Finite Element Analysis of Fatigue in Offshore Pipelines with Internal and External Circumferential Cracks


Abstract
1. Introduction
2. 3-D J-Integral and Stress Intensity Factor Model
3. Stress Intensity Factors of Surface Cracks in Cylindrical Pipes
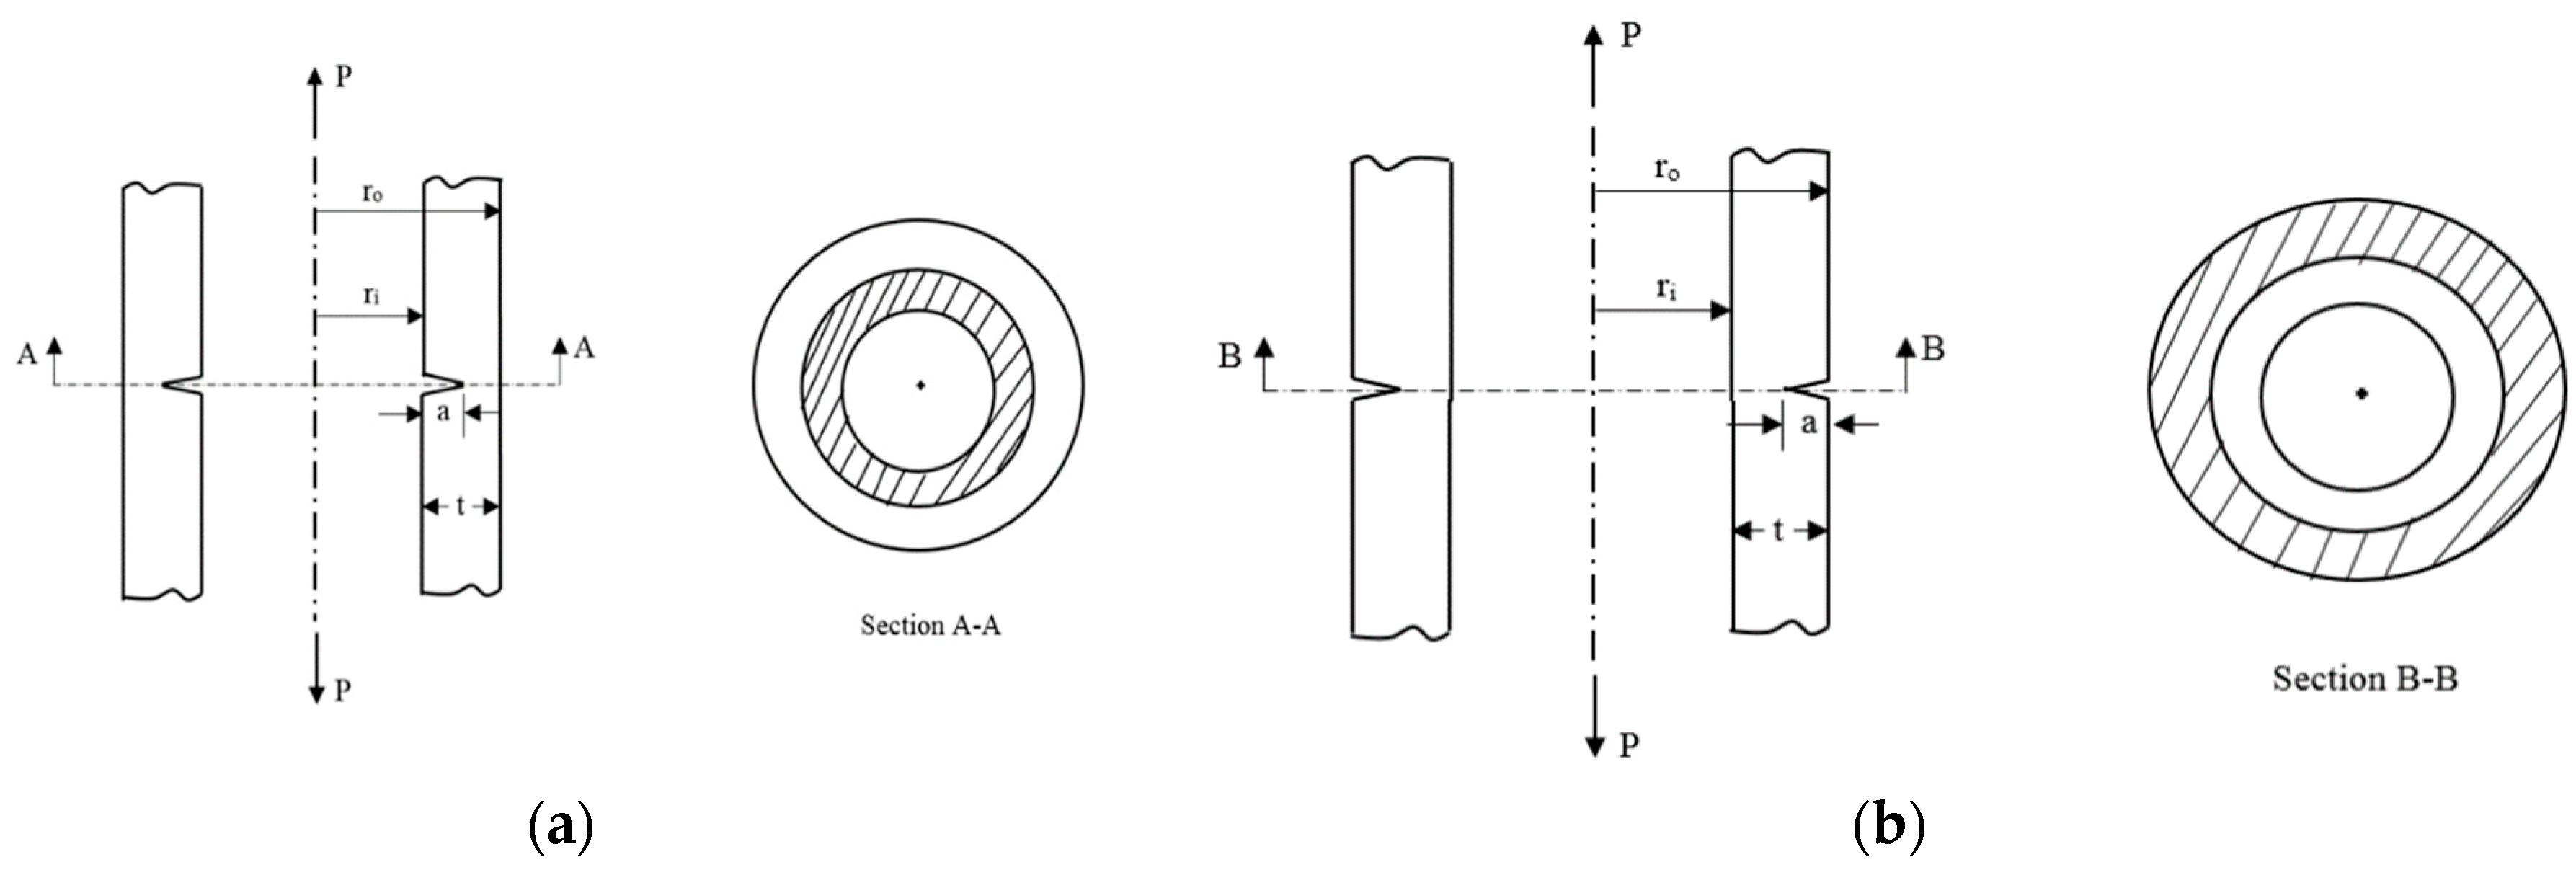
3.1. Cylindrical Pipe with Internal and External Circumferential Through-Wall Crack
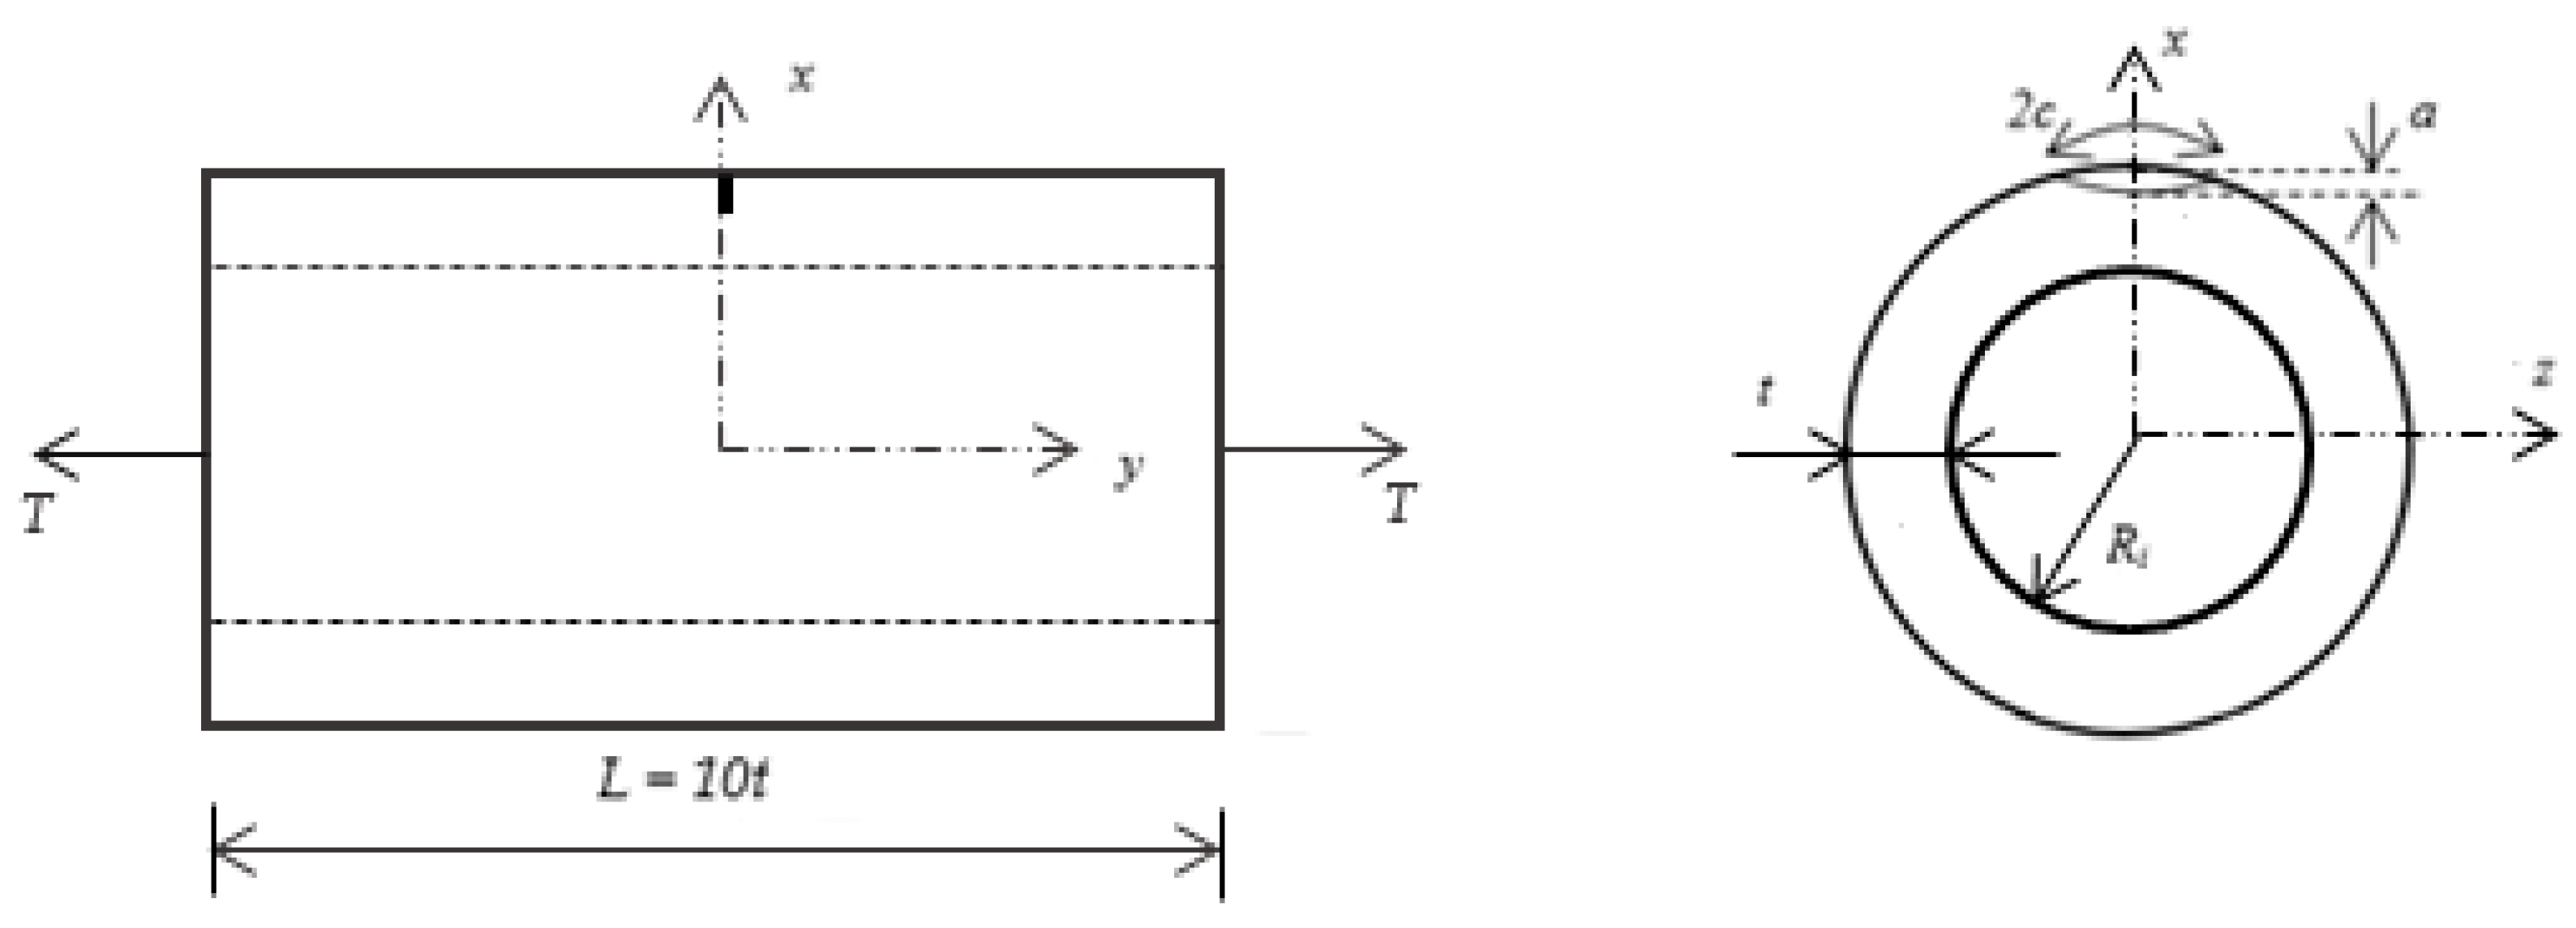
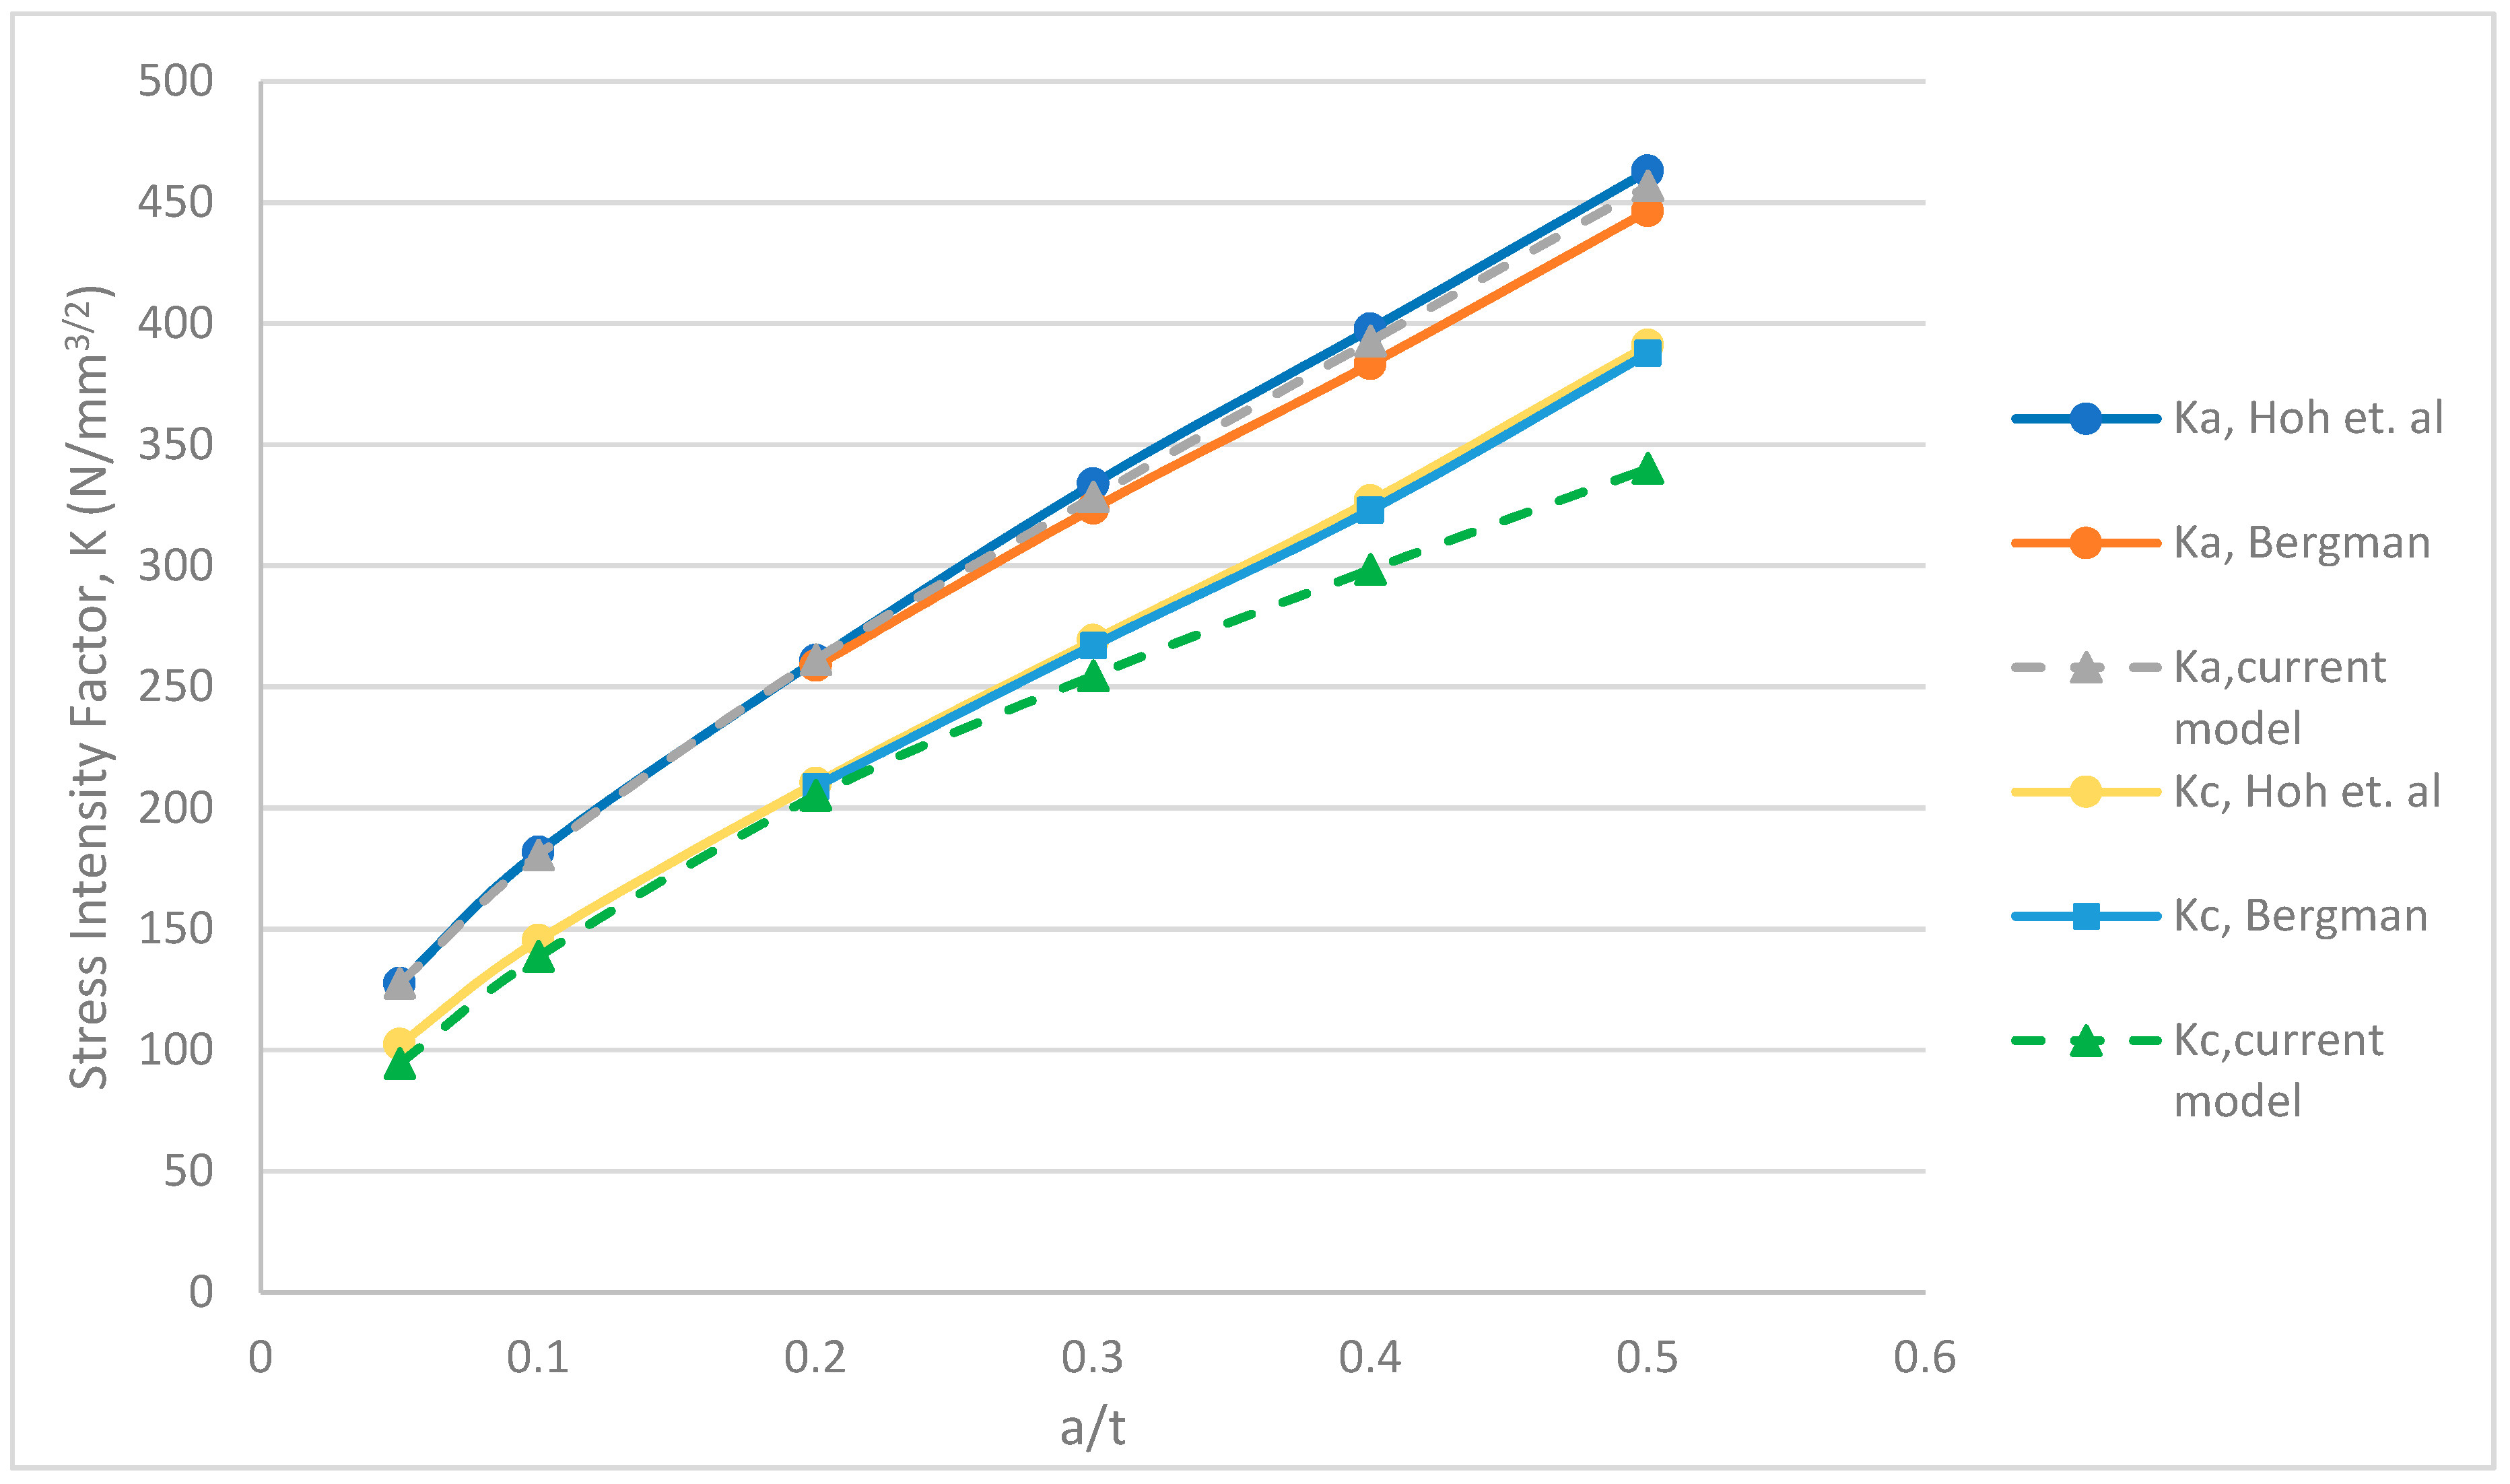
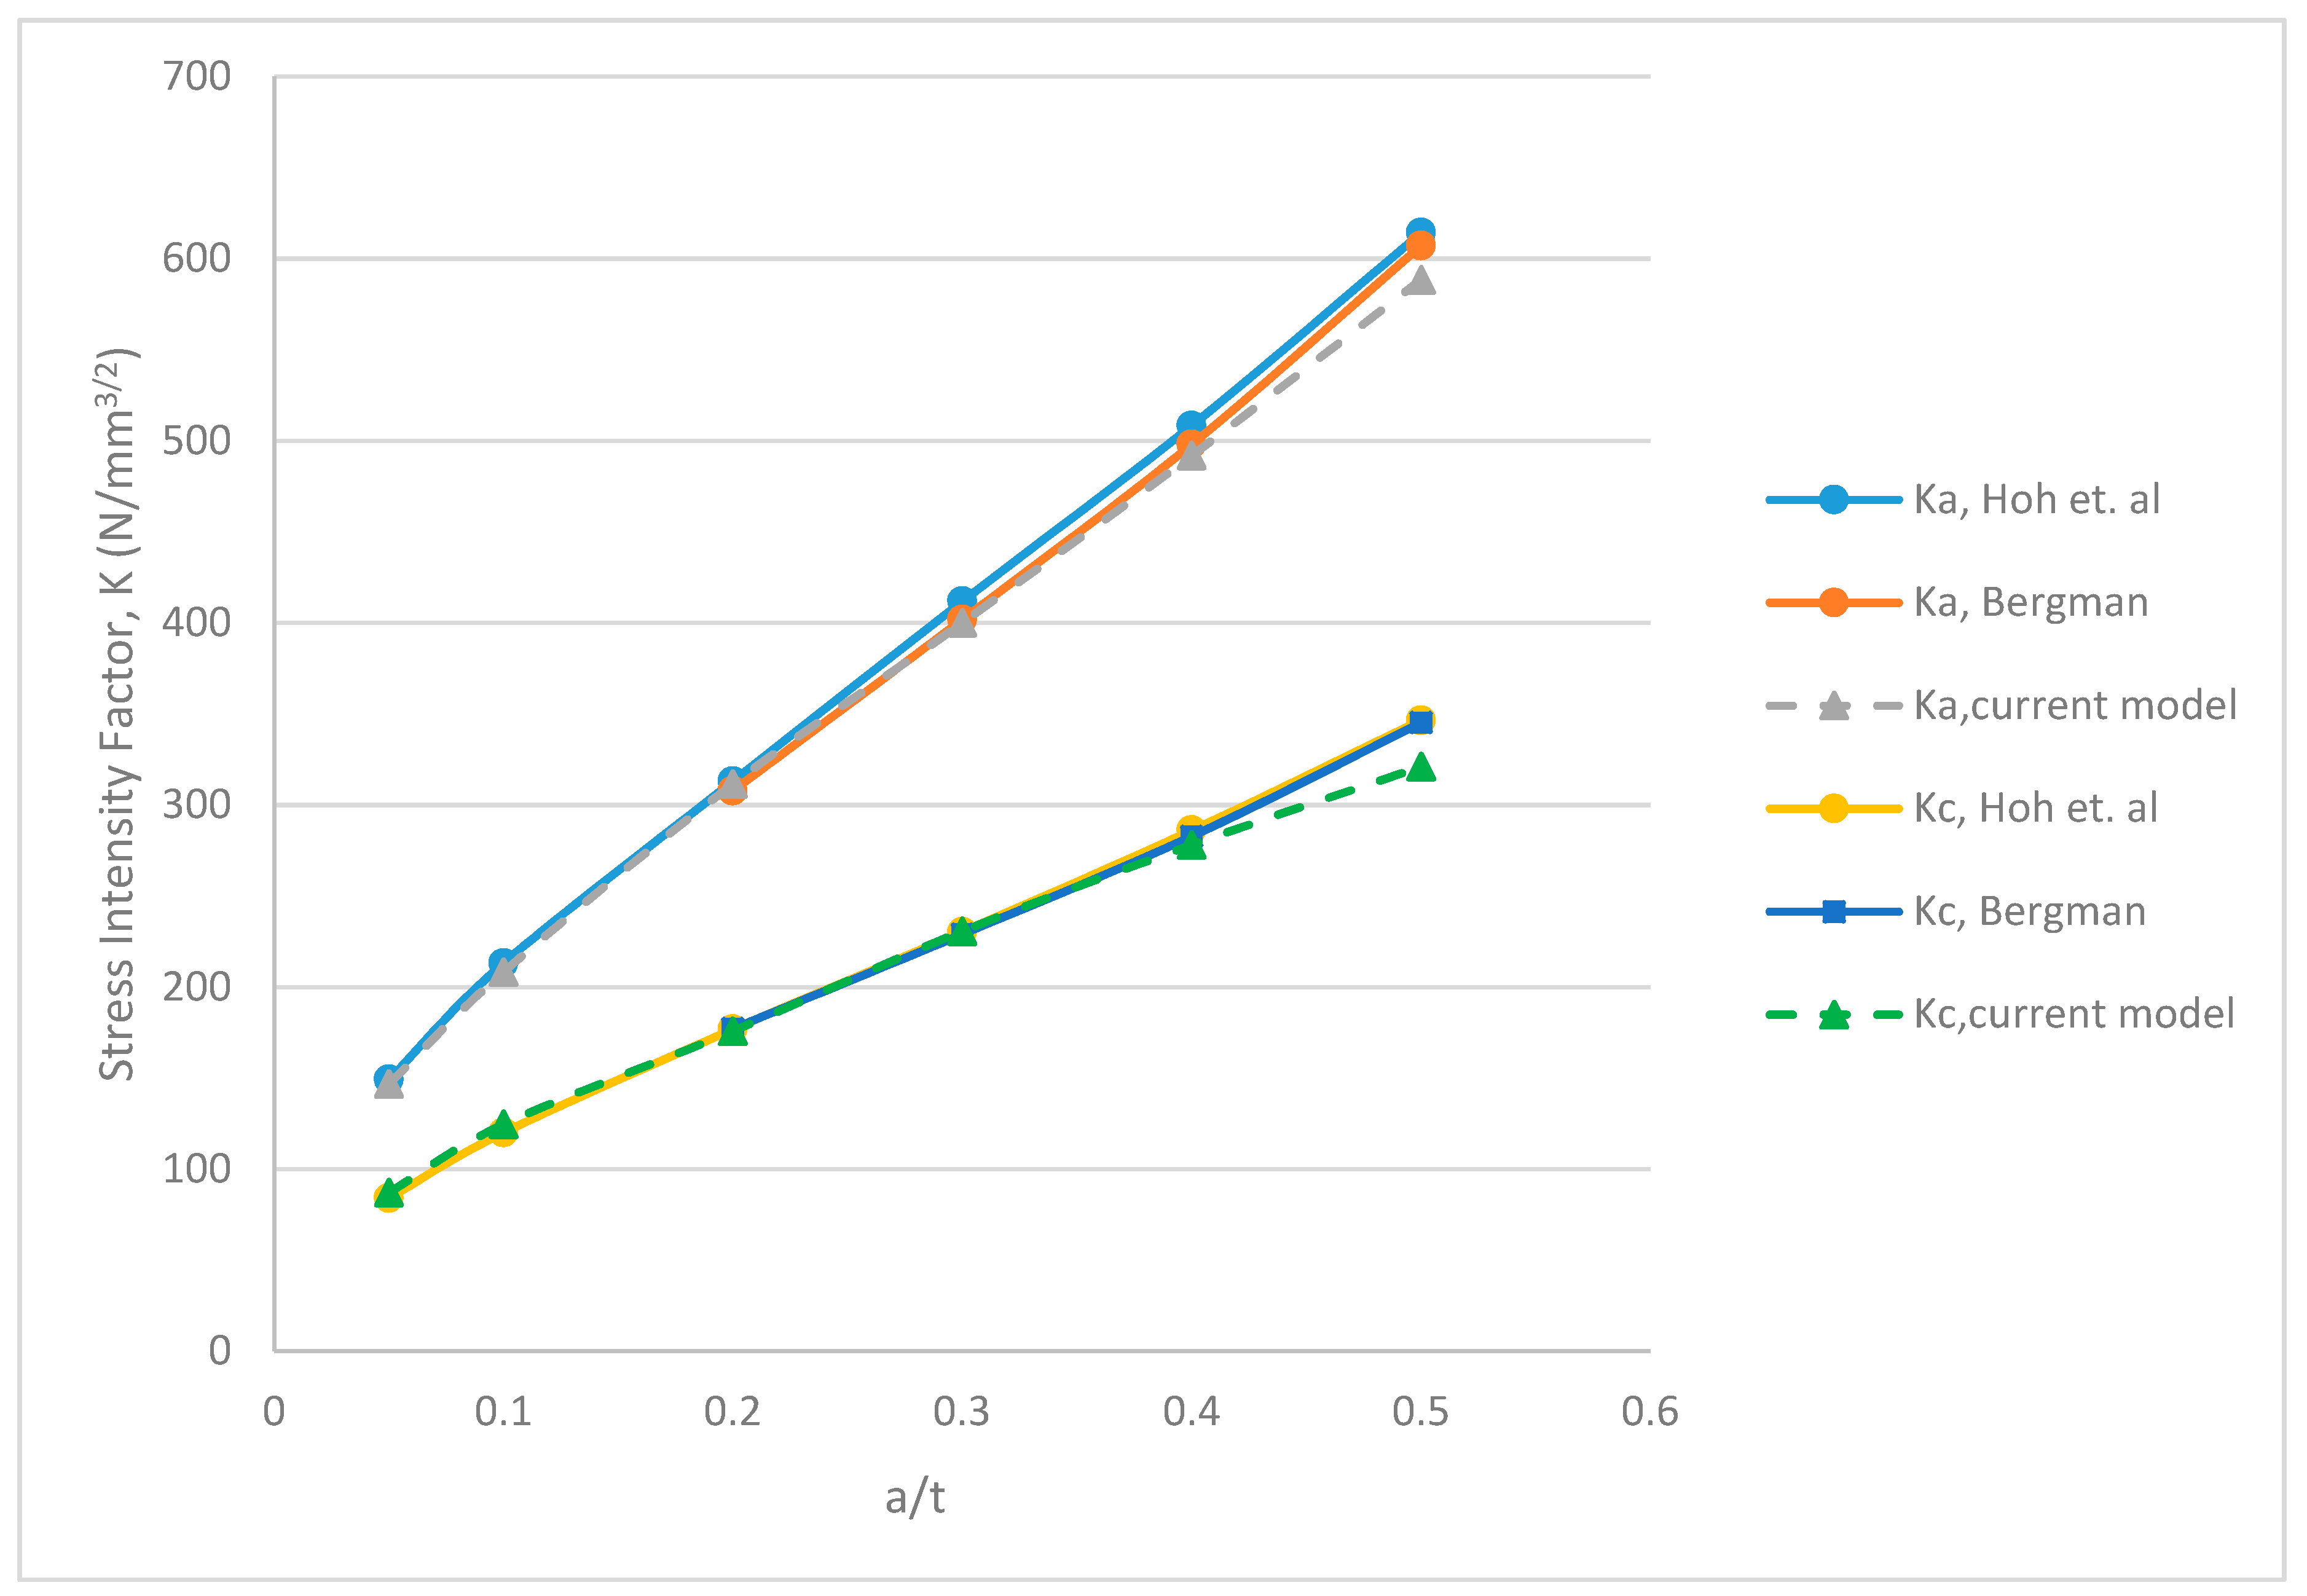
3.2. Plain Pipe with External Semi-Elliptical Surface Crack
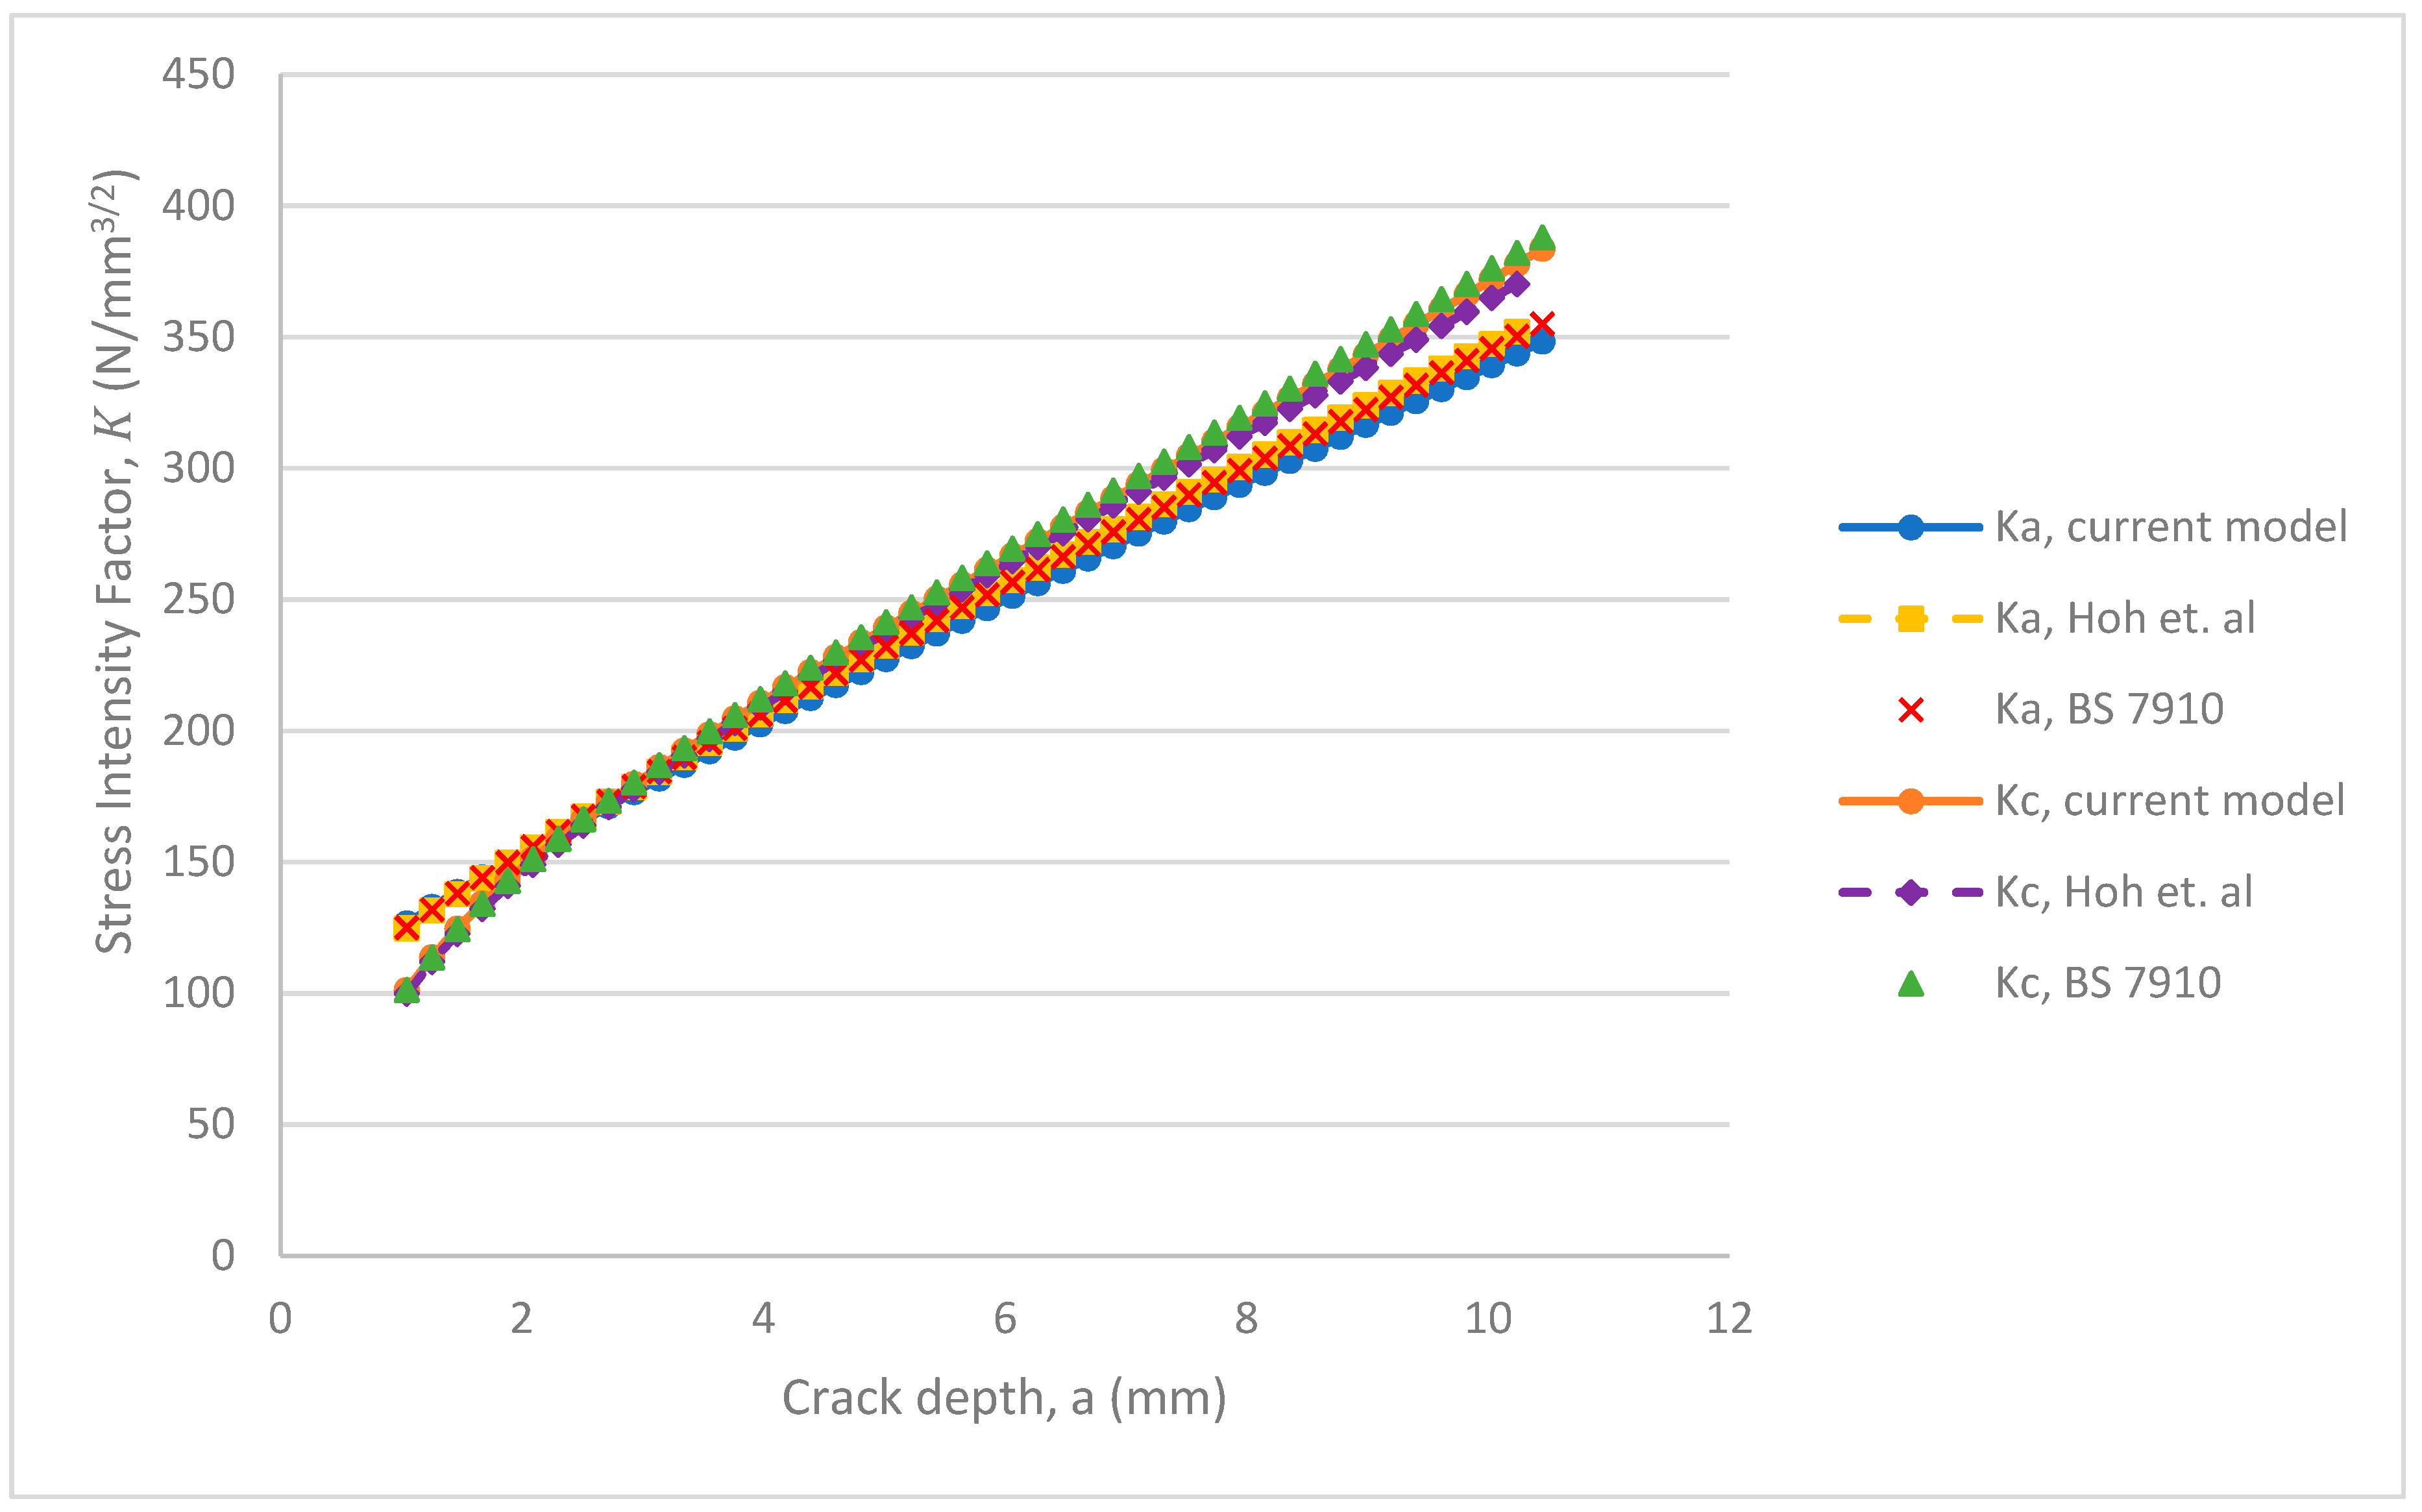
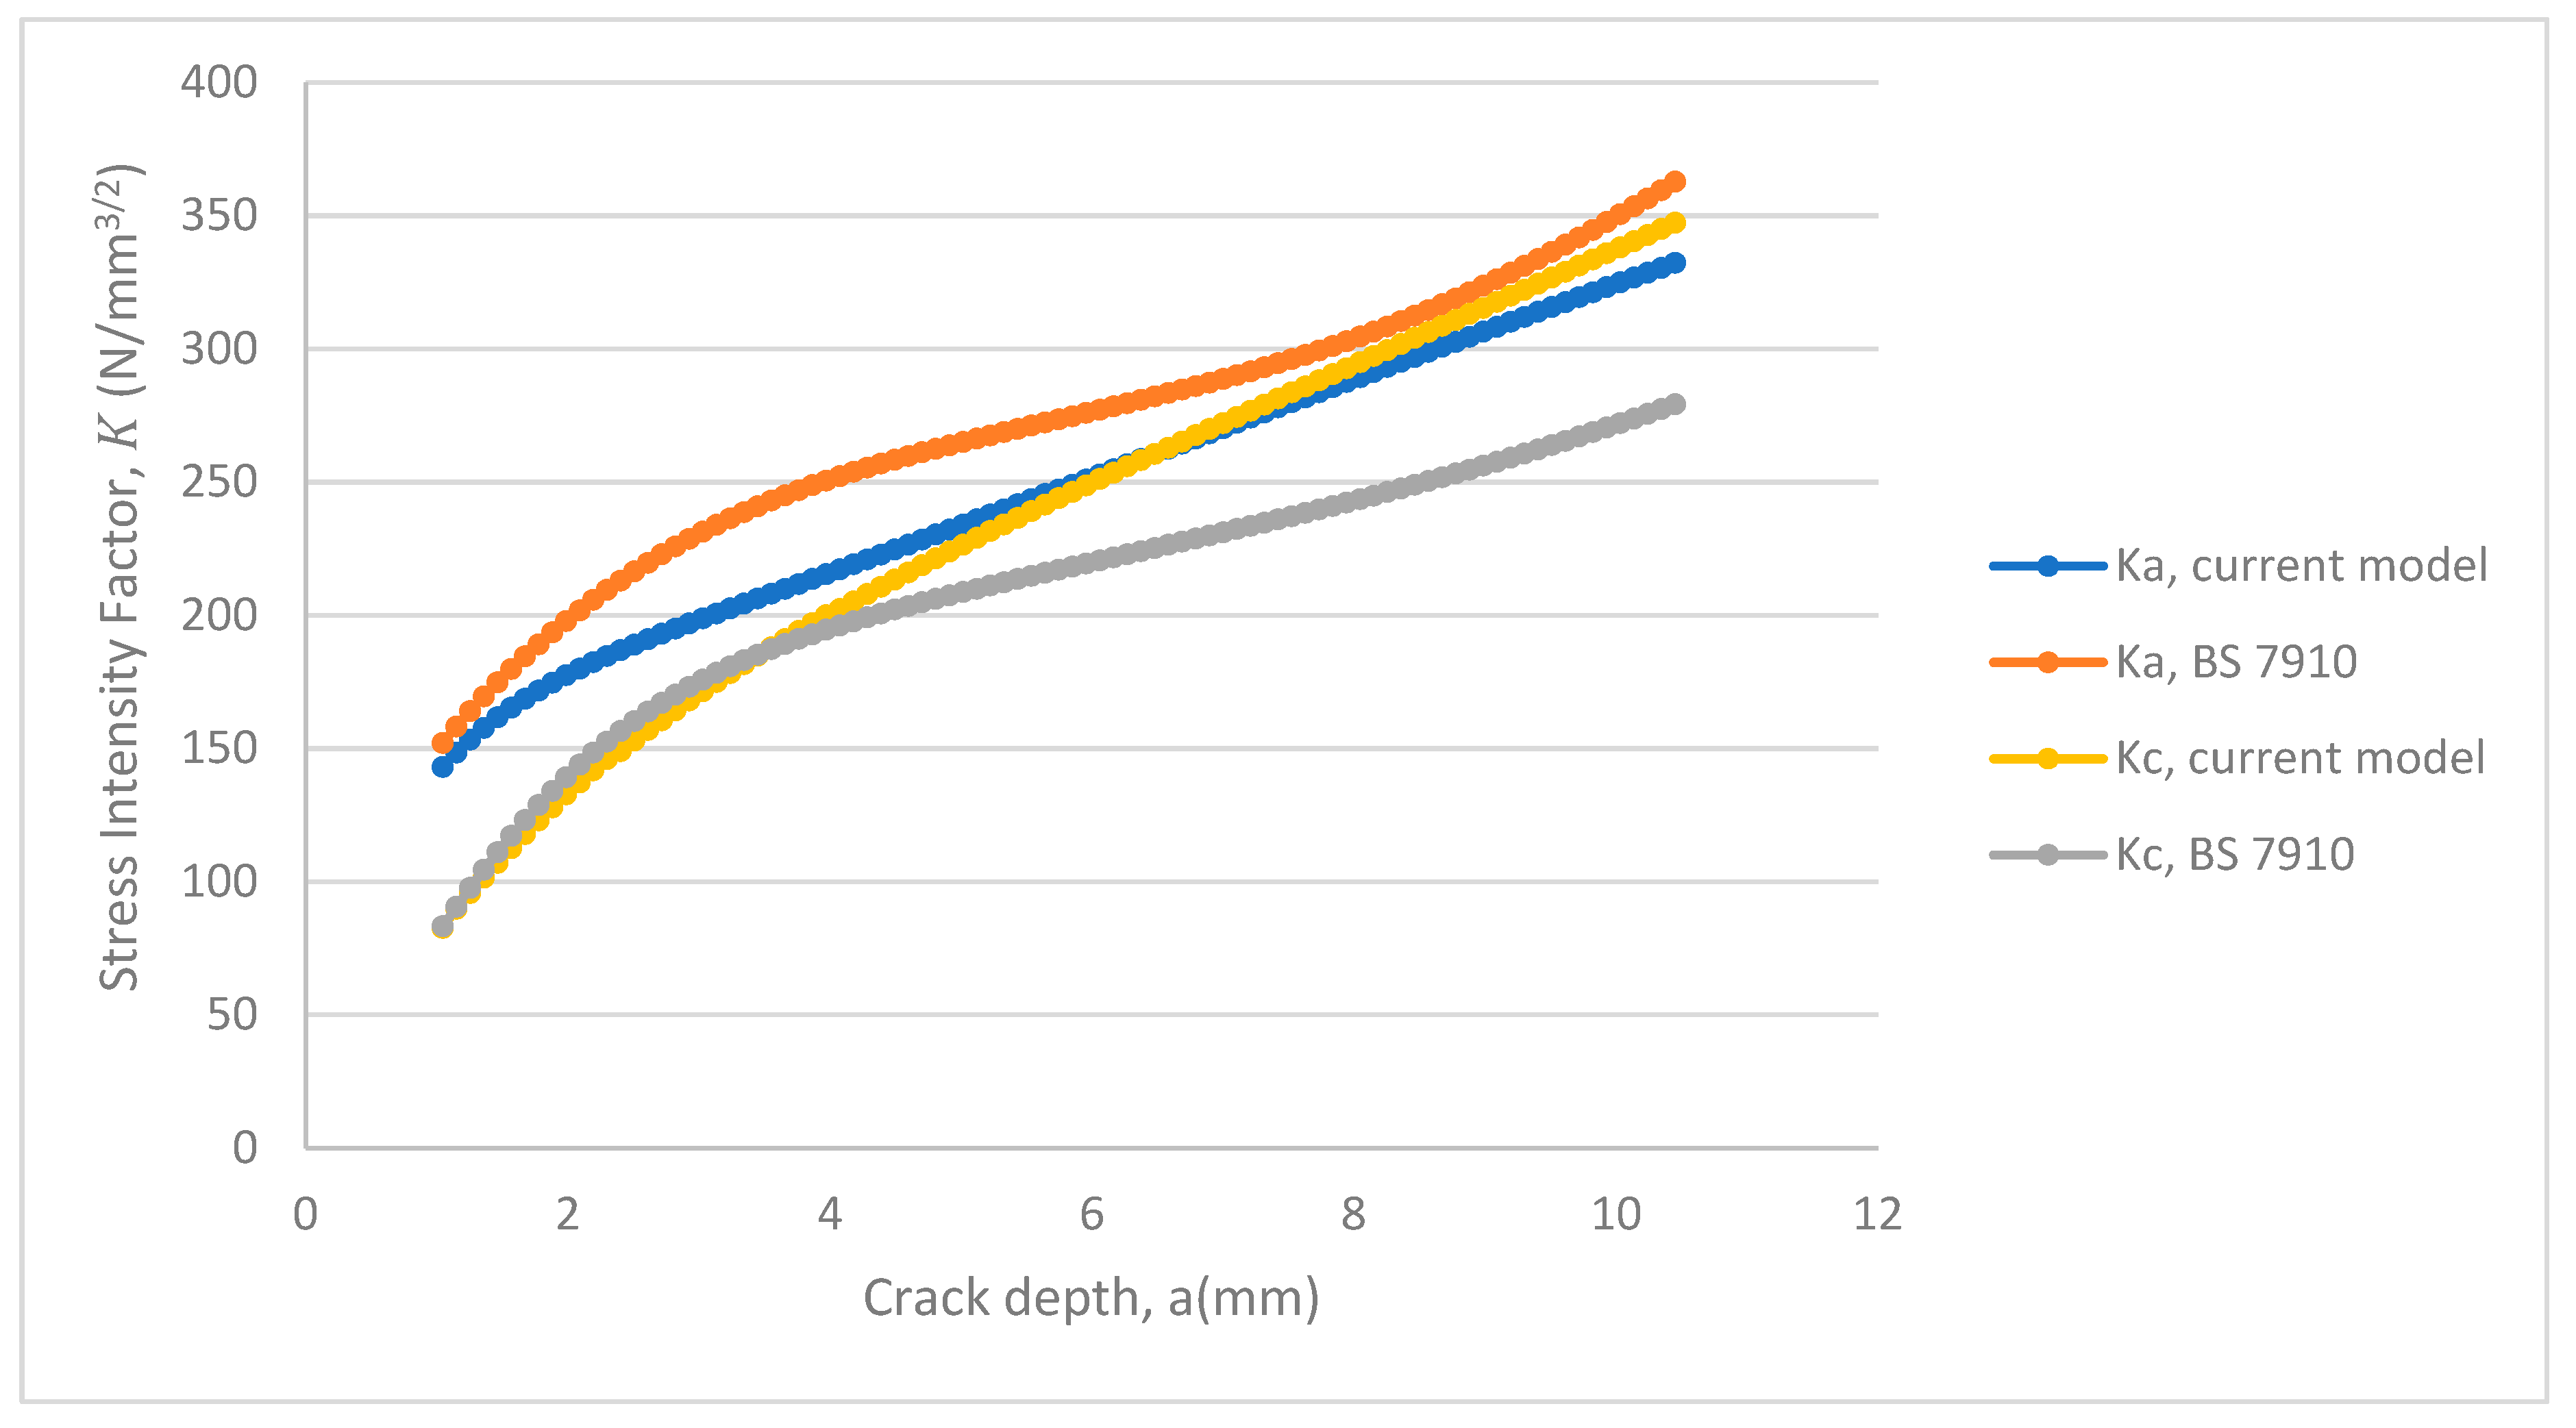
4. Fatigue Crack Propagation Analysis for Semi-Elliptical Surface Cracks in Plain Pipe
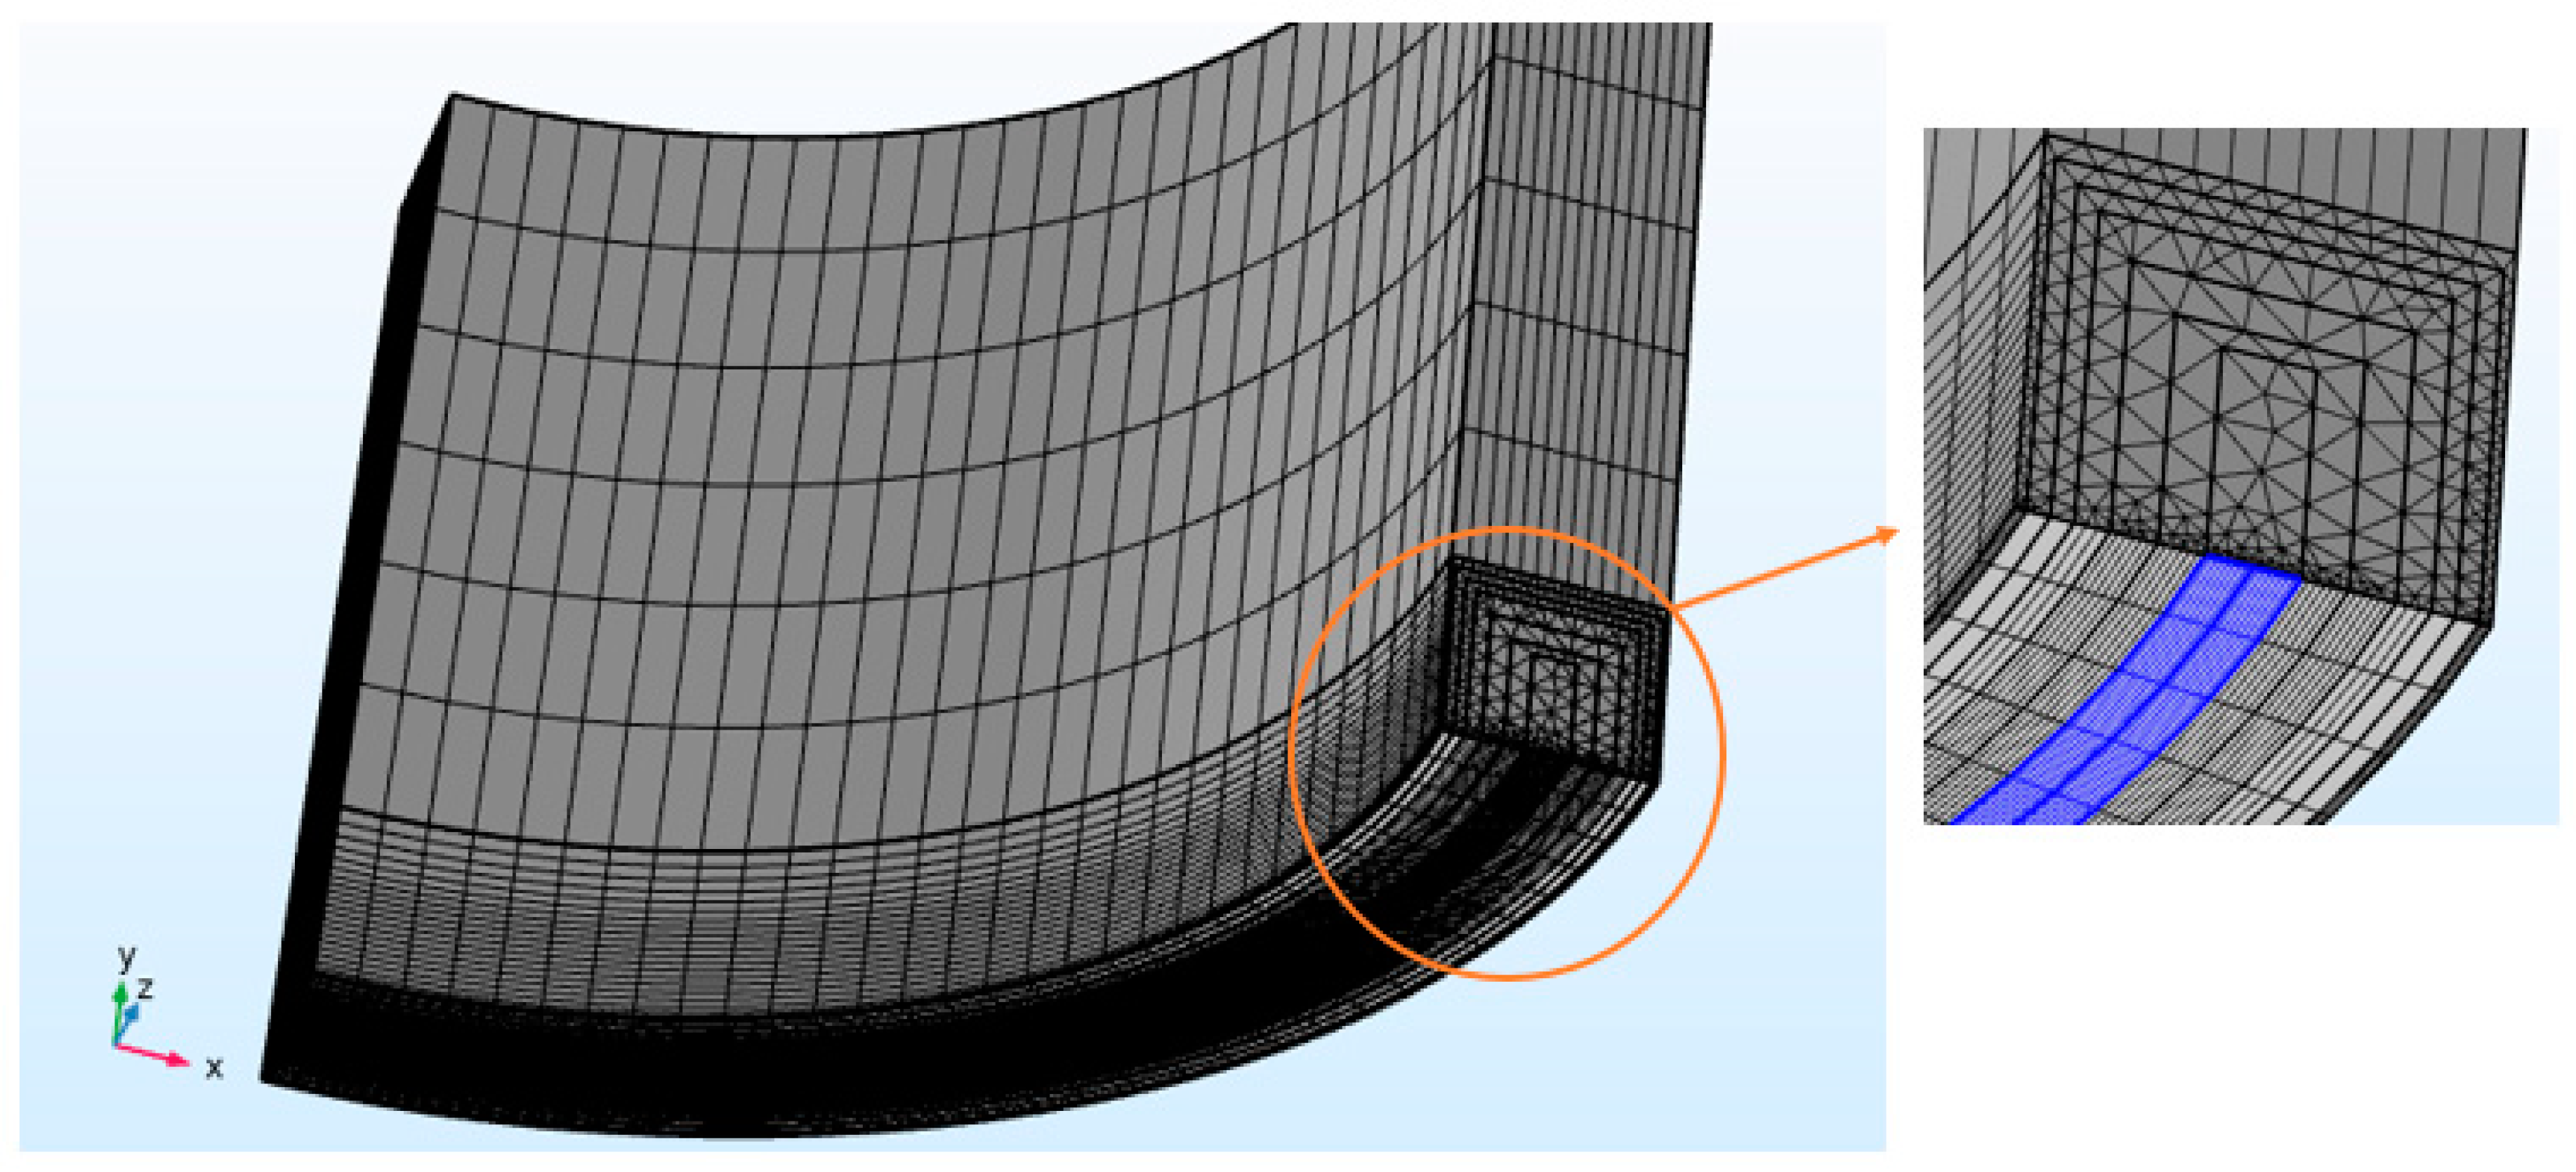
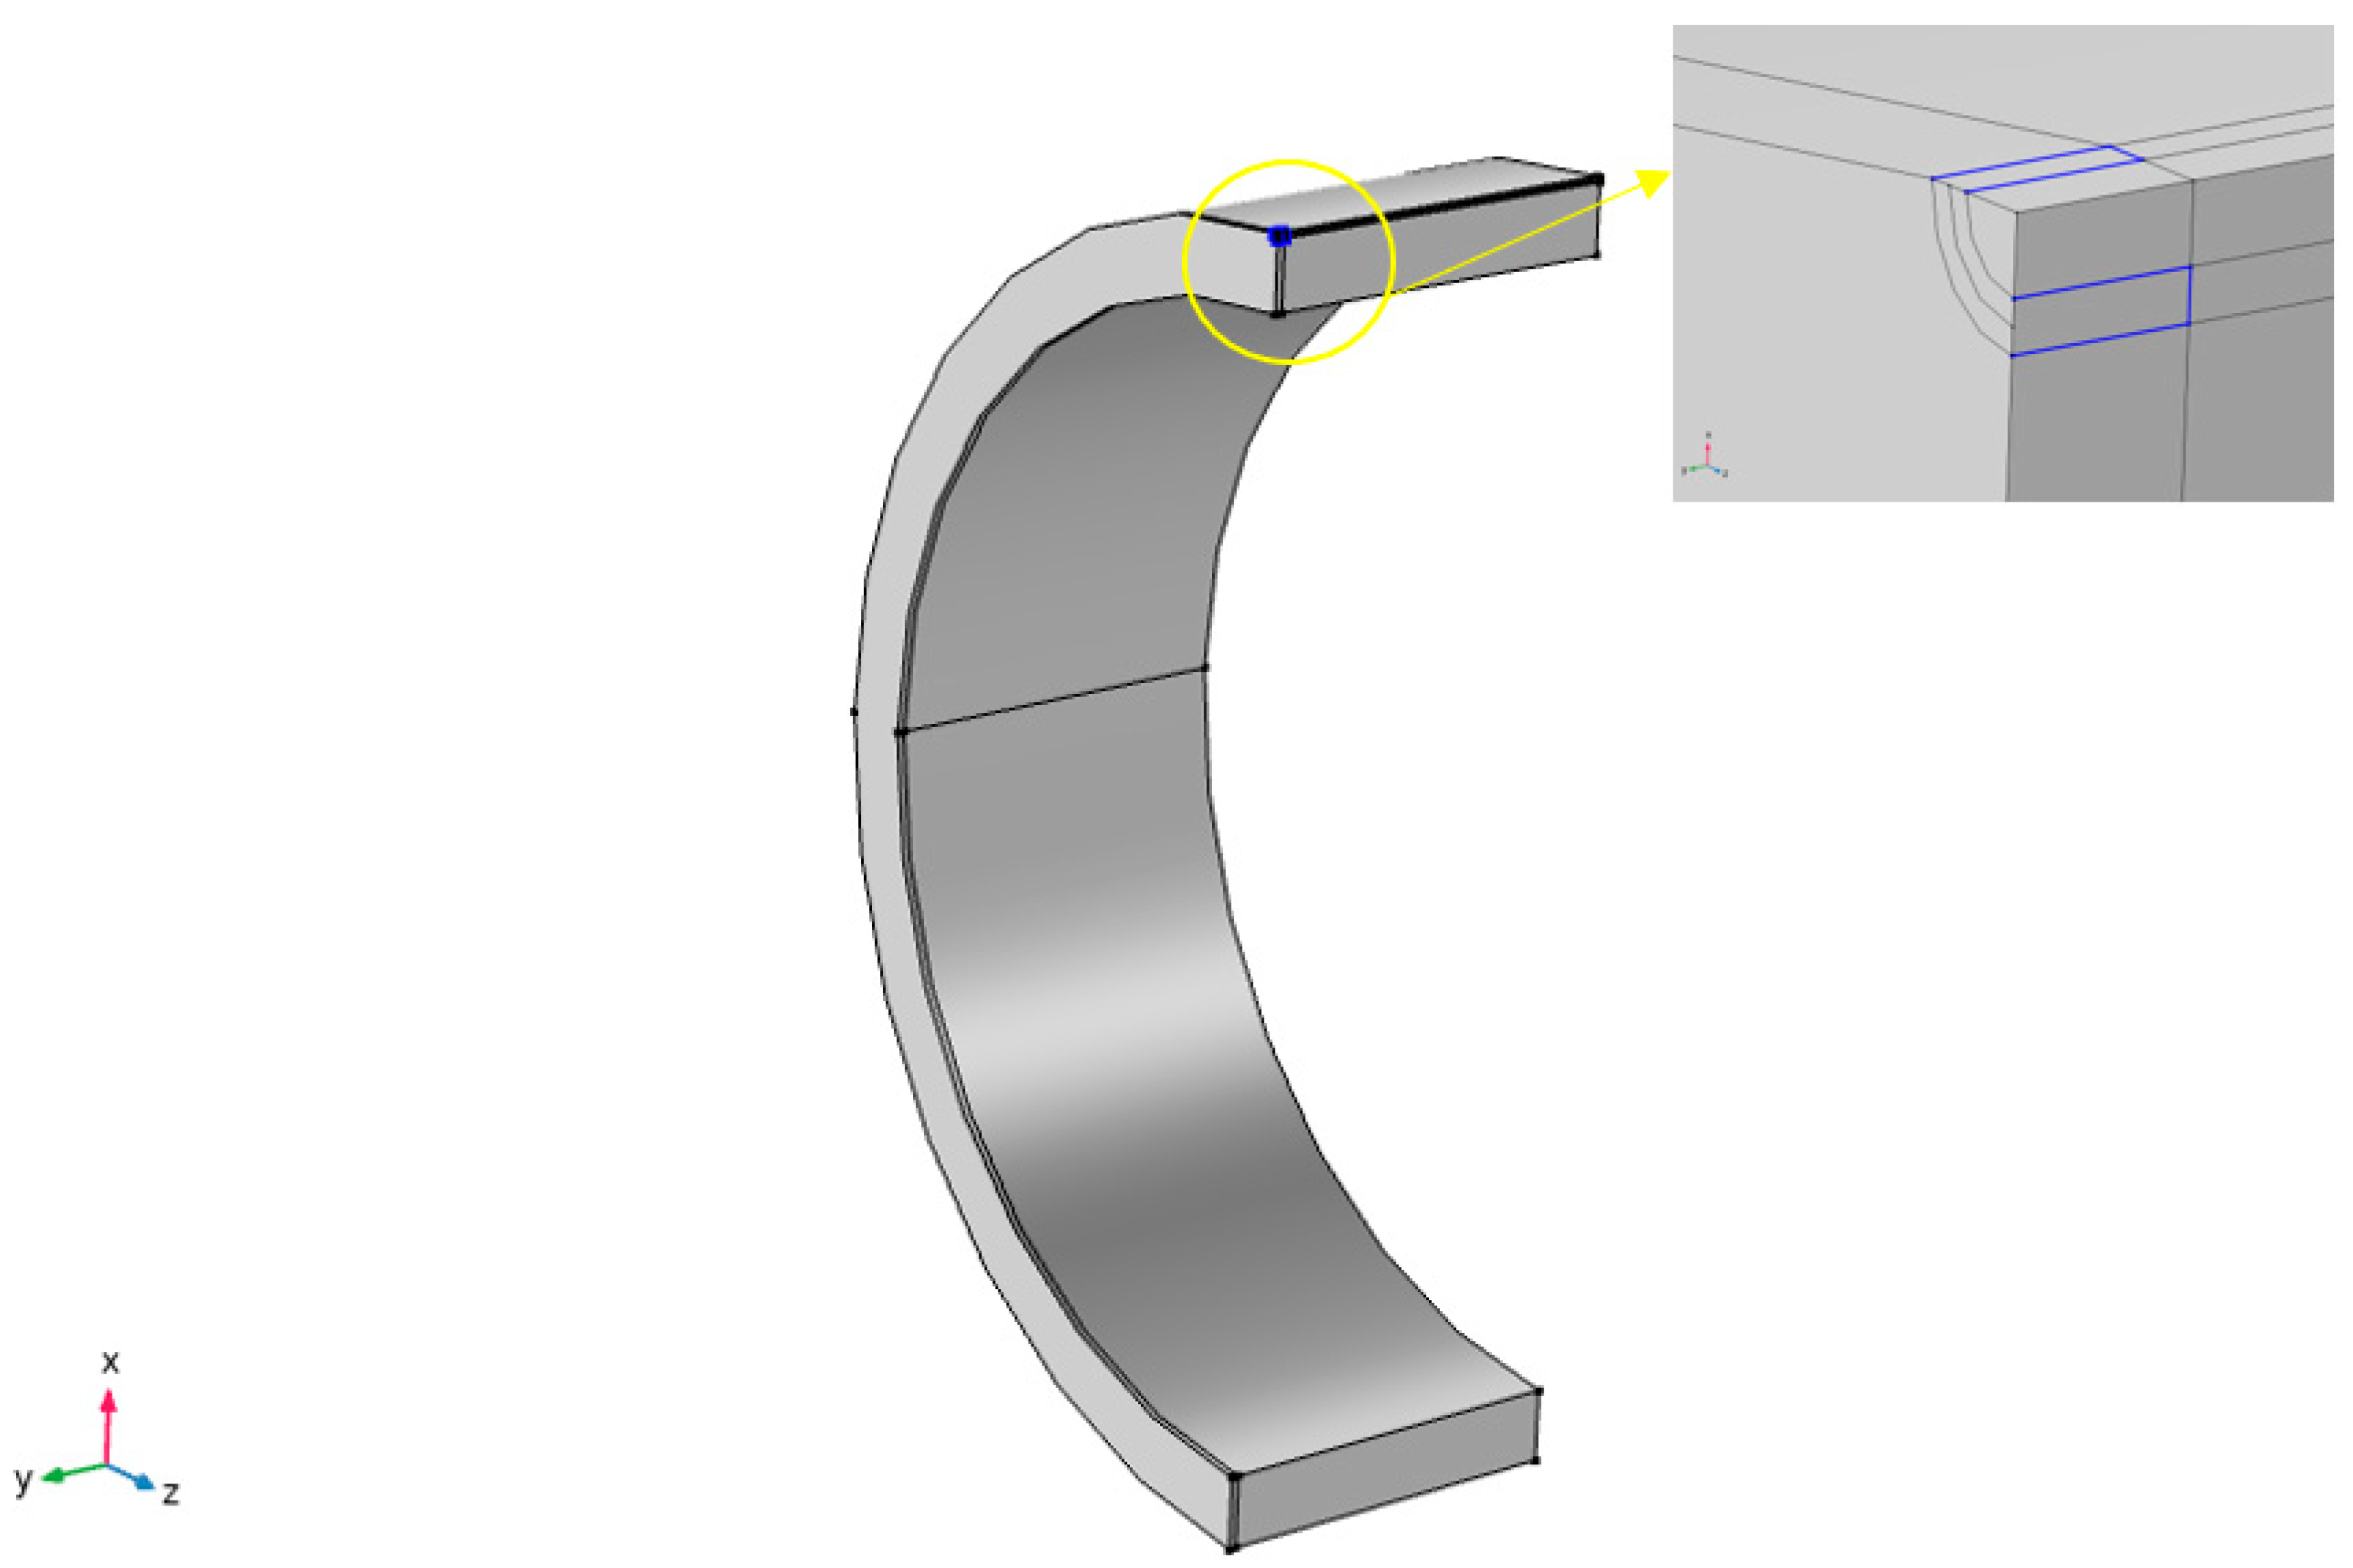
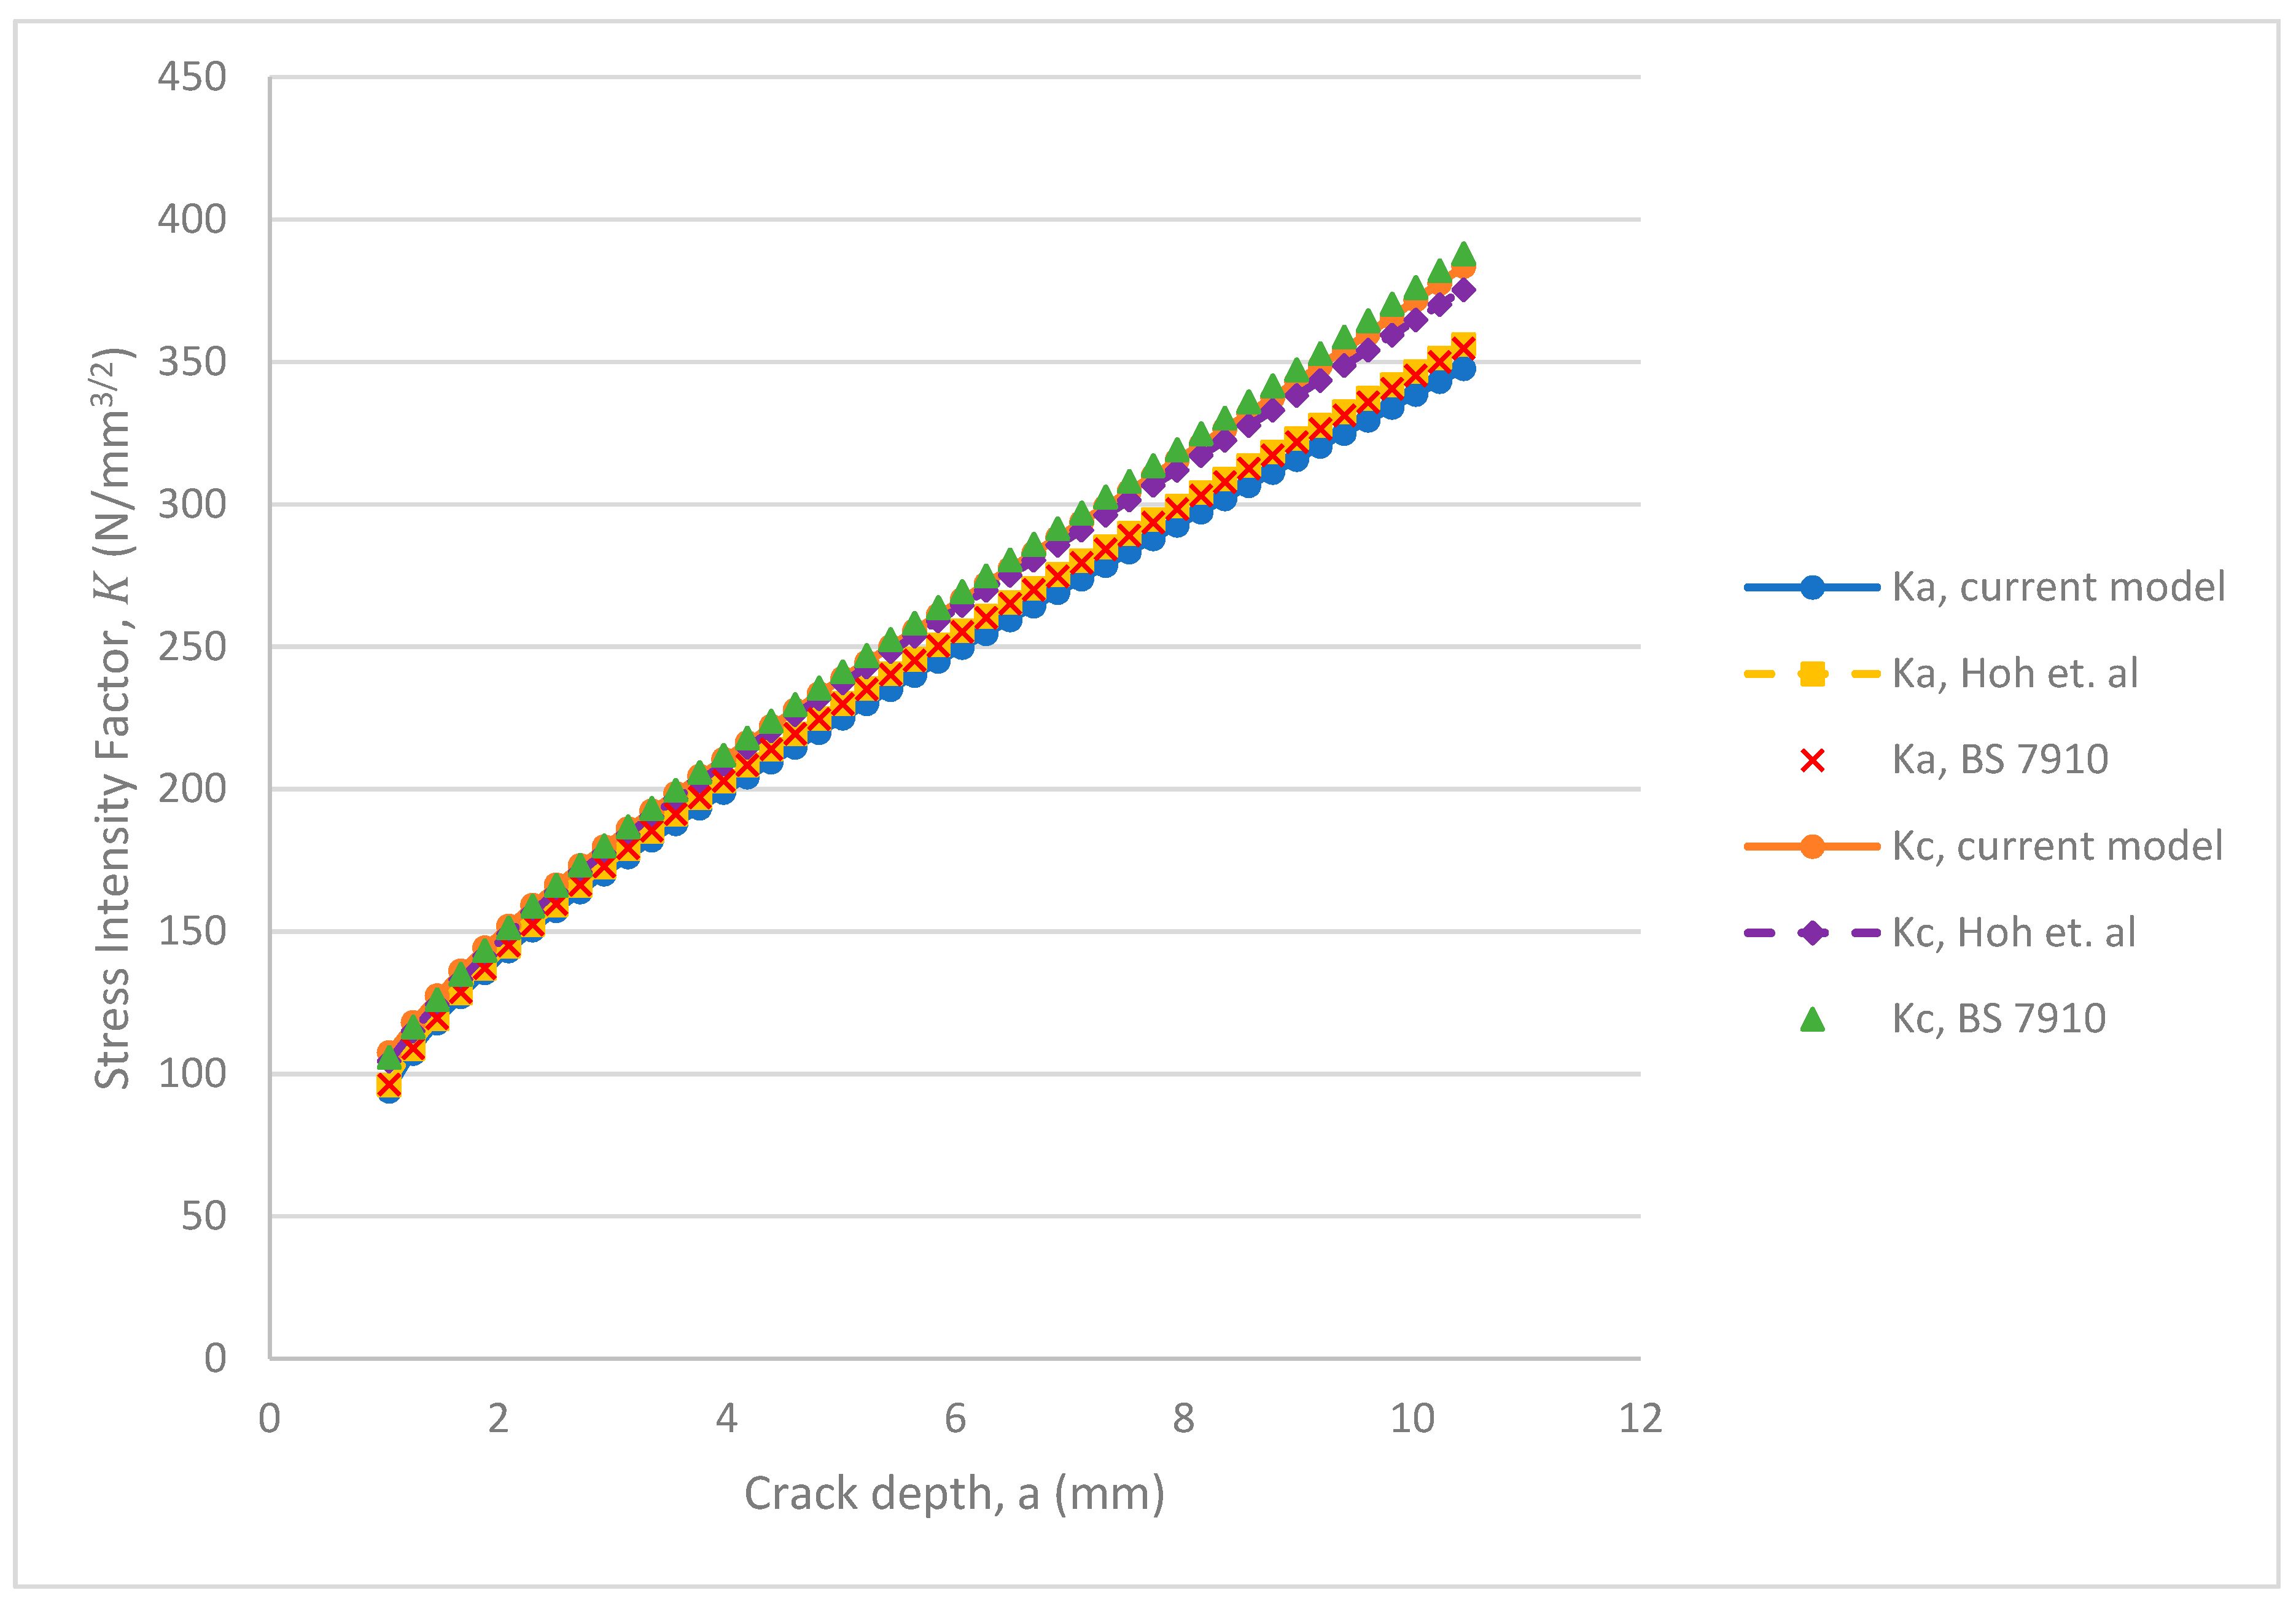
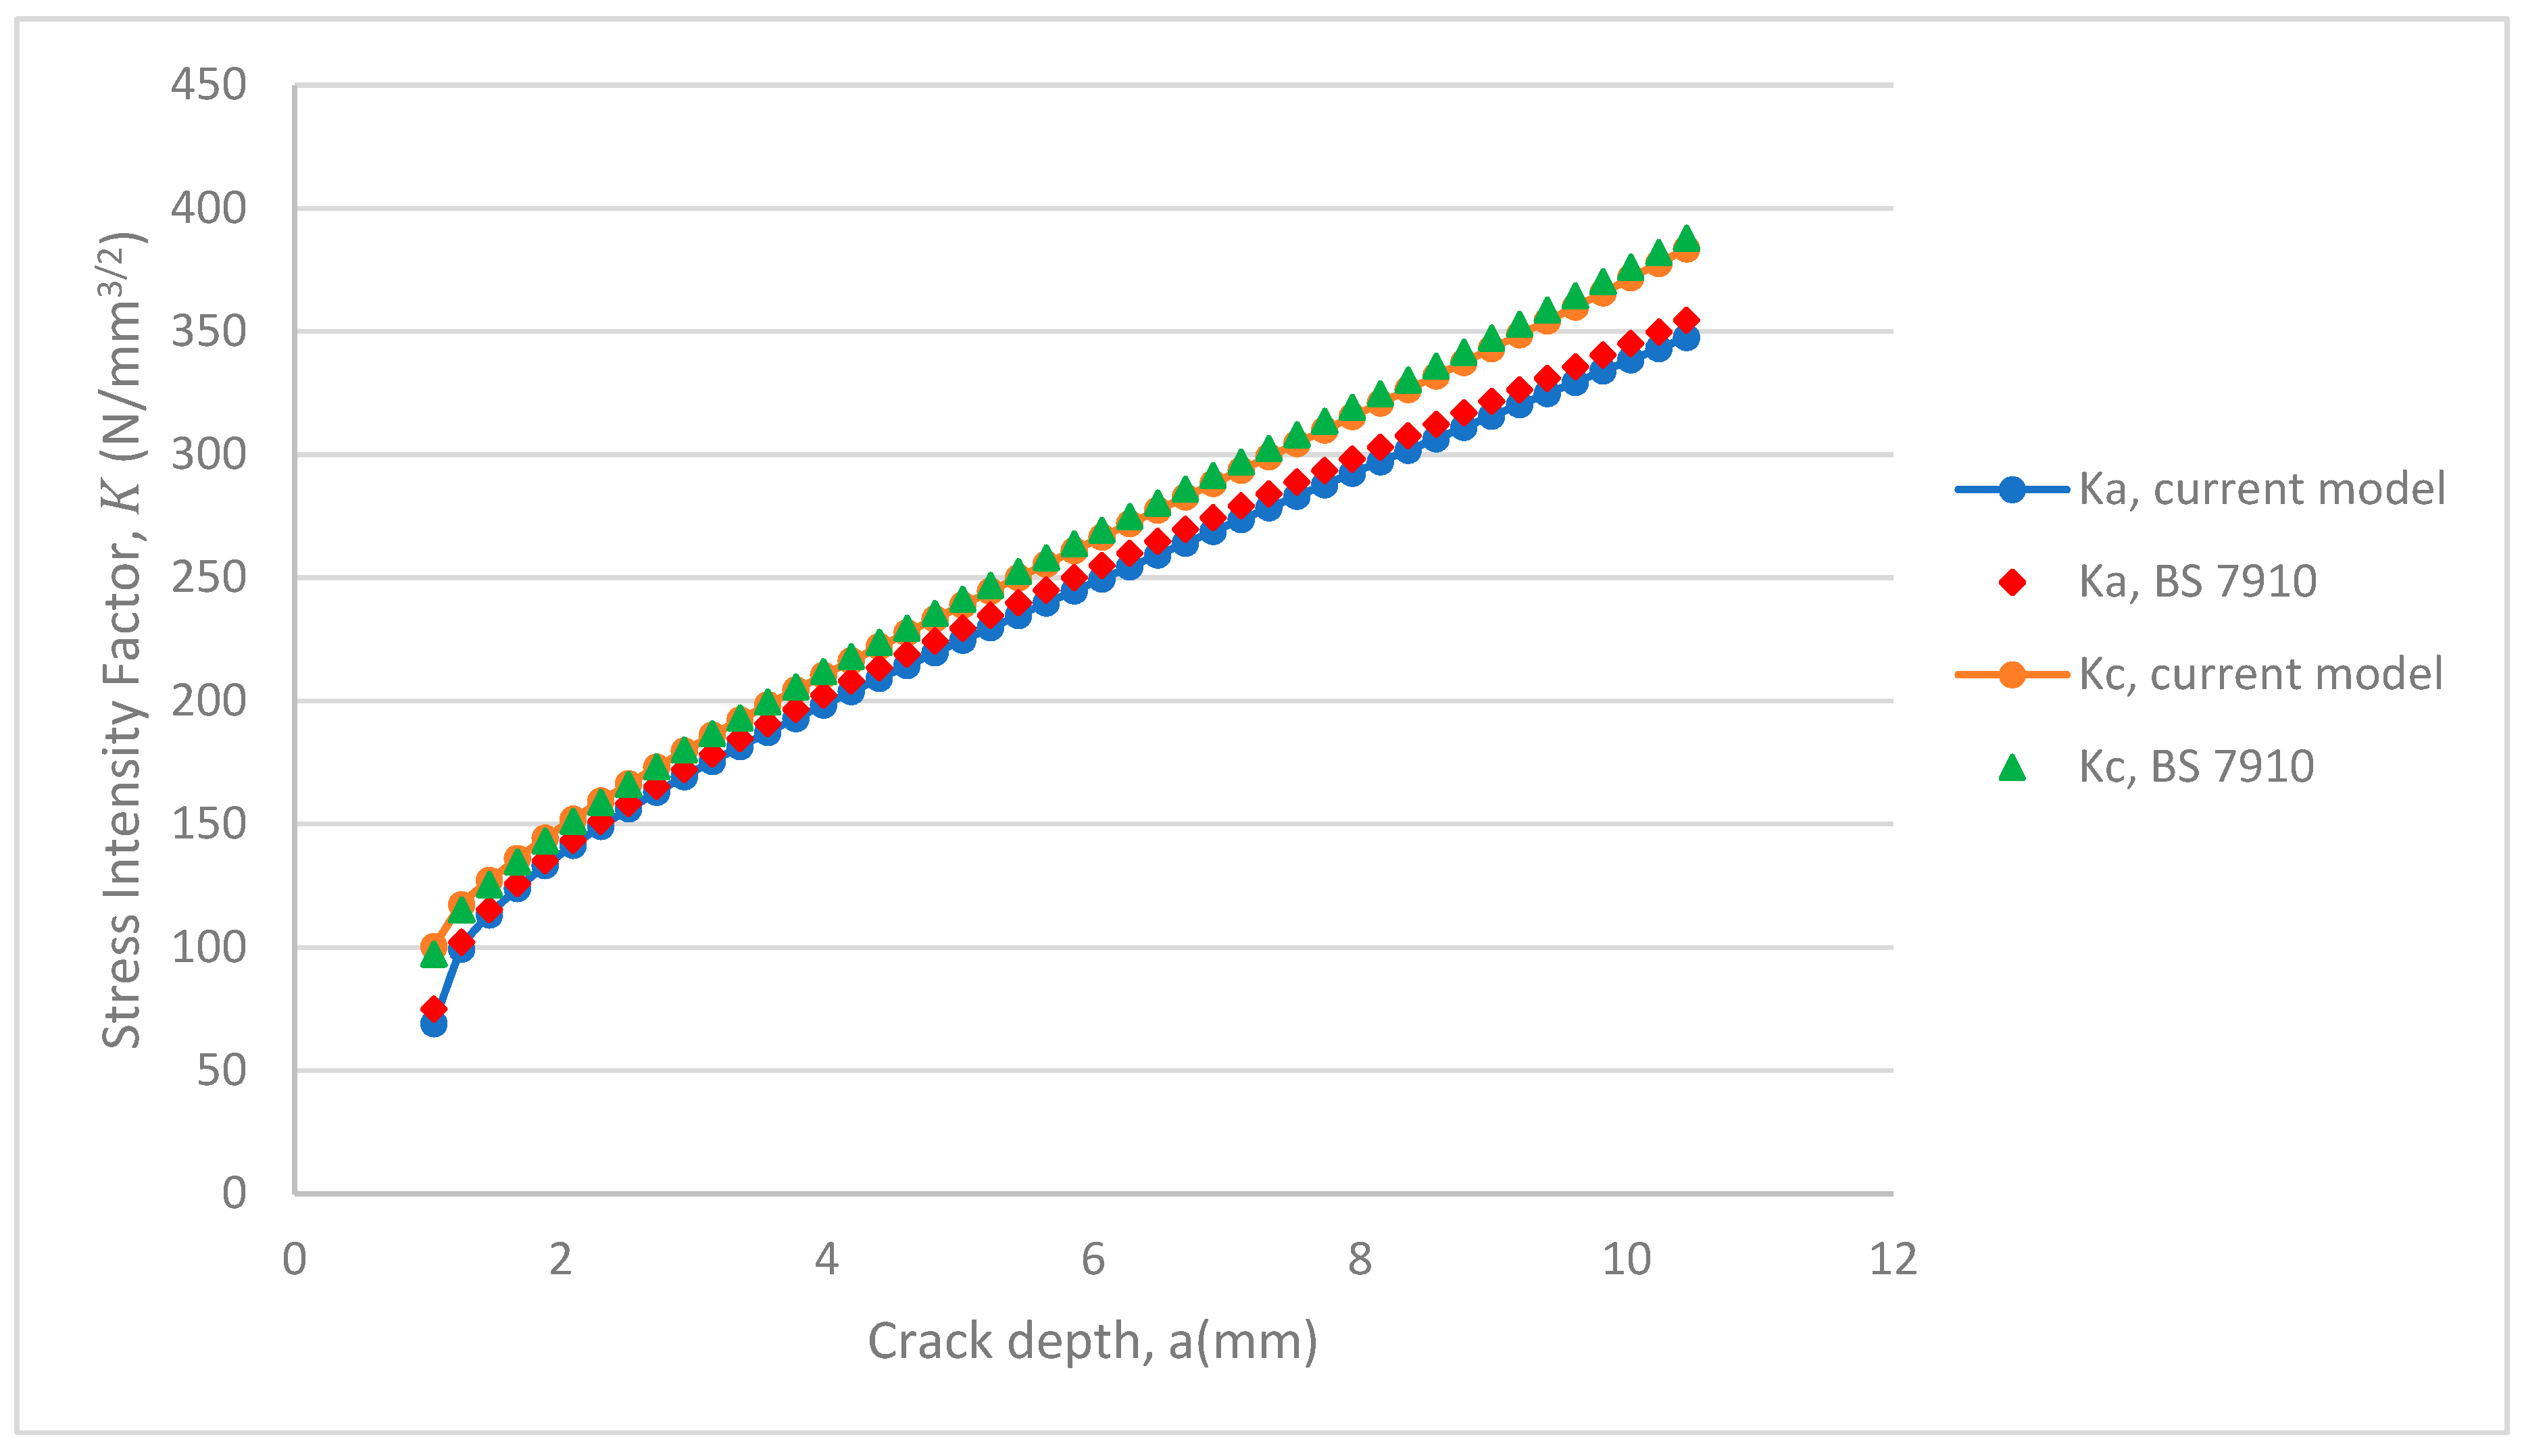
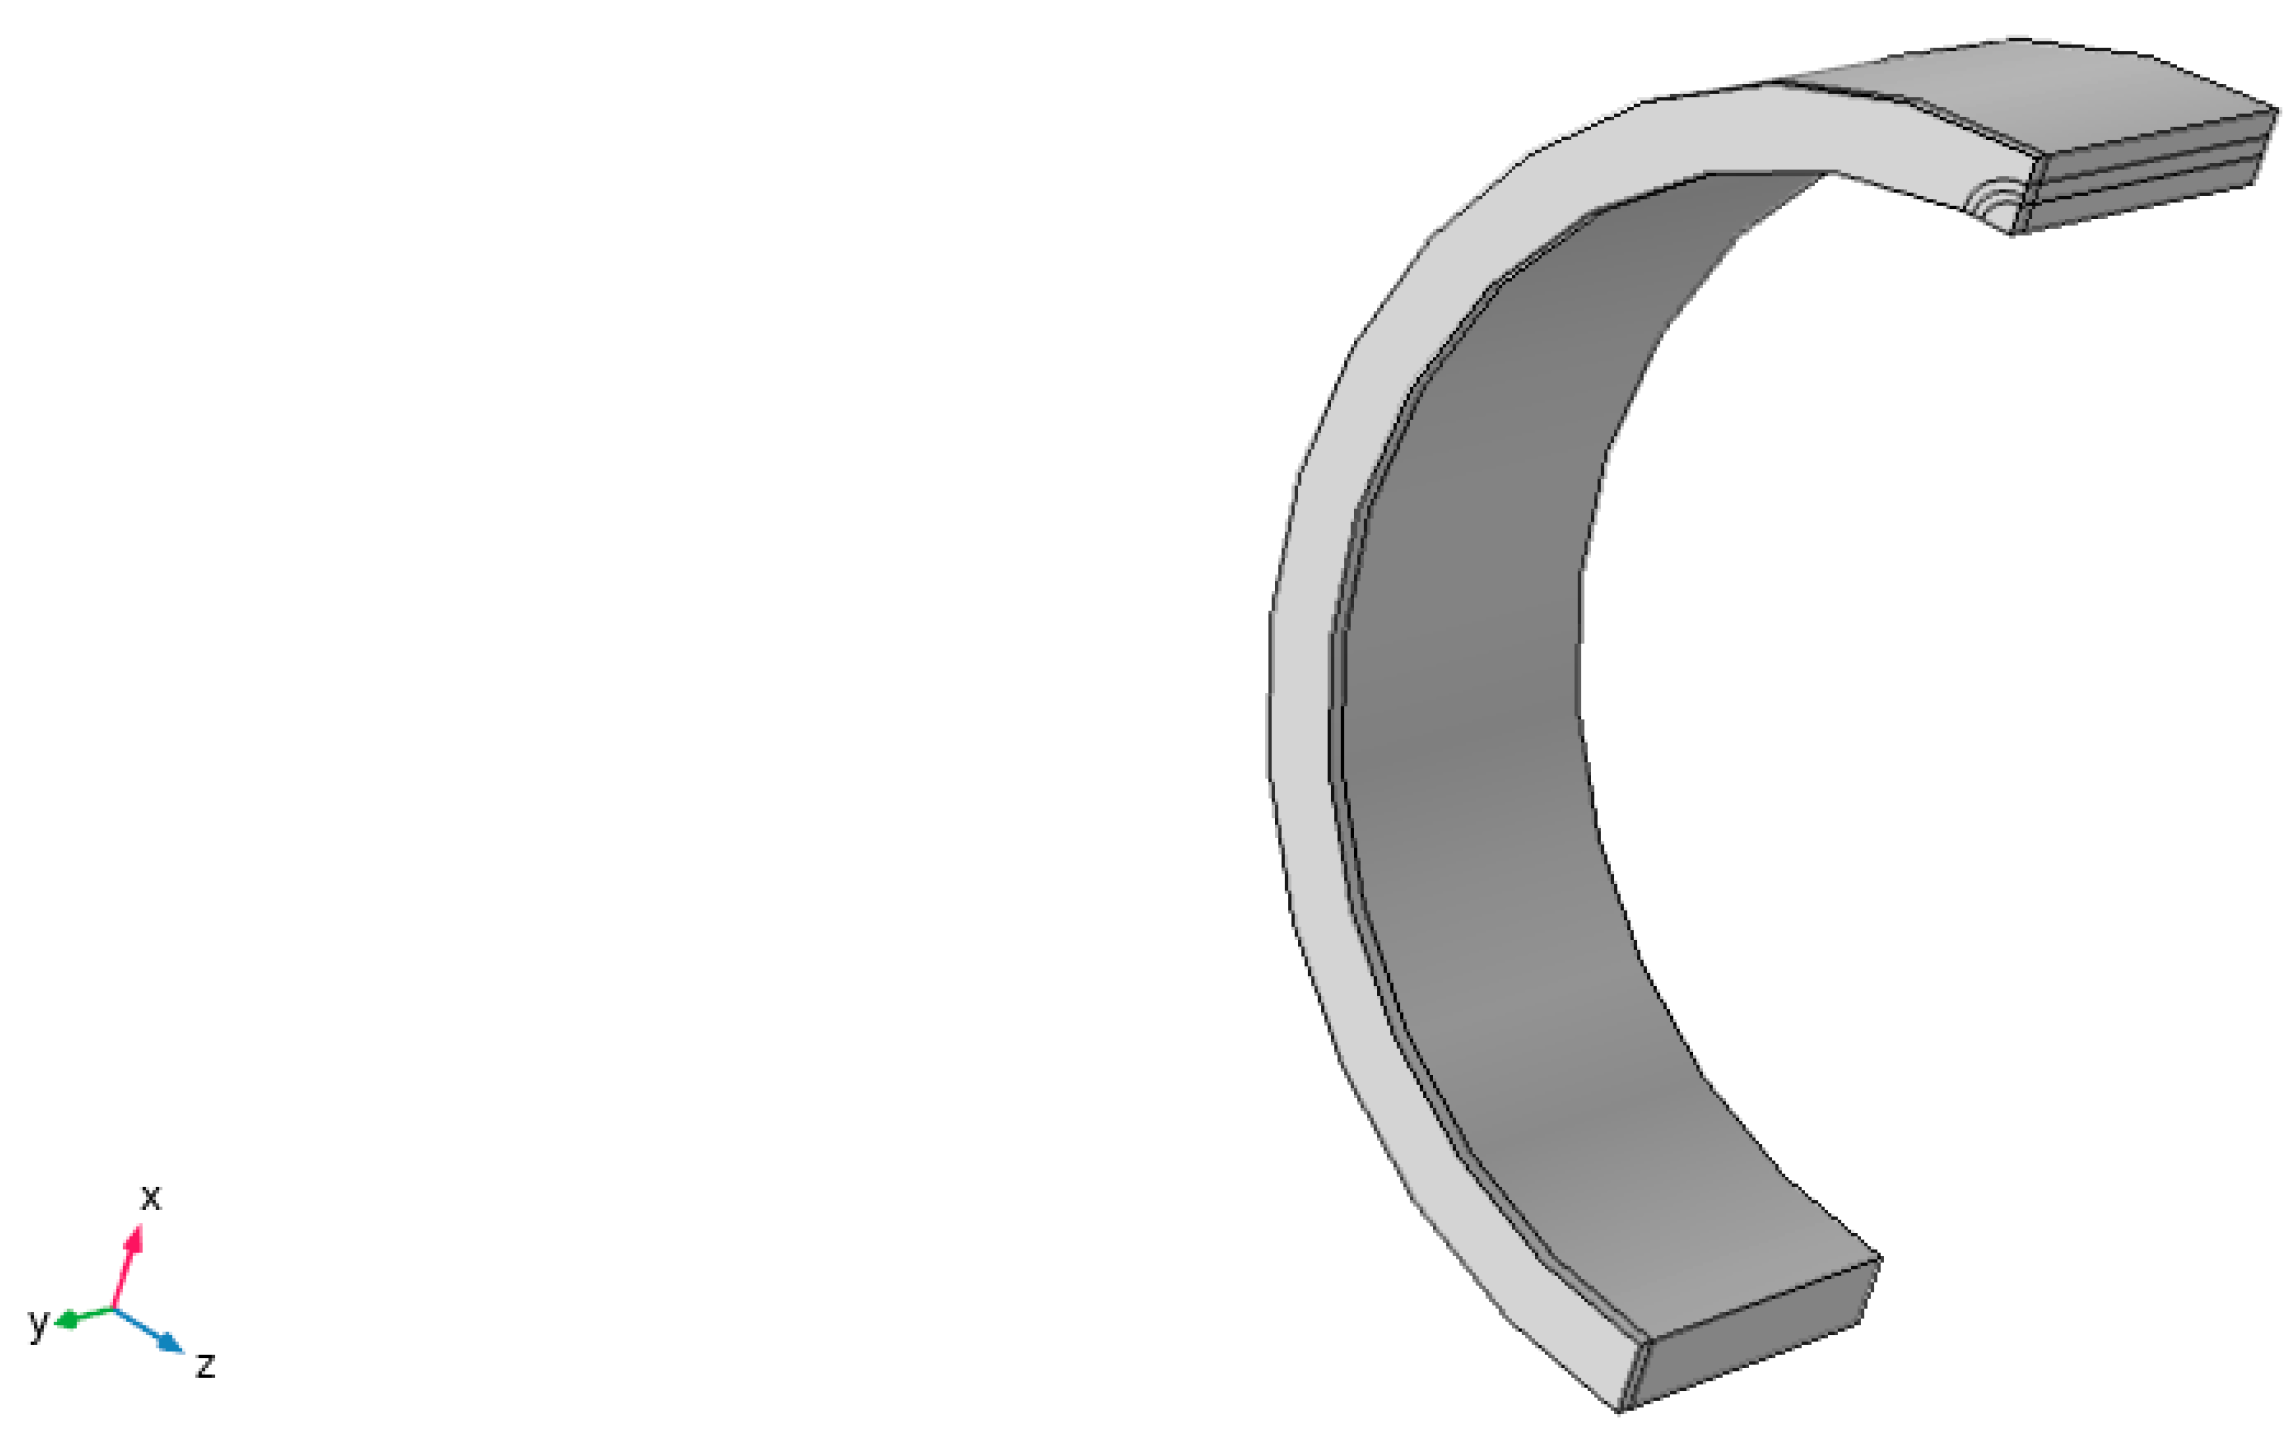
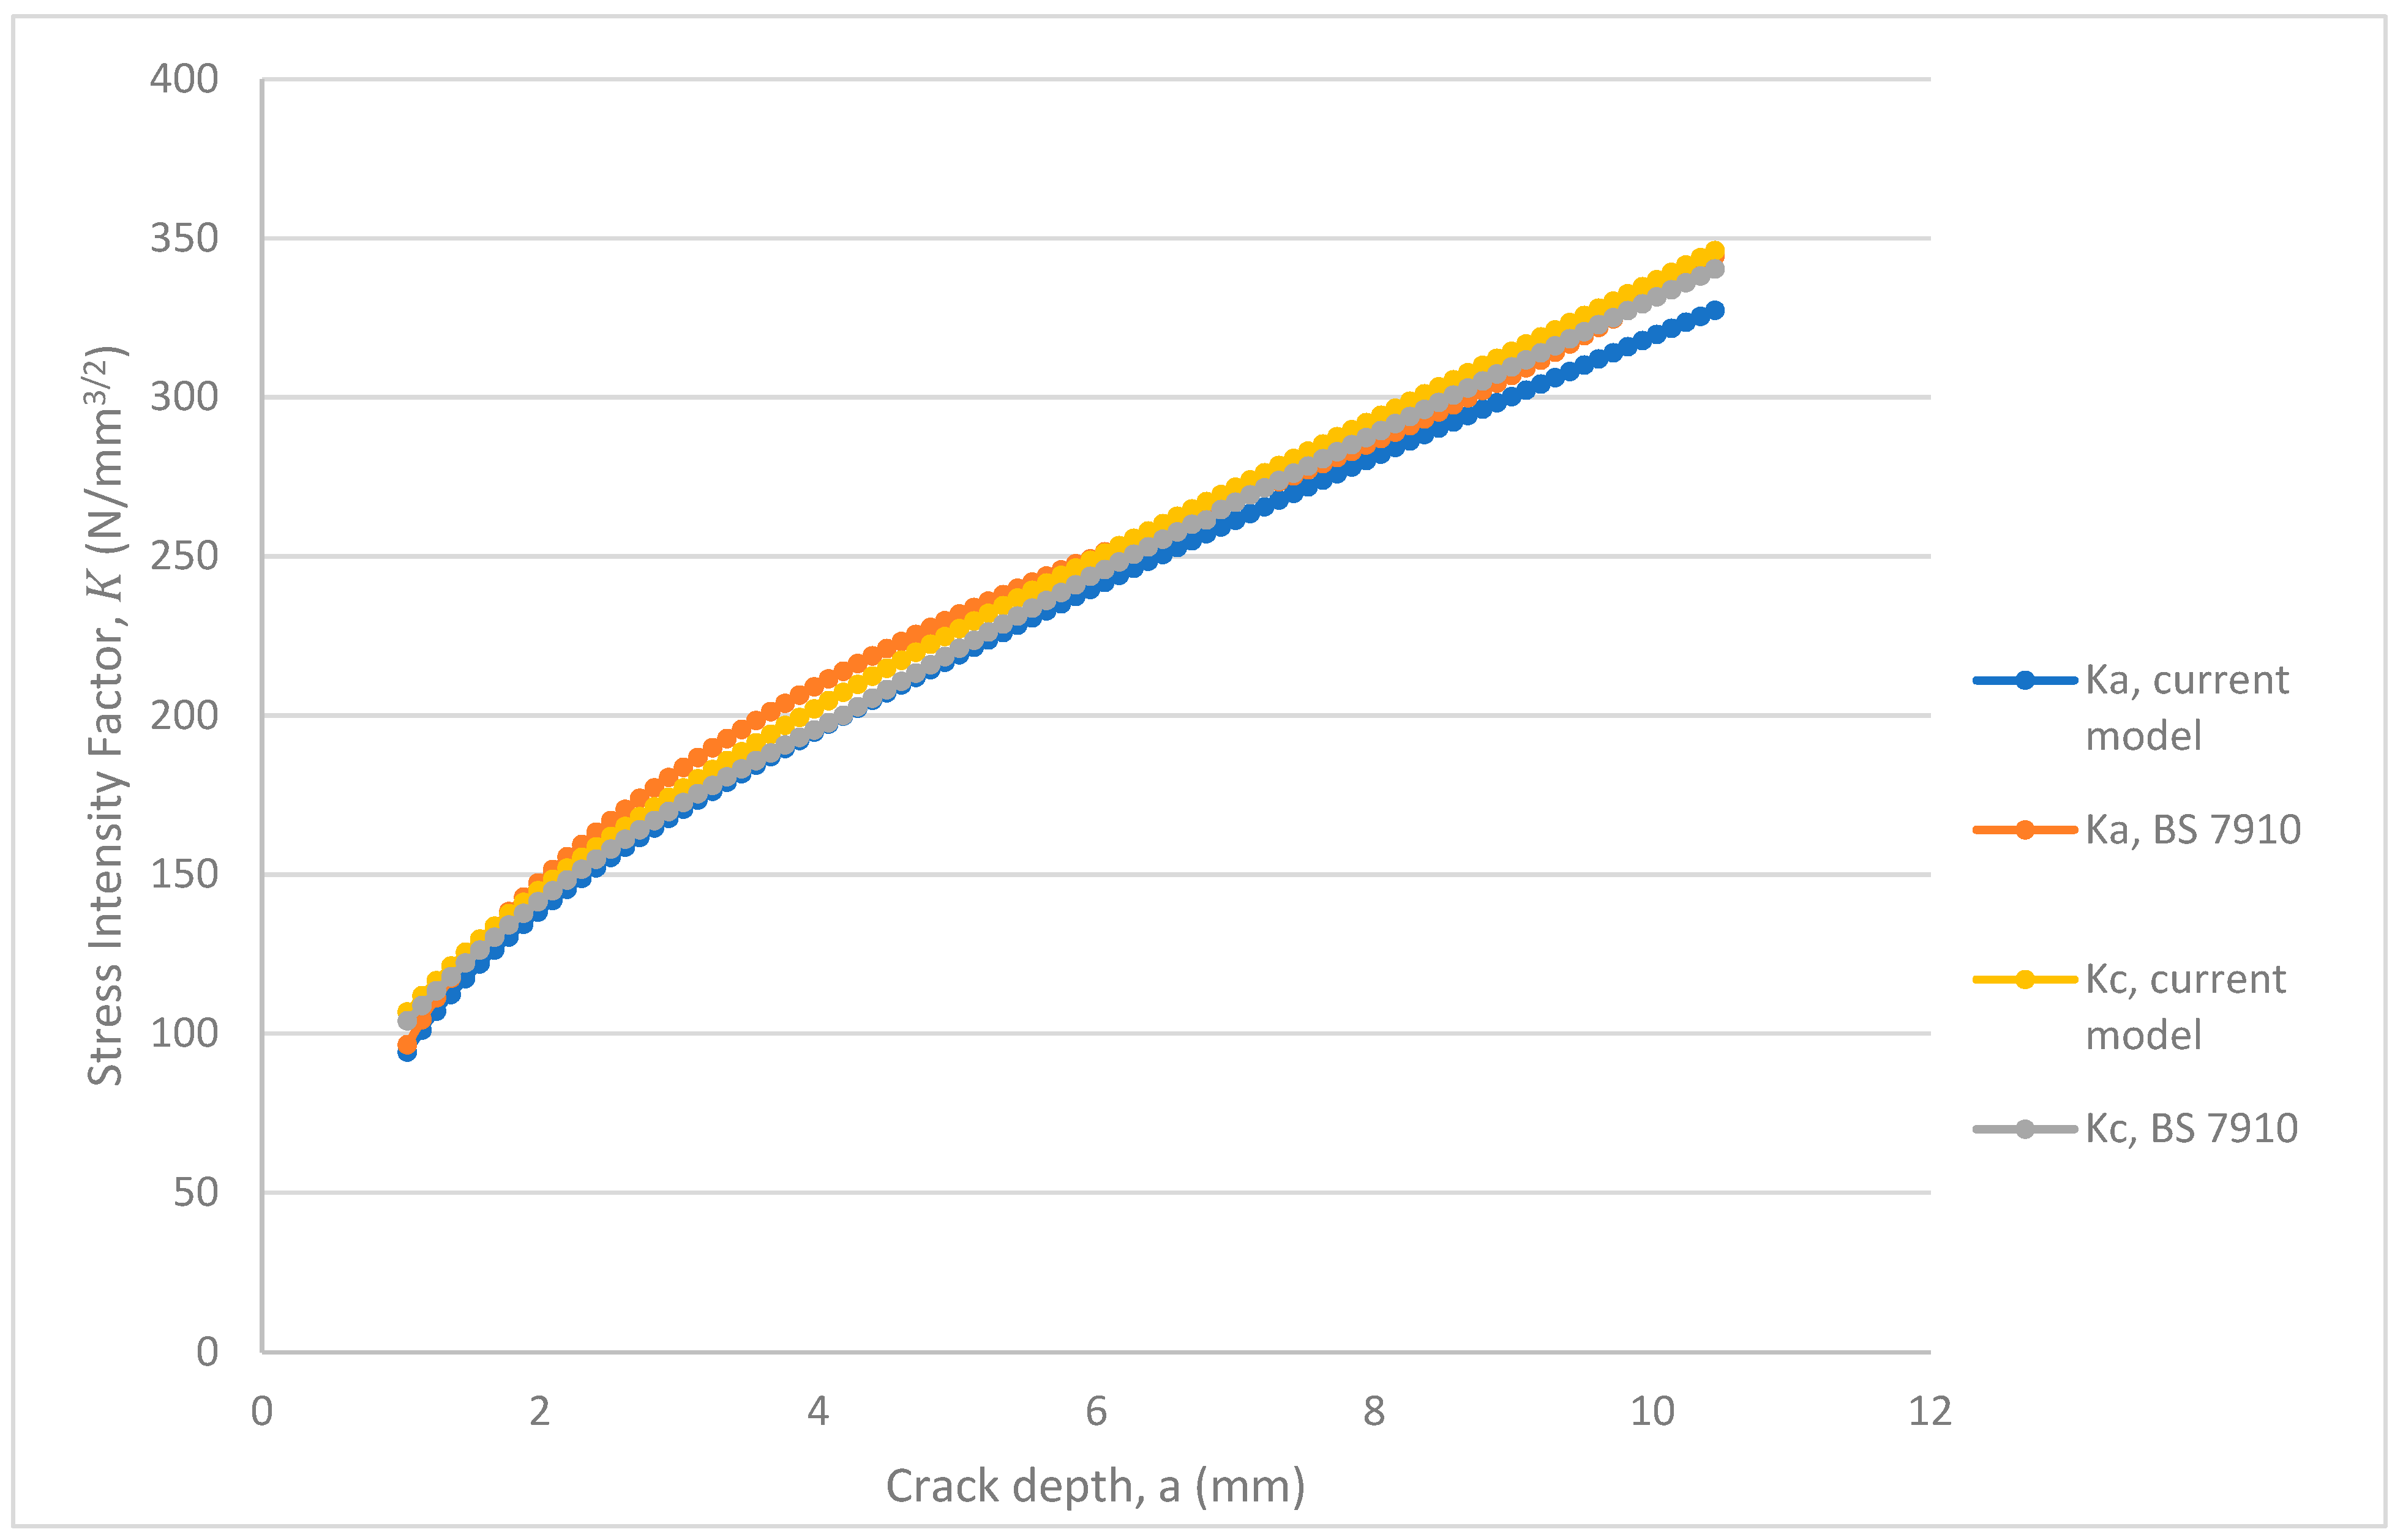
- The stress intensity factors, K, for a surface crack are estimated using Equations (2)–(4) at the deepest point Ka and at the crack surface Kc. The validation of the current method uses the pipe geometry in Figure 9.
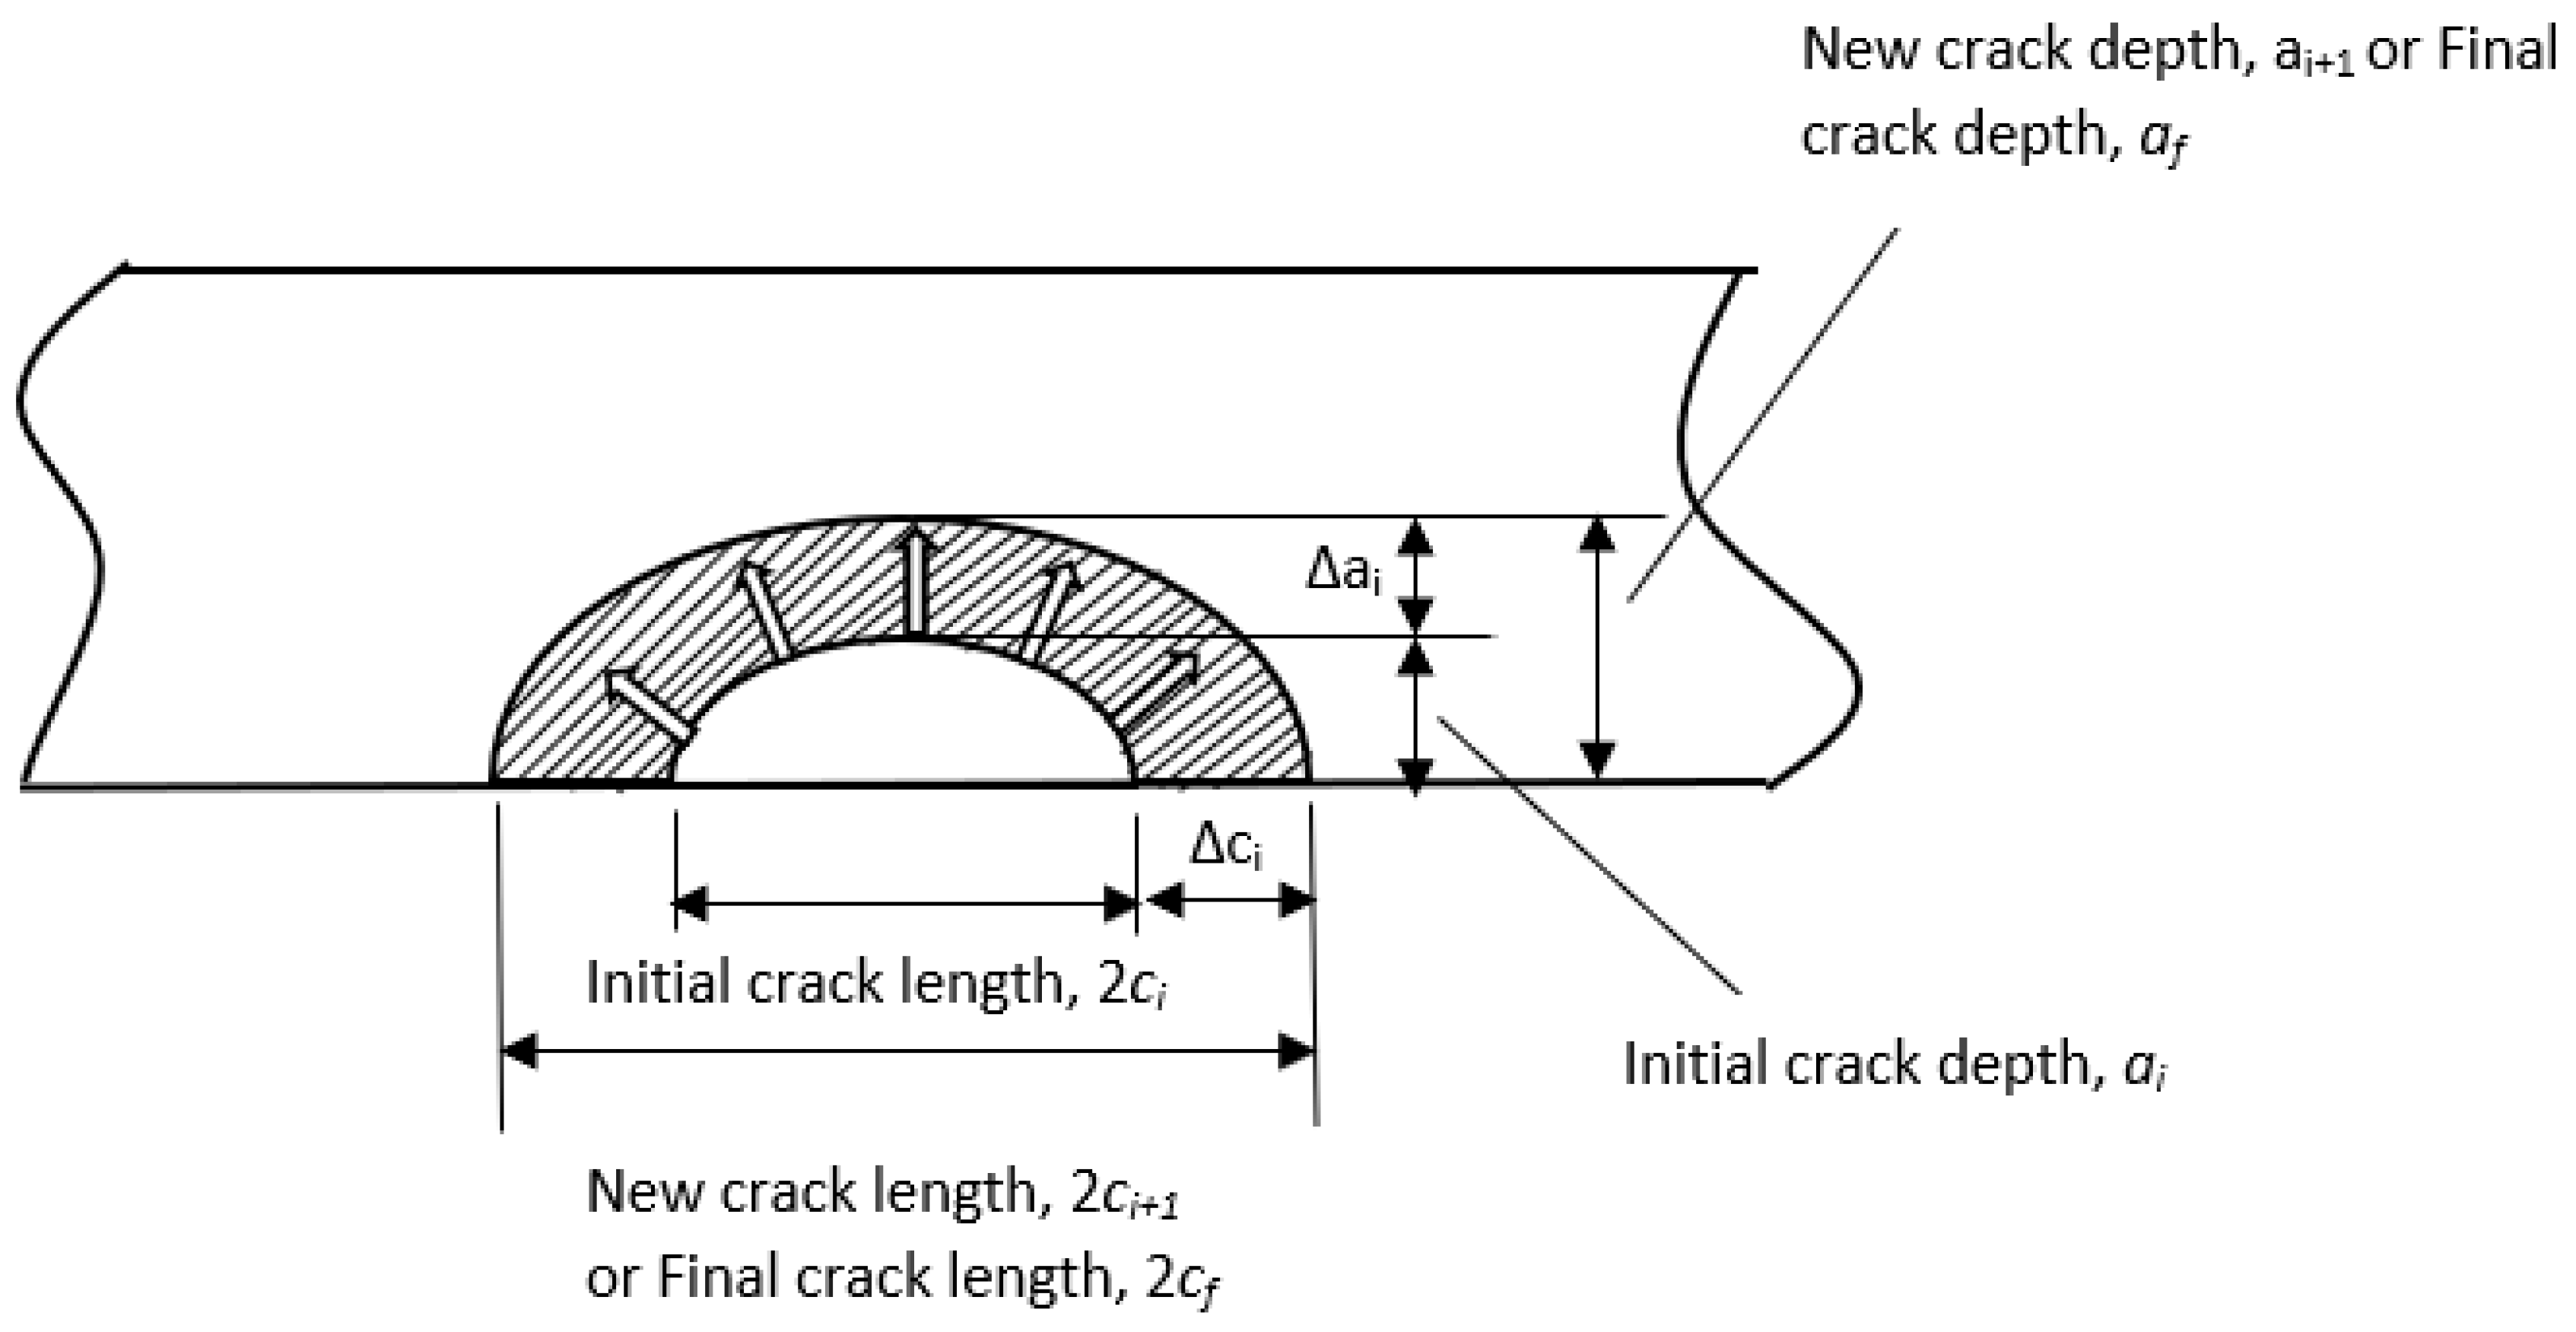
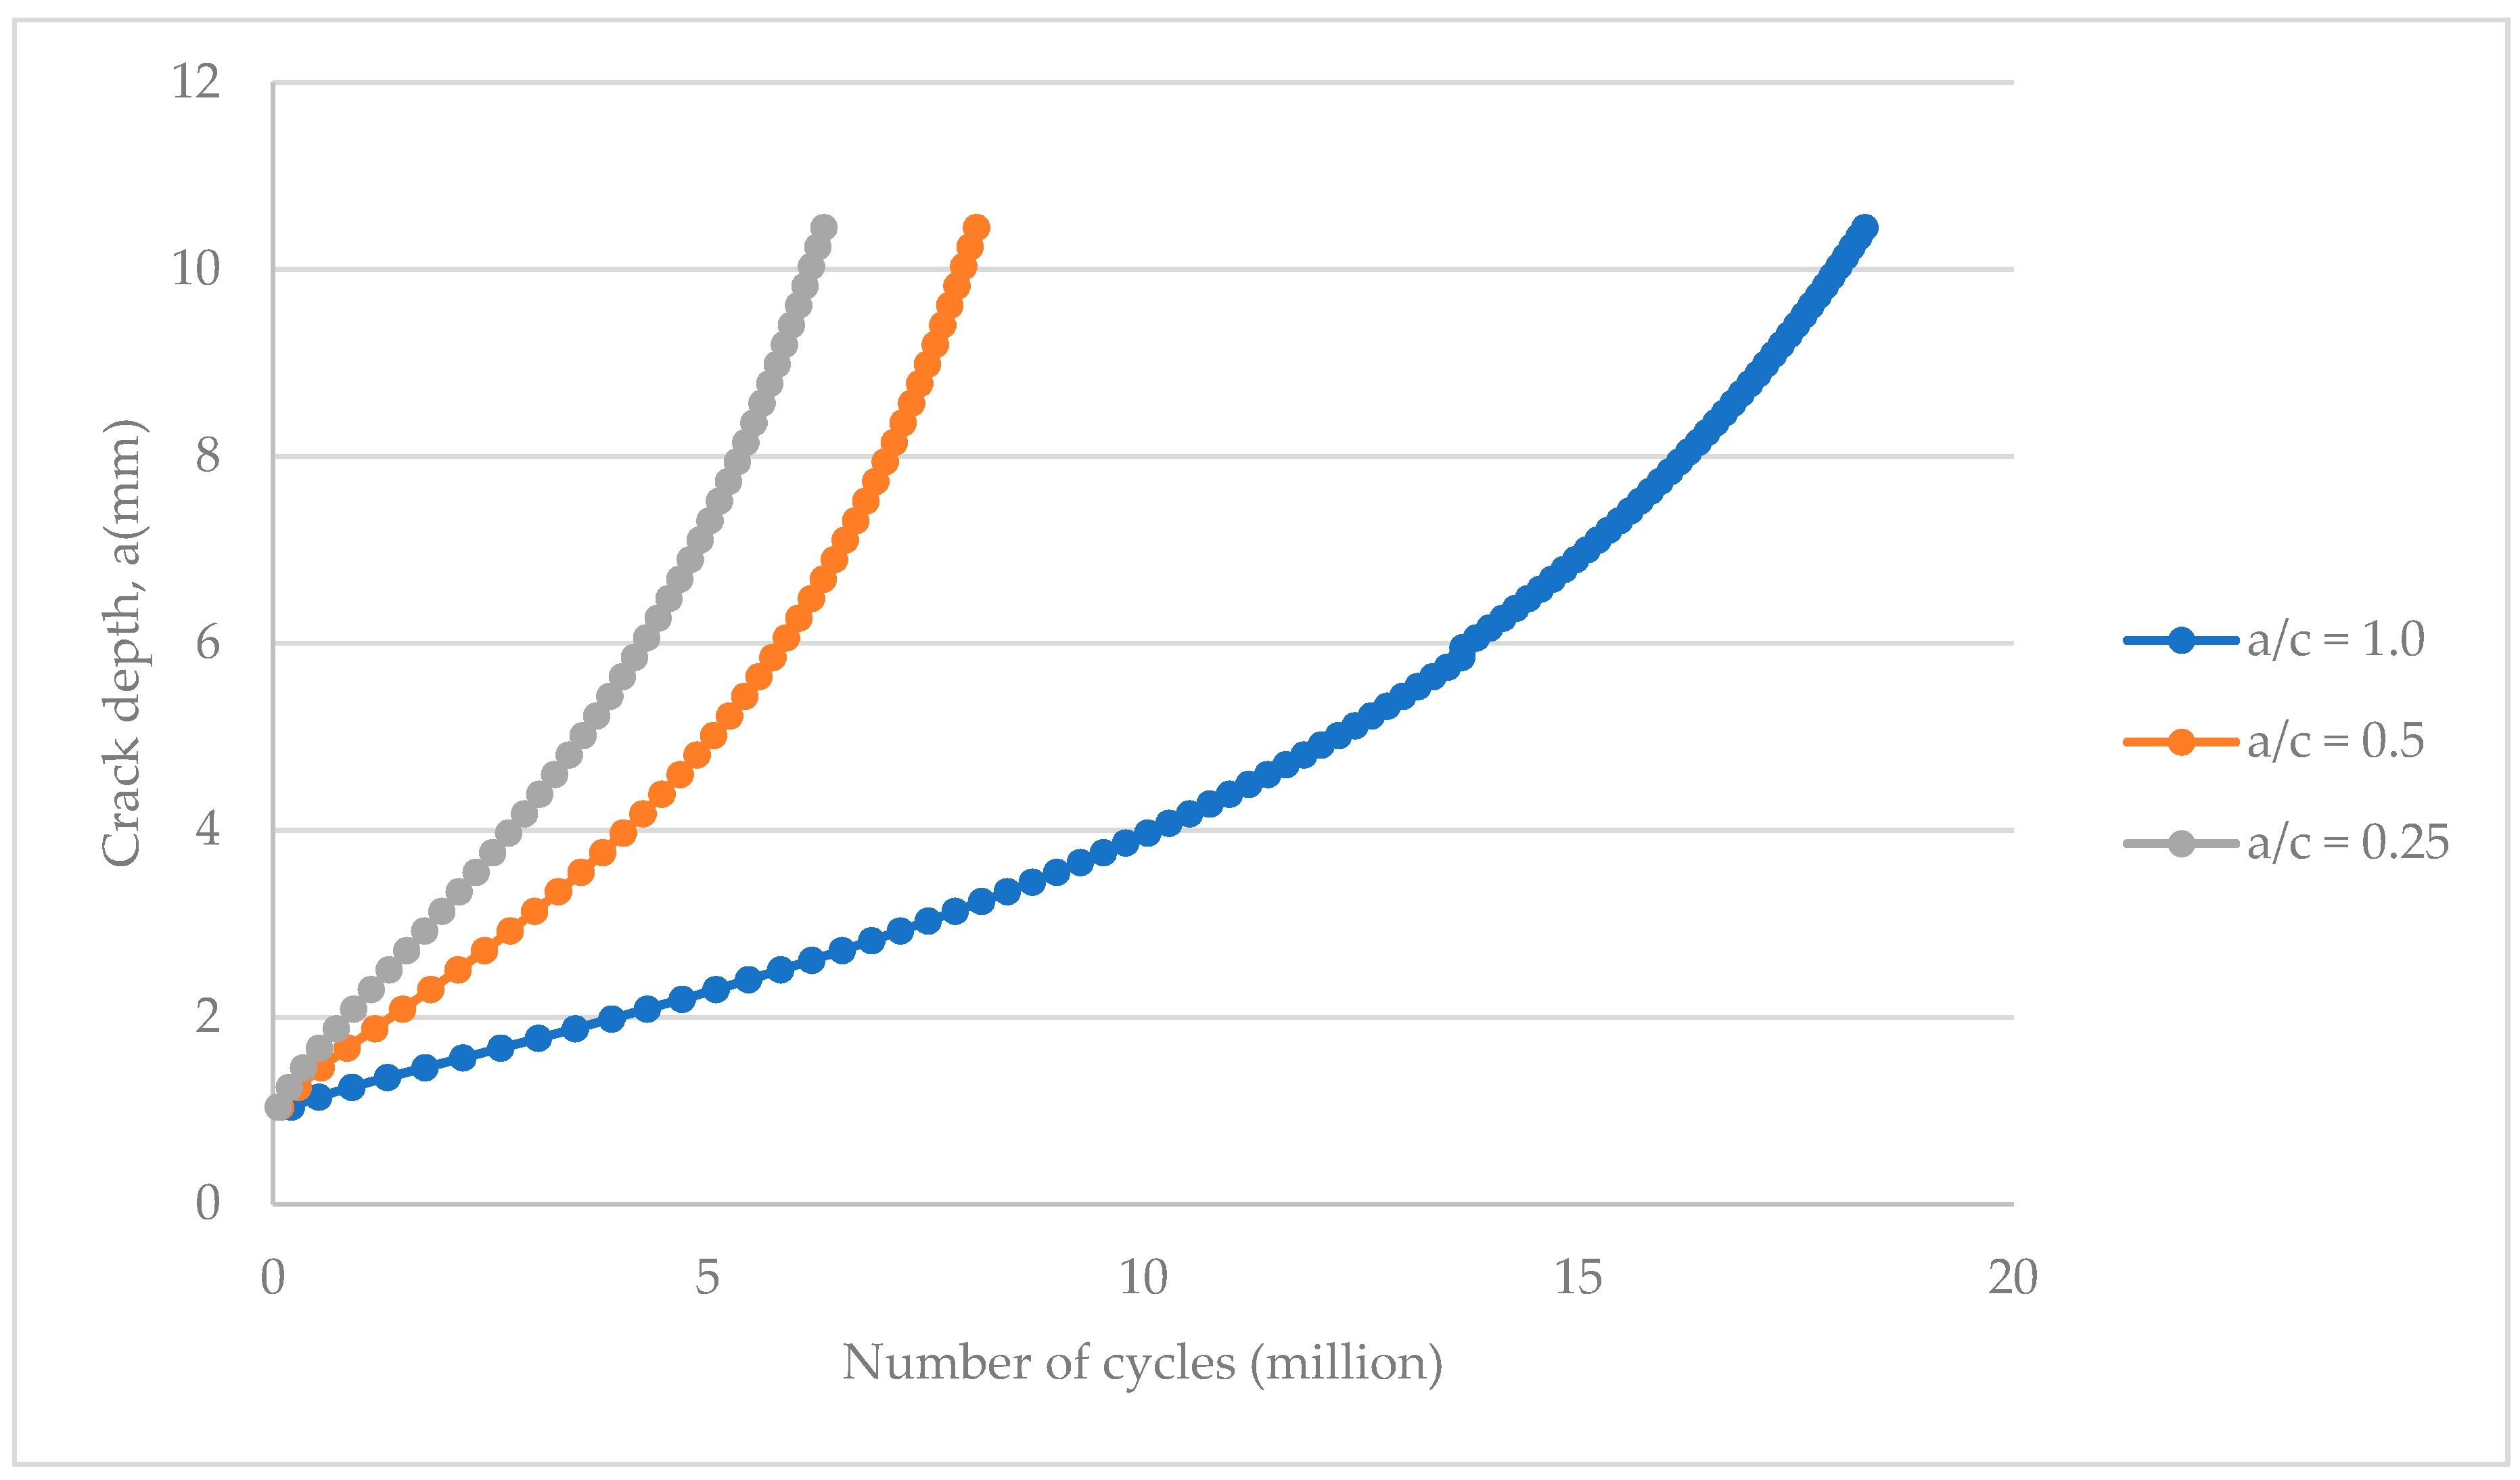
- By assuming a small linear increment in ai, Δai, and substituting for da in addition to substituting the values of Ka and Kc in Equation (6), the value of dc or Δci for the present cycle is evaluated. Note that the stress ratio, R, is assumed to be zero. Therefore, and .
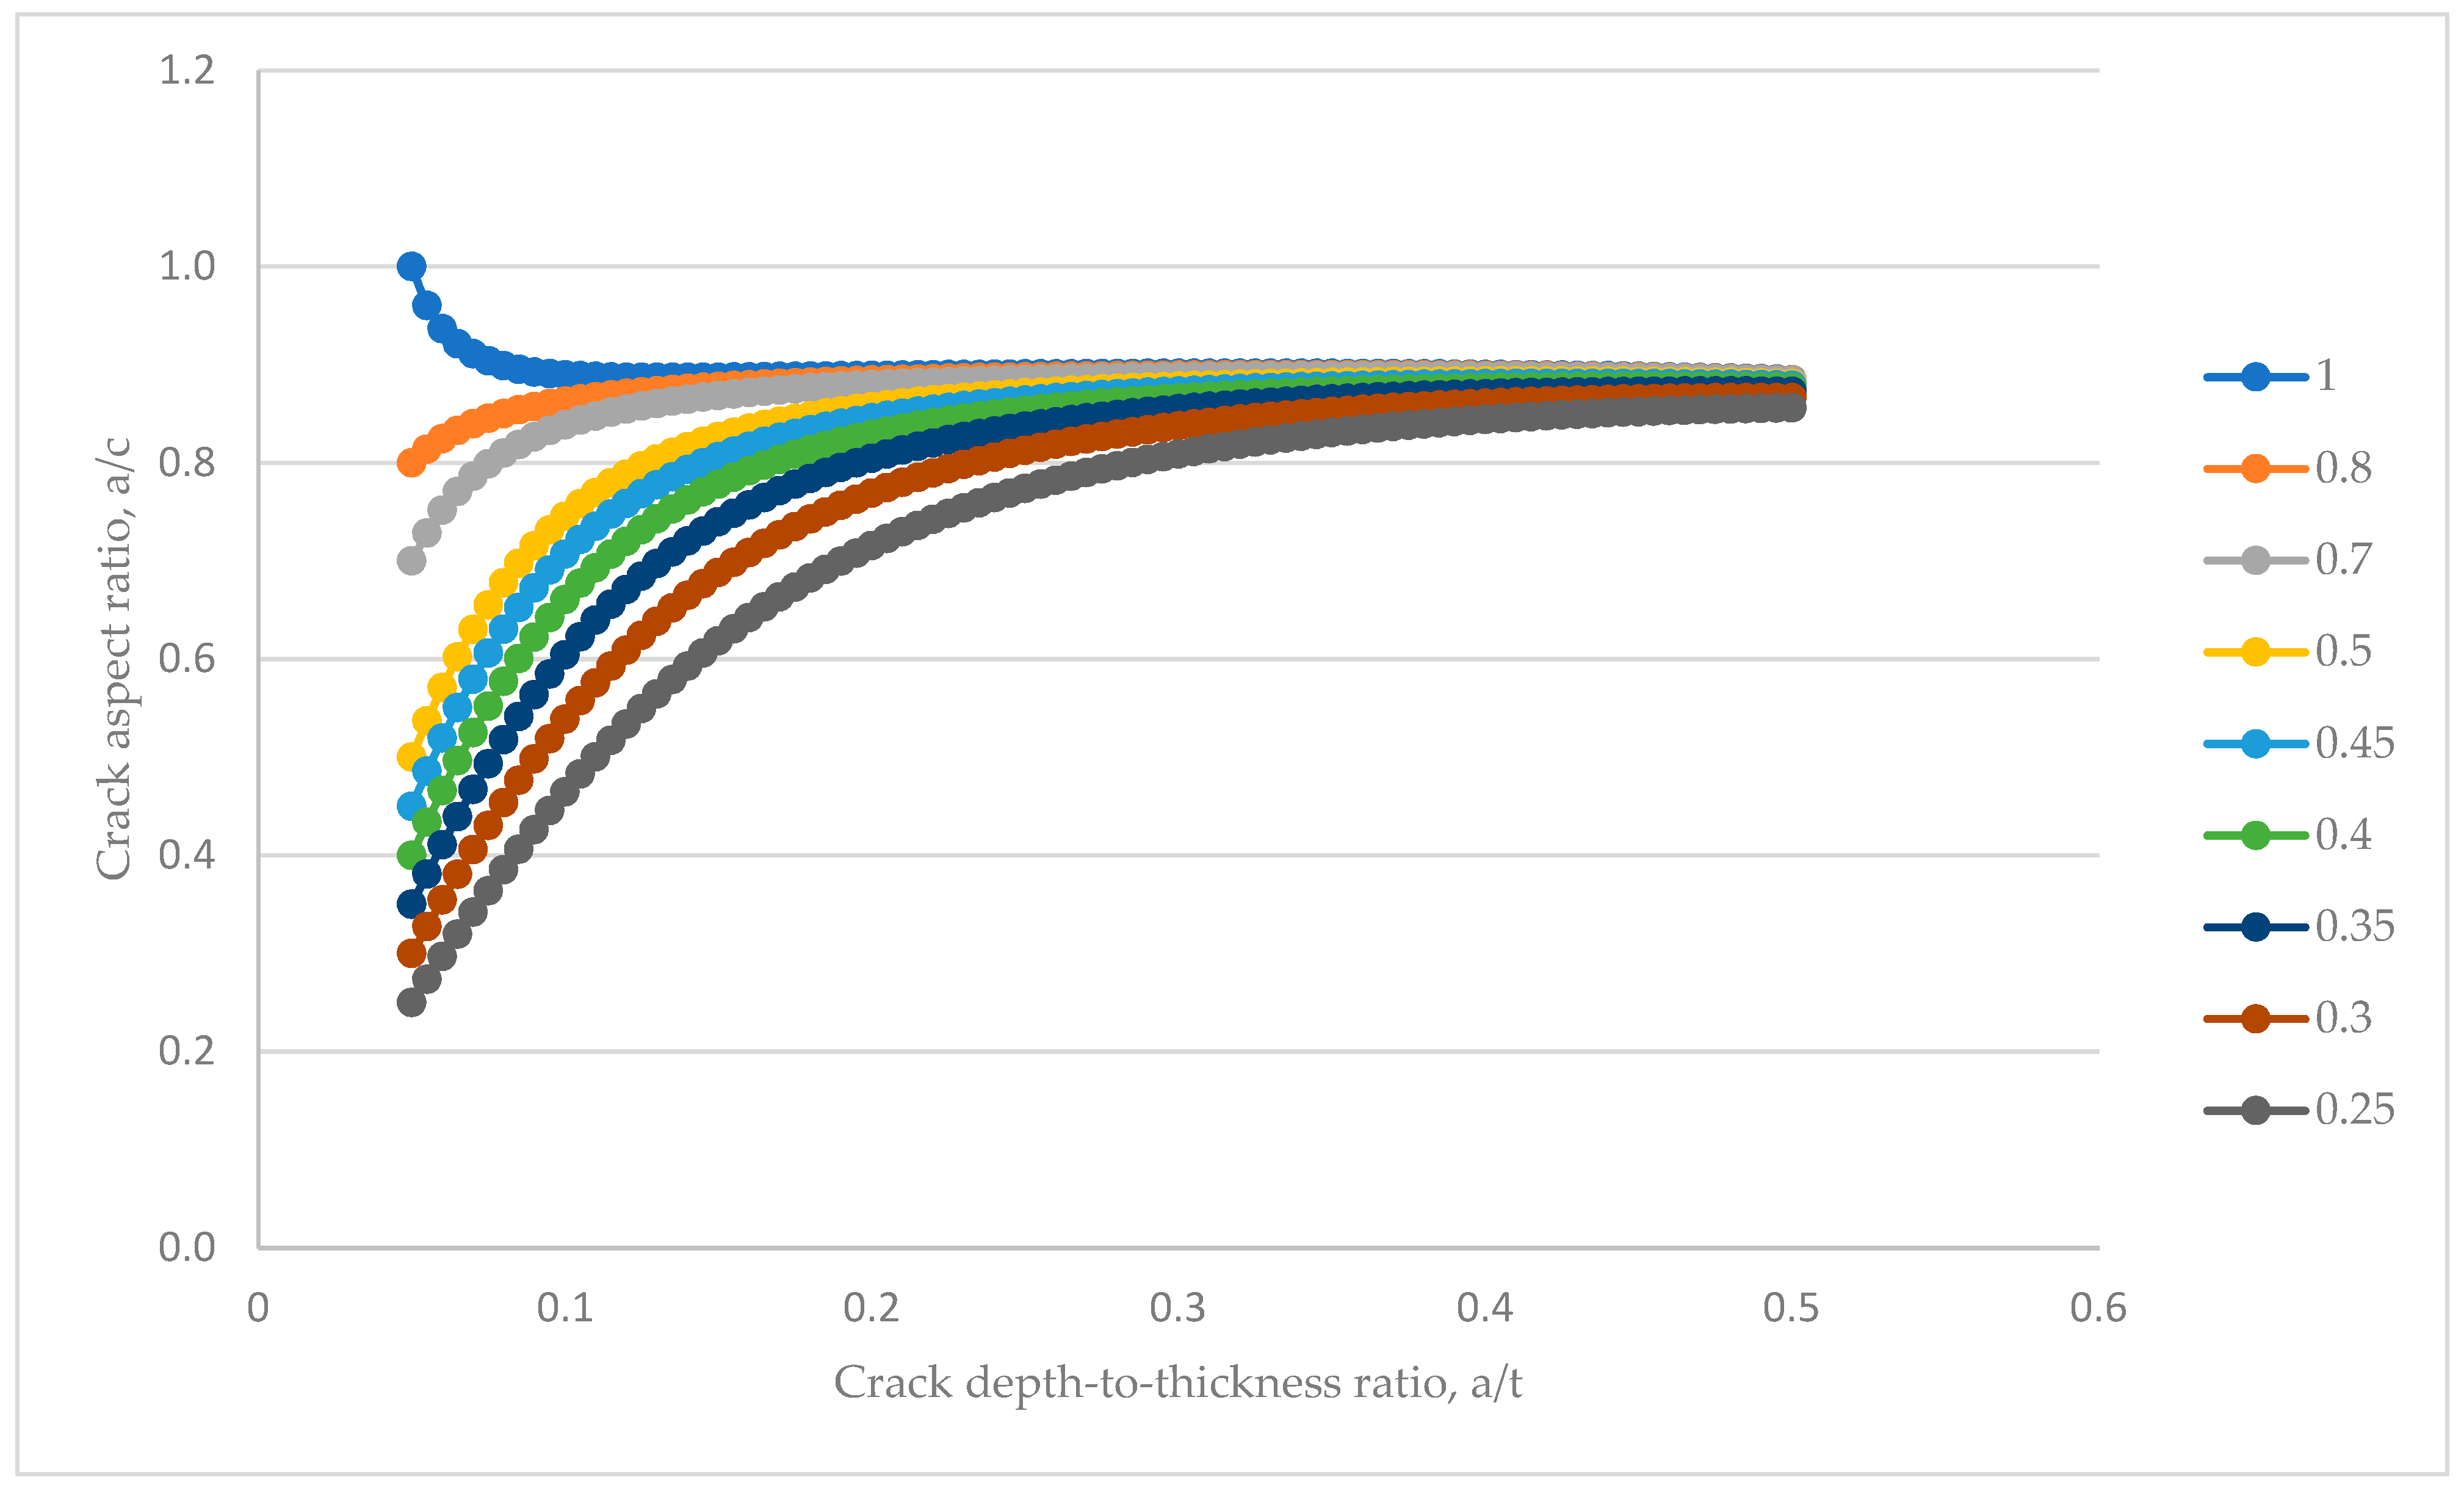
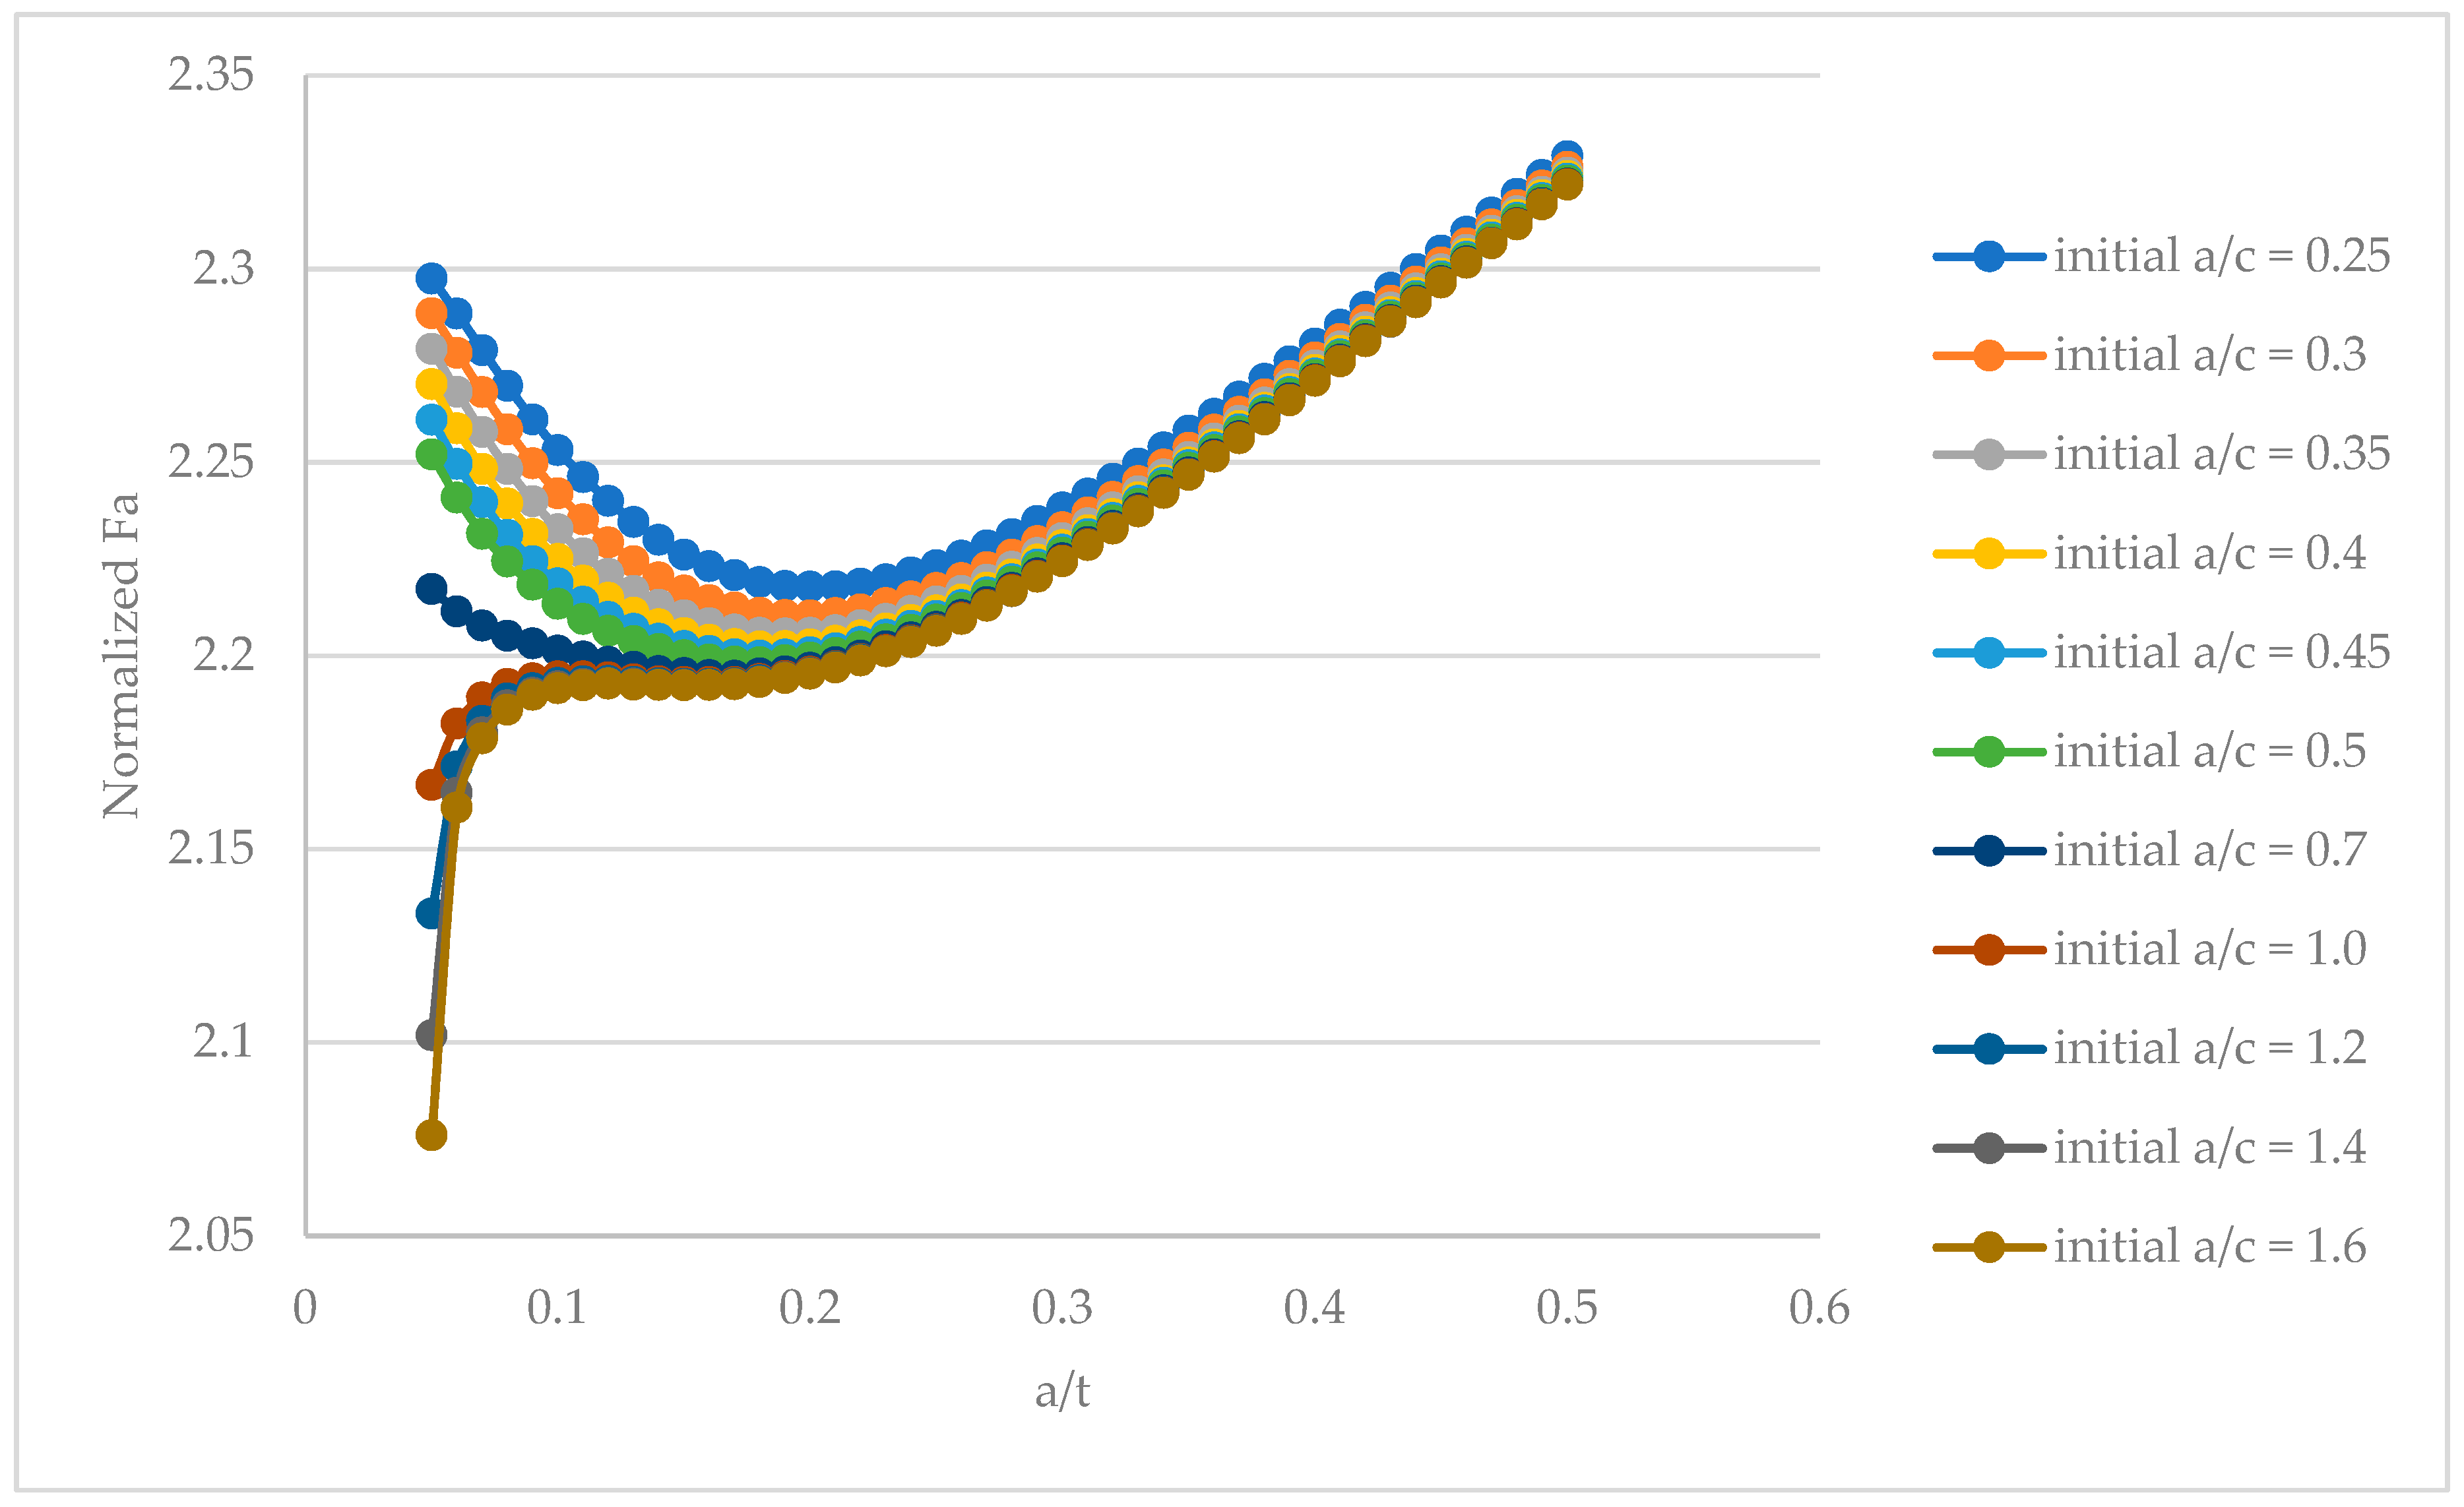
- The crack geometry and shape are updated for the next propagation step by adding Δai and Δci to ai and 2ci, respectively.
5. Conclusions
Author Contributions
Funding
Conflicts of Interest
Appendix A


References
- Xie, M.; Tian, Z. A review on pipeline integrity management utilizing in-line inspection data. Eng. Fail. Anal. 2018, 92, 222–239. [Google Scholar] [CrossRef]
- Kishawy, H.A.; Gabbar, H.A. Review of pipeline integrity management practices. Int. J. Press. Vessel. Pip. 2010, 87, 373–380. [Google Scholar] [CrossRef]
- The British Standards Institution. Guide to Methods for Assessing the Acceptability of Flaws in Metallic Structures, 3rd ed.; BS 7910; BSI Standards Limited: London, UK, 2013. [Google Scholar]
- Chong, T.-V.S.; Kumar, S.B.; Lai, M.O.; Loh, W.L. Fracture capacity of modern pipeline girth welds with 3D surface cracks under extreme operating conditions. Eng. Fract. Mech. 2015, 146, 139–160. [Google Scholar] [CrossRef]
- Netto, T.A.; Botto, A.; Lourenço, M.I. Fatigue performance of pre-strained pipes with girth weld defects: Full-scale experiments and analyses. Int. J. Fatigue 2008, 30, 767–778. [Google Scholar] [CrossRef]
- Benhamena, A.; Aminallah, L.; Bouiadjra, B.B.; Benguediab, M.; Amrouche, A.; Benseddiq, N. J integral solution for semi-elliptical surface crack in high density poly-ethylene pipe under bending. Mater. Des. 2011, 32, 2561–2569. [Google Scholar] [CrossRef]
- Holtam, C.M.; Baxter, D.P.; Ashcroft, I.A.; Thomson, R.C. Effect of crack depth on fatigue crack growth rates for a C-Mn pipeline steel in a sour environment. Int. J. Fatigue 2010, 32, 288–296. [Google Scholar] [CrossRef]
- Hoh, H.J.; Pang, J.H.L.; Tsang, K.S. Stress intensity factors for fatigue analysis of weld toe cracks in a girth-welded pipe. Int. J. Fatigue 2016, 87, 279–287. [Google Scholar] [CrossRef]
- Hutař, P.; Ševčík, M.; Náhlík, L.; Pinter, G.; Frank, A.; Mitev, I. A numerical methodology for lifetime estimation of HDPE pressure pipes. Eng. Fract. Mech. 2011, 78, 3049–3058. [Google Scholar] [CrossRef]
- Zhang, Y.M.; Fan, M.; Xiao, Z.M.; Zhang, W.G. Fatigue analysis on offshore pipelines with embedded cracks. Ocean Eng. 2016, 117, 45–56. [Google Scholar] [CrossRef]
- Pang, J.H.L.; Hoh, H.J.; Tsang, K.S.; Low, J.; Kong, S.C.; Yuan, W.G. Fatigue crack propagation analysis for multiple weld toe cracks in cut-out fatigue test specimens from a girth welded pipe. Int. J. Fatigue 2017, 94, 158–165. [Google Scholar] [CrossRef]
- Hertelé, S.; De Waele, W.; Denys, R.; Verstraete, M.; Van Wittenberghe, J. Parametric finite element model for large scale tension tests on flawed pipeline girth welds. Adv. Eng. Softw. 2012, 47, 24–34. [Google Scholar] [CrossRef]
- Yi, D.; Xiao, Z.M.; Idapalapati, S.; Kumar, S.B. Fracture analysis of girth welded pipelines with 3D embedded cracks subjected to biaxial loading conditions. Eng. Fract. Mech. 2012, 96, 570–587. [Google Scholar] [CrossRef]
- Arora, P.; Singh, P.K.; Bhasin, V.; Vaze, K.K.; Ghosh, A.K.; Pukazhendhi, D.M.; Gandhi, P.; Raghava, G. Predictions for fatigue crack growth life of cracked pipes and pipe welds using RMS SIF approach and experimental validation. Int. J. Press. Vessel. Pip. 2011, 88, 384–394. [Google Scholar] [CrossRef]
- Benhamena, A.; Bachir Bouiadjra, B.; Amrouche, A.; Mesmacque, G.; Benseddiq, N.; Benguediab, M. Three finite element analysis of semi-elliptical crack in high density poly-ethylene pipe subjected to internal pressure. Mater. Des. 2010, 31, 3038–3043. [Google Scholar] [CrossRef]
- Kou, K.P.; Burdekin, F.M. Stress intensity factors for a wide range of long-deep semi-elliptical surface cracks, partly through-wall cracks and fully through-wall cracks in tubular members. Eng. Fract. Mech. 2006, 73, 1693–1710. [Google Scholar] [CrossRef]
- Li, Z.; Jiang, X.; Hopman, H.; Zhu, L.; Liu, Z. An investigation on the circumferential surface crack growth in steel pipes subjected to fatigue bending. Theor. Appl. Fract. Mech. 2020, 105. [Google Scholar] [CrossRef]
- Baik, B.; Yamada, K.; Ishikawa, T. Fatigue crack propagation analysis for welded joint subjected to bending. Int. J. Fatigue 2011, 33, 746–758. [Google Scholar] [CrossRef]
- Li, Z.; Jiang, X.; Hopman, H. Surface crack growth in offshore metallic pipes under cyclic loads: A literature review. J. Mar. Sci. Eng. 2020, 8, 339. [Google Scholar] [CrossRef]
- Raju, I.S.; Newman, J.C. Stress-Intensity Factors for Circumferential Surface Cracks in Pipes and Rods Under Tension and Bending Loads. ASTM Spec. Tech. Publ. 1986, 789–805. [Google Scholar] [CrossRef]
- Paredes, M.; Ruggieri, C. Further results in J and CTOD estimation procedures for SE(T) fracture specimens—Part II: Weld centerline cracks. Eng. Fract. Mech. 2012, 89, 24–39. [Google Scholar] [CrossRef]
- Moore, P.; Pisarski, H. CTOD and Pipelines—The Past, Present and Future. In Proceedings of the 6th International Pipeline Technology Conference, Ostend, Belgium, 6–9 October 2013; TWI Ltd.: Cambridge, UK, 2013. [Google Scholar]
- Rice, J.R. A Path Independent Integral and the Approximate Analysis of Strain Concentration by Notches and Cracks. J. Appl. Mech. 1968, 35, 379–386. [Google Scholar] [CrossRef]
- Courtin, S.; Gardin, C.; Bézine, G.; Hamouda, H.B.H. Advantages of the J-integral approach for calculating stress intensity factors when using the commercial finite element software ABAQUS. Eng. Fract. Mech. 2005. [Google Scholar] [CrossRef]
- Lin, X.B.; Smith, R.A. Fatigue growth prediction of internal surface cracks in pressure vessels. J. Press. Vessel Technol. Trans. ASME 1998, 120, 17–23. [Google Scholar] [CrossRef]
- Hakimelahi, B.; Soltani, N. 3D J-integral evaluation using the computation of line and surface integrals. Fatigue Fract. Eng. Mater. Struct. 2010, 33, 661–672. [Google Scholar] [CrossRef]
- COMSOL Multiphysics® v. 5.5; COMSOL AB: Stockholm, Sweden; Available online: www.comsol.com (accessed on 10 September 2020).
- Tada, H.; Paris, P.; Irwin, G. The Stress Analysis of Cracks Handbook, 3rd ed.; ASME Press: New York, NY, USA, 2000; ISBN 9780511806865. [Google Scholar]
- Chiarelli, M.; Frediani, A. A computation of the three-dimensional J-integral for elastic materials with a view to applications in fracture mechanics. Eng. Fract. Mech. 1993, 44, 763–788. [Google Scholar] [CrossRef]
- Heidersbach, R. Metallurgy and Corrosion Control in Oil and Gas Production; Wiley Series in Corrosion; Wiley: New York, NY, USA, 2018; ISBN 9781119252375. [Google Scholar]
- ABAQUS. Version 6.14 User’s Manual; Dassault Systèmes Simulia Corp.: Providence, RI, USA, 2014. [Google Scholar]
- Shih, C.F.; Moran, B.; Nakamura, T. Energy release rate along a three-dimensional crack front in a thermally stressed body. Int. J. Fract. 1986, 30, 79–102. [Google Scholar] [CrossRef]
- Bergman, M. Stress Intensity Factors for Circumferential Surface Cracks in Pipes. Fatigue Fract. Eng. Mater. Struct. 1995, 18, 1155–1172. [Google Scholar] [CrossRef]
- Paris, P.; Erdogan, F. A Critical Analysis of Crack Propagation Laws. J. Basic Eng. 1963, 85, 528–533. [Google Scholar] [CrossRef]
- Tanaka, S.; Kawahara, T.; Okada, H. Study on crack propagation simulation of surface crack in welded joint structure. Mar. Struct. 2014, 39, 315–334. [Google Scholar] [CrossRef]
- Fulland, M.; Richard, H.A. Numerical determination of crack paths in three-dimensional structures with the program system ADAPCRACK3D. In Proceedings of the Conference of fatigue Crack Path FCP, Parma, Italy, 18–21 September 2003; Volume 49. [Google Scholar]
- Newman, J.C.; Raju, I.S. An empirical stress-intensity factor equation for the surface crack. Eng. Fract. Mech. 1981, 15, 185–192. [Google Scholar] [CrossRef]


| Contour Path no. | Path Dimensions (mm mm) | (N/mm) | (N/mm) | (N/mm) | SIF, (N/mm3/2) |
|---|---|---|---|---|---|
| 1 | 1.6376 | −0.0262 | 1.6113 | 60.542 | |
| 2 | 1.6385 | −0.0330 | 1.6055 | 60.432 | |
| 3 | 1.6381 | −0.0326 | 1.6055 | 60.432 | |
| 4 | 1.6346 | −0.0293 | 1.6053 | 60.429 | |
| 5 | 1.6309 | −0.0259 | 1.6050 | 60.424 | |
| 6 | 1.6270 | −0.0219 | 1.6051 | 60.425 | |
| 7 | 1.6246 | −0.0199 | 1.6046 | 60.416 |
| Contour Path no. | Path Dimensions (mm mm) | (N/mm) | (N/mm) | (N/mm) | SIF, (N/mm3/2) |
|---|---|---|---|---|---|
| 1 | 1.9760 | 0.0289 | 2.0049 | 67.533 | |
| 2 | 1.9718 | 0.0386 | 2.0104 | 67.625 | |
| 3 | 1.9691 | 0.0422 | 2.0113 | 67.640 | |
| 4 | 1.9680 | 0.0433 | 2.0113 | 67.640 | |
| 5 | 1.9683 | 0.0432 | 2.0115 | 67.643 | |
| 6 | 1.9682 | 0.0433 | 2.0114 | 67.642 | |
| 7 | 1.9670 | 0.0440 | 2.0110 | 67.634 |
| Internal Through-Wall Crack | External Through-Wall Crack | |||||||
|---|---|---|---|---|---|---|---|---|
| ri(mm) | (N/mm) | (N/mm) | (N/mm) | (N/mm) | (N/mm) | (N/mm) | ||
| 30 | 0.8966 | −0.03353 | 0.86306 | −0.03885 | 9.5833 | 0.14102 | 9.7244 | 0.014502 |
| 31 | 0.9188 | −0.03327 | 0.88557 | −0.03757 | 8.5223 | 0.12306 | 8.6454 | 0.014234 |
| 32 | 0.9449 | −0.03313 | 0.91176 | −0.03634 | 7.5497 | 0.10607 | 7.6558 | 0.013855 |
| 33 | 0.9757 | −0.03311 | 0.94254 | −0.03513 | 6.6553 | 0.091188 | 6.7465 | 0.013516 |
| 34 | 1.0126 | −0.03322 | 0.9794 | −0.03392 | 5.8297 | 0.078257 | 5.9079 | 0.013246 |
| 35 | 1.0578 | −0.03346 | 1.0244 | −0.03267 | 5.0639 | 0.066976 | 5.1309 | 0.013053 |
| 36 | 1.1143 | −0.03386 | 1.0804 | −0.03134 | 4.3495 | 0.057234 | 4.4068 | 0.012988 |
| 37 | 1.1864 | −0.0344 | 1.152 | −0.02986 | 3.679 | 0.048858 | 3.7279 | 0.013106 |
| 38 | 1.2808 | −0.03505 | 1.2458 | −0.02814 | 3.0464 | 0.041574 | 3.088 | 0.013463 |
| 39 | 1.4086 | −0.03571 | 1.3729 | −0.02601 | 2.4484 | 0.035131 | 2.4835 | 0.014146 |
| 40 | 1.5884 | −0.03607 | 1.5523 | −0.02324 | 1.8852 | 0.029085 | 1.9143 | 0.015194 |
| Case | Current Method (N/mm3/2) | Tada et al. (N/mm3/2) | Absolute Error (%) | Hakimelahi et al. (N/mm3/2) | Absolute Error (%) |
|---|---|---|---|---|---|
| (a) | 60.443 | 61.075 | 1.0 | 59.703 | 1.2 |
| (b) | 67.622 | 67.971 | 0.5 | 67.450 | 0.3 |
| Subscripts | ||||||
|---|---|---|---|---|---|---|
| Coefficients | 0 | 1 | 2 | 3 | 4 | 5 |
| 2.3588 | 0.7325 | −20.54 | 106.17 | −209.97 | 147.31 | |
| 0.2103 | −15.042 | 147.75 | −593.83 | 1075.3 | −725.62 | |
| −0.7112 | 24.183 | −212.69 | 815.23 | −1437.4 | 953.53 | |
| 0.2415 | −7.5538 | 64.517 | −242.98 | 423.28 | −278.27 | |
| Subscripts | ||||
|---|---|---|---|---|
| Coefficients | 0 | 1 | 2 | 3 |
| 1.4592 | 3.5643 | −13.305 | 15.029 | |
| 3.469 | −43.043 | 150.22 | −157.35 | |
| −12.11 | 143.01 | −482.17 | 489.9 | |
| 19.121 | −218.36 | 714.27 | −702.98 | |
| −14.471 | 160.71 | −510.37 | 485.22 | |
| 4.2501 | −46.035 | 141.92 | −129.89 | |
Publisher’s Note: MDPI stays neutral with regard to jurisdictional claims in published maps and institutional affiliations. |
© 2020 by the authors. Licensee MDPI, Basel, Switzerland. This article is an open access article distributed under the terms and conditions of the Creative Commons Attribution (CC BY) license (http://creativecommons.org/licenses/by/4.0/).
Share and Cite
Olamide, A.; Bennecer, A.; Kaczmarczyk, S. Finite Element Analysis of Fatigue in Offshore Pipelines with Internal and External Circumferential Cracks. Appl. Mech. 2020, 1, 193-223. https://doi.org/10.3390/applmech1040013
Olamide A, Bennecer A, Kaczmarczyk S. Finite Element Analysis of Fatigue in Offshore Pipelines with Internal and External Circumferential Cracks. Applied Mechanics. 2020; 1(4):193-223. https://doi.org/10.3390/applmech1040013
Chicago/Turabian StyleOlamide, Ayodeji, Abdeldjalil Bennecer, and Stefan Kaczmarczyk. 2020. "Finite Element Analysis of Fatigue in Offshore Pipelines with Internal and External Circumferential Cracks" Applied Mechanics 1, no. 4: 193-223. https://doi.org/10.3390/applmech1040013
APA StyleOlamide, A., Bennecer, A., & Kaczmarczyk, S. (2020). Finite Element Analysis of Fatigue in Offshore Pipelines with Internal and External Circumferential Cracks. Applied Mechanics, 1(4), 193-223. https://doi.org/10.3390/applmech1040013