Article

ACBE-CroFuseNet: An Optical and SAR Cross-Fusion Semantic Segmentation Network for Paddy Rice Extraction

School of Earth Sciences, Zhejiang University, Hangzhou 310058, China
*
Author to whom correspondence should be addressed.
AI 2026, 7(8), 302; https://doi.org/10.3390/ai7080302
Submission received: 2 July 2026 / Revised: 2 August 2026 / Accepted: 5 August 2026 / Published: 6 August 2026
(This article belongs to the Special Issue AI-Powered Remote Sensing for Agriculture)

Abstract

Accurate mapping of paddy rice is essential for agricultural monitoring, yield estimation, and food security assessment. However, optical imagery is often affected by clouds and spectral confusion, while SAR imagery suffers from speckle noise and weak spatial detail representation. Simple optical and SAR feature concatenation is therefore insufficient for complex agricultural landscapes. To address these limitations, this study proposes ACBE-CroFuseNet, an optical and SAR cross-fusion semantic segmentation network for paddy rice extraction using Sentinel-1 SAR and Sentinel-2 optical imagery in Yancheng, Jiangsu Province. ACBE-CroFuseNet introduces two task-oriented designs for paddy rice mapping. First, an attention cross-fusion module is developed to adaptively model modality contributions and spatial responses between optical spectral–textural features and SAR scattering–structural features. Second, a boundary enhancement module with boundary supervision is introduced to strengthen the delineation of fragmented paddy fields and field edges. Multimodal feature aggregation and multi-scale deep supervision are further used to improve feature utilization and segmentation stability. Compared with UNet++, Swin-Unet, CroFuseNet, and CMFFNet under five-fold cross-validation, ACBE-CroFuseNet achieves the best overall performance. The extracted paddy rice area in Yancheng in 2025 demonstrates the applicability of the proposed method for large-scale crop mapping.

1. Introduction

Paddy rice is one of the most important food crops in China and worldwide. Rapid and accurate acquisition of its spatial distribution information provides an essential basis for agricultural resource investigation, planting structure optimization, crop growth monitoring, and food security assessment [1,2,3,4,5]. Owing to its advantages of wide spatial coverage, high data acquisition efficiency, and objectivity, remote sensing technology has become an important approach for extracting paddy rice planting areas [6].
Paddy rice production areas are mostly located in humid or semi-humid regions, where key rice growth stages are frequently affected by clouds, rainfall, and fog. As a result, optical imagery often suffers from insufficient valid observations, missing spectral information, and discontinuous time-series records [7,8,9]. In contrast, synthetic aperture radar (SAR) has all-time and all-weather imaging capability. It can acquire land surface backscattering information and is sensitive to flooding, transplanting, vegetation structure, and surface roughness changes in paddy fields [10]. Therefore, SAR has become an important data source for paddy rice extraction in cloudy and rainy regions. Early studies mainly used ERS, ENVISAT/ASAR, RADARSAT, and other SAR data to identify paddy fields based on temporal backscattering changes caused by flooding and vegetation growth during the rice growing season. For example, Bouvet and Le Toan used ENVISAT/ASAR wide-swath data for rice field mapping in the Mekong Delta, demonstrating the potential of multi-temporal C-band SAR data for large-scale rice monitoring [11]. Nelson et al. developed an operational SAR-based rice monitoring system for multiple demonstration sites across Asia within the RIICE project, proving the feasibility of SAR time series for operational rice monitoring [12]. Clauss et al. mapped rice areas using Sentinel-1 time series and superpixel segmentation, showing that object-based spatial processing can reduce the influence of speckle noise on classification results [13]. These studies indicate that SAR data can effectively capture structural and moisture changes during rice growth and serve as an important complement to optical imagery.
With the open availability of Sentinel-1 data, SAR time-series-based paddy rice extraction has been further developed. Bazzi et al. used Sentinel-1 SAR time series to map rice in the Camargue region of France, confirming the effectiveness of Sentinel-1 for rice identification in temperate rice-growing areas [14]. Nguyen et al. combined Sentinel-1 time series with the Google Earth Engine platform to achieve near-real-time monitoring of rice extent, cropping patterns, and growth stages in Southeast Asia [15]. Other studies have used VH/VV polarization features, dynamic thresholds, slope-based indices, dynamic time warping, and phenology-based rules from Sentinel-1 data to identify paddy rice under different regional conditions and cropping systems [16,17,18]. However, SAR data also have limitations, including speckle noise, complex scattering mechanisms, and insufficient spatial texture details. In areas mixed with wetlands, water bodies, dryland crops, and other vegetation, relying only on SAR data can easily lead to commission and omission errors. This problem is particularly evident in agricultural landscapes with fragmented paddy field boundaries, small field sizes, or complex background land-cover types.
Optical imagery and SAR imagery are highly complementary in imaging mechanisms and information representation. Optical imagery can reflect vegetation spectra, chlorophyll absorption, and canopy growth status, while SAR imagery can characterize surface structure, moisture conditions, and vegetation volume scattering. Previous reviews have pointed out that optical and radar data fusion can generally improve land-use/land-cover and agricultural target recognition accuracy. However, because these two types of data differ in physical mechanisms, direct fusion faces challenges related to feature scale, noise distribution, spatiotemporal consistency, and semantic representation [19,20]. Existing optical–SAR fusion strategies mainly include pixel-level fusion, feature-level fusion, and decision-level fusion. Pixel-level fusion usually stacks multi-source data at the input layer and is easy to implement, but it requires high registration accuracy and radiometric consistency. Decision-level fusion integrates classification results from different data sources and has strong flexibility, but it is difficult to model deep cross-modal feature relationships. Feature-level fusion extracts optical and SAR features separately or jointly within the model and represents their complementarity in feature space, making it more suitable for paddy rice extraction in complex agricultural scenes.
In crop recognition and paddy rice mapping, Sentinel-1 and Sentinel-2 fusion has become an important research direction. Van Tricht et al. used Sentinel-1 radar imagery and Sentinel-2 optical imagery for crop mapping and demonstrated that the synergistic use of the two data sources improves crop type identification [21]. Orynbaikyzy et al. further analyzed the effects of feature selection, optical data availability, and parcel size on Sentinel-1/Sentinel-2 fusion classification accuracy, indicating that SAR data can provide stable supplementary information when optical observations are insufficient [22]. Adrian et al. input Sentinel-1 SAR and Sentinel-2 optical time series into a deep learning model for crop type mapping and showed that multi-temporal SAR–optical fusion significantly improves classification accuracy for complex crops [23]. For paddy rice extraction, Xiao et al. proposed a phenology- and object-based dual-source fusion algorithm using Sentinel-1/2 data and achieved high-resolution rice mapping in the Hangjiahu Plain [24]. Xu and Zhang proposed an adaptive stacking algorithm on the Google Earth Engine platform for rice mapping using multi-temporal Sentinel-1/2 images [25]. Gao et al. proposed the FARM framework, which extracts rice phenological samples from Sentinel-1 SAR and combines Sentinel-2 optical imagery with multiple random forest classifiers for automated rice mapping [26]. Zhao et al. proposed the Rice-Sentinel method, which integrates the V-shaped temporal pattern of Sentinel-1 VH backscatter with Sentinel-2 optical indices to identify flooding and transplanting signals, thereby improving the adaptability of cross-regional rice mapping [27]. These studies show that optical–SAR fusion can effectively alleviate the instability of single-source data and improve the accuracy and robustness of paddy rice extraction.
Although existing Sentinel-1/Sentinel-2 fusion studies have achieved good results, most methods still rely on manually constructed features, phenological rules, random forests, support vector machines, or simple deep networks. Their fusion strategies are mainly feature stacking, index combination, or classifier ensemble. For example, Saadat et al. constructed a convolutional neural network using Sentinel-1/Sentinel-2 time-series data for rice mapping [28]. Onojeghuo et al. developed a Deep ResU-Net based on Sentinel-1 SAR and Sentinel-2 optical imagery for smallholder paddy rice segmentation [29]. Huang et al. integrated Sentinel-1/2 data in rice–wetland coexistence zones and analyzed phenological differences between paddy rice and wetlands to reduce confusion [30]. Fikriyah et al. used Sentinel-1, Sentinel-2, and their combination for ratoon rice mapping, further demonstrating the complementary value of dual-source data under complex cropping systems [31]. However, these methods usually focus more on temporal features or classifier design and pay insufficient attention to the interaction mechanism between optical and SAR features in deep semantic space. As a result, it remains difficult to fully distinguish paddy rice from dryland crops, wetlands, water bodies, built-up land, and other similar or mixed land-cover types.
In recent years, deep learning methods for optical–SAR fusion have gradually shifted from simple input stacking to cross-modal feature interaction. Schmitt et al. constructed the SEN1-2 dataset, providing a basic data resource for deep SAR-optical fusion research [32]. Subsequent multimodal remote sensing studies further showed that designing specialized feature fusion structures for heterogeneous data can improve semantic segmentation and land-cover recognition performance. Wu et al. proposed CroFuseNet, which uses a dual-branch structure to separately extract optical and SAR features and enhances complementary dual-modal representation through a cross-fusion mechanism, achieving good performance in urban impervious surface extraction [33]. However, urban impervious surface extraction differs substantially from paddy rice mapping in target properties, spatial morphology, and confusion types. Paddy rice extraction requires not only the use of vegetation spectral and texture information from optical imagery, but also the integration of SAR responses to flooding, transplanting, vegetation structure, and surface roughness. Meanwhile, fragmented field boundaries, small parcel sizes, adjacent dryland crops, and mixed wetlands place higher demands on cross-modal feature selection and boundary delineation.
To address these task-specific challenges, this study proposes ACBE-CroFuseNet for Sentinel-1/Sentinel-2 paddy rice extraction. Compared with CroFuseNet and similar optical–SAR fusion networks, the contribution of this study is not limited to adopting a dual-branch fusion framework. The first key contribution is the proposed attention cross-fusion module, which combines modality attention and spatial attention to adaptively select useful optical and SAR information at different feature scales, thereby reducing redundancy and modality interference. The second key contribution is the boundary enhancement module, which introduces boundary feature learning and boundary supervision into the decoder to improve the delineation of fragmented paddy field edges. In addition, multimodal feature aggregation is used to integrate shared fusion features with modality-specific optical and SAR features. These task-oriented designs make the proposed model more suitable for paddy rice extraction in cloudy, rainy, and complex agricultural regions.

2. Study Area and Dataset

2.1. Study Area

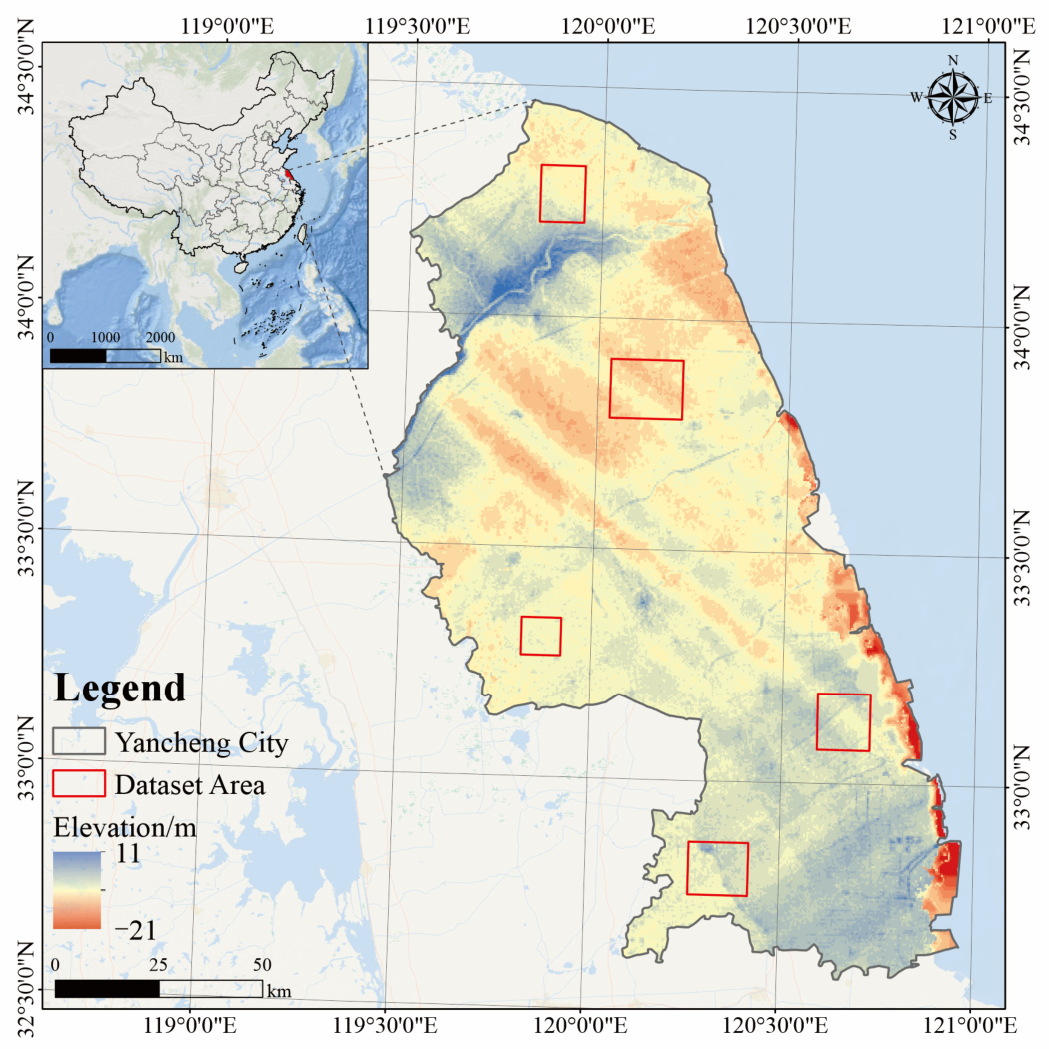
Yancheng was selected as the study area. As shown in Figure 1, Yancheng is located on the eastern coast of Jiangsu Province beside the Yellow Sea and lies in the northern wing of the Yangtze River Delta. It has a total area of approximately 1.69 × 10⁴ km2 and is the largest prefecture-level city in Jiangsu Province by area. The region has flat terrain, a dense river network, approximately 778,200 hm2 of cultivated land, and a coastline of approximately 582 km. It has typical characteristics of a composite landscape of plain agriculture and coastal wetlands.
Paddy rice fields in Yancheng are interlaced with dry land, built-up land, water bodies, tidal flat wetlands, and other vegetation types. The land-cover types are complex, making the region suitable for testing the recognition capability of paddy rice extraction models in complex agricultural landscapes. At the same time, clouds and fog in coastal areas, humid backgrounds, and dense water networks can easily affect the quality of optical imagery, while SAR imagery can provide all-time and all-weather backscattering information. Therefore, selecting Yancheng for paddy rice extraction using Sentinel-1 and Sentinel-2 fusion has good regional representativeness and application value.

2.2. Dataset

This study uses Sentinel-1 SAR imagery and Sentinel-2 optical imagery covering Yancheng from August to October 2025 as data sources to construct a paddy rice extraction dataset. This period corresponds to the middle and late growth stages of paddy rice, during which the rice canopy is relatively well developed and field boundaries and vegetation features are relatively obvious. This is beneficial for the identification of paddy rice planting areas. The main characteristics of the two types of data are shown in Table 1.
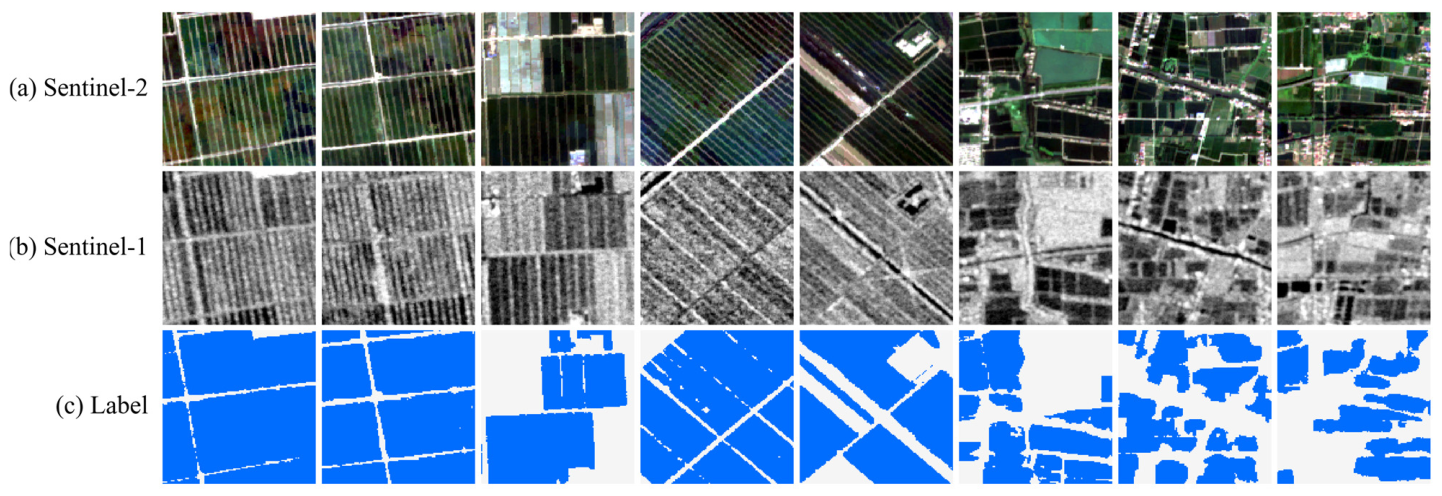
The image screening and preprocessing were completed on the Google Earth Engine, abbreviated as GEE, platform. The preprocessing process included cloud masking, radiometric correction, terrain correction, resampling, registration, and normalization. To reduce the influence of clouds, fog, abnormal observations, and SAR speckle noise in individual images on model training, this study performed median compositing on multi-temporal Sentinel-1 and Sentinel-2 images from August to October 2025 and obtained stable optical–SAR imagery covering the study area. Paddy rice labels were produced by manual visual interpretation. By combining optical imagery, SAR imagery, and high-resolution imagery for assisted interpretation, paddy rice planting areas were labeled as 1 and non-paddy rice areas were labeled as 0. After labeling, field boundaries, water bodies, built-up land, other vegetation, and other easily confused regions were checked and corrected to improve label accuracy. Examples of the dataset are shown in Figure 2.
Finally, a sliding window method was used to synchronously crop the registered optical imagery, SAR imagery, and label imagery, generating 5408 sample patches with a size of 128 × 128 pixels. Each sample includes a four-channel Sentinel-2 optical image, a two-channel Sentinel-1 SAR image with VV and VH polarizations, and the corresponding binary paddy rice label. The same file name was used for matching to ensure that the optical image, SAR image, and label corresponded exactly in spatial position. Since this study performs pixel-level semantic segmentation, the dataset composition was counted at the pixel level. Among all labeled pixels, paddy rice pixels accounted for 39.7%, corresponding to approximately 35.18 million pixels, while non-paddy rice pixels accounted for 60.3%, corresponding to approximately 53.43 million pixels. This indicates that the dataset has a certain class imbalance, but both categories contain sufficient samples for model training and evaluation. The non-paddy rice class includes dryland crops, built-up land, water bodies, coastal wetlands, bare land or tidal flats, and other vegetation types. During sample generation, patches from different land-cover backgrounds and paddy rice planting patterns were retained to improve the representativeness of the dataset and reduce sampling bias. For model evaluation, the dataset was randomly partitioned into five mutually exclusive folds. In each run, four folds were used for model training and the remaining fold was used for validation and accuracy evaluation. The final performance was reported as the mean and standard deviation across the five folds.

3. Method

3.1. Overall Method

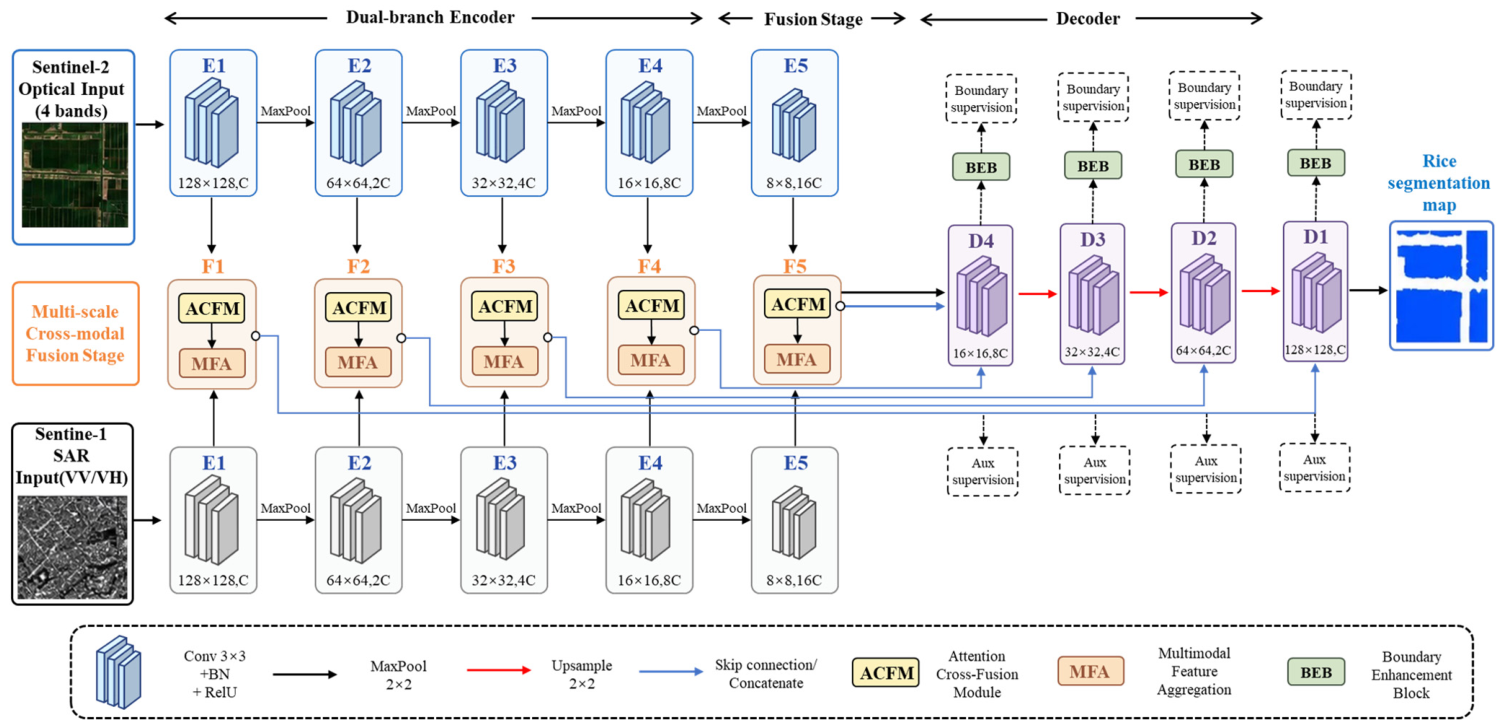
Considering that single optical imagery is easily affected by clouds, shadows, and spectral confusion, while single SAR imagery suffers from speckle noise and insufficient representation of spatial details, this study constructs ACBE-CroFuseNet for optical–SAR paddy rice extraction. As shown in Figure 3, the model retains the advantage of dual-branch feature extraction, but its main difference from existing optical–SAR fusion networks lies in two task-oriented modules: the attention cross-fusion module and the boundary enhancement module. The attention cross-fusion module adaptively learns the relative contribution and spatial response of optical and SAR features, enabling the network to select more useful information for paddy rice recognition instead of relying on fixed feature concatenation. The boundary enhancement module explicitly learns paddy field edge features and introduces boundary supervision, which is designed to reduce omission and commission errors in fragmented fields and mixed agricultural landscapes.
The overall model adopts an encoder–decoder structure. The input data include a four-channel Sentinel-2 optical image and a two-channel Sentinel-1 SAR image, and the image patch size is 128 × 128. The optical branch and SAR branch are each composed of a five-level convolutional encoding structure. Each level includes convolution, batch normalization, and ReLU activation operations. Downsampling is used to gradually enlarge the receptive field and extract high-level semantic information. For the i-th scale, the features extracted by the optical branch and SAR branch are expressed as follows.
F i o p t = E i o p t ( X o p t )
F i s a r = E i s a r ( X s a r )
where F i o p t denotes the optical feature at the i-th scale, F i s a r denotes the SAR feature at the i-th scale, X o p t denotes the Sentinel-2 optical input image, X s a r denotes the Sentinel-1 SAR input image, E i o p t (   ) denotes the i-th optical encoder stage, E i s a r (   ) denotes the i-th SAR encoder stage, and i denotes the feature scale level in the network.
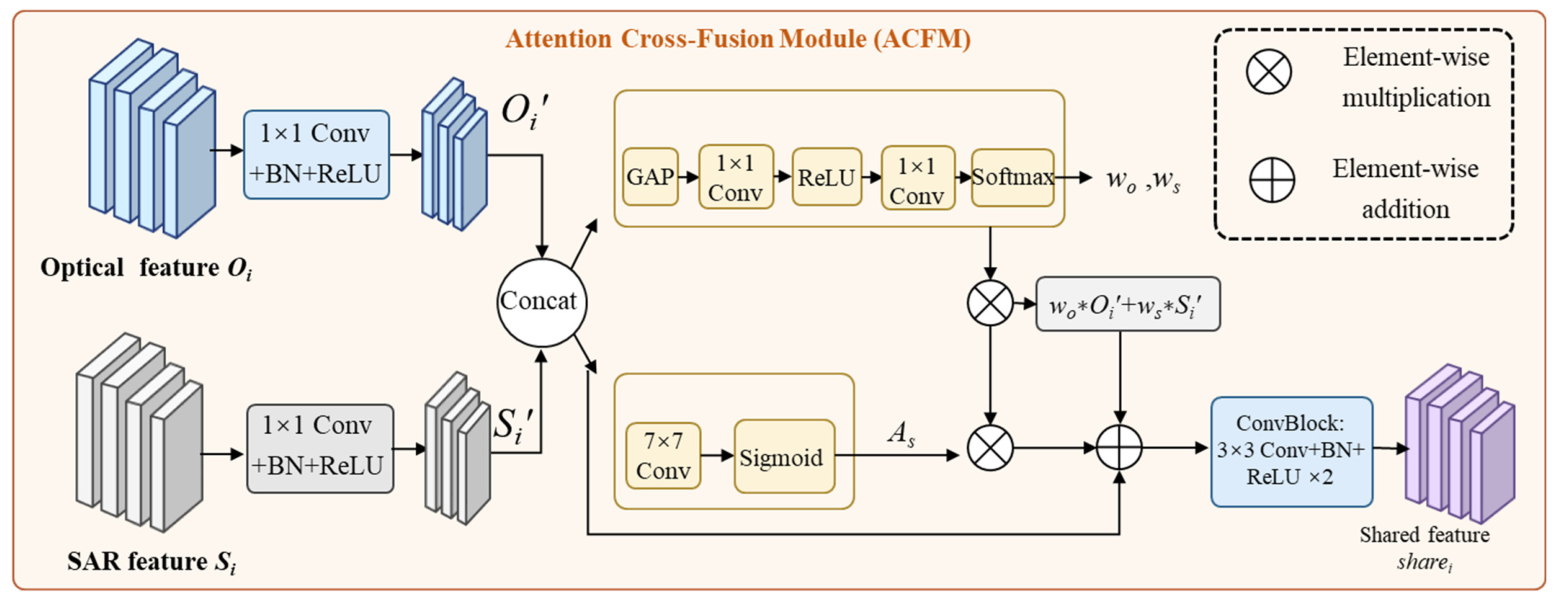
In the encoding stage, this study designs an attention cross-fusion module, abbreviated as ACFM, to adaptively fuse same-scale optical features and SAR features and obtain shared fusion features.
F i s h a r e = A C F M ( F i o p t , F i s a r )
where F i s h a r e denotes the shared fusion feature jointly generated from optical and SAR features at the i-th scale, ACFM denotes the attention cross-fusion module, F i o p t denotes the optical input feature of this module, and F i s a r denotes the SAR input feature of this module.
In the decoding stage, the model uses skip connections to preserve shallow spatial details and further integrates shared features, optical-specific features, and SAR-specific features through the multimodal feature aggregation module, abbreviated as MFA.
F i f u s e = M F A ( F i s h a r e , F i o p t , F i s a r )
where F i f u s e denotes the aggregated multimodal fusion feature at the i-th scale, MFA denotes the multimodal feature aggregation module, F i s h a r e denotes the shared fusion feature, F i o p t denotes the optical-specific feature, and F i s a r denotes the SAR-specific feature.
To enhance the boundary representation capability of paddy fields [34], this study introduces a boundary enhancement branch in the decoding stage and applies boundary supervision to decoding features at different scales. This design makes the model pay more attention to edge differences between paddy fields and other croplands, water bodies, built-up land, and wetlands. Finally, the model outputs a one-channel paddy rice probability map, and threshold segmentation is used to obtain the binary classification result of paddy rice and non-paddy rice.

3.2. Optical and SAR-Specific Feature Extraction Module

To fully preserve the exclusive features and complementary advantages of the two types of remote sensing data, this study abandons the early fusion strategy of simple channel stacking and constructs independent optical and SAR dual-branch feature extraction structures to realize differentiated learning of dual-modal features. Each feature extraction branch adopts a U-Net encoder structure. The basic convolutional unit is composed of two consecutive 3 × 3 convolutional layers, batch normalization layers, and ReLU activation functions, which are used to enhance local spatial texture and semantic representation capability. The downsampling module reduces the spatial resolution of feature maps through max pooling while increasing the number of channels, allowing the network to gradually move from local texture to high-level semantic features.
The optical branch mainly learns the spectral responses and texture distribution features of paddy rice in different bands, which helps distinguish paddy rice, other vegetation, and bare land. The SAR branch mainly learns differences in paddy field moisture, vegetation structure, and backscattering, which helps provide supplementary information when optical imagery is affected by clouds, fog, shadows, or spectrally similar objects. By retaining two independent branches, the model can avoid information interference caused by direct mixing of different modalities at the input stage and provide a more stable feature basis for subsequent cross-fusion.

3.3. Attention Cross-Fusion Module

To fully model the complementary relationship between optical features and SAR features, this study introduces an attention cross-fusion module at each encoding scale. The objective of this module is to adaptively determine the fusion weights of optical features and SAR features according to the contributions of different modalities at different spatial locations and semantic levels, thereby improving the model’s ability to recognize paddy rice regions in complex agricultural scenes. The algorithm flowchart is shown in Figure 4.
For optical features and SAR features at the same scale, a 1 × 1 convolution is first used for feature mapping so that the two modal features have consistent channel representations. Then, the two types of features are concatenated along the channel dimension, and modality attention weights are generated through global average pooling and convolutional mapping.
W i = S o f t m a x ( M A ( [ F ^ i o p t , F ^ i s a r ] ) )
where W i denotes the modality attention weight at the i-th scale, Softmax denotes the normalization function used to make the sum of the optical weight and SAR weight equal to 1, MA denotes the modality attention calculation function composed of global average pooling and convolutional mapping, and [ F ^ i o p t , F ^ i s a r ] denotes the concatenation of the mapped optical feature and mapped SAR feature along the channel dimension.
W i can be further expressed as follows.
W i = { w i o p t , w i s a r }
where w i o p t denotes the weight of the optical feature at the i-th scale, and w i s a r denotes the weight of the SAR feature at the i-th scale.
Through these weights, the model can automatically determine which modality contributes more to paddy rice extraction for the current sample and current scale. The weighted fusion process is expressed as follows.
F i m = w i o p t F ^ i o p t + w i s a r F ^ i s a r
where F i m denotes the fusion feature after modality attention weighting, F ^ i o p t denotes the mapped optical feature, and F ^ i s a r denotes the mapped SAR feature.
Considering that paddy fields have obvious spatial continuity and boundary morphology, this study further introduces spatial attention. A spatial weight map is generated from the concatenated cross-modal feature to highlight paddy rice related regions and suppress background noise.
S i = σ ( C o n v 7 × 7 ( [ F ^ i o p t , F ^ i s a r ] ) )
where S i denotes the spatial attention weight map at the i-th scale, σ (   ) denotes the sigmoid activation function used to map spatial weights into the range from 0 to 1, C o n v 7 × 7 (   ) denotes a convolution operation with a 7 × 7 kernel, and [ F ^ i o p t , F ^ i s a r ] denotes the channel concatenation result of the mapped optical feature and mapped SAR feature.
The final cross-fusion feature is expressed as follows.
F i s h a r e = R ( F i m S i + F i m )
where F i s h a r e denotes the shared fusion feature at the i-th scale, R( ) denotes the feature refinement unit composed of convolution, batch normalization, and ReLU activation, F i m denotes the fusion feature after modality attention weighting, S i denotes the spatial attention weight map, and denotes element-wise multiplication.

3.4. Multimodal Feature Aggregation

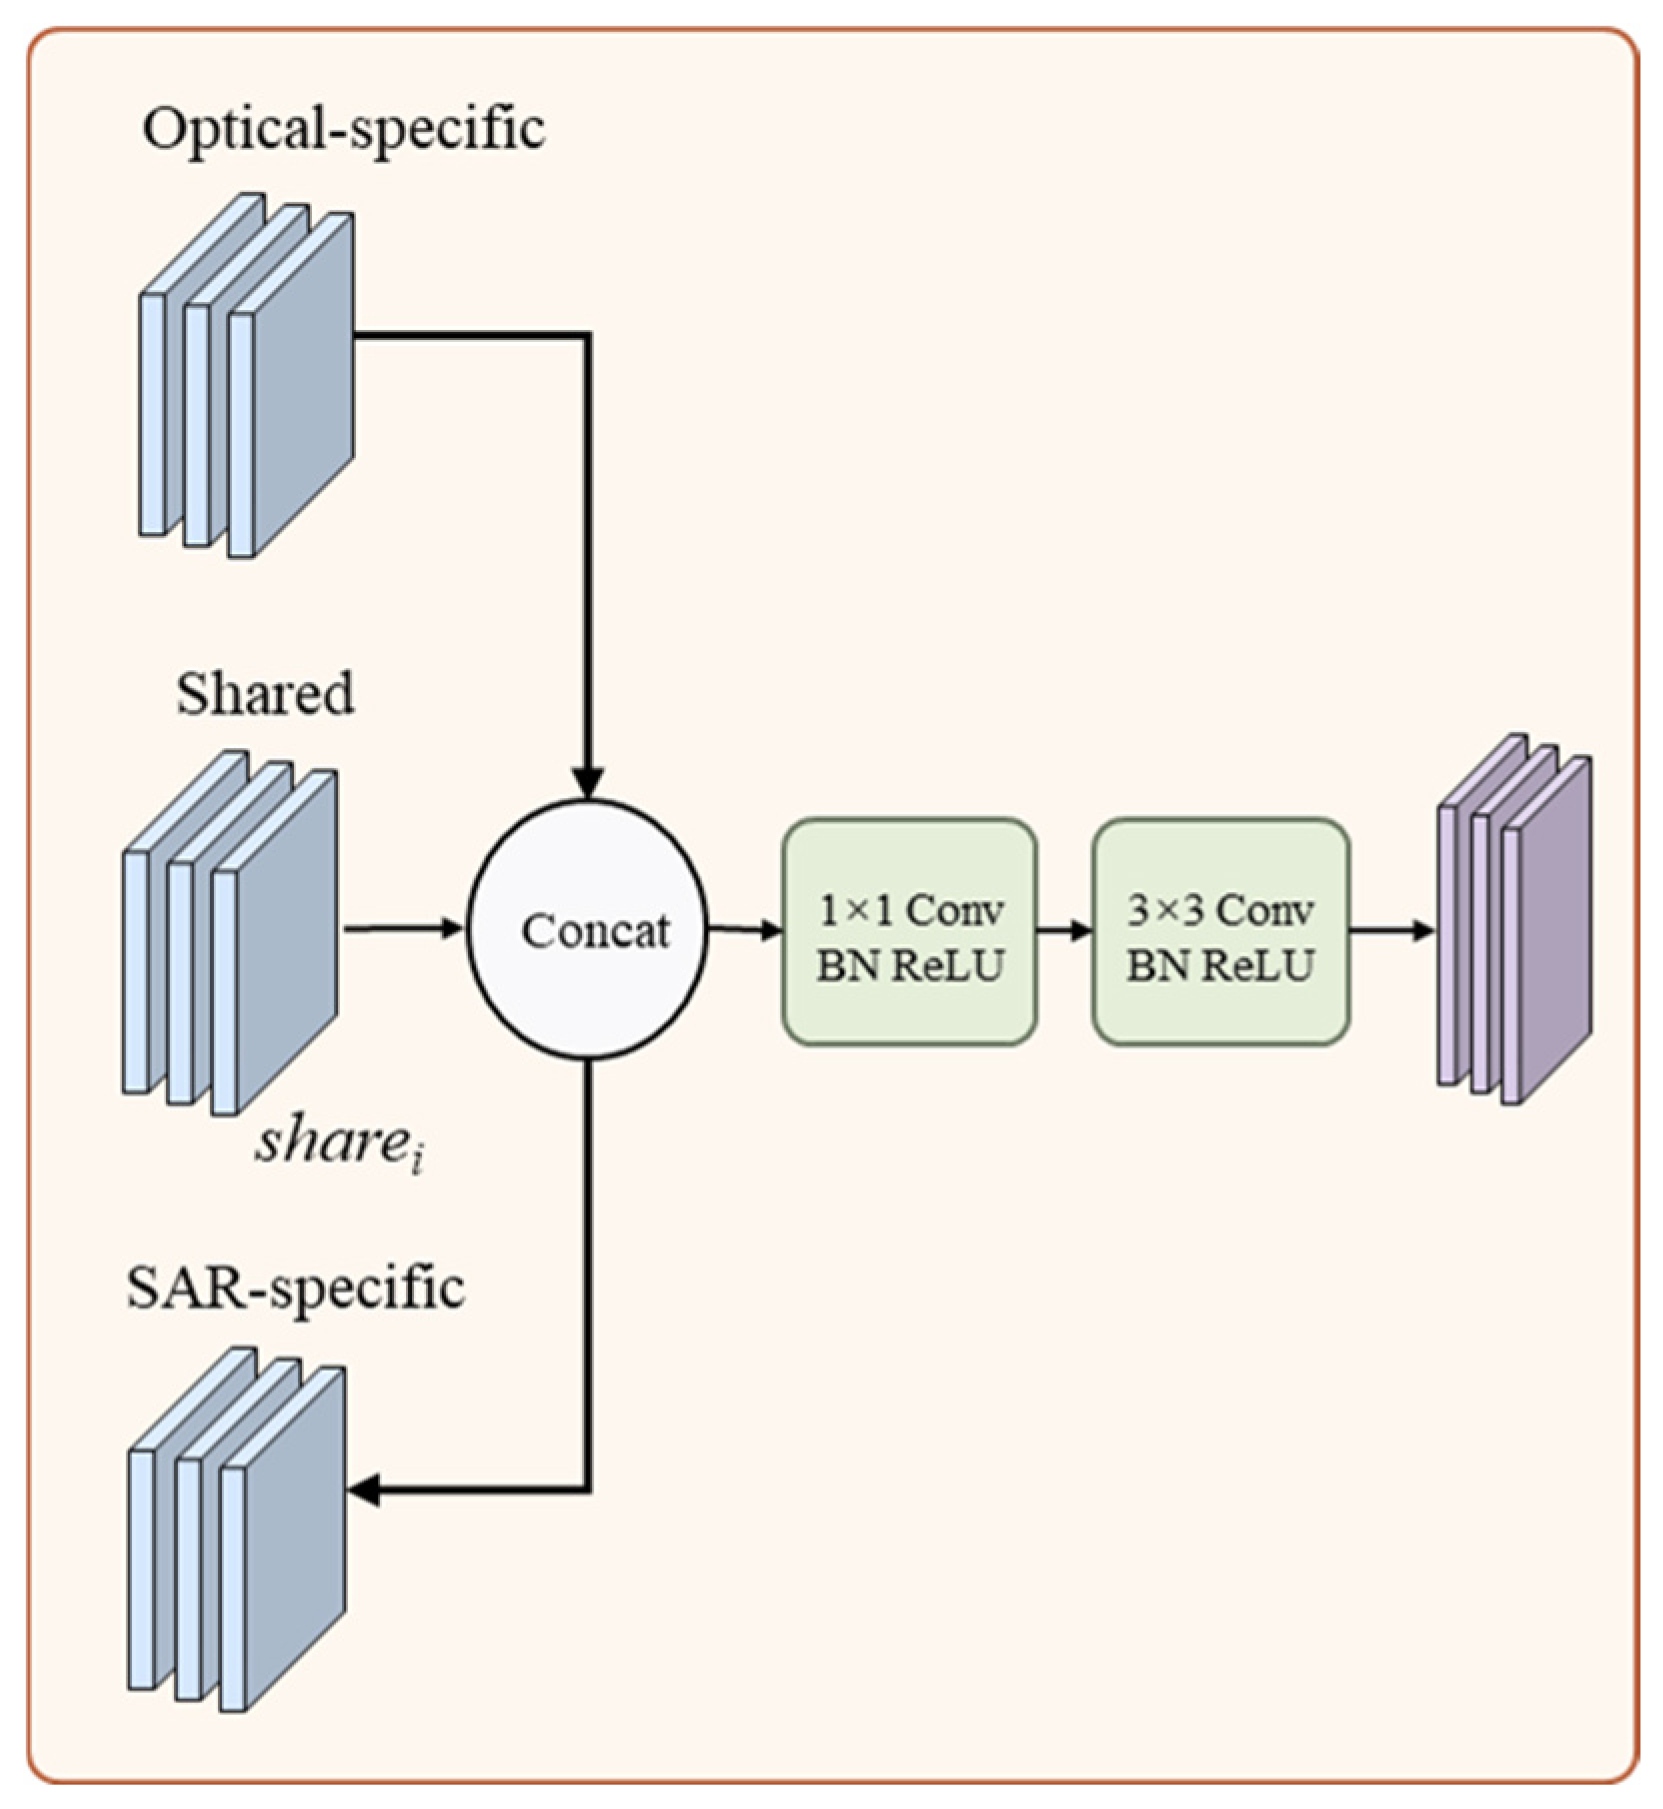
The shared fusion features obtained in the encoding stage can express complementary information between optical and SAR imagery, but the specific information in the optical branch and SAR branch is still valuable. For example, optical features are sensitive to spectral differences between paddy rice and other vegetation, while SAR features are more sensitive to moisture and structural information in paddy fields. To avoid weakening specific information during fusion, this study designs a multimodal feature aggregation module in the decoding stage. The structure of the multimodal feature aggregation module is shown in Figure 5.
For the i-th scale, the multimodal feature aggregation module concatenates the shared fusion feature, the optical-specific feature, and the SAR-specific feature along the channel dimension.
F i c a t = C o n c a t ( F i s h a r e , F i o p t , F i s a r )
where F i c a t denotes the concatenated multimodal feature at the i-th scale, Concat( ) denotes feature concatenation along the channel dimension, F i s h a r e denotes the shared fusion feature, F i o p t denotes the optical-specific feature, and F i s a r denotes the SAR-specific feature.
Then, a 1 × 1 convolution is used to compress the concatenated multimodal feature in the channel dimension to reduce redundant information. A 3 × 3 convolution is then used to further extract local spatial features and refine the fusion result. This process can be expressed as follows.
F ~ i = R e L U B N C o n v 1 × 1 ( F i c a t )
F i f u s e = R e L U B N C o n v 3 × 3 ( F ~ i )
where F ~ i denotes the intermediate feature after 1 × 1 convolutional compression, F i f u s e denotes the final multimodal fusion feature, ReLU( ) denotes the rectified linear unit activation function, BN( ) denotes batch normalization, C o n v 1 × 1 (   ) denotes a convolution operation with a 1 × 1 kernel used to adjust the number of channels and reduce redundancy, C o n v 3 × 3 (   ) denotes a convolution operation with a 3 × 3 kernel used to further extract local spatial features, and F i c a t denotes the concatenated multimodal feature.
This process not only preserves shared semantic information but also supplements the specific expressions of optical and SAR data.

3.5. Boundary Enhancement and Deep Supervision Module

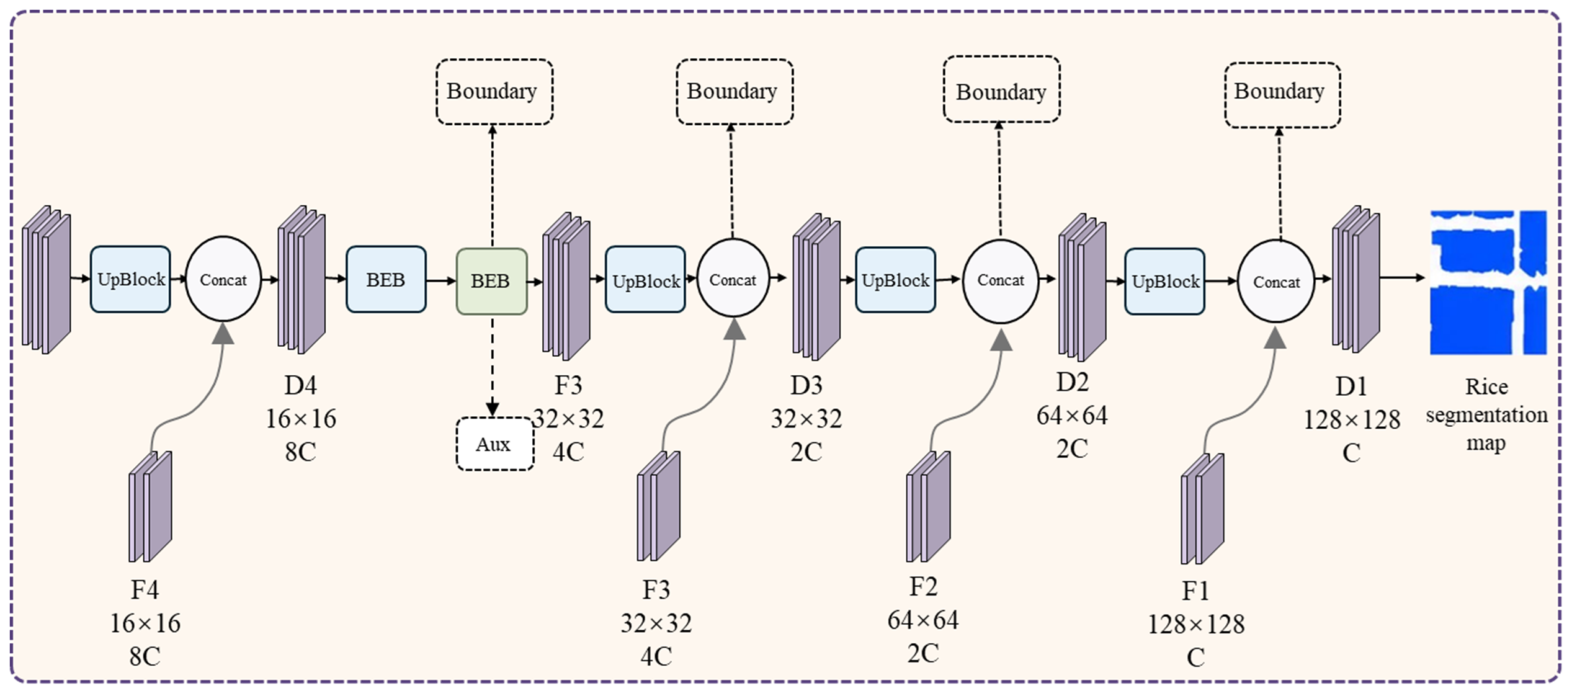
The decoder uses transposed convolution to progressively upsample deep semantic features to the original image size and combines skip connections to introduce shallow detail information. In this way, the integrity of the overall distribution of paddy rice regions can be maintained, and the recognition of field edges, narrow ridges, and fragmented small patches can also be improved. The flowchart is shown in Figure 6.
To enhance the model’s perception of paddy rice boundaries, this study introduces a boundary enhancement module in the decoding stage. The module first applies convolutional transformation to decoding features to extract boundary-related features and then generates a boundary prediction map through a 1 × 1 convolution.
B i = C o n v 1 × 1 ( G i ( D i ) )
where B i denotes the predicted boundary map at the i-th scale, C o n v 1 × 1 (   ) denotes a convolution operation with a 1 × 1 kernel used to map boundary features into a single-channel boundary prediction result, G i (   ) denotes the boundary feature extraction function at the i-th scale, and D i denotes the decoding feature at the i-th scale. G i (   ) is composed of convolution, batch normalization, and ReLU activation.
Then, the boundary features are fused with the original decoding features to enhance the main segmentation branch.
D i e n h = D i + H i ( C o n c a t ( D i , G i ( D i ) ) )
where D i e n h denotes the boundary-enhanced decoding feature, D i denotes the original decoding feature, H i (   ) denotes the feature enhancement mapping function at the i-th scale, and C o n c a t (   ) denotes channel concatenation. The function H i (   ) is composed of 1 × 1 convolution, batch normalization, and ReLU activation. Through this design, the model learns not only semantic features inside paddy rice regions but also explicitly focuses on the edge positions of paddy fields, thereby improving boundary segmentation accuracy.
At the same time, this study adopts a multi-scale deep supervision strategy and sets auxiliary segmentation outputs at different decoding layers. The auxiliary outputs are uniformly upsampled to the original image size and used to calculate losses with the ground-truth labels. Deep supervision can alleviate gradient attenuation during the training of deep networks and promote discriminative ability for paddy rice at different feature scales, enabling the model to maintain stable segmentation performance when paddy rice regions vary greatly in size and field shapes are complex.

3.6. Loss Function

This study treats paddy rice extraction as a binary semantic segmentation task, and the main model output is a paddy rice probability map. To simultaneously improve regional segmentation accuracy, category overlap, and boundary representation capability, this study constructs a comprehensive loss function consisting of main segmentation loss, auxiliary segmentation loss, and boundary loss.
L = L m a i n + λ 1 L a u x + λ 2 L b o u n d a r y
where L denotes the total loss during model training, L m a i n denotes the main segmentation output loss, L a u x denotes the multi-scale auxiliary output loss, L b o u n d a r y denotes the boundary supervision loss, λ 1 denotes the weight coefficient of the auxiliary segmentation loss, and λ 2 denotes the weight coefficient of the boundary loss. According to the training setting in this study, λ 1 = 0.4 and λ 2 = 0.2.
The main segmentation loss and auxiliary segmentation loss both adopt a combination of BCE loss and Dice loss. BCE loss constrains paddy rice and non-paddy rice categories at the pixel level, while Dice loss can alleviate the class imbalance problem and improve the overlap between predicted regions and real paddy rice regions. The segmentation loss is expressed as follows.
L s e g = 0.5 L B C E + 0.5 L D i c e
where L s e g denotes the segmentation loss corresponding to a single segmentation output, L B C E denotes the binary cross-entropy loss, L D i c e denotes the Dice loss, and the two coefficients of 0.5 denote the weights of BCE loss and Dice loss in the segmentation loss.
Dice loss is defined as follows.
L D i c e = 1 2 j = 1 N p j g j + ϵ j = 1 N p j + j = 1 N g j + ϵ
where L D i c e denotes the Dice loss, N denotes the total number of pixels involved in the calculation, p j   denotes the predicted probability that the j-th pixel belongs to the paddy rice class, g j denotes the ground-truth label of the j-th pixel, rice pixels are assigned a value of 1 and non-rice pixels are assigned a value of 0, the numerator represents the intersection between the prediction and the ground-truth label, the denominator represents the total scale of the predicted region and the real region, and ϵ denotes the smoothing term used to prevent the denominator from being zero. According to the training setting in this study, ϵ = 10−6.
The boundary supervision label is generated from the real paddy rice label using the Sobel operator and is used to represent the edge positions of paddy rice regions. BCE loss is used to constrain the predicted boundary result and the boundary label.
L b o u n d a r y = L B C E ( B , G b )
where L b o u n d a r y denotes the boundary supervision loss, L B C E denotes the binary cross-entropy loss function, B denotes the boundary map predicted by the model, and G b denotes the boundary supervision map generated from the real paddy rice label using the Sobel operator. The comprehensive loss function can simultaneously constrain the internal region, overall shape, and boundary details of paddy rice, making the model more suitable for refined paddy rice extraction in complex agricultural landscapes.

4. Experiments

4.1. Experimental Settings

The experiments in this study were conducted using five-fold cross-validation. The 5408 image patches were randomly divided into five mutually exclusive folds; in each round, four folds were used for training and the remaining fold was used for validation and accuracy evaluation. During training, the batch size was set to 8, the number of training epochs was set to 100, the AdamW optimizer was used, the initial learning rate was set to 1 × 10⁻⁴, and the weight decay coefficient was set to 1 × 10⁻⁴. All models used the same training set and validation set to ensure comparability among different methods. In the validation stage, the probability map output by the model was binarized with a threshold of 0.5 to obtain the final paddy rice extraction result.

4.2. Evaluation Metrics

To quantitatively evaluate the paddy rice extraction results, this study used overall accuracy, abbreviated as OA, user’s accuracy, abbreviated as UA, producer’s accuracy, abbreviated as PA, F1-score, and intersection over union, abbreviated as IoU, as evaluation metrics. OA measures the overall classification correctness. UA represents the proportion of pixels predicted as paddy rice that are truly paddy rice, reflecting commission errors. PA represents the proportion of real paddy rice pixels that are correctly identified, reflecting omission errors. F1-score comprehensively considers UA and PA. IoU measures the degree of overlap between the predicted paddy rice region and the real paddy rice region.

5. Results and Discussion

5.1. Comparative Experimental Results

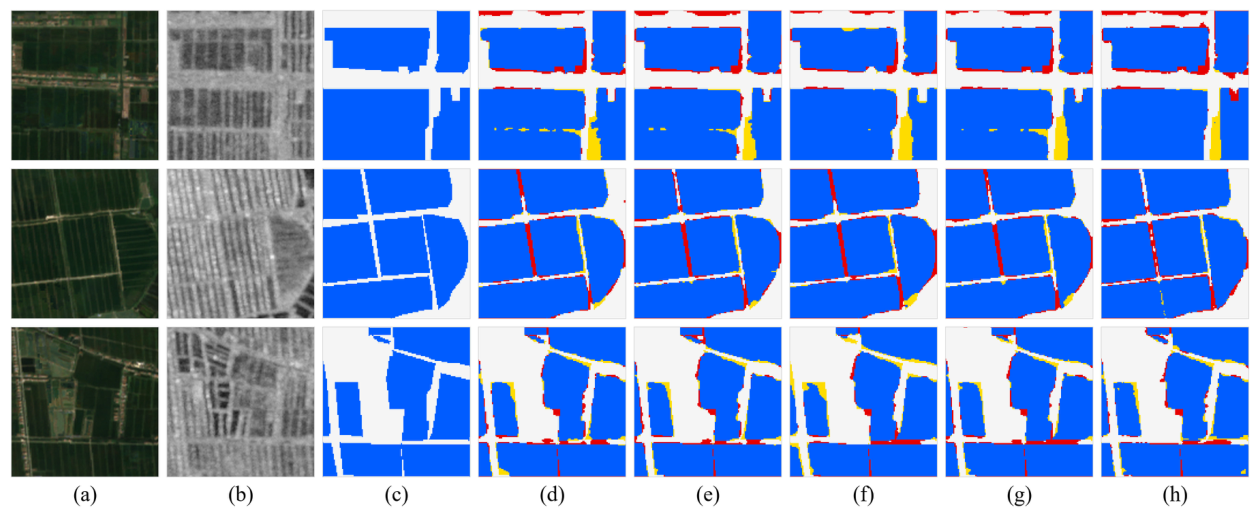
To verify the effectiveness of the proposed method in the paddy rice extraction task, UNet++ [35], Swin-Unet [36], CroFuseNet [33], and CMFFNet [37] were selected as comparative methods and compared with the proposed model. UNet++ and Swin-Unet represent commonly used semantic segmentation baselines, while CroFuseNet and CMFFNet represent optical–SAR fusion models. The final accuracy of each model was reported as the mean and standard deviation of the five validation folds. In this expression, the mean represents the average performance across the five folds, while the standard deviation reflects the variation in model performance among different folds. The quantitative evaluation results are reported as mean +/− standard deviation across the five folds in Table 2, and the local paddy rice extraction results of different methods are compared in Figure 7.
As shown in Table 2 and Figure 7, different models show clear performance differences in the paddy rice extraction task. The two general semantic segmentation baselines, UNet++ and Swin-Unet, obtained relatively lower mean IoU values of 0.856 and 0.859, respectively, indicating that direct feature encoding is insufficient for fully exploiting optical–SAR complementarity. The optical–SAR fusion models CroFuseNet and CMFFNet achieved higher mean IoU values of 0.865 and 0.862, respectively, showing that explicit multimodal fusion is beneficial for paddy rice extraction. However, the proposed ACBE-CroFuseNet achieved the highest mean values for all metrics, with OA, UA, PA, F1-score, and IoU reaching 0.935, 0.928, 0.939, 0.933, and 0.868, respectively. The standard deviations across the five folds were also small, indicating that the proposed method has stable performance under different data partitions. Compared with CroFuseNet and CMFFNet, the advantage of ACBE-CroFuseNet is mainly reflected in its task-oriented optical–SAR interaction and boundary refinement strategy. The dual-branch structure separately preserves optical spectral–textural features and SAR scattering–structural features, while the cross-fusion and multimodal aggregation modules enhance complementary information and reduce modality interference. In addition, the boundary enhancement mechanism improves the delineation of fragmented paddy fields and field edges. These results demonstrate that the proposed method can more effectively use multimodal information and achieve more reliable paddy rice segmentation in complex agricultural scenes.

5.2. Ablation Experimental Results

To further verify the effectiveness of each component in the proposed model, ablation experiments were designed to progressively analyze different input modalities and key modules. The experiments set different combinations, including single optical input, single SAR input, the addition of the boundary enhancement module, the introduction of the optical and SAR cross-fusion module, and the addition of the multimodal feature aggregation module. All ablation experiments used the same five-fold cross-validation partitioning and training parameters. The experimental results are shown in Table 3.
According to the five-fold mean values in Table 3, different input modalities and module combinations have an obvious influence on paddy rice extraction accuracy, and the small standard deviations indicate that the ablation results are relatively stable across different data partitions. The overall performance of the single optical encoder–decoder model is better than that of the single SAR encoder–decoder model, indicating that spectral information in optical imagery has stronger discriminative ability for paddy rice recognition during the middle and late growth stages. Optical features can better capture canopy reflectance, vegetation texture, and differences between paddy rice and non-vegetated surfaces. In contrast, the metrics of the single SAR model are relatively low, suggesting that relying only on backscattering and texture information is insufficient for distinguishing paddy rice from wetlands, water bodies, and other croplands. This is mainly because SAR responses are affected by surface roughness, moisture conditions, and speckle noise, which may produce similar scattering patterns among different land-cover types.
After the boundary enhancement module is added to the single-modality models, the accuracy of both optical-only and SAR-only models improves to a certain extent, and the improvement is more obvious for the SAR-based model. This indicates that boundary enhancement can guide the decoder to pay more attention to field edges and fragmented parcel structures. In practical prediction results, this module helps reduce boundary blurring, suppress local false extraction along roads, water edges, and field ridges, and improve the continuity of paddy rice patches. The larger improvement in the SAR-based model suggests that boundary supervision can partly compensate for the weak spatial detail representation caused by speckle noise and complex scattering responses. However, because the information contained in a single-modality input is still limited, boundary constraints alone cannot fully solve the confusion between paddy rice and similar land-cover types.
When optical and SAR cross-fusion is introduced, the model accuracy improves significantly compared with single-modality methods, confirming the complementarity between Sentinel-2 optical imagery and Sentinel-1 SAR imagery in paddy rice extraction. The cross-fusion module changes the prediction process by allowing optical and SAR features to interact at the feature level rather than being used independently or simply stacked at the input layer. Optical features provide spectral and vegetation information, while SAR features provide structural and moisture-related information. Through cross-modal interaction, the model can enhance reliable paddy rice features when the two modalities are consistent and reduce uncertainty when one modality is affected by clouds, spectral similarity, speckle noise, or local background interference. Therefore, cross-fusion improves the model’s ability to distinguish paddy rice from dryland crops, wetlands, water bodies, and other vegetation.
After the multimodal feature aggregation module is further added, model performance continues to improve, indicating that cross-fusion alone is not sufficient to fully use multi-source features. The shared fusion features generated by cross-fusion mainly represent complementary information between optical and SAR imagery, while modality-specific features still contain useful information for rice recognition. The multimodal feature aggregation module integrates shared fusion features with optical-specific and SAR-specific features, which helps preserve the spectral advantages of optical imagery and the structural scattering information of SAR imagery at the same time. This mechanism can improve the completeness of paddy rice extraction, especially in areas with fragmented fields, mixed crops, or complex backgrounds.
Finally, under the combined effect of optical–SAR cross-fusion, multimodal feature aggregation, and boundary enhancement, the model achieves the best results. These modules play different but complementary roles: the cross-fusion module strengthens feature interaction between the two modalities, the multimodal feature aggregation module improves the utilization of shared and modality-specific information, and the boundary enhancement module refines the spatial details of paddy field edges. Together, they allow the model to improve internal region recognition, reduce confusion with similar land-cover types, and produce more complete and stable paddy rice segmentation results in complex agricultural landscapes.

5.3. Model Complexity and Efficiency Analysis

To further evaluate the practicality of the proposed method for large-scale paddy rice mapping, model complexity and computational efficiency were analyzed. All models were evaluated under the same input setting, namely a 128 × 128 image patch containing four Sentinel-2 optical channels and two Sentinel-1 SAR channels. The batch size was set to 8, and the hardware platform was an NVIDIA GeForce RTX 3090 GPU. FLOPs were calculated for a single 128 × 128 patch, with one multiply–add operation counted as two floating-point operations. Training time denotes the estimated time required for 100 epochs in one fold. For UNet++, Swin-Unet, and the proposed ACBE-CroFuseNet, the parameter numbers and FLOPs were obtained from the corresponding implemented network structures. For CroFuseNet and CMFFNet, the values were estimated according to their publicly reported architectural designs and reproduced under the same input size and channel setting. The results are shown in Table 4.
As shown in Table 4, the proposed ACBE-CroFuseNet has a larger number of parameters than the general single-stream baselines because it uses dual encoders, attention cross-fusion modules, multimodal feature aggregation, and boundary enhancement blocks. However, its computational cost remains within an acceptable range. The FLOPs of ACBE-CroFuseNet are close to those of UNet++, and the peak training GPU memory consumption is only 2.75 GB under a batch size of 8. The average inference time is approximately 2.15 ms for one 128 × 128 patch, indicating that the model can still support block-wise large-area paddy rice mapping. Compared with CroFuseNet and CMFFNet, the proposed method introduces only a moderate increase in computational cost while achieving higher segmentation accuracy. This suggests that the added attention-based cross-modal interaction and boundary refinement modules provide a favorable trade-off between extraction accuracy and computational efficiency.

5.4. Paddy Rice Prediction in Yancheng

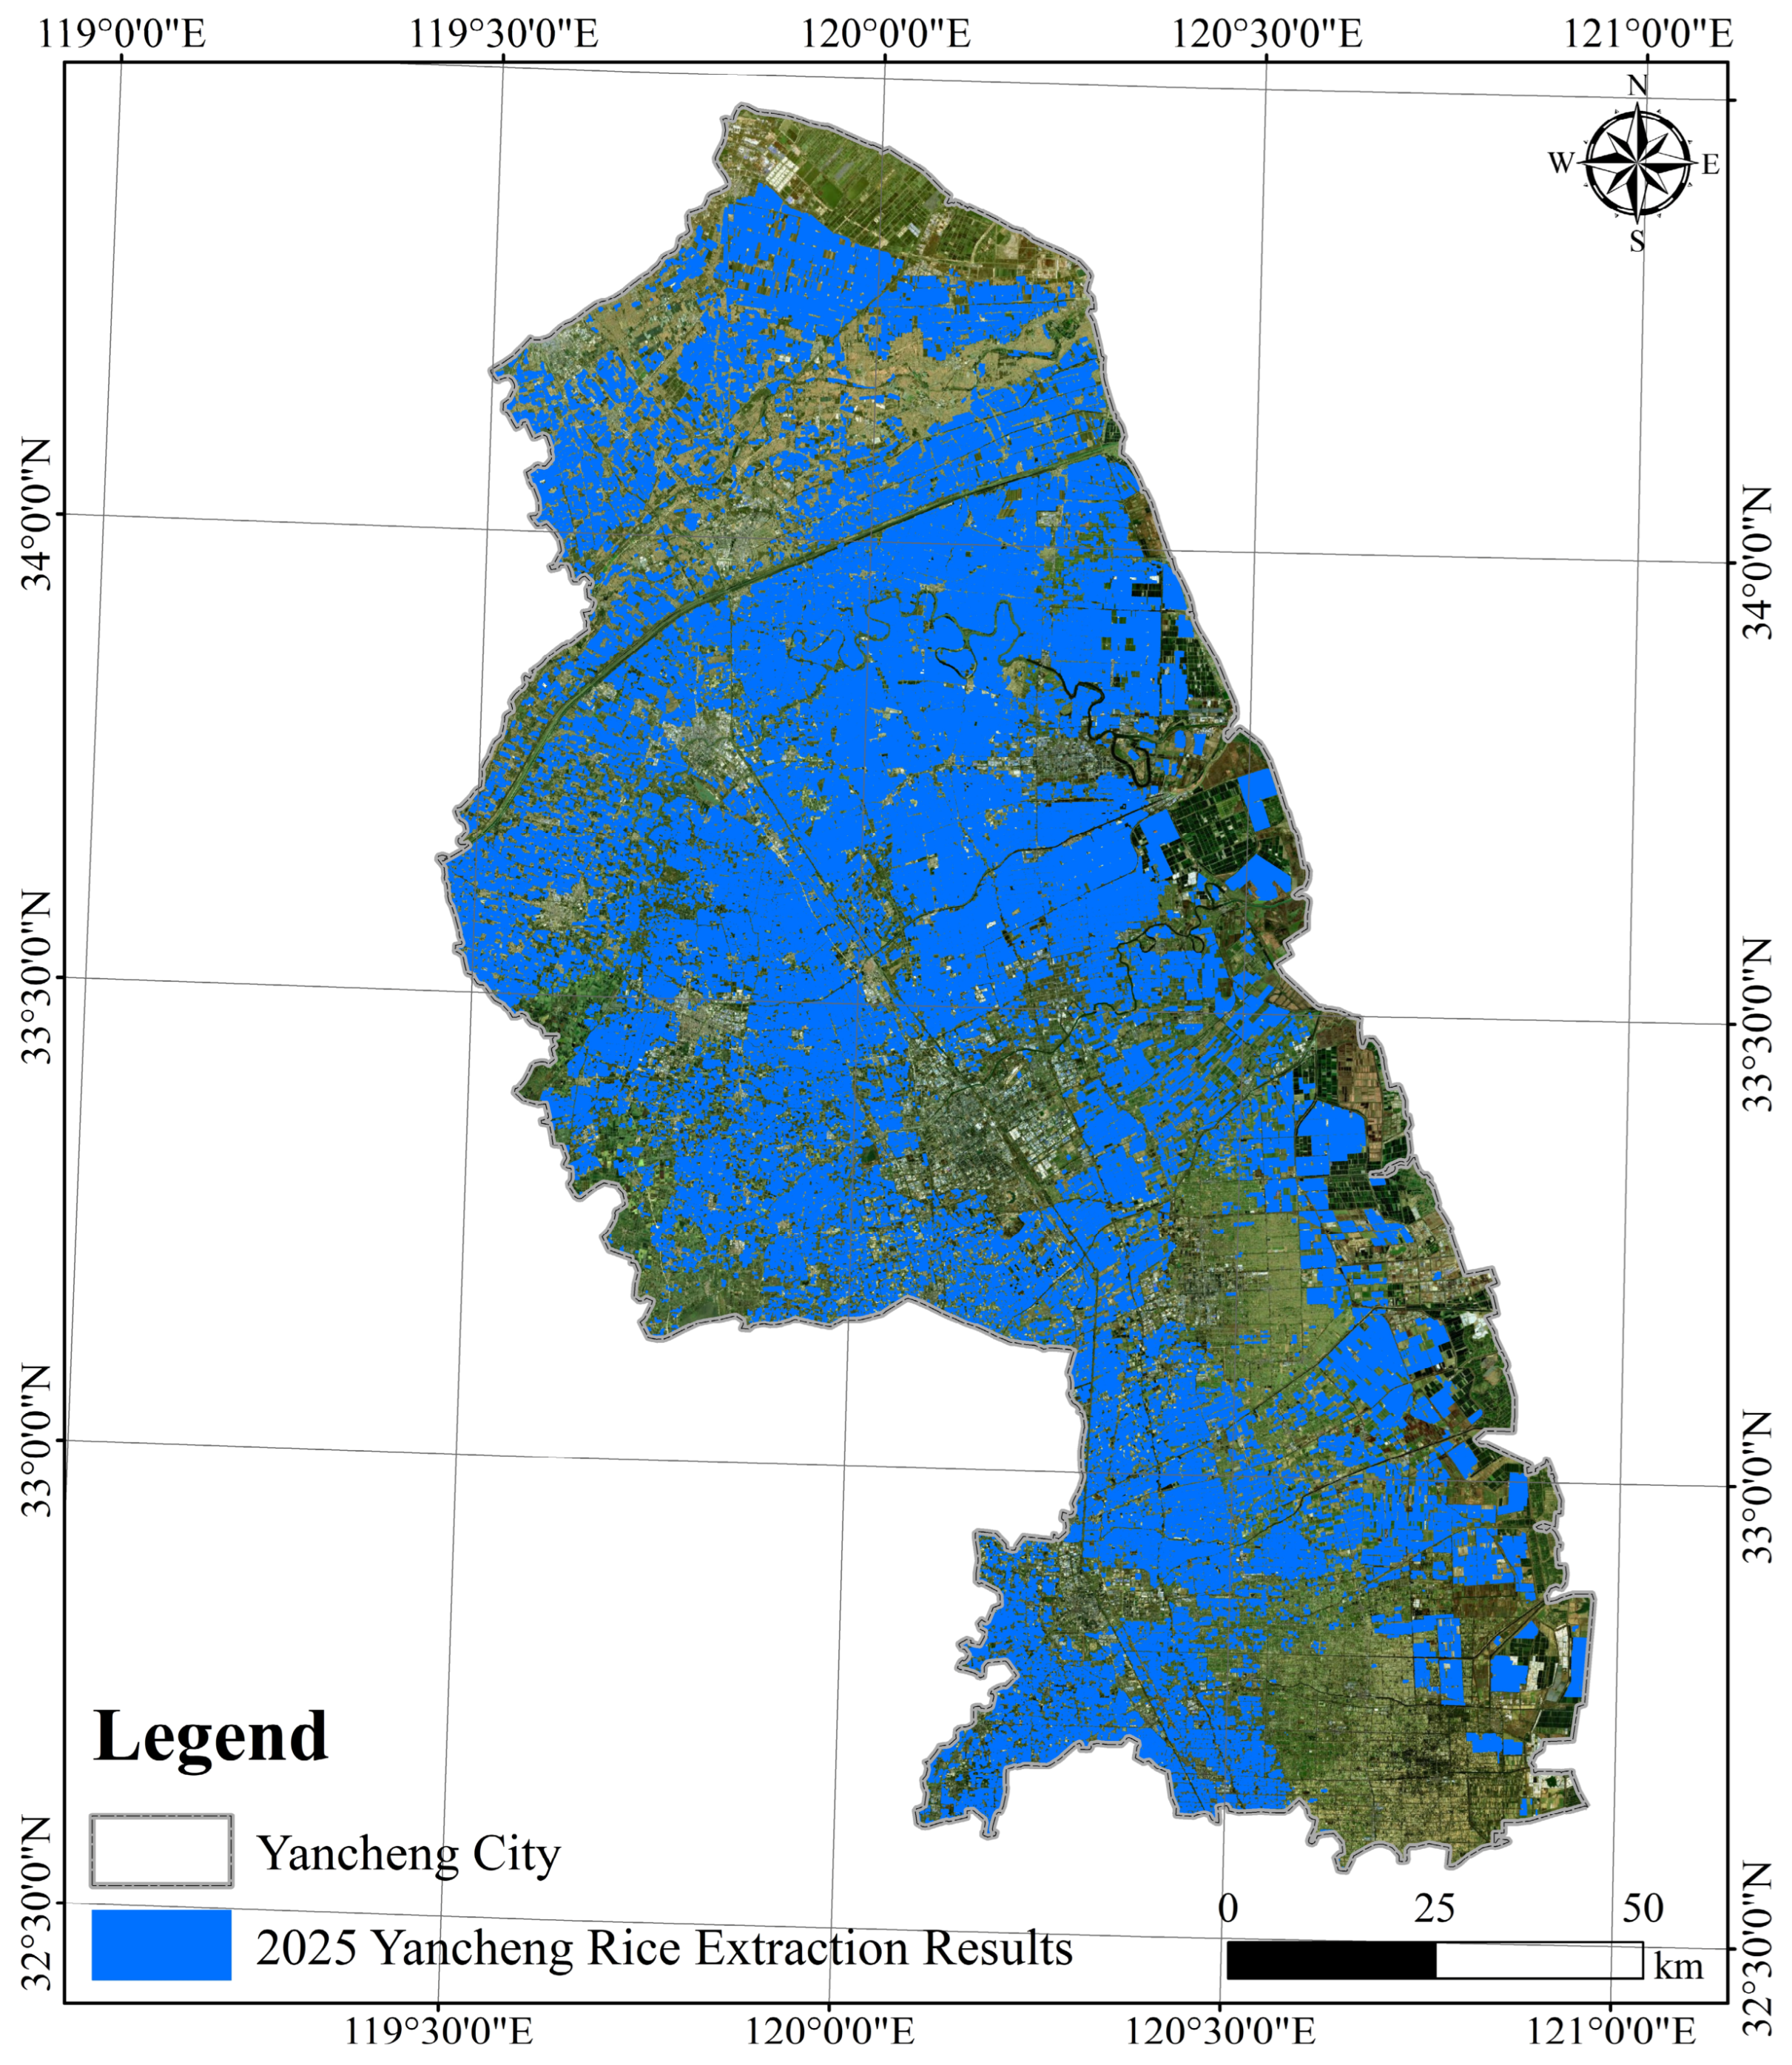
To further verify the application capability of the model over a large area, this study used the trained optimal model to predict the paddy rice planting areas of Yancheng in 2025. During prediction, Sentinel-1 and Sentinel-2 images from August to October 2025 were used as input data. Block-wise inference was performed over the study area, and the prediction results of each block were mosaicked to obtain the spatial distribution result of paddy rice in Yancheng.
The paddy rice extraction result of Yancheng in 2025 is shown in Figure 8. The prediction result shows that paddy rice planting areas present obvious spatial clustering within Yancheng and are mainly distributed in concentrated agricultural regions. Based on the model prediction result, the paddy rice planting area in Yancheng in 2025 was estimated to be 4797.13 km2. The official paddy rice planting area was 4533.33 km2 [38], and the difference rate between the extracted area and the official statistical area was 5.82%, indicating that the extraction result was generally consistent with the statistical data.
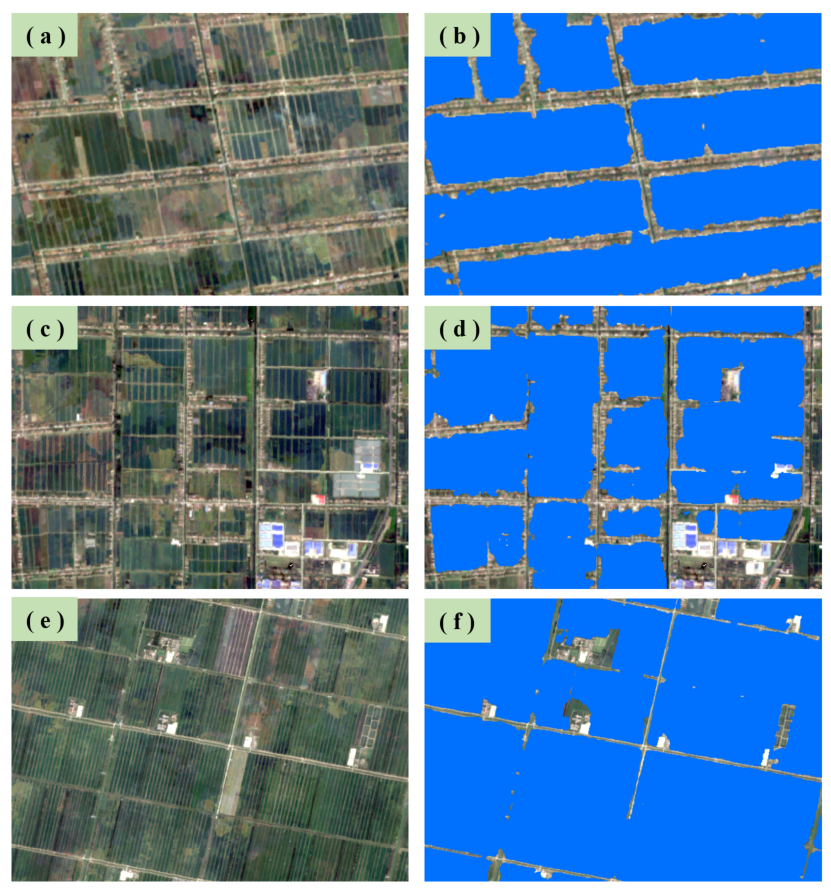
To further display the paddy rice extraction effect of the model in local regions, typical agricultural areas in Yancheng were selected for detailed presentation, as shown in Figure 9. The local enlarged results show that the proposed method can effectively identify the spatial distribution pattern of paddy fields and can maintain good integrity in contiguous planting areas. At the same time, the model can still obtain relatively clear extraction results for field boundaries and scattered paddy rice regions, indicating that the method has certain applicability in large-scale paddy rice mapping.

5.5. Generalization Ability Test

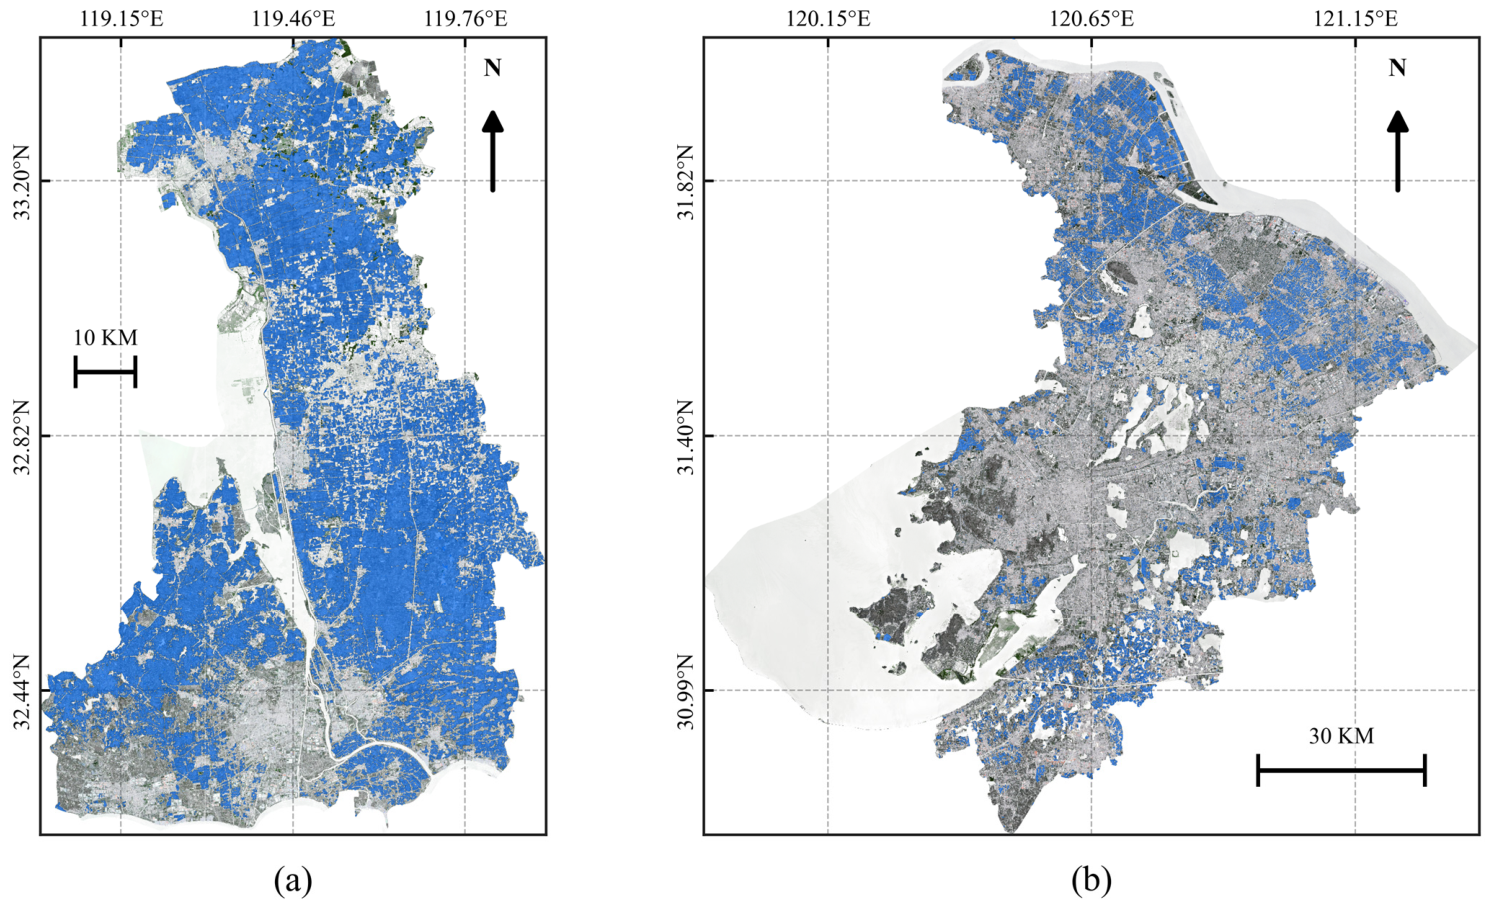
To further evaluate the transferability of the proposed model, ACBE-CroFuseNet was applied to Yangzhou in central Jiangsu and Suzhou in southern Jiangsu using Sentinel-1 SAR and Sentinel-2 optical imagery from the same period in 2025. Compared with Yancheng, which is located in the coastal plain and contains extensive coastal wetlands and dense river networks, Yangzhou is located in the central part of Jiangsu Province and is characterized by plain agricultural landscapes and lake-river systems, while Suzhou is located in southern Jiangsu with a warmer and more humid climate, denser urban–rural mosaics, and more fragmented agricultural land. These differences in climate background, landscape composition, field fragmentation, and surrounding land-cover types provide suitable test conditions for evaluating model generalization.
The extraction results for Yangzhou and Suzhou are shown in Figure 10. Since independent validation samples were not available for these two cities, the extracted paddy rice areas were indirectly evaluated by comparison with official statistical planting areas. For Suzhou, the extracted paddy rice area was 786.53 km2, while the official statistical planting area was 730.67 km2 [38]; the difference rate was 7.65%. For Yangzhou, the extracted paddy rice area was 2093.10 km2, while the official statistical planting area was 1947.80 km2 [38]; the difference rate was 7.46%. Overall, the model was able to identify the main paddy rice planting areas in both cities and maintained relatively complete spatial patterns under different regional conditions. Although local omission or commission errors may still occur in fragmented fields and mixed land-cover areas, the results indicate that the proposed optical–SAR fusion model has a certain degree of generalization ability beyond the original Yancheng study area.

5.6. Bad Case Analysis

To further analyze the limitations of the proposed method, a representative bad case is shown in Figure 11. In this scene, small and fragmented paddy rice patches are mixed with maize and other dryland crops. Because these rice patches occupy only a small area and are surrounded by spectrally similar crop fields, their optical texture and SAR backscattering responses are easily weakened during feature encoding. As a result, some very small paddy rice patches are missed by the model. This indicates that although ACBE-CroFuseNet performs well in continuous and regular paddy fields, omission errors may still occur in highly fragmented mixed-cropping areas. Future work will consider higher-resolution imagery, multi-temporal phenological features, and sample enhancement for small paddy rice patches to further improve the recognition of such difficult cases.

5.7. Limitations and Future Work

Although the proposed ACBE-CroFuseNet achieved good performance in paddy rice extraction, several limitations remain. First, this study mainly used imagery from the middle and late growth stages of paddy rice, and the model performance under different growth stages or seasonal conditions still needs further evaluation. Second, the current experiments were mainly conducted in single-season rice planting areas in Jiangsu Province, while the transferability of the model to regions with double-cropping or multi-season rice systems requires additional testing. Third, this study focused on single-period optical–SAR fusion, and the use of multi-temporal Sentinel-1 and Sentinel-2 data may further improve the discrimination of paddy rice by incorporating phenological changes. In future work, multi-season samples, cross-regional validation, and multi-temporal fusion strategies will be introduced to improve the robustness and generalization ability of the model.

6. Conclusions

This study proposed ACBE-CroFuseNet, an optical–SAR cross-fusion semantic segmentation network for paddy rice extraction using Sentinel-1 SAR and Sentinel-2 optical imagery. The model adopts a dual-branch structure to separately extract optical spectral–textural features and SAR scattering–structural features, and introduces attention cross-fusion, multimodal feature aggregation, boundary enhancement, and multi-scale deep supervision to improve multimodal feature interaction and paddy field boundary delineation.
The experimental results demonstrate that the proposed method achieves better paddy rice extraction performance than the comparison models and shows more stable results under five-fold cross-validation. The ablation experiments further confirm that the optical–SAR fusion strategy, multimodal feature aggregation, and boundary enhancement modules all contribute to the improvement of segmentation accuracy. In addition, the model complexity analysis indicates that ACBE-CroFuseNet maintains acceptable computational cost while improving extraction accuracy, suggesting its potential for large-scale paddy rice mapping.
The full-coverage mapping results in Yancheng and the transfer experiments in Yangzhou and Suzhou show that the proposed method can effectively identify the spatial distribution of paddy rice in complex plain agricultural landscapes and has a certain degree of cross-regional generalization ability. However, some omission errors still occur in very small and fragmented paddy fields, especially in mixed cropping areas. Future work will further evaluate the model under different growth stages and cropping systems, extend it to double-cropping or multi-season rice regions, and incorporate multi-temporal optical–SAR data to improve robustness and transferability.

Author Contributions

Conceptualization, X.G. and L.B.; methodology, X.G.; software, X.G.; validation, X.G.; formal analysis, X.G.; investigation, X.G.; resources, L.B.; data curation, L.B.; writing—original draft preparation, X.G.; writing—review and editing, L.B.; visualization, L.B. All authors have read and agreed to the published version of the manuscript.

Funding

This research was funded by the Natural Science Foundation of Hubei Province (grant number 2025AFB855). The APC was funded by the authors.

Institutional Review Board Statement

Not applicable.

Informed Consent Statement

Not applicable.

Data Availability Statement

The data presented in this study are available in the Copernicus Data Space Ecosystem at https://dataspace.copernicus.eu/. These data were derived from the following public-domain satellite resources: Sentinel-1 C-band SAR imagery and Sentinel-2 multispectral optical imagery provided by the European Space Agency (ESA).

Acknowledgments

During the preparation of this manuscript, the authors used GPT-5.5 for English translation verification, text simplification and manuscript polishing. The authors have reviewed and edited all AI-generated outputs and take full responsibility for all content of this publication.

Conflicts of Interest

The authors declare no conflicts of interest.

References

  1. Lu, J.; Li, J.; Fu, H.; Zou, W.; Kang, J.; Yu, H.; Lin, X. Estimation of rice yield using multi-source remote sensing data combined with crop growth model and deep learning algorithm. Agric. For. Meteorol. 2025, 370, 110600. [Google Scholar] [CrossRef] [Scilit]
  2. Zheng, J.; Song, X.; Yang, G.; Du, X.; Mei, X.; Yang, X. Remote Sensing Monitoring of Rice and Wheat Canopy Nitrogen: A Review. Remote Sens. 2022, 14, 5712. [Google Scholar] [CrossRef] [Scilit]
  3. Guo, Y.; Ren, H. Remote sensing monitoring of maize and paddy rice planting area using GF-6 WFV red edge features. Comput. Electron. Agric. 2023, 207, 107714. [Google Scholar] [CrossRef] [Scilit]
  4. Wang, D.; Struik, P.C.; Liang, L.; Yin, X. Developing remote sensing- and crop model-based methods to optimize nitrogen management in rice fields. Comput. Electron. Agric. 2024, 220, 108899. [Google Scholar] [CrossRef] [Scilit]
  5. Zhao, Z.; Dong, J.; Yang, J.; Liu, L.; You, N.; Xiao, X.; Zhang, G. From rice planting area mapping to rice agricultural system mapping: A holistic remote sensing framework for understanding China’s complex rice systems. ISPRS J. Photogramm. Remote Sens. 2025, 224, 382–397. [Google Scholar] [CrossRef] [Scilit]
  6. Xiao, X.; Boles, S.; Liu, J.; Zhuang, D.; Frolking, S.; Li, C.; Salas, W.; Moore, B. Mapping paddy rice agriculture in southern China using multi-temporal MODIS images. Remote Sens. Environ. 2005, 95, 480–492. [Google Scholar] [CrossRef] [Scilit]
  7. Li, J.; Xue, F.; Li, G.; Zhang, M.; Tian, J.; Zhang, H. SPRC: A novel Sentinel-1/-2 Phenology-enhanced framework for automated paddy rice mapping. Int. J. Appl. Earth Obs. Geoinf. 2025, 143, 104772. [Google Scholar] [CrossRef] [Scilit]
  8. Gan, C.; Qiu, B.; Zhang, J.; Yao, C.; Ye, Z.; Huang, H.; Huang, Y.; Peng, Y.; Lin, Y.; Lin, D.; et al. Mapping Paddy Rice Planting Patterns based on Sentinel-1/2. J. Geo-Inf. Sci. 2023, 25, 153–162. [Google Scholar] [CrossRef]
  9. Huang, C.; You, S.; Liu, A.; Li, P.; Zhang, J.; Deng, J. High-Resolution National-Scale Mapping of Paddy Rice Based on Sentinel-1/2 Data. Remote Sens. 2023, 15, 4055. [Google Scholar] [CrossRef] [Scilit]
  10. Yang, L.; Wang, L.; Abubakar, G.A.; Huang, J. High-Resolution Rice Mapping Based on SNIC Segmentation and Multi-Source Remote Sensing Images. Remote Sens. 2021, 13, 1148. [Google Scholar] [CrossRef] [Scilit]
  11. Bouvet, A.; Le Toan, T. Use of ENVISAT/ASAR wide-swath data for timely rice fields mapping in the Mekong River Delta. Remote Sens. Environ. 2011, 115, 1090–1101. [Google Scholar] [CrossRef] [Scilit]
  12. Nelson, A.; Setiyono, T.; Rala, A.; Quicho, E.; Raviz, J.; Abonete, P.; Maunahan, A.; Garcia, C.; Bhatti, H.; Villano, L.; et al. Towards an Operational SAR-Based Rice Monitoring System in Asia: Examples from 13 Demonstration Sites across Asia in the RIICE Project. Remote Sens. 2014, 6, 10773–10812. [Google Scholar] [CrossRef] [Scilit]
  13. Clauss, K.; Ottinger, M.; Kuenzer, C. Mapping rice areas with Sentinel-1 time series and superpixel segmentation. Int. J. Remote Sens. 2017, 39, 1399–1420. [Google Scholar] [CrossRef] [Scilit]
  14. Bazzi, H.; Baghdadi, N.; El Hajj, M.; Zribi, M.; Minh, D.H.T.; Ndikumana, E.; Courault, D.; Belhouchette, H. Mapping Paddy Rice Using Sentinel-1 SAR Time Series in Camargue, France. Remote Sens. 2019, 11, 887. [Google Scholar] [CrossRef] [Scilit]
  15. Rudiyanto; Minasny, B.; Shah, R.; Che Soh, N.; Arif, C.; Indra Setiawan, B. Automated Near-Real-Time Mapping and Monitoring of Rice Extent, Cropping Patterns, and Growth Stages in Southeast Asia Using Sentinel-1 Time Series on a Google Earth Engine Platform. Remote Sens. 2019, 11, 1666. [Google Scholar] [CrossRef] [Scilit]
  16. Nguyen, D.; Clauss, K.; Cao, S.; Naeimi, V.; Kuenzer, C.; Wagner, W. Mapping Rice Seasonality in the Mekong Delta with Multi-Year Envisat ASAR WSM Data. Remote Sens. 2015, 7, 15868–15893. [Google Scholar] [CrossRef] [Scilit]
  17. Wang, M.; Wang, J.; Chen, L.; Du, Z. Mapping paddy rice and rice phenology with Sentinel-1 SAR time series using a unified dynamic programming framework. Open Geosci. 2022, 14, 414–428. [Google Scholar] [CrossRef] [Scilit]
  18. A., A.H.; Umesh, P.; Tahiliani, M.P. Automated rice mapping using multitemporal Sentinel-1 SAR imagery using dynamic threshold and slope-based index methods. Remote Sens. Appl. Soc. Environ. 2025, 37, 101410. [Google Scholar] [CrossRef] [Scilit]
  19. Joshi, N.; Baumann, M.; Ehammer, A.; Fensholt, R.; Grogan, K.; Hostert, P.; Jepsen, M.; Kuemmerle, T.; Meyfroidt, P.; Mitchard, E.; et al. A Review of the Application of Optical and Radar Remote Sensing Data Fusion to Land Use Mapping and Monitoring. Remote Sens. 2016, 8, 70. [Google Scholar] [CrossRef] [Scilit]
  20. Schmitt, M.; Zhu, X.X. Data Fusion and Remote Sensing: An ever-growing relationship. IEEE Geosci. Remote Sens. Mag. 2016, 4, 6–23. [Google Scholar] [CrossRef] [Scilit]
  21. Van Tricht, K.; Gobin, A.; Gilliams, S.; Piccard, I. Synergistic Use of Radar Sentinel-1 and Optical Sentinel-2 Imagery for Crop Mapping: A Case Study for Belgium. Remote Sens. 2018, 10, 1642. [Google Scholar] [CrossRef] [Scilit]
  22. Orynbaikyzy, A.; Gessner, U.; Mack, B.; Conrad, C. Crop Type Classification Using Fusion of Sentinel-1 and Sentinel-2 Data: Assessing the Impact of Feature Selection, Optical Data Availability, and Parcel Sizes on the Accuracies. Remote Sens. 2020, 12, 2779. [Google Scholar] [CrossRef] [Scilit]
  23. Adrian, J.; Sagan, V.; Maimaitijiang, M. Sentinel SAR-optical fusion for crop type mapping using deep learning and Google Earth Engine. ISPRS J. Photogramm. Remote Sens. 2021, 175, 215–235. [Google Scholar] [CrossRef] [Scilit]
  24. Xiao, W.; Xu, S.; He, T. Mapping Paddy Rice with Sentinel-1/2 and Phenology-, Object-Based Algorithm—A Implementation in Hangjiahu Plain in China Using GEE Platform. Remote Sens. 2021, 13, 990. [Google Scholar] [CrossRef] [Scilit]
  25. Xu, D.; Zhang, M. Mapping paddy rice using an adaptive stacking algorithm and Sentinel-1/2 images based on Google Earth Engine. Remote Sens. Lett. 2022, 13, 373–382. [Google Scholar] [CrossRef] [Scilit]
  26. Gao, Y.; Pan, Y.; Zhu, X.; Li, L.; Ren, S.; Zhao, C.; Zheng, X. FARM: A fully automated rice mapping framework combining Sentinel-1 SAR and Sentinel-2 multi-temporal imagery. Comput. Electron. Agric. 2023, 213, 108262. [Google Scholar] [CrossRef] [Scilit]
  27. Zhao, Z.; Dong, J.; Zhang, G.; Yang, J.; Liu, R.; Wu, B.; Xiao, X. Improved phenology-based rice mapping algorithm by integrating optical and radar data. Remote Sens. Environ. 2024, 315, 114460. [Google Scholar] [CrossRef] [Scilit]
  28. Saadat, M.; Seydi, S.T.; Hasanlou, M.; Homayouni, S. A Convolutional Neural Network Method for Rice Mapping Using Time-Series of Sentinel-1 and Sentinel-2 Imagery. Agriculture 2022, 12, 2083. [Google Scholar] [CrossRef] [Scilit]
  29. Onojeghuo, A.O.; Miao, Y.; Blackburn, G.A. Deep ResU-Net Convolutional Neural Networks Segmentation for Smallholder Paddy Rice Mapping Using Sentinel 1 SAR and Sentinel 2 Optical Imagery. Remote Sens. 2023, 15, 1517. [Google Scholar] [CrossRef] [Scilit]
  30. Huang, D.; Xu, L.; Zou, S.; Liu, B.; Li, H.; Pu, L.; Chi, H. Mapping Paddy Rice in Rice–Wetland Coexistence Zone by Integrating Sentinel-1 and Sentinel-2 Data. Agriculture 2024, 14, 345. [Google Scholar] [CrossRef] [Scilit]
  31. Fikriyah, V.N.; Darvishzadeh, R.; Laborte, A.; Nelson, A. Ratoon rice mapping based on Sentinel-1 and Sentinel-2 imagery. Remote Sens. Appl. Soc. Environ. 2025, 38, 101592. [Google Scholar] [CrossRef] [Scilit]
  32. Schmitt, M.; Hughes, L.H.; Zhu, X.X. The SEN1-2 dataset for deep learning in sar-optical data fusion. ISPRS Ann. Photogramm. Remote Sens. Spat. Inf. Sci. 2018, IV-1, 141–146. [Google Scholar] [CrossRef] [Scilit]
  33. Wu, W.; Guo, S.; Shao, Z.; Li, D. CroFuseNet: A Semantic Segmentation Network for Urban Impervious Surface Extraction Based on Cross Fusion of Optical and SAR Images. IEEE J. Sel. Top. Appl. Earth Obs. Remote Sens. 2023, 16, 2573–2588. [Google Scholar] [CrossRef] [Scilit]
  34. Li, X.; Xie, L.; Wang, C.; Miao, J.; Shen, H.; Zhang, L. Boundary-enhanced dual-stream network for semantic segmentation of high-resolution remote sensing images. GIScience Remote Sens. 2024, 61, 2356355. [Google Scholar] [CrossRef] [Scilit]
  35. Zhou, Z.; Siddiquee, M.M.R.; Tajbakhsh, N.; Liang, J. UNet++: Redesigning Skip Connections to Exploit Multiscale Features in Image Segmentation. IEEE Trans. Med. Imaging 2020, 39, 1856–1867. [Google Scholar] [CrossRef] [Scilit] [PubMed]
  36. Cao, H.; Wang, Y.; Chen, J.; Jiang, D.; Zhang, X.; Tian, Q.; Wang, M. Swin-Unet: Unet-Like Pure Transformer for Medical Image Segmentation. Computer Vision—ECCV 2022 Workshops. In Proceedings of the Lecture Notes in Computer Science, 2023; Springer: Berlin/Heidelberg, Germany, 2023; pp. 205–218. [Google Scholar]
  37. Guo, S.; Wu, W.; Shao, Z.; Teng, J.; Li, D. Extracting urban impervious surface based on optical and SAR images cross-modal multi-scale features fusion network. Int. J. Digit. Earth 2024, 17, 2301675. [Google Scholar] [CrossRef] [Scilit]
  38. Bureau of Statistics of Jiangsu Province. Jiangsu Statistical Yearbook 2025. Available online: https://tj.jiangsu.gov.cn/col/col93166/index.html (accessed on 4 August 2026).
Figure 1. Location map of the study area.
Ai 07 00302 g001
Figure 2. Examples of the dataset. The blue colored areas represent paddy rice fields.
Ai 07 00302 g002
Figure 3. Overall architecture of the proposed ACBE-CroFuseNet for optical and SAR cross-fusion paddy rice extraction. The dashed-line arrows denote multi-scale deep supervision.
Ai 07 00302 g003
Figure 4. Schematic illustration of the attention cross-fusion module for multi-scale optical and SAR feature interaction.
Ai 07 00302 g004
Figure 5. Structure of the multimodal feature aggregation module for integrating shared and modality-specific features.
Ai 07 00302 g005
Figure 6. Network architecture diagram of the decoding stage. The solid-line arrow denotes the original decoding path, and the dashed-line arrow stands for the added boundary-enhanced path.
Ai 07 00302 g006
Figure 7. Visual comparison of paddy rice extraction results by different methods. Blue indicates correctly extracted paddy rice pixels, red indicates falsely extracted paddy rice pixels, and yellow indicates missed paddy rice pixels. (a) Sentinel-2 optical image, (b) Sentinel-1 SAR image, (c) reference label, (d) UNet++, (e) Swin-Unet, (f) CroFuseNet, (g) CMFFNet, and (h) Ours.
Ai 07 00302 g007
Figure 8. Prediction result of paddy rice planting areas in Yancheng in 2025. The base map is the true color display of Senti-nel 2 imagery, where vegetation is shown in green.
Ai 07 00302 g008
Figure 9. Local detail map of paddy rice extraction results in Yancheng. (a) Remote-sensing image of paddy-rice fields; (b) Paddy-rice extraction result corresponding to Figure (a); (c) Remote-sensing image of paddy-rice fields; (d) Pad-dy-rice extraction result corresponding to Figure (c); (e) Remote-sensing image of paddy-rice fields; (f) Paddy-rice extraction result corresponding to Figure (e).
Ai 07 00302 g009
Figure 10. Paddy rice extraction results in Yangzhou and Suzhou in 2025. (a) Yangzhou; (b) Suzhou. The blue-colored areas denote the extracted paddy-rice regions.
Ai 07 00302 g010
Figure 11. Bad case analysis of paddy rice extraction in mixed cropping areas. Blue indicates correctly extracted paddy rice, red indicates false extraction, and yellow indicates missed paddy rice pixels. (a) Sentinel-2 optical image, (b) Sentinel-1 SAR image, (c) reference label, (d) UNet++, (e) Swin-Unet, (f) CroFuseNet, (g) CMFFNet, and (h) Ours.
Ai 07 00302 g011
Table 1. Characteristics of Sentinel-1 and Sentinel-2 image data.
Data SourceProduct TypeImaging or Sensor TypeUsed Bands or PolarizationWavelength or Central WavelengthSpatial ResolutionTime RangeMain Function
Sentinel-1GRDC-band SAR, IW modeVV polarizationApproximately 5.6 cm10 mAugust to October 2025Providing backscattering, surface structure, and moisture information
C-band SAR, IW modeVH polarizationApproximately 5.6 cm10 mAugust to October 2025Providing vegetation structure and volume scattering information
Sentinel-2L2AMultispectral optical imageryB2 Blue490 nm10 mAugust to October 2025Reflecting visible blue-band characteristics
Multispectral optical imageryB3 Green560 nm10 mAugust to October 2025Reflecting spectral characteristics of green vegetation
Multispectral optical imageryB4 Red665 nm10 mAugust to October 2025Reflecting red-light absorption characteristics
Multispectral optical imageryB8 NIR842 nm10 mAugust to October 2025Reflecting near-infrared vegetation response
Table 2. Accuracy comparison of paddy rice extraction by different methods under five-fold cross-validation. Values are reported as mean +/− standard deviation.
MethodOA
(mean +/− SD)
UA
(mean +/− SD)
PA
(mean +/− SD)
F1-Score
(mean +/− SD)
IoU
(mean +/− SD)
UNet++0.920 +/− 0.0040.914 +/− 0.0060.931 +/− 0.0050.922 +/− 0.0040.856 +/− 0.006
Swin-Unet0.921 +/− 0.0050.916 +/− 0.0050.932 +/− 0.0060.924 +/− 0.0050.859 +/− 0.006
CroFuseNet0.927 +/− 0.0030.923 +/− 0.0040.935 +/− 0.0050.929 +/− 0.0040.865 +/− 0.005
CMFFNet0.924 +/− 0.0040.920 +/− 0.0050.933 +/− 0.0050.926 +/− 0.0040.862 +/− 0.005
Ours0.935 +/− 0.0040.928 +/− 0.0040.939 +/− 0.0040.933 +/− 0.0030.868 +/− 0.004
Table 3. Ablation experimental results of different module combinations.
Experimental SettingOA
(mean +/− SD)
UA
(mean +/− SD)
PA
(mean +/− SD)
F1-Score
(mean +/− SD)
IoU
(mean +/− SD)
Single optical data encoder–decoder0.910 +/− 0.0060.895 +/− 0.0070.925 +/− 0.0060.910 +/− 0.0060.834 +/− 0.008
Single SAR data encoder–decoder0.868 +/− 0.0070.869 +/− 0.0080.858 +/− 0.0090.864 +/− 0.0080.760 +/− 0.010
Single optical data encoder–decoder with boundary enhancement0.912 +/− 0.0050.898 +/− 0.0070.929 +/− 0.0060.913 +/− 0.0060.838 +/− 0.007
Single SAR data encoder–decoder with boundary enhancement0.875 +/− 0.0060.874 +/− 0.0080.869 +/− 0.0080.872 +/− 0.0070.773 +/− 0.009
Optical and SAR cross-fusion0.926 +/− 0.0050.923 +/− 0.0060.928 +/− 0.0070.925 +/− 0.0060.859 +/− 0.006
Optical and SAR cross-fusion with multimodal feature aggregation0.932 +/− 0.0050.927 +/− 0.0050.936 +/− 0.0050.931 +/− 0.0050.866 +/− 0.005
Optical and SAR cross-fusion with multimodal feature aggregation and boundary enhancement0.935 +/− 0.0050.928 +/− 0.0050.939 +/− 0.0060.933 +/− 0.0050.868 +/− 0.004
Table 4. Comparison of model complexity and computational efficiency.
MethodParams (M)FLOPs (G)Training GPU Memory (GB)Training Time (min/fold)Inference Time (ms/patch)
UNet++9.1617.274.1742.71.85
Swin-Unet11.979.152.1236.21.46
CroFuseNet23.4016.902.6061.02.05
CMFFNet21.8015.702.4858.41.98
Ours25.9817.842.7566.52.15
Disclaimer/Publisher’s Note: The statements, opinions and data contained in all publications are solely those of the individual author(s) and contributor(s) and not of MDPI and/or the editor(s). MDPI and/or the editor(s) disclaim responsibility for any injury to people or property resulting from any ideas, methods, instructions or products referred to in the content.