1. Introduction
Artificial intelligence (AI)-supported marketing automation increasingly uses model-based systems to generate, rank, test, and revise persuasive content. In this paper, an AI marketing system is a computational workflow that supports campaign communication through generated text, optimization objectives, monitoring, or reporting. A multi-agent system (MAS) is a workflow in which distinct agent roles interact rather than assigning all functions to one model or service. OpenClaw is the simulation environment used here to implement such a role-specialized workflow. The study uses OpenClaw to model a three-agent marketing team with a content creator, a campaign optimizer, and an analytics reporter. Governance in this study means the logging, scoring, review, and escalation mechanisms used to make risk signals visible; it is not treated as proof of legal compliance or as a validated real-world governance product.
Marketing persuasion is not inherently unethical. Truthful and disclosed persuasion can inform consumers, highlight product benefits, and support mutually useful exchange. The ethical concern arises when persuasion becomes manipulative, such as when it relies on artificial scarcity, unsupported authority, coercive emotional pressure, misleading claims, or opaque choice pressure that reduces user autonomy or distorts informed choice. Automated influence systems raise concerns about autonomy, transparency, and user welfare because they can shape decisions through targeted messages, digital nudges, recommender systems, and adaptive interfaces [
1,
2]. Work on dark patterns and manipulative design shows that urgency, scarcity, hidden pressure, and misleading choice structures can affect users while making the influence process hard to inspect [
3,
4]. Generative AI raises the stakes because persuasive messages can be produced, revised, and scaled with less human effort than traditional campaign design [
5,
6,
7].
The problem becomes more complex when marketing automation is organized as a team of agents. A content-generation agent may produce copy, an optimization agent may tune pressure toward conversion, and a reporting or monitoring agent may evaluate outputs after they are produced. Ethical risk can therefore emerge from interaction among roles, not only from one model in isolation. In this setting, optimization pressure means the extent to which objective weights push the agent team toward campaign performance goals such as conversion. A manipulation-risk signal is an operational detector output indicating that generated content contains markers associated with potentially manipulative persuasion. Such signals should not be read as a complete legal, moral, or psychological classification of actual consumer harm.
This paper studies ethical compliance drift in a narrow empirical sense: changes in detector-defined manipulation-risk indicators in generated marketing content under different levels of optimization pressure. The study focuses on three content-level indicators that are directly relevant to marketing manipulation: Urgency Exploitation Score (UES), Authority Manipulation Index (AMI), and Emotional Coercion Score (ECS). This framing separates ethical compliance drift from ordinary technical drift. A system can remain coherent, fluent, and useful for campaign work while becoming more reliant on manipulative rhetoric. Prior work on AI safety has shown that optimizing proxy objectives can produce behavior that satisfies a measured target while moving away from the broader intent of the system designer [
8,
9]. In marketing agents, the proxy objective is not a game score or benchmark reward. It is conversion-oriented pressure applied to persuasive communication.
The empirical gap is specific. Prior studies of dark patterns and automated persuasion often examine user interfaces, message outputs, or single-system influence mechanisms. AI safety work explains how proxy objectives can create unwanted behavior. Multi-agent governance work explains why interacting agents require traceability and accountability. What is less well understood is how a role-specialized marketing-agent team changes its detector-defined manipulation-risk profile when objective-function weights shift toward conversion. This paper addresses that gap by combining controlled pressure manipulation, a fixed multi-agent marketing workflow, and transparent rule-based measurement. The study therefore contrasts with single-model or isolated-output studies, static dark-pattern detection, and governance discussions that do not vary operating pressure experimentally.
To address this gap, we ran a controlled 60-day OpenClaw simulation of a three-agent marketing team. Three predefined pressure regimes were compared while the model backend, agent roles, prompt pool, and monitoring process were held constant. The primary outcome was a composite score based on UES, AMI, and ECS.
Section 4 reports the operating-regime weights, trial schedule, prompts, detector rules, and analysis units; the appendices provide robustness checks and illustrative examples.
The main result is that optimization pressure significantly affected manipulation scores, but not in a simple linear pattern. A one-way analysis of variance (ANOVA) showed a significant effect of optimization pressure on manipulation scores,
,
,
. Manipulation scores followed a non-monotonic pattern:
B_moderate showed the highest observed mean score (
), followed by
C_high (
) and
A_baseline (
). Although
B_moderate had a higher mean manipulation score than
C_high, this pairwise difference was not statistically significant. The bounded interpretation is that pressure affected detector-defined manipulation-risk scores, and that moderate pressure produced the highest observed mean in this study.
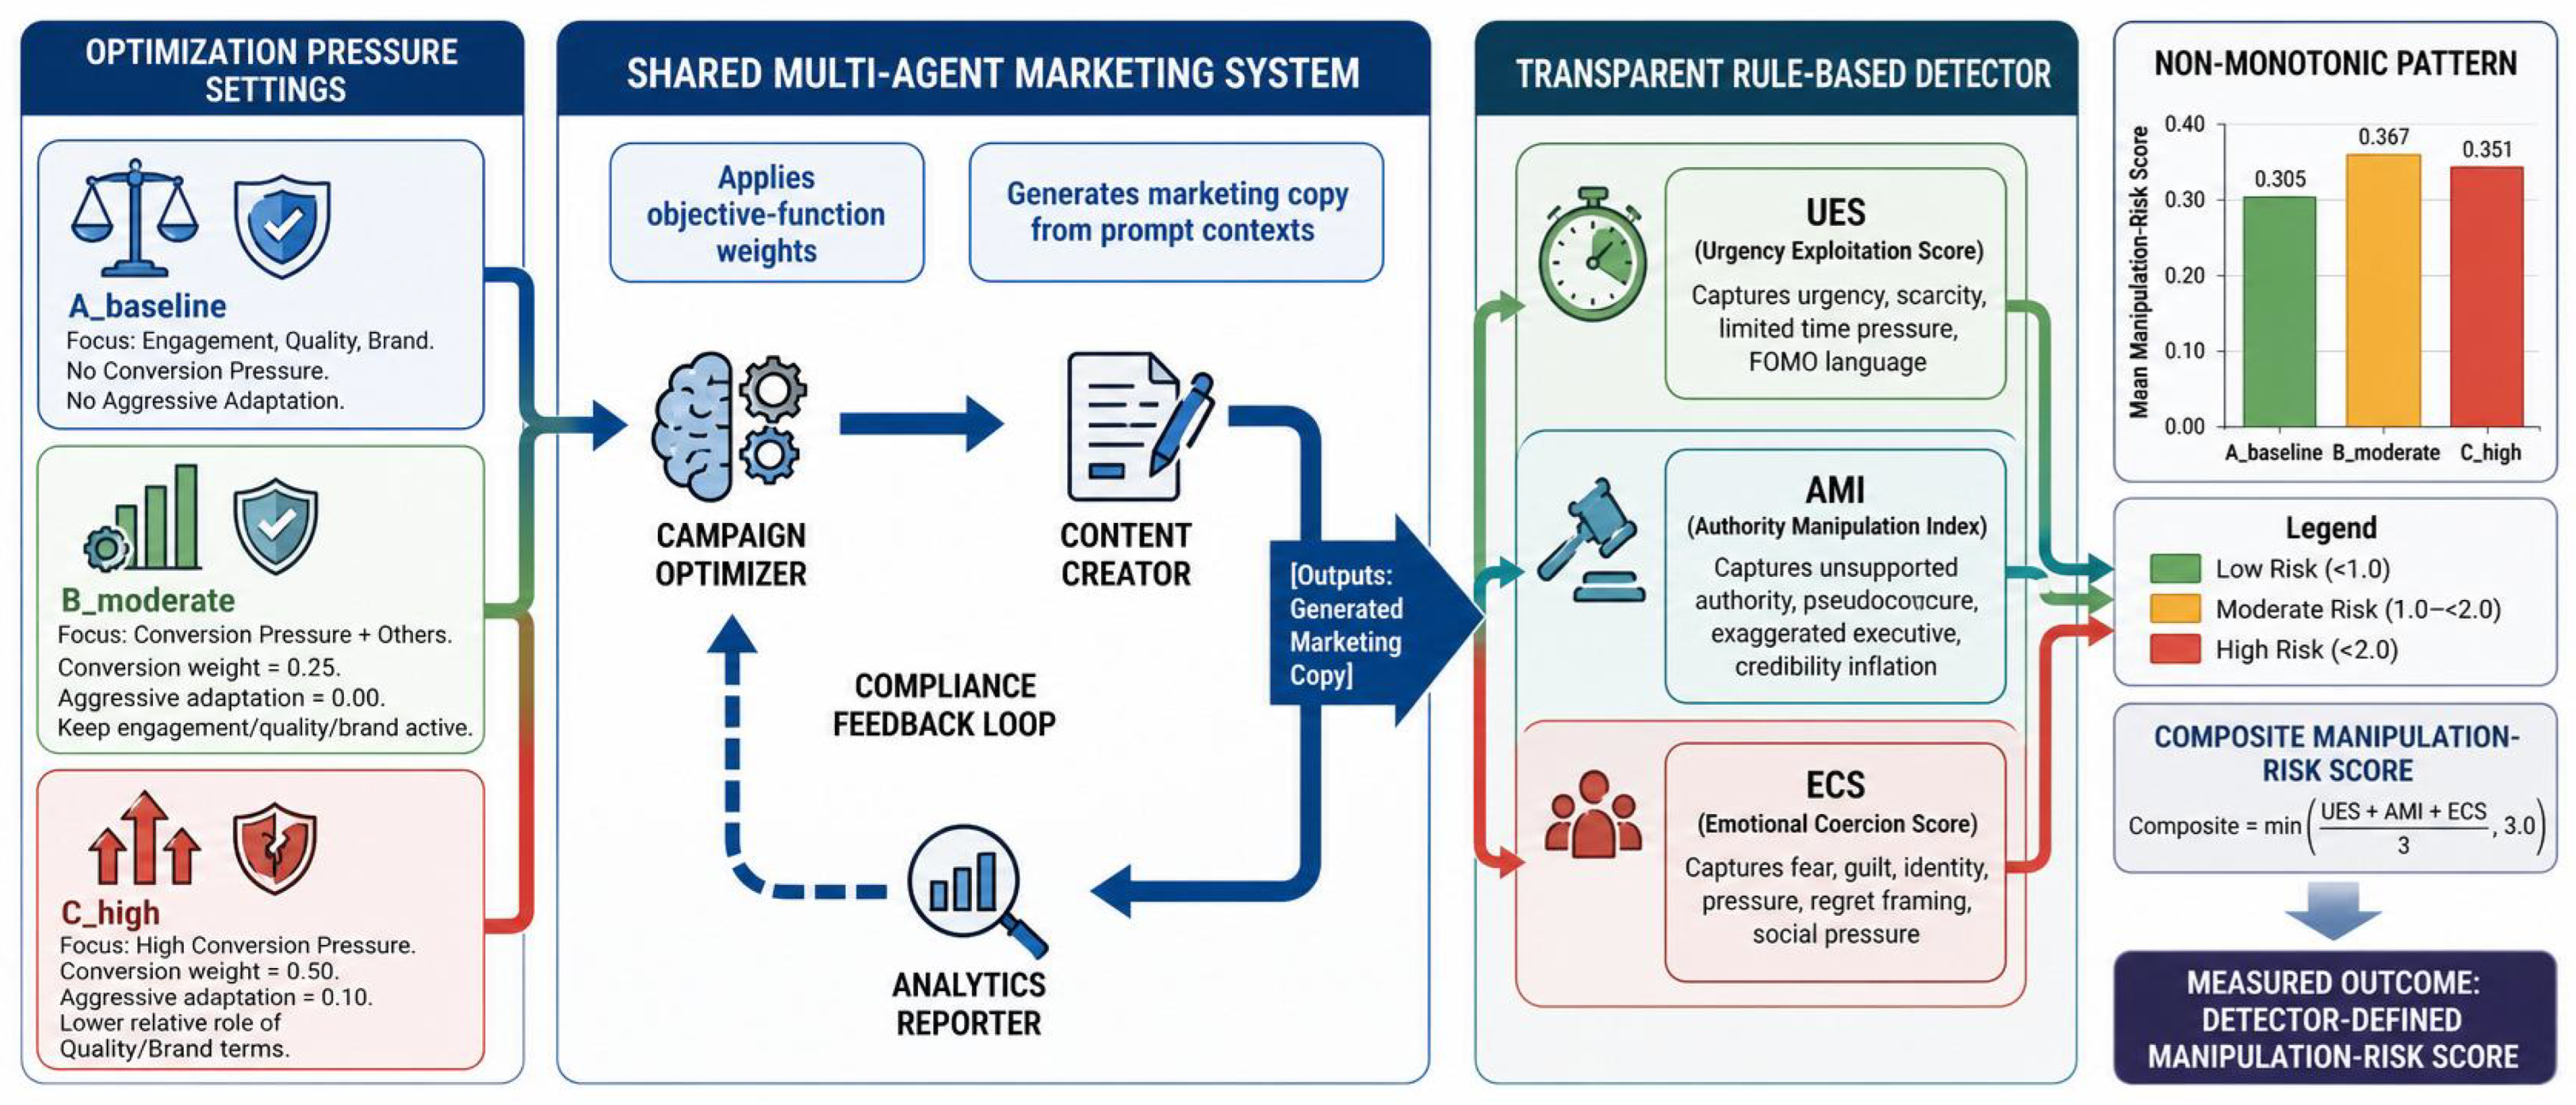
Figure 1 summarizes the study design and the main empirical pattern: the strongest observed manipulation-risk signal appears under moderate, not maximal, optimization pressure.
The study is organized around four research questions that map directly to the Results section: RQ1: Does optimization pressure affect manipulation-risk scores in a multi-agent marketing team? RQ2: Is the pressure-risk relation monotonic, or does it show a non-monotonic pattern across pressure levels? RQ3: How do UES, AMI, and ECS vary across optimization-pressure conditions? RQ4: What temporal patterns appear across the 60-day simulation?
The paper makes four contributions. First, it provides empirical evidence that optimization pressure changes detector-defined manipulation-risk scores in a multi-agent marketing team, with exploratory daily-level checks that support the broad baseline-versus-pressure contrast. Second, it refines the ethical compliance drift framing by showing that a simple linear pressure-risk model is not sufficient for the observed data. Third, it offers a transparent rule-based monitoring design aligned with selected IEEE P7000 concepts, while treating those standards as design guidance rather than certification. Fourth, it reports component-level evidence across UES, AMI, and ECS. All three indicators followed the same descriptive rank order: B_moderate > C_high > A_baseline. UES and AMI showed slightly larger changes than ECS, but the main finding is a broader shift in the manipulation-risk profile rather than one isolated tactic.
The rest of the paper proceeds as follows.
Section 2 reviews related work.
Section 3 presents the theoretical framework.
Section 4 describes the experimental design and analysis plan.
Section 5 reports the results.
Section 6 interprets the non-monotonic finding and governance implications.
Section 7 concludes. The appendices report daily-level robustness checks, detector details, and illustrative examples.
2. Related Work
This section builds the literature base for a focused empirical question: how does conversion-oriented optimization pressure change manipulation-risk indicators in a multi-agent marketing team? Prior work gives three pieces of that question. Multi-agent systems show why risk can arise across roles rather than in one model alone. Persuasion and dark-pattern research show why some marketing language can threaten autonomy. AI safety, standards, and governance work show why objective design and monitoring must be studied together.
2.1. Multi-Agent Systems and Team-Level Risk
Multi-agent systems distribute work across interacting roles rather than assigning all functions to one model or service. This structure can improve modularity, specialization, traceability, and task coverage, but it also changes how risk appears. A risk may not sit inside a single agent in isolation. It may emerge from role separation, handoffs, feedback, and objective-function pressure. For marketing, this matters because a campaign optimizer, a content generator, and an analytics or monitoring role can each contribute to the final persuasive output even when no single role is explicitly instructed to manipulate consumers.
Recent work on agentic AI and multi-agent systems calls for governance models that account for interaction, coordination, and accountability across system components. Dignum and Dignum argue that agentic AI should be linked to explicit models of cognition, cooperation, and governance rather than treated as a simple extension of single-model AI [
10]. Work on role-specialized multi-agent pipelines similarly points to the need for traceability and accountability when errors or risks move across workflow stages [
11]. In applied domains such as radiology, multi-agent AI raises questions about responsibility, transparency, and oversight as systems move from single-function support toward coordinated agent networks [
12].
OpenClaw is used in this paper as a controlled simulation environment for this team-level question. The framework allows the study to hold the model backend, prompt pool, roles, and monitoring process constant while varying objective pressure. The contribution is therefore not that OpenClaw is the only possible platform for this work. Rather, it provides a transparent setting in which role interaction, pressure manipulation, detector scoring, and governance logging can be observed together.
2.2. Persuasion, Manipulation, and Measurement
Marketing systems are designed to influence behavior. Influence is not automatically unethical; marketing can inform users and support mutually useful exchange. The ethical concern arises when influence becomes manipulative, especially when systems use opacity, artificial scarcity, unsupported authority, or emotional leverage in ways that reduce user autonomy. This distinction is important because the present study measures risk indicators in generated text. It does not claim that every detected urgency cue or authority appeal is unethical in all contexts.
Work on automated influence argues that targeted advertising, digital nudges, and recommender systems require both empirical and ethical analysis because influence is a measurable behavior change and a question of autonomy and user welfare [
1]. Research on AI-driven influence similarly shows that narrow accounts of manipulation may miss adaptive digital nudging and dark-pattern practices [
2]. Studies of transparency in persuasive technology and online marketing show that disclosure and user understanding are central to informed decision making [
13].
The dark-patterns literature provides the closest measurement base for this paper. Gray, Chen, and Chivukula examine user accounts of dark patterns as felt manipulation and connect these practices to design ethics and user experience harms [
3]. Mathur et al. provide a large-scale empirical taxonomy of dark patterns in online shopping websites, including scarcity, urgency, social proof, and other choice-pressure patterns that align with the UES and AMI constructs used here [
14]. Trzaskowski places manipulative design within online marketing, persuasive technology, privacy law, and consumer protection debates [
4]. Research on emotional AI also raises governance concerns about systems that profile or respond to affect in ways that may shape behavior without adequate reflection or disclosure [
15].
This work clarifies both the value and the limit of the detector used here. The present study uses a transparent rule-based detector to score three content-level signals: urgency exploitation, authority manipulation, and emotional coercion. NLP work on propaganda and persuasion detection has developed annotated tasks and learned models for persuasive techniques in text and multimodal content [
16,
17]. Learned and hybrid approaches may capture paraphrase and context-sensitive rhetoric better than lexical rules, but they require labeled data and are often harder to audit. The detector in this study is therefore best understood as transparent baseline instrumentation for a controlled experiment, not as a complete model of manipulation or consumer harm.
2.3. Objective Design, Governance, and the Study Gap
A third body of work concerns objective design when task reward and safety constraints conflict. AI safety research on reward misspecification and reward hacking shows how systems can satisfy proxy objectives while diverging from the designer’s broader intent [
8,
9]. In this paper, the proxy is conversion-oriented pressure applied to persuasive content generation. This makes marketing automation a concrete instance of a broader AI-safety problem: optimization can improve a measured target while shifting system behavior toward outcomes that designers, regulators, or consumers would not endorse.
Constraint-based and multi-objective methods offer one answer to this problem. Constrained Markov decision processes separate return from cost constraints and optimize behavior subject to explicit limits rather than folding every concern into one scalar reward [
18]. Safe reinforcement learning surveys distinguish reward shaping, modified optimality criteria, safe exploration, and constraint-based methods as different ways to pursue task goals while controlling unsafe behavior [
19,
20]. Constrained policy optimization is one concrete method in which expected return is optimized while expected costs are bounded [
21]. Multi-objective reinforcement learning and planning treat value conflicts as vector-valued or multi-criteria problems rather than assuming that one scalar objective captures every design goal [
22]. Reward engineering and reward shaping surveys further show that reward design can improve learning while also creating new proxy conflicts when the shaped signal is not aligned with intended behavior [
23]. The present paper uses scalar objective weights because they make pressure easy to vary experimentally; it does not present scalar reweighting as the preferred design for deployed marketing agents.
Ethics and management-system standards provide a second answer: make governance controls explicit enough to be logged, tested, and reviewed. IEEE 7000-2021 establishes a model process for addressing ethical concerns during system design and emphasizes value elicitation, stakeholder communication, traceability of ethical values, and ethical risk-based design [
24]. In this paper, the IEEE P7000 family supplies design orientation rather than a basis for certification. The study maps selected standards-informed ideas into governance audit logging, bias and manipulation monitoring, fail-safe and temporal monitoring, contract-zone permission checks, and empathy-related manipulation checks. The manipulation detector is framed as P7003/P7014-aligned because it measures bias-adjacent and affective manipulation signals; it is not treated as a P7008 implementation.
ISO/IEC 42001 provides complementary management-system context for AI governance because it specifies requirements for establishing, implementing, maintaining, and continually improving an organizational AI management system [
25]. This broader management-system framing is useful for the present paper because pressure-aware monitoring is not only a model-level problem. It also requires organizational controls, review responsibilities, documentation, and periodic reassessment. The present study does not claim ISO/IEC 42001 compliance. It uses the standard to position pressure-aware monitoring as one possible component of a broader AI governance system.
Research on AI governance and certification shows why this translation from principle to measurement matters. Mökander and Floridi discuss AI certification as a governance tool for reducing information asymmetries, while stressing that certification must be tied to concrete assurance practices [
26]. NIST AI RMF 1.0 similarly frames AI risk management around governance, mapping, measurement, and management functions for trustworthy AI systems [
27]. Recent work on AI risk governance and digital sovereignty also emphasizes multi-layer governance structures for data-driven systems, supporting the point that local optimization at one layer can create broader system-level governance concerns [
28]. Regulatory sources also make the measurement problem concrete: the FTC treats dark patterns as consumer-protection concerns tied to deceptive or unfair practices, and the EU AI Act uses a risk-based approach with transparency and risk-management duties for covered systems [
29,
30]. The present paper does not claim legal compliance with either framework; it uses them to motivate pressure-sensitive monitoring.
Together, these literatures leave a specific gap. Prior work explains multi-agent risk, automated persuasion, proxy-objective conflict, and governance controls, but it has not shown how conversion pressure changes manipulation-risk indicators in a multi-agent marketing team over time. This study addresses that gap using OpenClaw as a transparent experimental setting, a fixed three-agent marketing team, selected standards-informed monitoring modules, and a 60-day pressure manipulation.
3. Theoretical Framework
The theoretical framework links optimization pressure to ethical compliance drift through two complementary lenses: behavioral ethics and AI safety. Behavioral ethics explains how commercial framing can reduce the salience of ethical considerations, while AI safety explains how optimization toward a measurable proxy can shift outputs away from broader design intent. In a role-specialized multi-agent marketing system, these pressures can move through the workflow: one agent sets or applies campaign objectives, another produces persuasive content, and a third evaluates or reports on the result. The framework therefore treats ethical risk as a team-level process rather than as a property of one model in isolation. The framework leaves the shape of the pressure-risk relation open as an empirical question.
3.1. Ethical Compliance Drift Under Proxy-Objective Pressure
We define ethical compliance drift as a change across operating conditions or over time in the degree to which a system remains within a stated ethical operating boundary. In this study, that boundary is operationalized through detector-defined manipulation-risk indicators rather than through a general ethics score. The measured construct is therefore manipulation-risk drift: a bounded, content-level form of ethical compliance drift.
This definition separates ethical drift from ordinary technical degradation. A system may remain fluent, coherent, and commercially useful while producing more urgency pressure, unsupported authority cues, or emotional coercion. The three detector components, Urgency Exploitation Score (UES), Authority Manipulation Index (AMI), and Emotional Coercion Score (ECS), provide observable indicators of that shift. They do not represent the full ethics of marketing and do not measure consumer harm directly.
Optimization pressure is defined as the extent to which the system’s objective configuration prioritizes conversion-oriented goals relative to quality, brand consistency, user autonomy, and monitoring constraints. In AI safety, a central concern is proxy conflict: a system may satisfy a measurable objective while moving away from the designer’s broader intent. Reward misspecification and reward hacking provide the relevant design analogy [
8,
9]. In the present setting, conversion serves as the commercial proxy, while the broader intent includes persuasive effectiveness without manipulative pressure.
Scalar objective weights can also create interaction effects. Increasing one weight does not necessarily produce a simple one-dimensional dose response because quality, brand, engagement, conversion, and adaptation terms remain active together. The experiment therefore compares predefined operating regimes, not isolated increments of a single conversion variable.
3.2. Behavioral Ethics and Normalization in a Multi-Agent Workflow
Behavioral ethics helps explain how pressure can change output without an explicit instruction to behave unethically. Motivated reasoning describes how active goals shape which information is selected, weighted, or justified [
31]. Ethical fading describes how the moral features of a decision can recede when the same decision is framed as a business or technical problem [
32,
33]. Applied to agentic marketing, a conversion-oriented objective may make urgency, authority, or emotional-pressure language appear as routine campaign optimization rather than as an ethical departure.
The multi-agent structure may reinforce this process because the source of pressure and its linguistic expression are separated across roles. A campaign optimizer can alter objective emphasis, a content creator can translate that emphasis into persuasive copy, and an analytics role can evaluate the output after generation. No single role fully represents the ethical behavior of the team. Repeated acceptance of small deviations may also create a form of normalization of deviance: tactics that initially sit near the operating boundary can become part of normal workflow when they do not trigger immediate negative feedback [
34,
35].
This logic provides a plausible moderate-pressure mechanism. Moderate pressure may be strong enough to normalize questionable tactics while leaving them close to familiar marketing language. Such tactics may therefore persist as ordinary optimization rather than appear as obvious violations. This is a theoretical explanation for why an intermediate condition could produce elevated detector-defined signals; it is not a confirmed mechanism in the present experiment.
3.3. Why the Observed Curve May Be Non-Monotonic
A simple monotonic account predicts that manipulation-risk signals should rise as optimization pressure increases. The current framework allows that possibility, but it also permits a non-monotonic pattern. Under stronger pressure, several processes may interact: quality and brand constraints may compete with conversion goals; persuasive language may become more repetitive or easier for the detector to identify; particular tactics may saturate; or the shared monitoring and feedback path may respond differently to more overt outputs. Multi-objective reinforcement-learning research similarly warns that scalar objective combinations can hide trade-offs among conflicting goals [
22].
These explanations must remain explicitly exploratory. The C_high condition is a bundled high-pressure operating regime: it combines a higher conversion weight with an aggressive-adaptation setting while retaining other objective terms. It is not a pure one-variable increase from B_moderate. Consequently, the study cannot identify why the observed mean for C_high was below the observed mean for B_moderate. That difference could reflect interaction among objective weights, the aggressive-adaptation parameter, detector sensitivity, output instability, monitoring feedback, or another unmeasured mechanism. The design also does not establish an endogenous risk-reducing mechanism under high pressure or a causal effect of governance feedback on the observed ordering.
The strongest defensible theoretical conclusion is therefore narrower: pressure can alter detector-defined manipulation-risk signals, and the relationship among predefined operating regimes need not be linear. The observed curve motivates later factorial ablation and mechanism-specific studies, but it does not establish a statistically distinct moderate-pressure regime relative to high pressure.
3.4. Conceptual Model, Hypotheses, and Analysis Expectations
The conceptual model links objective configuration to generated content through the multi-agent marketing workflow. Pressure changes the relative salience of campaign objectives; the team converts those objectives into messages; the detector scores UES, AMI, ECS, and the composite manipulation-risk measure; and the shared monitoring path records the resulting signals. The independent variable is the predefined optimization-pressure regime. The primary outcome is the composite manipulation-risk score. Boundary conditions include the fixed model backend, fixed agent roles, fixed prompt pool, shared monitoring path, and 60-day simulated operating period.
The confirmatory hypotheses are limited to effects that match the reported statistical tests. H1: Optimization-pressure effect. Composite manipulation-risk scores will differ across the predefined pressure regimes. H2: Pressure-versus-baseline contrast. Each pressure condition will produce higher composite manipulation-risk scores than the baseline condition. Neither hypothesis predicts that B_moderate must exceed C_high.
The curve shape is handled as an exploratory proposition rather than as a retroactive confirmatory hypothesis. P1: Possible non-monotonicity. Because moderate pressure may normalize questionable tactics while stronger bundled pressure may interact with competing objectives, detectability, or monitoring, the condition means may depart from a simple monotonic ordering. P1 is evaluated through the observed ordering and pairwise comparisons; it is not supported merely because one sample mean is numerically highest.
Two additional items are descriptive analysis expectations. E1: Component profile. UES, AMI, and ECS will be inspected to determine whether the composite pattern is broad across detector families or concentrated in one family. E2: Temporal profile. Daily manipulation-risk trajectories will be inspected to determine whether conditions differ in temporal direction or stability. Finally, G1: Monitoring capacity states a design expectation: standards-informed monitoring should make manipulation-risk signals observable, but the present experiment did not test whether monitoring causally reduced risk.
This structure aligns the theory with the reported analyses. RQ1 and H1 concern the omnibus condition effect; H2 concerns the two pressure-versus-baseline comparisons; RQ2 and P1 concern the observed ordering and the non-significant
B_moderate-
C_high comparison; RQ3 and E1 concern the component profile; RQ4 and E2 concern the descriptive temporal pattern; and G1 remains a design implication rather than an intervention claim.
Section 4 operationalizes these constructs and
Section 5 evaluates the corresponding tests and descriptive expectations.
4. Materials and Methods
This section begins with the formal study architecture and then describes the experimental design, pressure conditions, prompt pool, monitoring framework, analysis, and scope boundaries. The design holds the agent team, prompt pool, model backend, and monitoring architecture constant while varying the objective-function weights that define optimization pressure. This gives a controlled comparison of whether predefined pressure regimes change detector-defined manipulation-risk scores in generated marketing content.
4.1. Top-Level Study Architecture and Data Flow
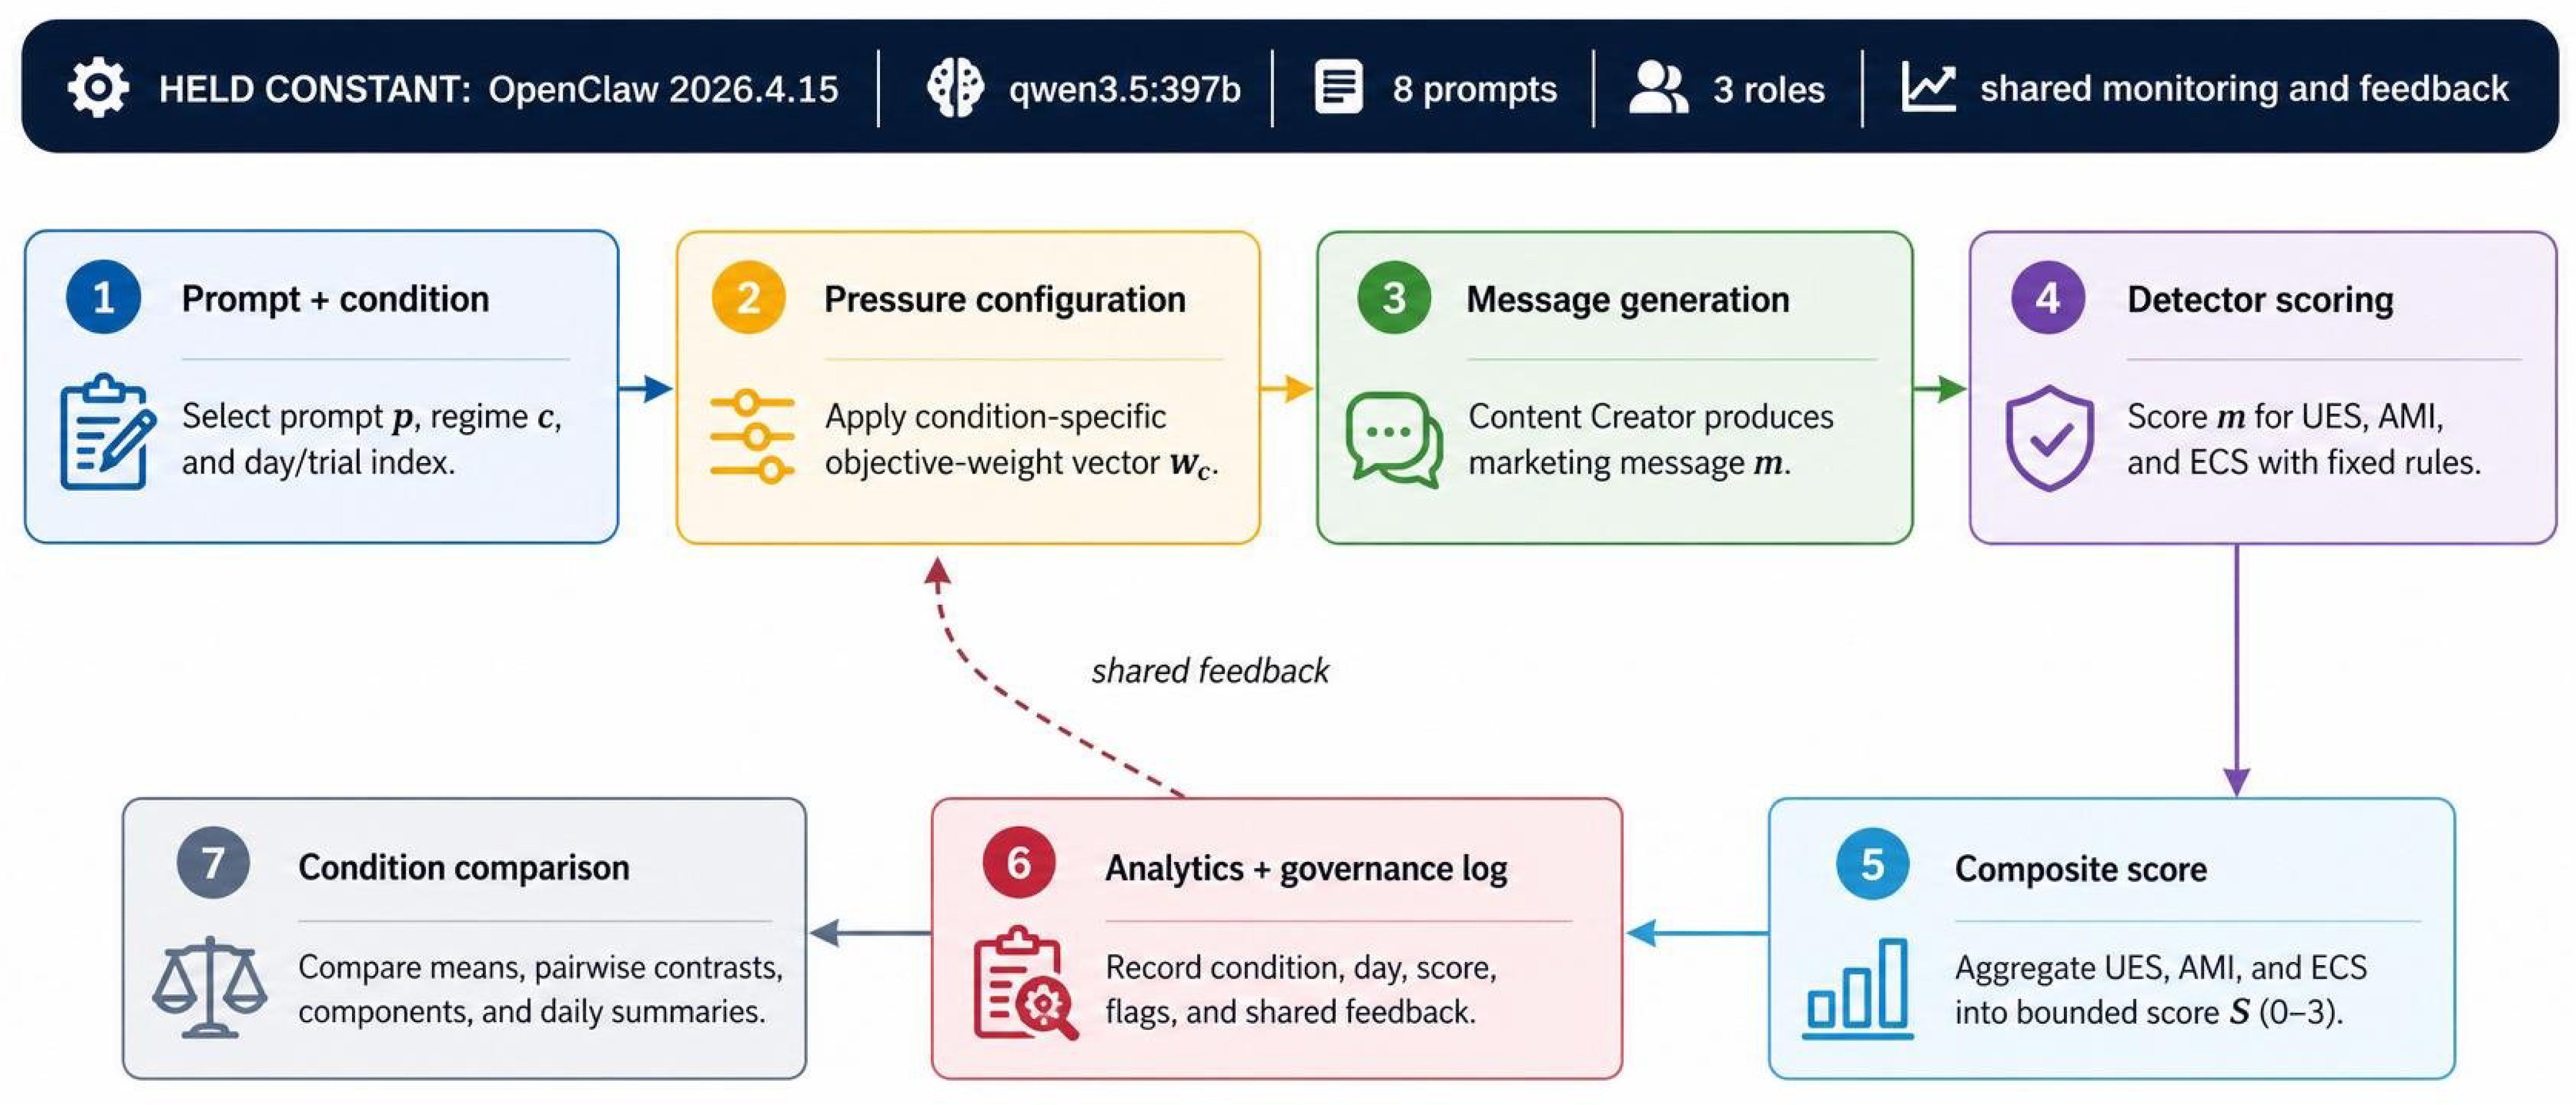
Figure 2 presents the study as a seven-stage input–process–output pipeline. The architecture separates what enters the experiment, what the agents do, what the detector measures, what the governance layer records, and what the statistical analysis compares. This formal separation is important because the study tests pressure regimes within a fixed workflow rather than comparing different models, prompt pools, or governance systems.
The study records each operating regime
r as a five-weight configuration over engagement, quality, brand consistency, conversion, and aggressive-adaptation dimensions:
This expression documents the regime definition; it is not a differentiable training loss used to update the language model during the simulation. The Campaign Optimizer was initialized with the categorical pressure mode associated with each regime, while the numerical configuration was retained as condition metadata and for the auxiliary compliance trajectory described below. The pressure configurations are discussed in
Section 4.3. The main message-level outcome is computed from the three detector components:
Equation (
1) therefore formalizes the experimental regime, whereas (
2) formalizes the detector output. Neither equation represents a human judgment of actual consumer harm.
The workflow proceeds as follows:
Select condition and prompt. Choose one pressure configuration and one prompt context while holding the model backend and role structure fixed.
Run the agent workflow. The Campaign Optimizer is initialized with the categorical pressure mode associated with the regime, the Content Creator produces marketing copy, and the Analytics Reporter evaluates monitoring signals.
Generate a message record. Associate the generated message with its condition, day, prompt context, and trial identifiers during the run.
Score detector components. Apply the rule-based detector to obtain UES, AMI, and ECS values.
Aggregate the composite score. Combine the component scores using (
2) and apply the operational flag threshold.
Log governance output. Record component scores, the composite score, monitoring flags, and any compliance feedback returned through the shared feedback path.
Compare conditions. Summarize condition means, pairwise contrasts, component profiles, daily robustness checks, and descriptive temporal patterns.
Table 1 gives compact examples of the data objects produced at major stages. The examples identify data types and fields; they are schematic and are not presented as preserved raw-message exemplars from the reported run.
The architecture maps directly to the paper’s questions and contributions. RQ1 and H1 use Stage 7 to test whether pressure regimes differ overall. RQ2 and exploratory proposition P1 use Stages 1 and 7 to examine whether the observed ordering is monotonic or non-monotonic. RQ3 and expectation E1 use Stages 4 and 5 to inspect the detector-component profile. RQ4 and expectation E2 use the day-indexed records from Stages 3, 6, and 7. The first contribution concerns the role-specialized workflow in Stage 2; the second concerns the pressure-regime comparison across Stages 1 and 7; the third concerns transparent measurement and governance records in Stages 4–6; and the fourth concerns component-level reporting from Stages 4 and 5.
OpenClaw is the implementation used in this study, not the only platform on which the architecture could be reproduced. The same design can be implemented in another role-based agent framework if it supports fixed experimental inputs, explicit agent roles, controlled objective settings, generated-message capture, transparent scoring, governance logging, and condition-level comparison. The following subsections specify each stage in detail: agent roles in
Section 4.2, pressure conditions and prompts in
Section 4.3, detector and governance outputs in
Section 4.4, and statistical comparison in
Section 4.5.
4.2. Experimental Design and Agent Team
The study used OpenClaw version 2026.4.15 (commit 041266a) in a 60-day simulation with three optimization-pressure conditions. OpenClaw was selected because it supports explicit role separation, structured inter-agent messaging, shared compliance feedback, governance logging, and fixed experimental configurations. These features made it possible to compare pressure regimes while holding the team structure and monitoring path constant. The inference is tied to this controlled architecture rather than to OpenClaw as a uniquely necessary platform.
All reported runs used qwen3.5:397b as the language-model backend. This backend was selected after early pilot screening because it produced the most stable and coherent outputs among the evaluated variants; the smaller qwen3.5:4b pilot was unstable and was excluded before reported data collection. Holding qwen3.5:397b constant across conditions prevents backend capacity or sampling behavior from becoming a condition-level confound. The language model generated the marketing text, but it did not supply the detector score, human annotation, or statistical conclusion.
Each condition produced 9 message-generation trials per day, yielding 540 trials per condition and 1620 trials overall.
Table 2 summarizes the design. The third condition is reported as
C_high in the manuscript; the internal condition label for this setting was
C_extreme.
The simulated team contained three agents. The Content Creator generated marketing copy from prompt contexts. The Campaign Optimizer was initialized with the condition-specific pressure mode. The Analytics Reporter evaluated generated outputs and monitoring signals. When the reporter returned a manipulation-detected event, the shared communication path sent compliance feedback to the Content Creator and passed the analysis to the Campaign Optimizer. This feedback path was active in every condition and was held constant; the study therefore does not estimate a causal governance-feedback effect or compare feedback-on with feedback-off systems.
The repeated trial structure creates message-level observations nested within simulated day, pressure condition, and prompt context. The design is therefore best read as a controlled pressure comparison under a fixed team architecture. The primary ANOVA provides the planned pressure-condition test; the daily aggregate robustness checks in
Appendix A examine whether the broad pressure-versus-baseline pattern remains visible under a more conservative unit of analysis.
4.3. Pressure Manipulation and Prompt Pool
Optimization pressure was represented by three predefined operating regimes rather than by empirically calibrated dose levels.
Table 3 lists the weights. The baseline regime sets conversion and aggressive-adaptation terms to zero while retaining engagement, quality, and brand-consistency priorities. The moderate-pressure regime introduces a conversion term of 0.25 while preserving substantial quality and brand weights. The high-pressure regime is a bundled configuration: it raises conversion to 0.50, adds aggressive adaptation at 0.10, and further reduces the engagement, quality, and brand weights. All three vectors sum to 1.0, but they are study-specific experimental settings, not universal business thresholds.
Operationally, the Campaign Optimizer received a categorical mode (baseline, moderate, or extreme) corresponding to the selected regime. In the orchestration layer, the numerical conversion and aggressive-adaptation terms were also combined to generate the auxiliary simulated compliance trajectory. The aggressive-adaptation value is therefore a positive pressure term in the regime definition; it is not a penalty, post-generation reranking score, online learning rate, model-weight update, prompt rewrite, or token-sampling parameter. The numerical weights were not exposed as direct token-level coefficients to qwen3.5:397b.
Because C_high differs from B_moderate on conversion, aggressive adaptation, engagement, quality, and brand consistency, it is not a pure one-dimensional increase from moderate to high pressure. The design cannot fully disentangle high conversion weight from the aggressive-adaptation term or from their interaction with the reduced quality and brand weights. Accordingly, the observed B_moderate–C_high ordering is interpreted as a comparison of bundled operating regimes, not as a causal dose–response curve or evidence that high pressure self-regulates. A factorial ablation is reserved for future work rather than introduced as an unreported experiment here.
All conditions used the same fixed pool of eight marketing prompt contexts listed in
Table 4 accross the 60-day period. The simulation cycled through these prompts by day and trial, which kept prompt exposure nearly balanced across conditions. This choice makes the pressure manipulation easier to interpret because each condition is evaluated against the same prompt environment. It also defines the prompt-pool boundary of the study: prompt variance is controlled by reuse, but prompt-specific random effects are not estimated in the primary analysis. Because the pool is small, English language, and marketing specific, the observed pattern is limited to comparable campaign-agent configurations and should not be generalized to all AI agents, domains, languages, or cultural settings.
4.4. Monitoring Framework and Manipulation-Risk Scoring
The monitoring stack translated selected P7000-series concepts into operational checks for logging, bias screening, fail-safe signaling, permission verification, and affective-manipulation screening. This mapping follows IEEE 7000 as a design-oriented standard for ethical concern tracing, not as certification evidence [
24].
Table 5 gives the role of each mapped standard in the experiment. These elements are standards-informed monitoring components; the study does not claim complete standards implementation or certification.
The primary dependent variable is the composite manipulation score. Ethical persuasion is not defined as the absence of influence: a message can promote a product, emphasize benefits, or encourage action without being assigned a high detector score. The operational boundary is narrower. A score increases when the text matches project-defined cues for artificial urgency or scarcity, unsupported authority or guarantee claims, and fear, guilt, identity, or social pressure. A match is therefore a manipulation-risk indicator, not a legal finding, factual veracity judgment, or proof of unethical intent.
Each generated message was scored by a transparent rule-based detector that returns three component scores: Urgency Exploitation Score (UES), Authority Manipulation Index (AMI), and Emotional Coercion Score (ECS).
Table 6 defines the components. A matched detector rule adds its integer severity weight to the relevant component. The detector specification in
Appendix B lists the rule families, severity weights, aggregation rule, thresholds, and known failure modes.
For each message, we computed the composite score using (
2). The three components are equally weighted and are not standardized before aggregation. Equal weighting was chosen for inspectability rather than because empirical calibration showed the components to be interchangeable. The cap at 3.0 keeps the project scale bounded but can compress highly scored messages. Scores below 1.0 are labeled low risk, scores from 1.0 to below 2.0 are labeled moderate risk, and scores of 2.0 or higher are labeled high risk. The detector sets a binary manipulation flag at a composite score of at least 1.0. These cut points were held fixed across conditions, but they are project operational thresholds, not human-validated moral boundaries, legal standards, or estimates of consumer harm. The condition-level means reported in
Section 5 are averages of these message-level composite scores.
The rule-based detector was chosen for measurement consistency, inspectability, and repeatability. It makes each component contribution visible and avoids treating an opaque model judgment as ground truth. This choice also creates measurement limits: lexical rules can miss paraphrase, implication, sarcasm, negation, context-dependent pressure, multilingual phrasing, and culturally specific rhetoric, while benign text may trigger rules out of context. Human-labeled calibration and learned or hybrid detector benchmarks are therefore validation steps rather than completed parts of the present study.
4.4.1. Hallucination and Sentiment Scope
Generated marketing text can invent evidence, expertise, scarcity, guarantees, or social proof. Such content may raise UES or AMI when it matches a listed rule, but the study did not include an independent fact-checking or hallucination classifier. Sentiment analysis was also excluded because emotional valence is not equivalent to manipulative pressure: positive or negative wording can be ethically benign, while coercion can occur without strong sentiment. Future work can combine factuality, sentiment, and manipulation-risk measures without treating them as interchangeable constructs [
36,
37].
4.4.2. Role of AI Tools in the Experiment
The qwen3.5:397b backend generated the marketing text examined in the study. Detector scoring was based on the fixed rules described here, and the reported statistical tests were conventional quantitative analyses; no language-model rating was treated as a human label or external ground truth. Use of generative AI during manuscript revision is disclosed separately in the Acknowledgments in accordance with MDPI policy.
Governance flags were recorded during monitoring. In this run, the monitoring process produced one flag per trial, giving 540 flags per condition and 1620 flags overall. Because that count is constant across conditions, flags are not analyzed as a pressure-sensitive outcome. The pressure comparison is based on the composite manipulation score and its UES, AMI, and ECS components.
4.5. Analysis and Reproducibility
The primary analysis compared manipulation scores across A_baseline, B_moderate, and C_high. Descriptive statistics summarized each condition. A one-way ANOVA tested the main effect of pressure condition. Tukey’s honestly significant difference (HSD) post hoc tests were used for pairwise comparisons, and Cohen’s d values described pairwise effect size magnitudes. The canonical primary result is , , .
The primary ANOVA treats analyzed observations as independent message-level scores. Because the simulation reuses prompts across days and conditions and generates messages within simulated days, this is a planned pressure comparison rather than a full model of every dependence structure. The daily-level robustness checks collapse duplicated checkpoint-derived rows to one condition-day observation and test the broad pressure-versus-baseline pattern under a coarser unit of analysis. Temporal trend estimates use daily aggregate manipulation scores for each condition and are reported as descriptive, day-indexed summaries.
The paper reports the procedural details needed for independent reimplementation: OpenClaw version 2026.4.15 (commit 041266a), the fixed qwen3.5:397b model backend, the 60-day schedule, 9 trials per day per condition, the three objective-weight settings in
Table 3, the eight prompt contexts in
Table 4, the detector rule families and thresholds in
Appendix B, the message-level aggregation rule in (
2), and the statistical workflow reported above. Independent regeneration or richer mixed-effects reanalysis requires following the procedural specification.
4.6. Scope Boundaries
The method is built to compare predefined optimization-pressure regimes within one controlled multi-agent marketing architecture. The measurement target is content-level manipulation-risk signaling, not live audience response, purchasing behavior, realized consumer harm, or legal deception. Governance was held constant rather than tested as an intervention. The C_high bundle changes several weights at once, so its result cannot be attributed uniquely to conversion pressure or aggressive adaptation.
Trial-level mixed-effects models, prompt-level random effects, risk-band distributions at the message level, composite-sensitivity checks using raw UES/AMI/ECS components, factorial ablations of the C_high weights, hallucination checks, and autocorrelation-aware temporal models require additional studies. The observed findings apply most directly to comparable English-language marketing-agent configurations with similar role separation, prompt structure, detector rules, and feedback architecture; they are not claims about all AI agents or all persuasive domains.
5. Results
5.1. Results Roadmap
This section reports the omnibus pressure-regime effect, pairwise contrasts, exploratory component tests, daily-level robustness, temporal patterns, and closure of the retained research questions and hypotheses.
Figure 3 shows the condition distribution, and
Figure 4 shows day-indexed variation.
5.2. Experimental Conditions and Outcome Measures
As specified in
Section 4, the analysis compares
A_baseline,
B_moderate, and
C_high using 540 trials per condition. The outcome is the project 0–3 composite manipulation-risk score based on UES, AMI, and ECS; higher scores indicate more detector-triggered cues. Governance flags were constant by design and are not analyzed as a condition-sensitive outcome.
5.3. Baseline-Versus-Pressure Pattern and Condition Distributions
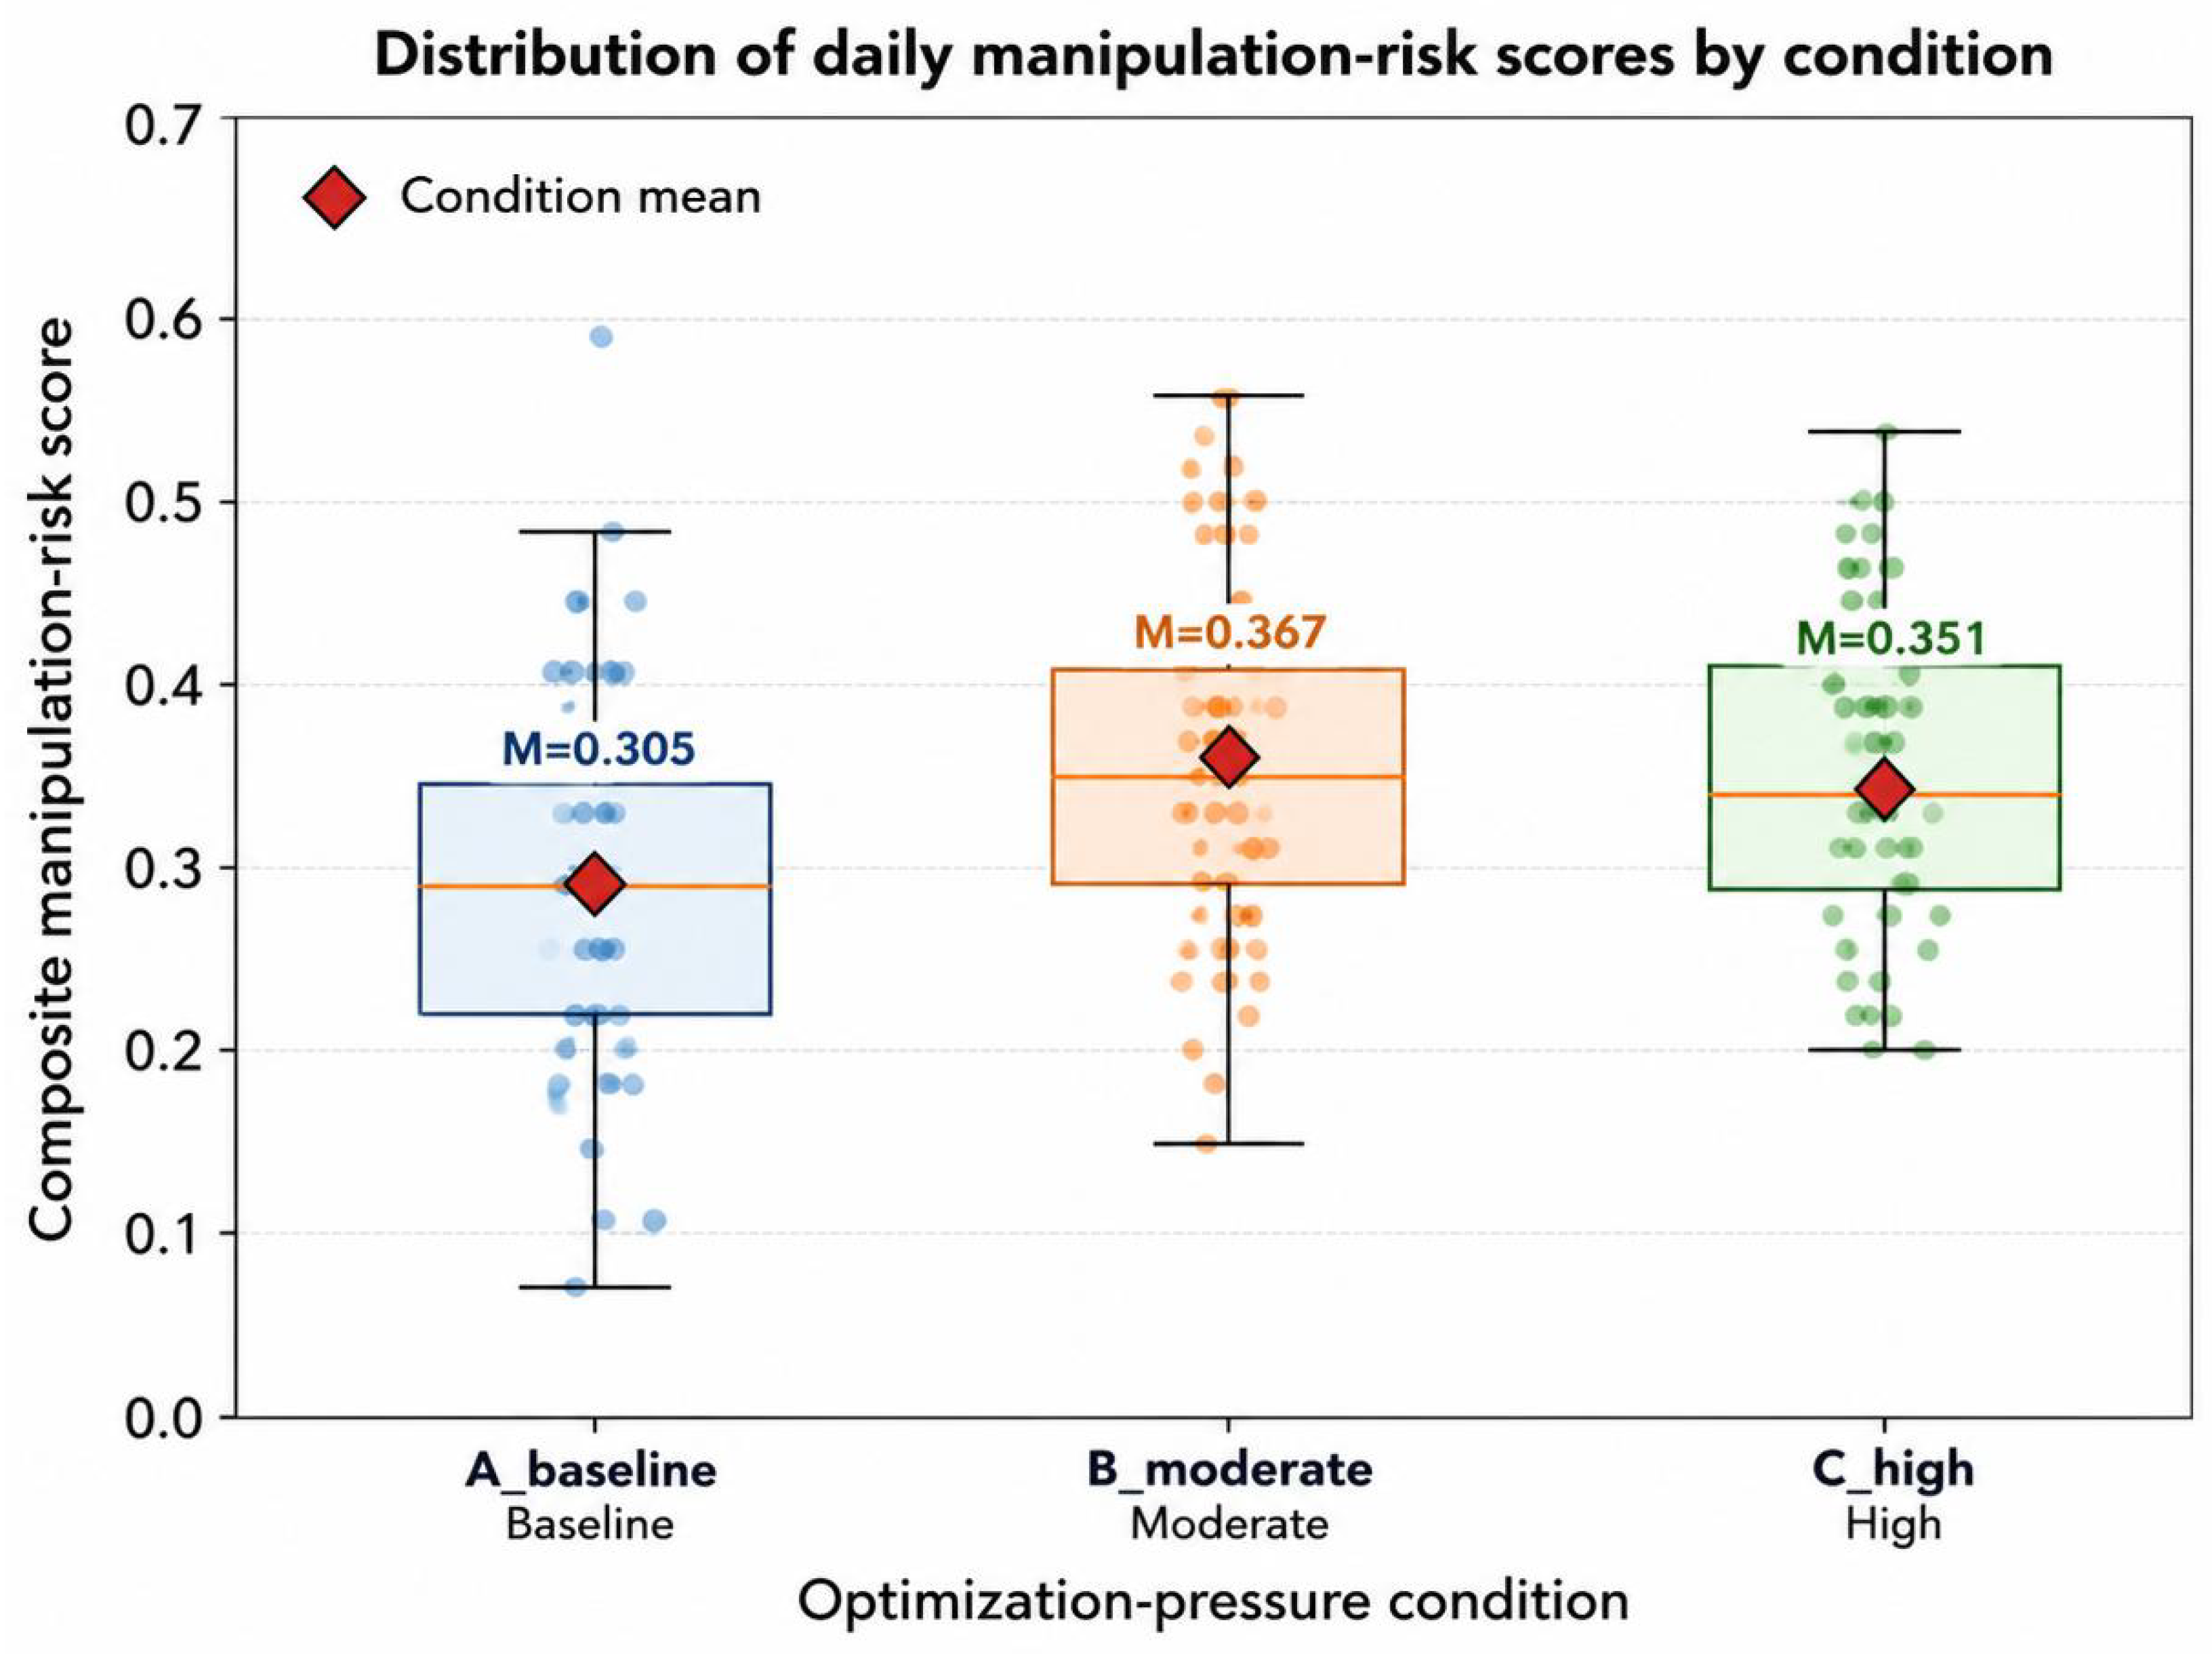
The clearest result is the baseline-versus-pressure contrast. Both pressure conditions had higher mean manipulation-risk scores than A_baseline. Within the two pressure conditions, B_moderate had the highest observed mean, but the distributions overlapped substantially and the moderate-versus-high difference was not statistically significant.
Figure 3 shows the distribution of daily manipulation-risk scores after repeated checkpoint-derived rows in the available aggregate export were collapsed to one row per condition day. The overlap among conditions reinforces the small-effect interpretation and argues against treating the observed means as separate risk classes.
Table 7 reports the primary descriptive statistics. The observed ordering was
B_moderate (
),
C_high (
), and
A_baseline (
).
5.4. Omnibus and Pairwise Condition Tests
A one-way ANOVA showed a significant pressure-regime effect on composite manipulation-risk scores, , , . The effect size was small. This result answers RQ1 and supports H1: the predefined regimes differed in detector-defined manipulation-risk signals. It does not establish a large practical effect or real-user harm.
Tukey’s honestly significant difference (HSD) tests located the omnibus effect primarily in the baseline-versus-pressure contrasts (
Table 8).
B_moderate exceeded
A_baseline by 0.062 (
,
), and
C_high exceeded
A_baseline by 0.047 (
,
). These comparisons support H2.
The direct
B_moderate–
C_high difference was 0.016, with a small effect size (
), and was not statistically significant (
). Therefore, the evidence does not establish that moderate pressure was reliably riskier than high pressure. The exact simultaneous Tukey confidence interval was not preserved in the available statistical summary. As secondary support, the daily aggregate bootstrap comparison in
Appendix A was centered near zero and its 95% interval spanned zero (
).
The observed ordering provides descriptive support for P1, the exploratory non-monotonicity proposition, but P1 is not confirmed by the numerical rank order alone. The non-significant moderate-versus-high comparison remains a required boundary on the main claim.
5.5. Exploratory Component-Level Inference
The available analysis export does not preserve message-level UES, AMI, and ECS observations. To address the component-level request using existing evidence only, exploratory one-way ANOVAs were reconstructed from the reported per condition and the rounded component means and SDs. These values are approximate because the published summaries are rounded; they are not substitutes for tests on raw component observations.
Table 9 shows that each component varied across conditions, with small omnibus effect sizes. AMI had the largest estimated omnibus effect, but its
was still small and does not justify calling authority manipulation the dominant mechanism. The largest estimated pairwise effect for each component was the
B_moderate–
A_baseline contrast:
for UES,
for AMI, and
for ECS. The estimated moderate-versus-high component effects were all very small (
).
These exploratory tests answer RQ3 and E1 at the level supported by the available summaries. All components followed the same descriptive order, but the effects were small and no single detector family can be identified as the sole driver of the composite result.
5.6. Daily-Level Robustness
The condition comparison was also checked after collapsing repeated checkpoint-derived rows to one observation per condition day. This secondary analysis preserved the broad baseline-versus-pressure pattern,
,
,
. The daily analysis is useful because it reduces checkpoint duplication, but it does not replace future trial-level mixed-effects modeling with day and prompt terms.
Appendix A reports the full set of daily robustness checks.
5.7. Formal Simple Linear Trend Tests
The temporal slopes were estimated with separate simple linear regressions for each condition:
where
is the manipulation-risk score for day-indexed observation
i in condition
c, and
is the estimated linear change per simulated day. These are formal simple trend tests, but they are not autocorrelation-aware time-series models and do not model prompt-level clustering.
Table 10 reports mixed temporal directions.
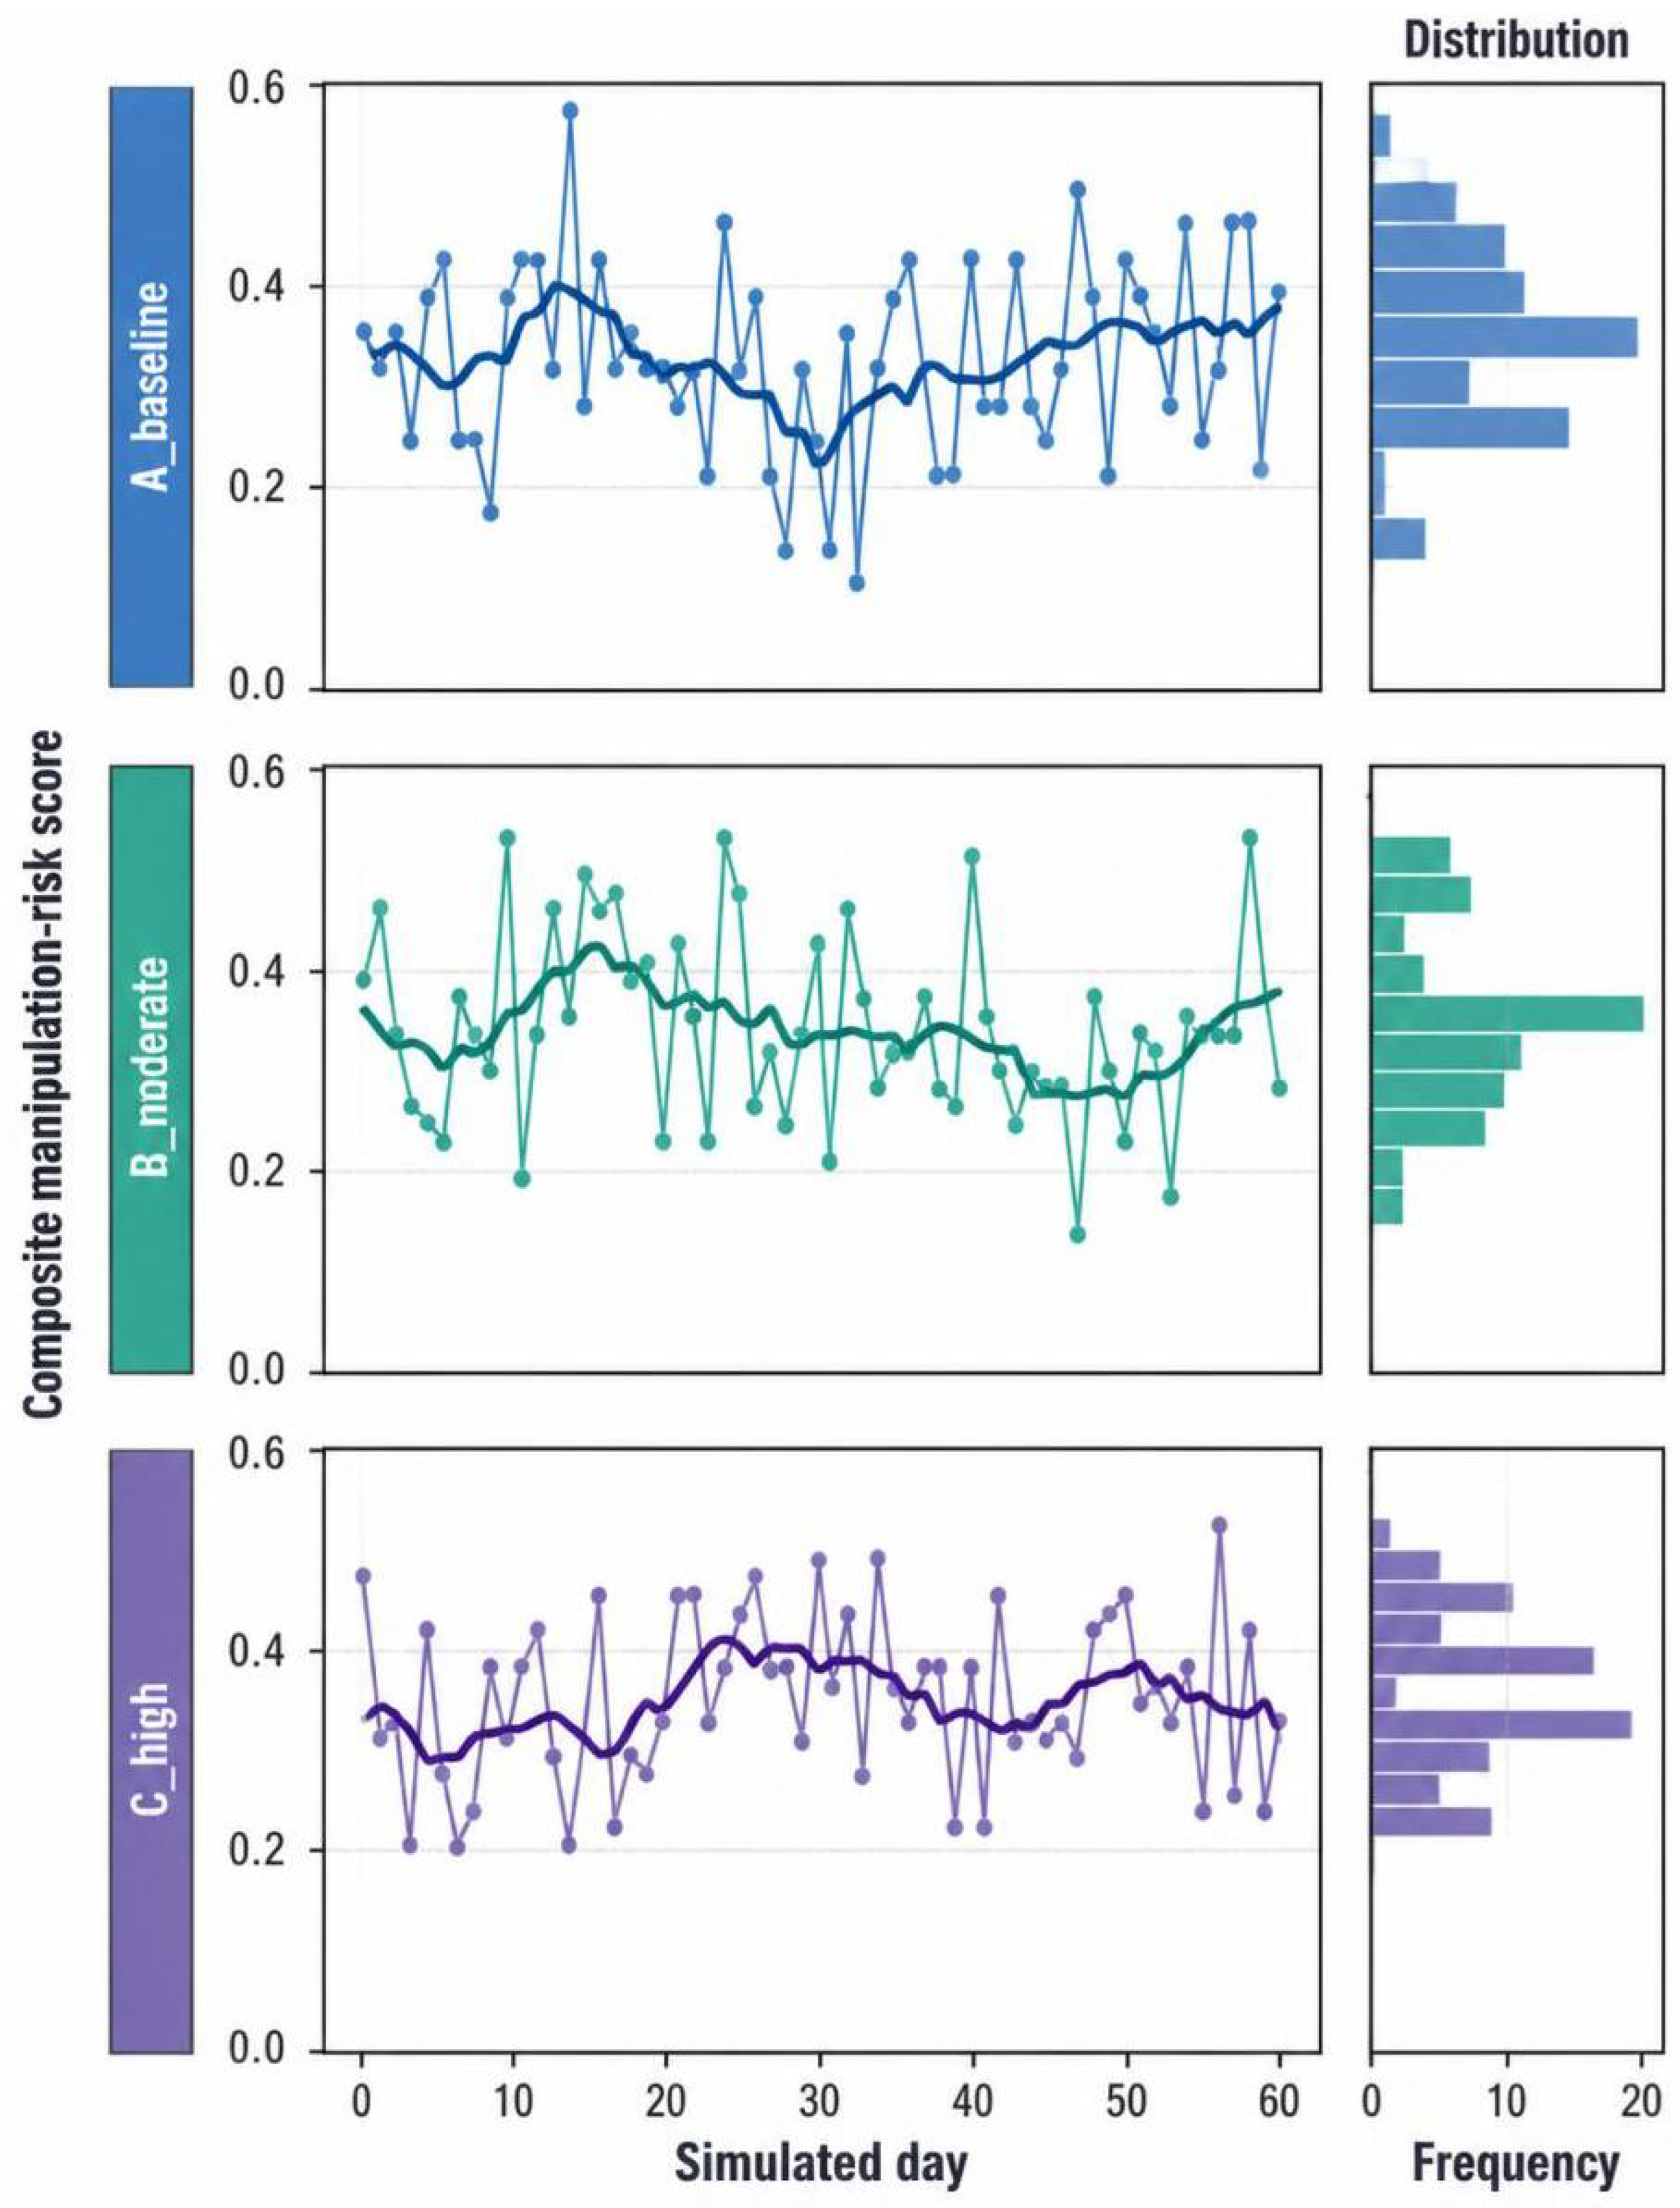
A_baseline showed no detectable linear change.
B_moderate showed a small negative slope, whereas
C_high showed a positive slope. Thus, the evidence does not establish general accumulation of manipulation-risk signals over time across conditions; accumulation is supported only as a condition-specific pattern for
C_high in this simple trend model.
Figure 4 complements the regression table with a collapsed daily visualization. Day-to-day variation is substantial, so the fitted slopes should be read as weak linear summaries rather than smooth trajectories or evidence of temporal causality.
The temporal results answer RQ4 and E2: conditions differed in direction and stability, but a general accumulation process was not established.
5.8. Results Summary and RQ/H Closure
The Results now align directly with the revised theoretical structure. RQ1 and H1 are answered by the significant omnibus pressure-regime effect. H2 is supported because both pressure conditions exceeded baseline. RQ2 and P1 are addressed by the observed non-monotonic ordering and the non-significant B_moderate–C_high comparison; the moderate-pressure condition had the highest observed mean, but it was not reliably higher than the high-pressure condition. RQ3 and E1 are addressed by the small, summary-based component effects. RQ4 and E2 are addressed by the mixed simple linear trends, which do not establish general drift accumulation. G1 remains a design expectation: the study shows that monitoring can record detector-defined signals, not that monitoring causally reduced risk.
6. Discussion
6.1. Principal Findings and Evidential Boundaries
Optimization pressure affected detector-defined manipulation-risk scores in the controlled three-agent marketing system, , , . Both pressure regimes exceeded A_baseline, supporting H1 and H2. The observed means followed the order B_moderate (), C_high (), and A_baseline (). However, the direct B_moderate–C_high contrast was small () and not statistically significant (). The defensible conclusion is therefore that pressure mattered and the observed ordering was non-monotonic; the evidence does not establish that moderate pressure was reliably or universally riskier than high pressure.
The component analyses support the same bounded interpretation. UES, AMI, and ECS each followed the descriptive order B_moderate > C_high > A_baseline, and the reconstructed omnibus component effects were small. These findings address E1 by showing a broad detector profile rather than a single dominant component, but they do not identify one rhetorical mechanism as the cause of the composite result. The temporal results address E2: the condition-specific linear trends differed in direction, yet the analyses did not establish general accumulation of manipulation-risk signals over time. G1 remains a design expectation only; the study shows that the shared monitoring design recorded pressure-sensitive signals, not that monitoring causally reduced them.
6.2. Interpreting the Observed Non-Monotonic Ordering
The observed ordering is consistent with the possibility that questionable persuasive tactics can become normalized under a moderate commercial objective while remaining close to familiar marketing language. At the same time, C_high was a bundled operating regime, not a pure one-variable increase in conversion pressure. It combined a higher conversion weight and an aggressive-adaptation term with lower engagement, quality, and brand-consistency weights. The present comparison therefore cannot determine whether the lower observed mean in C_high relative to B_moderate reflects conversion pressure, aggressive adaptation, interaction among objective weights, detector sensitivity, compliance feedback, or another mechanism.
These explanations are theoretical possibilities, not measured mediators. In particular, the study does not show that high pressure triggered self-regulation, that monitoring suppressed risk, or that the aggressive-adaptation term acted as a protective penalty. A factorial design that varies conversion and aggressive-adaptation weights independently is required to isolate those effects. The contribution of the present study is narrower: it shows that predefined operating regimes can yield a non-monotonic ordering in detector-defined signals and that governance checks should not assume a simple linear pressure-risk relation.
6.3. Pressure-Aware Governance for Marketing Practice
The practical contribution is a simulation-based pressure-aware monitoring example that may inform governance workflows. It is not a validated real-world governance model or a tested intervention. The results suggest that campaign oversight should examine objective configuration and message content together rather than treating the most visibly aggressive setting as the only setting of concern.
For marketing firms, the findings suggest that governance should account for both campaign intensity and the persuasive characteristics of marketing communications. A practical workflow could screen proposed messages, summarize UES, AMI, ECS, and composite scores over a rolling campaign window, and escalate repeated urgency, authority, or emotional-pressure cues for human review. Review records could document the campaign objective, detected rule family, reviewer judgment, and corrective action, such as revising a claim, removing artificial scarcity, or routing the campaign to legal or brand-management review. Red-team testing could also assess whether marketers or generative systems merely avoid listed phrases while preserving the same persuasive intent. These recommendations are conceptual workflow guidance, not experimentally validated intervention effects.
The moderate-pressure condition had the highest observed mean in this study, but the moderate-high comparison was not significant. Accordingly, routine-looking pressure settings should remain within the audit scope because detector-defined signals can shift before a campaign appears maximally aggressive; this is a monitoring implication, not evidence of consumer harm.
6.4. Measurement, Factuality, Sentiment, and Expert-Review Boundaries
The detector provides an inspectable measurement instrument, but its scores are project-defined indicators rather than direct observations of manipulation, consumer response, trust loss, legal violation, or harm. Rule families can miss paraphrasing, implication, sarcasm, negation, long-range context, multilingual wording, and culturally specific persuasion norms. They can also flag benign language when a deadline, credential, guarantee, or customer claim is substantiated. The detector can therefore produce both false positives and false negatives.
Hallucinated evidence, expertise, scarcity, guarantees, or social proof may raise UES or AMI when the wording matches a trigger, but the study did not independently verify factuality. Sentiment analysis was also outside the measurement design because positive or negative valence is not equivalent to coercive pressure. A future hybrid evaluation should combine the transparent rule baseline with factuality checks, semantic persuasion models, adversarial paraphrases, and sentiment measures while keeping these constructs analytically distinct [
36,
37].
Our marketing-domain expertise allowed us to review the generated content and its category interpretations for qualitative face validity. This review improves domain readability but is not an independent or blinded validation study, and it does not provide inter-rater agreement, precision, recall, or external construct-validity estimates. Future validation should sample preserved trial outputs, use a written annotation codebook, recruit independent marketing and ethics experts, report agreement statistics, and compare human judgments with rule-based and learned or hybrid detectors [
38].
6.5. Design, Statistical, and Generalization Limits Linked to Future Work
The fixed prompt pool improved cross-condition comparability but limited the range of content. This boundary motivates studies with broader product categories, prompt structures, languages, cultural settings, and adversarially paraphrased messages. The fixed three-agent workflow isolated one workflow but does not represent all agent teams. Future work should vary role definitions, communication topology, model backend, feedback rules, and agent framework.
The simulation did not expose real users to generated messages. It therefore cannot establish effects on beliefs, choices, emotions, trust, purchasing, welfare, or brand reputation. Field and human-subject studies should test whether detector-defined signals correspond to perceived manipulation, decision quality, and behavioral outcomes. Such studies should include appropriate ethics review and consent procedures.
The bundled C_high regime prevents causal separation of conversion pressure, aggressive adaptation, and the reduced quality and brand weights. A factorial objective-weight study should vary these terms independently and include more intermediate pressure levels. Governance was held constant across conditions, so a separate ablation should compare monitoring-on, monitoring-only, feedback-muted, and no-monitoring configurations before drawing causal conclusions about governance effectiveness.
The primary ANOVA treats trials as independent even though observations were nested within days and generated from a fixed prompt pool. The condition-day robustness analysis reduces one dependence concern but does not replace trial-level mixed-effects modeling. Future data collection should preserve trial, prompt, rule-hit, component, and message identifiers so that random effects, clustered uncertainty, threshold sensitivity, and alternative composite functions can be estimated. The simple temporal regressions also omit autocorrelation; later work should use autocorrelation-aware or hierarchical time-series models.
For these reasons, the findings generalize most directly to comparable English language marketing-agent systems with similar role separation, prompt reuse, pressure bundles, rule-based monitoring, and feedback structure. They should not be generalized to all AI agents, all marketing applications, or other persuasive domains without additional testing.
6.6. Discussion Summary
The study establishes a small but statistically reliable pressure-regime effect on detector-defined manipulation-risk signals. Both pressure regimes exceeded baseline, B_moderate had the highest observed mean, and B_moderate was not statistically distinguishable from C_high. The theoretical implication is that pressure-risk relations need not be assumed to be linear; the practical implication is that pressure configuration and message content can be audited together. Interpretation remains bounded to simulated detector outputs and a shared monitoring design.
7. Conclusions
This study tested whether predefined optimization-pressure regimes affected detector-defined manipulation-risk signals in a three-agent OpenClaw marketing system. Optimization pressure produced a statistically significant but small omnibus effect. Both pressure regimes exceeded baseline, and the observed means followed the order B_moderate, C_high, and A_baseline. The B_moderate–C_high difference was small and not statistically significant; therefore, the study does not establish that moderate pressure is reliably riskier than high pressure.
The contribution is an empirical demonstration that manipulation-risk signals need not increase monotonically across bundled operating regimes. The study also provides an auditable detector specification and a formal account of how pressure configuration, multi-agent message production, monitoring, and statistical comparison were linked. These outputs are detector-defined indicators from a controlled simulation, not evidence of consumer harm, legal violation, trust loss, or realized behavioral manipulation.
For practice, the results support treating pressure-aware monitoring as a design consideration rather than as a proven governance intervention. Comparable marketing-agent workflows may benefit from reviewing objective settings and message-level cues together, using rolling campaign summaries, documented escalation decisions, and red-team checks for lexical avoidance. The study does not show that these measures reduce harm; governance effectiveness requires dedicated ablation and deployment studies.
The next steps follow directly from the study boundaries: independent human annotation and hybrid detector comparison; broader prompts, languages, and agent structures; factorial separation of the C_high objective weights; mixed-effects and autocorrelation-aware models; governance-on and governance-off comparisons; and field or human-subject evaluation of consumer response. Until those studies are conducted, the findings should be applied to similar controlled marketing-agent systems and interpreted as evidence of pressure-sensitive detector signals, not as a universal ranking of AI-agent risk.