1. Introduction
Type 2 diabetes (T2D) is a prevalent chronic disease that affects millions of people worldwide and poses significant challenges to healthcare systems globally. Many guidelines [
1,
2,
3] suggest the use of metformin as the first-line treatment for T2D given its availability, low cost, and safety profile [
4,
5]. Subsequently, sodium-glucose cotransporter 2 inhibitors (SGLT2-i) and dipeptidyl peptidase-4 inhibitors (DPP4-i) are two prominent second-line treatment options for individuals with T2D, with both exhibiting comparable efficacy in lowering glucose levels [
6]. However, they offer distinct advantages. SGLT2-i are on average associated with weight loss, reduction in blood pressure, lower risk of hypoglycemia, and long-term cardiovascular benefits, whereas DPP4-i are weight-neutral, do not increase hypoglycemia risk, and are well tolerated and safe to use in patients with advanced renal disease [
7]. Therefore, identifying individuals who are more likely to experience a higher relative benefit from one drug class over another is important.
The current practice of a “one-size-fits-all” approach considers an average patient, neglecting the heterogeneity among patients, and failing to benefit everyone. In contrast, precision medicine aims to optimize healthcare quality by customizing the healthcare process to consider the unique characteristics of each individual [
8], including individual variability in genes, environment, and lifestyle. Recent studies have explored precision medicine approaches in T2D by modeling differential treatment responses [
9,
10,
11]. For example, Dennis et al. [
10] developed a treatment selection algorithm using routine clinical features to predict HbA1c response between SGLT2-i and DPP4-i therapies, while Venkatasubramaniam et al. [
11] compared statistical and machine learning approaches for individualized treatment selection. However, these studies primarily focus on HbA1c as a single outcome and rely on limited feature sets, without considering broader metabolic indicators or multi-dimensional treatment effects.
T2D is associated with multiple metabolic factors beyond glycemic control, including body mass index (BMI), low-density lipoprotein (LDL) cholesterol, and high-density lipoprotein (HDL) cholesterol [
12]. Overweight and obesity are common risk factors for T2D [
13], and T2D is also associated with changes in the amount of circulating lipids, including elevated triglycerides, increased LDL, and decreased HDL [
14]. Integrating these health parameters into treatment selection expands the range to consider additional factors, which could lead to more personalized and efficient strategies for managing T2D. An optimal treatment selection should account for individual characteristics and multiple effectiveness indicators, such as HbA1c, LDL cholesterol, HDL cholesterol, and BMI.
This study aims to develop an explainable artificial intelligence (XAI) multi-output model-based treatment selection method to identify the optimal treatment approach between DPP4-i and SGLT2-i for patients with T2D. The multi-output regression model simultaneously predicts four health indicator responses—HbA1c, LDL, HDL, and BMI—for two therapies using a single set of predictors. These predicted outcomes are used to evaluate treatment effectiveness at the individual level and are subsequently aggregated to derive a single treatment recommendation tailored to each patient’s health profile. This framework supports individualized decision-making and aims to improve the precision of diabetes management, while its explainability provides transparency into the factors influencing treatment selection.
This study makes several key contributions. First, we introduce a multi-output modeling framework that captures correlated responses across multiple outcomes, enabling a more comprehensive evaluation of treatment effects beyond single-outcome prediction. Second, we propose a dynamic trade-off resolution strategy that integrates these predictions into a single personalized recommendation based on individual patient profiles. Third, by incorporating SHAP-based explainability, the framework provides interpretable insights into the drivers of treatment decisions, supporting clinically actionable decision-making.
2. Materials and Methods
2.1. Study Design and Dataset
Patients diagnosed with T2D by the end of 2021 were identified with ICD-10 code E11 from the regional electronic health records (EHR) of The Joint Municipal Authority for North Karelia Social and Health Services—Siun sote, Finland. The collected information included patient-level records from both primary and specialized healthcare, including diagnostic and laboratory data spanning from 2012 to 2022. Additionally, medication prescriptions from 2012 to 2022 were obtained.
Initiations of antidiabetic medications were identified from the medication prescription data, focusing on the initiation of DPP4-i and SGLT2-i therapies. The date of initiation of an antidiabetic medication was defined as a baseline. Patients who initiated an antidiabetic medication between 2013 and 2021 and did not have a prescription in 2012 were considered new users and included in the analysis.
To be eligible for this study, the prescription of antidiabetic medications had to be in effect for at least 365 days. Patients who initiated more than one antidiabetic medication simultaneously were excluded. In addition, included patients were not allowed to start with another antidiabetic medication within 365 days of the initiation, and only prescriptions started at least 365 days after the previous antidiabetic medication prescription were considered. Lastly, medication prescription episodes where the patient died before reaching 365 days were excluded. One patient could have several treatment episodes with different antidiabetic medications but with the rules above.
2.2. Outcomes
The main outcomes (prediction targets) were the values of HbA1c, LDL cholesterol, HDL cholesterol, and BMI achieved 12 months after drug initiation. In the dataset, these outcomes were defined as the values closest to 12 months after drug initiation (within the range of 3 weeks to 12 months). HbA1c was analyzed with the turbidimetric inhibition immunoassay method and LDL and HDL with the photometric direct enzymatic method. All samples were analyzed in the Eastern Finland Laboratory (ISLAB, Kuopio, Finland;
https://www.islab.fi), which is an accredited laboratory and participates in external quality surveys. All values were standardized to International Federation of Clinical Chemistry (IFCC) units.
In evaluating the treatment selection model, favorable treatment outcomes are defined by the direction of the predicted values for each health outcome. Lower predicted values of HbA1c, LDL cholesterol, and BMI are desirable, as they indicate improved health conditions. In contrast, higher HDL cholesterol values are favorable, as they are associated with better cardiovascular health.
2.3. Potential Predictors
Several potential predictors were formed from the EHR data. These included clinical and treatment-related factors. Clinical factors included demographic variables, such as age, sex, and duration of T2D, and laboratory values on baseline HbA1c, fasting plasma glucose, BMI, LDL, HDL, total cholesterol, triglycerides, creatinine, and eGFR. In addition, clinical factors included the existence of comorbidities, such as hypertension, coronary artery disease, atrial fibrillation, heart failure, peripheral arterial diseases, stroke, chronic kidney failure, neuropathies, blindness, cancers, asthma, gout, glaucoma, depression, dementia, mental diseases, chronic obstructive pulmonary disease, rheumatoid and other arthritis, osteoporosis, neuromuscular diseases, and liver diseases, at the baseline.
Treatment-related factors included information on the prescriptions for other antidiabetic medications at baseline. Prescriptions for other than antidiabetic medications were also identified based on the third level of Anatomical Therapeutic Chemical (ATC) codes. In addition, information on smoking status at baseline was available. Detailed definitions of potential predictors are presented in
Supplementary Table S1.
2.4. Treatment Selection Model Development
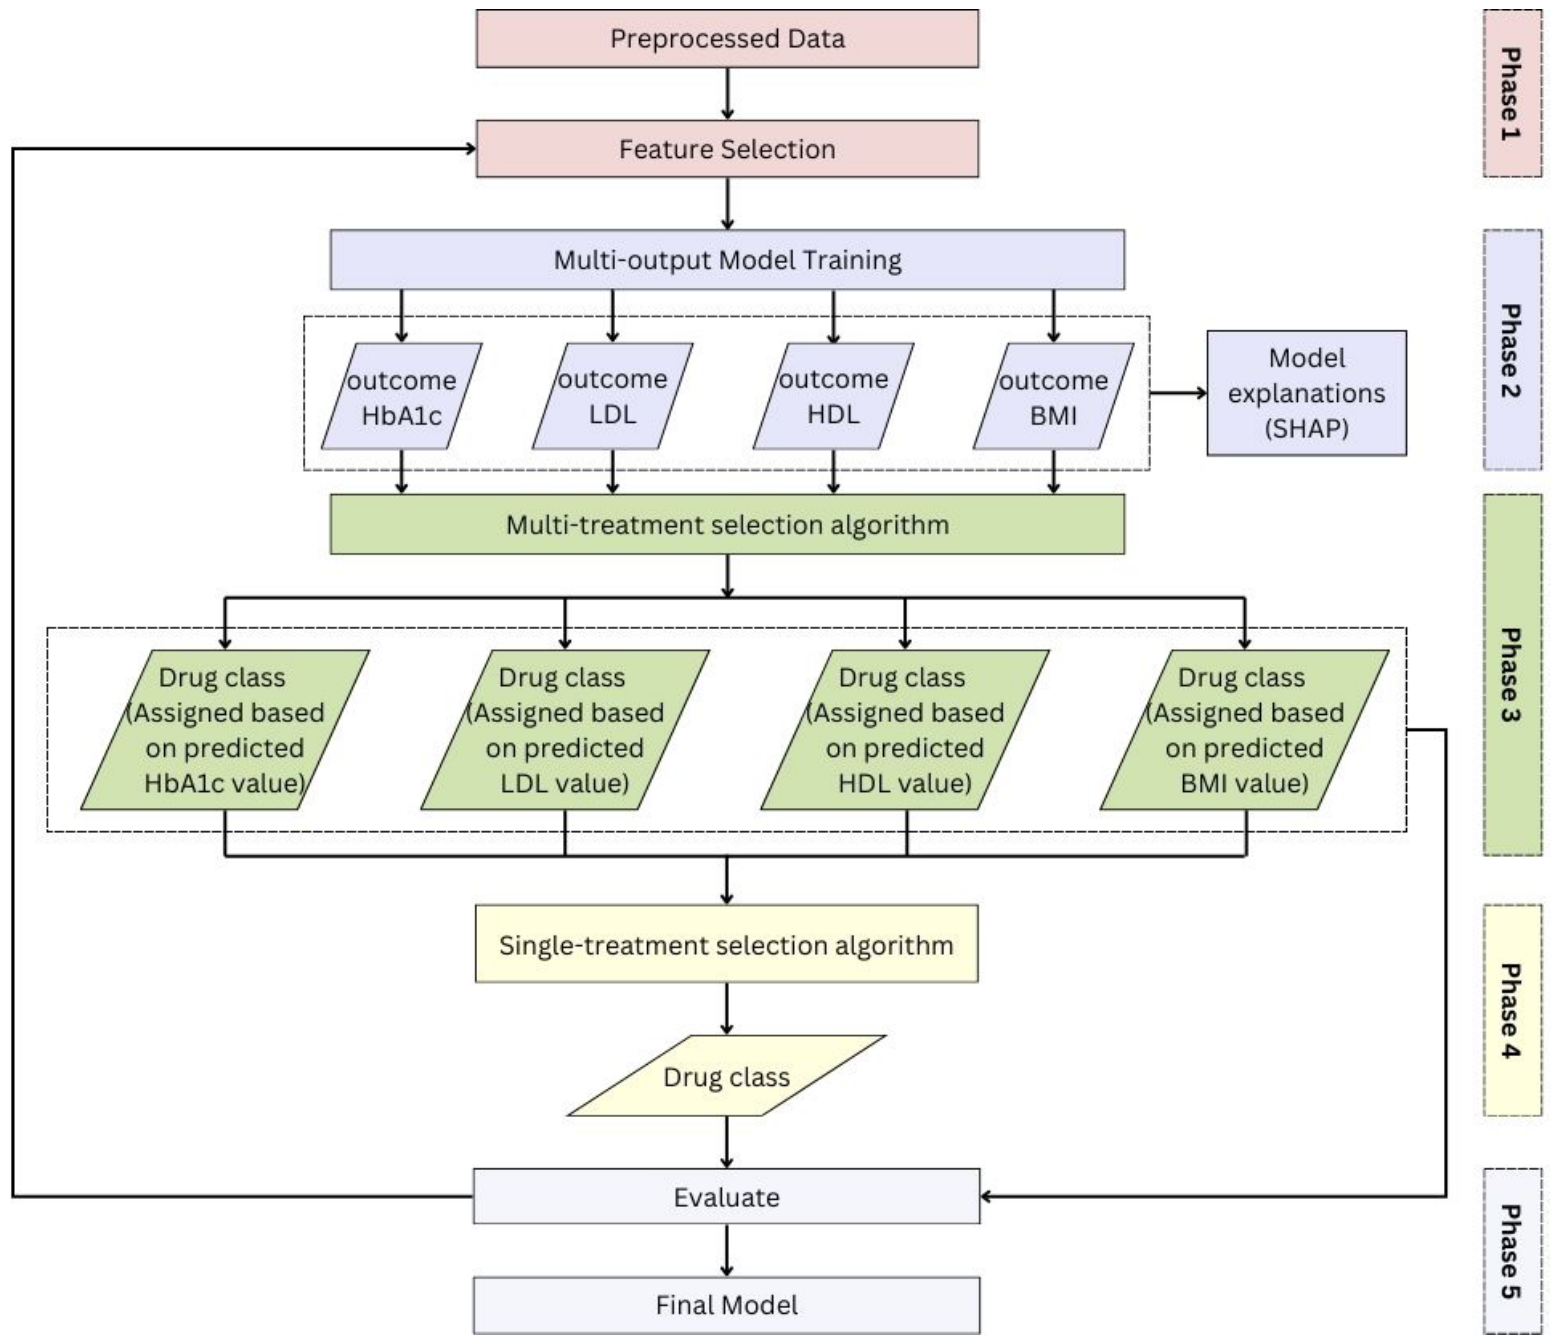
The treatment selection model architecture, illustrated in
Figure 1, is structured into five phases. Phase 1 involves data preprocessing, including feature selection techniques to prepare the dataset. Phase 2 focuses on the development of a multi-output model, which is the core for predicting treatment options. Phase 3 contains the development of the multi-treatment selection algorithm. In Phase 4, the results from multi-treatment selection model are aggregated to formulate a single-treatment selection approach. Finally, Phase 5 involves evaluating the model to measure the effectiveness of the selection strategy.
Figure 1.
Proposed personalized treatment selection model architecture: Each outcome from the multi-output model is processed individually through the treatment selection model, and the results are evaluated separately for each outcome. The model evaluation is detailed in
Figure 2.
Figure 1.
Proposed personalized treatment selection model architecture: Each outcome from the multi-output model is processed individually through the treatment selection model, and the results are evaluated separately for each outcome. The model evaluation is detailed in
Figure 2.
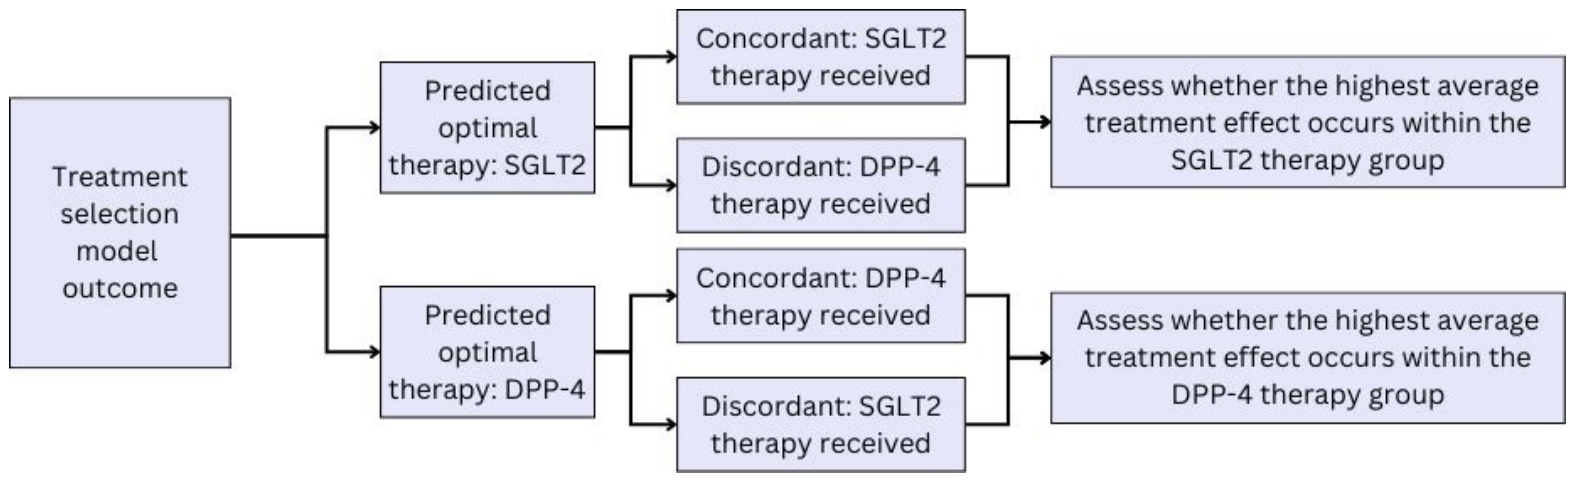
Figure 2.
Treatment selection evaluation framework: introduced in [
15].
Figure 2.
Treatment selection evaluation framework: introduced in [
15].
2.4.1. Data Preprocessing
The data preprocessing can be divided into six main steps. The initial dataset contained 5480 samples (patients) and 128 variables. In the first step, the data were filtered to include only participants with a baseline HbA1c ranging from 53 mmol/mol to 120 mmol/mol and an eGFR of 45 mL/min/1.73 m
2 or higher [
10]. Furthermore, variables with more than 40% missing values were eliminated. For variables with correlations above 0.7, one variable was retained based on relevance to the analysis, while the others were excluded to avoid multicollinearity and redundancy.
During the second step of preprocessing, all categorical labels were converted to numerical labels using the LabelEncoder [
16] and the dataset was randomly split into training and testing sets in a 3:1 ratio. SimpleImputer [
17] was then applied to impute missing values in the independent variables by replacing them with their respective modes. This approach was adopted in this study due to the relatively low proportion of missing values across most independent variables. Following this, Min–Max scaling was used to standardize the input features. The dataset consisted of 637 samples from the SGLT2-i group and 440 samples from the DPP4-i group. To address this imbalance, random oversampling was applied to the training dataset by duplicating samples from the minority class until both classes were balanced, resulting in equal representation in the training set. This approach ensured adequate representation of both treatments and reduced potential bias toward the majority class during model training. The test dataset remained unmodified throughout the analysis to ensure unbiased evaluation and avoid data leakage.
The outcomes contained missing values, and removing samples with these missing values would have resulted in significant data loss. In the third step, this issue was addressed by developing separate predictive models for each outcome using only the training data. These models were then used to impute missing outcome values within the training dataset. Samples with missing outcome values were excluded from the test dataset to prevent information leakage and ensure unbiased model evaluation. However, the performance of the model developed to predict missing values in LDL cholesterol outcome was unsatisfactory. Therefore, we decided to remove all samples in the training data that contained missing values for the LDL outcome.
Table 1 presents the performance of prediction models used to impute missing values in the outcomes.
We used a residual-based outlier detection technique to identify extreme observations in the dataset (Step 4). We fitted ordinary least squares (OLS) regression models for each outcome in the training dataset and subsequently used these models to make predictions on both the training and testing datasets. Next, we computed the standardized residuals for each prediction and flagged observations with standardized residuals greater than 4 as potential outliers. The detected outliers were removed from the datasets to reduce the influence of extreme values that may arise from measurement errors or atypical data points. After these preprocessing steps, the training dataset contained 1256 samples and the test dataset contained 101 samples.
In step 5 of preprocessing, we implemented a custom feature selection procedure to identify the most relevant features for our multi-output regression model. The feature selection process was conducted using three different algorithms: SelectKBest (Kbest) [
18], Recursive Feature Elimination (REF) [
19], and ReliefF [
20]. We used MultiOutputRegressor [
21] as the estimator for the REF algorithm. To address feature selection with the Kbest and ReliefF algorithms, which do not directly support multi-output feature selection, we iterated over each target feature. We then applied the respective method to select the most relevant features that show a strong relation with each target feature. Following the selection process for each target, we aggregated the selected features into a single list, removing duplicate entries. Furthermore, the
drug class feature was retained in the selected feature set because it represents the treatment assignment variable within the treatment selection framework, enabling the estimation of potential outcomes under different therapies rather than functioning solely as a predictive feature.
In the final step, we implemented 3-fold cross-validation using the training dataset to assess the performance and generalizability of our model. For each iteration of the cross-validation loop, the model was trained on two folds and evaluated on the third fold. This process was repeated three times to ensure that each fold served as both training and testing data. After training and evaluating the model on each fold, we calculated the mean accuracy and variance in the model’s performance across all folds.
2.4.2. Multi-Treatment Strategy: Treatment Selection Based on Multi-Output Model Predictions
We experimented with several multi-output regression models, including the multi-layer perceptron (MLPR) [
22], XGBoost [
23], CatBoost [
24], LightGBM [
25], Random Forest [
26], and linear regression [
27]. Furthermore, to improve model performance, we used the voting regressor ensemble [
28] method to combine predictions from best-performing individual regression models. Except for the MLPR model, the remaining models were assessed using MultiOutputRegressor and RegressorChain [
29] wrappers to extend their support and flexibility to multi-output regression.
All models underwent cross-validation and were trained using the training dataset. The model performances for predicting health parameter outcomes were assessed using the test dataset, and the R
2 score and RMSE were used as evaluation metrics. Furthermore, we used SHapley Additive exPlanations [
30] (SHAP-version 0.44.0) to interpret the predictions and understand the feature contributions of the multi-output model (
Figure 1 Phase 2).
In the multi-treatment selection method, for each health parameter, a patient is evaluated and assigned one of the two possible treatments based on the predicted outcome for that parameter (
Figure 1 Phase 3). The model facilitates the prediction of each health parameter outcome on each therapy. This enables the prediction of individualized treatment effect on specific health parameters. Subsequently, for each individual, the therapy associated with the highest predicted effectiveness for each health parameter was selected as the treatment option for that parameter. Later, the differences between the predicted outcomes of health parameters for the two therapies and the baseline values were calculated for each individual to get individualized treatment effects.
2.4.3. Single-Treatment Strategy: Treatment Selection Through Aggregation of Multi-Treatment Predictions
The multi-treatment approach outputs one of the two therapies for each health outcome per patient, allowing a patient to be assigned to different therapies based on the efficiency of each specific outcome. In the single-treatment strategy, we aggregate the results from the multi-treatment selection method and assign a single treatment to each individual (
Figure 1 Phase 4). We experimented with two aggregation methods to combine these therapy options: majority voting and importance-weighted aggregation.
The majority vote approach determined the final therapy by selecting the most frequently assigned therapy. In the event of equivalence, therapy was prioritized based on the predicted therapy for the HbA1c outcome.
The importance-weighted aggregation approach combines multiple treatment recommendations using feature importance values derived from the multi-output regression model, focusing on baseline features associated with each outcome (HbA1c, LDL, HDL, and BMI). Feature importance values were extracted for each outcome and normalized to ensure comparability, and were used to assign weights reflecting the relative contribution of each outcome to the final treatment decision. For each patient, a weighted score was calculated by multiplying the assigned therapy for each outcome by its corresponding weight and summing these values. The threshold for assigning the final treatment was defined as the mean of the weighted scores. Patients were then assigned to the final therapy based on whether their weighted score exceeds this threshold. Since aggregation was based on treatment assignments rather than raw outcome values, differences in outcome scales did not directly affect the aggregation process.
2.4.4. Treatment Selection Model Evaluation
In individual treatment selection, it is challenging to directly observe the difference in response between therapies for a given individual, as their responses to multiple treatments cannot be evaluated simultaneously. Consequently, the standard model performance metrics are insufficient for evaluating treatment selection models, as these metrics are primarily designed to assess the accuracy of predicting individual treatment outcomes, rather than evaluating the difference in effectiveness between therapies for each individual [
15].
The performance of multi-treatment selection and single-treatment selection models was evaluated in the test dataset using the framework introduced in [
15] (
Figure 1 Phase 5).
Figure 2 shows the evaluation approach of the treatment selection method. First, the multi-output model was used to predict the four outcomes for all individuals. Subsequently, predictions for each outcome were used independently to estimate the optimal therapy for individual patients using the multi-treatment selection method. In the next step, following the framework, we divided the population into two groups based on the predicted treatment. Then, we defined the concordant (therapy actually received is the therapy predicted by the method) and discordant (therapy actually received is not the therapy predicted by the method) subgroups on each predicted treatment group, based on the therapy actually received (observed) by each individual. Next, we evaluated the treatment selection model performance using the average health outcome improvement in the concordant compared to the discordant group within each predicted treatment group. This validation approach was applied separately for each outcome.
The same evaluation method was applied to assess the single-treatment selection model. After determining the final treatment decision for each individual using the aggregation method, we identified concordant and discordant subgroups within each predicted treatment group. The performance of the model was then evaluated by comparing the improvement in average effectiveness in health outcomes between the concordant and discordant groups (
Figure 2).
3. Results
To contextualize predictive performance, we compared the trained machine learning models against a cohort mean prediction baseline and regularized linear regression models. The mean baseline achieved an R
2 of −0.007 and an RMSE of 6.59, while Elastic Net and Ridge regression achieved R
2 scores of 0.195 and 0.464, with RMSE values of 5.759 and 5.501, respectively. The selected LightGBM model achieved an R
2 score of 0.441 and an RMSE of 5.582. Although Ridge regression achieved slightly higher predictive performance than LightGBM, it assigned all patients to the SGLT2-i treatment group and demonstrated no ability to capture treatment heterogeneity. In contrast, the LightGBM model demonstrated the highest treatment effectiveness during validation, with the strongest ability to discriminate between concordant and discordant subgroups, and was therefore selected as the final model.
Appendix A presents the performance of the other highest-performing multi-output models.
The selected LightGBM multi-output regressor was configured with a maximum tree depth of 6 and a learning rate of 0.1 (
Figure 1 Phase 2). The model was trained using 13 features selected by the REF algorithm: baseline HbA1c, baseline BMI, baseline HDL, baseline LDL, drug class, creatinine, eGFR, glucose, HbA1c (7–18 months) before drug initiation, age at drug initiation (years), obesity, duration of type 2 diabetes (years) and triglycerides (
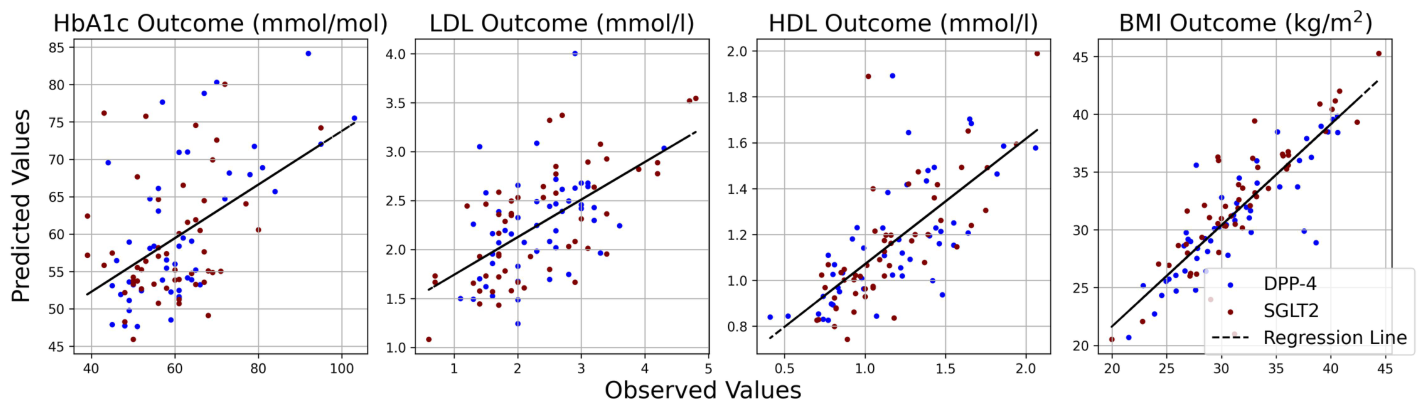
Figure 1 Phase 1). The observed and predicted values for the four outcomes are shown in the
Figure 3. The observed BMI values and predictions were more similar than the predictions for the other outcomes.
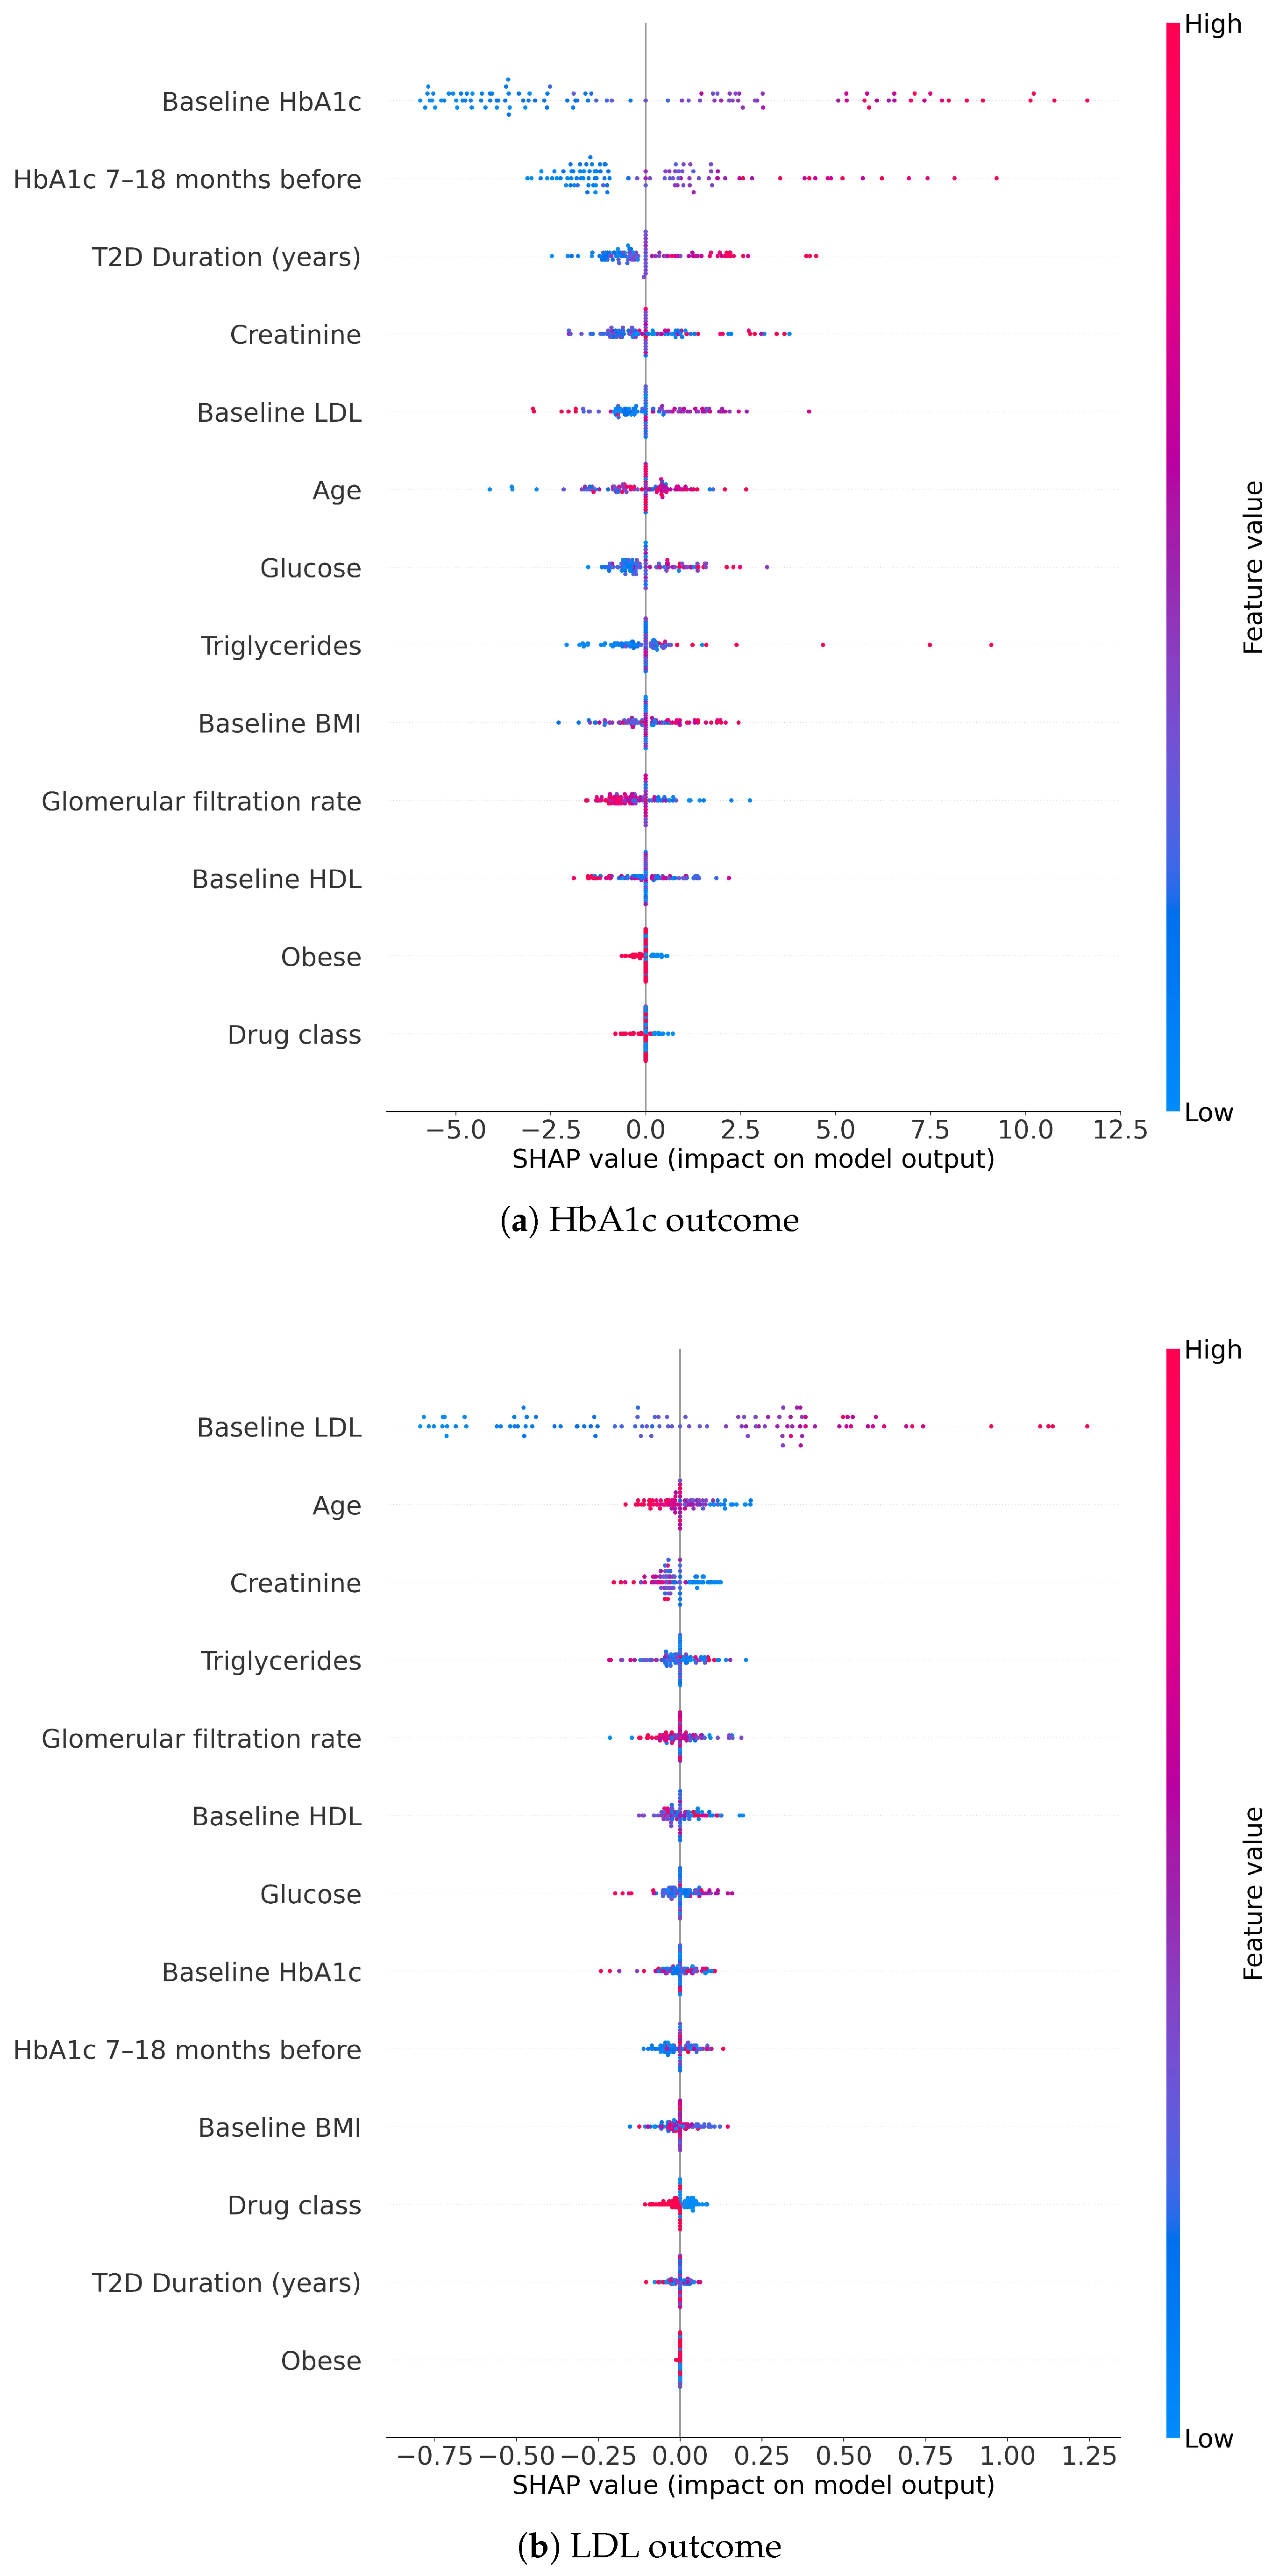
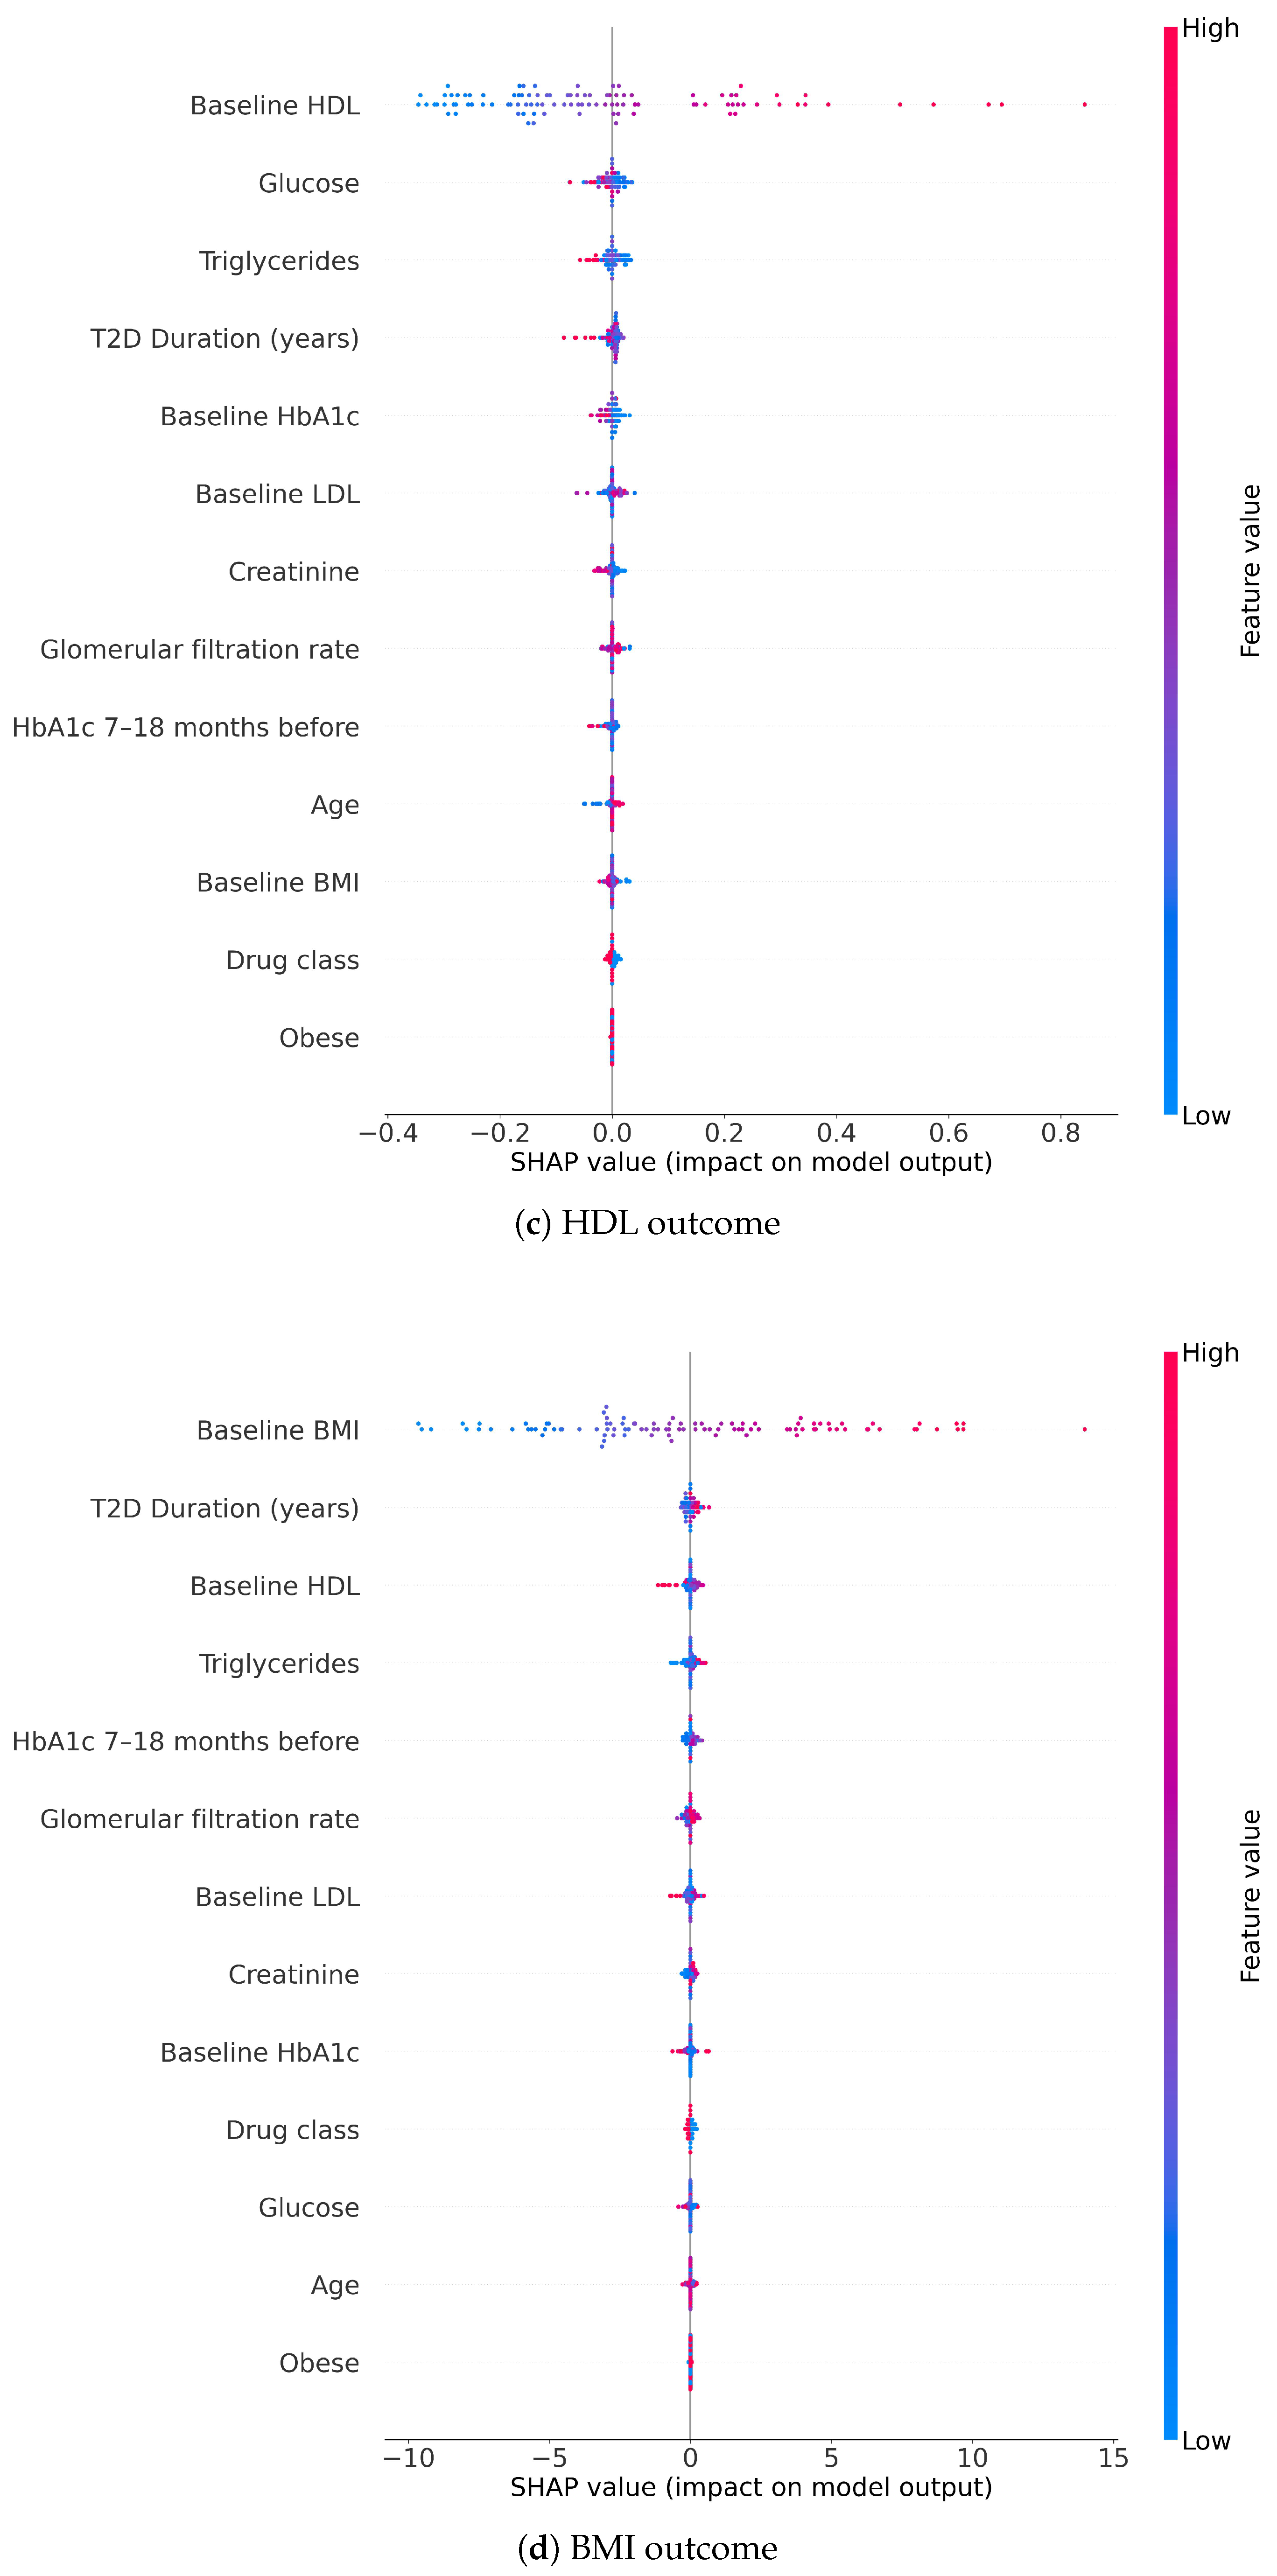
Figure 4 illustrates the global feature importance plots generated using SHAP for each of the four outcomes. These plots provide insights into the individual contribution of features to the model predictions for each outcome.
We removed outliers from each predicted outcome using the residual-based outlier detection method to ensure the robustness and precision of our treatment selection model. Predictions with extreme residuals—indicating large discrepancies between predicted and observed values—were considered potentially implausible. Such extreme values may occur when the model makes predictions for patient profiles that are poorly represented in the data or due to noise in real-world EHR data, rather than reflecting reliable clinical responses. Excluding these predictions reduces the influence of unstable estimates and improves the robustness of treatment effect comparisons while limiting the impact of potentially implausible model outputs.
The preprocessed test data included 52 users of SGLT2-i and 49 users of DPP4-i. Following outlier removal, our treatment selection model predicted that 35 patients would benefit from DPP4-i in terms of lowering HbA1c levels, while 65 patients would benefit from SGLT2-i. Regarding LDL cholesterol levels, the model identified benefits for 61 patients with SGLT2-i and 40 patients with DPP4-i. Additionally, the model anticipated positive effects on HDL cholesterol levels for 28 patients with SGLT2-i and 73 patients with DPP4-i. In terms of lowering BMI, the model predicted advantages for 80 patients using SGLT2-i and 21 patients using DPP4-i.
Table 2 displays the evaluation of the multi-treatment selection model (
Figure 1 Phase 3 and 5), including the observed treatment effects in the observed data and the treatment effect within the concordant and discordant subgroups.
The outcomes of the multi-treatment selection model were aggregated to assign a single treatment to each individual.
Table 3 displays the performance metrics for both aggregated approaches (
Figure 1 Phase 4). The results indicate that the majority vote approach outperforms the importance-weighted aggregation method in all performance metrics. Furthermore, we calculated Cohen’s kappa score to assess the level of agreement between the majority voting and importance-weighted aggregation approaches. The resulting Cohen’s kappa score of 0.58 indicates a moderate level of agreement between the two methods, suggesting some consistency in treatment selection outcomes. Using majority voting, the model predicted that 64 individuals would benefit from SGLT2-i, with 31 in the concordant subgroup and 33 in the discordant subgroup. For DPP4-i, the model identified 37 individuals as likely to benefit, comprising 16 in the concordant subgroup and 21 in the discordant subgroup. The importance-weighted aggregation approach identified 42 individuals as likely to benefit from SGLT2-i, including 17 in the concordant subgroup and 25 in the discordant subgroup. Additionally, this approach identified 59 individuals as likely to benefit from DPP4-i, with 24 in the concordant subgroup and 35 in the discordant subgroup.
Table 4 presents the validation results of the majority voting approach, while
Table 5 provides the validation results of the importance-weighted aggregation approach (
Figure 1 Phase 5).
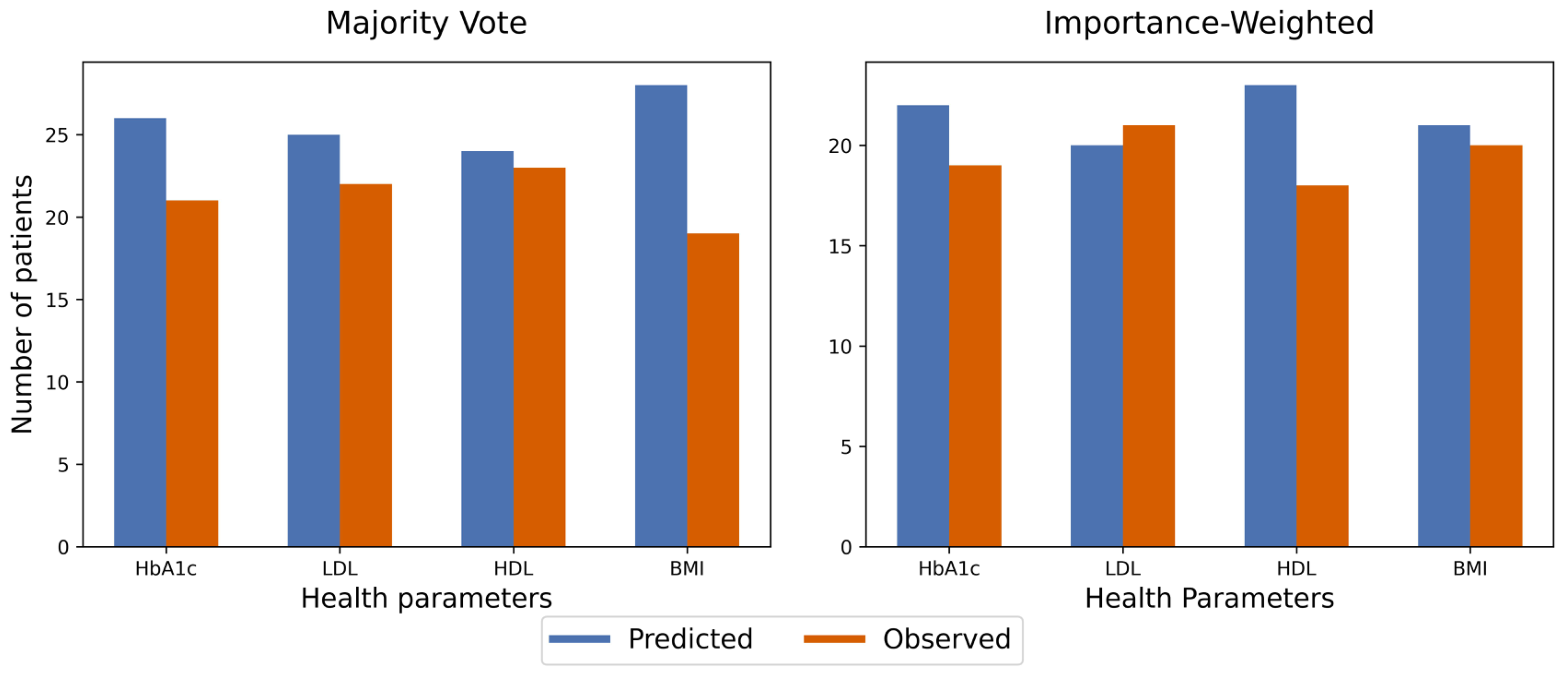
We evaluated changes in four health parameters—HbA1c, LDL, HDL, and BMI—by computing the differences between baseline values and the values observed and predicted at 12 months within the concordant groups (
Figure 5). In the analysis using the single-treatment majority vote aggregation approach, the following improvements were observed over a 12-month period: For HbA1c levels, 26 samples demonstrated improvement in predicted data, compared to 21 samples in the observed data. Similarly, for LDL levels, 25 samples showed improvement in the predicted data, whereas 22 samples showed improvement in the observed data. HDL levels improved in 24 samples according to predicted data and in 23 samples based on observed data. Notably, for BMI, 28 samples experienced improvement according to predicted data, while only 19 samples showed improvement in the observed data.
In a comparable analysis using the single-treatment importance-weighted aggregation approach, the following improvements were noted over the 12-month period: For HbA1c, 22 samples showed improvement in the predicted data compared to 19 samples in the observed data. For LDL levels, 20 samples showed improvement in predicted data, while 21 samples showed improved in the observed data. HDL improvements were seen in 23 samples for the predicted data and in 18 samples for the observed data. Finally, for BMI, 21 samples exhibited improvement in the predicted data compared to 20 samples in the observed data.
4. Discussion
Our study presents an explainable personalized treatment selection model designed to identify the optimal therapy for T2D based on individual patient characteristics and the effectiveness of multiple health parameter responses. This approach addresses the increasing need to move beyond HbA1c levels in the personalized treatment of T2D. Our model incorporates additional efficacy outcomes, including the patient’s LDL, HDL, and BMI along with HbA1c, to enhance the precision and effectiveness of treatment decisions. Furthermore, this approach supports a shift from the traditional `treat-to-target’ approach to a more holistic `treat-to-benefit’ paradigm in the management of T2D [
31]. Importantly, beyond predictive performance, its value lies in translating model outputs into clinically actionable insights, enabling transparent treatment decisions in practice.
The SHAP analysis of the multi-output model provided detailed insights into the model’s predictions for each health parameter. For HbA1c, the most significant predictors identified were baseline HbA1c, HbA1c measurements taken 7–18 months prior, duration of T2D, creatinine levels, baseline LDL levels, and age. In contrast, LDL cholesterol levels were primarily influenced by baseline LDL values, age, creatinine, and triglyceride levels. For HDL cholesterol and BMI, baseline values of HDL and BMI, respectively, were the dominant predictors, with other factors contributing less significantly. These findings highlight the variability in feature impacts across different health parameters. Therefore, it is important to tailor interventions relevant to each health parameter to improve treatment effectiveness. This approach ensures that treatment plans are more aligned with individual patient profiles and their unique health outcomes.
Experiments with various multi-output regression models revealed that the LightGBM regression model significantly outperformed the other models in evaluating the treatment selection model, effectively identifying treatment benefit groups for SGLT2-i and DPP4-i across all four outcomes. In particular, the multi-treatment model demonstrated good performance in distinguishing treatment benefit strata for SGLT2-i compared to DPP4-i in all four outcomes. Furthermore, except for the DPP4-i concordant group in the HbA1c outcome, the predicted average treatment effect for concordant groups showed an improvement over the average treatment effect in the observed real-world data. However, it is important to highlight that our multi-treatment model identified relatively smaller groups benefiting from DPP4-i in terms of treatment effect on HbA1c, LDL, and BMI outcomes, compared to those benefiting from SGLT2-i.
The proposed single-treatment selection approaches fused the results of the multi-treatment model and evaluated the effectiveness of SGLT2-i and DPP4-i treatments across HbA1c, LDL, HDL, and BMI outcomes. Despite its relative simplicity, the majority voting approach performed well in evaluating treatment effectiveness. SGLT2-i consistently showed a greater average treatment effect across all measured outcomes, including significant reductions in HbA1c, LDL, and BMI, alongside a modest increase in HDL. In contrast, while DPP4-i also improved treatment effectiveness in HbA1c, LDL, and HDL, it was associated with an increase in BMI within the concordant subgroup, indicating a potential trade-off. Notably, this increase in BMI contrasts with the general perception of DPP4-i as weight-neutral in real-world data, highlighting its potential impact on the studied population [
32,
33]. The consistency between our model’s predictions and actual clinical observations underscores the model’s capability to identify both the benefits and trade-offs of DPP4-i therapy, highlighting the need for careful evaluation of BMI effects when applying these treatments. Additionally, considering LDL and HDL, the outcome effectiveness differences were comparable between the two drugs, with DPP4-i showing a slightly higher effectiveness than SGLT2-i. Furthermore, considering all efficacy outcomes, the majority-voting single-treatment model demonstrated a higher number of patients with improved outcomes in the predicted data compared to the observed real-world data. This approach has advantages over the traditional “one-size-fits-all” treatment strategy, highlighting the potential of personalized treatment plans.
The importance-weighted aggregation method did not work well in the evaluation. This approach identified SGLT2-i subgroups that demonstrate improved treatment effects in three outcomes. However, the performance of the DPP4-i treatment was less consistent. While the method identified subgroups with enhanced treatment effects for LDL cholesterol, it was less effective for HbA1c, HDL and BMI. Overall, both aggregation approaches revealed consistent findings for SGLT2-i treatment, which showed improved efficacy across outcomes. However, both methods identified limitations with DPP4-i, particularly regarding the BMI outcome, which aligns with observed data. These findings highlight the need for further research on DPP4-i’s effects on BMI.
Our findings indicate that personalized medication leads to better health outcomes, improving the individual’s quality of life. In addition, on a broader scale, personalized medications contribute to a reduction in the economic burden on the healthcare system. Studies showed that individual-level reductions in these health parameters will result in long-term cost savings at national levels [
34,
35,
36]. Furthermore, since the number of patients with T2D is predicted to increase to 643 million by 2030 and 783 million by 2045 [
37], the cumulative economic impact of reducing the levels of HbA1c, LDL, HDL and BMI even by modest amounts could have profound implications at the societal and global levels, including significant savings in healthcare costs and improved overall health outcomes.
Notable strengths of our study include the introduction of a comprehensive personalized treatment selection model that addresses the limitations of evaluating treatment effectiveness based solely on HbA1c levels in T2D treatments [
11]. By incorporating multiple health parameters such as LDL, HDL, and BMI, this approach enhances the precision of treatment decisions and addresses the growing need for more individualized diabetes management outlined in both European [
38] and US [
39] treatment guidelines. Additionally, the use of SHAP analysis provides a detailed understanding of the model’s predictions for each health parameter. This insight into the most significant predictors for HbA1c, LDL, HDL, and BMI supports the development of tailored treatment strategies and the variability in feature impacts. Furthermore, our study explored different machine learning models to evaluate treatment effectiveness, demonstrating the effectiveness of the LightGBM regression model in distinguishing treatment benefit groups and improving the precision of treatment selection.
Our study has several limitations. The dataset represents a population from a specific region in Finland, which may limit the generalizability of our model to more diverse populations. We acknowledge that further validation of the model across different sub-populations and geographical regions is needed. Moreover, we were unable to validate individual-level treatment effects because the treatment outcomes were observed for only one treatment, which presents a fundamental challenge in causal inference. Furthermore, the complexity of treatment effects across different outcomes may not be fully captured by the aggregation methods we introduced, highlighting the necessity for more advanced analytical techniques. Additionally, analyzing the number of patients with improved outcomes does not account for those who already had their outcomes within the target range, for whom no further improvement was needed or possible. In this study, we only consider EHR data and medication prescription data, while other variables, such as physical activities, genetics, and adherence levels, which might influence treatment outcomes, were not included and could affect observed results. In addition, missing data in the independent variables were handled using single imputation. While more advanced imputation methods can better account for uncertainty in missing values, this uncertainty was not explicitly modeled in the current study, which may lead to underestimated variability. Missing outcome values were imputed using model-based methods. While this retained more training data, imputed values were treated as observed without accounting for prediction uncertainty, which may introduce bias. Finally, due to the limited size of the test dataset and the further reduction within concordant and discordant subgroups, some subgroup analyses are based on small sample sizes. This leads to increased variability and wide confidence intervals, thereby limiting the statistical power to detect reliable differences in treatment effects.
In future studies, we aim to explore more advanced methods for imputing missing values in independent variables, including multiple imputation and machine-learning-based techniques, and to develop and refine methods that more effectively integrate multi-treatment selection outcomes. We will also examine off-policy evaluation strategies to better assess the causal impact of treatment recommendations. Additionally, our future work will focus on externally validating the model using diverse population data and evaluating the economic outcomes of diabetes management based on the results of the developed treatment selection model.
5. Conclusions
Our study proposed an explainable personalized treatment selection model for T2D, emphasizing the importance of incorporating multiple health parameters beyond HbA1c. This model enhances the precision and effectiveness of treatment decisions by tailoring interventions to individual patient characteristics. The study focuses on SGLT2-i and DPP4-i; however, the methodology presented here serves as a framework that can be applied to other medications, including more recent therapies like GLP-1 analogs, as their data availability increases.
At the core of the treatment selection model, the multi-output model predicted individual’s HbA1c, LDL, HDL, and BMI levels 12 months after drug initiation, achieving an R2 score of 0.44. SHAP analysis of this model revealed key predictors for each health parameter, highlighting the importance of personalized treatment strategies. This multi-output model served as the foundation for developing the multi-treatment selection model, which allows clinicians to assign treatments tailored to specific health outcome. By aggregating the results of the multi-treatment selection model, the proposed single-treatment selection algorithm achieved an accuracy of 0.47 and an F1 score of 0.46. It demonstrated a strong treatment effect with SGLT2-i compared to DPP4-i. However, the model identified a negative impact on BMI with DPP4-i, suggesting a need for further research to address this reduced treatment effect. Overall, our approach showed better health outcomes compared to the data observed in the real world, indicating the potential for personalized treatment strategies to improve quality of life and reduce healthcare costs.





 ,
,