1. Introduction
Accurately predicting mortality remains one of the most critical yet challenging tasks in public health research [
1,
2]. Despite the growing availability of large-scale health data [
3], forecasting who is most at risk of death—and under what circumstances—requires capturing the intricate, nonlinear interactions among demographic, socioeconomic, behavioral, and medical variables [
1,
4]. Reliable mortality prediction can inform early intervention, improve resource allocation, and guide preventive strategies, making it a key objective in population health analytics [
5].
In this context, mortality was selected as the primary outcome of this study because it represents one of the most robust and objective indicators of population health. It is a definitive and irreversible event, making it a “hard” gauge of health that is free from subjective interpretation. It is systematically and universally recorded, enabling reliable, bias-free comparisons across populations and time periods. As highlighted by Wunsch et al., mortality data are routinely collected at the national level with near-complete coverage, making them more comprehensive and less prone to reporting bias than morbidity indicators [
6]. Similarly, Liang et al. note that mortality-based indicators are “essential measures for population health, enabling comparisons between regions, populations, and time because of their routine availability and standardized recording” [
7]. These characteristics make mortality an exceptionally strong endpoint for research seeking to identify risk factors, forecast health trajectories, and guide public health interventions.
Yet accurate mortality prediction is inherently challenging. Population-level health data are often characterized by class imbalance, where deaths represent only a small fraction of all recorded cases. This imbalance biases models toward predicting survival, undermining their ability to identify high-risk individuals [
8]. Furthermore, mortality is shaped by a complex, nonlinear interplay of multiple factors, ranging from chronic conditions and health behaviors to environmental exposures, which can be difficult to capture using traditional statistical approaches [
9]. The heterogeneity of individual health profiles, along with missing or incomplete data, adds further complexity to the modelling task.
Recent advances in Machine Learning (ML) offer promising avenues for addressing these challenges. Modern classification algorithms, particularly ensemble methods, are capable of learning from high-dimensional datasets, modelling intricate variable interactions, and adapting to skewed class distributions when combined with appropriate preprocessing strategies [
10,
11]. Alongside predictive modelling, techniques such as misclassification analysis and anomaly detection are gaining traction in healthcare research. For example, Wang et al. used an LSTM autoencoder to flag anomalous mortality cases, highlighting dialysis session length as a key predictor [
12]. Such approaches can uncover unusual cases that defy standard classification, offering deeper insights into hidden subpopulations and potentially guiding targeted public health interventions.
This study focuses on improving mortality prediction in large-scale, survey-based health data by comparing ML models and integrating post-classification analysis. The overall objective is to develop a robust and interpretable framework that enhances the detection of mortality risk and contributes to data-driven, preventive public health strategies.
In this context, mortality prediction is investigated using the Integrated Public Use Microdata Series—National Health Interview Survey (IPUMS NHIS; University of Minnesota, Minneapolis, MN, USA) datasets for the years 2010 and 2015, containing 193,765 records and 104 features. The study applies three classification algorithms—Logistic Regression, Random Forest, and XGBoost—progressing from baseline models on preprocessed, imbalanced data to experiments with oversampling (SMOTE), hybrid resampling (SMOTEENN), and hyperparameter tuning. Recall was prioritized as the main evaluation metric to maximize sensitivity to mortality cases, while maintaining an acceptable balance with precision. The research also incorporates a post-misclassification analysis for anomaly detection using Isolation Forest and Decision Tree to flag cases consistently misclassified across models.
The main contributions of this research are:
Addressing severe class imbalance in mortality prediction through comparative evaluation of resampling and hybrid techniques.
Identifying the optimal combination of classification algorithm and preprocessing strategy.
Applying feature importance and permutation analyses to highlight key predictors of mortality, including age, employment status, self-reported health, and lifestyle indicators.
Using misclassification and anomaly detection to uncover atypical profiles, revealing potential subpopulations requiring targeted public health attention.
By combining predictive modelling with systematic misclassification analysis, this study demonstrates a methodological approach that goes beyond accuracy metrics to better capture the complexities of mortality risk. The findings support the broader vision of shifting from reactive healthcare toward proactive, data-driven prevention strategies, enabling earlier and more precise interventions for at-risk populations.
The work begins with a background overview and a review of related work on mortality prediction, with emphasis on ML and anomaly detection approaches. It then introduces the IPUMS NHIS dataset and outlines the methodological framework. The results are presented next, covering model performance, interpretative analysis, and an exploration of misclassified instances supported by anomaly detection. The final sections discuss our findings, along with their limitations and implications for public health.
2. Background
Mortality, at its core, refers to the incidence of death within a given population. It is a fundamental concept in public health, epidemiology, and demography, serving as both an individual-level outcome and a broader indicator of societal health, healthcare system performance, and environmental or socioeconomic conditions [
13,
14]. While death is a universal and inevitable event, its timing, causes, and distribution vary widely across populations, geographical regions, and historical periods.
Historically, mortality has been quantified through indicators such as the crude death rate (total deaths per 1000 individuals), age-specific mortality rates, and cause-specific mortality rates. These statistics provide vital insight into population health and are routinely used by global institutions like the WHO and the Centers for Disease Control and Prevention (CDC) to assess disease burden, inform policy, and prioritize public health interventions [
14,
15].
Over time, the leading causes of mortality have shifted. In the past, infectious diseases such as smallpox, tuberculosis, and influenza were major drivers of death, particularly in low- and middle-income countries. However, advances in sanitation, vaccines, and medical care led to significant reductions in infectious disease mortality during the 20th century. This change marked a global epidemiological transition, wherein NCDs, including cardiovascular disease (CVD), cancer, diabetes, and chronic respiratory conditions, became the leading causes of death [
14,
16,
17].
Today, mortality beyond biological factors reflects behavioral, environmental, and social determinants of health. Indicators like Health-Adjusted Life Expectancy (HALE) and avoidable mortality have broadened the focus from merely recording deaths to examining how early, and under what circumstances, people die. These measures highlight the critical role of education, employment, and access to care in shaping life outcomes [
18,
19].
At the same time, the growing availability of large-scale health data, including EHRs, national surveys, and platforms such as IPUMS, enables population-level modeling and supports the application of ML to understand and potentially prevent premature death [
20,
21,
22]. Similar ML methods have also proven useful in broader health contexts, including epidemic analytics, where classification and clustering approaches help detect and forecast outbreaks [
23].
Mortality outcomes are further shaped by broader social disparities, including inequalities in education and access to care [
24]. Moreover, mortality is deeply influenced by daily behaviors, habits, and environments that shape health over time. A growing body of research shows that modifiable lifestyle factors, such as diet, physical activity, substance use, and mental health, are among the most powerful predictors of premature mortality, particularly in relation to NCDs [
25,
26]. Understanding these behaviors is crucial for both public health and the development of predictive models aimed at identifying individuals at risk before clinical deterioration occurs, offering broader benefits, including treatment evaluation, clinical decision support, and fraud detection [
27].
Nutritional habits are directly linked to lifespan and mortality risk [
28]. The Global Burden of Disease Study identified poor diet as one of the leading risk factors for early death worldwide, attributing approximately 11 million (or 1 in 5) of all deaths in 2017 to dietary risks [
29]. Additionally, adherence to the Mediterranean diet has been associated with a 23% lower risk of all-cause mortality [
30].
Tobacco remains one of the most preventable causes of death, with strong associations with lung cancer, CVD, and chronic respiratory conditions; WHO estimates that it causes over 8 million deaths per year [
31]. Alcohol use also poses serious risks, including liver disease, injuries, and mental health disorders, particularly acute in middle- and high-income countries [
32]. Alcohol-related cancer deaths in the U.S. from 1990 to 2021 rose from under 12,000 to over 23,000 annually [
33].
Regular physical activity is associated with a significantly reduced risk of all-cause mortality, while a sedentary lifestyle has the opposite effect. Warburton and Bredin’s systematic review emphasizes that even modest increases in physical activity can result in meaningful improvements in health and longevity [
34].
The psychological dimension of health is increasingly recognized as a determinant of mortality. Chronic stress, depression, and anxiety show strong associations with depression, CVD, and HIV/AIDS progression, contributing to inflammation, immune dysfunction, and cardiovascular risk [
35]. Studies indicate that daily emotional stress can significantly affect long-term health outcomes and life expectancy [
36]. Moreover, stress-related disorders have been associated with an increased risk of all-cause mortality and multiple cause-specific mortality [
37].
Related Work
The use of explainable machine and deep learning methods for mortality prediction has gained substantial traction in recent years, with particular emphasis on combining predictive accuracy with interpretability in real-world settings. These approaches have proven especially relevant in critical care and long-term monitoring, where transparency is crucial for clinical decision-making. However, these studies are typically based on clinically structured datasets. In contrast, survey-based data offers an alternative perspective by capturing more heterogeneous and less well-defined mortality profiles.
Avati et al. [
38] proposed a fully connected deep neural network trained on EHRs to predict patient mortality within a 3–12 month horizon. Their model achieved an Area Under the Receiver Operating Characteristic Curve (AUC) of 0.93 and an average precision of 0.69, effectively demonstrating the utility of early identification for initiating timely palliative care interventions. Lundberg et al. [
39] introduced TreeExplainer, a method specifically designed to compute SHAP values for tree-based models. This approach provides both local and global interpretability, including feature interactions, thereby enhancing the transparency and accountability of predictive systems in healthcare applications, such as mortality forecasting. These approaches focus on predictive performance and interpretability, where there is limited insight into misclassification behavior and the identification of atypical or hard-to-classify cases.
Further advancing deep learning applications, Rajkomar et al. [
21] developed three neural network architectures based on EHR data, including a recurrent neural network. Their models achieved AUC scores of up to 0.94 for in-hospital mortality prediction, confirming the potential of temporal data representations for clinical forecasting, while being trained on site-specific EHR data that may limit their applicability across different healthcare settings. In Taiwan [
40], a study developed multiple ML models—XGBoost, Random Forest, and Logistic Regression—to predict 30-day, 90-day, and 1-year mortality in critically ill ventilated patients. XGBoost emerged as the top-performing model, with AUC scores of 0.858, 0.839, and 0.816, respectively.
Using the MIMIC-III dataset, Lee and Tsoi [
10] focused on mortality prediction through clinically guided feature engineering. Their Random Forest model yielded an AUC of 0.94, highlighting the efficacy of well-curated features in improving model performance, particularly in high-dimensional clinical data. Similarly, a South Korean study developed iMORS, an ensemble model combining deep learning with LightGBM to predict short-term mortality in ICU patients [
11]. This model achieved an internal AUC of 0.964 and 0.870–0.890 on external datasets (MIMIC, eICU-CRD, AmsterdamUMCdb), outperforming the standard National Early Warning Score (NEWS) and positioning itself as a viable real-time decision–support system. However, these models showed reduced performance across external cohorts and high-risk subgroups, highlighting challenges in generalization and robustness across different patient populations.
Another MIMIC-III-based study focused specifically on Sepsis-3 patients, developing a stacking-based meta-classifier to predict 30-day mortality. Fifteen biomarkers were selected through ensemble feature ranking (XGBoost, Random Forest, Extra Trees and Logistic Regression), and the data were balanced using SMOTE-Tomek. The final model, using logistic regression as the meta-learner, achieved an AUC of 0.99 and an F1-score of 95.6% [
41]. SHAP analysis and a nomogram were used to enhance interpretability, underlining the model’s clinical relevance and potential for early ICU intervention. The focus on short-term mortality limits its ability to capture long-term outcomes, and limited clarity on data source diversity may affect generalizability across different healthcare settings.
In a COVID-19-specific study from Iran, researchers addressed mortality prediction for patients with a history of smoking. Models trained on clinical and demographic variables achieved strong performance using XGBoost—87.5% accuracy (F1-score: 86.2%) at admission and 90.5% accuracy (F1-score: 89.9%) post-admission [
42]—underlining the predictive importance of smoking as a risk factor in pandemic-related mortality. Due to the limited sample size, the study was unable to perform external validation or develop models for different patient subgroups, restricting the robustness and applicability of the results.
Beyond standard classification, anomaly detection has been explored as an alternative lens. Wang et al. [
12] approached mortality forecasting from an anomaly detection perspective using longitudinal hemodialysis data. Their model, based on an LSTM autoencoder (LSTM AE), was trained exclusively on data from surviving patients to identify anomalous patterns in non-survivors through reconstruction errors. Achieving an F1-score of 0.87, this model not only addressed the data imbalance problem but also highlighted dialysis session length as a critical predictive feature. The approach relies on a deep learning architecture, limiting interpretability and broader applicability, while providing limited insight into model behavior beyond anomaly detection performance.
In the realm of public health surveillance, Wiemken et al. [
43] applied time-series anomaly detection methods to enhance monitoring of pneumonia and influenza (P&I) mortality in the U.S. Their model flagged 17 anomalous mortality weeks (4.9%) versus 72 (20.6%) in conventional approaches, offering improved precision and interpretability for public health applications. These studies show how anomaly-based methods can reveal hidden mortality risks and improve surveillance in both clinical and public health domains.
Overall, existing studies demonstrate strong predictive performance; they predominantly focus on clinical data and standard evaluation metrics. Limited attention is given to understanding model behavior in terms of misclassification patterns and the identification of complex or ambiguous cases. In addition, the integration of anomaly detection with classification models remains underexplored.
The present study addresses these gaps by shifting the focus to survey data and combining predictive modelling with misclassification analysis and anomaly detection. This approach provides a complementary perspective that goes beyond performance metrics, enabling a deeper understanding of model behavior and the identification of hidden patterns in mortality risk.
3. Data and Methods
The study begins with the collection and extraction of survey data from the IPUMS NHIS for the years 2010 and 2015. These years were selected because they provide the most complete and consistent information for the variables used in this study, with fewer missing values compared to other years. Choosing two distinct time points also allowed us to create a broader and more representative sample of the population, capturing potential temporal variability, while keeping the survey design and questions comparable across years.
Following data acquisition, preprocessing steps were applied, including the removal of rows with missing values, one-hot encoding of categorical variables, and the exclusion of high-cardinality or non-informative features.
Three ML classifiers—Random Forest, Logistic Regression, and XGBoost—are then trained to perform binary classification of mortality. These algorithms were selected for their distinct strengths, including interpretability, the ability to capture nonlinear relationships, and their capacity to handle high-dimensional data while remaining computationally efficient [
44,
45,
46,
47]. Hyperparameter tuning, SMOTE and SMOTEENN were carried out to address common modeling challenges, such as class imbalance and overfitting [
48].
The methodology includes a post-analysis of misclassified cases, which was motivated by the question: Were the instances that all models struggled to classify simply random noise, or did they reflect deeper, hidden structures within the data?
To pursue this, instances that were incorrectly predicted by all three models are flagged as commonly misclassified and are hypothesized to represent unusual or complex profiles. In parallel, feature importance analysis is conducted to determine which variables most strongly influence model predictions.
We also applied an Isolation Forest to the complete dataset to generate anomaly scores, which were then systematically compared against the subset of commonly misclassified instances identified across all models.
We further employed UMAP to project these cases into a lower-dimensional space, allowing us to visually examine their distribution and potential clustering relative to the broader dataset.
Additionally, we trained a Decision Tree exclusively on this subset of frequently misclassified records, using it as an interpretative tool to reveal characteristic feature splits and latent patterns.
Figure 1 presents the pipeline summarizing the steps carried out.
3.1. Dataset Description
The dataset used in this study is based on the Integrated Public Use Microdata Series—IPUMS NHIS, specifically from the years 2010 and 2015. IPUMS NHIS is a harmonized collection of health-related survey data provided by the U.S. National Center for Health Statistics (NCHS). It offers a wide array of variables, which are self-reported and collected through personal household interviews [
22].
The extracted dataset comprised 193,765 records and 133 selected features. Given that the objective of this study is to uncover anomalies potentially rooted in behaviors and daily-life contexts, the selection process prioritized variables that could offer a comprehensive representation of each respondent. The final feature set includes demographic characteristics (e.g., age, sex, race/ethnicity), socioeconomic indicators (e.g., employment status, poverty status, weekly working hours), lifestyle and behavioral factors (e.g., smoking, alcohol use, physical activity, dietary habits), and medical history (e.g., chronic conditions, screening tests).
Table 1 summarizes these variables, grouped by domain and purpose.
3.2. Exploratory Data Analysis
Exploratory data analysis was conducted to gain an initial understanding of the IPUMS NHIS dataset and identify patterns relevant to mortality prediction. The analysis focused on demographic, socioeconomic, health-related, and behavioral features, guided by prior literature [
24,
28,
37].
The dataset covers a broad adult age range, with fewer participants aged 80 or older. Gender distribution is nearly balanced, with a slight majority of female respondents. In terms of race and ethnicity, White individuals form the largest group, followed by Black and Asian participants.
Socioeconomic indicators show that most participants reported being at or above the poverty threshold, while a smaller proportion was below it. In terms of employment, approximately half of the responses were classified as “Not in Universe” (NIU), meaning the individuals were not part of the target group for the work hours question. Among those who did respond, the most common category was 21–40 working hours per week, while fewer individuals reported working 41–60 h. Only a small number indicated working very low, very high, or extreme hours.
Regarding chronic conditions, among those who were eligible to answer (approximately 50% of the dataset), the majority of participants did not report a history of diabetes, hypertension, cancer, or heart disease. A small proportion indicated a past diagnosis of one or more of these illnesses, resulting in a highly imbalanced distribution. These conditions are well-established contributors to elevated mortality risk. Self-reported health status leaned heavily toward positive assessments, with most respondents describing their health as “Good” or “Very Good”, while a smaller percentage rated it as “Fair” or “Poor”.
Behavioral and lifestyle factors indicate that 19% of participants had never smoked 100 cigarettes in their lifetime, while 12.5% had. A large portion of the dataset (68.6%) fell under the Not in Universe (NIU) category for smoking-related questions. Alcohol consumption patterns showed a similar trend. Among valid responses, 19.5% were current drinkers, 6.7% identified as lifetime abstainers (fewer than 12 drinks in their lifetime), and 5% were former drinkers with no alcohol use in the past year. Although BMI data were frequently unknown, the available entries revealed a reasonable distribution across normal weight, overweight, and obesity categories.
Mental health indicators also had limited response rates. However, the available data suggest that most individuals did not report frequent experiences of depression, anxiety, or hopelessness. Very few participants reported taking medication for mental health conditions, resulting in a highly imbalanced distribution for these variables as well.
3.3. Data Preprocessing
Prior to model development, a series of preprocessing steps were applied to ensure data quality, reduce dimensionality, and align the dataset with the goals of this study. Given the high number of features in the IPUMS NHIS dataset, an initial step involved the creation of a feature dictionary to manage and organize variable definitions effectively.
Missing values were systematically assessed across the dataset. Features with a high proportion of missing data were removed entirely, as their imputation was not feasible or their contribution to the analysis was minimal. Additionally, a check for duplicate records confirmed that no duplicates were present.
A new binary target variable named dead_or_alive was created to indicate mortality status. This variable was coded as 0 for alive and 1 for deceased. The target distribution is highly imbalanced, with 186,158 instances (96%) labeled as alive and only 7607 instances (4%) labeled as deceased. This imbalance presents a challenge for model training. To address this, resampling techniques were applied to the training set after the data split. Specifically, SMOTE and SMOTEENN were used to increase the representation of the minority class and improve class separability through the removal of noisy and ambiguous instances.
A key objective during preprocessing was dimensionality reduction. Survey weights and complex sampling design variables (e.g., household_weight, person_weight) were excluded, as their primary use is in population-level estimation, which falls outside the scope of this study. Similarly, features such as unique identifiers, timestamps, and structural metadata were removed due to their lack of predictive value and potential to introduce noise.
In addition, early model experimentation guided further feature elimination. Using permutation and feature importance analyses, variables that contributed excessively to overfitting or offered limited predictive value were identified and removed.
After these reductions, the final cleaned dataset included 104 categorical features. To prepare the data for modeling, one-hot encoding was applied, resulting in a total of 554 features in the final transformed dataset. This high-dimensional structure introduces additional challenges, particularly in terms of computational efficiency and the increased risk of overfitting. These challenges are further compounded by the significant class imbalance in the target variable, which leads models to favor the majority class and underperform in detecting minority class instances.
3.4. Applied Models
ML offers a powerful means of extracting predictive insights from complex, high-dimensional data, making it well suited to understanding multifactorial outcomes like mortality.
Random Forest is a widely used ensemble learning algorithm introduced in [
44] that constructs multiple decision trees and aggregates their outputs to improve classification performance. Known for its robustness, speed, and resistance to overfitting, random forest is widely used in various domains.
Logistic Regression is a supervised classification algorithm introduced by David Cox 1958 using the Sigmoid Function to estimate the probability that a given input belongs to a particular category, making it particularly suitable for binary classification tasks [
45]. Logistic Regression is not only interpretable and computationally efficient but also robust in high-dimensional settings. When combined with regularization techniques and appropriate handling of class imbalance, it serves as a strong baseline model in healthcare analytics [
46].
Extreme Gradient Boosting (XGBoost) is a supervised ML algorithm builds upon the gradient boosting framework. It builds an ensemble of decision trees sequentially, where each tree corrects the residual errors of the previous ones using a gradient descent optimization approach. In healthcare, XGBoost enables the identification of high-risk individuals at an early stage and supports clinical decision-making by providing data-driven insights into complex patient profiles [
47].
Isolation Forest (iForest) is an ML algorithm designed for detecting rare or unusual patterns in data, known as anomalies. It works by constructing multiple random decision trees that recursively partition the dataset. Anomalies tend to be isolated in fewer splits and therefore appear higher in the tree structure, reflecting their deviation from the norm [
49]. In healthcare applications, Isolation Forest can flag patients with rare or atypical profiles, potentially indicating hidden risks or undiagnosed conditions [
50].
3.5. Model Interpretation and Explainability Tools
In high-stakes fields such as healthcare, where interpretability is crucial for building trust and guiding clinical decisions, understanding how models arrive at their outcomes is just as important as performance itself. In this study, interpretation tools such as feature importance, permutation importance, and logistic regression coefficients were used throughout both the training and validation phases.
In parallel, the evaluation metrics were selected to provide a balanced assessment of model performance, particularly in the presence of class imbalance. In this context, recall and F1-score were prioritized to better capture the model’s ability to identify minority class instances, while ROC-AUC was used to assess overall discrimination performance across different thresholds.
Feature Importance is a technique commonly used with tree-based models. It measures the contribution of each feature to the predictive performance of the model, typically based on how much each feature reduces impurity across the ensemble of decision trees. Features with higher importance scores are those that frequently appear near the top of decision trees and play a more significant role in making splits [
51].
Permutation Importance offers a model-agnostic approach to feature relevance and is particularly valuable when comparing across different algorithms. This method involves randomly shuffling the values of a single feature and observing the resulting decrease in model performance, typically measured by accuracy or AUC. A substantial drop indicates that the model relied heavily on that feature for correct predictions.
Feature Coefficients for linear models offer a straightforward interpretation of how each variable affects the predicted probability of the target class. Coefficients represent the log-odds change in the outcome for a one-unit change in the predictor, holding all other variables constant. Positive coefficients increase the likelihood of mortality, while negative ones reduce it [
52].
4. Results
In this section, the results obtained from the proposed approach are presented. The analysis begins with a comparative assessment of Logistic Regression, Random Forest, and XGBoost based on classification metrics, followed by feature importance, permutation importance, and coefficient inspection. To move beyond overall performance, we investigate commonly misclassified cases across models, with the aim of understanding patterns of prediction uncertainty. Anomaly detection is applied to these difficult-to-classify instances to explore whether underlying hidden structures or risk profiles may explain persistent errors. Together, these results provide both predictive and analytical insight into mortality forecasting in a preventive healthcare context.
4.1. Classification Results
This part of the analysis examines how different modelling configurations influenced classification outcomes in the mortality prediction task.
4.1.1. Results Interpretation on Preprocessed Data
As an initial step in the modelling process, three classification algorithms, Logistic Regression, Random Forest, and XGBoost, were applied to the pre-processed dataset to establish baseline performance. These models were trained using an 80:20 train-test split without any resampling or advanced feature tuning, allowing for an early assessment of their behavior on the imbalanced dataset.
Table 2 presents the classification metrics and AUC scores. Across all models, the overall accuracy appears high (0.96), primarily due to the dominance of the majority class (class 0).
However, the results clearly reveal the challenge of class imbalance: all models struggle to identify the minority class (class 1), with very low recall and F1 scores. This confirms that relying on accuracy alone is misleading, and further techniques are needed to improve detection of class 1 cases. The AUC scores for Logistic Regression and XGBoost indicate relatively stable performance between training and test sets. In contrast, Random Forest shows a more pronounced discrepancy (0.98/0.88), suggesting signs of overfitting.
4.1.2. Results Interpretation After Hyperparameter Tuning
To optimize model performance of the models, a Randomized Search approach was applied to fine-tune the hyperparameters for all three classifiers. This method was selected over grid search due to its efficiency in exploring a wide hyperparameter space with reduced computational cost. The goal was to identify the best parameter configurations, while balancing model complexity, generalization, and sensitivity to the minority class. All searches were evaluated using F1-score as the scoring metric. A Stratified K-Fold cross-validation strategy was applied to preserve class distribution across folds and ensure robust evaluation. Additionally, both training and test scores from the cross-validation process were recorded, allowing a clearer comparison between model performance on seen and unseen data.
For the XGBoost classifier, a search space was defined to improve sensitivity to the minority class while maintaining strong generalization. Settings that influence tree complexity and the amount of randomness during training were explored to avoid overfitting. The learning rate and number of estimators were also tuned to control convergence speed and model capacity.
The Random Forest classifier was tuned to balance performance and generalization by adjusting the number of trees and controlling tree complexity. Parameters were used to prevent overfitting by requiring a sufficient number of observations for splits and leaf nodes, while class weighting was applied during training to address class imbalance.
For the Logistic Regression model, a simpler hyperparameter space was explored due to its linear nature. Tuning focused on the regularization strength using a logarithmic scale. The l2 penalty and liblinear solver were used for compatibility with class weighting, while balanced class weight addressed class imbalance.
In
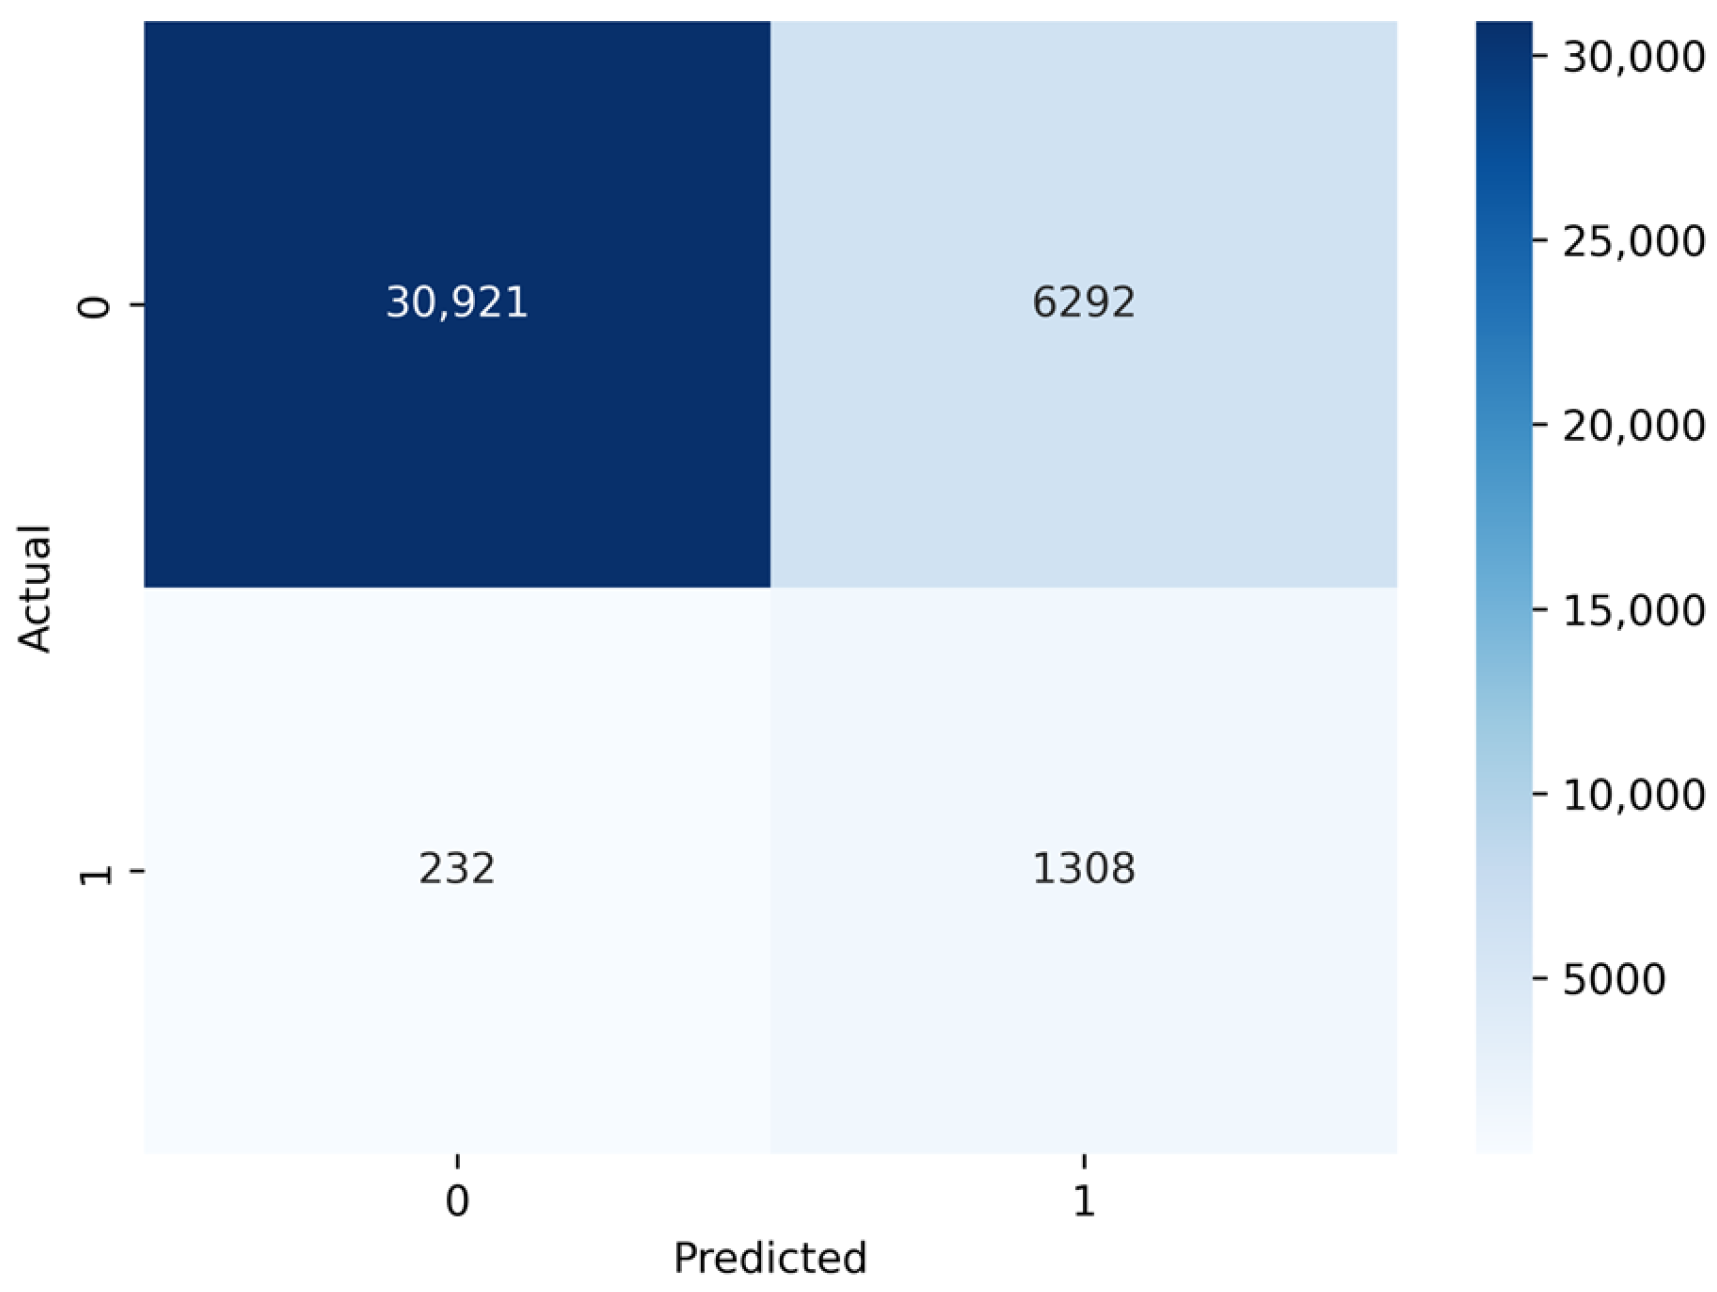
Table 3, we can see the results of applying hyperparameter tuning in conjunction with balanced class weights. Logistic Regression achieved a recall of 85% for the deceased class and a strong AUC of 0.92, substantially improving its sensitivity to mortality cases. However, this came with a trade-off in precision, dropping to 17%, suggesting a higher rate of false positives. This trade-off is clearly reflected in the confusion matrix of
Figure 2, where the model misclassified 6292 alive individuals as at risk, highlighting the increased false positive burden that accompanies higher recall. Even so, the overall F1 score for class 1 improved to 0.29, illustrating a more balanced sensitivity to mortality cases.
For Random Forest, we observe a somewhat different profile. The recall reached 74% with a similar F1 score of 0.29, and it maintained a decent AUC of 0.89. Precision was slightly higher at 18%, helping reduce false alarms compared to Logistic Regression.
XGBoost stood out by balancing these metrics the most effectively. It achieved a recall of 69% and the highest F1 score of 0.39, alongside an AUC of 0.92. With a precision of 27% and a manageable runtime of about 25 min, XGBoost demonstrated strong potential for identifying high-risk cases in imbalanced healthcare data.
4.1.3. Results Interpretation on SMOTE-Resampled Data
Next, a resampling strategy was applied using SMOTE, a popular approach that creates synthetic examples of the minority class by interpolating between existing samples and their nearest neighbors, effectively balancing the dataset without replicating original instances [
53]. This process produced an equal number of instances for both the alive and deceased categories, each totaling 148,945 observations.
As shown in
Table 4, after applying SMOTE, all three models demonstrated clear shifts in performance. Each model achieved improved recall for the minority class compared to the initial imbalanced results, highlighting SMOTE’s impact on enhancing sensitivity to mortality cases. However, this improvement came at the cost of lower precision, indicating an increase in false positives. Additionally, the gaps between training and test AUC scores, especially for the tree-based models, pointed to suboptimal generalization and emerging signs of overfitting.
To further refine model performance after resampling, we applied the same Randomized Search hyperparameter tuning strategy that was previously used on the original, imbalanced dataset. This approach aimed to identify optimal parameter settings while maintaining consistency in the evaluation framework.
As shown in
Table 5, the results after tuning on SMOTE-resampled data revealed several notable shifts. Logistic Regression remained largely stable, sustaining a recall of 82% and an AUC of 0.92, closely mirroring its performance before resampling. Random Forest exhibited a slight improvement in precision, rising to 21%, and an increase in the F1 score to 0.32, although recall dropped to 65%, indicating a modest trade-off. However, the considerable gap between its training and test AUC scores (0.96 vs. 0.89) points to ongoing overfitting. For XGBoost, the recall for the minority class decreased to 42% compared to 69% without SMOTE, despite maintaining similar precision, highlighting that oversampling did not necessarily translate into better sensitivity after tuning. The difference between its training and test AUC (0.99 vs. 0.89) further underscores overfitting concerns.
Overall, while hyperparameter optimization on the SMOTE-balanced data helped to modestly adjust precision and F1 scores, it did not outperform the models tuned on the original dataset with balanced class weights, emphasizing the complex interplay between resampling and model calibration.
4.1.4. Results Interpretation on SMOTEENN-Resampled Data
SMOTEENN was then applied as a more refined method. It combines SMOTE with Edited Nearest Neighbors (ENN), which removes noisy or misclassified instances, offering both oversampling and data-cleaning benefits [
48]. The resulting training set contained 230,453 observations across 553 features, with a slightly imbalanced but cleaner class distribution: 117,777 alive and 112,676 deceased. This setup aimed to improve not only class balance but also data quality, reducing potential noise that could lead to overfitting.
As shown in
Table 6, the models trained on the SMOTEENN-processed data did not exhibit substantial improvements over those trained with SMOTE alone. Logistic Regression achieved a recall of 81% in the minority class, nearly identical to 82% with SMOTE. However, it now showed a noticeably larger gap between training and test AUC scores (0.98 vs. 0.90), indicating increased overfitting compared to the more stable results after SMOTE.
Random Forest displayed a slight improvement in precision, increasing from 17% with SMOTE to 20% with SMOTEENN. Its recall also rose from 23% to 64%, suggesting better sensitivity. Yet this came at the cost of a sharper drop in generalization, as reflected in the wider AUC gap (0.97 vs. 0.82), pointing again to overfitting.
For XGBoost, the recall for the minority class improved, moving from 43% under SMOTE to 60% with SMOTEENN, with precision and F1 scores remaining similar. The high training AUC of 0.99 compared to a lower test AUC of 0.89 continued to highlight concerns about the model memorizing the training data.
Given these patterns and considering that even SMOTE, after hyperparameter tuning, had not yielded consistently strong improvements, no further hyperparameter tuning was pursued for SMOTEENN. This underlined that, in this context, more complex resampling did not translate into meaningful performance gains.
4.2. Interpretation and Explainability Results
This section presents a closer look at how predictions were interpreted. The goal is not only to evaluate how well each model performed but also to understand which features influenced those outcomes and how explainable the decisions were.
4.2.1. Coefficient & Feature Importance
The feature importance results across the three models reveal several consistent patterns and insightful distinctions.
Table 7,
Table 8 and
Table 9 present the top 20 most important features for each model, offering a clear comparison of the variables that contributed most strongly to the predictions.
Age-related variables prominently appear in all three tables, confirming age as a central predictor of mortality. For instance, age categories, such as “1–17”, “18–34”, “35–49”, and “65–79” ranked among the most important features in both Random Forest and XGBoost, with particularly strong negative coefficients for younger age groups in the Logistic Regression model, indicating a strong relationship with the likelihood of being alive.
Employment status, particularly “Not in Universe”, probably meaning people who are not in labor force category (hours_worked_last_week_or_usually_categorical_NIU (0)), also emerged as a recurring signal across Random Forest and XGBoost, suggesting that labor force participation may capture underlying vulnerability factors such as aging, disability, or chronic illness.
Several subjective health indicators, especially self-reported poor health (health_status_5, health_status_4) and psychological distress measures like “felt worthless”, “felt hopeless”, and “felt effort”, were heavily weighted in Logistic Regression and also had notable importance in the Random Forest. These features likely reflect latent mental and physical burdens.
Interestingly, dietary habits (e.g., processed meat, green salad, coffee/tea frequency) showed relatively higher weights in Logistic Regression, which could indicate linear associations with health outcomes. However, these same variables received lower importance in tree-based models, potentially due to nonlinear interactions with broader lifestyle indicators.
Finally, XGBoost assigned unusually high importance to some features less emphasized by other models, such as genetic_test_cancer_risk_1 and activity duration, highlighting the model’s ability to exploit subtle, complex interactions that may go underutilized in simpler models (which is consistent with its stronger performance relative to the other models).
4.2.2. Permutation Importance
Permutation importance was computed for all three models using the F1-score as the evaluation metric, providing a model-agnostic approach to evaluating the influence of each feature. This was implemented using the permutation importance function, which estimates the importance of each feature by measuring the decline in model performance when its values are randomly shuffled. The results presented in
Table 10,
Table 11 and
Table 12 reflect this analysis, providing a performance-based ranking of features that most strongly influenced each model’s predictive accuracy with respect to classifying mortality outcomes.
Across all three models, age-related variables remain dominant, reinforcing their central role in mortality prediction. These results are largely consistent with the original feature importances, which also emphasize age, but permutation scores here provide a stronger quantitative signal of how much predictive performance depends on these age variables.
Interestingly, permutation importance shifts attention toward more clinically grounded features that were underemphasized in the feature importance rankings. For instance, Random Forest’s permutation scores give meaningful weight to heart_attack_history_1, cancer_diagnosis_1, coronary_heart_disease_1, stroke_history_1, diabetes_diagnosis_1, etc., classic indicators of serious health conditions. These variables were less prominent in the standard feature importance list, indicating that while the model may not split frequently on them, their disruption still meaningfully degrades performance. XGBoost similarly shows elevated importance for comorbidities such as emphysema, coronary heart disease, heart attack, colonoscopy and smoking history.
Permutation importance for Logistic Regression highlights both age and a mixture of clinical and behavioral variables, such as vision_problems_1, green_salad_frequency_3, bmi_category_3, and kidney_issues_past_year_1. This diverse profile illustrates Logistic Regression’s sensitivity to both lifestyle and health conditions, albeit in a linear framework.
4.3. Misclassification Analysis & Results
A detailed exploration of the models’ misclassifications is presented, alongside further analyses aimed at understanding where and why prediction errors occur. We look at how often the different classifiers made similar mistakes, using visual, statistical and ML techniques to investigate possible patterns or anomalies in these errors and apply a targeted decision tree to identify factors that may explain persistent misclassifications.
4.3.1. Misclassified Instances Analysis & Results
The final test set consisted of 38,733 unseen instances, of which 96.03% (37,213) were labelled as class 0 (alive), and only 3.97% (1540) as class 1 (deceased). All three models produced the same prediction for 33,551 instances (86.58%), whereas they disagreed on 5202 instances (13.42%).
Figure 3 depicts the distribution of model agreements and disagreements across the test set.
A breakdown of misclassifications is provided below:
Logistic Regression misclassified a total of 6524 instances, of which 6292 were false negatives (actual class 1 predicted as 0) and 232 were false positives.
Random Forest misclassified 5540 instances, with 5133 false negatives and 407 false positives.
XGBoost showed the best precision among the three, misclassifying 3358 instances, of which 2884 were false negatives and 474 were false positives.
A cross-model comparison revealed that 2632 instances were commonly misclassified (both class 0 and class 1) by all three models. Among these, 2431 belonged to class 1 and 201 to class 0, indicating a shared difficulty in correctly identifying positive cases. When analysing model-specific misclassifications:
For Logistic Regression, 40% of its 6524 misclassified instances overlapped with the other two models.
For Random Forest, 47.4% of its 5540 misclassified instances overlapped with the other two models.
For XGBoost, 78.4% of its 3358 misclassified instances overlapped with the other two models.
This overlap underscores a consistent subset of difficult-to-classify cases, particularly among the minority class, across different algorithmic approaches.
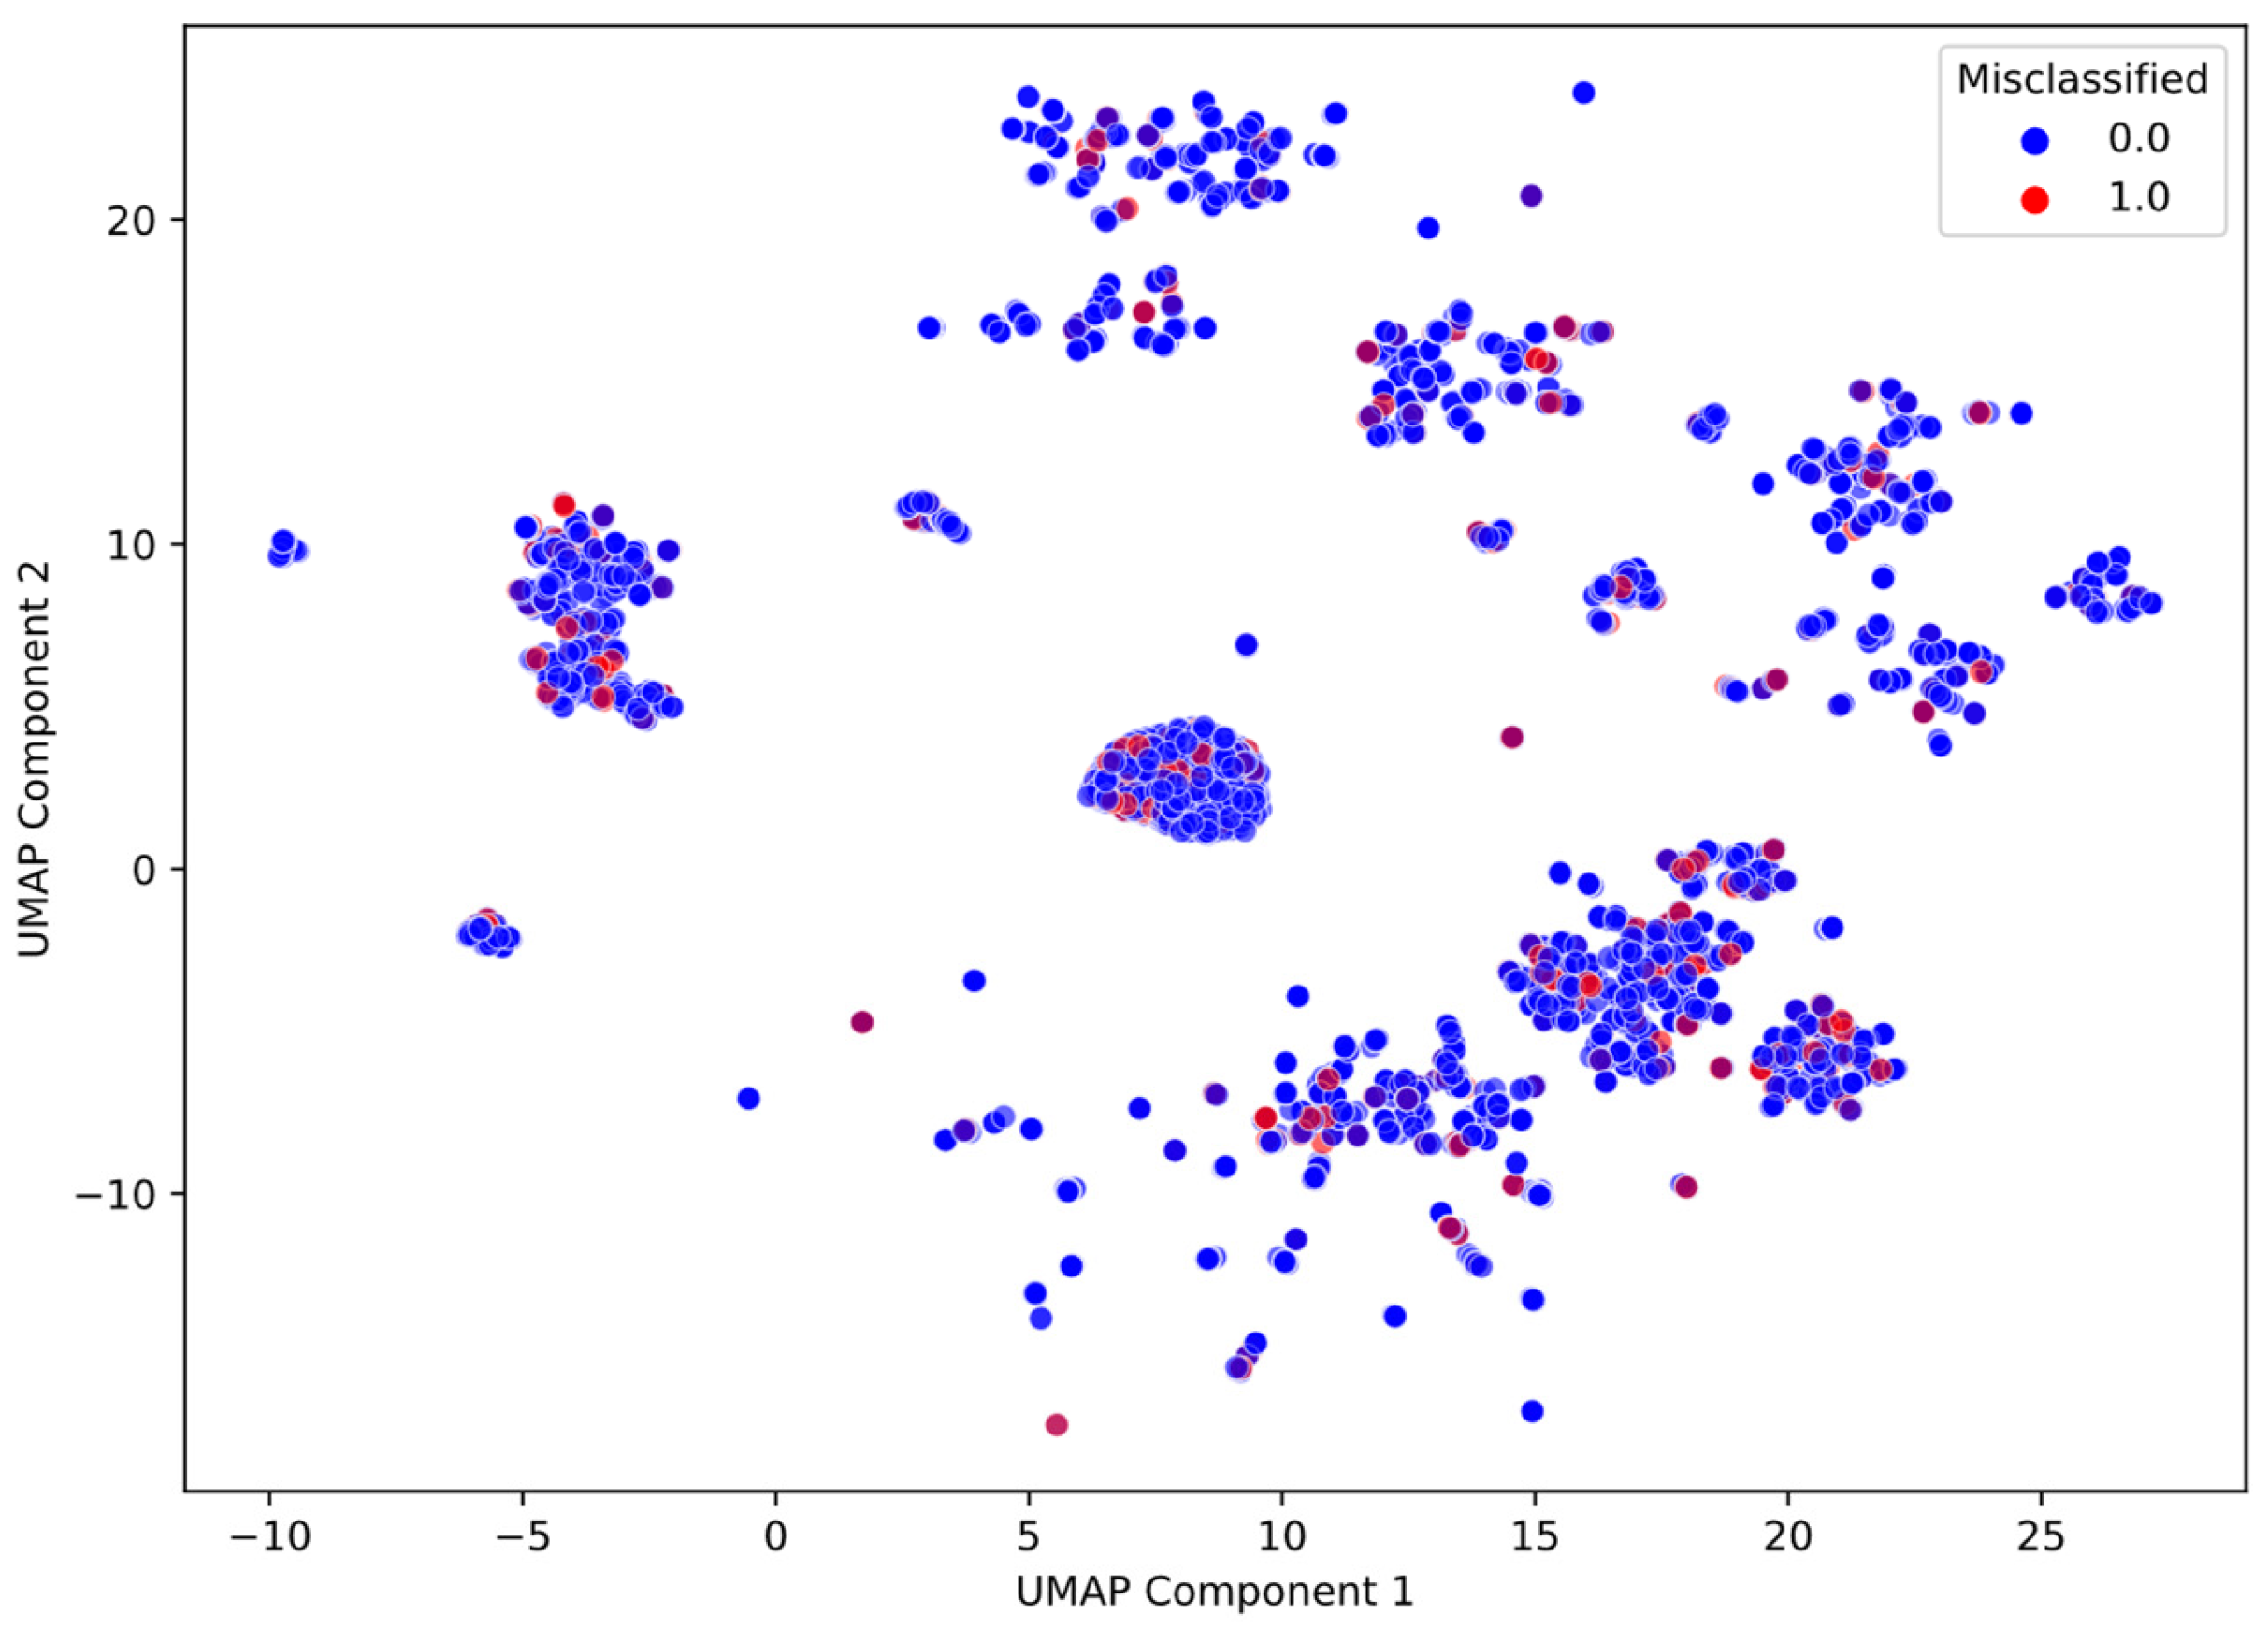
To gain a better understanding of the prediction landscape, UMAP (Uniform Manifold Approximation and Projection) was selected for visualizing high-dimensional data due to its strong mathematical foundation and its ability to preserve both local neighbourhoods and global structure. Its proven use across diverse scientific domains highlights its reliability for large-scale data exploration [
54]. This technique enables the visualization of instance distributions in a 2D scatter plot; each point represents a test instance, color-coded based on whether it was misclassified by the model.
Figure 4,
Figure 5 and
Figure 6 present these UMAP projections for the three classifiers, offering an intuitive view of how misclassified instances are distributed across the latent space and revealing potential clusters of confusion or areas of overlap between classes.
4.3.2. Isolation Forest Analysis & Results
Next, to investigate whether these persistent misclassifications could be linked to underlying anomalies in the feature space, an Isolation Forest algorithm was applied to the training set (excluding the target variable). Using the decision function on the test set, 3607 instances were identified as anomalies (i.e., received negative anomaly scores).
Notably, of the 2632 instances commonly misclassified by all three models, only 24.2%, or 637 instances, were flagged as anomalies by the Isolation Forest.
Figure 7 focuses specifically on this overlapping subset, highlighting where the commonly misclassified observations coincide with negative anomaly scores. This overlap suggests that there is a possibility that a non-negligible portion of the misclassified data may correspond to structurally unusual or atypical individuals, cases that defy general population patterns and may be inherently harder to classify.
5. Discussion
This study evaluated the effectiveness of three machine learning classifiers—Logistic Regression, Random Forest, and XGBoost—for predicting all-cause mortality using the IPUMS NHIS dataset. Despite the challenges of high dimensionality and severe class imbalance (only 3.9% of cases labelled as deceased), the analysis yielded several critical insights into model behaviour, optimisation strategies, and implications for predictive healthcare analytics.
Initially, the models were trained using minimal preprocessing to establish baseline performance. All three classifiers achieved high overall accuracy due to the dominance of the majority class, yet their recall scores for the minority class were poor, consistently falling below 20%. This highlighted a significant limitation: The models were ineffective at identifying true positive cases, i.e., individuals who had died. This issue emphasized the need to shift evaluation focus away from accuracy and toward more meaningful metrics such as F1-score, recall, and AUC, especially in the context of life-critical predictions.
To address the class imbalance, three strategies were explored: (i) class-weighted learning; (ii) SMOTE; and (iii) SMOTEENN. Among these, the use of class weighting combined with hyperparameter tuning consistently delivered the most balanced and reliable results, particularly for recall and generalization. Although SMOTE and SMOTEENN improve recall across models, they also reduced precision and introduced signs of overfitting in this high-dimensional setting. These resampling methods often disrupted the underlying structure of the data, resulting in variability in AUC performance between training and test sets. Consequently, SMOTE-based techniques were ultimately less effective than class-weighted learning for this task [
54].
Further refinements used randomized hyperparameter tuning with class balancing and cross-validation to support robust generalization. XGBoost stood out among all the models examined by achieving a more favorable balance between sensitivity (69%) and specificity (92%). As reflected in its confusion matrix in
Figure 8, the model successfully identified 1066 actual mortality cases while limiting false positives to 2884, a notably lower figure compared to the other approaches. This outcome underscores XGBoost’s capacity to capture a substantial proportion of true high-risk individuals without excessively misclassifying healthy cases.
To interpret model behaviour and quantify variable contributions, we examined coefficients, feature importances, and permutation importances. Age-related features dominated all rankings, as expected in mortality prediction, but the employment-status category “Not in Universe” (NIU) stood out as a surprisingly strong predictor across methods. This suggests that being outside the labour force, potentially due to retirement, disability, or long-term illness, captures significant latent vulnerability.
Additionally, permutation importance revealed that classic clinical indicators such as stroke, heart disease, cancer, and diabetes had a greater impact on model performance than their structural importance suggested, especially in Random Forest and XGBoost. This contrast underscores the value of permutation-based methods in highlighting critical but infrequently split-on features and demonstrates how even well-known risk factors can be underrepresented in structural model logic. XGBoost’s ability to elevate subtle features, such as genetic testing history, underscores its strength in capturing complex, nonlinear interactions, reinforcing its superior performance and offering promising avenues for deeper clinical insights.
To gain insight into the systematic misclassification errors, a focused Decision Tree model was trained on the subset of test samples consistently misclassified by multiple classifiers, with emphasis on those overlapping with XGBoost’s errors. The model achieved a high recall of 84%, effectively identifying most misclassified instances, though at the cost of low precision, a trade-off acceptable in this diagnostic context. Many of the tree’s primary splits, such as self-reported poor health, lack of vigorous physical activity, hypertension diagnosis, and mental health indicators (feelings of worthlessness), aligned closely with the top-ranked features from the importance analyses, meaning that these features were both important for general predictions and also played a significant role in the models’ confusion.
However, some divergences also emerged: clinical variables, like heart attack history, emphysema diagnosis and diabetes, which had high permutation importance scores, rarely appeared near the tree’s top levels. This suggests that while these features are critical for overall prediction performance, they may be less involved in the ambiguity that leads to model disagreement. That confusion might arise from other features or noisy variables, such as self-reported health measures or personal health ratings, which may introduce inconsistency into the models’ decisions.
Dimensionality reduction with UMAP served as an exploratory tool to visualise the high-dimensional feature space. The projections revealed that many misclassified samples tended to appear near the boundaries of clusters, supporting the idea that these cases share overlapping or ambiguous characteristics.
Overall, the combination of class-imbalance handling, hyperparameter tuning, and interpretability tools provided a multi-layered understanding of model strengths and limitations. While predictive performance improved through each methodological layer, the study also illuminated how systematic misclassifications and data complexity persist, underscoring the need for more nuanced, context-aware modelling approaches in healthcare prediction tasks.
5.1. Study Constraints and Considerations
Several constraints should be considered when interpreting the findings of this study. First, because the analysis is based on survey data and supervised ML prediction, the identified feature contributions should be interpreted as associative rather than causal. The models indicate which variables improve mortality-risk discrimination, but they do not establish causal mechanisms.
Second, many NHIS variables are self-reported, which may introduce recall bias, subjective inconsistency, and measurement noise. Such variability may affect model stability and contribute to ambiguity in decision boundaries.
Moreover, although the proposed framework performed effectively on the selected IPUMS NHIS sample, model performance and feature-importance patterns may differ across other populations, datasets, and implementation settings due to differences in population composition, class prevalence, variable definitions, and preprocessing choices.
In addition, the treatment of class imbalance was limited to class weighting and resampling techniques, such as SMOTE and SMOTEENN; more advanced imbalance-aware approaches, including cost-sensitive learning or focal loss, were not explored and may further improve model performance.
Finally, although the selected evaluation metrics provide a balanced assessment of model performance under class imbalance, additional metrics such as PR-AUC or calibrated probability analysis were not examined and could offer further insight into model behaviour and reliability in imbalanced prediction settings.
5.2. Clinical and Public Health Implications
Beyond the technical performance of ML method application, this study highlights the importance of explainable artificial intelligence (XAI) in medical and public health applications. The use of interpretation tools enabled a deeper understanding of how models identify mortality risk, revealing several important findings in terms of identification of human vulnerability through the role of social determinants of health. The importance of “Not in Universe” employment status and “feelings of worthlessness” might suggest that mortality is not merely a biological phenomenon, but also a socioeconomic and psychological one. This demonstrates the value of XAI in uncovering non-obvious patterns that may remain hidden in purely performance-driven approaches.
Such insights could prove valuable for health researchers and policy planners, as it highlights the necessity of a holistic approach to the determinants of mortality. Identification of social determinants of health as potential predictors of mortality might be as important as health symptoms and disease diagnoses. Furthermore, our analyses identify subsets of the population that might otherwise remain “invisible” to traditional algorithmic screening. Integration of anomaly detection like Isolation Forest into public health research provides important insight into the identification of atypical high-risk individuals who do not fit the classic clinical characteristics, thereby addressing potential gaps in preventive care.
5.3. Feature Research
Future research could extend this work by validating the proposed framework on additional mortality-related datasets and populations to assess the robustness and generalizability of both predictive performance and feature-importance patterns.
A broader range of ML algorithms and imbalance-aware techniques, such as cost-sensitive learning or focal loss, should also be examined to further assess their impact on predictive performance and model robustness. Expanding the modelling space in this way would provide a more comprehensive understanding of how different approaches handle class imbalance and complex prediction scenarios.
Anomaly detection analysis should be extended by comparing multiple unsupervised methods, such as Local Outlier Factor (LOF) or One-Class SVM, to better understand which instances contribute most to prediction uncertainty. Since anomalies in this context are not labelled, using a variety of algorithms may help capture different types of rare patterns or edge cases that were overlooked by supervised classifiers.
Analyzing how these anomalous instances cluster in feature space could support the creation of new, more informative features. These derived features could then be fed back into the predictive pipeline, potentially improving the F1-score for the minority class by helping models better distinguish subtle patterns associated with high-risk outcomes.
In addition, combining misclassification analysis with anomaly detection shows potential for uncovering hidden patterns that traditional models overlook. This integrative approach could enhance both interpretability and predictive accuracy.
Another consideration is that predicting all-cause mortality might be too broad. Future studies could focus on specific causes of death, which would allow for more target-ed modelling, improved anomaly detection, and greater clinical relevance.
6. Conclusions
This study set out to explore the prediction of all-cause mortality using real-life healthcare survey data from IPUMS NHIS, applying three ML classifiers on a highly imbalanced and high-dimensional dataset. The results unveiled important challenges and valuable opportunities in designing models capable of identifying rare but critical outcomes.
Initial experiments confirmed a well-known dilemma in imbalanced classification: achieving high overall accuracy (approximately 96%), while maintaining very low recall for the minority class (around 20%). This prompted a shift in focus toward recall, F1-score, and AUC as the most meaningful evaluation metrics. Among the tested strategies, class-weighted learning combined with hyperparameter tuning consistently outperformed oversampling methods like SMOTE and SMOTEENN.
Feature importance analyses across all three models consistently highlighted age as the dominant predictor, with younger age groups showing strong negative coefficients (−8.95) in Logistic Regression. Employment status and subjective health indicators, such as poor self-rated health and psychological distress, also stood out as strong indicators. Notably, XGBoost uniquely prioritized features like genetic testing for cancer and activity duration, signalling its ability to capture complex, nonlinear relationships often missed by simpler models.
Permutation importance offered complementary insights. While age remained paramount, clinical factors including history of heart attack, stroke, and diabetes gained prominence, indicating underlying predictive power. Employment status again ranked highly, reinforcing its stability as a mortality proxy. These patterns revealed hidden dependencies essential for sustaining classification performance.
The Decision Tree analysis revealed that misclassifications often stemmed from subjective and behavioural factors—less about clinical diagnoses and more about how people report and live with their health conditions.
Among all models, XGBoost emerged as the best performer. This points to an important avenue: enhancing predictive performance by integrating stronger clinical signals, such as detailed cancer histories and diagnostic markers, alongside lifestyle and psychosocial variables.
Dimensionality reduction with UMAP illustrated that misclassified instances often cluster in specific regions of the feature space, opening opportunities for future cluster-aware or local modelling strategies.
This work advances mortality prediction beyond clinical EHR studies by showing competitive results on non-clinical, population-level survey data that are self-reported, high-dimensional, and severely imbalanced. We find cost-sensitive training to be more reliable than SMOTE/SMOTEENN in this setting, while tuned XGBoost maintains robust minority-class sensitivity across heterogeneous profiles. A post-model misclassification layer uncovers hidden subgroups and pinpoints error hotspots, turning mistakes into actionable insight.