Article

Toward Reliable Models for Distinguishing Epileptic High-Frequency Oscillations (HFOs) from Non-HFO Events Using LSTM and Pre-Trained OWL-ViT Vision–Language Framework

by
Sahbi Chaibi
1,2,* and
Abdennaceur Kachouri
1
1
AFD2E Laboratory, National School of Engineers of Sfax, University of Sfax, Sfax 3038, Tunisia
2
Faculty of Sciences of Monastir, University of Monastir, Monastir 5019, Tunisia
*
Author to whom correspondence should be addressed.
AI 2025, 6(9), 230; https://doi.org/10.3390/ai6090230
Submission received: 15 May 2025 / Revised: 22 June 2025 / Accepted: 8 July 2025 / Published: 14 September 2025
(This article belongs to the Section Medical & Healthcare AI)

Abstract

Background: Over the past two decades, high-frequency oscillations (HFOs) between 80 and 500 Hz have emerged as valuable biomarkers for delineating and tracking epileptogenic brain networks. However, inspecting HFO events in lengthy EEG recordings remains a time-consuming visual process and mainly relies on experienced clinicians. Extensive recent research has emphasized the value of introducing deep learning (DL) and generative AI (GenAI) methods to automatically identify epileptic HFOs in iEEG signals. Owing to the ongoing issue of the noticeable incidence of spurious or false HFOs, a key question remains: which model is better able to distinguish epileptic HFOs from non-HFO events, such as artifacts and background noise? Methods: In this regard, our study addresses two main objectives: (i) proposing a novel HFO classification approach using a prompt engineering framework with OWL-ViT, a state-of-the-art large vision–language model designed for multimodal image understanding guided by optimized natural language prompts; and (ii) comparing a range of existing deep learning and generative models, including our proposed one. Main results: Notably, our quantitative and qualitative analysis demonstrated that the LSTM model achieved the highest classification accuracy of 99.16% among the time-series methods considered, while our proposed method consistently performed best among the different approaches based on time–frequency representation, achieving an accuracy of 99.07%. Conclusions and significance: The present study highlights the effectiveness of LSTM and prompted OWL-ViT models in distinguishing genuine HFOs from spurious non-HFO oscillations with respect to the gold-standard benchmark. These advancements constitute a promising step toward more reliable and efficient diagnostic tools for epilepsy.

Graphical Abstract

1. Introduction

Epilepsy is characterized by irregular and recurrent seizures that primarily arise from aberrant electrical activity in the brain. High-frequency oscillations (HFOs), especially in the 80–500 Hz range, have been recognized as valuable biomarkers for identifying epileptogenic zones [1]. They also hold significant potential for assessing disease severity, monitoring treatment response, and evaluating prognostic outcomes. These oscillations have been observed during both ictal and interictal periods and can be recorded invasively via intracranial EEG or non-invasively through scalp EEG and MEG [2,3]. In fact, an HFO is clinically characterized as a brief rhythmic oscillation of low amplitude, lasting between 30 and 100 milliseconds, typically consisting of at least three cycles, and clearly distinguishable from background activity [4]. HFOs are classified into the following categories: High-Gamma (80–150 Hz), Ripples (80–250 Hz), Fast Ripples (250–500 Hz), and Very-High-Frequency Oscillations (500 up to 2000 Hz) [5]. Despite their remarkable clinical utilities, HFO analyses still rely heavily on visual inspection by experienced neurologists, which requires a great deal of time due to low signal-to-noise ratios, their brief nature, their low rate, and the presence of spikes and artifacts [6]. To overcome these challenges and improve the clinical applicability of HFOs, a wide range of architectures and algorithms have been developed over the past two decades as alternatives to visual inspection.
According to the state of the art, there are three main categories of algorithms developed for detecting, extracting, classifying, distinguishing, and analyzing HFOs: simpler techniques, machine learning-based methods, and deep learning (DL)-based frameworks. Simpler techniques, developed first, and often considered to be the traditional approaches, typically involve rule-based approaches that rely on predefined thresholds and other basic signal processing operations, such as amplitude-based detection, frequency-based analysis, and phase-based processing [7,8]. Although these methods are computationally efficient, they often lack the adaptability required to handle the complexity and variability of HFOs across diverse datasets. Regarding the second type, most machine learning-based approaches often rely on handcrafted features extracted from EEG signals. Although these methods offer improved accuracy compared to simpler techniques, their effectiveness remains heavily reliant on the quality of the chosen features set used to distinguish between HFOs and non-HFO events [9,10]. In contrast, deep learning models leverage neural networks to automatically extract hierarchical informative features from preprocessed EEG data. These methods excel at capturing complex patterns in HFOs, outperforming both machine learning approaches and basic techniques. Indeed, several previous studies [1,11,12,13,14,15] have demonstrated the superior performance of deep learning approaches in detecting and distinguishing HFOs. Table 1, below, depicts an overview of the most recent deep learning and generative models suggested for HFO detection and classification, as reported in the relevant literature.
However, despite these recent advancements in the detection and classification of HFOs, the ongoing issue of a noticeable incidence of spurious or false HFOs remains a significant challenge [16,19,20,27,28,29,30]. Hence, this underscores an immediate need for the development of more efficient and reliable automatic HFO detectors and classifiers. Partly in response to this challenge, our study proposed a novel HFO classification framework based on prompt engineering using OWL-ViT, a prompted large vision–language DL model that integrates a powerful vision backbone with text-prompt engineering. Furthermore, a critical question remains: which model is most reliable and stands out as a top recommendation for accurately classifying HFO patterns and distinguishing them from non-HFO patterns? To this end, the secondary objective of the study is to conduct a comprehensive performance comparison among ten optimized paradigms, referred to as the following: one- and two-dimensional Convolutional Neural Networks (CNNs), Long Short-Term Memory (LSTM) networks, and hybrid architectures combining CNN-2D and LSTM models. We also explored transfer learning frameworks based on two pre-trained models, VGG16 and ResNet101, as well as an AlexNet-based architecture, a 1D time-series Transformer and a 2D Vision Transformer (ViT). Finally, we introduce our proposed framework based on OWL-ViT, a large vision–language prompted model that integrates a powerful vision backbone with text-prompt engineering.
To summarize, our contributions are as follows:
  • A comprehensive overview of existing automated HFO detection and classification approaches utilizing deep learning frameworks.
  • The integration of classical augmentation methods with advanced GAN-based data generation techniques to produce additional realistic synthetic EEG waveforms and TF image maps.
  • The introduction of a novel and advanced approach based on OWL-ViT, a large vision–language-prompted model, along with its methodologies.
  • The optimization, tuning, evaluation, and comparison of different deep learning architectures implemented in this study.
The remaining sections of this paper are organized as follows: Section 1 introduces the research background, research problems, significance, and motivation for conducting this study. Section 2 provides a detailed overview of the dataset employed in this study, followed by a clear description of all the preprocessing steps and methodologies employed. It also introduces briefly the core deep learning paradigms explored, along with their respective key learning hyperparameters. This section is finished by outlining the commonly used evaluation metrics in assessing the performance of various optimized classifiers. Section 3 presents detailed flowcharts of the optimal HFO classification configurations, all of which have been extensively optimized to evaluate their effectiveness in distinguishing between HFO and non-HFO events. This section also presents a typical comparison of experimental results. Section 4 involves a discussion of the attained results, highlighting the contributions and main limitations of this research. As to the ultimate section, it depicts the main concluding remarks, along with a summary of the achieved findings and suggested potential research veins.

2. Materials and Methods

Our proposed experimental framework for the automatic classification of epileptic HFO patterns in iEEG signals involves several key steps: data collection, preprocessing, model training, tuning and fine-tuning, hyperparameter optimization, and model evaluation. At the outset, channels associated with epileptogenic regions were identified and selected for analysis. Experienced clinicians then annotated the various HFO events present within these channels. Subsequently, preprocessing steps were conducted to filter the normalized iEEG signals in both time and time–frequency domains. Next, the annotated data underwent augmentation to improve its variability and size. The final events were further transformed into standardized formats appropriate as inputs for deep learning models. Afterward, the data obtained was split into training, validation, and test subsets. Following the split, each deep learning model was trained, and its key hyperparameters were properly tuned or optimized. Various algorithms were designed to minimize errors or losses and improve accuracy. Finally, the models’ effectiveness was evaluated using nine key classification metrics, ensuring a comprehensive assessment of their predictive accuracy and reliability. The overall workflow methodology of our study is summarized in Figure 1.

2.1. Dataset, Visualizations, and Software Environments

The dataset used in this study was sourced from the Montreal Neurological Institute and Hospital (MNI) in Canada. Three consecutive patients with medically refractory epilepsy were considered in this study. All recordings were preprocessed using a low-pass anti-aliasing filter at 500 Hz and subsequently sampled at 2000 Hz. The data included recordings from 24 subdural grid channels and 70 depth Stereo-EEG (SEEG) channels, each lasting about four minutes, recorded during interictal periods from bilateral mesial temporal lobe epilepsy (MTLE) structures. Data collection adhered to ethical guidelines, with all patients giving informed consent to participate in biomedical research studies in accordance with the MNI’s research ethics protocols. Channels associated with epileptogenic regions were identified and chosen for analysis. According to the inter-rater agreement criteria and following a supervision process conducted by two board-certified neuro-electrophysiologists, each with over 25 years of experience in epilepsy diagnosis and EEG interpretation. Visual annotation and inspection of HFOs were conducted using our custom-designed GUI software package (described in the Supplementary Materials). As a result, the dataset was found to contain 314 distinct HFO events, which were retained for further processing. The results of the experts’ annotations served as the gold-standard benchmark for training various models and guiding their hyperparameter optimization and evaluation.
Most publicly available clinical iEEG datasets are not openly accessible and are often difficult to download due to privacy concerns, consent limitations, and institutional restrictions. While large-scale datasets, especially those involving long-duration intracranial EEG recordings from numerous subjects, are ideal for training deep learning models, in our case, due to the limited dataset size (314 samples), which we consider to be a limitation, two key strategies were adopted, including cross-validation and data augmentation to improve the models’ consistency. Cross-validation has proven effective in improving the consistency and generalizability of models trained on small datasets [11,15,22,26], by splitting the data into multiple subsets and ensuring that the model does not overfit to a particular portion of the data. Overall, it helps prevent overfitting and enhances the model’s generalizability.
Meanwhile, data augmentation methods involve generating highly realistic signals while preserving equivalence to the original HFO and non-HFO events. These techniques have recently proven effective in addressing the challenge of limited training datasets, since collecting new clinical data is not an easy task. Potentially, these techniques have significantly demonstrated their capability in improving HFO classification performance [13,23]. In this work, data generation produced an additional 1756 time–frequency image examples and 1328 time-series samples, equally divided between the two classes. The generated dataset was combined with the original real dataset to form a new balanced dataset, which was stored in .mat files as a gold-standard benchmark for further use in the HFO classification process. The final collected events were first randomly shuffled, then divided into 10 folds. For each training iteration, 7 folds (70% of the samples) were reserved for training, while the remaining 3 folds (30%) were equally split between validation and testing.
Additionally, all code, techniques, and experimental simulations were implemented using Anaconda (Python version 3.11.7), MATLAB (version 2014b), and Google Colab (Python versions: 3.10 and Python 3.11) environments.

2.2. Data Preprocessing

The preprocessing pipeline for raw EEG data typically involves normalization, filtering, standard rescaling or resizing, and other transformations into usable formats. The first step involves applying Max-Abs normalization to the unfiltered EEG signals, scaling amplitudes between −1 and 1 to ensure consistency across data and time. Regarding the filtering process, for 1D classification tasks, a Kaiser FIR filter [31] with a frequency range of 80–500 Hz was applied to isolate HFO-relevant frequencies. For 2D classification tasks, the normalized signals were transformed into time–frequency maps using the CMOR wavelet, which was selected for three main reasons: its strong alignment with the distinctive characteristics of HFOs, its ability to preserve the complete information contained in HFO events, and its suitability for capturing the specific morphological features of HFOs [7,8]. In our implementation, we used a 7-cycle Morlet wavelet with a frequency resolution of 1.1141 Hz and a frequency range spanning 80 to 500 Hz [8]. As a final step, regarding resizing, since the average duration of an HFO is 150 ms, each event was resized to 300 samples for 1D models. For 2D models, the time–frequency maps were resized horizontally to 300 samples and vertically to cover the frequency range from 80 to 500 Hz. They were then formatted as input images with dimensions of 100 × 100 × 3 pixels.

2.3. EEG Data Augmentation Using Conventional and GAN-Based Methods

Several challenges arose due to the fact that the limited size of available datasets, such as ours, could hinder the performance of the designed models. To address this issue, data augmentation was adopted to expand the dataset size by generating additional examples in both the time and time–frequency domains, and therefore to improve the generalization capability and consistency in the compared models. The process involves generating additional examples through two augmentation strategies applied at both the time–domain and time–frequency representation level. The first one is recognized as traditional data augmentation, which is based on conventional and classical operations such as cropping, flipping, rotating, and adjusting contrast and brightness [32,33]. These transformations helped enrich the dataset’s diversity. As a second solution, GANs [32,34] have gained considerable attention due to their impressive results in generating realistic synthetic temporal signals and images. A GAN [35] is a deep learning framework that consists of two competing neural networks: the generator (G) and the discriminator (D). The generator attempts to create realistic data samples from random noise, aimed to mimic real data, while the discriminator evaluates whether a given sample is real (from the training data) or fake (generated by the G). The generator’s primary objective is to produce data that can fool the discriminator into classifying it as real, whereas the discriminator aims to correctly distinguish between genuine and synthetic data.
This adversarial process continuously refines both networks over time, improving the G’s ability to generate increasingly realistic synthetic data, until the D can no longer reliably distinguish between real and fake samples. Consequently, this interaction is formalized as a minimax optimization problem, which can be expressed by the following objective function:
m i n G   m a x D   V D , G = E x ~ p d a t a ( x ) [ log ( D x ) ] + E z ~ p z z   [ log 1 D G z ]  
Here, x represents a sample drawn from the real data distribution  p d a t a ( x ) , while  p z z  denotes the distribution of the random input noise z that is fed into the generator. Meanwhile, D(x) and D(G(z)) are the outputs of the discriminator, corresponding to real and generated data, respectively.
Further details on the adaptative specific GAN architecture employed in our case, known as DCGAN, can be found at https://machinelearningmastery.com/how-to-develop-a-generative-adversarial-network-for-an-mnist-handwritten-digits-from-scratch-in-keras/, (accessed on 5 June 2024). For a deeper understanding of these frameworks and their applications, the referenced website provides comprehensive guidelines and insightful resources to support reproducibility and reuse.

2.4. Key Deep Learning Hyperparameters for Classifying HFOs

When dealing with deep learning methods, there are several key hyperparameters to consider, which should be carefully tuned and properly optimized through trial-and-error strategies to minimize errors and maximize model performance, predictive accuracy, and overall effectiveness. Some of these hyperparameters are common across all different DL architectures, while others are specific to the model being used. While there are no given inference rules directly defining what makes a hyperparameter “good” or “bad,” various alternative strategies can be employed to determine or find optimal hyperparameter values. These strategies typically involve systematic exploration, domain knowledge, iterative refinement, and experimentation to identify optimal configurations that maximize models’ performance or effectiveness. The most common hyperparameters include the learning rate, the number of epochs, batch size, the choice of optimizers, early stopping criteria, and the employed cost function. Next, we turn our attention to the method-specific hyperparameters, which also require careful refinement to efficiently optimize models’ performance. The choice and configuration of these hyperparameters often depend on numerous factors, such as the problem domain, dataset properties, and computational constraints. These might include, for instance, the activation functions, number and configurations of dense layers, specifications of convolutional layers such as kernel sizes and filter counts, dropout rates, stride, padding, and other specific parameters like LSTM units, number of transformer blocks, fully connected layer architectures, prompted inputs, and text queries (prompts).

2.5. Performance Evaluation Metrics Used for Classification Tasks

The ground-truth labels of the HFOs and non-HFOs were used to evaluate the performance of the various classifiers using the ten folds cross-validation technique. True positives (TPs), true negatives (TNs), false positives (FPs), and false negatives (FNs) are evaluated by comparing predicted labels with ground-truth labels. True positives (TPs) denote the number of correctly classified HFO activities. True negatives (TNs) measure the percentage of actual non-HFO activities that are correctly identified. False positives (FPs) represent the number of non-HFO activities incorrectly classified as HFOs, and false negatives (FNs) characterize true HFOs incorrectly classified as non-HFO patterns. Choosing the appropriate evaluative metrics is a critical step in assessing the performance of a developed DL model. To assess our selected HFO classifier models’ performance, several metrics were employed, including accuracy, recall, specificity, negative predictive value (NPV), precision, F1-score, False Discovery Rate (FDR), and Area Under the ROC Curve (AUC). To provide a comprehensive assessment, an overall metric that integrates the 8 metrics into a single measure was also employed, as defined below:
O v e r a l l   m e t r i c = A c c u r a c y + R e c a l l + S p e c i f i c i t y + N P V + P r e c i s i o n + F 1 _ s c o r e + A U C F D R 8

3. Results

Data augmentation techniques have been extensively used in the present study to address the issue of limited dataset sizes, since collecting new clinical data is not an easy task and data scarcity is particularly common when dealing with intracranial EEG data.
Previous high-quality research in the context of HFOs [13,23] has demonstrated that data augmentation significantly improves models’ performance and consistency by increasing data diversity and reducing overfitting, thereby allowing the models to generalize better compared to those without augmentation. In this study, augmentation methods were used to generate additional realistic samples to supplement existing real data. By enriching the dataset with realistic synthetic patterns, these techniques enable models to capture a broader range of patterns, variations, dynamics, features, and dependencies in the data. Figure 2, below, displays snapshots of generated HFOs and non-HFOs (including backgrounds and artifacts examples) in both time and time–frequency domains. These waveforms and images were produced using a combination of classical augmentation methods (e.g., flipping) and advanced DCGAN-based generation-reliant techniques. As illustrated on this figure, the results presented are considered valuable and promising in producing additional HFO events and non-HFO waveforms, showcasing noticeable advancements in EEG pattern augmentation across both time and time–frequency views. This step results in an additional 1756 TF images and 1328 temporal patterns, evenly split between two classes. In addition, to assess the impact of data augmentation, we conducted additional ablation experiments. When augmentation was disabled, the model’s performance dropped notably, with an approximate 5% decrease in accuracy and a 7% increase in loss. In agreement with other previous studies [13,23,24], our findings highlight and confirm that data augmentation substantially improves performance and helps mitigate issues such as overfitting and underfitting, particularly when combined with hyperparameter tuning.
Regarding the optimization process, the best hyperparameter values identified through careful and extensive tuning are presented in Table 2. Various configurations were evaluated by systematically adjusting parameters across increasing and decreasing ranges. The configurations that yielded the highest accuracy while minimizing loss were selected. Initially, a high epoch value of 300 was used as a baseline for all classification models and later optimized per architecture using early stopping criteria. Optimal configurations, in terms of accuracy and loss, were explored by testing a range of hyperparameters. Specifically, learning rates between 10−8 and 0.1, batch sizes from 3 to 50, and widely used optimizers, SGD, Adam, RmsProp, and Adadelta, were evaluated to assess their impact. The loss functions considered included commonly used metrics such as Binary Cross-Entropy and Binary Focal Cross-Entropy. Additionally, k-fold cross-validation with k values ranging from 5 to 15 was examined to ensure a good balance between computational cost and model performance.
Figure 3, below, provides an overview of the optimized models’ configurations, outlining the complete set of hyperparameters used. The CNN-1D model employs four convolutional layers, followed by two layers with 256 and 1 units, respectively. The 2D-CNN uses three convolutional layers and three dense layers with 128, 64, and 1 units, respectively, while the LSTM leverages 10 units to capture temporal dependencies, followed by a dense layer with a single neuron. The hybrid CNN-2D-LSTM model combines a single convolutional layer, followed by eight LSTM units and a dense layer with one output value. Transfer learning with VGG16 and ResNet101 involves freezing the early layers and fine-tuning the remaining layers to adapt the models to our dataset.
AlexNet consists of five convolutional layers, followed by two dense layers, one with 4096 units and the other with a single output unit. Finally, Transformer models (1D and ViT-2D) utilize attention mechanisms [36] to process time-series data and image patches as inputs. While the 1D Transformer employed four transformer blocks, the 2D Transformer achieved its best results with a configuration of three blocks. Both were then followed by two dense layers consisting of 256 neurons and 1 neuron, respectively.
Additionally, we leveraged the OWL-ViT to distinguish epileptic HFO patterns from non-HFO waveforms by using text prompts to guide the model’s classification. The OWL-ViT was developed and trained by Google Research on large pairs of images and text and can be queried with one or multiple text prompts to analyze images. This method allowed us to classify images effectively without needing any task-specific training data. To implement this approach, we followed these steps:
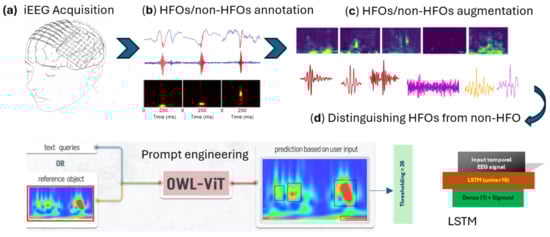
  • Model Setup: We accessed and downloaded the pre-trained large OWL-ViT model on Google Colab through the Hugging Face platform, which provides convenient access to state-of-the-art large models.
  • Data Input: We fed the model with image samples containing both genuine HFOs and non-HFO (artifact, background) patterns for analysis.
  • Prompt Generation: We manually created 556 different text prompts by combining key words like verbs, descriptions, and target terms related to HFO context to cover many ways of describing what the model should detect.
  • Prompt Evaluation: For each prompt or experiment, we ran the model to obtain the result. Our goal was to determine which prompt best helped the model to distinguish real HFOs from artifacts and give a noticeable visual distinction between the two classes.
  • Selecting the Best Prompt and Threshold: Among all tested prompts, the phrase “detect the noise” produced the most clear and significant separation between HFO and non-HFO patterns. The classification decision was based on counting how many bounding boxes the model detected in each image. To find the optimal cutoff point for this count, we used ROC curve analysis, which balances sensitivity (correctly identifying HFOs) and specificity (correctly rejecting artifacts). This analysis showed that using a threshold of 26 bounding boxes gave the best performance in distinguishing between the two categories.
Figure 4 presents a representative example showing that HFO events generally produce fewer detected boxes, while non-HFO activities, including artifacts and background events, are linked to a substantially higher number of detected rectangular objects. This illustrates the critical role of the OWL-ViT model, guided by prompt engineering, in effectively distinguishing between HFOs and non-HFOs.
Based on the testing data, the quantitative results presented in Table 3 demonstrate that the optimized models generally achieved good performance in the HFO classification tasks. This success can be attributed to two main factors: the refinement and optimization phase, which avoided overfitting, and the beneficial impact of data augmentation. Our findings show that the LSTM model achieved the highest classification accuracy of 99.16% among the time-series methods, significantly outperforming the others. This model also obtained the highest average combined overall score. Notably, our proposed OWL-ViT architecture was the best-performing method among the time–frequency-based models, reaching an accuracy of 99.07%. It also achieved the highest combined overall metric within the 2D deep learning architectures, confirming its strong performance.
Although the absolute difference between the top-performing models is small (e.g., 0.09%), it is important to evaluate its statistical significance. We computed the p-value comparing the LSTM model’s accuracy and overall metric to those of OWL-ViT using 10-fold cross-validation. A p-value below 0.05 indicates statistical significance, allowing rejection of the null hypothesis. In our analysis, the p-value was 0.103 for accuracy and 0.0182 for the overall metric, indicating that the difference in the overall metric is statistically significant, while the accuracy difference is not.
Visualizing the training and validation accuracy and loss curves and tracking their progress over iterations provided valuable insights into how effectively each model was learning and generalizing, as well as how closely it was approaching an optimal solution. Analyzing these curves allowed us to evaluate the models’ learning efficiency and generalization capabilities by monitoring convergence behavior and detecting potential underfitting or overfitting issues. As shown in Figure 5, all the optimized models demonstrated remarkably promising performance and good generalization.

4. Discussion

Recent studies highlight the important role of visual inspection of HFOs for understanding epileptic seizures and localizing the EZ, but this process requires substantial time and mental effort. Therefore, effective automated detection and classification of HFOs are considered essential tools for conducting systematic studies on these patterns and enabling their reliable application as clinical biomarkers. In this study, various deep learning approaches, including ours, were explored to differentiate epileptic HFO events from non-epileptic ones. After careful hyperparameter and configuration optimization, the models’ performance was assessed using nine metrics. An effective method should achieve near-perfect, 100%, accuracy, recall, specificity, precision, NPV, AUC, and F1-score, and an overall metric, while minimizing the FDR to close to zero. Achieving optimal conditions is difficult due to the inherent tradeoffs between these metrics. In fact, false HFO classifications may occur primarily due to spurious frequency components introduced by the filtering process of transient activities and rhythmic artifacts, including EMG artifacts, eye-blink artifacts, spikes, sharp waves, and noise artifacts [29,30]. To enable a consistent comparison across different methods, Figure 6 presents bar charts depicting a qualitative visualization of the strengths and weaknesses associated with each model. Consequently, qualitative and quantitative analysis of these bar plots confirms that both the LSTM and OWL-ViT models are particularly well-suited for classifying HFOs in the time and time–frequency domains. Compared to time-series methods, time–frequency approaches are still generally considered more appropriate, especially as they enable to simultaneously characterize HFOs in both time and frequency domains [4].
In summary, although the top-performing LSTM and OWL-ViT models showed higher reliability and performance, minor classification errors were still occasionally observed. Hence, further refinements are needed, as no single approach has eliminated false HFO detections or effectively filtered out background noise and artifacts. Future research may explore hybrid strategies that combine LSTM, OWL-ViT, and Transformer 2D, which are recognized as top-performing models (Figure 6, Table 3), to enhance the robustness and accuracy of HFO classification.
Still, however, several limitations must be acknowledged in this study. First, although the LSTM and OWL-ViT models achieved promising results in classifying HFOs, the study is based on a small cohort of patients, in which only 314 real samples were collected. This limitation, frequently reported in previous studies (as shown in Table 1), may restrict the generalizability of the models to specific new and diverse patterns. While virtual sample generation helps alleviate the issue of data scarcity, a larger cohort of real data is still likely necessary to capture the intricate complexities and variations present in real-world signals.
Second, the limited dataset may have led to slightly inflated accuracies, which could differ when the models are evaluated against larger external datasets.
Third, internal validation was conducted using data from a single institution. To enhance the generalizability and clinical applicability of HFOs, external validation using more data from multiple centers is essential. Such validation should involve broader variability across age groups, diverse symptoms, and clinical profiles, thereby contributing to the further refinement of the models.
Fourth, although numerous HFO classification and detection methods have been developed over the past two decades, a systematic comparison with classical baseline approaches and other machine learning techniques is still needed to objectively assess progress in this field.
Fifth, this study relied exclusively on single-modality data (i.e., iEEG). Integrating additional multimodal recordings, such as scalp EEG and MEG, could enhance the generalizability of outcomes by improving the detection and classification of HFOs. Addressing these limitations in future work could further improve the performance and interpretability of the models, as well as deepen our understanding of the brain’s spatiotemporal propagation dynamics within epileptogenic networks.
In conclusion, although our results are promising, large-scale multicenter validation studies are necessary to confirm the reliability and generalizability of our research findings before they can be safely applied in clinical practice.

5. Conclusions and Future Research Veins

During the past two decades, detectable relevant HFOs from EEG and MEG recordings have gained increasing importance as potential biomarkers for localizing epileptogenic brain networks and monitoring seizure activity. HFO inspection relies heavily on clinicians’ visual analysis, a process that is time-consuming, requires significant mental effort, and is dependent on highly experienced neurologists. Consequently, reliable HFO detection systems are highly needed to enhance the clinical applicability of HFOs. Our findings demonstrated the success of LSTM and OWL-ViT models in distinguishing epileptic HFOs from artifacts across both time and time–frequency domains. To provide a clear roadmap for future work, we outline the following steps: (1) Test the current results on large iEEG, scalp EEG, or MEG datasets to assess their broad generalizability. (2) Conduct prospective multicenter validation to assess the clinical utility of the models. (3) Explore testing other advanced models, such as large language models (LLMs) and large vision models (LVMs) [37]. (4) Implement a voting system among the top models to potentially enhance results. (5) Use advanced super-resolution techniques instead of the traditional CMOR wavelet, such as superlets, Teager–Kaiser energy methods, the Fractional Synchrosqueezing Transform (FrSST), and, especially, convolutional encoder–decoder networks [38,39,40,41], to greatly improve the time–frequency representation of HFO bursts. These improvements open new avenues toward more efficient and reliable generalized classification results.

Supplementary Materials

The following supporting information can be downloaded at: https://www.mdpi.com/article/10.3390/ai6090230/s1, File S1: User guide for HFOs annotation: Version 2.0.

Author Contributions

All authors made substantial contributions to the work and shared responsibility for its content. S.C. conceived and designed the study, developed the codes, performed data and statistical analyses, and drafted the manuscript. A.K. supervised the study and provided critical revisions. All authors have read and agreed to the published version of the manuscript.

Funding

This research did not receive any specific grant from funding agencies in the public, commercial, or not-for-profit sectors. The authors declare that they have no competing interests related to the research findings.

Institutional Review Board Statement

This study involving human participants was approved by the Montreal Neurological Institute and Hospital (MNI), Canada. All participants received a clear and detailed explanation of the study’s objectives.

Informed Consent Statement

Informed consent was obtained from all subjects involved in the study.

Data Availability Statement

The data in this study cannot be shared to protect patients’ privacy and confidentiality.

Acknowledgments

The authors would like to thank the staff of the Montreal Neurological Institute and Hospital (Canada) for kindly providing the dataset used in this study to evaluate and compare the performance of the designed models. We also express our sincere gratitude to the members of the Functional Exploration of the Nervous System Service at CHU Sahloul, Sousse, Tunisia, for their valuable assistance and support in the visual inspection process of HFOs. We sincerely appreciate the support of OpenAI’s ChatGPT-4o language model in enhancing and polishing the language of this article.

Conflicts of Interest

The authors declare that the research was conducted in the absence of any commercial or financial relationships that could be construed as a potential conflict of interest.

Abbreviations

AdagradAdaptive Gradient Algorithm
AdamAdaptive Moment Estimation
AIArtificial Intelligence
AlexNetAlex Convolutional Neural Network
CMOR WaveletComplex Morlet Wavelet
CNNConvolutional Neural Network
CVAEConditional Variational Autoencoder
DAData Augmentation
DCGANDeep Convolutional Generative Adversarial Network
DGCNNDeep Graph Convolutional Neural Network
DLDeep Learning
EEGElectroencephalography
ECoGElectrocorticography
EMGElectromyography
EZEpileptogenic Zone
FDRFalse Discovery Rate
FIRFinite Impulse Response Filter
FrSSTFractional Synchrosqueezing Transform
FRsFast Ripples
GANGenerative Adversarial Network
GenAIGenerative Artificial Intelligence
HFOsHigh-Frequency Oscillations
IEEGIntracranial Electroencephalography
LDALinear Discriminant Analysis
LLMsLarge Language Models
LSTMLong Short-Term Memory
LVMsLarge Vision Models
MEGMagnetoencephalography
OWL-ViTOpen-World Localization Vision Transformer
ResNet101Residual Network with 101 Layers
RmsPropRoot Mean Square Propagation
RonSRipple on Spike
RsRipples
SEEGStereo Electroencephalography
SGDStochastic Gradient Descent
SVMSupport Vector Machine
TFTime–Frequency
TLTransfer Learning
TLETemporal Lobe Epilepsy
ViTVision Transformer
VGG16Visual Geometry Group 16-layer Network

References

  1. Zhang, Y.; Lu, Q.; Monsoor, T.; Hussain, S.A.; Qiao, J.X.; Salamon, N.; Fallah, A.; Sim, M.S.; Asano, E.; Sankar, R.; et al. Roychowdhury V and Nariai H. Refining epileptogenic high-frequency oscillations using deep learning: A reverse engineering approach. Brain Commun. 2021, 4, fcab267. [Google Scholar] [CrossRef] [PubMed]
  2. Noorlag, L.; van Klink, N.E.C.; Kobayashi, K.; Gotman, J.; Braun, K.P.J.; Zijlmans, M. High-frequency oscillations in scalp EEG: A systematic review of methodological choices and clinical findings. Clin. Neurophysiol. 2022, 137, 46–58. [Google Scholar] [CrossRef] [PubMed]
  3. Vasilica, A.M.; Litvak, V.; Cao, C.; Walker, M.; Vivekananda, U. Detection of pathological high-frequency oscillations in refractory epilepsy patients undergoing simultaneous stereo-electroencephalography and magnetoencephalography. Seizure Eur. J. Epilepsy 2023, 107, 81–90. [Google Scholar] [CrossRef]
  4. Chaibi, S.; Mahjoub, C.; Le Bouquin Jeannès, R.; Kachouri, A. Interactive interface for spatio-temporal mapping of epileptic human brain using characteristics of high frequency oscillations (HFOs). Biomed. Signal Process. Control 2023, 85, 105041. [Google Scholar] [CrossRef]
  5. Wang, Y.; Zhou, D.; Yang, X.; Xu, X.; Ren, L.; Yu, T.; Zhou, W.; Shao, X.; Yang, Z.; Wang, S.; et al. Expert consensus on clinical applications of high-frequency oscillations in epilepsy. Acta Epileptol. 2020, 2, 8. [Google Scholar] [CrossRef]
  6. Wong, S.M.; Arski, O.N.; Workewych, A.M.; Donner, E.; Ochi, A.; Otsubo, H.; Snead III, O.C.; Ibrahim, G.M. Detection of high-frequency oscillations in electroencephalography: A scoping review and an adaptable open-source framework. Seizure 2021, 84, 23–33. [Google Scholar] [CrossRef]
  7. Chander, R. Algorithms to Detect High Frequency Oscillations in Human Intracerebral EE.G. Ph.D. Thesis, Department of Biomedical Engineering McGill University Montreal, Montreal, QC, Canada, 2007. [Google Scholar]
  8. Chaibi, S.; Lajnef, T.; Sakka, Z.; Samet, M.; Kachouri, A. A comparison of methods for detection of high frequency oscillations (HFOs) in human intracerebral EEG recordings. Am. J. Signal Process. 2013, 3, 25–34. [Google Scholar] [CrossRef]
  9. Krikid, F.; Karfoul, A.; Chaibi, S.; Kachenoura, A.; Nica, A.; Kachouri, A.; Le Bouquin Jeannès, R. Classification of high frequency oscillations in intracranial EEG signals based on coupled time-frequency and image-related features. Biomed. Signal Process. Control 2022, 73, 103418. [Google Scholar] [CrossRef]
  10. Chaibi, S.; Mahjoub, C.; Ayadi, W.; Kachouri, A. Epileptic EEG patterns recognition through machine learning techniques and relevant time-frequency features. Biomed. Eng./Biomed. Tech. 2024, 69, 111–123. [Google Scholar] [CrossRef]
  11. Liu, J.; Sun, S.; Liu, Y.; Guo, J.; Li, H.; Gao, Y.; Sun, J.; Xiang, J. A novel MEGNet for classification of high-frequency oscillations in magnetoencephalography of epileptic patients. Complexity 2020. [CrossRef]
  12. Zhao, B.; Hu, W.; Zhang, C.; Wang, X.; Wang, Y.; Liu, C.; Mo, J.; Yang, X.; Sang, L.; Ma, Y.; et al. Integrated Automatic Detection, Classification and Imaging of High Frequency Oscillations with Stereo electroencephalography. Front. Neurosci. 2020, 14, 546. [Google Scholar] [CrossRef] [PubMed]
  13. Guo, J.; Xiao, N.; Li, H.; He, L.; Li, Q.; Wu, T.; He, X.; Chen, P.; Chen, D.; Xiang, J.; et al. Transformer-based high-frequency oscillation signal detection on magnetoencephalography from epileptic patients. Front. Mol. Biosci. 2022, 9, 822810. [Google Scholar] [CrossRef]
  14. Zhang, M.; Liu, J.; Liu, C.; Wu, T.; Peng, X. An efficient CADNet for classification of high-frequency oscillations in magnetoencephalography. In Proceedings of the 2022 4th International Conference on Robotics and Computer Vision (ICRCV), Wuhan, China, 25–27 September 2022; pp. 25–30. [Google Scholar] [CrossRef]
  15. Sadek, Z.; Hadriche, A.; Maalej, R.; Jmail, N. Multi-classification of High-Frequency Oscillations Using iEEG Signals and Deep Learning Models. J. Image Graph. 2025, 13, 52–63. [Google Scholar] [CrossRef]
  16. Lai, D.; Chen, Z.; Zeng, Z.; Ma, K.; Zhang, X.; Chen, W.; Zhang, H. Automated detection of high frequency oscillations in intracranial EEG using the combination of short-time energy and convolutional neural networks. IEEE Access 2019, 7, 82501–82511. [Google Scholar] [CrossRef]
  17. Ma, K.; Lai, D.; Chen, Z.; Zeng, Z.; Zhang, X.; Chen, W.; Zhang, H. Automatic detection of high frequency oscillations (80–500 Hz) based on convolutional neural network in human intracerebral EE.G. In Proceedings of the 2019 41st Annual International Conference of the IEEE Engineering in Medicine and Biology Society (EMBC), Berlin, Germany, 23–27 July 2019; pp. 5133–5136. [Google Scholar] [CrossRef]
  18. Medvedev, A.V.; Agoureeva, G.I.; Murro, A.M. A long short-term memory neural network for the detection of epileptiform spikes and high-frequency oscillations. Sci. Rep. 2019, 9, 19374. [Google Scholar] [CrossRef]
  19. Zuo, R.; Wei, J.; Li, X.; Li, C.; Zhao, C.; Ren, Z.; Liang, Y.; Geng, X.; Jiang, C.; Yang, X.; et al. Automated Detection of High-Frequency Oscillations in Epilepsy Based on a Convolutional Neural Network. Front. Comput. Neurosci. 2019, 13, 6. [Google Scholar] [CrossRef]
  20. Yuki, T.; Yutaro, T.; Keiya, I.; Masaki, I.; Yumie, O. Efficient Detection of High-frequency Biomarker Signals of Epilepsy by a Transfer-learning-based Convolutional Neural Network. Adv. Biomed. Eng. 2021, 10, 158–165. [Google Scholar] [CrossRef]
  21. Ren, G.; Sun, Y.; Wang, D.; Ren, J.; Dai, J.; Mei, S.; Li, Y.; Wang, X.; Yang, X.; Yan, J.; et al. Identification of Epileptogenic and Non-epileptogenic High-Frequency Oscillations Using a Multi-Feature Convolutional Neural Network Model. Front. Neurol. 2021, 12, 640526. [Google Scholar] [CrossRef]
  22. Milon-Harnois, G.; Jrad, N.; Schang, D.; van Bogaert, P.; Chauvet, P. 1D vs 2D convolutional neural networks for scalp high frequency oscillations identification. In Proceedings of the 30th European Symposium on Artificial Neural Networks, Computational Intelligence and Machine Learning, Bruges, Belgium, 5–7 October 2022; p. 211. [Google Scholar] [CrossRef]
  23. Krikid, F.; Karfoul, A.; Chaibi, S.; Kachenoura, A.; Nica, A.; Kachouri, A.; Le Bouquin Jeannès, R. Multi-classification of high frequency oscillations in intracranial EEG signals based on CNN and data augmentation. Signal Image Video Process. 2023, 18, 1099–1109. [Google Scholar] [CrossRef]
  24. Broti, N.M.; Sawada, M.; Takayama, Y.; Iwasaki, M.; Ono, Y. Detection of high-frequency biomarker signals of epilepsy by combined deep-learning feature selection and linear discrimination analysis. In Proceedings of the 37th Annual Conference of the Japanese Society for Artificial Intelligence 2023, Kumamoto, Japan, 6–9 June 2023. Paper 1L5-OS-18b-03. [Google Scholar]
  25. Gharebaghi, F.; Sardouie, S.H. HFO detection from iEEG signals in epilepsy using time-trained graphs and deep graph convolutional neural network. In Proceedings of the 2024 32nd International Conference on Electrical Engineering (ICEE) 2024, Tehran, Iran, 14–16 May 2024; pp. 1–7. [Google Scholar] [CrossRef]
  26. Chen, W.; Kang, T.; Heyat, M.B.B.; Fatima, J.E.; Xu, Y.; Lai, D. Unsupervised detection of high-frequency oscillations in intracranial electroencephalogram: Promoting a valuable automated diagnostic tool for epilepsy. Front. Neurol. 2025, 16, 1455613. [Google Scholar] [CrossRef]
  27. Bénar, C.G.; Chauvière, L.; Bartolomei, F.; Wendling, F. Pitfalls of high pass filtering for detecting epileptic oscillations: A technical note on “false” ripples. Clin. Neurophysiol. 2010, 121, 301–310. [Google Scholar] [CrossRef] [PubMed]
  28. Park, C.J.; Hong, S.B. High Frequency Oscillations in Epilepsy: Detection Methods and Considerations in Clinical Application. J. Epilepsy Res. 2019, 9, 1–13. [Google Scholar] [CrossRef]
  29. Gliske, S.V.; Qin, Z.; Lau, K.; Alvarado-Rojas, C.; Salami, P.; Zelman, R.; Stacey, W.C. Distinguishing false and true positive detections of high frequency oscillations. J. Neural Eng. 2020, 17, 056005. [Google Scholar] [CrossRef] [PubMed]
  30. Zhou, Y.; You, J.; Kumar, U.; Weiss, S.A.; Bragin, A.; Engel, J., Jr.; Papadelis, C.; Li, L. An approach for reliably identifying high-frequency oscillations and reducing false-positive detections. Epilepsia Open 2022, 7, 674–686. [Google Scholar] [CrossRef]
  31. Chaibi, S.; Mahjoub, C.; Kachouri, A. EEG-based cognitive fatigue recognition using relevant multi-domain features and machine learning. Adv. Neural Eng. Brain-Comput. Interfaces 2025, 327–344. [Google Scholar] [CrossRef]
  32. Zhang, K.; Xu, G.; Han, Z.; Ma, K.; Zheng, X.; Chen, L.; Duan, N.; Zhang, S. Data Augmentation for Motor Imagery Signal Classification Based on a Hybrid Neural Network. Sensors 2020, 20, 4485. [Google Scholar] [CrossRef] [PubMed]
  33. Yang, C.; Xiao, C.; Westover, M.B.; Sun, J. Self-Supervised Electroencephalogram Representation Learning for Automatic Sleep Staging: Model Development and Evaluation Study. JMIR AI 2023, 2, e46769. [Google Scholar] [CrossRef]
  34. Du, X.; Wang, X.; Zhu, L.; Ding, X.; Lv, Y.; Qiu, S.; Liu, Q. Electroencephalographic Signal Data Augmentation Based on Improved Generative Adversarial Network. Brain Sci. 2024, 14, 367. [Google Scholar] [CrossRef]
  35. Gui, J.; Sun, Z.; Wen, Y.; Tao, D.; Ye, J. A review on generative adversarial networks: Algorithms, theory, and applications. IEEE Trans. Knowl. Data Eng. 2023, 35, 3313–3332. [Google Scholar] [CrossRef]
  36. Vaswani, A.; Shazeer, N.; Parmar, N.; Uszkoreit, J.; Jones, L.; Gomez, A.N.; Kaiser, L.; Polosukhin, I. Attention is all you need. In Proceedings of the 31st International Conference on Neural Information Processing Systems, Long Beach, CA, USA, 4–9 December 2017; pp. 6000–6010. [Google Scholar] [CrossRef]
  37. Cooper, A.; Kato, K.; Shih, C.-H.; Yamane, H.; Vinken, K.; Takemoto, K.; Sunagawa, T.; Yeh, H.-W.; Yamanaka, J.; Mason, I.; et al. Rethinking VLMs and LLMs for image classification. Sci. Rep. 2025, 15, 19692. [Google Scholar] [CrossRef] [PubMed]
  38. Boudraa, A.O.; Salzenstein, F. Teager–Kaiser energy methods for signal and image analysis. Digit. Signal Process. 2018, 78, 338–375. [Google Scholar] [CrossRef]
  39. Moca, V.V.; Bârzan, H.; Nagy-Dăbâcan, A.; Mihali, A.; Mureșan, R.C. Time-frequency super-resolution with superlets. Nat. Commun. 2021, 12, 337. [Google Scholar] [CrossRef] [PubMed]
  40. Li, Y.; Ramli, D.A. Fractional synchrosqueezing transform for enhanced multicomponent signal separation. Sci. Rep. 2024, 14, 18082. [Google Scholar] [CrossRef]
  41. Wang, Z.; Chen, L.; Xiao, P.; Xu, L.; Li, Z. Enhancing time-frequency resolution via deep-learning framework. IET Signal Process. 2023, 17, e12210. [Google Scholar] [CrossRef]
Figure 1. Schematic diagram illustrating the main steps for HFOs classification in clinical practice: (A) HFO annotation; (B) preprocessing using digital Kaiser FIR filter and CMOR wavelet; (C) data augmentation in both time and time–frequency domains; and (D) model optimization and evaluation.
Ai 06 00230 g001
Figure 2. HFO and non-HFO augmentation using classical and DCGAN-based techniques.
Ai 06 00230 g002
Figure 3. An illustration of different optimized deep learning configurations designed to distinguish HFOs from non-HFOs. (a) One-dimensional CNN model, (b) LSTM model, (c) Transformer 1D, (d) bi-dimensional CNN, (e) CNN-2D-LSTM, (f) AlexNet, (g) ResNet101, (h) VGG16, (i) bi-dimensional ViT Tansformer, and (j) OWL-ViT encoder.
Ai 06 00230 g003
Figure 4. Example of distinguishing between HFOs and non-HFOs based on our proposed OWL-ViT encoder. (a) HFO examples, (b) background instances, and (c) artifact samples.
Ai 06 00230 g004
Figure 5. Accuracy and loss curves of different methods. Note: OWL-ViT was not included in Figure 5 because it does not require model training. As a pre-trained vision–language model, it operates through prompt-based inference rather than learning from labeled data.
Ai 06 00230 g005
Figure 6. Bar charts for assessing classification performance of HFOs. OWL-ViT and LSTM outperform other methods and typically achieve comparable results.
Ai 06 00230 g006
Table 1. An overview of state-of-the-art deep learning methods for HFO detection and classification. This table outlines details such as the authors, methods used, datasets, model performance, encountered challenges, and the clinical significance of each study’s findings.
Authors
Year of Publication
Deep Learning Method
Nature of Dataset
Size of Gold Standard
Models’ EfficiencyEncountered PitfallsSignificance of Results
Lai D et al., 2019
[16]
CNN-2D
Intracranial EEG data
Five patients
14,998 real HFOs
Sensitivity = 88.16% Rs
Sensitivity = 93.37% FRs
FDR = 12.58% for Rs
FDR = 8.1% for FRs
A relatively small dataset was collected in this work, which still poses challenges to the generalizability of the model.
The proposed model allows fast analysis of large amounts of test data with higher accuracy.
Ma K et al., 2019
[17]
CNN-2D
Intracranial EEG data
Three epileptic patients
9200 real HFOs
Precision = 94.19%
Recall = 89.37%
F1-score = 91.71%
Limitations include a small patient’s dataset, risk of overfitting, and the need for more clinical data and cross-validation to improve the CNN’s performance and generalizability.The proposed HFO detector would be more efficient and useful in the diagnosis of epilepsy.
Medvedev A.V et al., 2019
[18]
LSTM
Intracranial EEG
12 patients
2000 events (R, RonS)
Accuracy and specificity for each class exceeding 90%-The proposed model can significantly accelerate the analysis of iEEG data and increase their diagnostic value, which may improve surgical
outcomes.
Zuo R et al., 2019
[19]
CNN-2D
Intracranial EEG
19 participants
49,340 Rs and 19,734 FRs
Sensitivity: 77.04% for Rs and 83.23% for FRs
Specificity: 72.27% for Rs and 79.36% for FRs
It lacked cross-channel information and was unable to capture the main characteristics of HFOs, such as duration, amplitude, and energy.This detector may be used to assist clinicians in locating epileptogenic zones.
Liu J et al., 2020
[11]
MEGNET
MEG
20 epileptic patients
50 Rs and 50 FRs
Accuracy, precision, recall, and F1-score: 94%, 95%, 94%, and 94%The gold-standard dataset is small, with only 100 samples used.
There is a lack of external validation.
Only single-modality data (i.e., MEG) was utilized. Multimodal data (e.g., concurrent EEG recordings) are needed for improved performance.
The proposed method is robust and outperforms the compared models.
Zhao B et al., 2020
[12]
ResNet101
SEEG
20 patients
38,447 R events
26,454 FR events
Accuracies on the validation dataset were above 95%Performance validation on a larger cohort of data from a multicenter is needed.
This algorithm is computationally expensive.
This detector can provide robust HFO analysis results, revealing EZ identification.
Yuki T et al., 2021
[20]
Transfer learning with
AlexNet CNN
ECoG data
Two patients
1809 real HFOs
The accuracy and F1-measure were greater
than 91% and 73%, respectively
FDR = 19.0 ± 4.42%.
A larger number of patients is required to enhance the generality and feasibility of the model.
There were limitations regarding the age of the patients.
The results suggest that the proposed method may provide an accurate, automatic, and personalized HFO classification.
Zhang Y et al., 2021
[1]
CNN-2D
Intracranial EEG data
19 patients
10151 real HFOs
Accuracy = 96.3%, F1-score = 96.8% using artifact detection modelIt is of interest to include more patients and EEG data to train and improve the model.
All the data were collected from the same institution.
This framework reliably replicated the HFO classification tasks typically performed by human experts.
Ren G et al., 2021
[21]
CNN-2D
Intracranial EEG data
19 patients
7000 epochs of Rs and 2000 epochs of FRs
Accuracy: 80.89 ± 1.43% and 77.85 ± 1.61% for Rs and FRsThere was a limitation in the number of patients.
In addition, same patients were used for training, validation, and testing.
Due to the small number of events, the performance of the model was not good enough.
The proposed method is an effective deep learning model that can be used to distinguish EZ and non-EZ HFOs.
Milon-Harnois G et al., 2022
[22]
CNN-1D and CNN-2D
Scalp EEG
Three epileptic patients
2591 visually labeled HFOs
Precision, sensitivity, specificity, and F1-score:
85.7%, 84.9%, 85.7%, and 85.3% for CNN-2D
87.5%, 91.4%, 86.9%, and 89.4% for CNN-1D
-Experimental results show that CNN-1D is more effective compared to CNN-2D.
The proposed DL models reached competitive performance levels.
Guo J et al., 2022
[13]
Transformer 1D
MEG data
20 clinical patients
101 HFO samples
Accuracy of 0.9615, precision of 1.000, sensitivity of 0.9286, specificity of 1.000, and F-score of 0.963 A small cohort of epilepsy patients, from which 101 samples from 20 patients were collected.
Internal validation was conducted on a set of data from one institution.
The proposed framework outperforms the state-of-the-art HFO classifiers.
Zhang M et al., 2022
[14]
CNN-2D+ Transformer 2D
MEG data
20 epileptic patients
50 Ripples and 50 FRs
Accuracy, precision, recall, and F1-score of the optimized model reached 0.97, 0.98, 0.97, and 0.97-The results demonstrate that this model outperforms other compared methods.
Krikid F et al., 2023
[23]
CNN-2D with Data augmentation
Intracranial EEG
Five patients
710 Rs and 418 FRs
Sensitivity, specificity, accuracy, and F1-score, are, respectively, 0.861, 0.964, 0.978, and 0.905-The proposed approach yields superior results.
Broti NM et al., 2023
[24]
VGG19 + LDA
ECoG data
2 patients
1809 real HFOs
Accuracy of 87%-This method may aid clinical research by reducing the need for large annotations and accurate HFO detection.
Gharebaghi F et al., 2024
[25]
DGCNN
iEEG
20 patients
Sensitivity of 90.7%, specificity of 93.3%, and an AUC of 0.96-The proposed approach automatically learns discriminative features across patients.
Sadek Z et al., 2025
[15]
GoogLeNet + SVM
iEEG
21 patients
3220 trials of HFOs
Accuracy: 94.07% This study was limited by increased data dimensionality from HFO-to-image conversion.
A relatively small dataset was used, which affected the model generalization.
This model hold promise for classifying epileptic biomarkers and may improve seizure prediction.
Chen W et al., 2025
[26]
CVAE autoencoder +
K-means
iEEG
5 patients
1611 HFOs
Accuracy of 93.02%, sensitivity of 94.48%,
specificity of 92.06%
There was limited patient diversity (age and clinical symptoms).
Small dataset size: larger and more varied data are needed.
It offers a promising clinical tool to support surgical planning and improve outcomes in epilepsy patients.
The method shows promise for aiding surgical planning in epilepsy.
Table 2. Optimized hyperparameters obtained by minimizing losses and maximizing accuracies. Since OWL-ViT is used directly as a pre-trained model, no additional optimization, training, or fine-tuning is necessary.
HyperparameterOptimizerLoss FunctionBatch SizeNumber of Epochs in Early StoppingLearning RateCross-ValidationPatience Used in Early Stopping
Method
CNN-1DRmsPropBinary Cross-Entropy201300.0003 15
LSTM15570.003 10
Transformer 1D40550.0003 20
CNN-2D121350.000410-K-Folders25
CNN-2D-LSTM201400.000415
VGG1615890.000215
ResNet10130250.00054
AlexNet50340.0000015
Transformer ViT-2D10650.000415
OWL-ViT method-------
Table 3. Performance comparison of various networks for distinguishing epileptic HFO events from non-epileptic ones. Bold values highlight the most significant results achieved.
Performance MetricFDRAccuracyRecallSpecificityNPVPrecisionF1-ScoreAUCOverall Metric
Method
Time-series
DL Networks
CNN-1D9.8491.9494.1689.7293.8990.1592.1192.079.26
LSTM1.6399.1610098.3310098.3699.1799.086.54
Transformer-1D12.5490.5095.0485.7794.3187.4591.0890.077.70
Time–Frequency
DL Networks
CNN-2D3.1296.896.8796.7296.7296.8796.8797.084.34
CNN-2D-LSTM4.2690.7785.2396.2586.8495.7390.1791.078.96
VGG166.8193.3094.6191.7493.4593.1893.8993.080.79
ResNet1014.7693.3092.3094.4991.1595.7390.1791.080.42
AlexNet1.6196.895.3198.3695.2398.3896.8297.084.53
Transformer-2D3.0198.1099.2297.0199.2396.9898.0998.085.45
Prompted OWL-ViT1.2599.0799.4198.7499.1599.4099.0897.0086.32
Disclaimer/Publisher’s Note: The statements, opinions and data contained in all publications are solely those of the individual author(s) and contributor(s) and not of MDPI and/or the editor(s). MDPI and/or the editor(s) disclaim responsibility for any injury to people or property resulting from any ideas, methods, instructions or products referred to in the content.

