Article

Robust Single-Cell RNA-Seq Analysis Using Hyperdimensional Computing: Enhanced Clustering and Classification Methods

by
Hossein Mohammadi
1,
Maziyar Baranpouyan
2,
Krishnaprasad Thirunarayan
1,* and
Lingwei Chen
1
1
Department of Computer Science and Engineering, Wright State University, Dayton, OH 45435, USA
2
Accenture Technology Labs, San Francisco, CA 94105, USA
*
Author to whom correspondence should be addressed.
Submission received: 24 March 2025 / Revised: 16 April 2025 / Accepted: 24 April 2025 / Published: 1 May 2025

Abstract

:
Background. Single-cell RNA sequencing (scRNA-seq) has transformed genomics by enabling the study of cellular heterogeneity. However, its high dimensionality, noise, and sparsity pose significant challenges for data analysis. Methods. We investigate the use of Hyperdimensional Computing (HDC), a brain-inspired computational framework recognized for its noise robustness and hardware efficiency, to tackle the challenges in scRNA-seq data analysis. We apply HDC to both supervised classification and unsupervised clustering tasks. Results. Our experiments demonstrate that HDC consistently outperforms established methods such as XGBoost, Seurat reference mapping, and scANVI in terms of noise tolerance and scalability. HDC achieves superior accuracy in classification tasks and maintains robust clustering performance across varying noise levels. Conclusions. These results highlight HDC as a promising framework for accurate and efficient single-cell data analysis. Its potential extends to other high-dimensional biological datasets including proteomics, epigenomics, and transcriptomics, with implications for advancing bioinformatics and personalized medicine.

1. Introduction

Single-cell RNA sequencing (scRNA-seq) has revolutionized genomics by enabling the exploration of cellular heterogeneity at an unprecedented resolution. This technology allows for the detailed analysis of the transcriptomes of individual cells, revealing the complexities of gene expression within heterogeneous cell populations. The ability to analyze single cells rather than bulk cell populations is crucial for understanding the distinct roles and behaviors of different cell types, particularly in complex tissues or under varying conditions such as disease states [1,2,3,4].
The process of scRNA-seq involves isolating individual cells, capturing their RNA, converting this RNA into complementary DNA (cDNA), and then sequencing these cDNA molecules to profile the transcriptome. Various methods for single-cell isolation include fluorescence-activated cell sorting (FACS), microfluidic devices, and droplet-based systems like Drop-seq and 10x Genomics, which have greatly enhanced the throughput and accuracy of single-cell analysis [1,2,3,4].
scRNA-seq has significant implications for biomedical research. It allows for the identification of rare cell types, the discovery of new cell states, and the understanding of cellular responses to environmental changes. It has been instrumental in advancing cancer research, immunology, and developmental biology by providing insights into cellular dynamics and tissue organization [1,5]. However, scRNA-seq data pose several challenges. The high dimensionality of the data, inherent noise, and sparse gene expression complicate the analysis. Noise can arise from various sources, including technical variability during sample preparation and sequencing, as well as biological variability between cells. Moreover, the dropout effects, where some transcripts are missed during sequencing, further add to the data sparsity and complexity [1,5,6].
Hyperdimensional computing (HDC) is a brain-inspired computing paradigm that is gaining popularity due to its robustness to noise and hardware-based computational efficiency. HDC represents data as high-dimensional vectors, or hypervectors, which can be manipulated to perform various computational tasks. Thiss aspproach is particularly suited for applications requiring noise resilience and efficient processing, such as in bioinformatics [7,8], robotics [9], image and signal processing [10], natural language processing [11], and brain–machine interfaces [12]. The origins of HDC lie in cognitive neuroscience and the theory of vector symbolic architectures (VSAs). It mimics brain functions by using high-dimensional spaces to encode, store, and process information. This makes HDC highly parallelizable and fault-tolerant, ideal for dealing with the noisy and high-dimensional nature of scRNA-seq data [1,4].
Researchers have introduced various classification and clustering methodologies using HDC. For classification, methods like QuantHD utilize high-dimensional hypervector encoding and iterative training to improve accuracy. These approaches have been shown to outperform traditional machine learning methods, such as XGBoost and Seurat, in handling noisy scRNA-seq data [2,4]. In clustering, HDC-based methods have demonstrated significant improvements in noise robustness and computational efficiency. By encoding single-cell data into high-dimensional vectors, these methods can effectively cluster cells with similar expression profiles, even in the presence of substantial noise and sparsity [3,5].
The accurate classification and clustering of scRNA-seq data are critical for understanding cellular heterogeneity and dynamics. Improved methods for these tasks can lead to better insights into tissue function, disease mechanisms, and the discovery of new cell types and states. Progress in noise-robust classification and clustering methods can significantly enhance the analysis of scRNA-seq data, leading to more accurate biological interpretations and potential applications in personalized medicine [1,3,5,6].
In this paper, we explore the key advancements and challenges in scRNA-seq, and introduce HDC as an innovative approach to improve the classification and clustering of scRNA-seq data. Our major contributions are listed below:
Innovative Encoding Methodology: We implement HDC for scRNA-seq datasets, introducing a novel encoding methodology that effectively translates high-dimensional single-cell data into hyperdimensional vectors. We rigorously interpret the role of each part of the methodology and its relationship within the bioinformatics context, verifying its significance through comprehensive analyses. This approach optimizes the data for HDC applications, demonstrating enhanced robustness and efficacy in managing the complexities of scRNA-seq data.
Improved Robustness and Comprehensive Analysis: This paper presents a comprehensive experimental analysis that demonstrates the efficacy of HDC in both supervised (classification) and unsupervised (clustering) tasks. Through extensive experiments, we show that HDC significantly enhances the robustness of these algorithms when handling the inherent noise and sparsity of scRNA-seq datasets. Additionally, we evaluate the impact of varying levels of noise and different hyperparameters on the performance of our proposed methods.
Customized Hypervector Adjustment: We develop an approach to adjust the base hypervectors to better represent the features of the dataset at hand. This customization is designed to enhance the biological relevance of the encoded data. We verify the effectiveness of these adjustments through rigorous experimentation, showcasing their impact on improving classification and clustering performance in the presence of noisy and sparse data.
The paper is organized as follows: In Section 2, we detail the process of encoding scRNA-seq data into hyperdimensional vectors. We then describe the methodology used for clustering these encoded datasets, followed by the classification methodology. Section 3 presents the experimental setup and results, including clustering, classification, and classification under varying noise levels, as well as an experiment focused on improving encoding for better biological representation. In Section 4, we discuss the significance of each aspect of the methodology and explore the impact of hyperparameters. Finally, Section 5 concludes with a summary of our findings and suggests potential directions for future research.

2. Methods

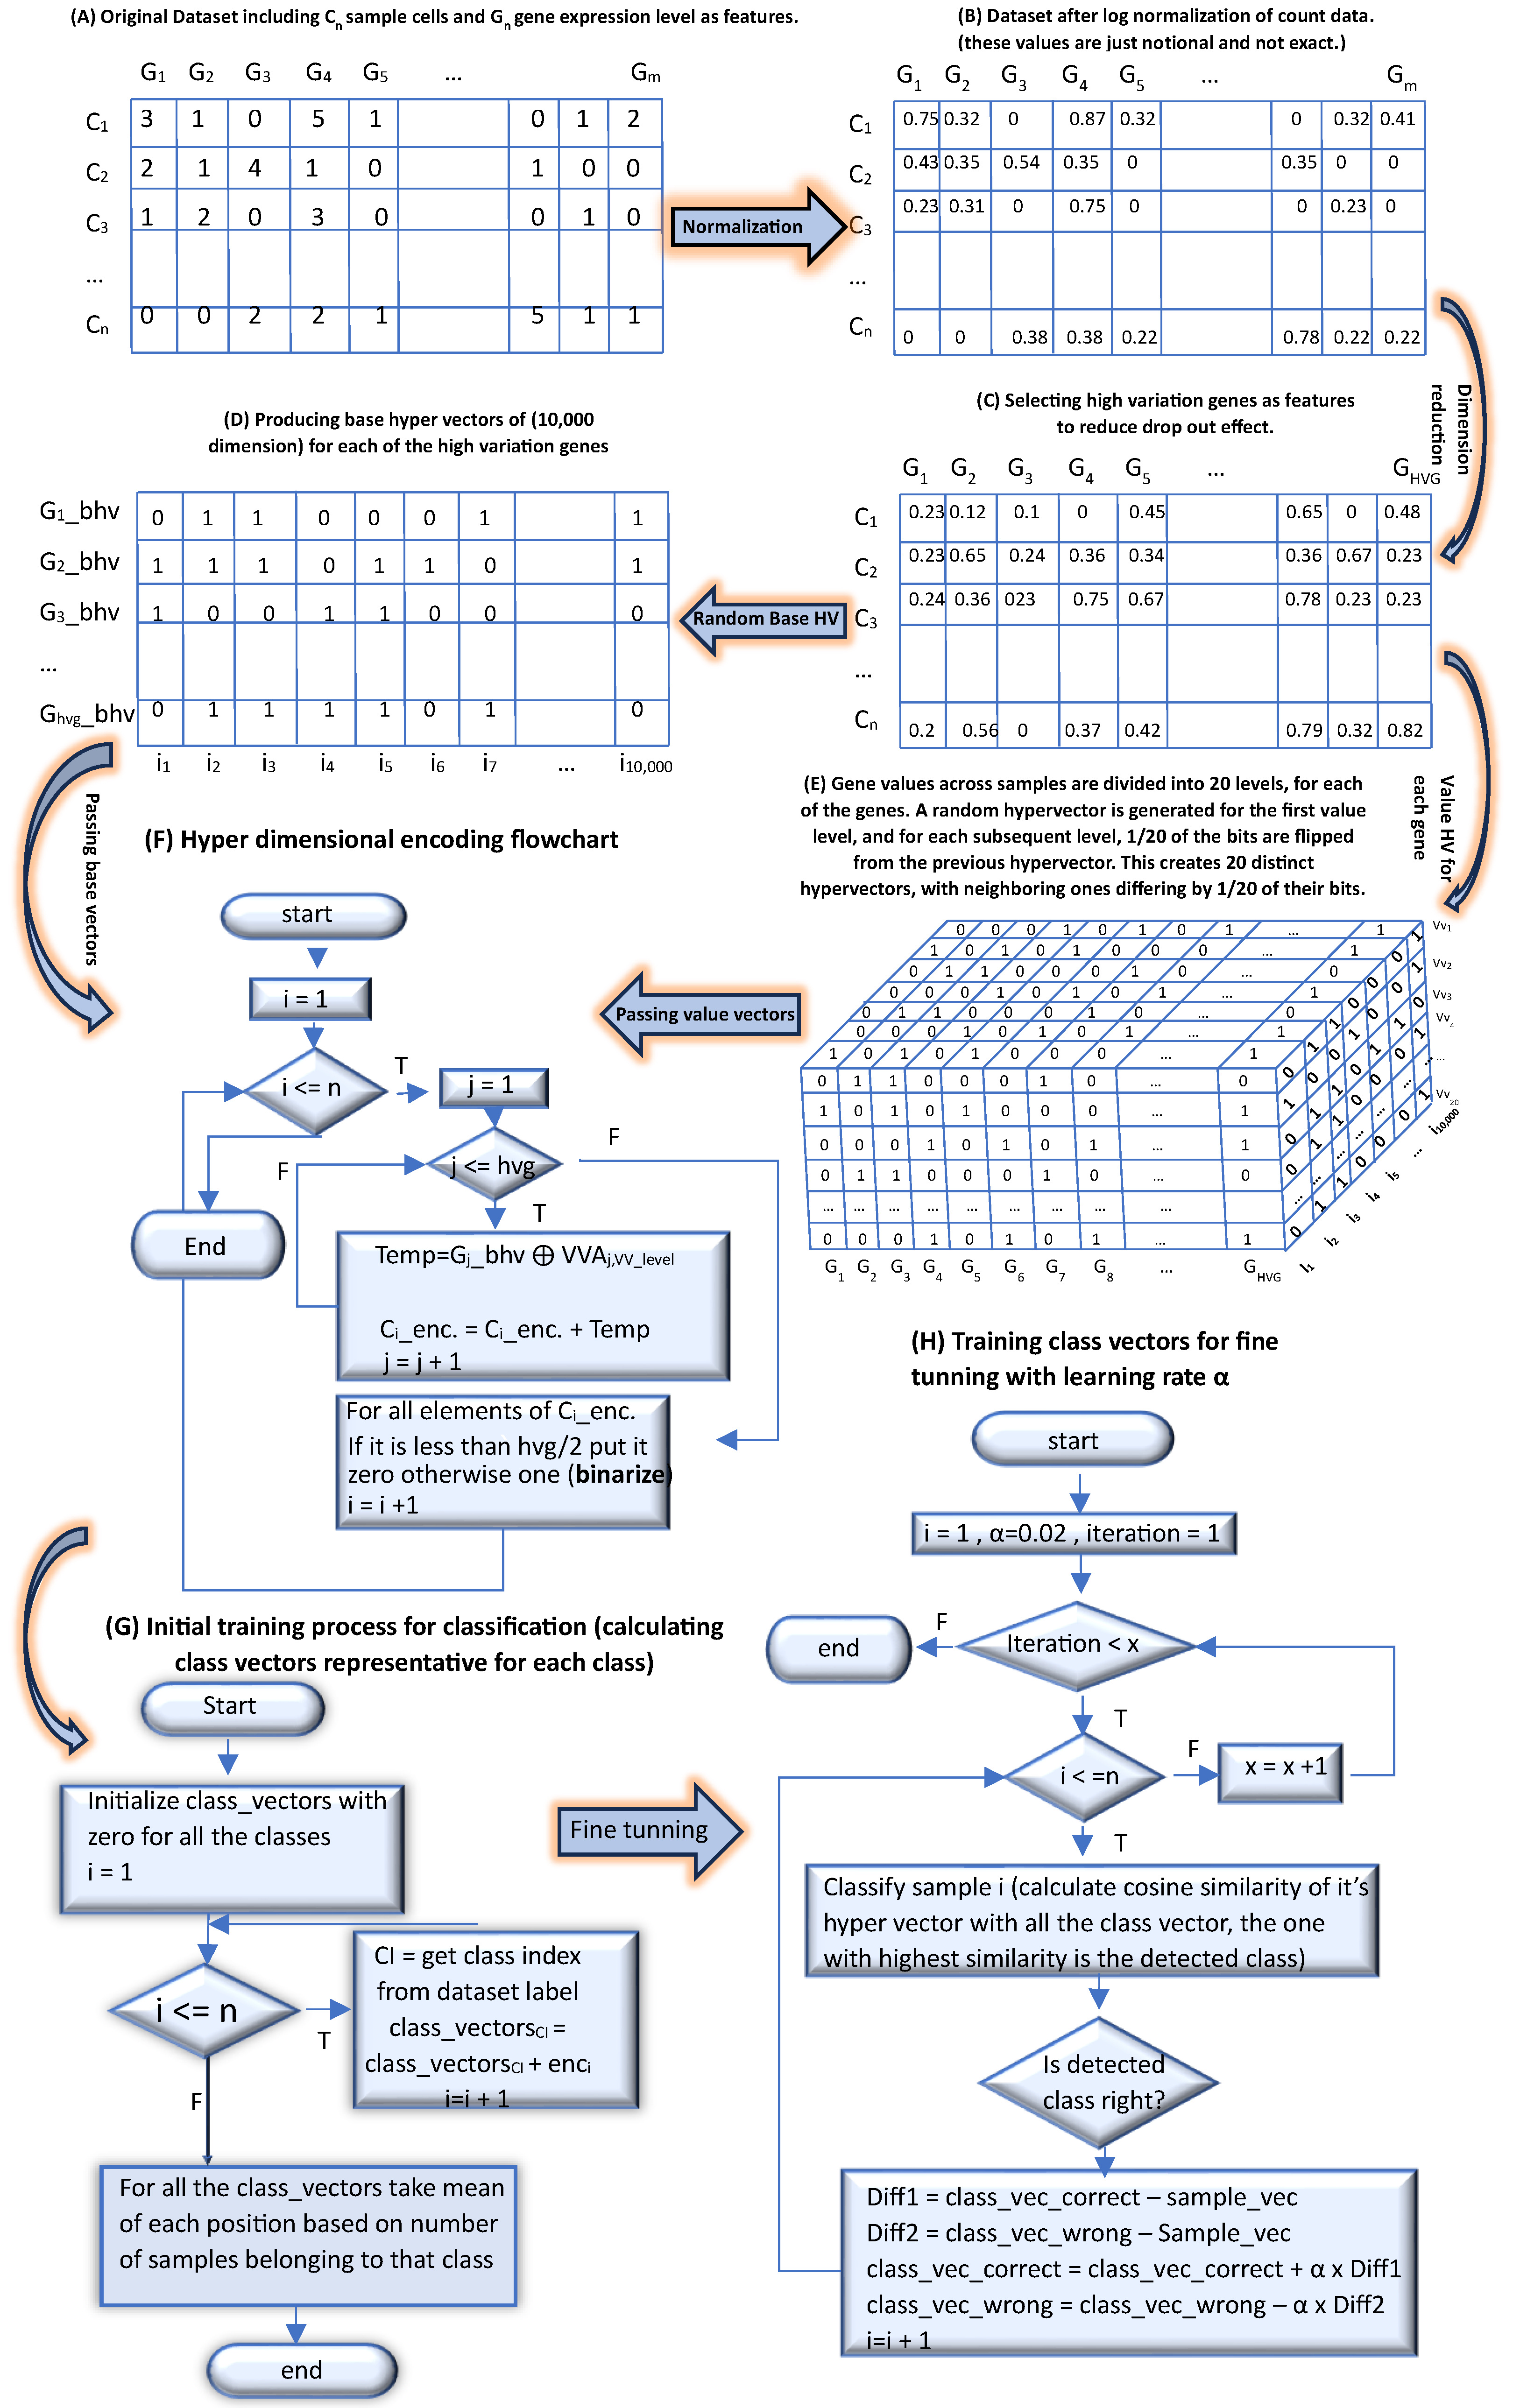
2.1. Preprocessing and Encoding

2.1.1. Preprocessing of scRNA-Seq Data

The initial preprocessing of scRNA-seq data ensures that the data are normalized, filtered, and transformed to handle the high dimensionality and noise inherent in scRNA-seq datasets, reducing technical biases, sparsity, and variability. This prepares the scRNA-seq data for hyperdimensional encoding, allowing them to capture the underlying biological signals more accurately and robustly.
Normalization. Log normalization is applied to gene expression data to reduce biases and technical variations. This step enhances data comparability and stability, which is crucial for the performance of downstream clustering and classification algorithms. The log transformation is defined as
f ( x ) = log 2 ( 1 + x )
where x represents the expression values of genes across cells. This transformation stabilizes the variance for random variables with variance quadratic in the mean, which is particularly important for scRNA-seq data where gene expression levels can vary widely [13,14].
Filtering. For classification, we filter genes based on their variation by selecting high-variance genes, as this approach effectively captures the most informative features for supervised tasks. However, for clustering, where the goal is to accurately identify and separate even rare cell types in an unsupervised manner, we employ a different filtering method. Instead of focusing solely on highly variable genes, which could result in the loss of critical information specific to rare cell types, we opt to drop genes with fewer than Q distinct expression values. Through experimental analysis, Q is set to 20. This approach ensures that we retain more genes, potentially preserving important biological signals necessary for clustering, particularly those related to rare cell types [15,16,17]. Note that by applying the log transformation, we reduce the influence of extreme values and normalize the variance, thereby enhancing the robustness of downstream analyses including the gene filtering approach.

2.1.2. Hyperdimensional Encoding

Once the data are preprocessed, we proceed with encoding the scRNA-seq data into hyperdimensional vectors, a crucial step for leveraging HDC.
Base Hypervectors. Each gene is represented by a base hypervector, B i , randomly generated to ensure near orthogonality. These base hypervectors act as signatures for each gene, and the orthogonality guarantees that their cosine similarity is near zero, which ensures that there is no information overlap among them. This orthogonality is particularly beneficial for scRNA-seq data, as it allows each gene’s unique expression profile to be captured independently, reflecting the biological diversity across cell types without interference. Specifically, for a dataset with p genes (e.g., we filter informative 2000 genes for our experiments), we generate p base hypervectors:
B i { 0 , 1 } D for i = 1 , 2 , , p
The dimensionality D = 10 , 000 is chosen based on established practices in hyperdimensional computing, where high dimensionality is critical to ensure near-orthogonality among randomly generated binary vectors. We empirically test several values (e.g., D = 1000, 5000, 10,000, 15,000) and observe that performance improvements plateau around D = 10,000, striking a balance between classification accuracy and computational efficiency. Similarly, the selection of 2000 high-variance genes follows standard scRNA-seq preprocessing techniques, capturing informative features while minimizing noise and sparsity. This number is found effective across diverse datasets for both clustering and classification tasks.
Given this choice, the 10,000-dimensional base hypervectors B i { 0 , 1 } D are nearly orthogonal and provide a robust foundation for encoding gene identities. The theoretical capacity of 2 10 , 000 combinations far exceeds the number of genes typically encoded, allowing each gene to be uniquely represented with high fidelity. Even in the presence of noise that flips some bits, the redundancy inherent in such high-dimensional space preserves the integrity of the representation. This ensures that each gene’s signal remains distinct and reliable. These base hypervectors are subsequently combined with level hypervectors to encode the gene expression magnitudes for each sample in a noise-resilient and biologically meaningful way.
Level Hypervectors. To quantize gene expression values, we define level hypervectors. The range of gene expression values, [ g min , g max ] is discretized into Q levels. The first-level hypervector, L 1 , is randomly generated, and subsequent level hypervectors are created by randomly flipping D / Q bits of the preceding hypervector:
L i = flip ( L i 1 , D / Q ) for i = 2 , 3 , , Q
This method ensures that adjacent level hypervectors are more correlated, while distant levels are nearly orthogonal, capturing subtle variations while preserving distinctions between vastly different values—a key advantage for reflecting the broad range and diversity in scRNA-seq data [18,19,20].
Encoding Process. Each cell is encoded by binding (XORing) its gene expression value encoding level hypervector with the corresponding base hypervectors. The final hyperdimensional vector for a cell, X H , is computed as
X H = 1 p i = 1 p B i L g i
where g i represents the level index for the expression value of gene i. This process ensures that each gene’s contribution is preserved in the high-dimensional space, making the encoding robust to both noise and data sparsity. By doing this, we ensure that we have a single integrated and comprehensive hypervector of 10,000 dimensions for each sample, carrying all the information about the genes and their expression levels for that sample. In the following steps, we binarize this integrated hypervector for computational and hardware efficiency without degrading performance. This means that instead of dealing with initial vectors representing the expression levels of, for example, p = 2000 (that is, 2000 real numbers) genes, we only work with a binary vector of D = 10 , 000 bits. This would achieve a compression ratio of over 100 on a 64-bit machine. As a quick refresher for estimating compression efficiency, our starting point is a cell represented as an array of 20,000 real numbers corresponding to the expression values (a single real number) for 20,000 genes in a scRNA-seq data. We then select 2000 genes from these using variance criteria and encode them using 2000 × 10,000 base bit vectors and 20 × 10,000 level bit vectors to represent each cell that reflects gene expression levels. We then collapse this to 10,000 bit vectors for each cell using XOR expression and binarization discussed in Section 2.3. So, overall, we start with 20,000 real numbers per cell and convert them into 10,000 bit vectors per cell. Assuming each real number requires 64 bits, the compression efficiency for each cell is 2 × 64:1. Furthermore, we demonstrate how this representation improves both classification and clustering accuracy and is robust with respect to noise as well as the variability of cells and experimental conditions. This binary vector is not only smaller in size but also more robust to noise, as the information is distributed across all the bits, and altering some bits does not easily change the overall integrity of the hypervector.
Although the final hypervectors are binary, their construction is biologically grounded. Each hypervector captures gene-level information through XOR binding between the gene’s base hypervector and a level hypervector representing its expression. As these components are structured to reflect gene identity and expression magnitude, the final hypervector encodes a holistic view of the cell’s transcriptional state. Moreover, by aggregating signals across thousands of genes, the representation reflects biologically meaningful patterns such as cell type or developmental stage. This abstraction enables robust classification and clustering while maintaining biological relevance.

2.2. Clustering Methodology

The clustering methodology builds upon the hyperdimensional vectors, the overview of which is illustrated in Figure 1. The process begins with the original gene expression matrix X n × w , where n represents the number of sample cells and w represents the number of genes. This matrix undergoes hyperdimensional (HD) encoding to produce the hyperdimensional encoded matrix X n × D , with D being the length of the hypervectors. Feature construction is then performed on this encoded matrix, resulting in the feature matrix F n × q , where q (typically, q D ) is the feature length after feature construction. Finally, hybrid clustering is applied to the feature matrix, producing the final cell clusters. Further details are presented as follows.

2.2.1. Feature Engineering

To facilitate efficient clustering, we extract a smaller set of informative features from the encoded data using randomized singular value decomposition (rSVD), which is a dimensionality reduction technique that preserves the essential structure in a lower-dimensional space.
Random Projection Singular Value Decomposition (rSVD). We apply rSVD to the encoded data matrix, X H R n × D , where n represents the number of cells and D = 10 , 000 is the dimensionality of the hypervectors, to obtain a low-rank approximation. This dimensionality reduction is achieved by first computing the cell-cell correlation matrix, defined as
C = X H T X H
where C R D × D is a symmetric positive semidefinite matrix that permits eigendecomposition C = Q Σ Q T , with Q being an orthogonal matrix. This eigendecomposition is directly related to the singular value decomposition of X H . Specifically, we decompose X H as
X H = U Σ V T
In this decomposition, U R n × q contains the left singular vectors representing cell patterns, Σ R q × q is a diagonal matrix containing singular values in descending order, and V R D × q contains the right singular vectors representing gene patterns, where q D is the number of retained features. The relationship between C’s eigendecomposition and X H ’s SVD is established through V, which contains the eigenvectors of C, while the singular values in Σ are the square roots of the C eigenvalues.
Feature Matrix Construction. After decomposition using rSVD, we construct the feature matrix F R n × q from the left singular vectors U and the corresponding singular values Σ :
F = U Σ
This construction yields a compact and informative representation, where each row of F corresponds to a cell’s compressed abstracted representation in the reduced q-dimensional space, while each column represents a learned feature pattern across all cells. The dimensionality reduction from D to q (typically, q D ) preserves the most significant patterns in the data while substantially reducing computational complexity. The choice of SVD over the direct eigendecomposition of C provides both computational efficiency and numerical stability, particularly important for the high-dimensional, sparse nature of scRNA-seq data. The resulting feature matrix F serves as the basis for downstream clustering tasks, capturing the essential biological signals while mitigating technical noise and sparsity issues.

2.2.2. Hybrid Clustering

We propose a hybrid clustering method, named Hyperdimensional Single-Cell RNA-seq Clustering (HDSCC), which combines the strengths of hierarchical and k-means clustering techniques to improve stability and scalability, making it particularly suitable for large and complex scRNA-seq datasets.
Hierarchical Clustering. HDSCC proceeds by applying hierarchical clustering to a subsample of cells using the Ward agglomeration method, which is a variance-minimizing approach. Specifically, Ward’s method seeks to minimize the total within-cluster variance at each step of the clustering process by merging the pair of clusters that leads to the smallest possible increase in variance [21]. The number of clusters (k) can be estimated by analyzing the resulting dendrogram, which shows the hierarchical relationships between clusters and provides insights into the natural groupings within the data. This step helps identify a reasonable set of initial cluster centers, which serve as starting points for further refinement.
K-means Clustering. The initial cluster centers obtained from hierarchical clustering are used as starting centroids for k-means clustering, which is then applied to the entire dataset. This hybrid approach ensures stable clustering solutions, reduces computational time, and provides a scalable and robust solution for analyzing large single-cell RNA-seq datasets.

2.3. Classification Methodology

In this section, we propose a novel approach that leverages HDC to enhance cell type classification performance in scRNA-seq dataset. The overview of these technical steps is illustrated in Figure 2.

2.3.1. HD Encoding

To enable effective cell type classification, the HD encoding of the preprocessed scRNA-seq data follows a similar approach discussed in Section 2.1, with additional steps tailored for classification tasks.
Base and Value Hypervectors. Each high-variance gene is represented by a base hypervector, while its corresponding expression levels are quantized into value hypervectors. These vectors are generated to ensure that base hypervectors are nearly orthogonal, allowing each gene to be represented independently, and that value hypervectors capture graded expression levels with minimal overlap. This structured representation enables fine-grained gene expression analysis [18,20].
Encoding Samples. Each sample cell is encoded into a hyperdimensional vector by binding the base and value hypervectors. This results in a unique and holistic representation for each cell, effectively capturing the distinct gene expression patterns across the high-variance genes.

2.3.2. Classification Process

With each sample cell now represented as a hyperdimensional vector, we proceed to the classification process. This involves several key steps, including binarization, class representative computation, interactive training, and inference, which are detailed as follows.
Binarization. The encoded hypervector for each cell is binarized to enhance computational efficiency. This step involves transforming each element based on a threshold:
H bin [ i ] = 1 if H [ i ] > T 0 otherwise
where T is set at half the number of high-variance genes (that is, T = 1000 in our running example). This is because, during the encoding step, all combined base and value hypervectors for all the genes are added together, so the value of each position in the hypervector can range from 0 (if all the corresponding positions in the hypervectors of all genes are 0) to the total number of genes (if all the corresponding positions in the hypervectors of all genes are 1). Therefore, T is chosen as half this number and serves as the threshold for dividing between 0 and 1 in the final binary hypervector [19].
Class Representatives. Class centroid for cell type x, C x , is computed by averaging the hypervectors of all samples belonging to the same cell type. These centroids serve as representative vectors for each cell type class:
C x = 1 n i = 1 n H bin ( i )
where n is the number of samples in the class.
Inference. For a new sample, its hypervector is compared with each class representative using cosine similarity. The class with the highest similarity is chosen as the predicted class:
similarity ( i ) = H bin ( new ) · C i H bin ( new ) · C i
classOf ( H bin ( new ) ) = arg max i similarity ( i )
Iterative Training. To enhance classification accuracy, iterative training is employed on the training set. This process involves updating class representatives based on the classification accuracy of individual samples, allowing the model to be as accurate as possible on the training set, rather than relying solely on the initial centroids for classification purposes. The iterative training process is defined as follows:
C miss = C miss α · H bin ( new )
C match = C match + α · H bin ( new )
where α is the learning rate. Misclassified samples adjust the centroids of both the correct and incorrect classes to refine the model, improving predictions in subsequent iterations. In other words, here, C match and C miss represent the centroids of the correct and misclassified class of the new sample, respectively. This method has shown promising results not only in achieving high accuracy on the training set but also in delivering strong empirical performance on the test set.
Classification Pipeline. The entire classification pipeline, from encoding to iterative training, is designed to handle the high dimensionality and noise of scRNA-seq data. This pipeline provides robust and accurate cell type classification, demonstrating the efficacy of HDC in managing complex biological data.

3. Experiments

3.1. Clustering Experiments

3.1.1. Datasets

We employ six different scRNA-seq datasets to evaluate our proposed clustering method, HDSCC. These datasets are selected based on high label confidence and diversity in cell stages and conditions. The properties of the datasets are summarized in Table 1.

3.1.2. Evaluation Metrics

To assess the clustering results, we employ two standard clustering performance metrics: Adjusted Rand Index (ARI) and Normalized Mutual Information (NMI) [28,29]. These metrics are well known for evaluating clustering performance in single-cell data where labels are known.

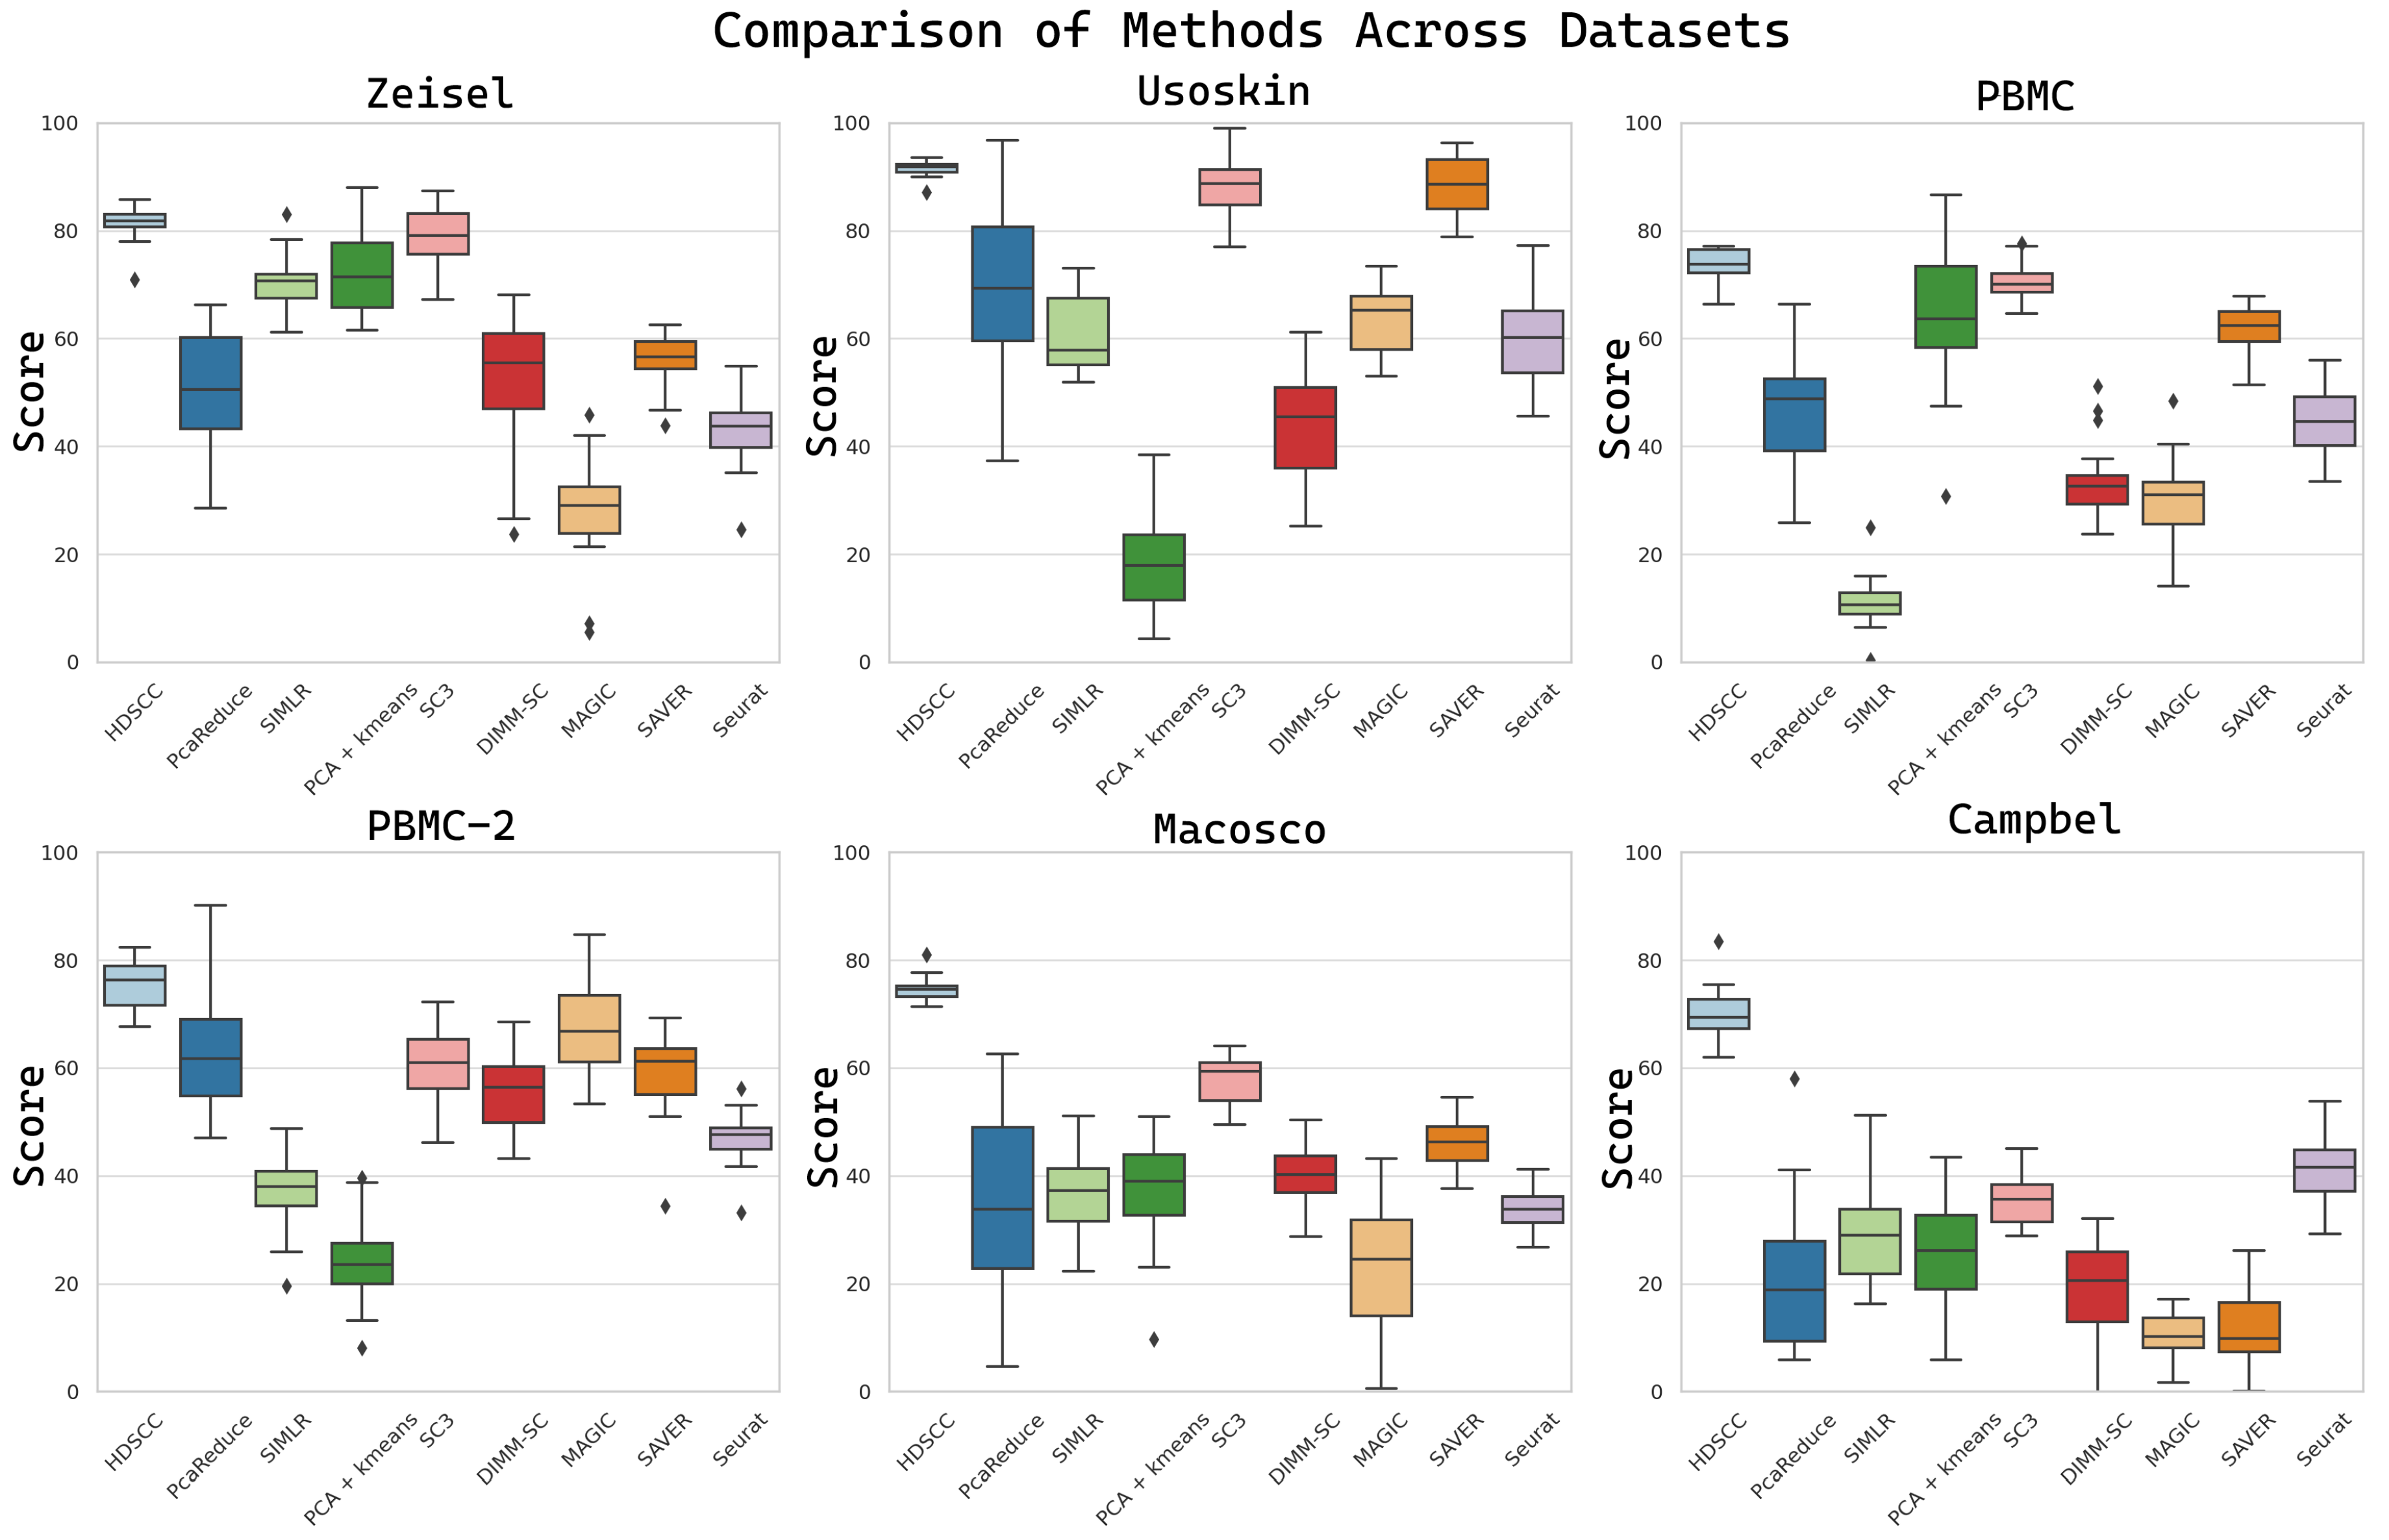
3.1.3. Clustering Performance

We compare our method (HDSCC) with other state-of-the-art scRNA-seq clustering methods, including SC3 [30], SIMLR [31], PCA+k-means [32], DIMM-SC [33], PcaReduce [34], SAVER [35], and MAGIC [36]. The average clustering results are reported in Table 2.

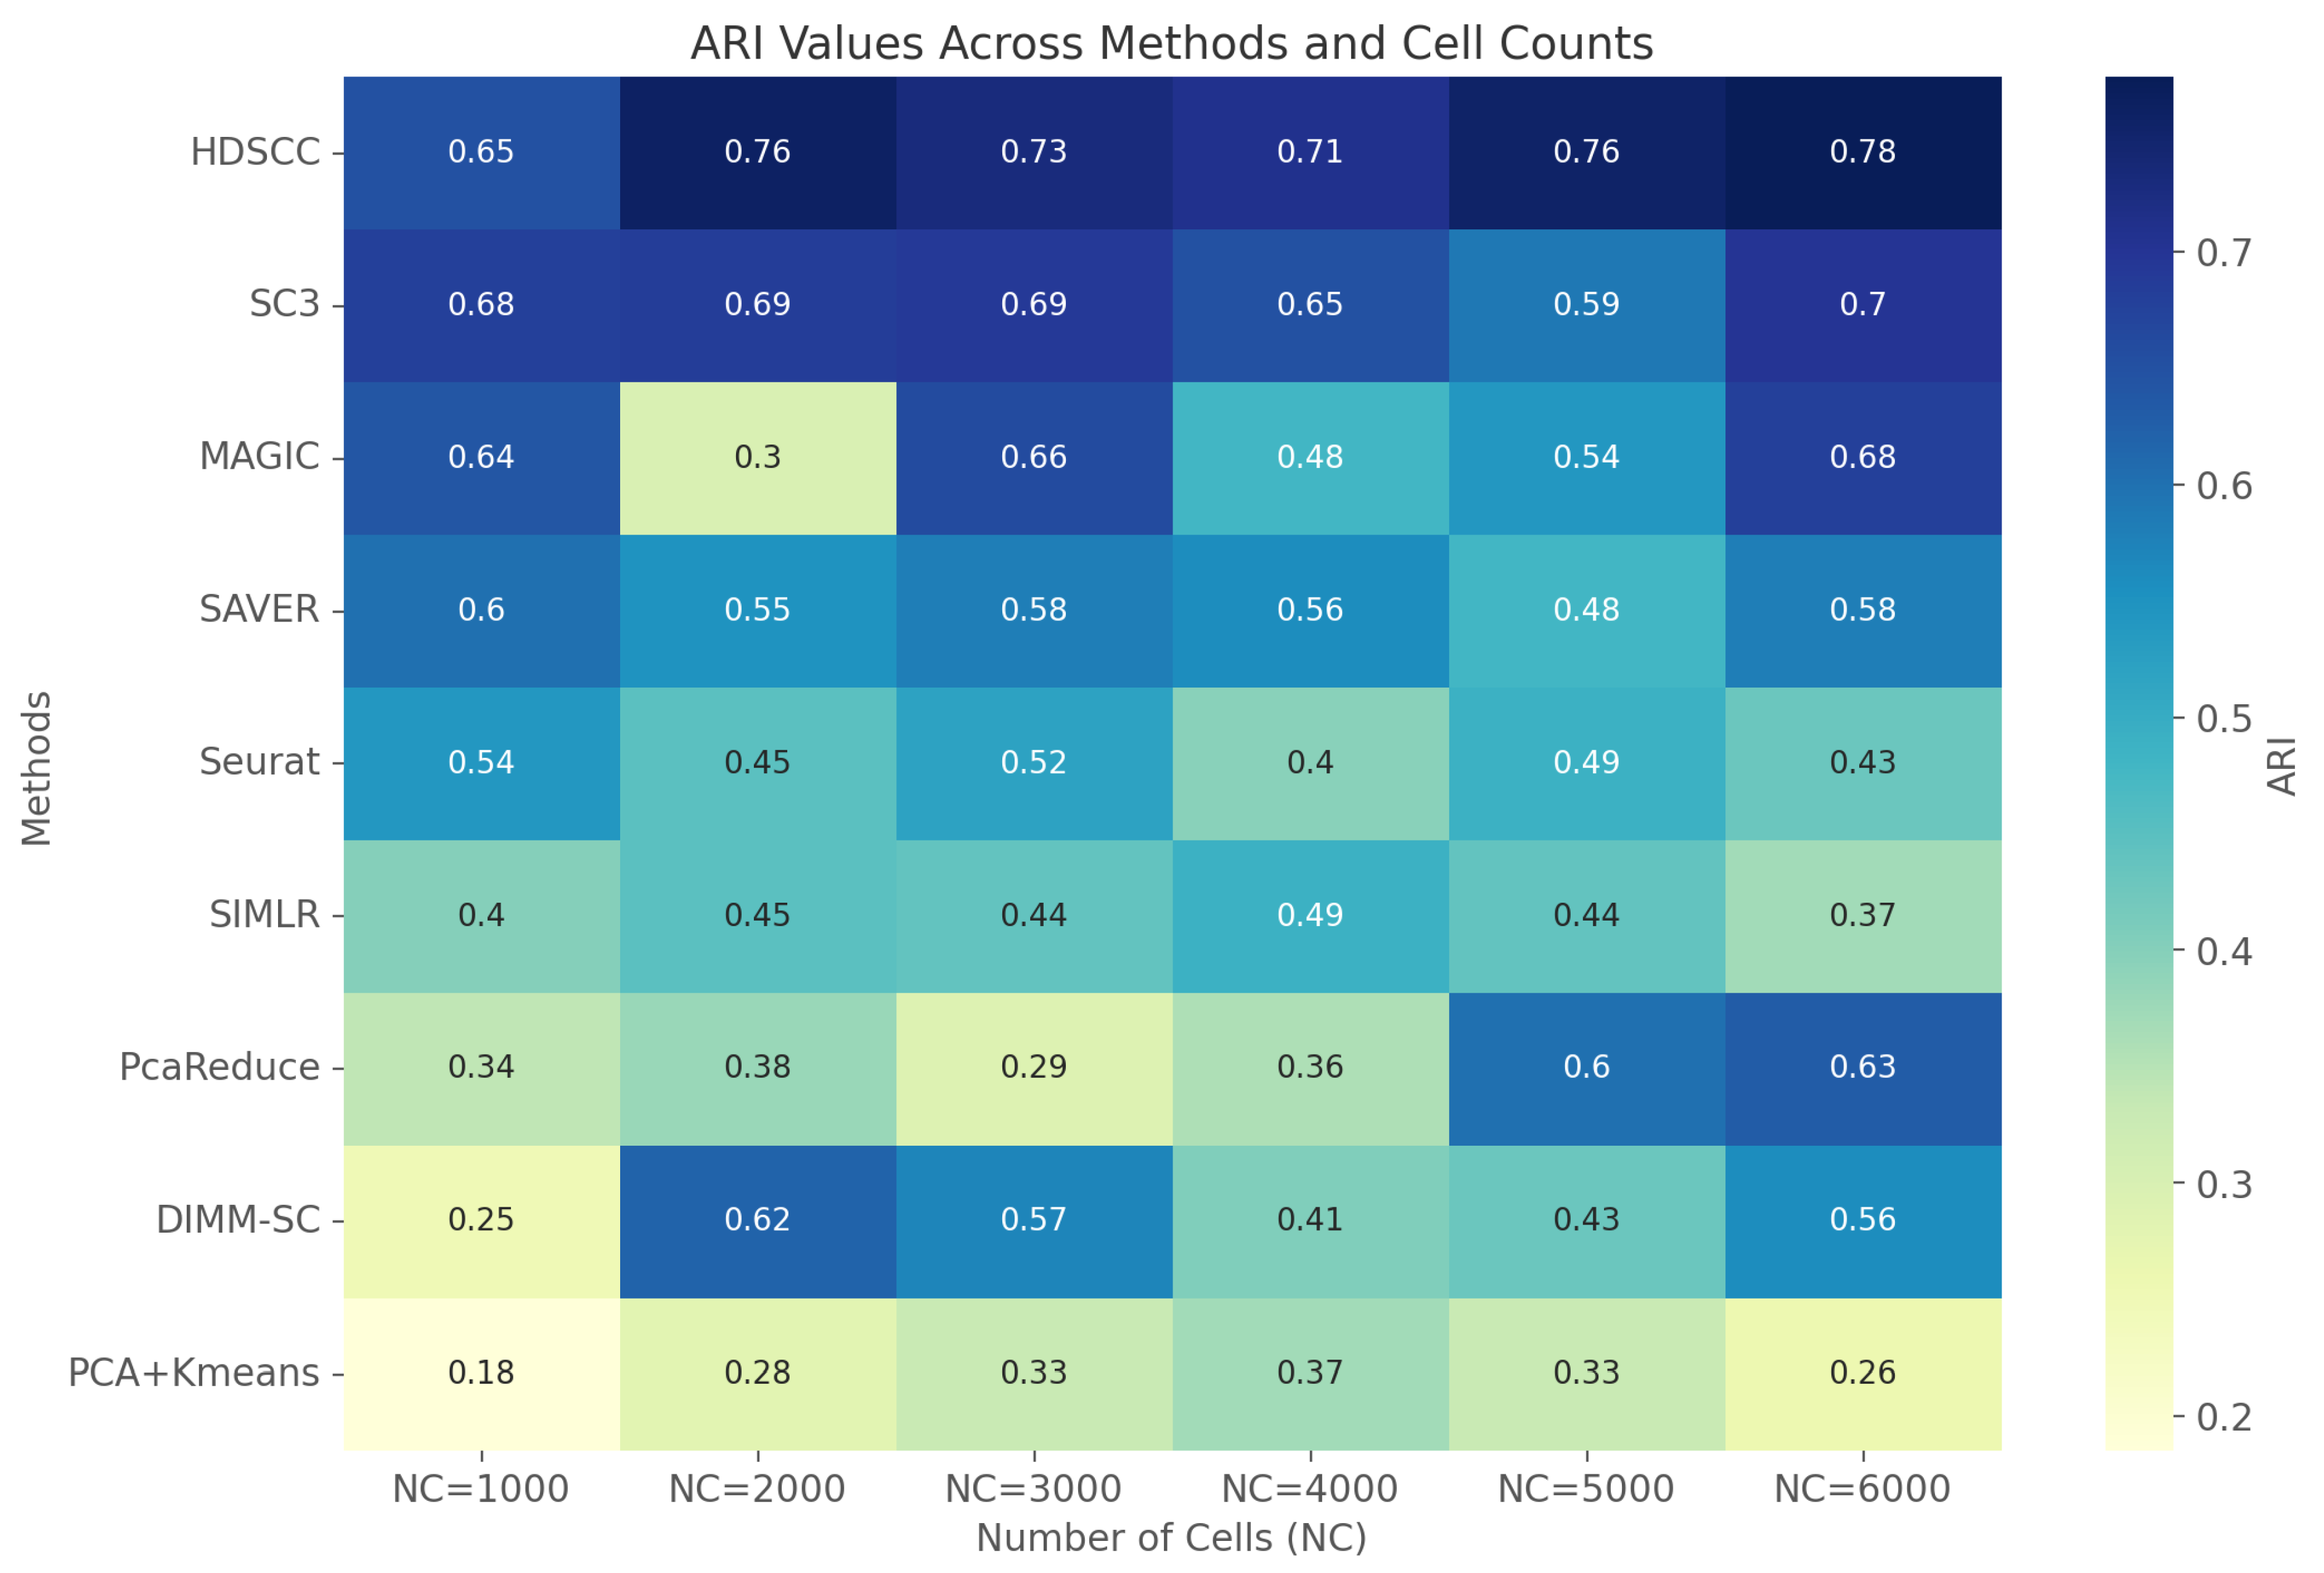
3.1.4. Clustering Performance and Data Size

Our method demonstrates efficiency, in that the size of the dataset has no significant negative effect on its performance. Specifically, as the number of cells in a given dataset increases, the performance of our method either improves or remains consistent, which contrasts with most other clustering methods that often degrade with larger data sizes. This observation is supported by rerunning all methods on various subsets of the PBMC-2 dataset and evaluating their clustering performances. The results, summarized in Figure 3, show that our method maintains robust performance, as indicated by the ARI values, across different dataset sizes.

3.1.5. Robustness to Noise

We evaluate the robustness of the clustering methods by randomly removing 10% of the cells from each dataset and repeating each clustering method 20 times. We also calculate the interquartile range (IQR) for each method to assess stability. The results, shown in Figure 4, demonstrate the robustness of our method, which consistently outperforms other methods in maintaining high ARI values even as noise levels increase.

3.1.6. Runtime Comparison

The average running time of all methods over the employed datasets is reported in Table 3. Some methods are not able to handle the PBMC and Campbell datasets due to the high memory complexity; thus, we use a cluster server for these datasets.

3.2. Classification Experiments

3.2.1. Datasets

Our study uses diverse scRNA-seq datasets for classification experiments with HDC, in split by batch [2] and random split [37] settings to simulate real-world scenarios. The datasets used are CeNGEN [38], Pancreas [39], and Zebrafish [40]. The data statistics are summarized in Table 4.

3.2.2. Experimental Settings

We optimize hyperparameters within a Python 3.9 virtual environment on an Ubuntu Linux 22.04 server. Key hyperparameters are selected as follows: 2000 high-variance genes, 10,000-dimensional hypervectors, and a learning rate of 0.02. Data preprocessing involves binning into 20-value hypervectors for each gene.

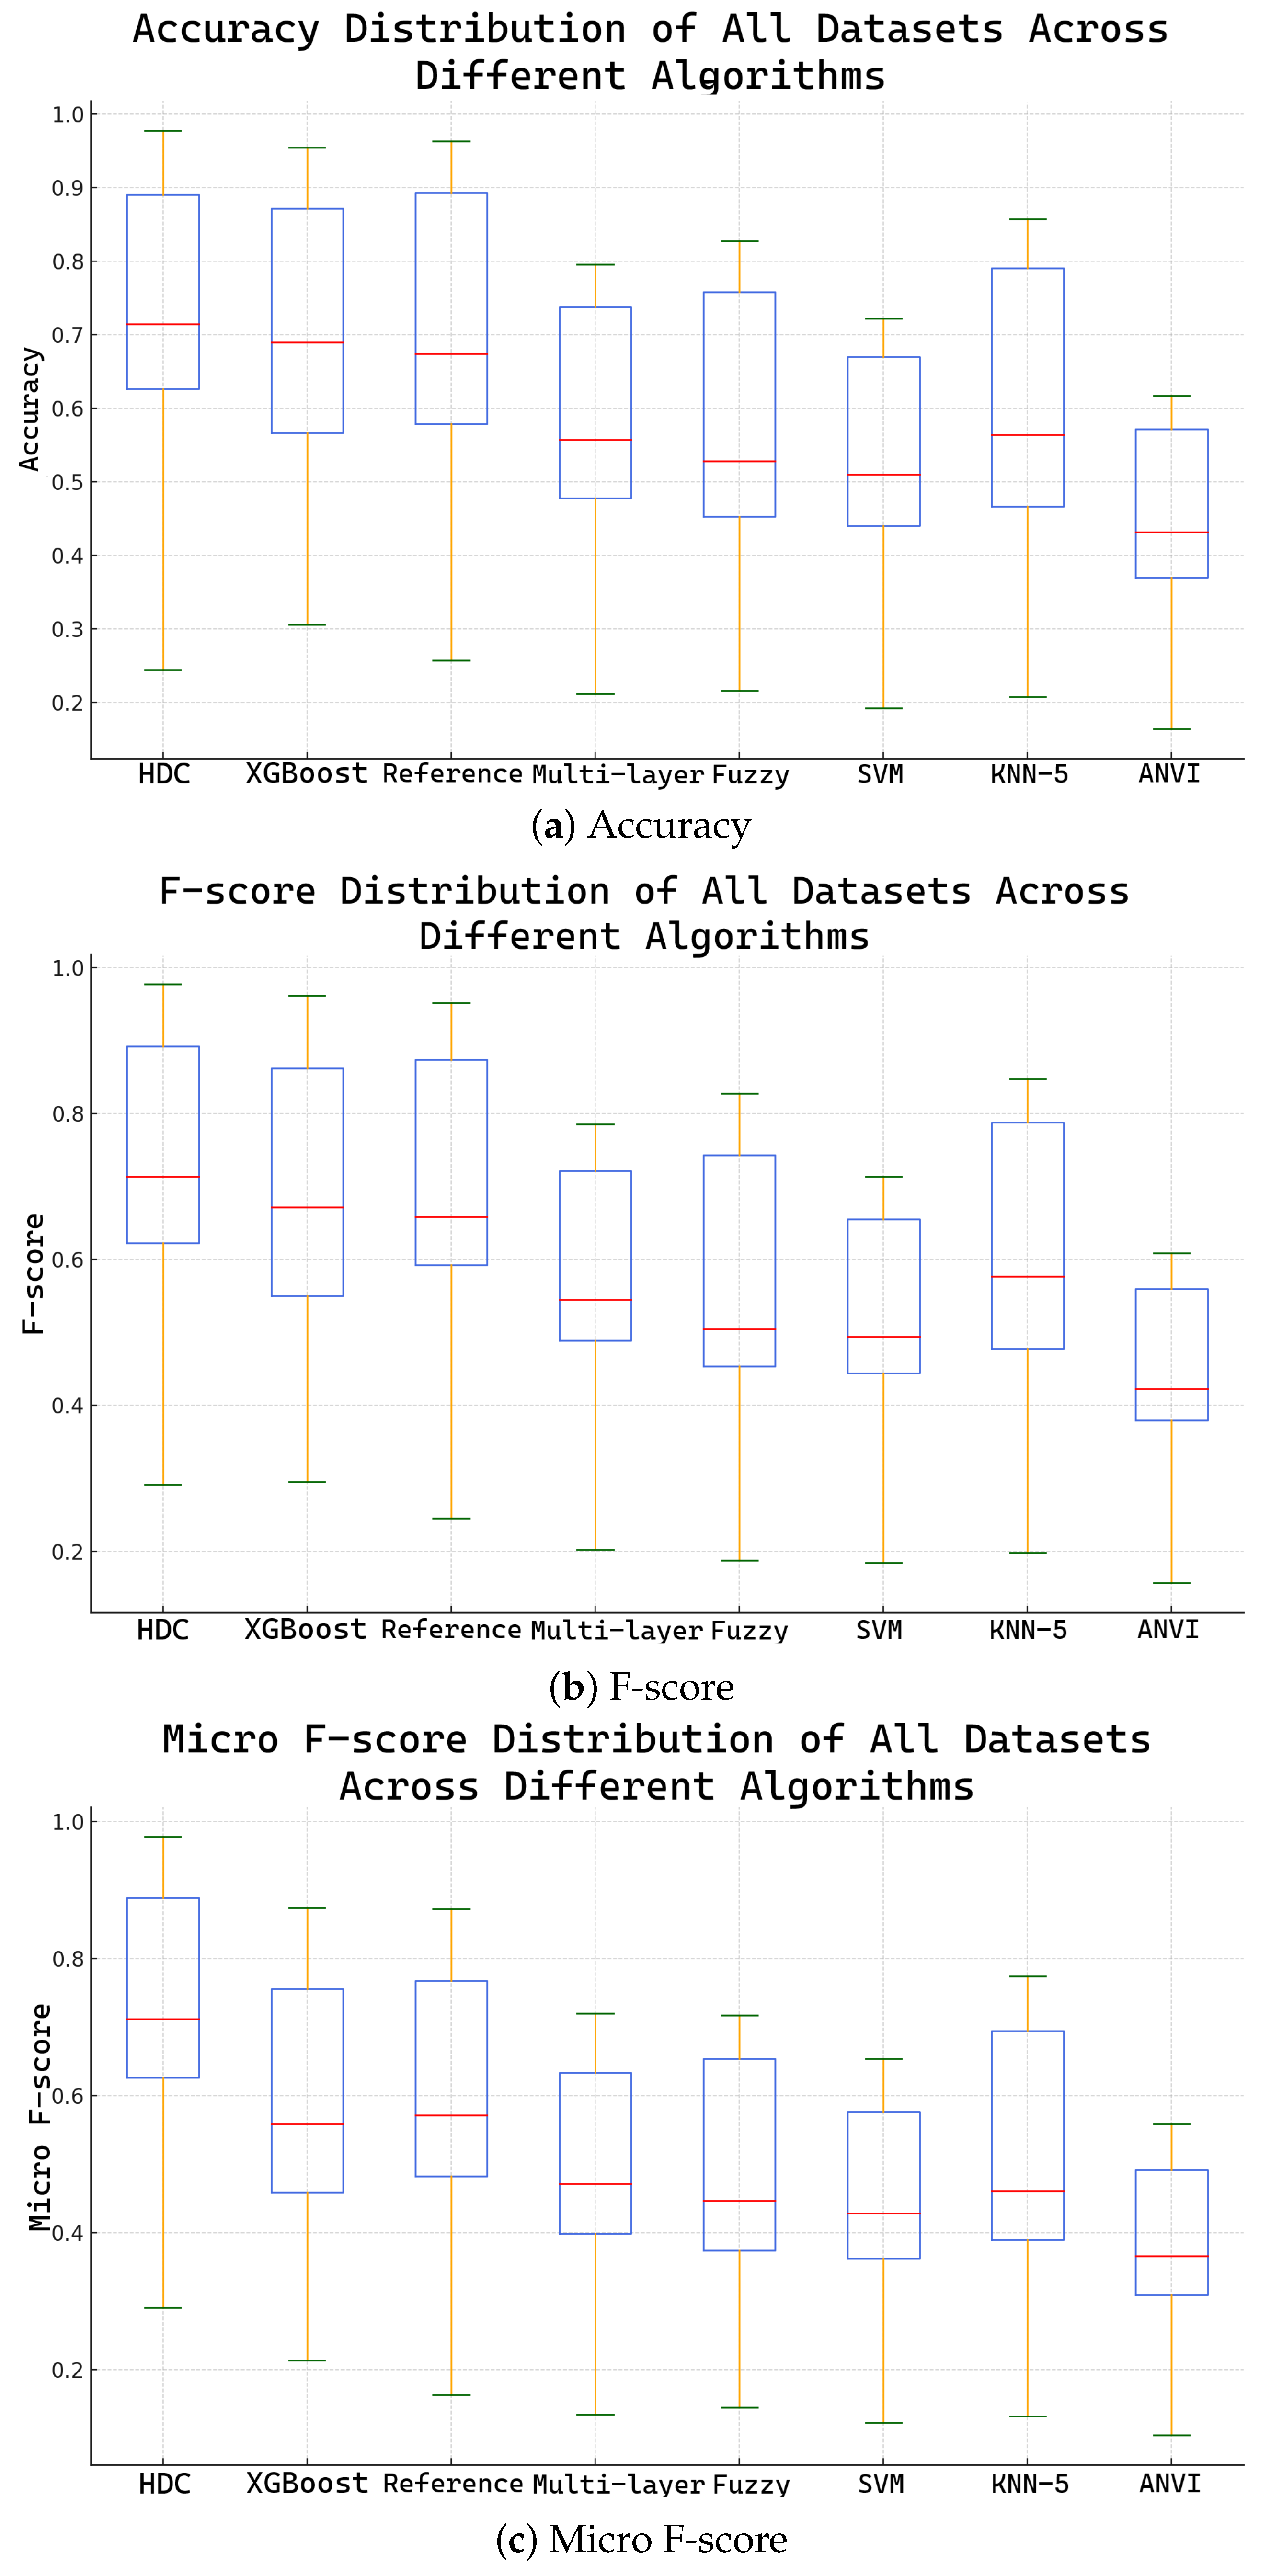
3.2.3. Comparison with Other Models

Our HDC method was compared with models like XGBoost, Seurat, MLP, Fuzzy, SVM, KNN, and scANVI. The outcomes, shown in Figure 5, demonstrate our method’s effectiveness through accuracy, F-score, and micro F-score metrics.

3.3. Noise Robustness Experiments on Classification

3.3.1. Stability Analysis

We evaluate the HDC performance in noisy conditions by introducing random noise (5% to 50%) into the datasets. The F-score results, shown in Figure 6, indicate the robustness of HDC, maintaining high performance across noise levels and outperforming other models, especially in the Pancreas and CeNGEN datasets.

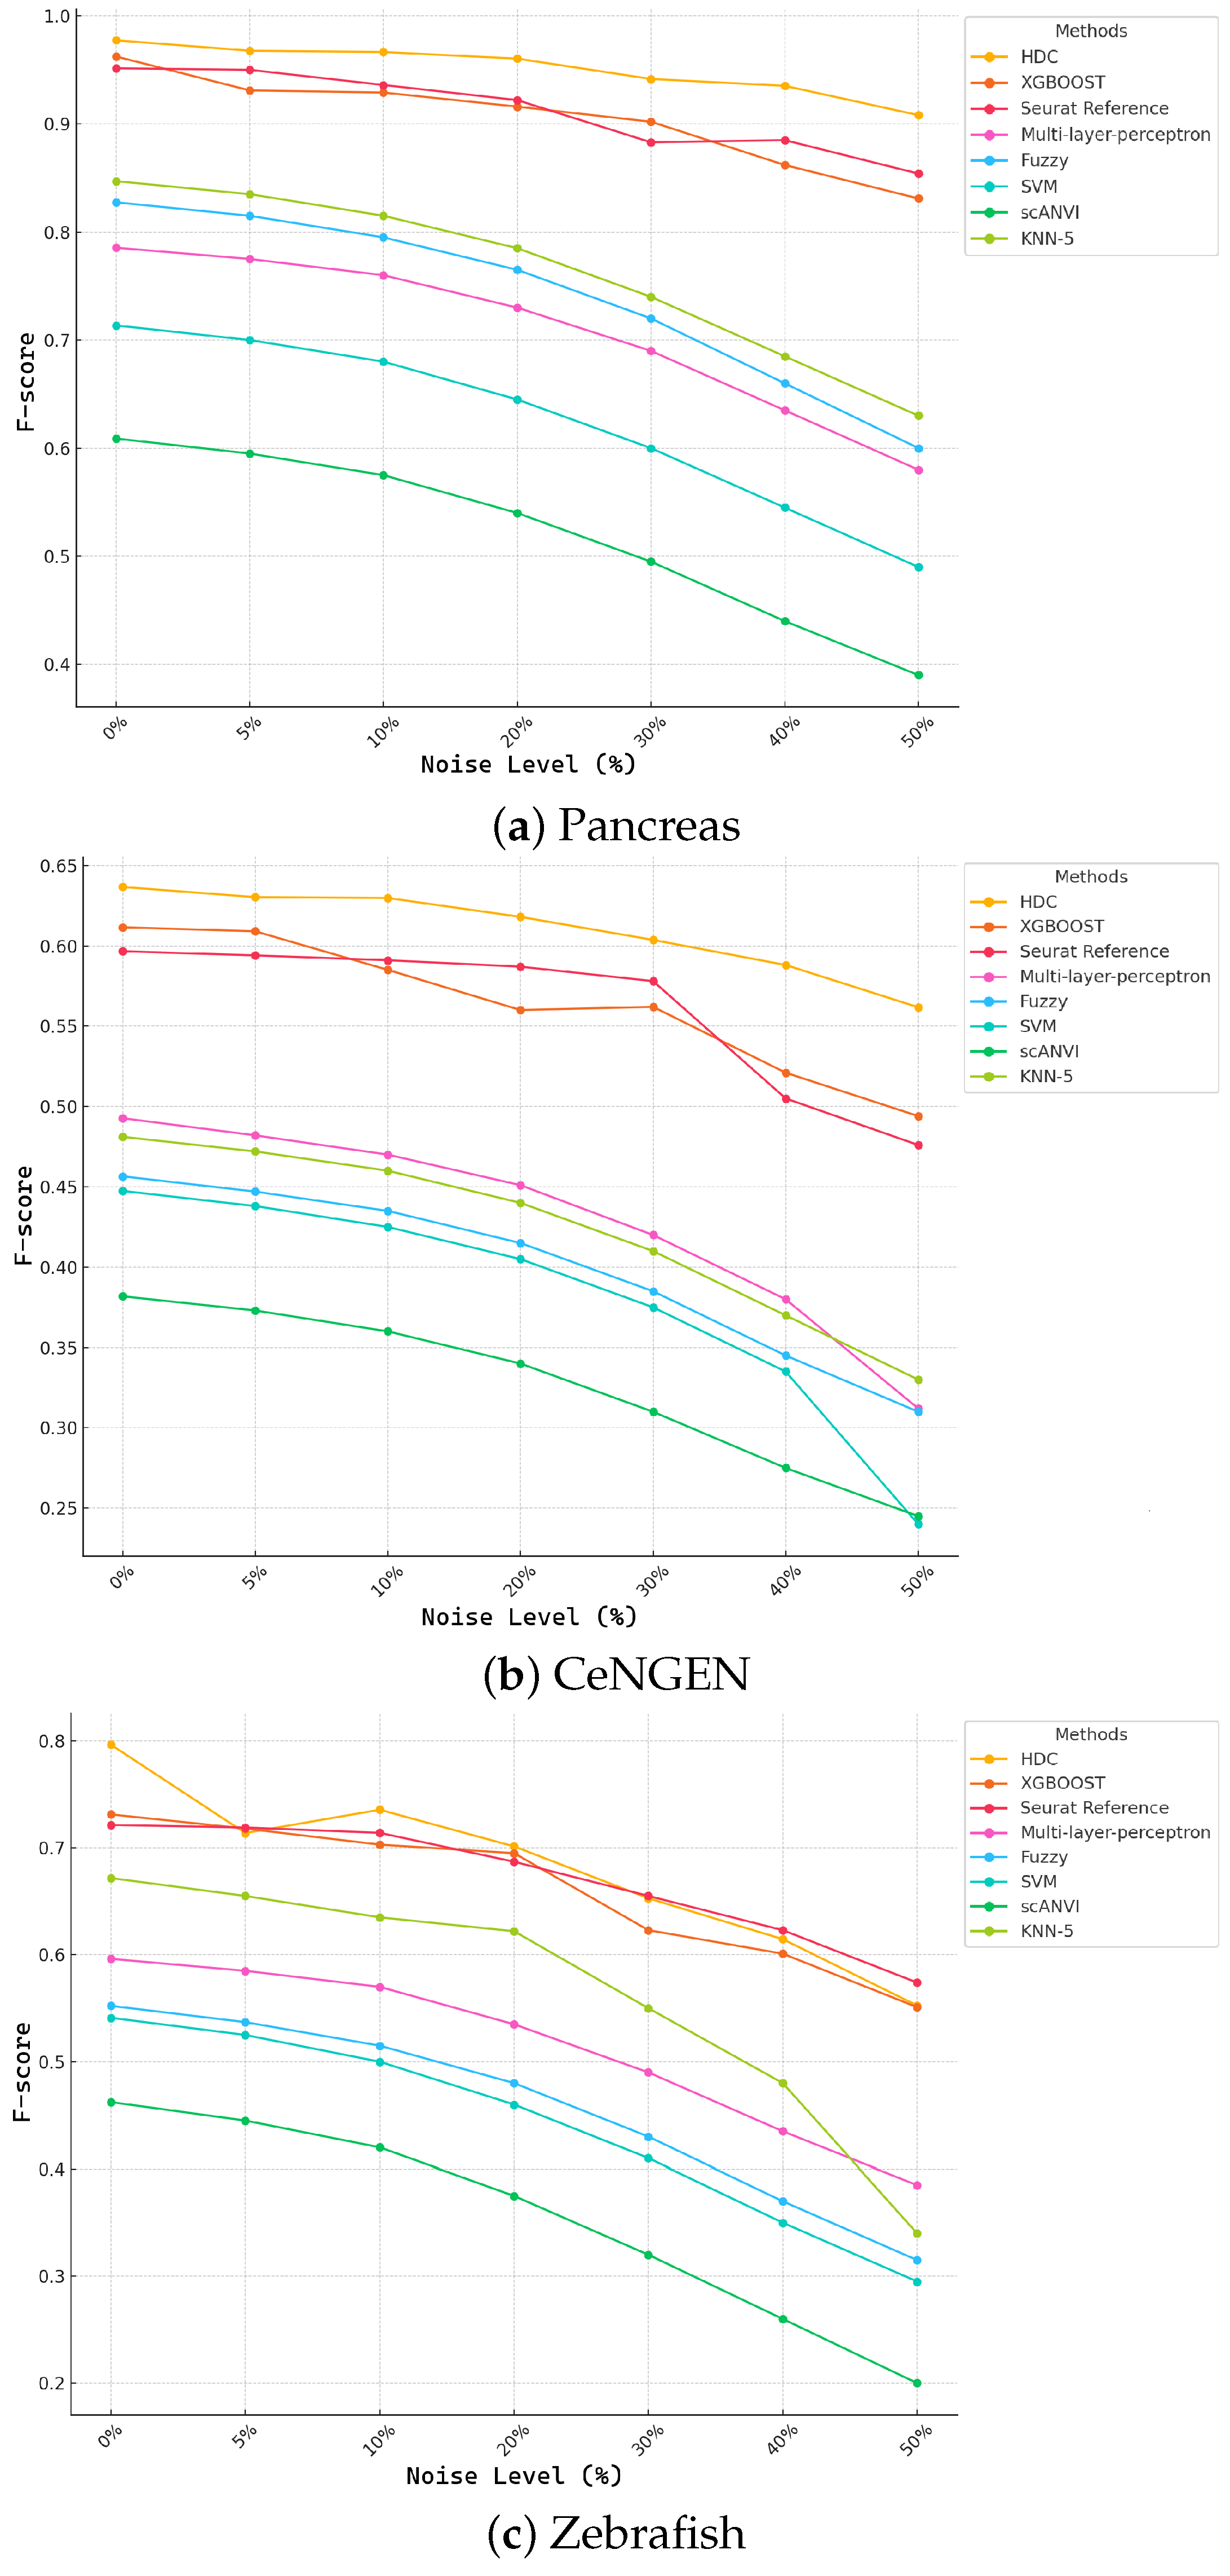
3.3.2. Robustness to Noise in Data

For this experiment, we pollute 2% to 15% of the data with random noise and calculate the quality loss in their average clustering performance (ARI index). As shown in Figure 7, HDSCC provides notably higher robustness to noise compared to other methods. For 15% data error, the HDSCC robustness is approximately 2.5 times higher than the second-best method (SC3).

3.3.3. Proposed Method for Improved Base Hypervector Selection

In this section, we introduce a more rigorous experimental methodology for selecting base hypervectors. In our previous experiments, base hypervectors were chosen as random hypervectors to be orthogonal, ensuring their cosine similarity was close to zero. This approach aimed to prevent any information leakage between different feature signatures since base hypervectors served merely as signatures of genes. In this study, we propose a method that considers inter-gene relationships when choosing our base hypervectors. Gene regulatory networks imply correlations between certain genes, which vary depending on the environment and cell types. By selecting hypervectors for genes with higher correlation to have higher cosine similarity, and for genes with lower correlation to have lower cosine similarity, we aim to inject biological information into our encoding process. We hypothesize that this enhanced encoding should lead to improved classification performance.
To achieve this goal, we use embeddings from our dataset that reflect cell–gene interactions. As outlined in our previous work, we construct a bipartite graph with cells on one side and genes on the other. Each cell is connected to all corresponding genes with expression levels greater than zero, and the link weights are determined by the expression levels. Let G = ( V , E , W ) be the bipartite graph where V is the set of vertices (cells and genes) and E is the set of edges connecting cells to genes and W is the edge weight matrix. The weight of an edge w i j between cell i and gene j is given by the expression level of gene j in cell i:
w i j = expression_level ( i , j )
Using the BigGraph embedding algorithm (a graph neural network base algorithm [41]), we generate embedding vectors of dimension 64 for all genes and cells, capturing the correlation and interaction information. Let e g be the embedding vector for gene g. We map each 64-dimensional row vector to a 10,000-dimensional binary vector using Locality-Sensitive Hashing (LSH) [42]. This process preserves the relative cosine similarity between samples. First, we generate 10,000 random vectors r k where k = 1 , , 10 , 000 , and each r k is 64-dimensional:
R = [ r 1 , r 2 , , r 10 , 000 ]
Next, we project each 64-dimensional row vector e g onto these random vectors:
p g = e g · R
where p g is a 10,000-dimensional vector of projection results. Finally, we convert the projection results into binary codes by applying a threshold. For each element in p g , assign ’1’ if the value is greater than 0, and otherwise assign ’0’ (that is, all non-zero entries are set to 1):
b g = 1 if p g [ i ] > 0 0 otherwise
The resulting b g is a 10,000-dimensional binary vector representing the base hypervector for gene g.
To evaluate the effectiveness of our proposed biologically informed base hypervector selection strategy, we conduct an ablation study comparing the performance of our earlier random-based approach with the knowledge-infused method described in this section. As shown in Table 5, incorporating gene-gene similarity into the hypervector construction consistently improves the F-score by 3–5% across three benchmark datasets—Pancreas, CeNGEN, and Zebrafish—demonstrating the biological benefit and practical impact of this enhancement.

4. Discussion

4.1. Comparative Analysis of Clustering Methods

In this study, we have introduced HDSCC, a novel clustering method for scRNA-seq data that leverages hyperdimensional computing. Our comparative analysis with other state-of-the-art methods, such as SC3, SIMLR, PCA + k-means, DIMM-SC, PcaReduce, SAVER, MAGIC, and Seurat, demonstrates the superiority of HDSCC in terms of clustering accuracy and robustness to noise. The high-dimensional encoding provided by HDC allows for a more comprehensive representation of the gene expression profiles, enabling better discrimination between cell types. This is reflected in the higher ARI and NMI scores obtained by HDSCC across various datasets.
The robustness of HDSCC is particularly noteworthy. Our experiments show that HDSCC maintains stable performance even when a significant portion of the data is noisy or missing. This robustness is a critical feature for scRNA-seq data, which are inherently noisy and sparse. By comparing the interquartile range (IQR) of the clustering results, we observe that HDSCC consistently exhibits lower variability than other methods, indicating its reliability and robustness in different experimental conditions.

4.2. Effectiveness of Hyperdimensional Encoding in Classification

The classification experiments further highlight the effectiveness of hyperdimensional encoding. By encoding the scRNA-seq data into high-dimensional vectors, we are able to utilize HDC for the robust classification of cell types. Our results show that the proposed HDC-based method outperforms traditional classification algorithms such as XGBoost, Seurat, MLP, Fuzzy, SVM, KNN, and scANVI. The accuracy, F-score, and micro F-score metrics indicate that HDC can effectively manage the high dimensionality and sparsity of scRNA-seq data, providing accurate classifications even in challenging conditions.
A key advantage of the hyperdimensional approach is its ability to retain the biological relevance of the data through customized hypervector adjustments. By adjusting the base hypervectors to better represent the features of the dataset, we ensure that the encoded data remain biologically meaningful. This customization proves effective as demonstrated by the high classification performance across diverse datasets.

4.3. Noise Robustness in Clustering and Classification

One of the most significant findings of our study is the noise robustness of the HDC-based methods. The clustering and classification experiments both show that our methods maintain high performance in the presence of various levels of noise. This is crucial for scRNA-seq data, where technical and biological variability can introduce significant noise. Our experiments with artificially introduced noise reveal that HDSCC and the HDC-based classification method outperform other methods in maintaining accuracy and stability.
For clustering, we evaluate the robustness by removing a percentage of cells and repeating the clustering process multiple times. HDSCC consistently outperforms other methods, with lower IQR values indicating more stable clustering results. In classification, we introduce random noise into the datasets and measure the impact on the F-score. Our method demonstrates superior robustness, maintaining high F-scores even as the noise level increases. This resilience to noise is a testament to the strength of hyperdimensional encoding in preserving essential information despite the presence of variability and errors.

4.4. Computational Efficiency

The computational efficiency of our proposed methods is another significant advantage. The high-dimensional encoding and the use of efficient algorithms allow for the rapid processing of large scRNA-seq datasets. The average running time of HDSCC is significantly lower than that of other methods, particularly for large datasets like PBMC and Campbell. This efficiency makes HDSCC and the HDC-based classification method practical for real-world applications, where computational resources and time are often limited.

4.5. Implications for Biomedical Research

The advancements presented in this study have important implications for biomedical research. The ability to accurately classify and cluster scRNA-seq data has the potential to uncover new insights into cellular heterogeneity, tissue function, and disease mechanisms. The robustness of our methods to noise ensures that these insights are reliable, even in challenging experimental conditions. This can lead to more accurate biological interpretations and support the development of personalized medicine approaches.
Furthermore, the scalability and efficiency of our methods make them suitable for large-scale studies, enabling researchers to analyze vast amounts of single-cell data without being hindered by computational constraints. This can accelerate discoveries in various fields, including cancer research, immunology, and developmental biology.

4.6. Future Work

While our study demonstrates the effectiveness of HDC-based methods for scRNA-seq data, there are several avenues for future research. One potential direction is to explore the integration of HDC with other advanced computational techniques, such as deep learning, to further enhance the performance and applicability of our methods. Additionally, applying our methods to other types of omics data, such as proteomics or metabolomics, could provide a more comprehensive understanding of cellular functions and interactions.
Another important area for future work is the development of methods to interpret the high-dimensional hypervectors in a biologically meaningful way. This could involve designing tools to map the features encoded in the hypervectors back to biological processes or pathways, providing more intuitive insights for biologists and clinicians. So, we plan to explore different embedding approaches to further enhance our methodology. Additionally, we will investigate more rigorous methods for mapping embeddings to hypervectors to improve classification performance.

5. Conclusions

In conclusion, our study demonstrates the significant potential of hyperdimensional computing (HDC) for analyzing scRNA-seq data. The proposed HDSCC method and HDC-based classification approach offer robust, accurate, and efficient solutions for both clustering and classifying single-cell data. By leveraging hyperdimensional encoding, our methods effectively address the challenges posed by the high dimensionality, noise, and sparse gene expression inherent in scRNA-seq datasets. Our experimental results, which include comparisons with established methods like XGBoost, Seurat reference mapping, and scANVI, further highlight the superiority of HDC in handling noise, dropout, and batch effects. Moreover, the computational efficiency and scalability of HDC make it a practical choice for processing large-scale biological datasets.
Beyond single-cell analysis, the versatility of hyperdimensional computing opens the door to broader applications in other high-dimensional biological data domains, such as proteomics, epigenomics, and transcriptomics. These findings suggest that HDC can not only advance bioinformatics and biomedical research but also drive innovations in personalized medicine, where precise, efficient data analysis is critical. Overall, our work underscores the importance of exploring brain-inspired computing models like HDC to address the growing complexity of biological data and unlock new opportunities for scientific discovery.

Author Contributions

Conceptualization, H.M. and M.B.; methodology, H.M. and M.B.; software, H.M.; validation, H.M. and M.B.; formal analysis, H.M. and L.C.; investigation, H.M.; resources, H.M. and L.C.; writing—original draft preparation, H.M.; writing—review and editing, H.M., L.C. and K.T.; visualization, H.M. and L.C.; supervision, K.T. and L.C.; project administration, K.T.; funding acquisition, K.T. All authors have read and agreed to the published version of the manuscript.

Funding

This research received no external funding.

Institutional Review Board Statement

Not applicable.

Informed Consent Statement

Not applicable.

Data Availability Statement

The datasets are publically available.

Conflicts of Interest

The authors declare no conflicts of interest.

References

  1. Stuart, T.; Butler, A.; Hoffman, P.; Hafemeister, C.; Papalexi, E.; Mauck, W.M.; Hao, Y.; Stoeckius, M.; Smibert, P.; Satija, R. Comprehensive integration of single-cell data. Cell 2019, 177, 1888–1902. [Google Scholar] [CrossRef] [PubMed]
  2. Butler, A.; Hoffman, P.; Smibert, P.; Papalexi, E.; Satija, R. Integrating single-cell transcriptomic data across different conditions, technologies, and species. Nat. Biotechnol. 2018, 36, 411–420. [Google Scholar] [CrossRef] [PubMed]
  3. Aldridge, P.L.; Metzner, H.; Morgan, J.P. High-throughput data integration and analysis for single-cell RNA-sequencing. Nat. Methods 2020, 17, 875–882. [Google Scholar]
  4. Tanay, E.; Regev, A. Scaling single-cell genomics from tissue organization to cell-type atlases. Genes 2019, 10, 10. [Google Scholar]
  5. Lun, E.; McCarthy, F.; Marioni, M. A Computational Workflow to Enhance Single-Cell RNA-seq Analysis. Nucleic Acids Res. 2021, 49, 705–721. [Google Scholar]
  6. Li, H.; Courtois, R.; Sengupta, M.; Prahalad, K. A Scalable Computational Framework for Large-Scale Single-Cell RNA-Seq Data. Nat. Biotechnol. 2018, 36, 411–420. [Google Scholar]
  7. Imani, M.; Rahimi, A.; Ly, D.R.; Rosing, T. HDCluster: An Efficient Clustering Algorithm for Hyperdimensional Computing. IEEE Trans. Comput. 2021, 70, 340–352. [Google Scholar]
  8. Rahimi, A.; Imani, M.; Lee, J.C.; Rosing, T. Hyperdimensional Computing for Nonlinear Classification of EEG Error-Related Potentials. In Proceedings of the IEEE International Conference on Rebooting Computing (ICRC), Washington, DC, USA, 8–9 November 2017; pp. 1–8. [Google Scholar]
  9. Neubert, P.; Protzel, P. Hyperdimensional Computing: A New Way of Representing Signals in Robotics. IEEE Robot. Autom. Mag. 2019, 26, 17–22. [Google Scholar]
  10. Hersche, M.; Stadelmann, R.; Benini, L. Fast and Accurate Multivariate Pattern Recognition of EEG Signals with Hyperdimensional Computing. IEEE Access 2020, 8, 190720–190734. [Google Scholar]
  11. Kanerva, P. Hyperdimensional computing: An introduction to computing in distributed representation with high-dimensional random vectors. Cogn. Comput. 2012, 1, 139–159. [Google Scholar] [CrossRef]
  12. Burrello, A.; Marchesoni, S.; Fornaciari, A.; Tagliavini, M. HDNN: Hyperdimensional Computing for Neural Networks. IEEE Trans. Neural Netw. Learn. Syst. 2021, 32, 4049–4063. [Google Scholar]
  13. Booeshaghi, A.; Pachter, L. Normalization of single-cell RNA-seq counts by log (x + 1) or log (1 + x). Bioinformatics 2021, 37, 2223–2224. [Google Scholar] [PubMed]
  14. Lun, A. Overcoming systematic errors caused by log-transformation of normalized single-cell RNA sequencing data. bioRxiv 2018, 404962. [Google Scholar] [CrossRef]
  15. Peng, M.; Lin, B.; Zhang, J.; Zhou, Y.; Lin, B. scFSNN: A feature selection method based on neural network for single-cell RNA-seq data. BMC Genom. 2024, 25, 264. [Google Scholar] [CrossRef]
  16. Cho, J.; Baik, B.; Nguyen, H.; Park, D.; Nam, D. Characterizing efficient feature selection for single-cell expression analysis. Briefings Bioinform. 2024, 25, bbae317. [Google Scholar]
  17. Baranpouyan, M.; Mohammadi, H.; Goudarzi, H.T.; Thirunarayan, K.; Chen, L. Enhancing Rare Cell Type Identification in Single-Cell Data: An Innovative Gene Filtering Approach using Bipartite Cell-Gene Relation Graph. In Proceedings of the 2023 IEEE EMBS International Conference on Biomedical and Health Informatics (BHI), Pittsburgh, PA, USA, 15–18 October 2023; pp. 1–5. [Google Scholar]
  18. Baranpouyan, M.; Mohammadi, H. HDSCC: A robust clustering approach for Single Cell RNA-seq data using Hyperdimensional Encoding. In Proceedings of the 2023 45th Annual International Conference of the IEEE Engineering in Medicine &Biology Society (EMBC), Sydney, Australia, 24–27 July 2023; pp. 1–5. [Google Scholar]
  19. Imani, M.; Bosch, S.; Datta, S.; Ramakrishna, S.; Salamat, S.; Rabaey, J.; Rosing, T. Quanthd: A quantization framework for hyperdimensional computing. IEEE Trans. Comput.-Aided Des. Integr. Circuits Syst. 2019, 39, 2268–2278. [Google Scholar] [CrossRef]
  20. Mohammadi, H.; Baranpouyan, M.; Thirunarayan, K.; Chen, L. HyperCell: Advancing Cell Type Classification with Hyperdimensional Computing. In Proceedings of the 2024 46th Annual International Conference of the IEEE Engineering in Medicine and Biology Society (EMBC), Orlando, FL, USA, 15–19 July 2024; pp. 1–4. [Google Scholar]
  21. Ward, J.H., Jr. Hierarchical grouping to optimize an objective function. J. Am. Stat. Assoc. 1963, 58, 236–244. [Google Scholar] [CrossRef]
  22. Usoskin, D.; Furlan, A.; Islam, S.; Abdo, H.; Lönnerberg, P.; Lou, D.; Hjerling-Leffler, J.; Haeggström, J.; Kharchenko, O.; Kharchenko, P.V.; et al. Unbiased Classification of Sensory Neuron Types by Large-Scale Single-Cell RNA Sequencing. Nat. Neurosci. 2015, 18, 145–153. [Google Scholar] [CrossRef]
  23. Zeisel, A.; Muñoz-Manchado, A.B.; Codeluppi, S.; Lönnerberg, P.; La Manno, G.; Juréus, A.; Marques, S.; Munguba, H.; He, L.; Betsholtz, C.; et al. Brain Structure: Cell Types in the Mouse Cortex and Hippocampus Revealed by Single-Cell RNA-seq. Science 2015, 347, 1138–1142. [Google Scholar]
  24. Macosko, E.Z.; Basu, A.; Satija, R.; Nemesh, J.; Shekhar, K.; Goldman, M.; Tirosh, I.; Bialas, A.R.; Kamitaki, N.; Martersteck, E.M.; et al. Highly Parallel Genome-Wide Expression Profiling of Individual Cells Using Nanoliter Droplets. Cell 2016, 161, 1202–1214. [Google Scholar]
  25. Campbell, J.N.; Macosko, E.Z.; Fenselau, H.; Pers, T.H.; Lyubetskaya, A.; Tenen, D.; Goldman, M.; Verstegen, A.M.J.; Resch, J.M.; McCarroll, S.A.; et al. A Molecular Census of Arcuate Hypothalamus and Median Eminence Cell Types. Nat. Neurosci. 2017, 20, 484–496. [Google Scholar] [CrossRef] [PubMed]
  26. 10x Genomics. 1k PBMCs from a Healthy Donor (v3 Chemistry); 10x Genomics: Pleasanton, CA, USA, 2018. [Google Scholar]
  27. 10x Genomics. 5k Peripheral Blood Mononuclear Cells (PBMCs) from a Healthy Donor with a Panel of TotalSeq™-B Antibodies (v3 Chemistry); 10x Genomics: Pleasanton, CA, USA, 2019. [Google Scholar]
  28. Hubert, L.; Arabie, P. Comparing partitions. J. Classif. 1985, 2, 193–218. [Google Scholar] [CrossRef]
  29. Strehl, A.; Ghosh, J. Cluster ensembles—A knowledge reuse framework for combining multiple partitions. J. Mach. Learn. Res. 2002, 3, 583–617. [Google Scholar]
  30. Kiselev, V.Y.; Kirschner, K.; Schaub, M.T.; Andrews, T.; Yiu, A.; Chandra, T.; Natarajan, K.N.; Reik, W.; Barahona, M.; Green, A.R.; et al. SC3: Consensus clustering of single-cell RNA-seq data. Nat. Methods 2017, 14, 483–486. [Google Scholar]
  31. Wang, B.; Zhu, H.; Zhang, Z.; Gillis, S.P. SIMLR: A Tool for Large-Scale Single-Cell RNA-Seq Data Analysis by Multi-Kernel Learning. BioRxiv 2017, 18, 118901. [Google Scholar]
  32. Lloyd, S. Least squares quantization in PCM. IEEE Trans. Inf. Theory 1982, 28, 129–137. [Google Scholar] [CrossRef]
  33. Sun, Z.; Wang, T.; Deng, K.; Wang, X.F.; Lafyatis, R.; Ding, Y.; Hu, M.; Chen, W. DIMM-SC: A Dirichlet mixture model for clustering droplet-based single cell transcriptomic data. Bioinformatics 2018, 34, 139–146. [Google Scholar]
  34. Žurauskienė, J.; Yau, C. pcaReduce: Hierarchical clustering of single cell transcriptional profiles. BMC Bioinform. 2016, 17, 140. [Google Scholar]
  35. Huang, M.; Wang, J.; Torre, E.; Dueck, H.; Shaffer, S.; Bonasio, R.; Murray, J.I.; Raj, A.; Li, M.; Zhang, N.R. SAVER: Gene expression recovery for single-cell RNA sequencing. Nat. Methods 2018, 15, 539–542. [Google Scholar]
  36. Van Dijk, D.; Nainys, J.; Sharma, R.; Kaithail, P.; Carr, A.J.; Moon, K.R.; Mazutis, L.; Wolf, G.; Krishnaswamy, S.; Pe’er, D. Recovering Gene Interactions from Single-Cell Data Using Data Diffusion. Cell 2018, 174, 716–729.e27. [Google Scholar]
  37. Hafemeister, C.; Satija, R. Normalization and variance stabilization of single-cell RNA-seq data using regularized negative binomial regression. Genome Biol. 2019, 20, 296. [Google Scholar]
  38. Cao, C.; Zheng, S.; Cox, D.K.; Zhang, Y.; Wang, L.; Li, M.; Chen, H.; Liu, J.; Yang, X.; Huang, Q.; et al. Comprehensive single-cell transcriptome lineages of a multicellular organism. Science 2020, 370, 1234–1240. [Google Scholar]
  39. Baron, M.; Veres, A.; Wolock, S.L.; Faust, A.L.; Gaujoux, R.; Vetere, A.; Ryu, J.H.; Wagner, B.K.; Shen-Orr, S.S.; Klein, A.M.; et al. A single-cell transcriptomic map of the human and mouse pancreas reveals inter-and intra-cell population structure. Cell Syst. 2016, 3, 346–360. [Google Scholar] [CrossRef] [PubMed]
  40. Wagner, D.E.; Weinreb, C.; Collins, Z.M.; Briggs, J.A.; Megason, S.G.; Klein, A.M. Single-cell mapping of gene expression landscapes and lineage in the zebrafish embryo. Science 2018, 360, 981–987. [Google Scholar]
  41. Chen, H.; Ryu, J.; Vinyard, M.; Lerer, A.; Pinello, L. SIMBA: Single-cell embedding along with features. Nat. Methods 2024, 21, 1003–1013. [Google Scholar] [CrossRef]
  42. Indyk, P.; Motwani, R. Approximate nearest neighbors: Towards removing the curse of dimensionality. In Proceedings of the Thirtieth Annual ACM Symposium on Theory of Computing (STOC), Dallas, TX, USA, 24–26 May 1998; ACM: New York, NY, USA, 1998; pp. 604–613. [Google Scholar]
Figure 1. Overview of the hybrid clustering pipeline using Hyperdimensional Computing (HDC). Gene expression data is first encoded into high-dimensional space through HD-encoding. Features are then constructed and passed to a hybrid clustering module to identify distinct cell subpopulations. The final diagram on the right presents a representative example of clustering output, where clusters are shown in blue, red, and black.
Ai 06 00094 g001
Figure 2. Overview of the HD encoding and classification methodology: (A) The original dataset containing cells ( C i ) and gene expression levels ( G j ). (B) Normalization of count data. (C) Selection of high variation genes to reduce dropout effect. (D) Production of base hypervectors for high variation genes. (E) Division of gene values into 20 levels and creation of value hypervectors. (F) Hyperdimensional encoding flowchart. (G) Initial training process for classification, including calculation of class vector representatives. (H) Fine-tuning of class vectors with learning rate α .
Ai 06 00094 g002
Figure 3. Clustering performance (ARI value) of all methods over different subsets of the PBMC-2 dataset. NC denotes the number of cells in the corresponding subset.
Ai 06 00094 g003
Figure 4. Robustness of clustering methods across varying levels of noise. This figure compares the performance of different clustering methods in terms of ARI when subjected to increasing levels of random noise in the dataset. The analysis is conducted on multiple scRNA-seq datasets to assess how each method’s clustering accuracy is affected by noise. Rhomboidal markers represent outliers in the performance scores based on standard boxplot convention (values beyond 1.5 × IQR).
Ai 06 00094 g004
Figure 5. Comparison of our model with other classification models on accuracy, F-score, and micro F-score.
Ai 06 00094 g005
Figure 6. Stability analysis: F-score of different methods in the presence of random noise (0% to 50%) for Pancreas, CeNGEN, and Zebrafish datasets.
Ai 06 00094 g006
Figure 7. Data error robustness evaluation. The figure shows the performance of various clustering methods, including HDSCC, across six different datasets (Usoskin, Zeisel, Macosko, Campbell, PBMC, and PBMC-2) as the percentage of data error increases. The x-axis represents the data error percentage (%), while the y-axis represents the quality loss (%). The legend on the right indicates the different methods compared in the study.
Ai 06 00094 g007
Table 1. Datasets and their characteristics.
DatasetCellsGenesCell TypesSparsity%
Usoskin [22]62225,334485
Zeisel [23]300519,972981
Macosko [24]10,55923,2883990
Campbell [25]20,92126,7742093
PBMC [26]76,89932,738798
PBMC-2 [27]600032,738398
Table 2. Comparison of HDSCC with state-of-the-art scRNA-seq clustering methods using Adjusted Rand Index (ARI) and Normalized Mutual Information (NMI). The highest value in each column is highlighted in bold.
MethodUsoskinZeiselMacoskoCampbellPBMCPBMC-2
ARI/NMIARI/NMIARI/NMIARI/NMIARI/NMIARI/NMI
HDSCC91.5/85.181.5/76.274.5/79.670.1/79.273.4/73.275.3/74.8
PcaReduce71.0/66.650.4/65.534.2/68.215.2/55.446.4/63.062.1/63.3
SIMLR30.5/34.670.2/75.637.1/56.128.2/53.010.2/24.636.8/41.0
PCA + k-means18.5/24.972.0/74.837.2/69.023.4/59.964.1/73.023.7/31.0
SC388.5/87.378.7/71.758.0/78.835.2/65.170.3/74.560.2/55.2
DIMM-SC43.5/52.452.3/63.740.1/67.019.0/56.133.2/37.454.0/60.1
MAGIC63.6/72.727.9/50.922.5/61.38.2/26.230.0/32.367.4/67.3
SAVER88.4/85.556.2/69.845.7/73.810.2/18.960.4/70.858.3/57.5
Seurat61.0/73.242.8/63.633.9/37.840.2/44.243.7/51.844.5/46.1
Table 3. Running time (in seconds) for various methods across all datasets. The lowest value in each column is highlighted in bold.
Method/DataUsoskinZeiselMacoskoCampbellPBMC
HDSCC10.111.719.371.597.8
PcaReduce20.845.3343.3439.2402.2
SIMLR4.37.333.153.272.2
PCA + k-means7.28.118.263.492.4
SC34.37.433.4125.3341.1
DIMM-SC12.123.239.257.398.2
MAGIC5.16.522.356.373.2
SAVER7.315.453.491.2211.3
Seurat7.29.428.240.5110.2
Table 4. Summary of the classification datasets used in the study, including the number of cells (individual cell samples), genes (number of gene expression profiles), experiments (the number of different labs or experiments from which the data are gathered), and cell types (the distinct types of cells identified in the dataset) for each dataset.
DatasetCellsGenesExperimentsCell Types
CeNGEN100,95522,46917169
Pancreas16,38218,771614
Zebrafish26,02225,258224
Table 5. Comparison of F-scores between previous and proposed methods.
DatasetPrevious F-ScoreProposed F-Score
Pancreas0.9710.977
CenGEN0.640.67
Zebrafish0.780.82
Disclaimer/Publisher’s Note: The statements, opinions and data contained in all publications are solely those of the individual author(s) and contributor(s) and not of MDPI and/or the editor(s). MDPI and/or the editor(s) disclaim responsibility for any injury to people or property resulting from any ideas, methods, instructions or products referred to in the content.

