1. Introduction
Although fixed-income deposits offer security and stability, their profitability is significantly lower compared to alternatives, such as variable incomes based on stock investments. However, stock investments are inherently volatile, with potential for both gains and losses, particularly in the short term. The careful selection of stock assets substantially influences the overall profitability of investment portfolios [
1]. In this scenario, investors highly appreciate proper investment recommendations, which may stem from either human expertise or automated systems, such as robo-advisors. Indeed, numerous studies have confirmed that computerized methods, e.g., investments in passive Exchange-Traded Fund (ETF) tracking benchmark indices such as Standard & Poor’s 500 (S&P 500) and NASDAQ-100, typically outperform actively managed ETFs overseen by human experts [
2]. These passive ETFs are managed using straightforward rules based on market capitalization.
In the contemporary era of advanced artificial intelligence (AI), researchers have explored innovative approaches for recommending stock investments. For example, Pelster et al. [
3] investigated whether the intelligent chat bot ChatGPT could assist in stock selection. Their findings indicate that ChatGPT-4, when equipped with internet access, successfully provided useful recommendations that yielded interesting dividend returns. It is worth noting that dividend yields are relatively predictable based on historical data (e.g., king stocks have consistently provided increasing dividend values over decades). These developments reflect a growing interest in using modern AI technologies, such as generative AI-based chat systems, for effective stock selection in investment strategies.
Furthermore, stock price prediction is widely regarded as one of the most challenging tasks in financial analysis due to its inherent complexity and significant uncertainty. Nevertheless, markets such as S&P 500 have demonstrated consistent average growth over decades [
4]. Thus, investors recognize that the probability of achieving positive returns favors long-term investment, though they also know that successful outcomes depend on the careful selection of stocks and optimal timing.
Novice and experienced investors not only need a proposed stock investment portfolio with some expectations, but they also need to understand the analysis behind and the most relevant information of each of the companies. Our approach provides such explanations with some of the well-known charts from XAI and also a proper description of each company, providing an explained portfolio with a technique that reduces individual stock investment risk with a diversified portfolio.
In this study, we propose an automated approach that integrates a traditional machine learning (ML) method; specifically, it is a multi-layer perceptron (MLP) neural network, where explainable artificial intelligence (XAI) is used to generate investment portfolio recommendations. Additionally, we incorporate DeepSeek, a tool of generative artificial intelligence (GAI), to enhance the interpretability of our system’s recommendations. This is achieved through prompt engineering and template-based text generation, which provide detailed explanations of the outputs. In addition, this work evaluates the application of GAI within the framework of XAI. Moreover, the XAI recommendations must be protected to guarantee the security of the information proposed by the system.
The main objective of this research is to provide a portfolio accompanied by comprehensive information, thereby fostering investor trust in these recommendations. Therefore, our system provides transparent and interpretable insights into the decision-making process behind each recommendation. This transparency not only enhances user confidence in the AI-driven suggestions, but it also enables investors to better understand the rationale underpinning the proposed strategies, thereby supporting informed decision making in stock investment.
The contributions of this research can be summarized as follows: (1) providing a dataset containing key financial metrics of the last five years; (2) providing an explainable investment recommendation system to recommend stock portfolios, utilizing both XAI and GAI tools; (3) bridging the gap between XAI and GAI tools and showcasing their combined potential in the context of the financial decision-making process; and (4) introducing a model based on the Artificial Intelligence Trust, Risk, and Security Management (AI TRiSM) framework to provide an integrated approach to trust, risk, and security management. Thus, our system delivers clear, transparent, and secure explanations, enhancing user understanding and trust in the decision-making process.
This paper is structured as follows:
Section 2 provides the research context,
Section 3 details the methodology,
Section 4 introduces the evaluation method,
Section 5 presents the results, and
Section 6 and
Section 7 offer a discussion of the findings and the main conclusions, respectively.
2. Related Work
AI is frequently employed for stock recommendation systems. For instance, Kang et al. [
5] introduced an AI-based approach for rebalancing highly volatile financial portfolios. In particular, ML techniques are commonly applied to stock market prediction, but there are still challenges related to non-linear methods [
6]. Despite these advancements, only a limited number of studies address the use of GAI for stock market forecasting. One of the objectives of our work is to provide insights into the application of GAI for stock market forecasting.
The integration of AI into financial markets has significantly transformed the landscape of stock market forecasting, especially in the area of generative modeling and XAI. In this section, we review the literature on the application of GAI for stock investment recommendations and the use of XAI techniques to enhance the explanation of predictions.
Moreover, in the financial markets, trust, risk, and security management need to be considered when working with XAI systems. Optimizing AI system security requires a comprehensive approach that integrates the proper security strategies. In this case, some models, such the TRiSM framework, can be applied [
7].
By examining these two research areas, this study seeks to integrate the innovative potential of GAI with the transparency offered by XAI, applying the TRiSM framework to propose a methodology that guarantees trust, risk, and security management in these scenarios, thereby contributing to the development of more robust and reliable stock investment recommendation systems.
2.1. GAI in Stock Investment Recommendation
In recent years, several researchers have explored the use of AI, especially GAI, to directly construct, manage, or optimize investment portfolios [
3,
8,
9,
10]. Others have concentrated their efforts on developing methods to generate synthetic financial data [
11], enhance financial advisory services [
12], conduct sentiment analysis of unstructured financial data [
13], or improve operational capabilities [
14].
Aiche et al. [
8] employed an innovative AI-driven approach to build and manage a portfolio of cybersecurity stocks from 2018 to 2024. They collected structured financial data, such as historical stock prices, financial ratios, and quarterly earnings, from sources such as Bloomberg. They used financial metrics, such as the trailing P/E ratio (also known as PER), price-to-earnings-growth (PEG), return on equity (ROE), and forward PER, to prioritize stocks. Additionally, they incorporated unstructured data from financial news (Yahoo Finance, Investing.com, and MarketWatch) and social media (X, Reddit, and StockTwits). They used sentiment analysis to identify the companies with high investor confidence and market perception. The selection process filters by market capitalization and applies criteria, such as revenue growth, sentiment score, forward PER, PEG ratio, and ROE. Subsequently, they employed ML models (Random Forest and SVM) and fundamental analysis to predict the direction of the stocks. Predictions are generated through a weighted combination: 40% from the Random Forest and SVM forecasting models, 25% from sentiment analysis, 20% from fundamental metrics, and 15% from revenue growth. They created the final portfolio using mean-variance optimization (MVO) and rebalanced quarterly with assistance from GAI (ChatGPT-40). They evaluated the performance of the portfolio using the Sharpe ratio and maximum drawdown. Their results outperformed the returns of traditional cybersecurity investments.
Advancing the use of GAI for portfolio recommendations, Kim [
9] examined the integration of ChatGPT into a quantitative investment framework, acting as a quant asset manager. They collected 10 years of data from sources such as Federal Reserve Economic Data and Yahoo Finance. ChatGPT is used to construct the investment portfolio by recommending asset classes based on economic conditions, replacing human asset managers. While they use ChatGPT to understand macroeconomic relationships between economic conditions and asset class movements, they do not employ it to assess current market conditions. ChatGPT recommendations are evaluated using equally weighted, global minimum-variance, and risk-parity portfolio strategies, demonstrating improved portfolio efficiency compared to traditional models.
Similarly, Pelster et al. [
3] investigated whether ChatGPT-4, enriched with additional information from a web search engine, can provide valuable investment advice by predicting earnings surprises and evaluating the attractiveness of stocks. They proposed two prompts: one for predicting earnings and another for assessing the relative attractiveness of each S&P 500 company. They developed an application that automates a conversation with ChatGPT via the WebChatGPT Chrome extension, entering prompts about earnings surprises or stock attractiveness. Recommendations are evaluated using the mean return and Sharpe ratio, finding a positive correlation between ChatGPT ratings and future stock returns. This suggests that ChatGPT can successfully identify stocks that outperform.
In the same vein, Huang et al. [
10] explored stock selection and portfolio optimization using a structured prompt framework with GAI (ChatGPT) and a novel bio-inspired algorithm. They proposed a structured framework composed of strategy (basic guidelines for the stock selection process), goals (investment objectives), and constraints (investors’ restrictions). They evaluated their results using risk, expected return (ER), and the Sharpe ratio. Although their findings are promising, they have pointed out that a weakness of AI recommendations is that they do not have real-time market analysis.
While the aforementioned studies focus on direct portfolio management, other research has utilized AI, particularly GAI, as an analytical tool or to generate synthetic data that enhances financial understanding. For instance, Ante et al. [
15] applied Natural Language Processing (NLP) to analyze the 10-K filings of NASDAQ companies (2010–2022), classifying AI exposure using binary and weighted scores based on the frequency of AI-related terms. Their approach generated four indices, though without AI-driven optimization. Their methodology prioritizes objective classification over predictive portfolio construction. Nevertheless, their findings reveal a rising trend in AI mentions over time and significant positive abnormal returns for companies with high AI exposure following the emergence of ChatGPT. In contrast, Takahashi et al. [
11] used GAI to generate synthetic financial time series for modeling market dynamics, rather than focusing on proposing investment portfolios.
Other studies have assessed AI capabilities in financial sentiment analysis and advisory roles, offering broader insights into its potential. Muhammad et al. [
13] evaluated the effectiveness of traditional sentiment analysis techniques compared to ChatGPT and Gemini in the financial domain. They created a dataset of 1476 news headlines from the Bloomberg financial news service, which were enriched with manual sentiment score annotations. They evaluated the effectiveness of each of the conventional sentiment analysis models, ChatGPT and Gemini, using classification metrics, such as precision, recall, F1-measure, and accuracy. Their results showed that ChatGPT slightly outperformed the highly optimized conventional method.
Huang et al. [
12] investigated the role of GAI in improving robo-advisers (RA) for financial advisory services, concluding that AI-driven financial advisors can analyze market conditions and provide insights into future trends.
Finally, Jackson et al. [
14] explored the transformative role of AI and GAI in supply chain and operations management. These authors used GAI to improve operational capabilities (e.g., synthetic data for demand forecasting), but not to create investment portfolios.
Our research differs from the previous related works by integrating XAI and GAI tools to create a transparent and explainable investment recommendation system. While studies such as [
3,
8,
9] utilized GAI for portfolio management, they did not incorporate XAI to enhance user understanding and trust. Additionally, our approach provides a dataset with key financial metrics, which was not a primary focus in the aforementioned studies.
2.2. XAI in Stock Investment Recommendation
The integration of XAI in stock investment recommendations to enhance both the accuracy and interpretability of predictions has been explored. For instance, Ferrara et al. [
16] investigated the combination of ML and XAI techniques to improve the accuracy and interpretability of stock price predictions. They focused on companies with strong environmental sustainability commitments, such as Tesla, NextEra Energy, Vestas, and Enel, using data from Yahoo Finance. Their approach involves training short-term stock price prediction models using Random Forest and XGBoost with variables like Open, High, Low, and Volume reflecting market behavior. To understand the contribution of each variable, they employ XAI techniques, such as Shapley additive explanations (SHAPs) and local interpretable model-agnostic explanations (LIMEs). Notably, SHAP analysis revealed that the high and open variables significantly impacted Random Forest predictions, while the high variables were dominant in XGBoost.
In contrast, Wang et al. [
17] developed a deep learning model based on generative adversarial networks to predict stock market returns and to construct a portfolio. Although they did not use XAI techniques like SHAP and LIME, their model provides insights into key predictors, such as momentum, liquidity, and fundamentals. To test their model, they collected data on stocks in the Chinese market from the Wind platform. Their model outperformed traditional and ML methods and portfolio performance (achieving a 23.52% annualized return and a Sharpe ratio of 1.29). Their work contributes to both asset pricing literature and explainable AI, offering practical insights for investors, analysts, and regulators.
Our research differs from existing XAI studies by combining XAI tools with GAI to create a transparent and explainable investment recommendation system. While works like [
16] use XAI to enhance the interpretability of stock price predictions, they do not integrate GAI to broaden its scope in the financial decision-making process. Additionally, our approach uses the fundamental financial information of companies, as shown in our dataset with key financial metrics, which was not a primary focus in the aforementioned works. This allows for a more comprehensive understanding of the investment process.
The novelty of the proposed system lies in its ability to not only provide portfolio recommendations, but also deliver explanations of these recommendations.
3. Methodology
The proposed methodology includes the use of ML techniques to provide an investment portfolio recommendation. In addition, these recommendations are enriched with XAI and the proper explanations provided by DeepSeek. Our predictions were evaluated using the t-Student test, and the generated AI explanations were evaluated using GAI tools, such as ChatGPT, Gemini, Grok, and Qwen. We explain, in more detail, each step of our proposed methodology in the following lines and later on when we present the evaluation method in
Section 4.
Step 1. Data collection: This step comprises collecting the financial fundamentals PER and Net Profit Margin (NPM) from technological companies using the Yahoo Finance service for the last five years. We implemented an ad hoc Python API to retrieve these data from Yahoo Finance. More details about the data collection are explained in
Section 3.2. As a result of this step, we provide the generated dataset, which can be downloaded from the Mendeley dataset (“Dataset about stock fundamentals and later stock price increases in a four-year period”, Mendeley Data, V1, DOI: 10.17632/5jk4bm7x5v.1).
Step 2. Prediction of an investment portfolio: This step is composed of the typical steps of knowledge discovery, i.e., preprocessing, modeling, and evaluation. In preprocessing, the dataset is separated into input data (X) and output data (Y), where X contains two columns, PER and NPM, and Y contains a percentage of the increased value. Descriptive statistical analysis is necessary to check whether transformations (e.g., normalization) are necessary. Afterward, the dataset is split into a training and a testing set. Modeling includes generating an initial model with the training dataset. In this stage, some of the most common ML approaches, such as MLP, k-Nearest Neighbors, and Support Vector Machine (SVM) are tested. An MLP neural network was chosen due to its flexibility and potential prediction feasibility. A k-fold cross-validation strategy is used to predict the optimal hyperparameters of MLP. Once this step is completed, an MLP is generated by taking into account the optimal hyperparameters, and it is then trained with the training dataset. We used different numbers of neurons, ranging from 25 to 300 neurons and from 2 to 3 layers, and we picked the combination of 2 layers of 150 neurons each as the one that avoided overfitting and provided an average profitability over the average of the index.
Step 3. Explanations of an investment portfolio: This step includes the use of GAI tools to provide more information about the selected companies in the investment portfolio recommendation. In this research, we use the DeepSeek tool and prompt engineering.
Step 4. Design of the security protocols: This step uses the AI TRiSM model for managing security and risk. This step has two sub-phases concerning, respectively, the design of the security protocol and the simulation of potential attacks.
Each of the most relevant aspects of the methodology are described in each of the following subsections.
3.1. System Architecture
The proposed methodology recommends developing a system with a certain architecture.
Figure 1 shows an overview of the system architecture. Green boxes represent external API or libraries, blue boxes denote internal system modules, and pink boxes indicate system outputs. On the left, the Data Collector module retrieves data from the Yahoo Finance API, extracting key fundamental financial values for companies with a given index. This module stores the data into a dedicated financial data repository. The ML Model module contains a ML model trained on this repository to forecast company stock prices four years ahead. The Portfolio Recommender module integrates the outputs from the ML model, the XAI module, and the Prompt Generator. Within this module, the ML model is used for picking up a portfolio of a given number of companies. The Prompt Generator is used for generating prompts for the purpose of obtaining a description of the most relevant aspects of each company, which are obtained thanks to DeepSeek. The XAI Security module uses AI TRiSM to ensure security. The XAI module is used for providing SHAP charts using the SHAP technique and local interpretable model-agnostic explanation (LIME) charts to describe the relevance of each fundamental financial value in the decisions. Together, these components enable the Portfolio Recommender to deliver a recommended portfolio with a description of the portfolio and explanations about how the decision was reached when suggesting such a portfolio.
3.2. Dataset
The dataset was collected from the source of the Yahoo Finance service. This dataset serves as a valuable resource, offering a solid and reliable foundation for conducting financial analysis and supporting data-driven decision making.
The most relevant financial metric of stock fundamentals is PER, which is the proportion of the price of the stock divided by the total earnings. This shows undervalued stocks. However, being undervalued might also mean that there might be a reason for a real-problem that makes the market undervalue a specific stock.
Another relevant aspect is NPM, which represents the ratio of net profits divided by all the incomes of the company. This margin is important to know how much of the sales are profit. This also depends on the sector, since, for example, technology and consumer goods companies usually have completely different margins.
Dividend yield shows the percentage of the stock price that is provided in dividends. Normally, dividends show that the company is so profitable that it can distribute its profits. This is very important to consider with the payout ratio, which represents the percentage of the earnings that are distributed in dividends. Another interesting aspect is the dividend growth rate, which is used to see how much the dividend is growing per year (normally calculated within the last five years).
Cashflow indicates how much liquid money is generated in the company for a year per action. It can distinguish between operative cashflow (not considering financing costs), investment cashflow (that considers investments of a company in financial services, real estates, and other properties), and financing cashflow (considering financing investments and payments).
Other relevant metrics are return on investment (ROI) measures as the NPM is divided by the cost of investment.
All these financial metrics are calculated from the last five years, and it is also important to see them in perspective.
Regarding the management of missing values, we only collected the stock values from which all the information was collected to only recommend stock investments based on stocks with full fundamental financial information. In the data collection, if this happened, our program informed which stock values were discarded for this reason. We also considered the possibility of replacing the missing values with the average values of their sectors (notice that some fundamental values depend very much on the sectors). However, the automatic classification of stock values into a sector was not a straightforward problem since some companies belonged to several sectors and the result of this classification could alter the final price predictions.
The dataset also included the price of the stock four years before the experiment (February 2021) and the price during the experiment (February 2025), as well as the price increase. The first published version of the dataset only included PER and NPM, both of the mentioned prices, and the percentage increase in the four-year period since these were the values that were actually used in our first experiment. Later, we included more data concerning the other financial ratios about dividend yield, payout ratio, cashflow and ROI. We also included information from April 2021 to April 2025, where the latter was understood as a different scenario due to the impact of custom USA duties on the global economy. The financial ratios were obtained by obtaining information through the Yahoo Finance library in Python and applying the required equations for calculating the corresponding ratios.
3.3. Analysis About the Financial Ratios for Automatic Recommendations
This approach focuses on diversified value investment based on the known data from companies that are usually useful in long-term investments (i.e., a period of several years). For this purpose, our automated system is based on the fundamental financial aspects of companies.
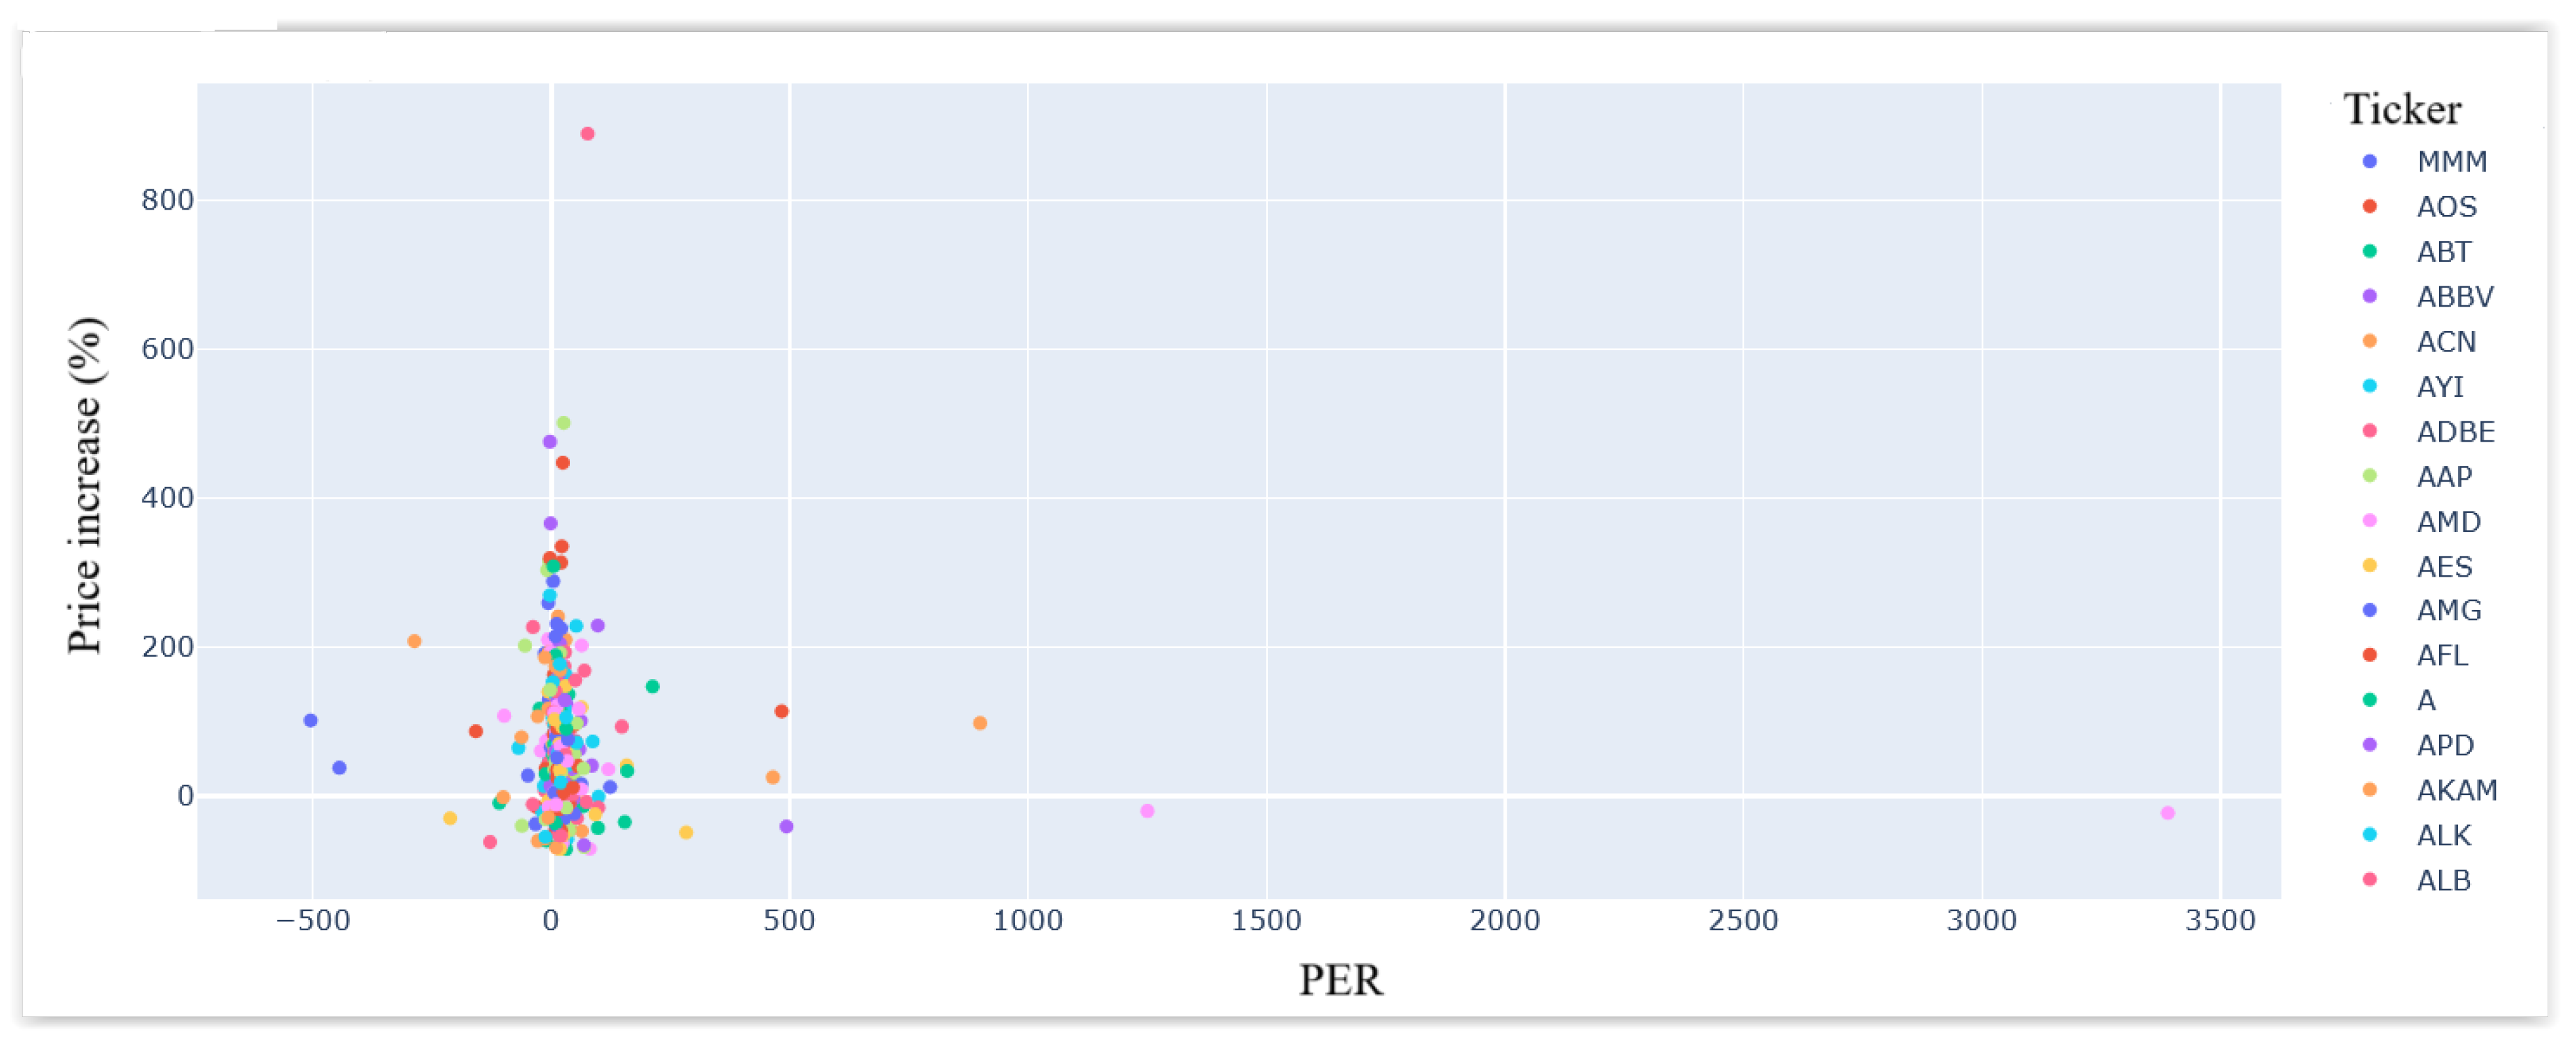
To begin with, this approach considers the PER and NPM. Intuitively, PER represents the number of years such that the companies earn as much as their initial costs, where both the price and this ratio are frozen over time. From a basic and abstract viewpoint, a low PER should represent buying opportunities for its inherent profitability. However, this assumption is naive and far from the truth, as the last four years of history shows in
Figure 2. This figure presents the percentage of increase ratio in the stock price month of our initial experiments (February 2025) over the prices that were applicable during the four years before the experiment, as well as those related to the PER values four years ago, for the companies in the S&P 500. As one can observe, there was no clear relation between these two concepts, at least when considering the below chart.
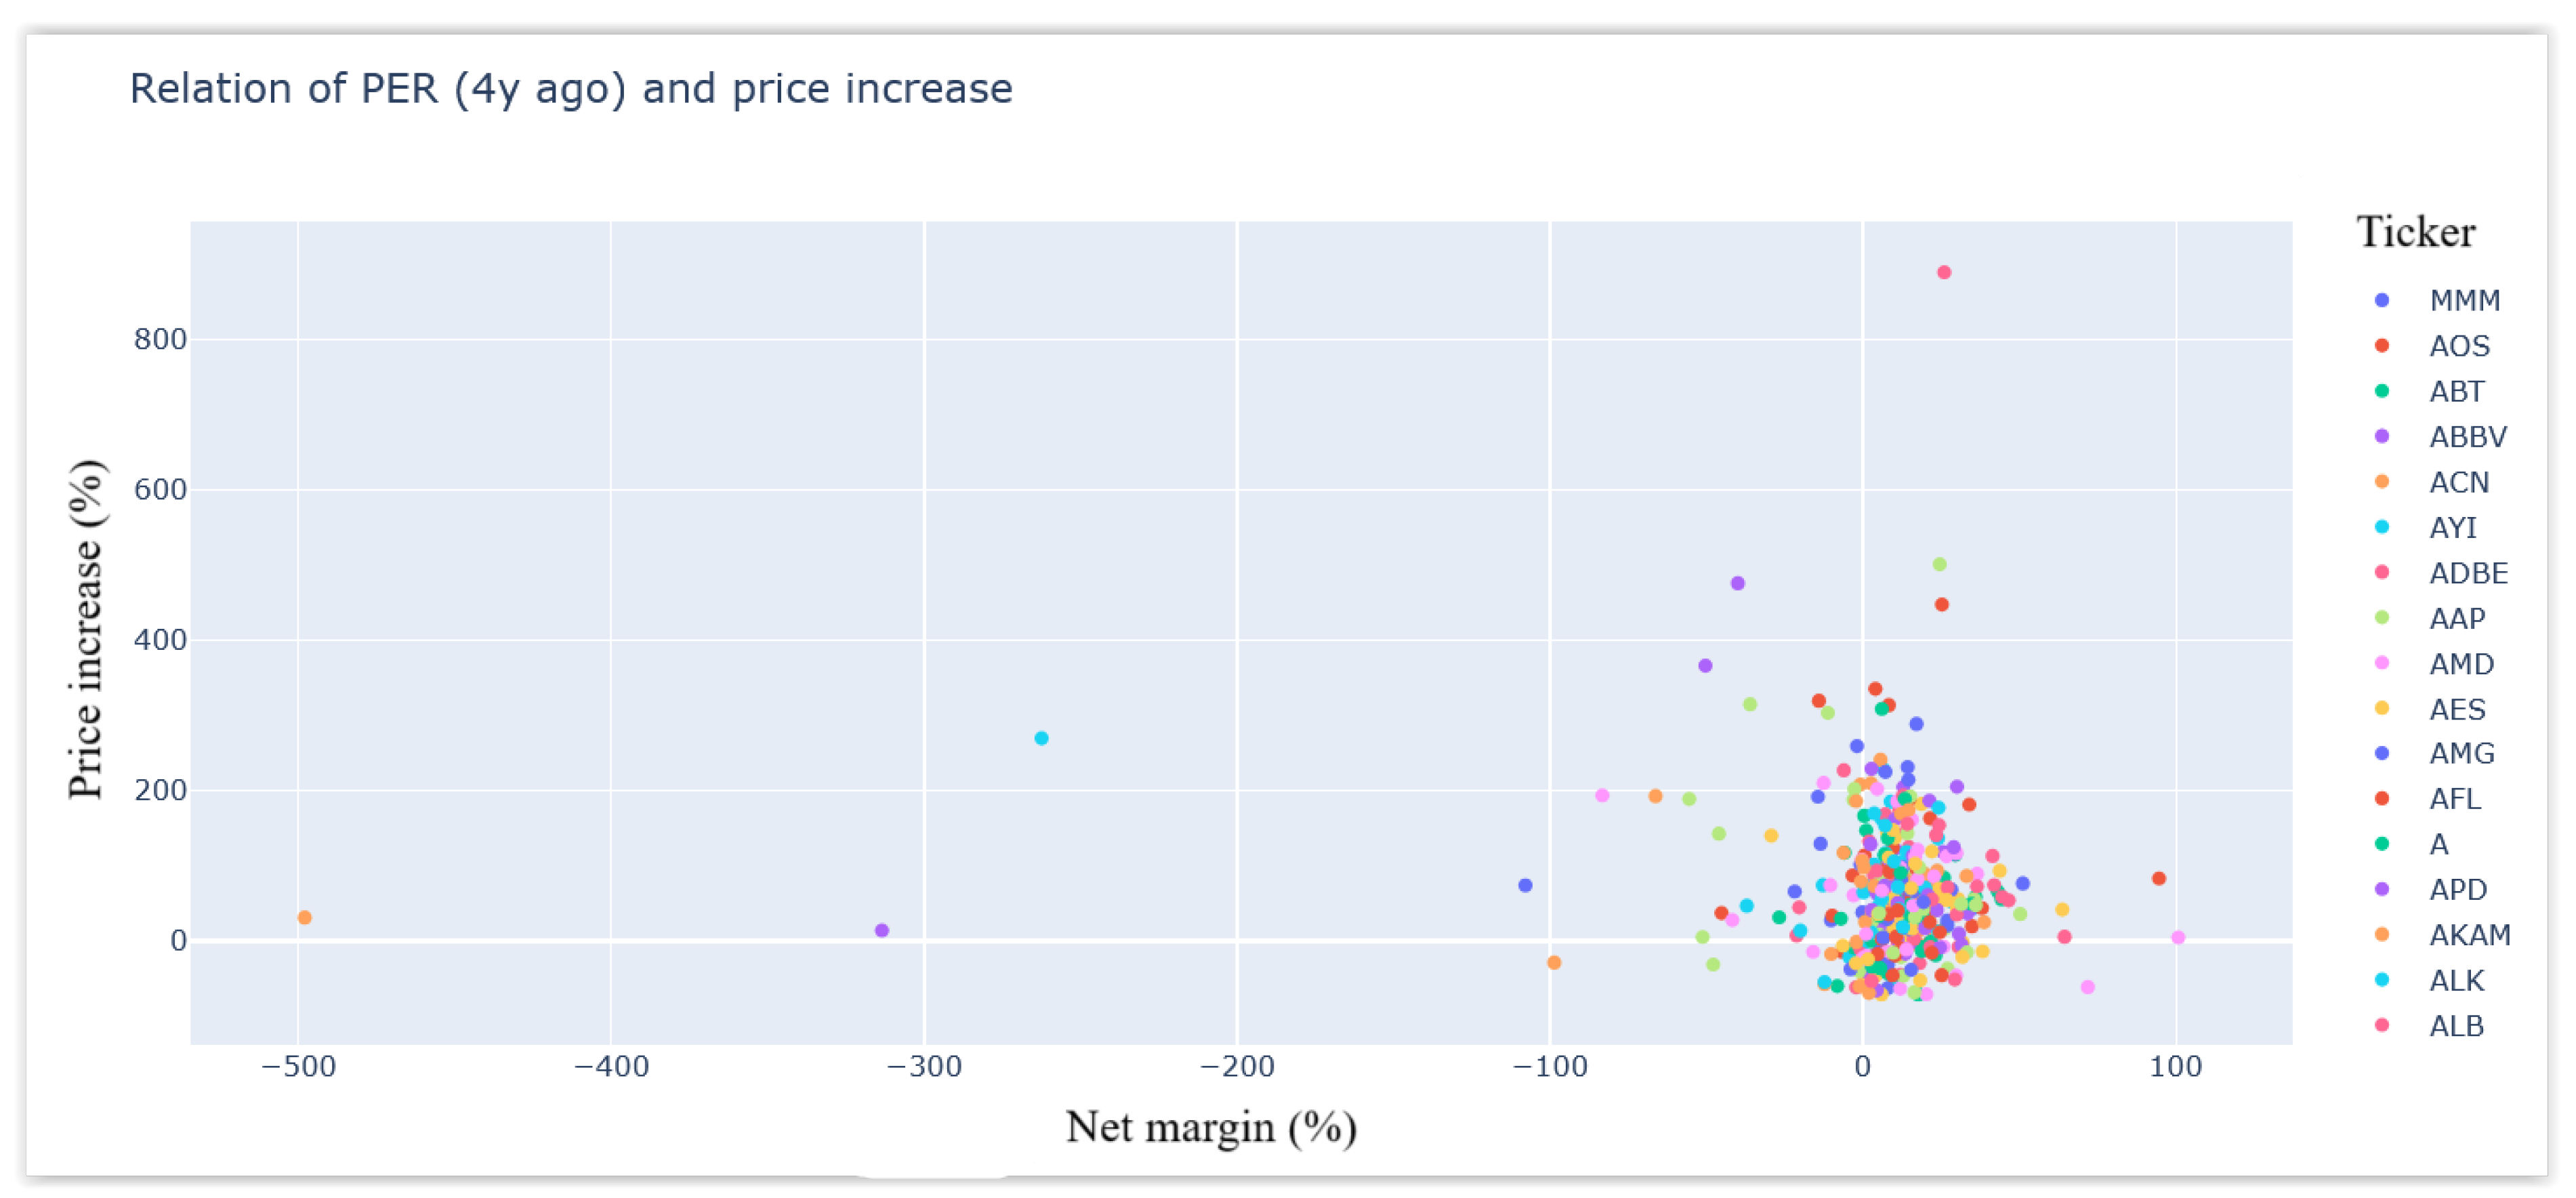
The proposed approach also considers the NPM, which represents the percentage of profits out of total revenue.
Figure 3 shows the scatter plot of all the S&P 500 companies regarding their 4-year price increases in relation to the NPM at the beginning of this period. This figure does not show a clear relationship between these two variables.
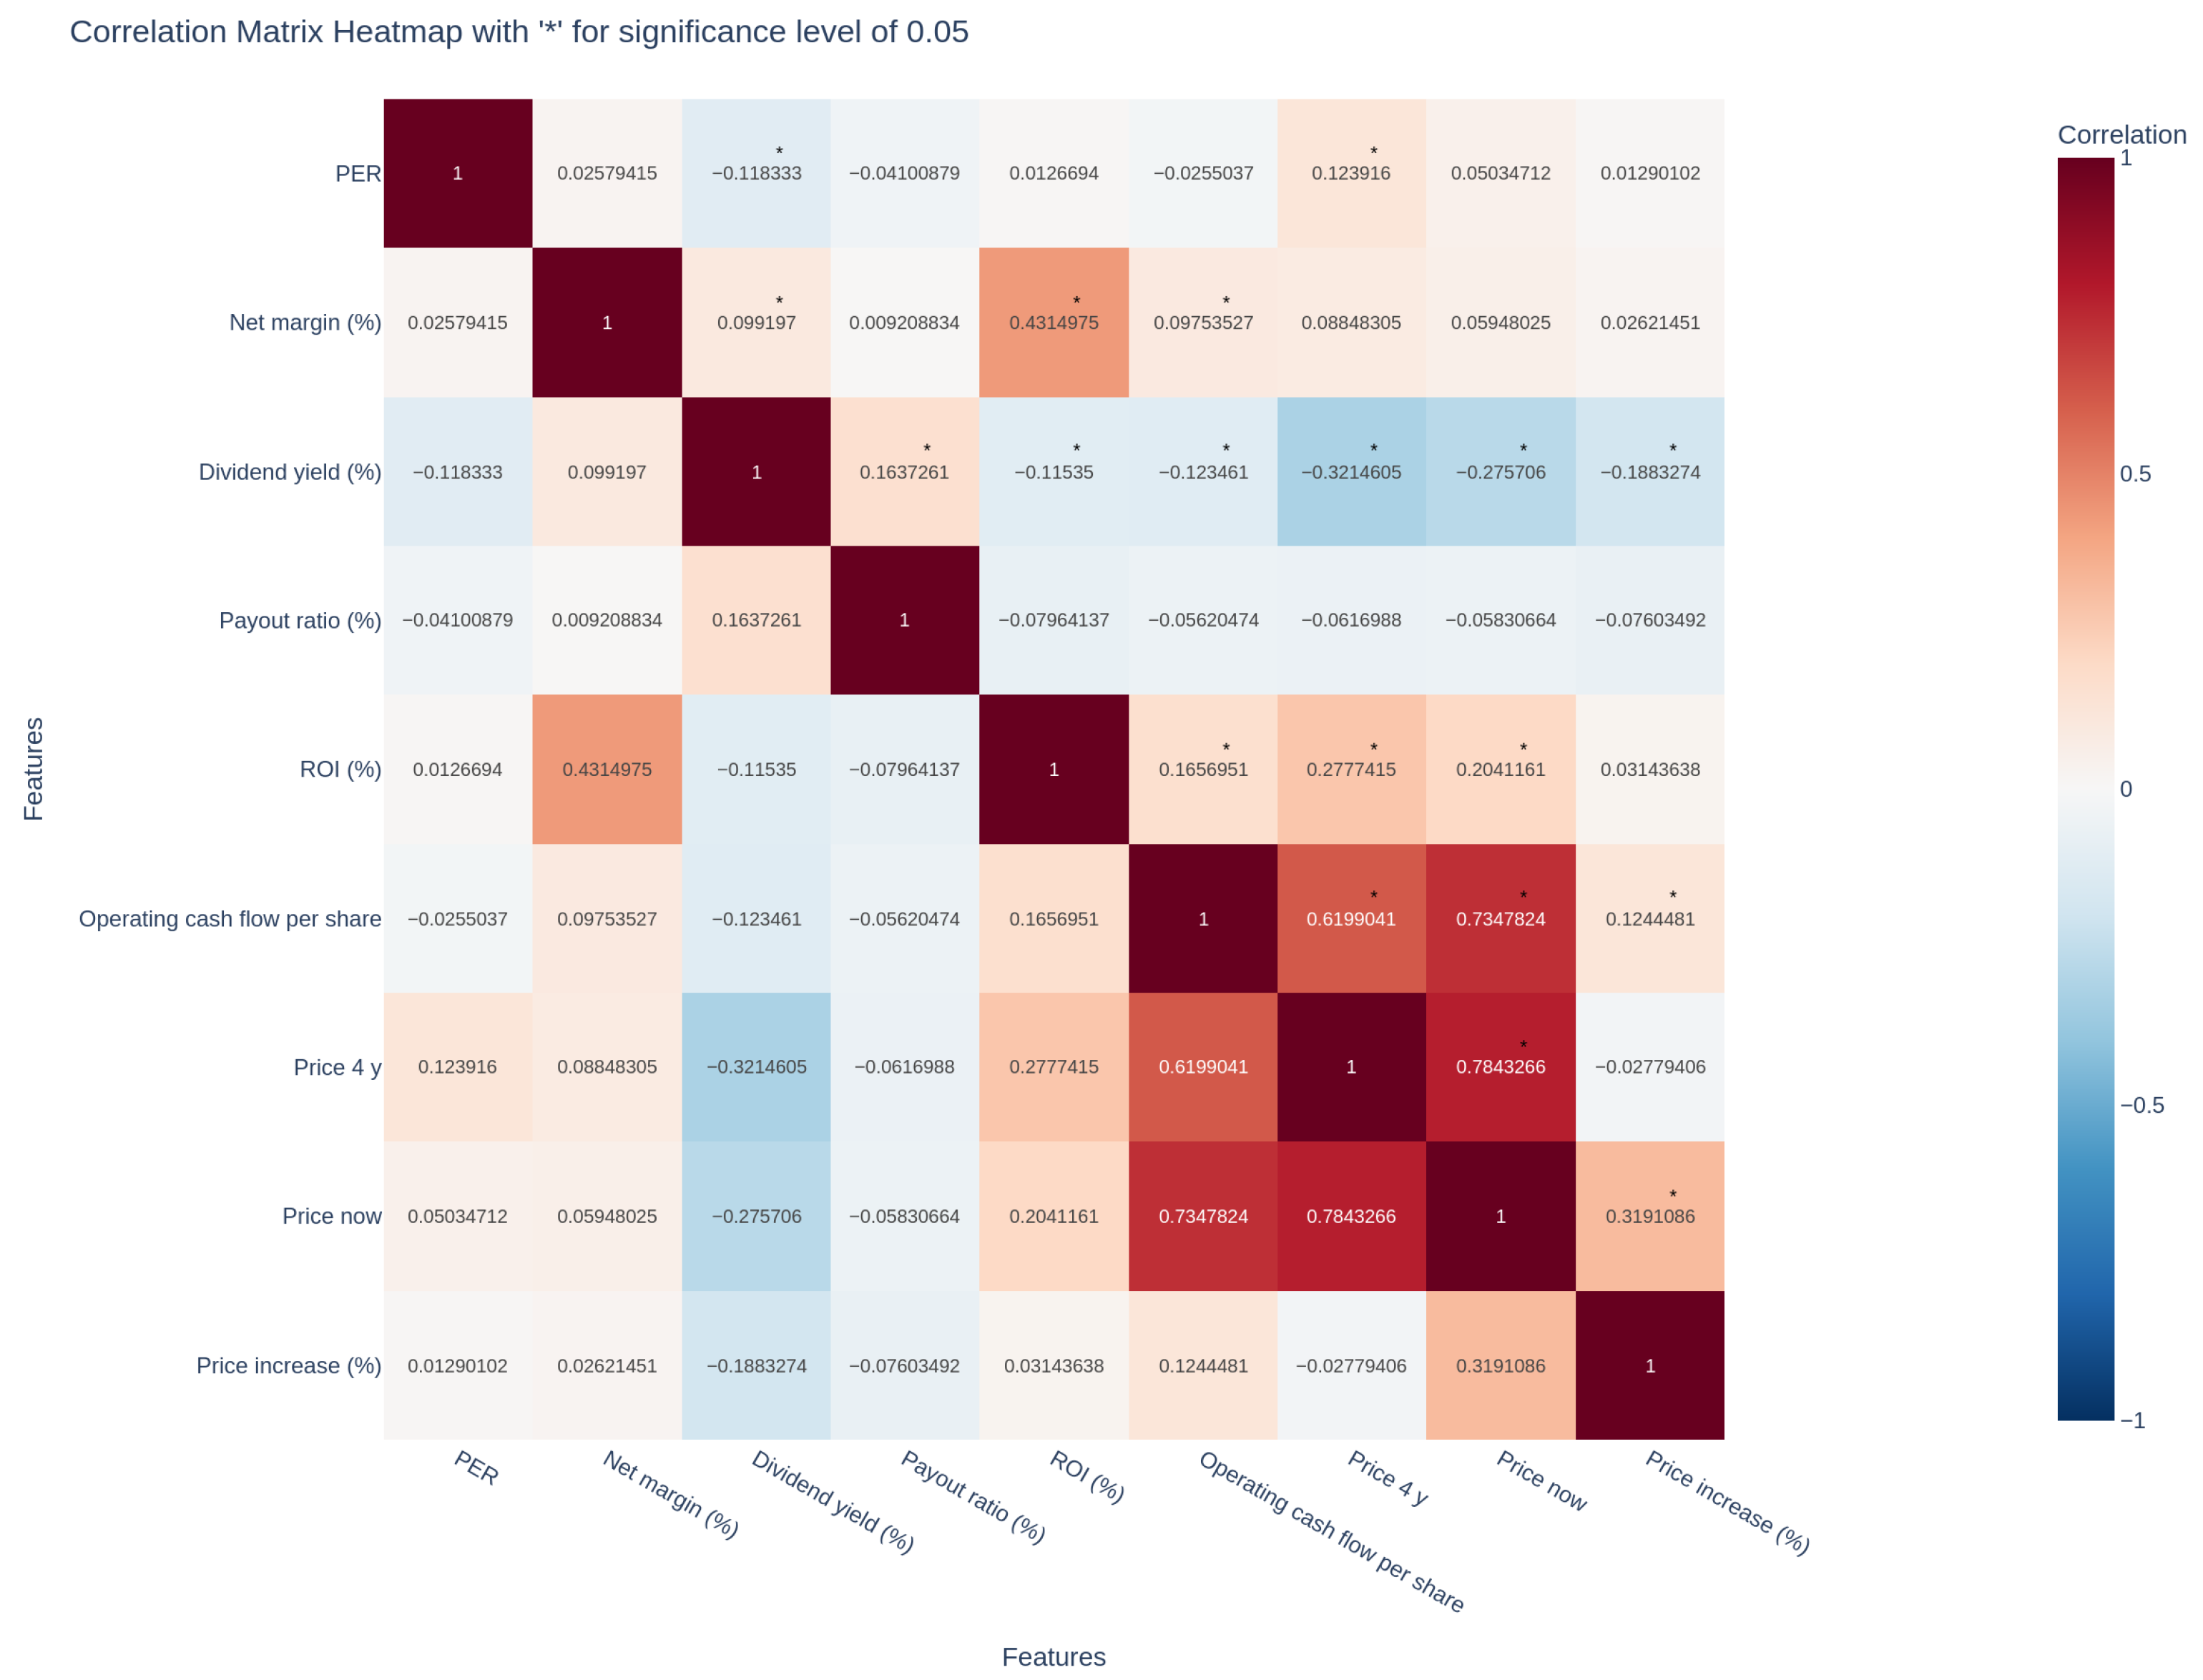
Moreover, this work also considered dividend yield, payout ratio, ROI, and operating cashflow per share as an expansion for considering the most relevant features.
Figure 4 shows the correlation among the different features. One can observe that PER was inversely slightly correlated with the dividend yield, showing that low PER is related to high “dividend yield”. This correlation is relatively low in absolute value, although any correlation is difficult to obtain in stock price predictions given the high levels of uncertainty in this domain. The NPM was significantly correlated with the “dividend yield”, “ROI”, and “operating cashflow”, so it provided different information from the PER. Price increase was significantly correlated with dividend yield (inversely), operating cashflow (directly), and price now (directly).
We created a feature selection mechanism from these variables. For this purpose, we applied a standard scalar to the input fundamental variables, and we then later applied a variance threshold selection mechanism. We observed that, with a threshold of 0.25, all six of the variables were selected, so we used all of them for our recommendations and explanations.
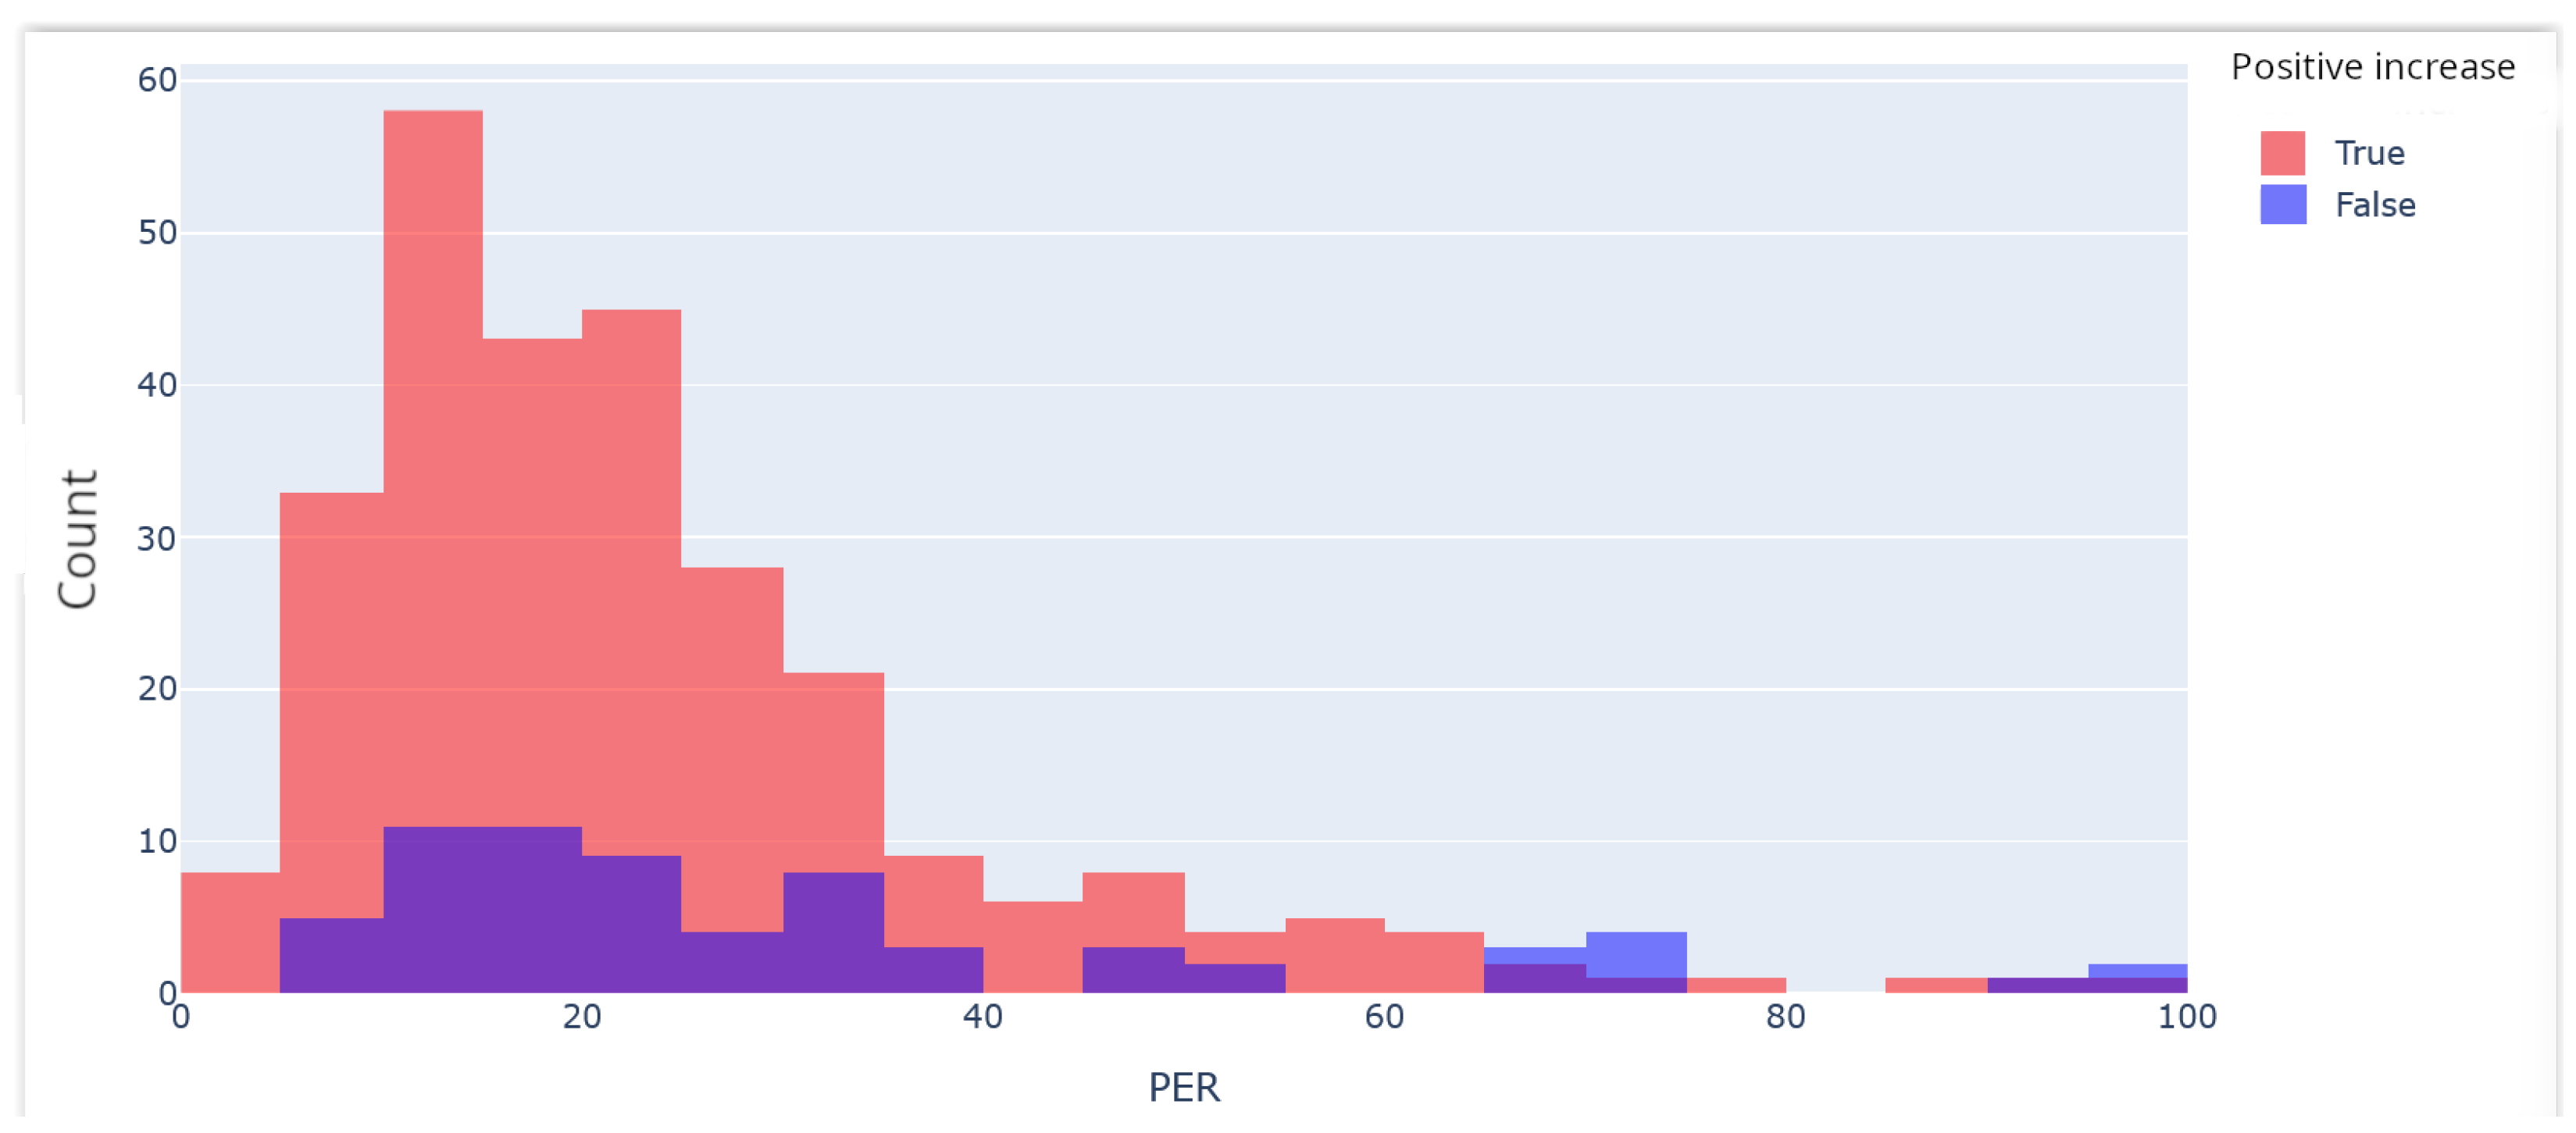
Figure 5 shows the distribution of companies when considering the PER, and it shows whether these had either positive or negative price increases over the next four years. Most companies had a PER between 10% and 40%.
Figure 6 shows the relative positive increase (red) in comparison to the amount of each interval. It was observed that the intervals with 100% of price increases over decreases (i.e., 0–5, 40–45, 75–80, and 85–90) had very few cases, so these did not seem to be relevant. In fact, intervals 70–75, 80–85, and 90–95 had the exact opposite result. Thus, it seems safer to invest in companies with a score from 0 to 29 than in other companies.
Firstly, we decided that the most appropriate feature normalization was to subtract the mean and divide the result by the standard deviation, but some stock values had so many different values that they altered the total results. The common way of proceeding would have been to consider these stock values as outliers and to keep them out of our analysis. However, these outliers included companies as prestigious as NVIDIA, who are recommended by many technical experts, so we decided to avoid leaving the outliers out. Therefore, our presented results use the original values without normalization for the aforementioned reasons.
Since negative PER and NPM revealed losses, and as we believed that recommending companies with losses is very risky and could hinder the trust of our users in our recommender system, we decided to filter out all of the possible recommendations with either a negative PER or negative NPM.
3.4. XAI System for Recommendation
DeepSeek is competing against ChatGPT in GAI. One of their advantages is that it is freely open, although its maturity is lower than ChatGPT given their duration in the market.
The proposed XAI system is based on enhancing the information about companies inside the investment portfolio recommendation. This information is enhanced using prompt engineering with DeepSeek. This task includes the implementation of the Python code of some prompts that were used in DeepSeek to provide meaningful descriptions.
Regarding prompt engineering, the system calculated the recommendations using a combination of XAI and prompt engineering. It was used for the following steps:
Providing a description of the company.
Indicating which financial data were used.
Described the most relevant factors taken into account based on SHAP outputs.
Note that the system first generates the following description:
This system provides investment recommendations based on a neural network system that has been trained with the information of the last four years of the financial balances of companies. This recommendation is intended for value investors, and, consequently, these recommendations are for long-term investments (e.g., around four years). More concretely, this system uses PER (price-to-earning ratio), NPM (net profit margin), dividend yield, ROI (return of investment), and operating cashflow per share. NPM is a financial metric that represents the percentage of a company’s revenue that remains as profit after all expenses, taxes, and costs have been deducted. Up to the date, there is no way to predict the value of stocks with certainty. The predicted price increases are only raw estimations based on ML techniques that should be regarded as simply uncertain indicators that show probable increases. The portfolios use the principle of diversification, in which picking up several stocks reduces the impact of the risk where a company decreases its price due to very particular circumstances.
Below, one can observe an example of a prompt used in DeepSeek for describing a financial ratio:
Describe in one sentence the meaning of “net margin” of a company
The system also introduces the reference index on which the portfolio is based as follows:
This system provides recommendations based on specific sectors since financial ratios are usually comparable in the same field. In particular, the following portfolio recommendation is based on the NASDAQ-100 index. The NASDAQ-100 is a market-capitalization-weighted index of the 100 largest non-financial companies listed on the NASDAQ stock exchange, primarily featuring technology and growth-oriented firms. The NASDAQ-100 is a market-capitalization-weighted index of the 100 largest non-financial companies listed on the NASDAQ stock exchange, primarily featuring technology and growth-oriented firms.
An example of a prompt when generating the introduction of an index:
Describe in one sentence the NASDAQ-100
In the particular case of indexes, we tested both ChatGPT and DeepSeek, and, in this specific index, we used the ChatGPT description. The approach used human supervision since it can be selected before users use the system, and it remains the same for each particular index.
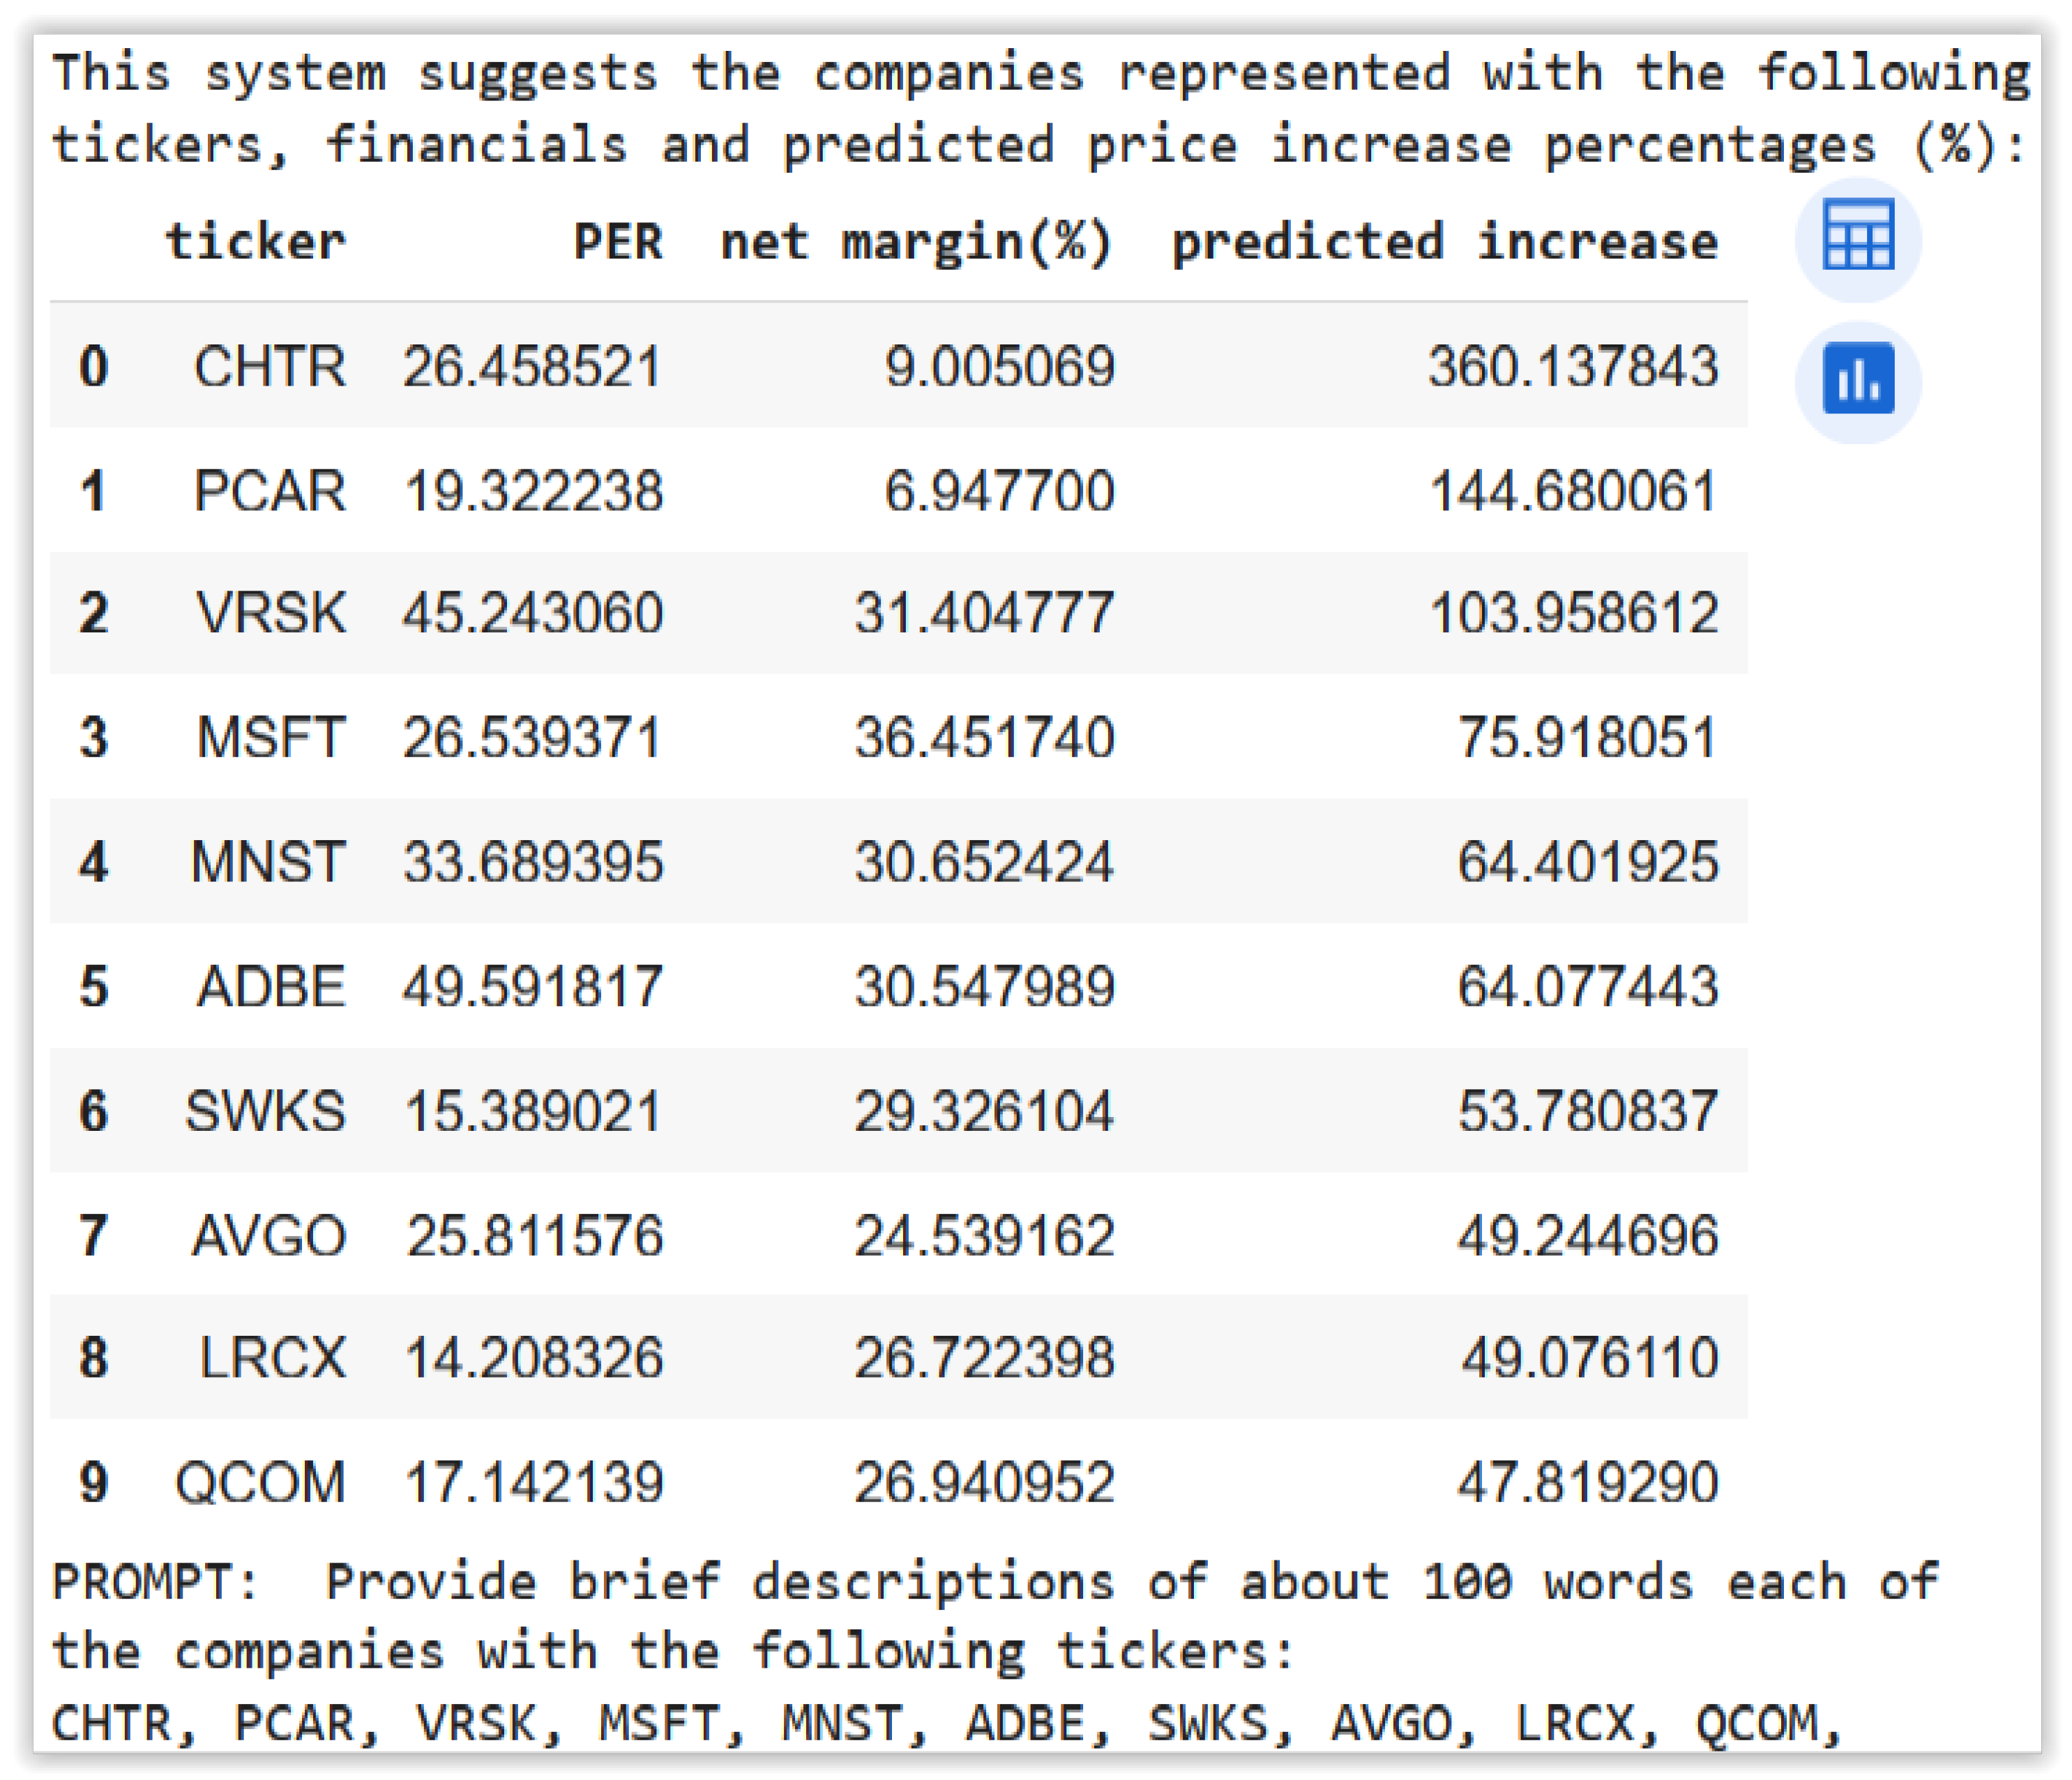
Figure 7 shows the recommended investment portfolio by the system. It provides the ticker as each stock-valued identifier. For example, “CHTR” is the ticker of “Charter Communications, Inc.” company. It also presents the fundamental financial information of the PER and NPM used for performing the estimations. Finally, it presents the predicted increase percentages over 4 years, which are most likely different from the actual price increases but which help conform a portfolio with a high profitability on average.
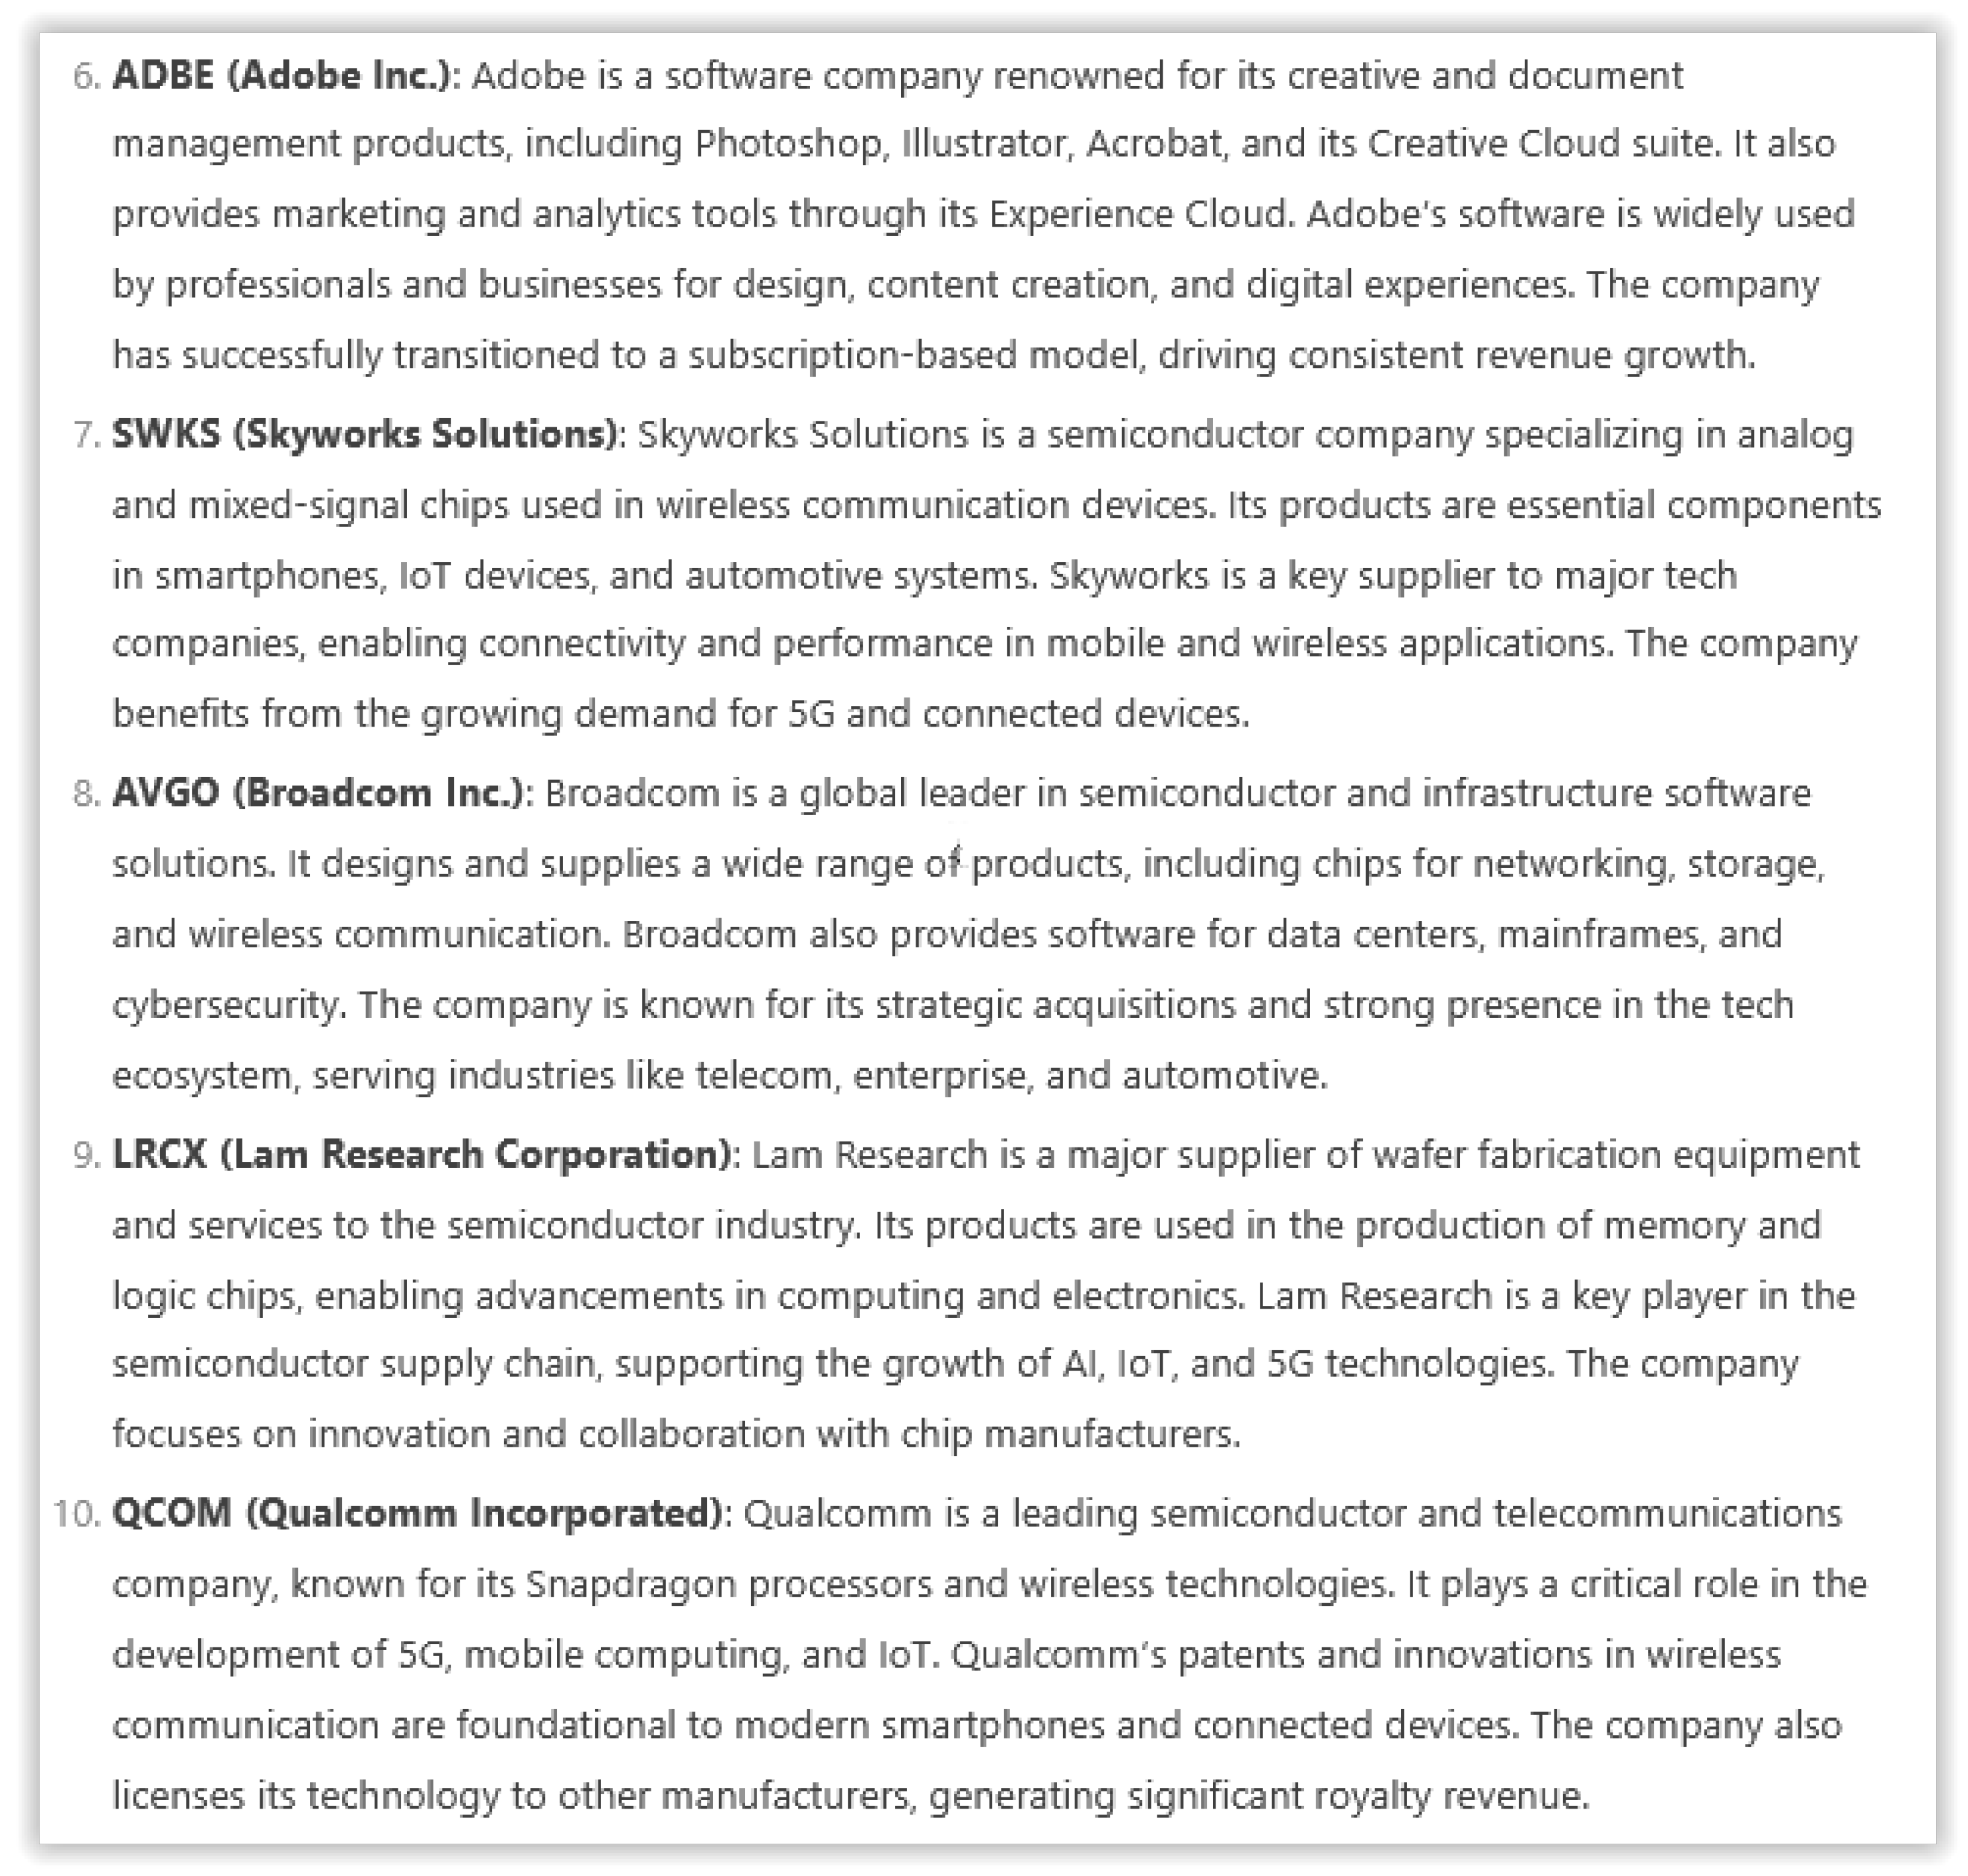
Figure 8 and
Figure 9 present the description of the most relevant information of the companies of the proposed investment portfolio, and these were generated utilizing GAI through DeepSeek with the prompt generated by our system for the given portfolio.
To complete the explanation, our system provides an explanation according to SHAP values of the given index used as a reference for the fundamental financial features in the trained ML model. It is worth mentioning that obtaining a global SHAP chart is especially useful in linear ML models with feature independence, but, in other cases such as neural networks, its usefulness is arguable, and many researchers would find it useless for not fulfilling the basic assumptions of SHAP. However, a recent work [
18] has shown that SHAP information can be useful in neural networks. In particular, its authors proved how they used SHAP interpretations to effectively select features when applying deep learning, specifically in convolutional neural networks (CNNs). Being aware of the known limitations of applying SHAP to ML models with dependent features [
19],
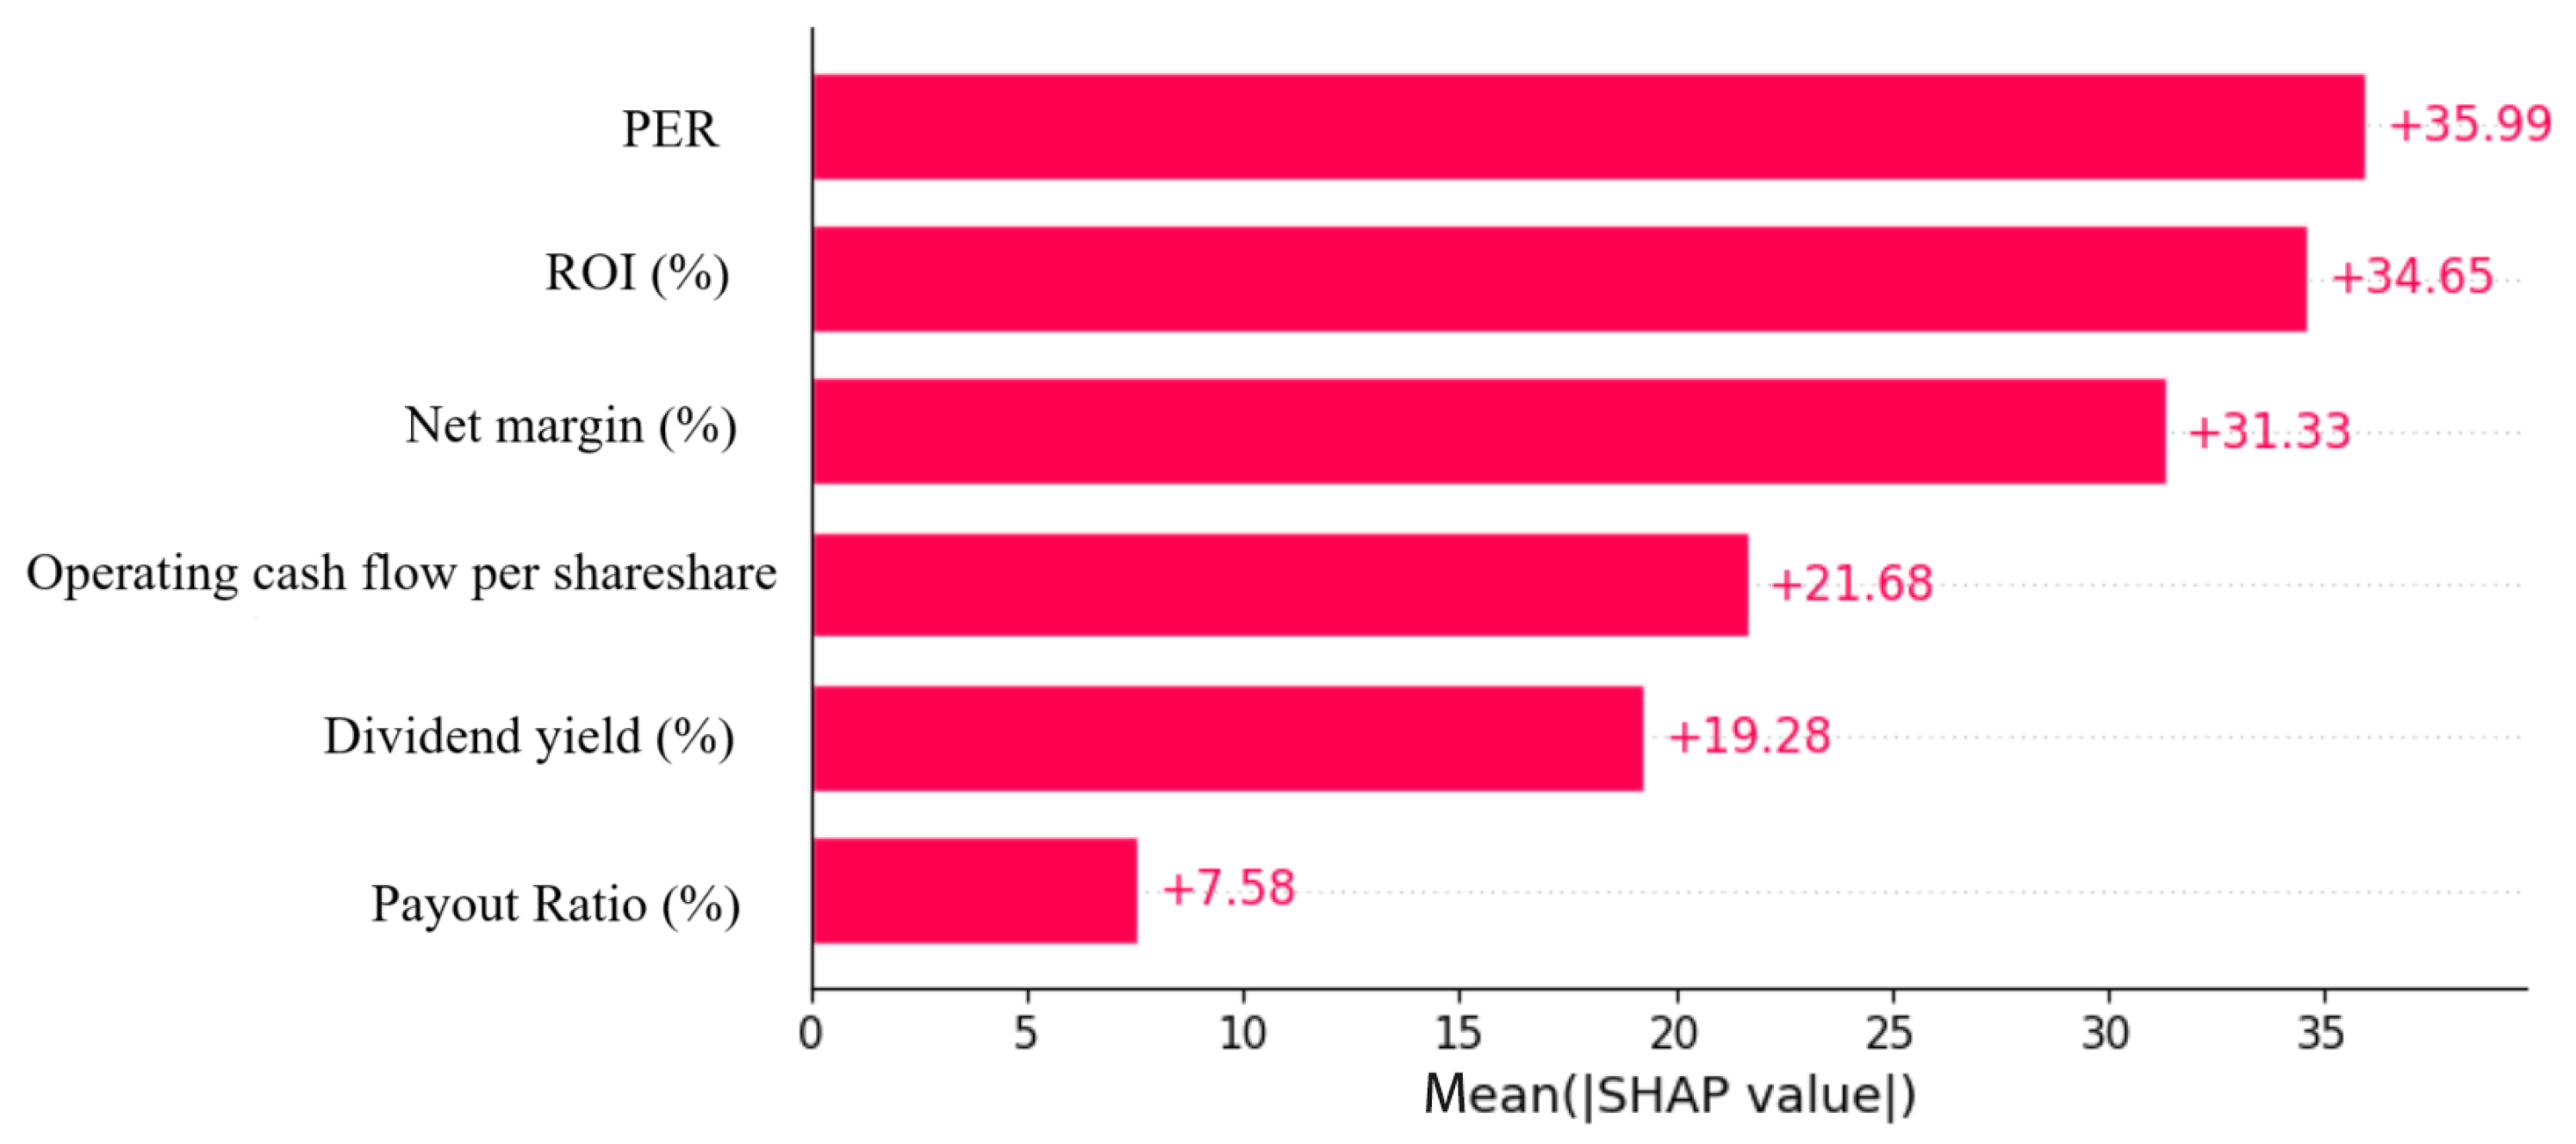
Figure 10 shows the SHAP explanation for the globally trained MLP regressor model when using 70% of the S&P-500 for training. One can observe that, in the general system, the NPM, ROI, and PER are probably having (in that particular order) high influences on the predicted system.
The proposed system also provides an explanation for each recommendation, as one can observe in the explanation SHAP bar plot for the Apple company shown in
Figure 11. This example shows that a specific case may have a completely different influence from the general model. More concretely, in the particular case of Apple, its dividend yield was found to be the most influential aspect.
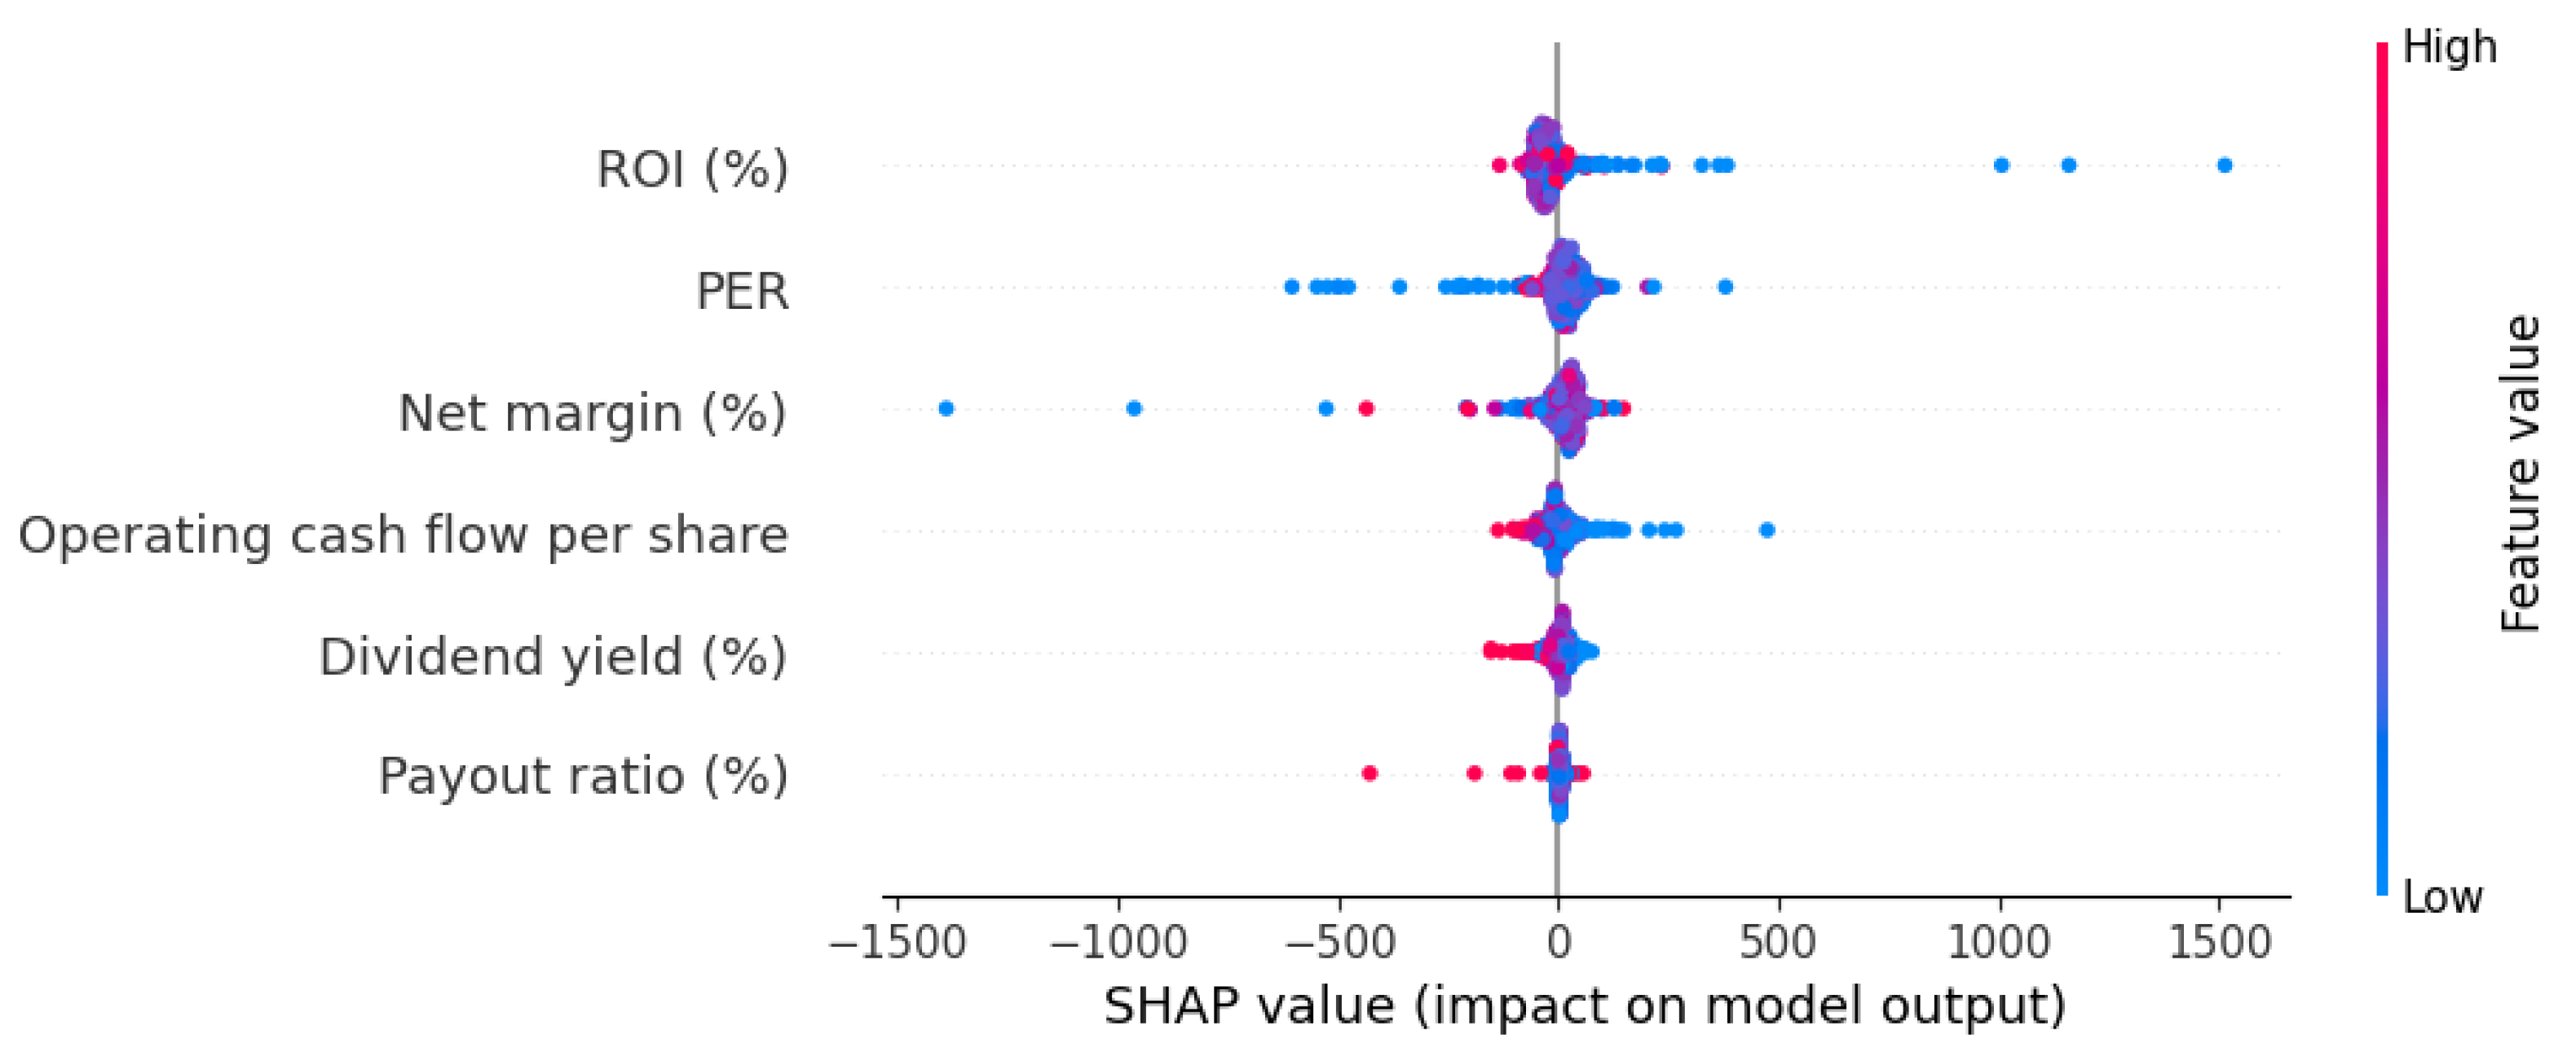
The system also provides a distribution of local explanations with a SHAP Beeswarm plot, as one can observe, as an example, for the same MLP regressor model on the S&P-500 in
Figure 12. This plot is useful to see the distribution of individual influences and the relation with the value of each feature. Generally, positive net margins contribute to high SHAP influence values. In the case of the PER feature, low positive values make high SHAP values, but high PER values can also have either a positive or negative impact. In the years shown, for instance, technological companies had high PER values, and, even though they obtained high price increases, medium and low dividend yields are usually related to positive price increases.
We also applied a LIME technique with the LIME Tabular Explainer in Python 3.11
Figure 13 shows the result of the explanation of a particular prediction about the feature importance of PER (Feature 0), NPM (Feature 1), dividend yield (Feature 2), ROI (Feature 3), payout ratio (Feature 4), and operating cashflow per share (Feature 5), respectively. One can observe that this LIME chart explains similar facts to the previously presented individual SHAP explanation, such as the negative impact of NPM. Providing both LIME and SHAP explanations can help users to cross-validate findings.
3.5. Cybersecurity and Encryption on the Recommender Website
Recommender systems based on AI in the financial domain, especially those accessible through web platforms, require a comprehensive strategy to ensure security, user trust, and proper risk management. The exposure to external threats, the sensitivity of the data, and the system’s potential to influence economic decisions make a robust, ethical, and traceable approach essential. This section presents cybersecurity methodology for making this system safe.
This methodology proposes using advanced encryption mechanisms for the web interface of the system. The cybersecurity in this kind of system is important to avoid potential hackers trying to alter the recommendations to influence the market to their own benefit. Firstly, common website attacks are recommended to be controlled by sanitizing the inputs. Secondly, the website server needs to be secure, so either a commercial web server with proper security is used or the website has common cybersecurity mechanisms.
This methodology includes a model proposal for risk, security, and trust analysis. We propose an advanced model for risk, security, and trust management that is specifically tailored to a system that utilizes DeepSeek for long-term investment recommendations based on financial fundamentals, such as PER and NPM. This proposal is grounded in the AI TRiSM framework, which offers a comprehensive methodology to address the challenges in AI systems. AI TRiSM emphasizes transparency, accountability, fairness, reliability, and compliance with ethical standards, making it a strong foundation for ensuring trust and security in financial AI applications combined with XAI.
Our proposed model is designed to address vulnerabilities specific to systems like DeepSeek by creating a robust and transparent environment. In terms of risk management, we recommend adversarial perturbation tests to evaluate the resilience of the DeepSeek model when data inputs are manipulated. This ensures that key financial indicators, such as PER and NPM, remain dependable predictors, even under adversarial conditions. Similarly, black box testing can simulate external manipulations in historical data or APIs, helping the system detect and manage unreliable data without requiring direct access to its internal structure. White box testing is proposed to examine and reinforce the gradients within DeepSeek, preventing potential vulnerabilities from being exploited. We also suggest simulating failures in historical financial data intentionally to analyze how the system identifies and rectifies anomalies, thus ensuring high data quality standards. Furthermore, sandbox environments are recommended to simulate real attack scenarios, such as API disruptions, and to validate the system stability during high-stress conditions. Finally, resilience validation procedures are critical to ensuring that the system can recover swiftly after adversarial events, thus preserving security and performance integrity.
For security management, we propose measures to safeguard the system from unauthorized access by employing multi-factor authentication (MFA) and encrypting sensitive data during storage and transmission. Adversarial training is integrated into the system development to prepare DeepSeek for secure operation under adverse conditions. Additionally, ongoing audits are recommended to uphold compliance with international regulations, such as GDPR, ensuring the system adheres to ethical and legal standards. This can be supported by recent studies on privacy-preserving AI, such as in distributed matrix computations [
20], where minimizing information leakage is fundamental to adversarial resilience. This methodology proposes the use of homomorphic encryption that enables computations on encrypted data without decrypting it. In particular, this encryption is especially useful if federated learning is used to apply the ML model, as shown in [
21]. To guarantee that the executing code is actually the one proposed by the authors, we propose to authenticate the code through our approach based on the principles of the blockchain [
22].
Trust management plays a vital role in our proposal. Interactive dashboards are suggested to provide clear and comprehensive explanations of how DeepSeek utilizes financial indicators in its decision-making process. This transparency fosters user trust by making complex AI-driven recommendations understandable. Accountability is supported by maintaining detailed records of all decisions made by DeepSeek, which would facilitate audits and reinforce ethical oversight. Real-time dashboards are recommended to allow users to visualize the impact of data on recommendations, promoting user understanding while enhancing system transparency.
Continuous monitoring is fundamental to our proposed model. Advanced platforms such as Datadog or Splunk are recommended to track data inputs, system metrics, and anomalies in real time. Key Risk Indicators (KRIs) are established to automatically alert to unusual changes in metrics, like PER, NPM, ROI, dividend yield, and operating cashflow, thereby ensuring the prompt identification of critical risks. Predictive analysis tools, including algorithms like Isolation Forest, would detect anomalies and classify risks based on severity, facilitating proactive interventions. Enhanced dashboards could visualize historical trends, current metrics, and alert statuses, providing comprehensive oversight of DeepSeek’s operation. Finally, regular audits are proposed to ensure compliance with quality and security standards, aligning with AI TRiSM’s principles of continuous evaluation and improvement.
This proposed model addresses vulnerabilities specific to AI systems in finance while integrating ethical governance to ensure responsible deployment. By leveraging the AI TRiSM framework and incorporating XAI principles, DeepSeek would operate transparently and reliably, mitigating risks while fostering user trust and ethical compliance. These recommendations position DeepSeek as a dependable solution for long-term investment decision making as it has achieved the highest standards in AI-driven financial systems.
Table 1 summarizes the key elements of the proposed model, emphasizing its alignment with AI TRiSM principles and its application within DeepSeek and XAI frameworks for optimal security, trust, and risk management.
4. Evaluation Method
This work was evaluated both in a computerized way based on statistical analyses and GAI and with a user study involving participants.
The computerized evaluation of this work involved both the portfolio prediction and the explanations provided by GAI tools.
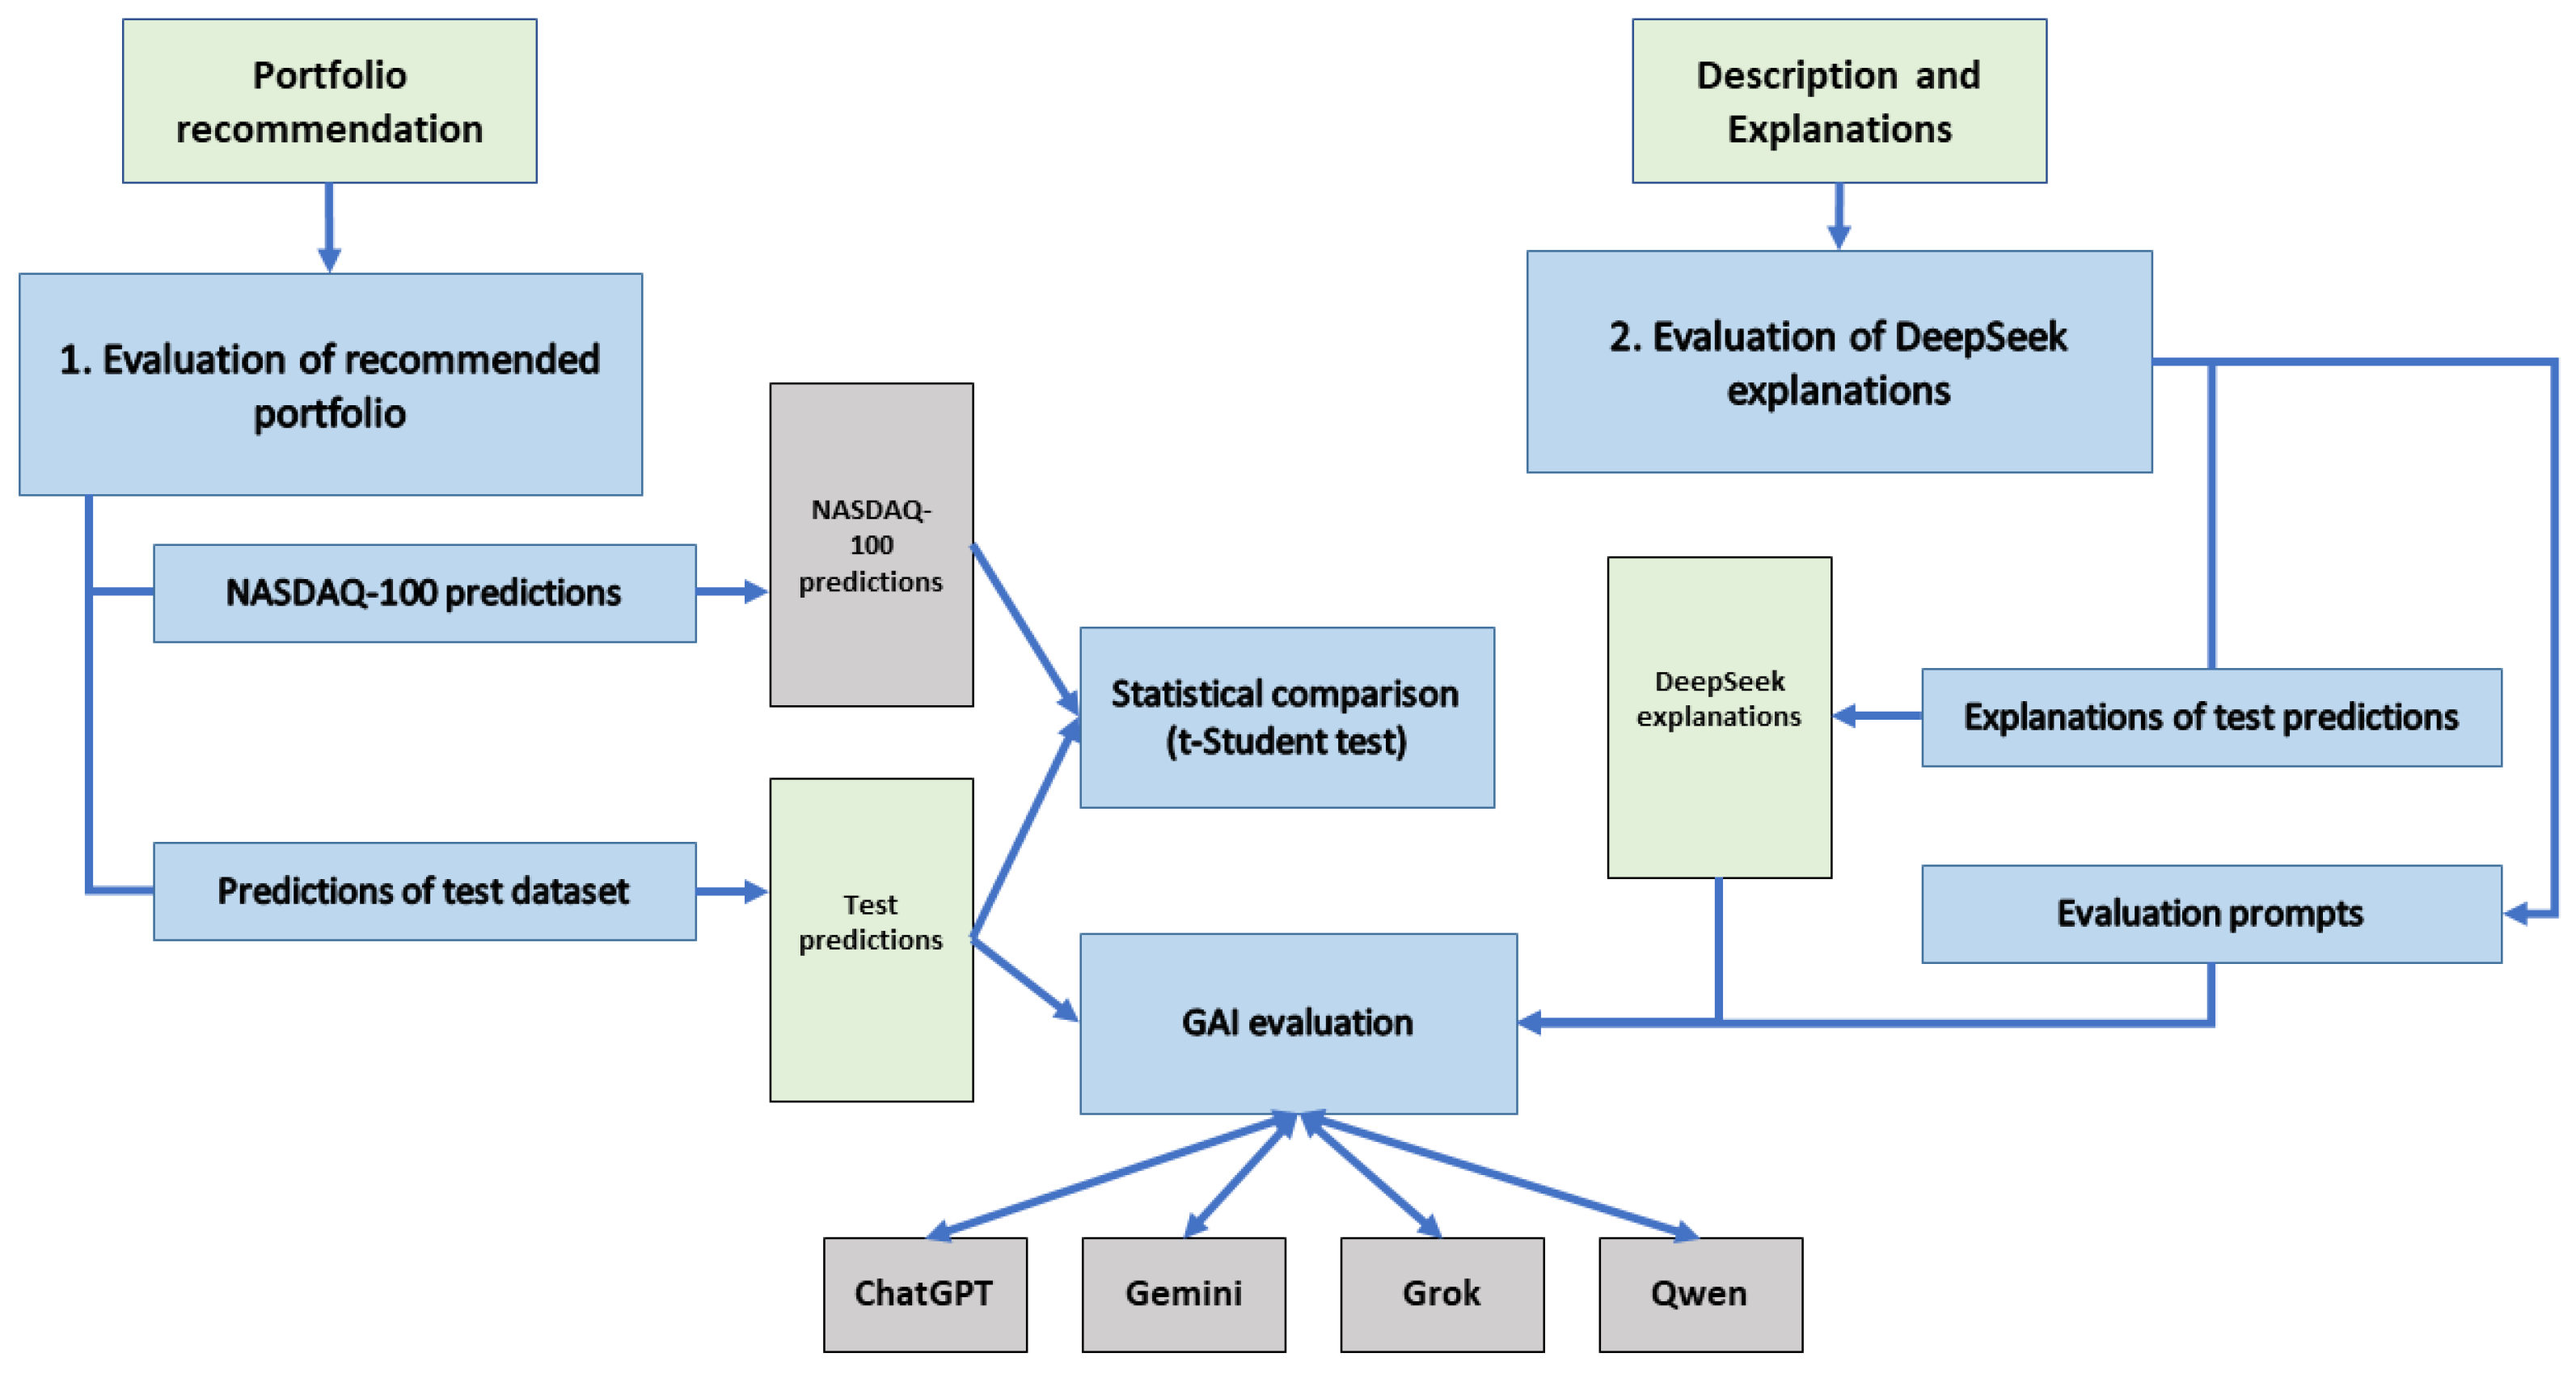
Figure 14 outlines the processes of two distinct evaluations: (1) the evaluation of the recommended portfolio, and (2) the evaluation of explanations generated by DeepSeek.
For the evaluation of the recommended portfolio, our model generates predictions using the test dataset. These predictions are subsequently assessed through two methods: statistical comparison and GAI evaluation. In the statistical comparison, the portfolio prediction was compared to the NASDAQ-100 prediction, and a Student t-test was then conducted to determine whether the differences between them were statistically significant. Additionally, the predictions were evaluated using other GAI tools, including ChatGPT, Gemini, Grok, and Qwen, in a process referred to as GAI evaluation.
For the evaluation of the explanations, which are depicted in DeepSeek explanations, they were assessed by other GAI tools using evaluation prompts specifically designed through prompt engineering. The evaluation score provided by each GAI tool is based on two factors: the quality of the recommended portfolio (evaluation of recommended portfolio), and the quality of the explanations.
In order to ensure the consistency in the evaluation results from different GAI tools, we used the exact same prompt for all GAI tools in the evaluation.
We constructed this prompt based on the two aforementioned factors about the portfolio and its explanations. In this prompt, we also explicitly included the range of the scores so that the evaluations were unified in scale across the different GAI tools. The constructed prompt for evaluation was literally the following one:
“Please, evaluate from 0 to 100 each of the following aspects of the following recommended portfolio: (1) Quality of the portfolio, and (2) Explanation of the portfolio”
Furthermore, we also performed similar comparisons with the S&P 500 in a completely different scenario (7 April 2025), in which there was an international world-wide crisis due to the custom duties for regulating foreign trade.
For the user study, we presented our created system to volunteering participants, and we then surveyed them about the most relevant aspects of our presented system.
Section 5.3 describes the sample of participants, introduces the research questions of the survey, and discusses the results.
5. Results
In this section, we explain the main results of applying the proposed methodology and the evaluation method when considering the NASDAQ-100 and S&P 500 indexes. In the first step, we obtained the generated dataset, which is composed of eight attributes (PER, NPM, dividend yield, ROI, operating cashflow per share, price 4 years ago, current price, and price increase) and 600 instances.
In Step 2, we preprocessed the dataset, dividing it into X and Y. Then, we preprocessed X, obtaining the following descriptive statistics for the PER (mean = 67.61, std = 189.50, max = 1236.83, and min = −157.59) and NPM (mean = 10.985, std = 40.947, max = 63.717, and min = −313.50). These results indicate that the scales of PER and NPM were not similar; as such, it was necessary to normalize the dataset. Then, we split the dataset into training (50%) and test (50%) datasets. As a result, the size was 300 and 300 for the training dataset and test dataset, respectively. Then, the MLP hyperparameters (the number of neurons of the first and second layers) were tested using a k-fold cross-validation strategy.
The experiments used k = 4. As a result, the distribution of 150 neurons for the first layer and 150 for the second layer seemed to be an optimal neural network configuration. We tested the optimizers limited-memory Broyden–Fletcher–Goldfarb–Shanno (L-BFGS), adaptive moment estimation (ADAM), and stochastic gradient descent (SGD) with a learning rate of 0.0001 and a ReLU activation function. Our results indicated that the L-BFGS optimizer obtained better results than ADAM and SGD. Next, we generated an MLP model using an L-BFGS optimizer with a learning rate of 0.0001 and a ReLu activation function, and we then trained this model with the training dataset.
We applied a cross-validation of four random balanced splits following these criteria. Since the input data size was small, MLP was an appropriate choice for this kind of data, as recommended in the literature [
23].
In Step 3, our system provided explanations of the obtained investment portfolio when using the DeepSeek tool and the following prompt.
Provide brief descriptions of about 100 words for each of the companies with the following tickers: CHTR, PCAR, VRSK, MSFT, MNST, ADBE, SWKS, AVGO, LRCX, QCOM.
For example,
Figure 8 shows the explanations offered by the DeepSeek tool for the first five companies in the recommended portfolio. For instance, DeepSeek informed that “Charter Communications is a leading broadband connectivity and cable operator in the U.S.” This information enhances the feasibility of the investment portfolio recommendation provided by our system.
Following our evaluation method, we compared the effectiveness of the recommendations of our approach and the DeepSeek baseline. For example,
Figure 15 shows the profitability of the proposed system for the recommendations of a 10-stock portfolio. In this particular case, one can observe the profitability of the proposed system of 110.02% over four years compared to the NASDAQ profitability of 50.71% in the same period.
It is worth mentioning that the NASDAQ-100 mainly includes technological and growth companies, but it also utilizes different subfields, and each subfield may have been identified by the PER and NPM. This might be the reason why most companies in the proposed portfolio might be from the technological, semiconductors, software, or telecommunication fields. Additionally, the proposed portfolio includes sectors beyond technology, such as trucks and beverages. This inclusion provides a degree of diversification, particularly given the NASDAQ-100’s primary focus on technology stocks.
Moreover,
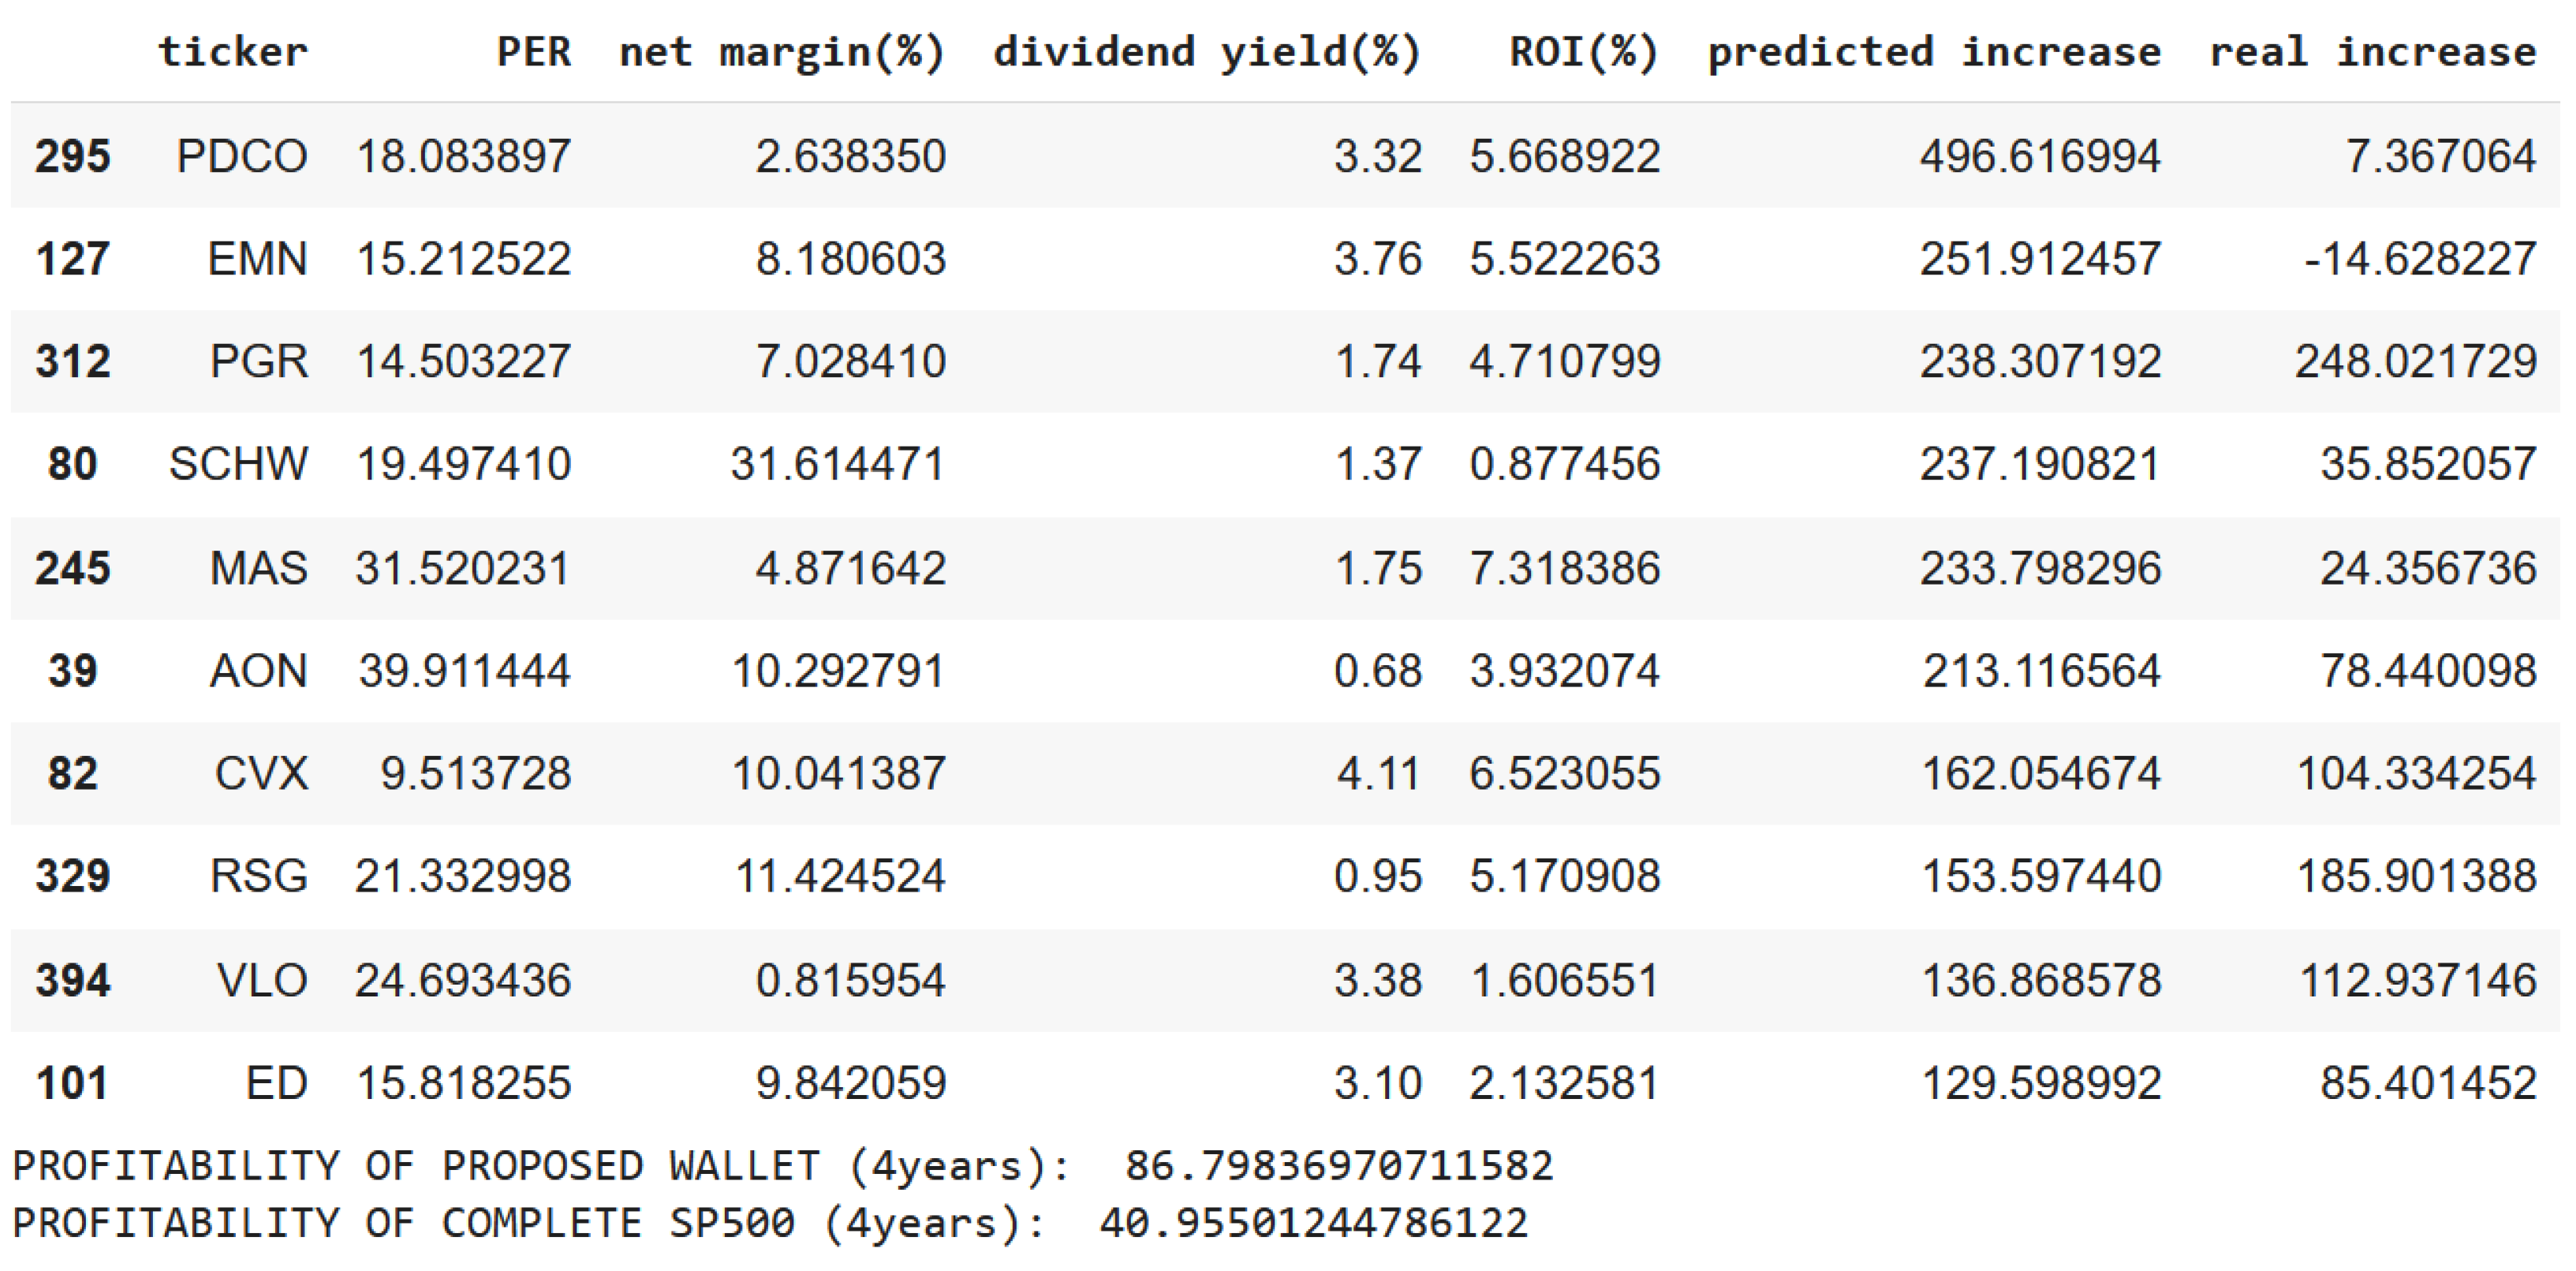
Figure 16 presents an example of portfolio recommendation with the S&P-500. In this particular portfolio, the profitability was 45.32% compared to the 40.96% of the reference index.
The next subsections provide the statistical analysis of the profitability of the proposed investment portfolio recommendations and evaluations of our system explanations, which were partially generated by DeepSeek.
5.1. Statistical Analysis About the Profitability of the Proposed Stock Investment Recommendations over the Passive Index Investment
When investing, it is important to conduct a statistical analysis on the results. This ensures that any improvements are not due to chance and that the proposed portfolio recommendations offer a statistically significant improvement over the index.
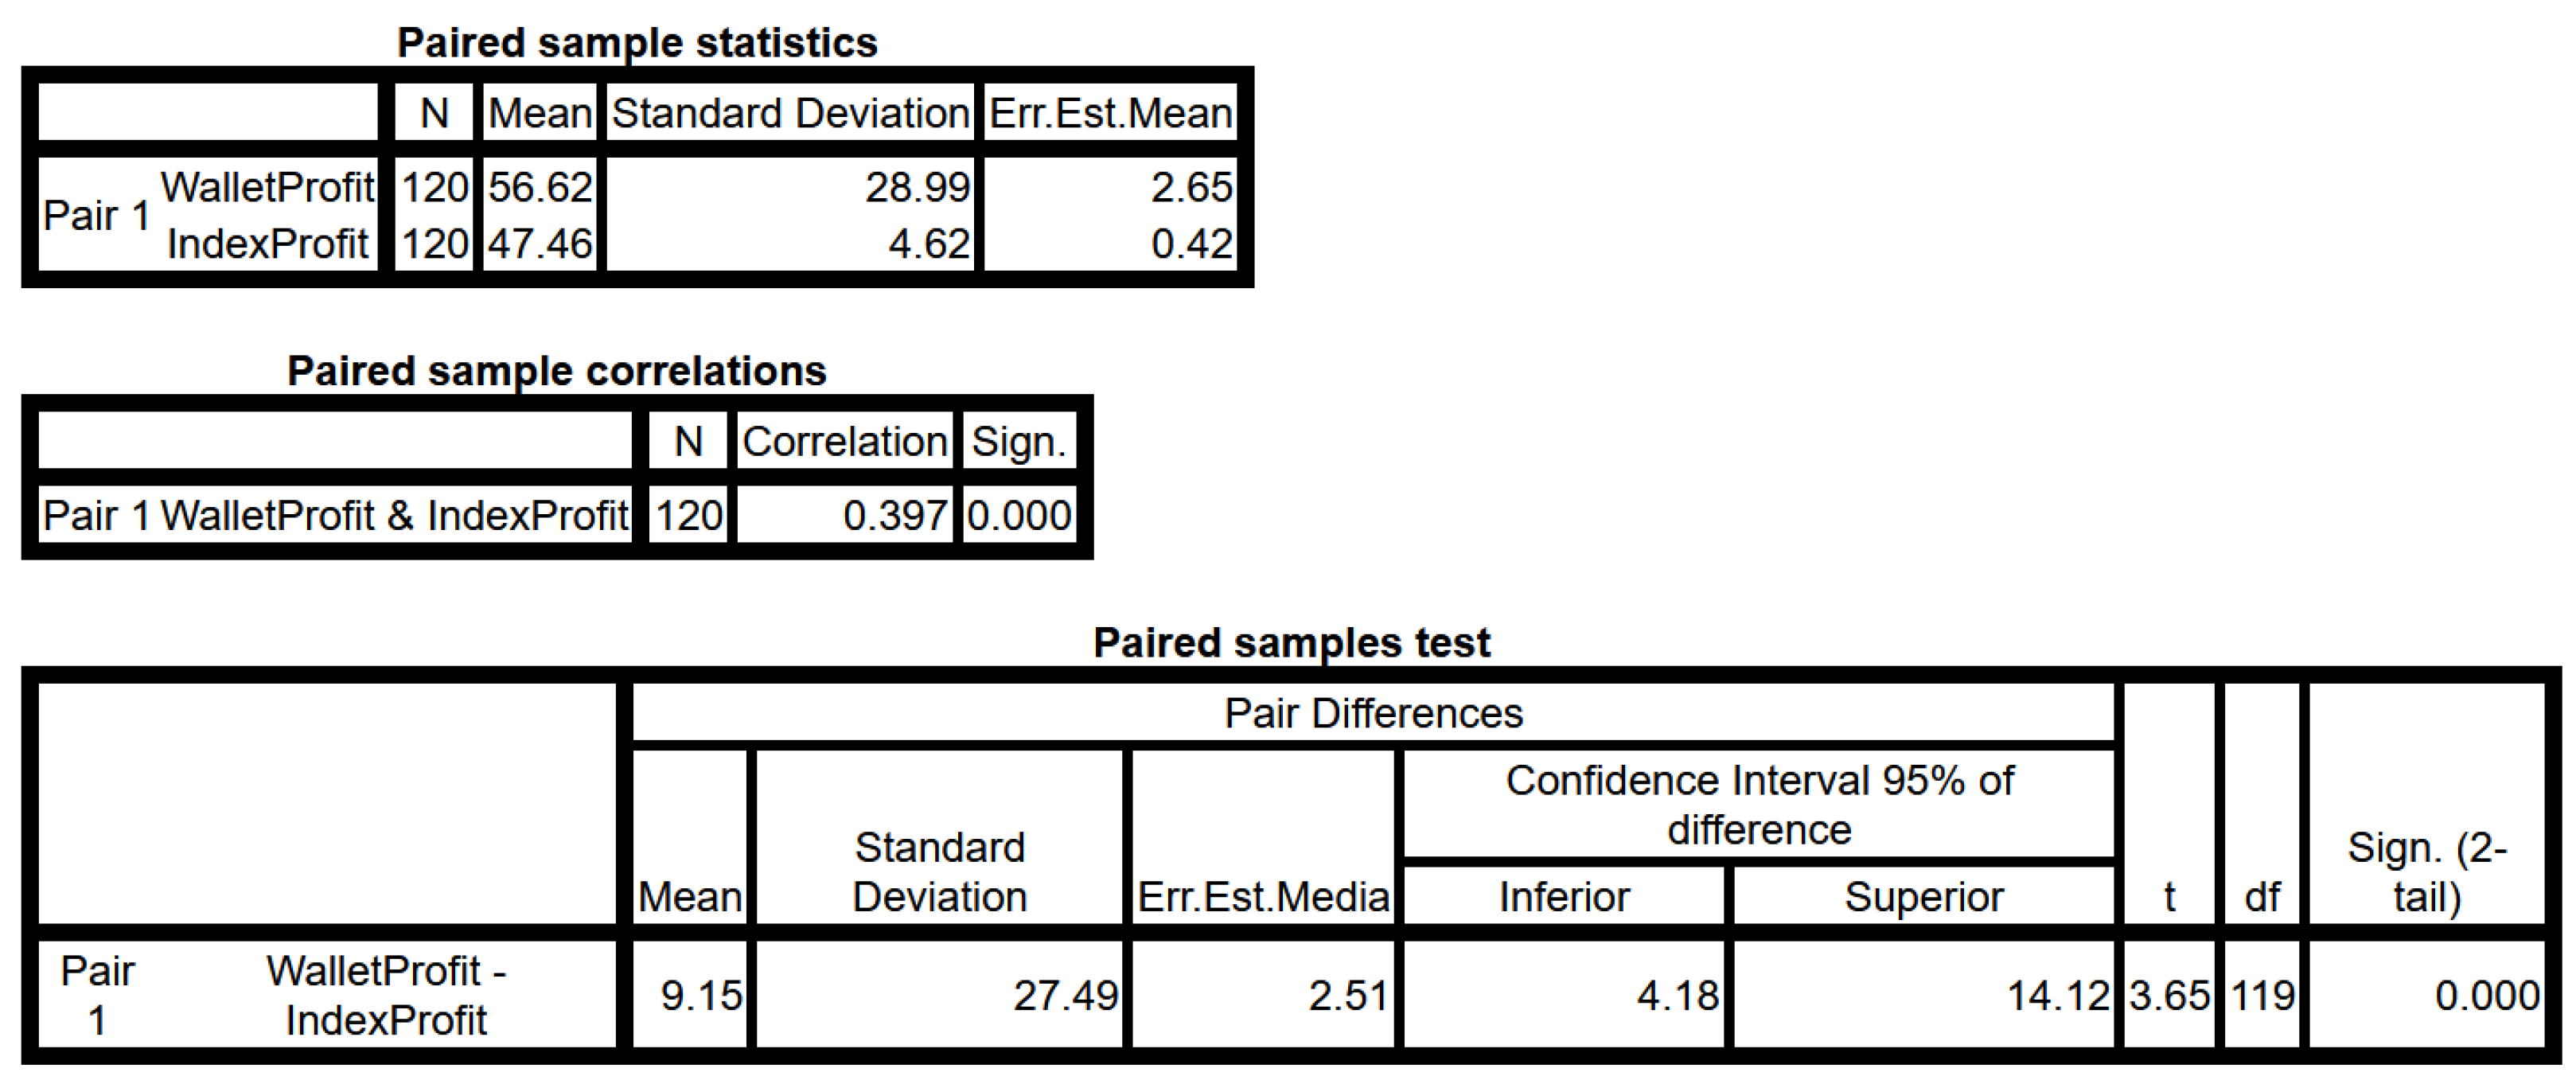
We generated portfolios by splitting them into training and test datasets in four different random divisions. For each possible split, we generated 20 different sizes (comprising portfolios from 8 to 27 companies). In this way, we had 120 different proposed portfolios. We compared the profitability of these portfolios with the profitabilities of the reference indexes NASDAQ-100 and S&P-500. We also compared the results using t-Student for the paired groups, as these portfolios were in the same four-year period. Both groups were in the same period of years, so the macroeconomic aspects were the same in both the control group (reference index) and the experimental group (proposed portfolio).
Figure 17 shows the results of the t-Student test. One can observe that the average profitability was greater than the reference index within four years, achieving 56.62% of profits on average rather than 47.46%, which was the average of the companies in the reference indexes. The results were statistically significant, with a significance of 0.000 in total and a two-tail significance of also 0.000. Therefore, we concluded that there are statistically significant differences between the recommendation portfolio profit and the reference–index profit.
5.2. Evaluation of the Explanations of Proposed Portfolios
To assess the usefulness of the portfolio proposed in
Section 5, we asked the following prompt for GAI tools, which are different from the one used for generating company descriptions:
Please evaluate from 0 to 100 each of the following aspects of the following recommended portfolio: (1) Quality of the portfolio, and (2) Explanation of the portfolio
The ChatGPT (model used: ChatGPT-40) evaluation showed the strengths and weaknesses of the proposed portfolio, providing a high score in both dimensions: 85 and 90, respectively. The Grok (model used: Grok3) evaluation also showed the strengths and weaknesses, but it provided scores below the ChatGPT scores: 75 and 65. In the same vein was the evaluation provided by Qwen (model used: Qwen2.5-Max). It showed the strengths and weaknesses of the proposed portfolio but it provided scores below ChatGPT: 60 and 65. Nevertheless, the Gemini (model used: Gemini 2.0 Flash Thinking Experimental) evaluation was different than the previous ones. Its evaluation is based on different aspects, such as diversification, risk, and target investors, for the quality dimension. Gemini evaluated the explanation dimension in the following aspects: clarity and simplicity, logical rationale, transparency, and context. The Gemini scores were 58 and 45. Taking into account the four evaluations provided by the GAI tools, the average score was 69.5 and 66.25, respectively. As an example, the ChatGPT evaluation is shown below.
5.2.1. Quality of the Portfolio (Score: 85/100)
Strengths: The portfolio consists of well-established companies across various industries, including technology (MSFT, ADBE, AVGO, QCOM, SWKS, and LRCX), telecommunications (CHTR), automotive (PCAR), analytics (VRSK), and consumer goods (MNST). Many of these companies have strong financials, high profit margins, and solid market positions.
Diversification: While the portfolio was diversified across different sectors, it leaned heavily toward tech and semiconductors, which could expose it to sector-specific risks.
Valuation and Growth Potential: The predicted price increases seemed ambitious, especially for CHTR (+360%), but the presence of profitable and innovative companies added credibility to the selections.
5.2.2. Explanation of the Portfolio (Score: 90/100)
Company Descriptions: The explanations for each company were clear, concise, and informative, giving a strong overview of their business models and market relevance.
Financial Data: The inclusion of P/E ratios, net margins, and predicted price increases added a quantitative dimension, although more context on how these metrics were derived would be helpful.
Suggested Improvement: It would be beneficial to provide the reasoning behind the selections, such as the industry trends, competitive advantages, or specific catalysts driving the predicted price increases.
As the last step, we evaluated a human expert portfolio recommendation with an explanation as the baseline. On 17 April 2025, we searched on Google with the keywords “portfolio recommendation with explanation”. We explored the results of Google following the ranking order of the first web page, and the first entry that actually contained investment portfolio examples with explanations was the White Coat Investor website (
https://www.whitecoatinvestor.com/150-portfolios-better-than-yours/ (last accessed on 17 April 2025)). From the given recommendation examples of this website, we picked a diversified portfolio with a reasonable explanation (this recommended portfolio was referred to as Portfolio 26 on this website). We evaluated this portfolio with the exact same mechanism using ChatGPT, and the result was a score of 85/100 in terms of quality of the portfolio and a score of 75/100 for the explanation of the portfolio. As one can observe, our approach obtained a better result in the explanation (90 instead of 75, i.e., out of 100) according to this GAI evaluation. Regarding the quality of the portfolios, both of them obtained the same score. Thus, our approach improved the explainability when compared to a common human expert recommendation that was quickly retrieved from the Internet, according to ChatGPT evaluation. In the comparison with the baseline, we only considered this tool since we believed that the other GAI tools were not properly considering SHAP outputs. Consequently, there were no significant improvements in the scores over human expert recommendations. This comparison with the baseline was limited as the human expert review was obtained freely online with a simple search, and only a GAI tool was used, although it was probably the most mature. Our approach may be useful compared with this kind of human recommendation, but a further future comparison will be necessary to reliably corroborate such statement.
5.3. User Study About Portfolio Recommendations and Their Explanations
For this study, we asked for volunteers who participated in the evaluation of a tool for recommending stock portfolios based on XAI with explanations. In this study, seven people participated. This study included seven adult participants, with a balanced gender distribution (four women and three men). Six participants were from Spain, and one was from the United States. Three participants had a background in financial and stock investment, while four did not.
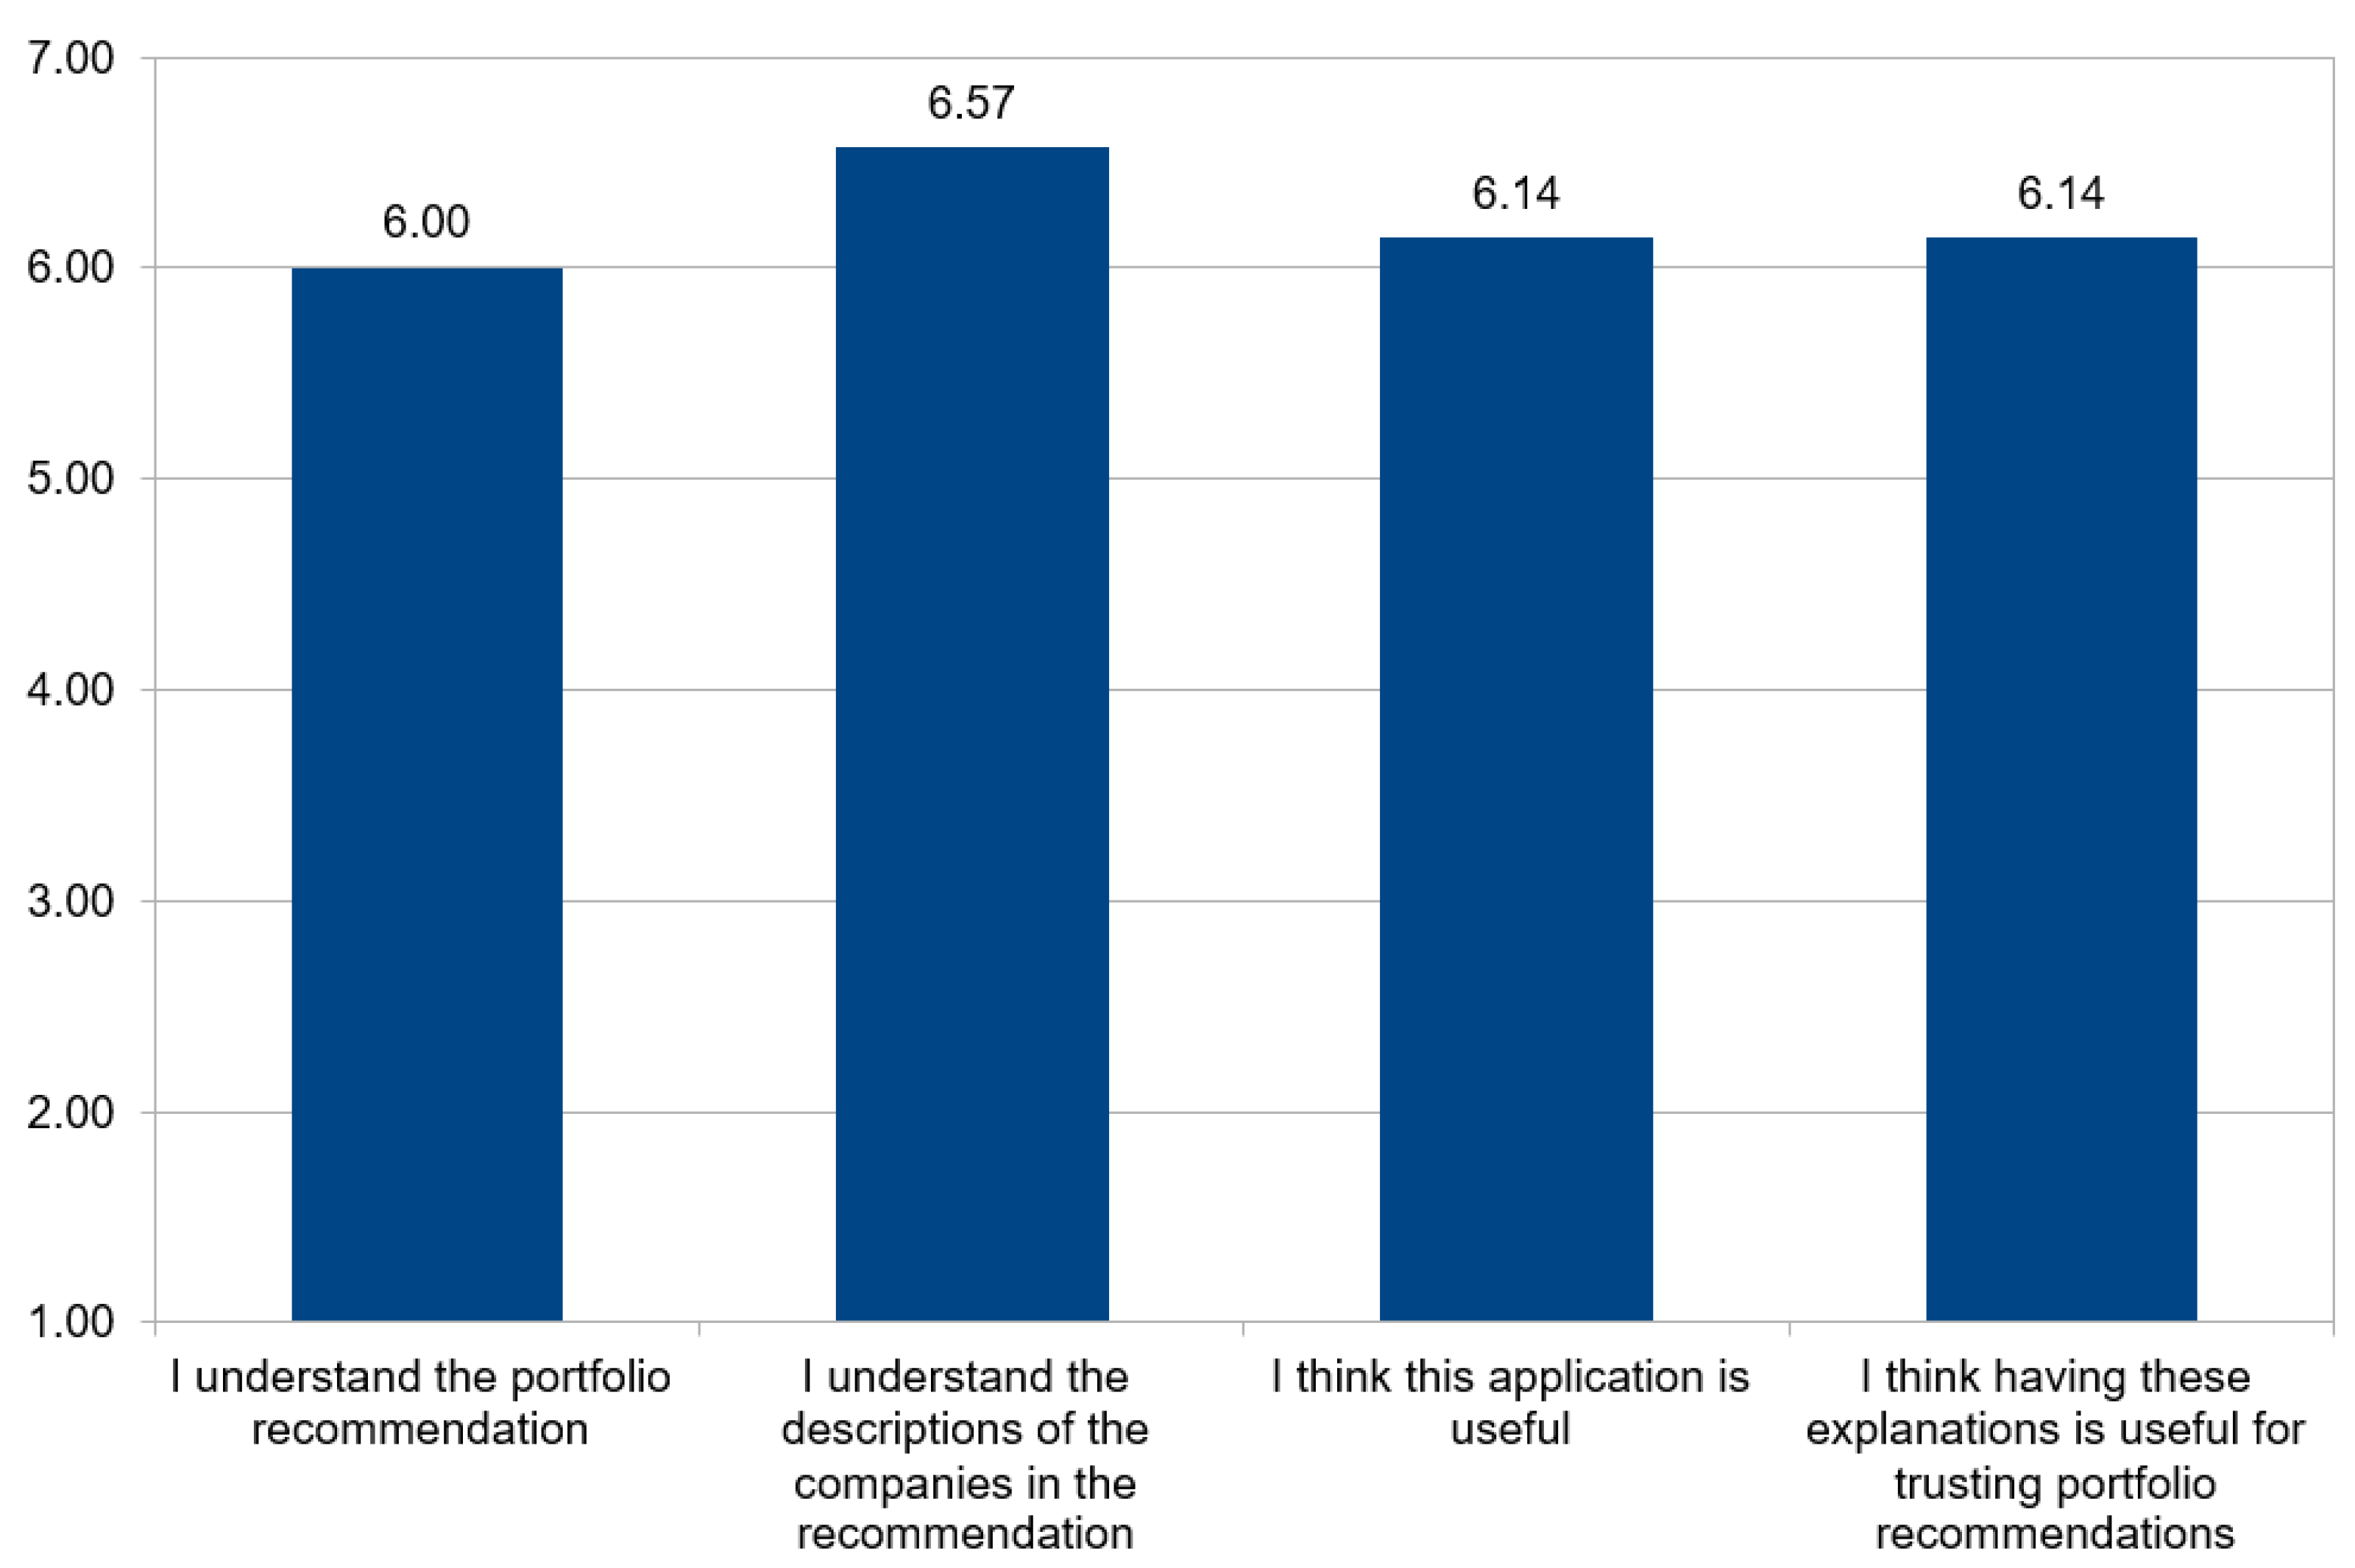
For evaluating our XAI-based portfolio recommender, we designed a questionnaire based on the key factors that we were interested in evaluating. More concretely, we asked participants to evaluate the following sentences in a 7-point Likert scale: (Q1) “I understand the portfolio recommendation”, (Q2) “I understand the descriptions of the companies in the recommendation”, (Q3) “I think this application is useful”, and (Q4) “I think having these explanations are useful for trusting portfolio recommendations”.
Figure 18 presents the results of the survey about our XAI-based portfolio recommender. It is worth mentioning that the highest value was obtained in Q2 about the understandability of company descriptions (ranked as 6.57 out of 7), which were generated through GAI by means of DeepSeek, so the result of incorporating this technology was really appreciated by the participants. Q3 also obtained a high value (6.14 out of 7), showing that the users found our recommender application useful.
The most important finding was that the novelty of the explanations generated through the XAI-based techniques was considered useful when it came to trusting portfolio recommendations (Question Q4), and it also had a high value (6.14 out of 7). This corroborates the importance and utility of providing explanations in such systems.
Figure 19 shows the distribution of replies to Q4, showing that most participants (57.1% of the sample) agreed (6 out 7) with the usefulness of these XAI-based explanations for gaining trust, and another representative group of participants (28.6% of the sample) strongly agreed (7 out of 7) with this usefulness.
6. Discussion
The presented 4-year profitability percentages were considered in two 4-year periods (from February 2021 to February 2025, and from April 2021 to April 2025). Consequently, these were affected by the macroeconomic aspects of these two periods, and they were subsequently not comparable to either of the other past or future periods. However, what is relevant was that, in the same periods, our proposed approach outperformed the passive indexes of the reference in a statistically significant way. It is worth mentioning that the two periods used included different scenarios since the ending dates were before and after the USA custom duties for international trade. Thus, the first period was a bull market with index prices near maximums, while the latter period included market crashes with price decreases of up to 20% in several days with very high volatility.
Financial indicator ratios depend on the field. Different fields are usually associated with different ranges of PER, NPM, ROI, dividend yields, cashflow, and payout ratios. This approach has been successfully when applied to a reference index that overweights certain sectors and companies with certain features; more specifically, we used NASDAQ-100 companies for this purpose. Thus, our approach might also be useful in this kind of index when it is focused on certain sectors or companies with shared features. The outcomes may not be extendable when using more diversified indexes, either in fields or geographically. Even though we also analyzed the S&P 500 for our study with diversified sectors in the USA, all of the results together of the NASDAQ-100 and S&P 500 still saw statistically significant improvements. Thus, our approach might be on the right path toward a more generic approach for recommending stock investments in different sectors and regions with the proper training.
Every trimester, each company provides the financial fundamentals that provide insight information that reveals new information about the value of the company to the public. However, almost immediately, the price of the company changes with this new information. Normally, the reports are released out of market hours. The price changes in the pre-market without the possibility of either buying or selling. Thus, the opening stock prices now incorporate the new information. Thus, this approach is competing with everyone else, who also have exactly the same information, and it uses the fundamental value based on the financials for long-term investments, like in the long-term investments of the well-known investor Warren Buffett [
24].
It is worth mentioning that this work provided ML attribution-based explanations, which focus on ranking the importance value of input features. However, as mentioned in [
25], there are two other types of ML explanations. Model-based explanations focus on describing the learned ML, like the decision trees’ depth and the number of non-zero weights in linear models. In our short-term future work, these could help in understanding the complexity of ML models necessary to outperform market profitability and whether there is any relation between complexity/simplicity and profitability. Another kind of ML explanation are example-based explanations. This can be useful for understanding the recommendations based on similarity or their difference (i.e., counterfactual examples) with some other stock values. All these improvements could enrich the portfolio recommendations of our system and their interpretation.
The SHAP assumes feature independence and model additivity, but these are not met in neural networks with non-linear dependencies. SHAP charts are only illustrative explanations, and users need to be aware of their potential limitations on non-linear models, such as the ones described in [
26]. As a possible mitigation strategy, the SHAP outcomes can be enhanced using the SHAP proxy proposed by [
19]. This XAI proxy approach has been successfully applied in the context of image processing in cardiac magnetic resonance images and brain images (specifically MRI) in the health domain. However, the application of this XAI proxy is not straightforward, as the underlying software is not public and its usefulness has only been proven in image processing, which is not exactly our context. It is worth mentioning that LIME provides deeper explanation insights without this limitation. However, LIME explanations are performed on each individual prediction [
27], so it has the limitation that users cannot analyze the complete learned model as a whole.
The results of the user study are promising, although it has some limitations. First, the small sample size of seven participants limits the generalizability of the findings. Moreover, this study lacked domain knowledge control and did not require any specific economic or XAI knowledge. Most participants lacked experience in stock investment or XAI, which may have constrained their ability to provide nuanced feedback. If the users had experience in financial analysis, they may have had either corroborated or refuted recommendations with more insight into financial knowledge. Consequently, this study would have been more meaningful for users with such backgrounds. We plan to address these limitations in future iterations of the user study by expanding the sample size and incorporating domain-specific expertise.
7. Conclusions and Future Work
This work has presented a methodology for recommending stock investment portfolios in a given reference index based on the fundamentals of companies that are reflected in the financial information reported on their trimestral reports. The proposed methodology has been able to provide 120 different portfolios based on the NASDAQ-100 and S&P-500 lists of companies, with different portfolio sizes between 8 and 28 companies based on the financial information obtained from the four years before the experiment. The profitability, on average, of these recommended portfolios increased compared to the average profitability of the lists of reference indexes in the same period. The t-Student analysis of this comparison demonstrated a statistically significant improvement (p < 0.001). The portfolios were explained with XAI and GAI tools using SHAP, LIME, and DeepSeek as the underlying technologies. The recommended portfolios and descriptions were positively assessed according to our GAI-based evaluation and our user study.
Our work can assist novice investors who struggle to understand portfolio recommendations. The proposed system not only provides a portfolio recommendation, but it also offers clear and useful explanations for each stock in the portfolio. Additionally, the proposed system can benefit expert investors by suggesting a potential portfolio. Experts can analyze the fundamentals, evaluate the provided explanations about these fundamentals, and integrate them with external factors, such as current macroeconomic aspects. Furthermore, they can gain insights into the sector-specific implications tied to the fundamentals.
This work was planned to be extended by considering more fundamental values, i.e., in terms of more fundamental financial ratios and the sequence of the evolution of these financial ratios before the time the predictions would be made. In this line, our work will consider recurrent neural networks, like long-short term memory (LSTM) networks or deep learning approaches (such as convolutional neural networks (CNN)). In an alternative line of work, we will also consider the possibility of providing diversified portfolios departing from several sectoral indexes based on a separate training for each of them.








_Zheng.png)


