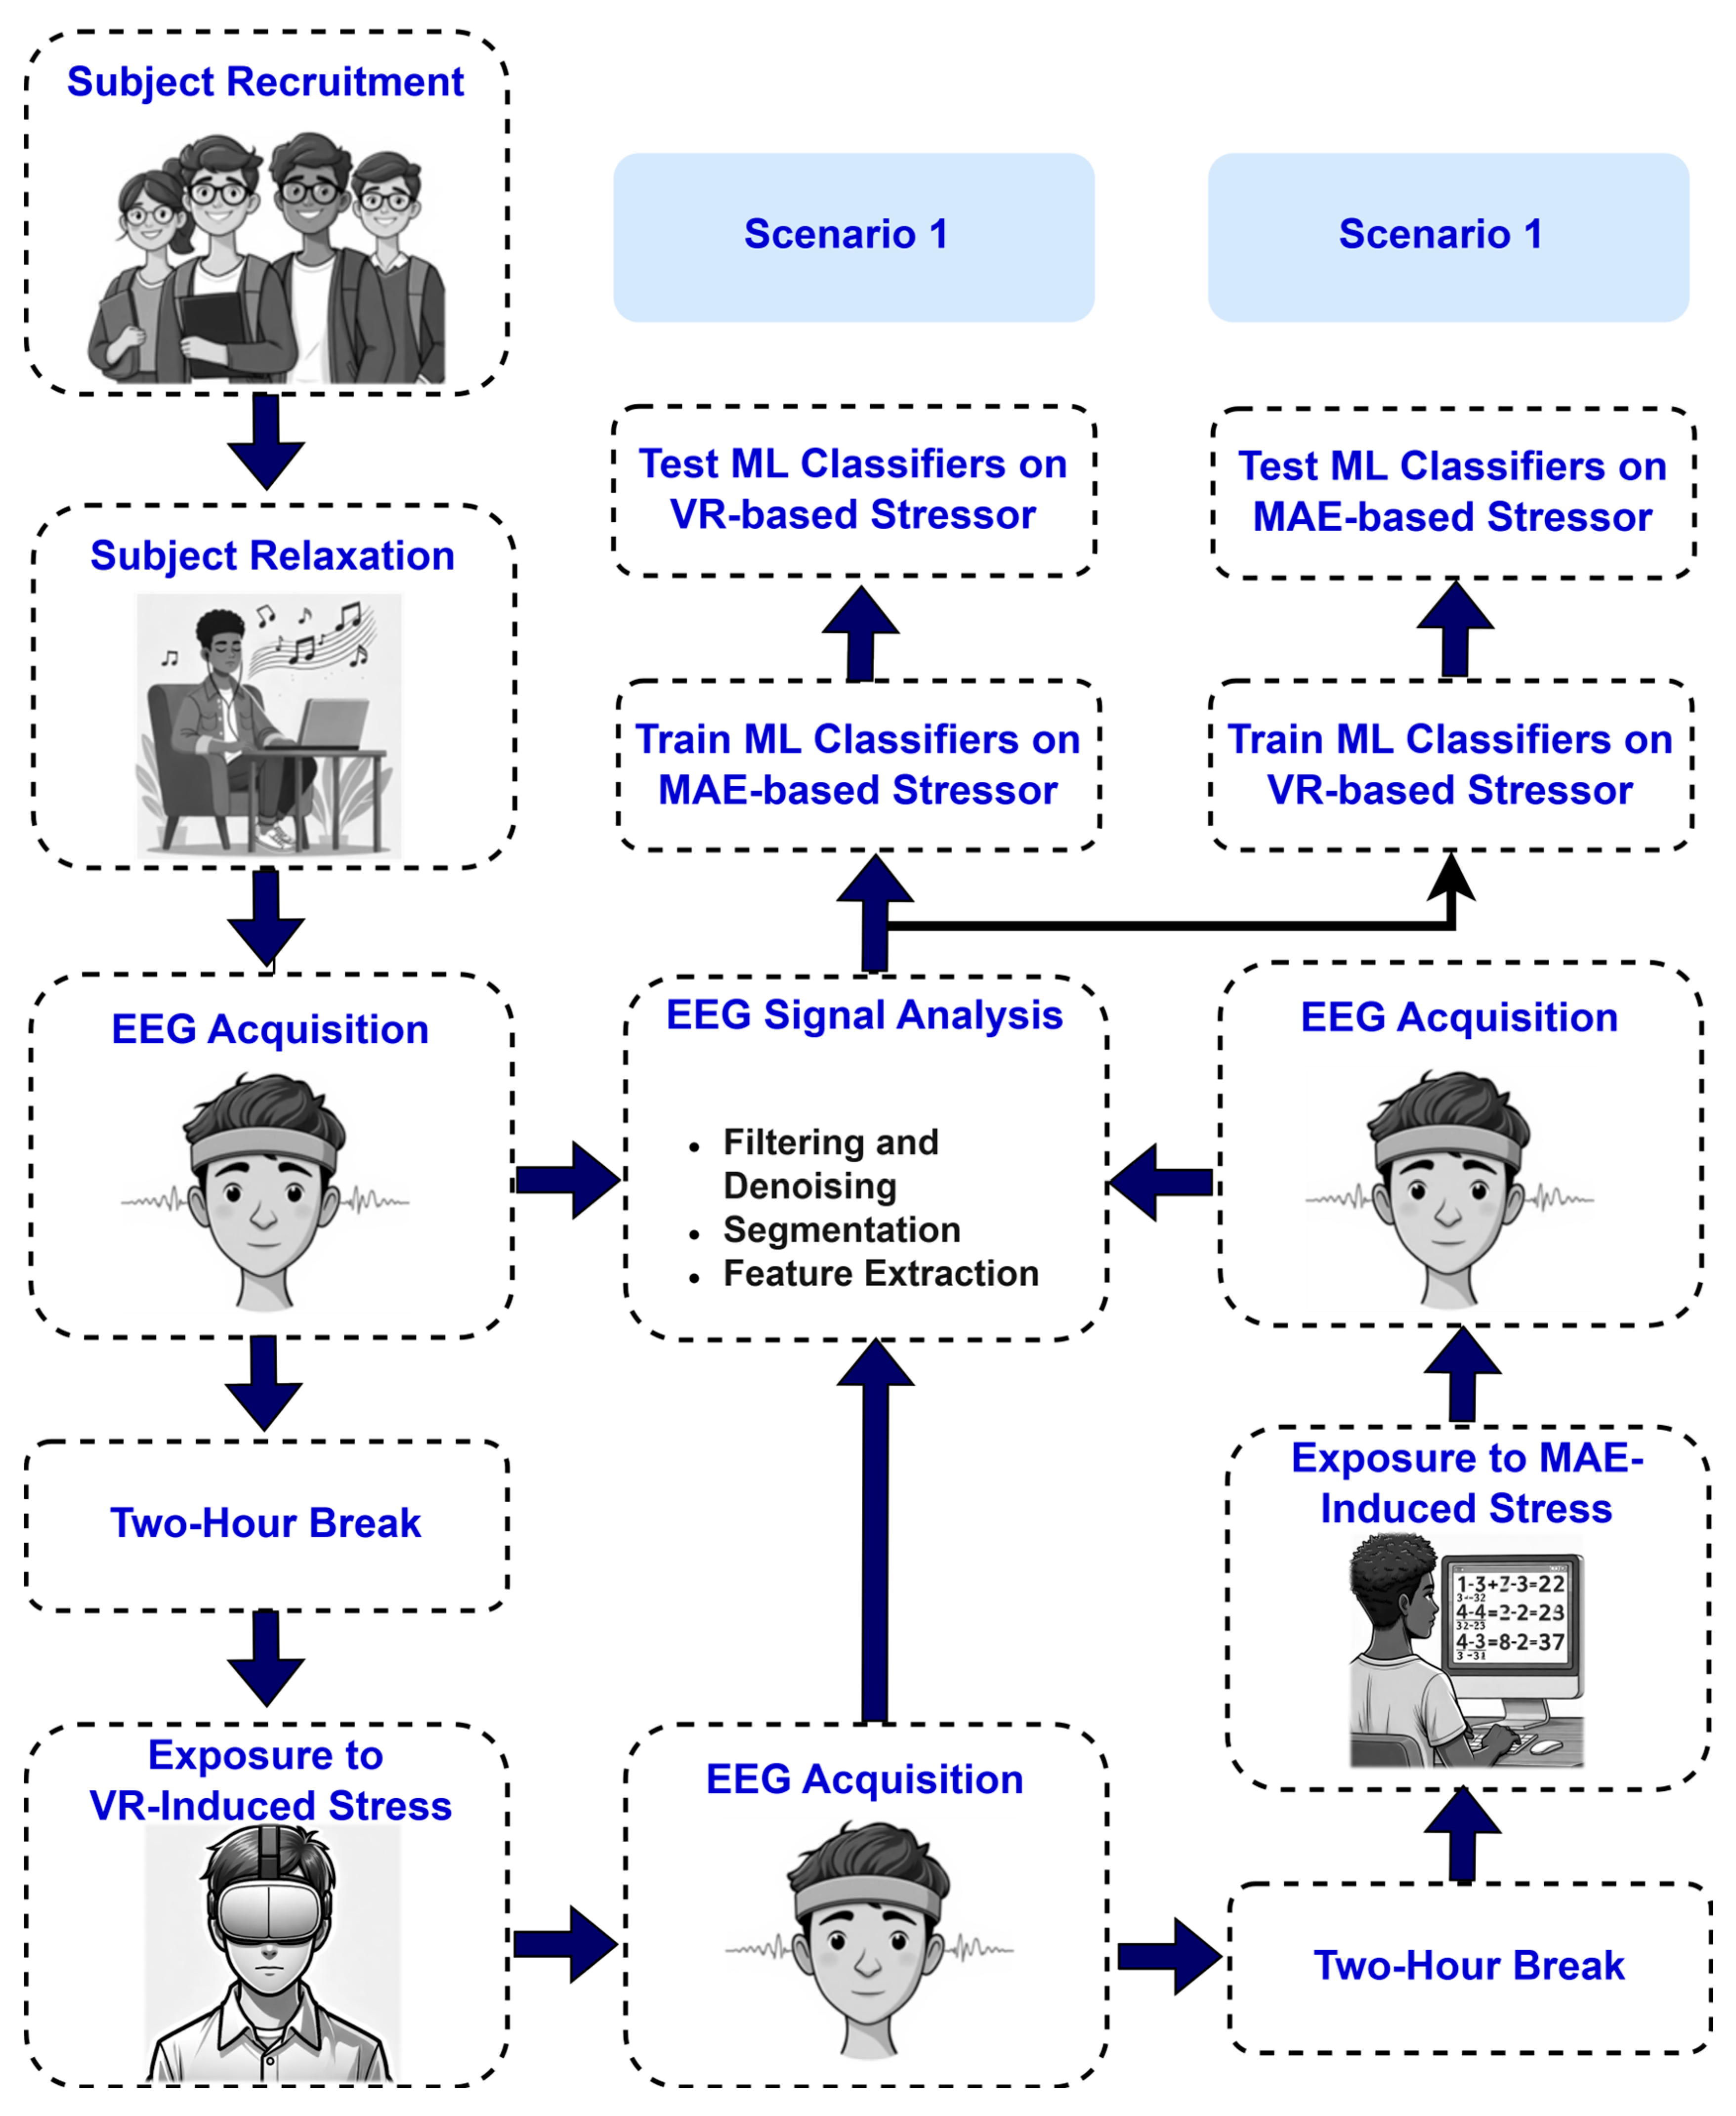
4.3.1. Scenario 1: MAE Data as Training Data and VR Data as Testing Data
Table 1 presents the performance evaluation of the AF7 electrode across five participants utilizing three classifiers (LDA, SVM, and KNN), highlighting notable trends in accuracy, precision, recall, and F1-score. The LDA classifier exhibited an average accuracy of 69.23%, accompanied by considerable variability among participants. Participant 5 attained the highest individual accuracy at 99.29%, whereas Participant 3 recorded the lowest at 47.86%. Notwithstanding its diminished accuracy, LDA demonstrated robust precision, averaging 91.76%, with maxima of 98.65% (Participant 2) and 98.57% (Participant 5). Nonetheless, recall values were significantly lower, averaging 68.09%, with Participant 3 (48.91%) and Participant 2 (52.52%) exhibiting subpar performance. The mean F1-score for LDA was 76.49%, indicating a balance between precision and recall; however, Participant 3’s low score of 64.73% emphasized inconsistencies.
On the other hand, the SVM classifier demonstrated enhanced performance compared to LDA, attaining an average accuracy of 76.73%. Participant 4 achieved an accuracy of 90.41%, while Participant 2 recorded an accuracy of 58.11%. Precision remained strong, averaging 94.22%, with Participant 4 (95.89%) and Participant 3 (94.29%) enhancing this performance. Recall enhanced to an average of 73.45%, driven by Participant 4 (86.42%) and Participant 5 (100%), while Participant 2 (54.55%) persisted in presenting a deficiency. The mean F1-score increased to 81.53%, with Participant 4 (90.91%) and Participant 5 (98.55%) demonstrating SVM’s proficiency in balancing precision and recall. The KNN classifier surpassed its competitors, attaining the highest average accuracy of 78.96% and outperforming in all metrics. Participant 4 attained 100% accuracy, the highest individual score in the study, whereas Participant 2 recorded the lowest score at 47.30%. The precision was outstanding, averaging 95.36%, with Participants 3 and 4 achieving 97.14% and 100%, respectively. Recall also enhanced, averaging 76.84%, with Participants 4 and 5 achieving 100%, whereas Participant 2 (48.61%) encountered difficulties. The F1-score reached an average of 83.90%, enhanced by Participant 4’s flawless 100% and Participant 3’s 82.42%, highlighting KNN’s exceptional equilibrium between metrics.
These results reveal considerable variability among participants. Participant 5 consistently demonstrated superior performance across classifiers, attaining near-perfect accuracy (99.29% with LDA and KNN) and recall (100% with LDA and SVM). Participant 4 distinguished themselves, notably achieving 100% accuracy with KNN and 90.41% accuracy with SVM, indicating a robust alignment between their data and these models. In contrast, Participants 2 and 3 encountered difficulties, as Participant 2’s accuracy decreased to 47.30% (KNN) and Participant 3’s accuracy fell to 47.86% (LDA), suggesting possible complications such as data variability or physiological disparities.
The confidence intervals and ANOVA findings of
Table 2 provide essential details regarding the comparative performance validity of our classifiers for the A7 electrode. The relatively wide confidence intervals displayed by our accuracy parameters (LDA: [50.12, 88.34], KNN: [55.38, 102.54]) suggest that our accuracy metric has considerable variability across participants and may not be generalizable to a wider population. However, precision parameters exhibited narrower confidence intervals (LDA: [82.54, 100.98]), meaning these metrics exhibited more reliable performance across individuals. The ANOVA showed statistical significance, with
p-values for accuracy (
p = 0.021), recall (
p = 0.018), and F1-score (
p = 0.034), thus confirming that KNN’s performance is significantly stronger than both other classifiers in these two areas. The precision metrics, however, displayed non-significant differences (
p = 0.104), suggesting that all three models perform similarly in classifying positive cases accurately. Although KNN exhibits the best overall performance with respect to each of the parameters assessed, the variance indicates either inconsistency of performance or difficulties generalizing these preliminary results.
Similarly,
Table 3 presents detailed performance metrics specific to the AF8 electrode data, following the same format as that used for the AF7 sensor. This table includes metrics for each participant, demonstrating the performance of the LDA, SVM, and KNN classifiers when applied to AF8 data.
Table 2 shows the results for Scenario 1 using the AF8 electrode. The SVM classifier for the AF8 electrode (
Table 2) attained the greatest average accuracy of 87.51%, surpassing LDA (78.88%) and KNN (86.60%). Participant 1 exhibited outstanding performance with SVM (97.30% accuracy), whereas Participant 5 also displayed commendable results (94.29% accuracy). The SVM classifier exhibited high average precision (97.16%) and average recall (83.60%), yielding a strong average F1-score of 89.13%. This consistency highlights the reliability of SVM for AF8 data. These results are greater than those achieved using AF7 (
Table 1).
Incorporating the confidence intervals and ANOVA test results offered a more robust statistical assessment of the performance metrics, as presented in
Table 4. The 95% confidence intervals indicate participant variability in classifier performance, with a smaller range (e.g., precision for SVM: 93.76–100.56) indicating more consistent performance and a larger range (e.g., accuracy for LDA: 64.50–93.26) indicating less consistent performance. The ANOVA confirms that there were statistically significant differences in performance across the classifiers for all metrics evaluated (
p < 0.05), indicating that the differences observed were not due to chance. It is important to note that SVM performed consistently well in terms of average accuracy (87.51%) and F1-score (89.13%) and had minimal range variability, which reinforces the reliability of the classifier for detecting stress using the AF8 electrode. These findings lessen the concern of overfitting, since they suggest that the high accuracy claims noted in the results are supported by statistically significant trends and variability at the participant level.
Table 5 provides a comprehensive overview of the LDA, SVM, and KNN classifiers’ performance metrics, specifically for the TP9 sensor. For the TP9 electrode (
Table 5), the LDA classifier achieved the highest average performance with an average accuracy of 69.76%, although the overall metrics were inferior relative to the other electrodes. Participant 1 attained an accuracy of 87.16% using LDA, while performance exhibited significant variability, with Participant 3 and Participant 4 achieving accuracy scores of 50.00% and 69.18%, respectively. LDA’s elevated average precision (89.42%) set against its diminished average recall (69.39%) indicates possible difficulties in identifying true positives. The average F1-score for LDA (76.06%) exceeded that of SVM (75.00%) and KNN (74.81%), confirming its comparative superiority for TP9 despite overall modest performance.
By including CIs and ANOVA test statistics, the performance metrics for the TP9 electrode were evaluated more rigorously as shown in
Table 6. The CIs indicate that accuracy, precision, recall, and F1-score exhibited considerable variability subject to the behavior of the participants, especially for the LDA and KNN classifiers. For instance, the 95% CI for accuracy indicated a range of approximately 39 percentage points for LDA (50.23–89.29%), indicating considerable participant-level variability among responses. ANOVA results also indicated that recall was the only metric for which statistically significant differences were found between classifiers (
p = 0.037) suggesting that, while classifiers performed similarly regarding accuracy, precision, and F1-score, there remained a difference in ‘ability’ to identify true positives. Furthermore, finding no significant differences in accuracy across classifiers (
p = 0.081) would suggest that claims regarding high accuracy would add little to the classifying performance and would likely not be generalizable across all contexts or participants without overfitting. Overall, the data indicate that both variability and statistical rigor should be considered when interpreting performance metrics associated with classifiers, particularly when working in a small-sample-size context.
Table 7 covers the results of the TP10 electrode, providing a thorough breakdown of performance metrics for individual participants. This table follows the same format as those for the AF7, AF8, and TP9 sensors, ensuring consistency in data presentation. The TP10 electrode (
Table 7) demonstrated the most robust results, with the SVM classifier attaining a maximum average accuracy of 95.76%, the highest among all sensors. Participant 3 and Participant 4 exhibited exceptional performances, achieving accuracies of 92.86% and 93.84%, respectively. Furthermore, SVM achieved an exceptional average precision (97.30%), average recall (94.59%), and average F1-score (95.85%), indicating a nearly optimal balance. Although LDA and KNN exhibited lower averages (89.32% and 89.17%, respectively), Participant 4 attained 96.55% accuracy with LDA, demonstrating intermittent excellence but diminished consistency.
The incorporation of CIs and ANOVA test statistics enhanced the robustness of the evaluation of the performance metrics reported for the TP10 electrode. As shown in
Table 8, the 95% CIs indicate a likely range for the true population mean, which also indicates variability. For example, the SVM classifier demonstrated superior average accuracy (95.76%) relative to the other classifiers with a narrow 95% CI (91.14–100.00%), indicating strong and consistent performance across participants. The ANOVA test, however, revealed statistically significant differences in performance metrics across the three classifiers: accuracy (
p = 0.031), recall (
p = 0.045), and F1-score (
p = 0.022), which suggests that these performance measures are not uniformly distributed across the conditions. This suggests, however, that the SVM classifier performed better than both the LDA and KNN classification approaches in both accuracy and recall measures based on the higher means and CIs related to recall shown for the SVM. These results validate the proposition that the SVM classifier is effective for stress detection data derived from the TP10 electrode while demonstrating a need to factor in participant-level variability and statistical significance when making high-accuracy claims. The demonstrated lack of significance with precision (
p = 0.102) indicates that all three classifiers performed similarly to identify positive cases. Differences in recall and F1-score emphasize the need to carefully select a model, particularly when considering the balance of sensitivity and specificity as part of the analysis.
The analysis of the results in
Table 1,
Table 2,
Table 3,
Table 4,
Table 5,
Table 6,
Table 7 and
Table 8 disclosed multiple significant findings. Participant 4 attained the highest individual accuracies of 96.55% and 93.84% with the LDA and SVM classifiers, respectively, using the TP10 electrode, while Participant 1 achieved 99.32% and 97.30% individual accuracies using LDA and SVM, respectively, employing the AF8 electrode. The results demonstrate remarkable individual performances, especially for electrodes linked to posterior (TP10) and frontal (AF8) brain regions, indicating localized signal effectiveness for stress detection. The TP10 electrode combined with SVM exhibited the highest average accuracy at 95.76%, surpassing all the other electrode–classifier combinations, while AF8’s SVM attained 87.51%. This highlights the TP10 electrode’s enhanced reliability in detecting stress-related patterns among participants, likely attributable to its positioning in posterior regions, which may be essential for identifying physiological stress responses.
Participant variability was significant, exhibiting marked differences in performance. For instance, Participant 3 attained a score of merely 50.00% for both accuracy and recall with LDA, KNN, and SVM on TP9, whereas Participant 1 achieved an accuracy of 87.16%, 85.81%, and 83.78% utilizing the identical electrode with the LDA, SVM, and KNN classifiers, respectively. These discrepancies highlight fundamental variances in individual EEG signal characteristics, potentially affected by anatomical variations, consistency of electrode position, or distinct stress response patterns. SVM exhibited superior efficacy for AF8 and TP10, attributed to its capacity to manage non-linear and intricate EEG data patterns, as indicated by its high precision (up to 97.30%) and recall (up to 94.59%). Conversely, LDA, a linear model, demonstrated moderate performance for TP9 (69.76% average accuracy), indicating either simpler signal dynamics in that area or constraints in capturing subtle stress-related characteristics.
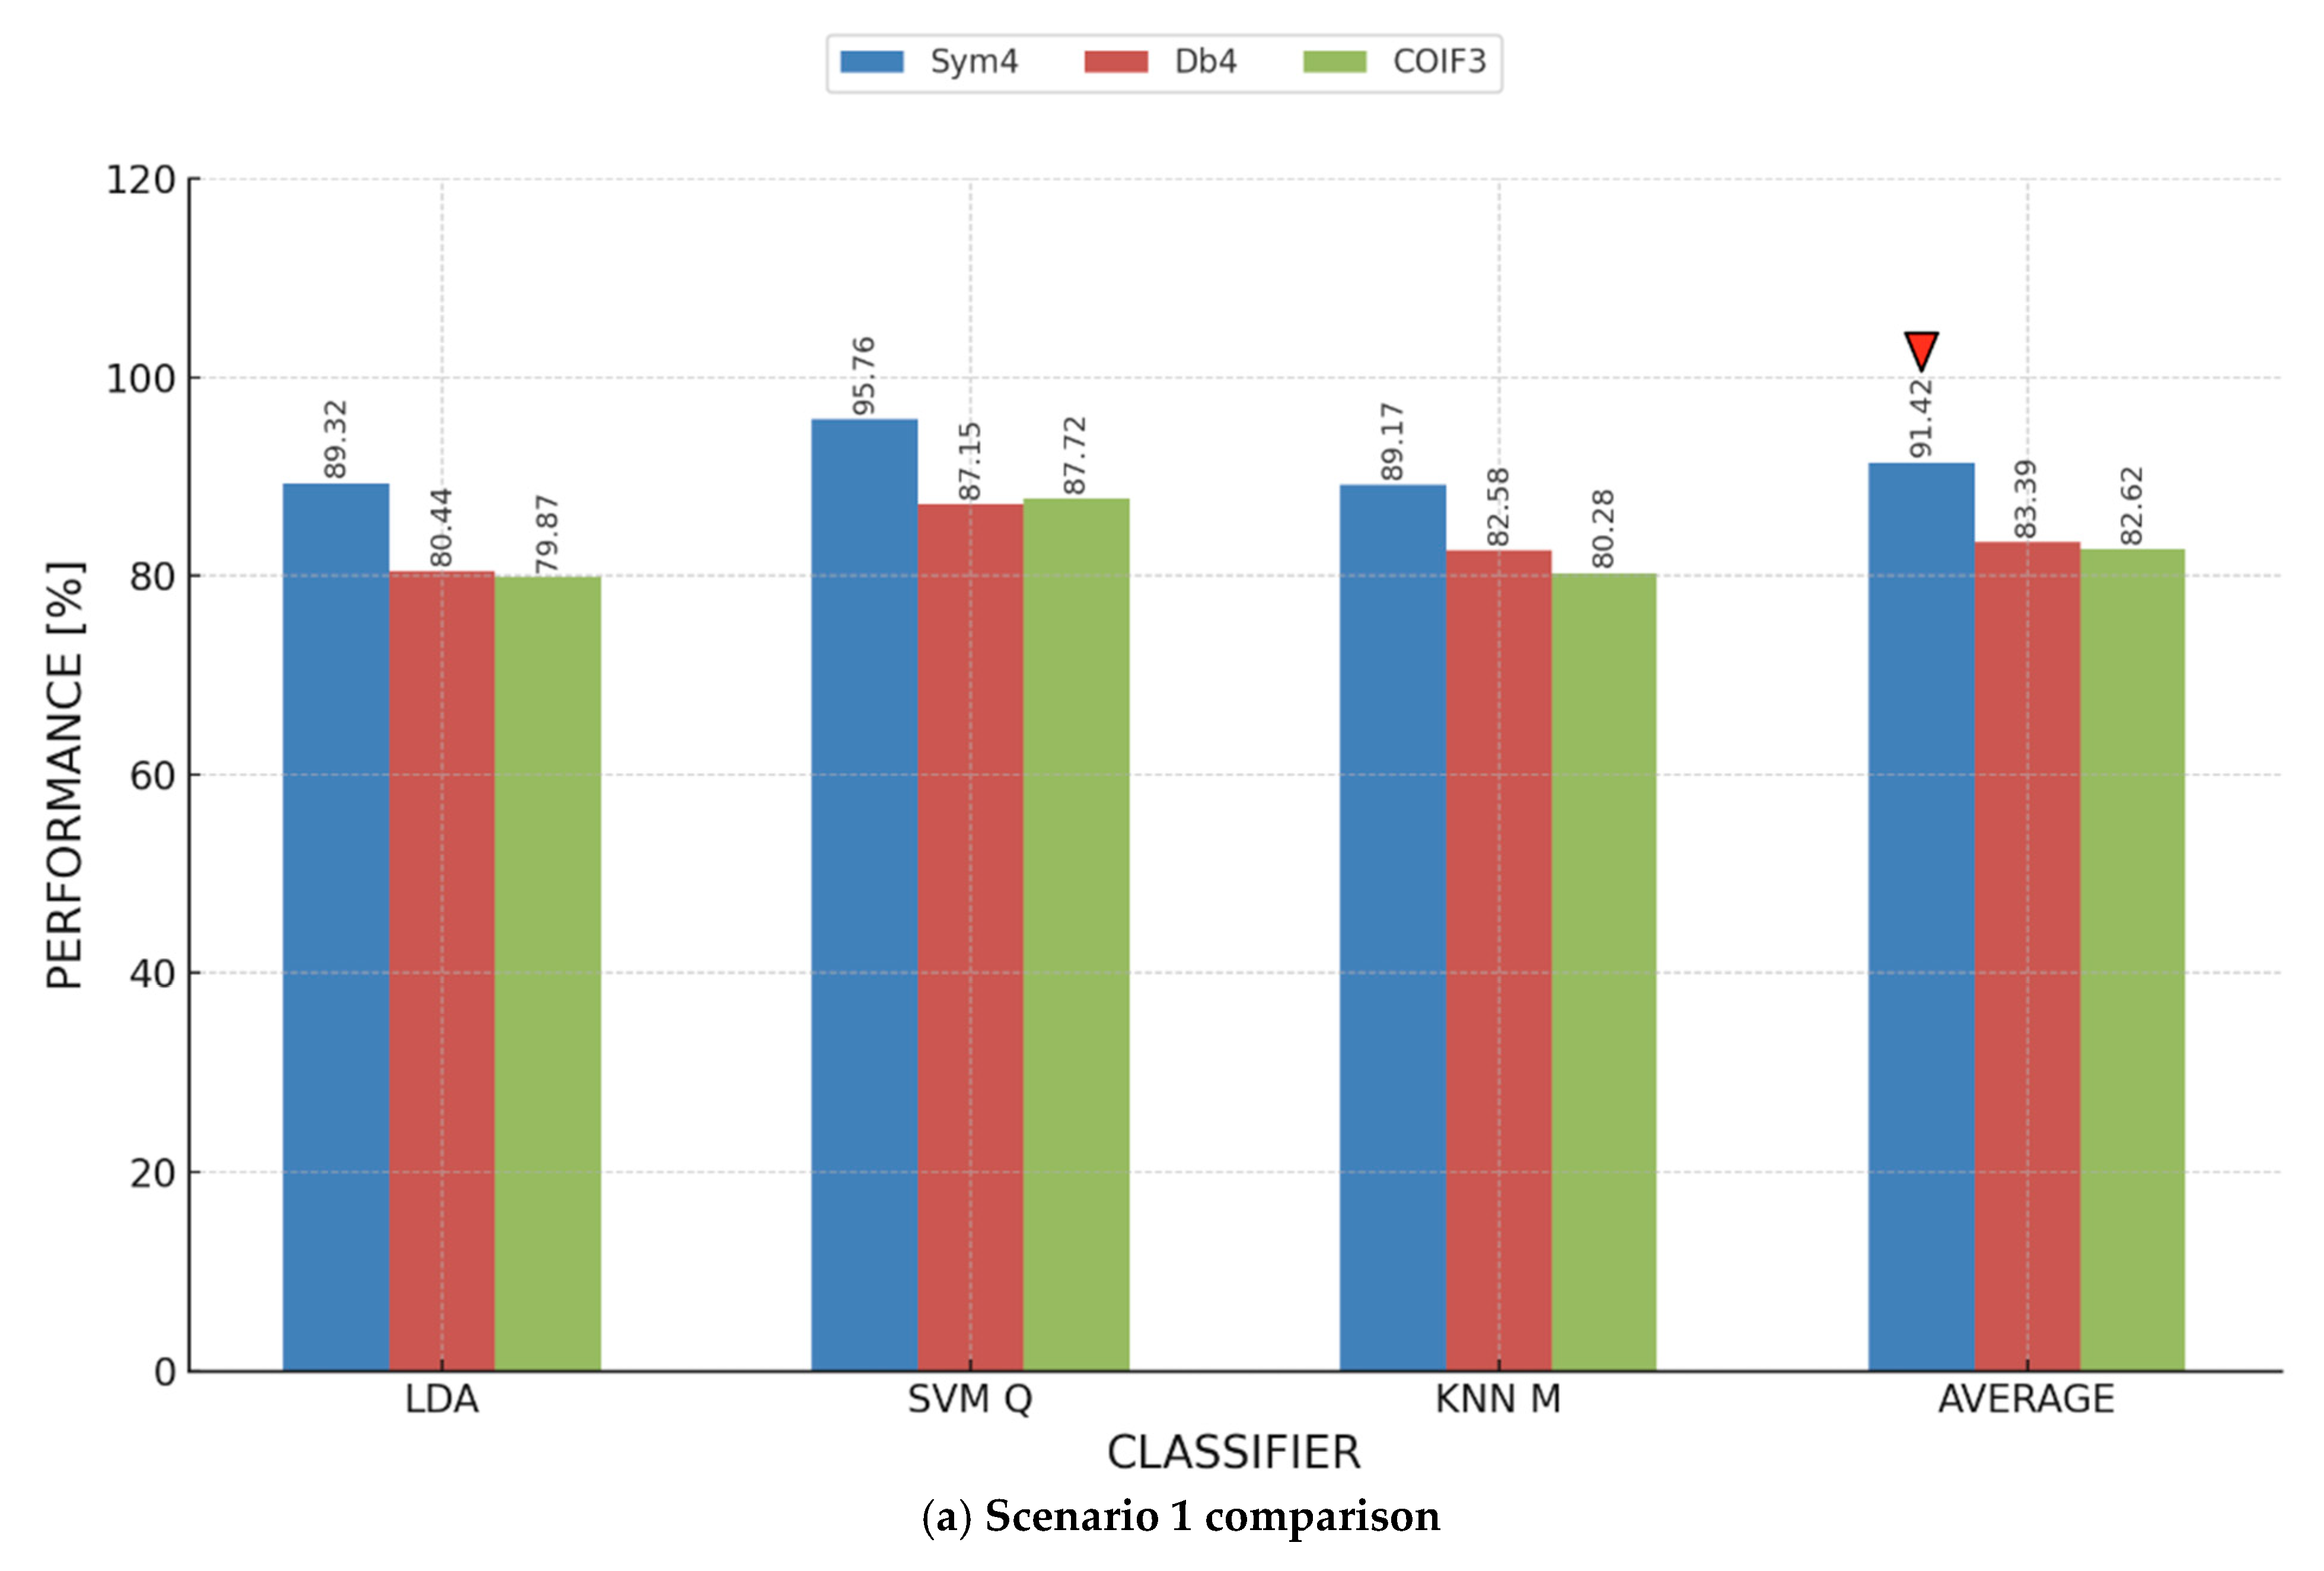
The findings suggest that the TP10 electrode, especially with SVM, is crucial for stress analysis, likely due to the abundance of stress-related neural activity in posterior brain regions. The superior performance of SVM is attributed to its ability to model complex patterns in EEG data, while LDA’s linear assumptions may restrict its effectiveness in more dynamic contexts. The considerable variability among participants highlights the necessity for personalized strategies, such as adaptive feature selection or tailored classifier tuning, to enhance the robustness of EEG-based stress detection systems. This may reduce the effects of biological variability and improve cross-subject generalizability in future applications. To provide a comprehensive overview of our findings, we calculated the average accuracy for the three classifiers, considering results from each participant and electrode. These aggregated results are presented in
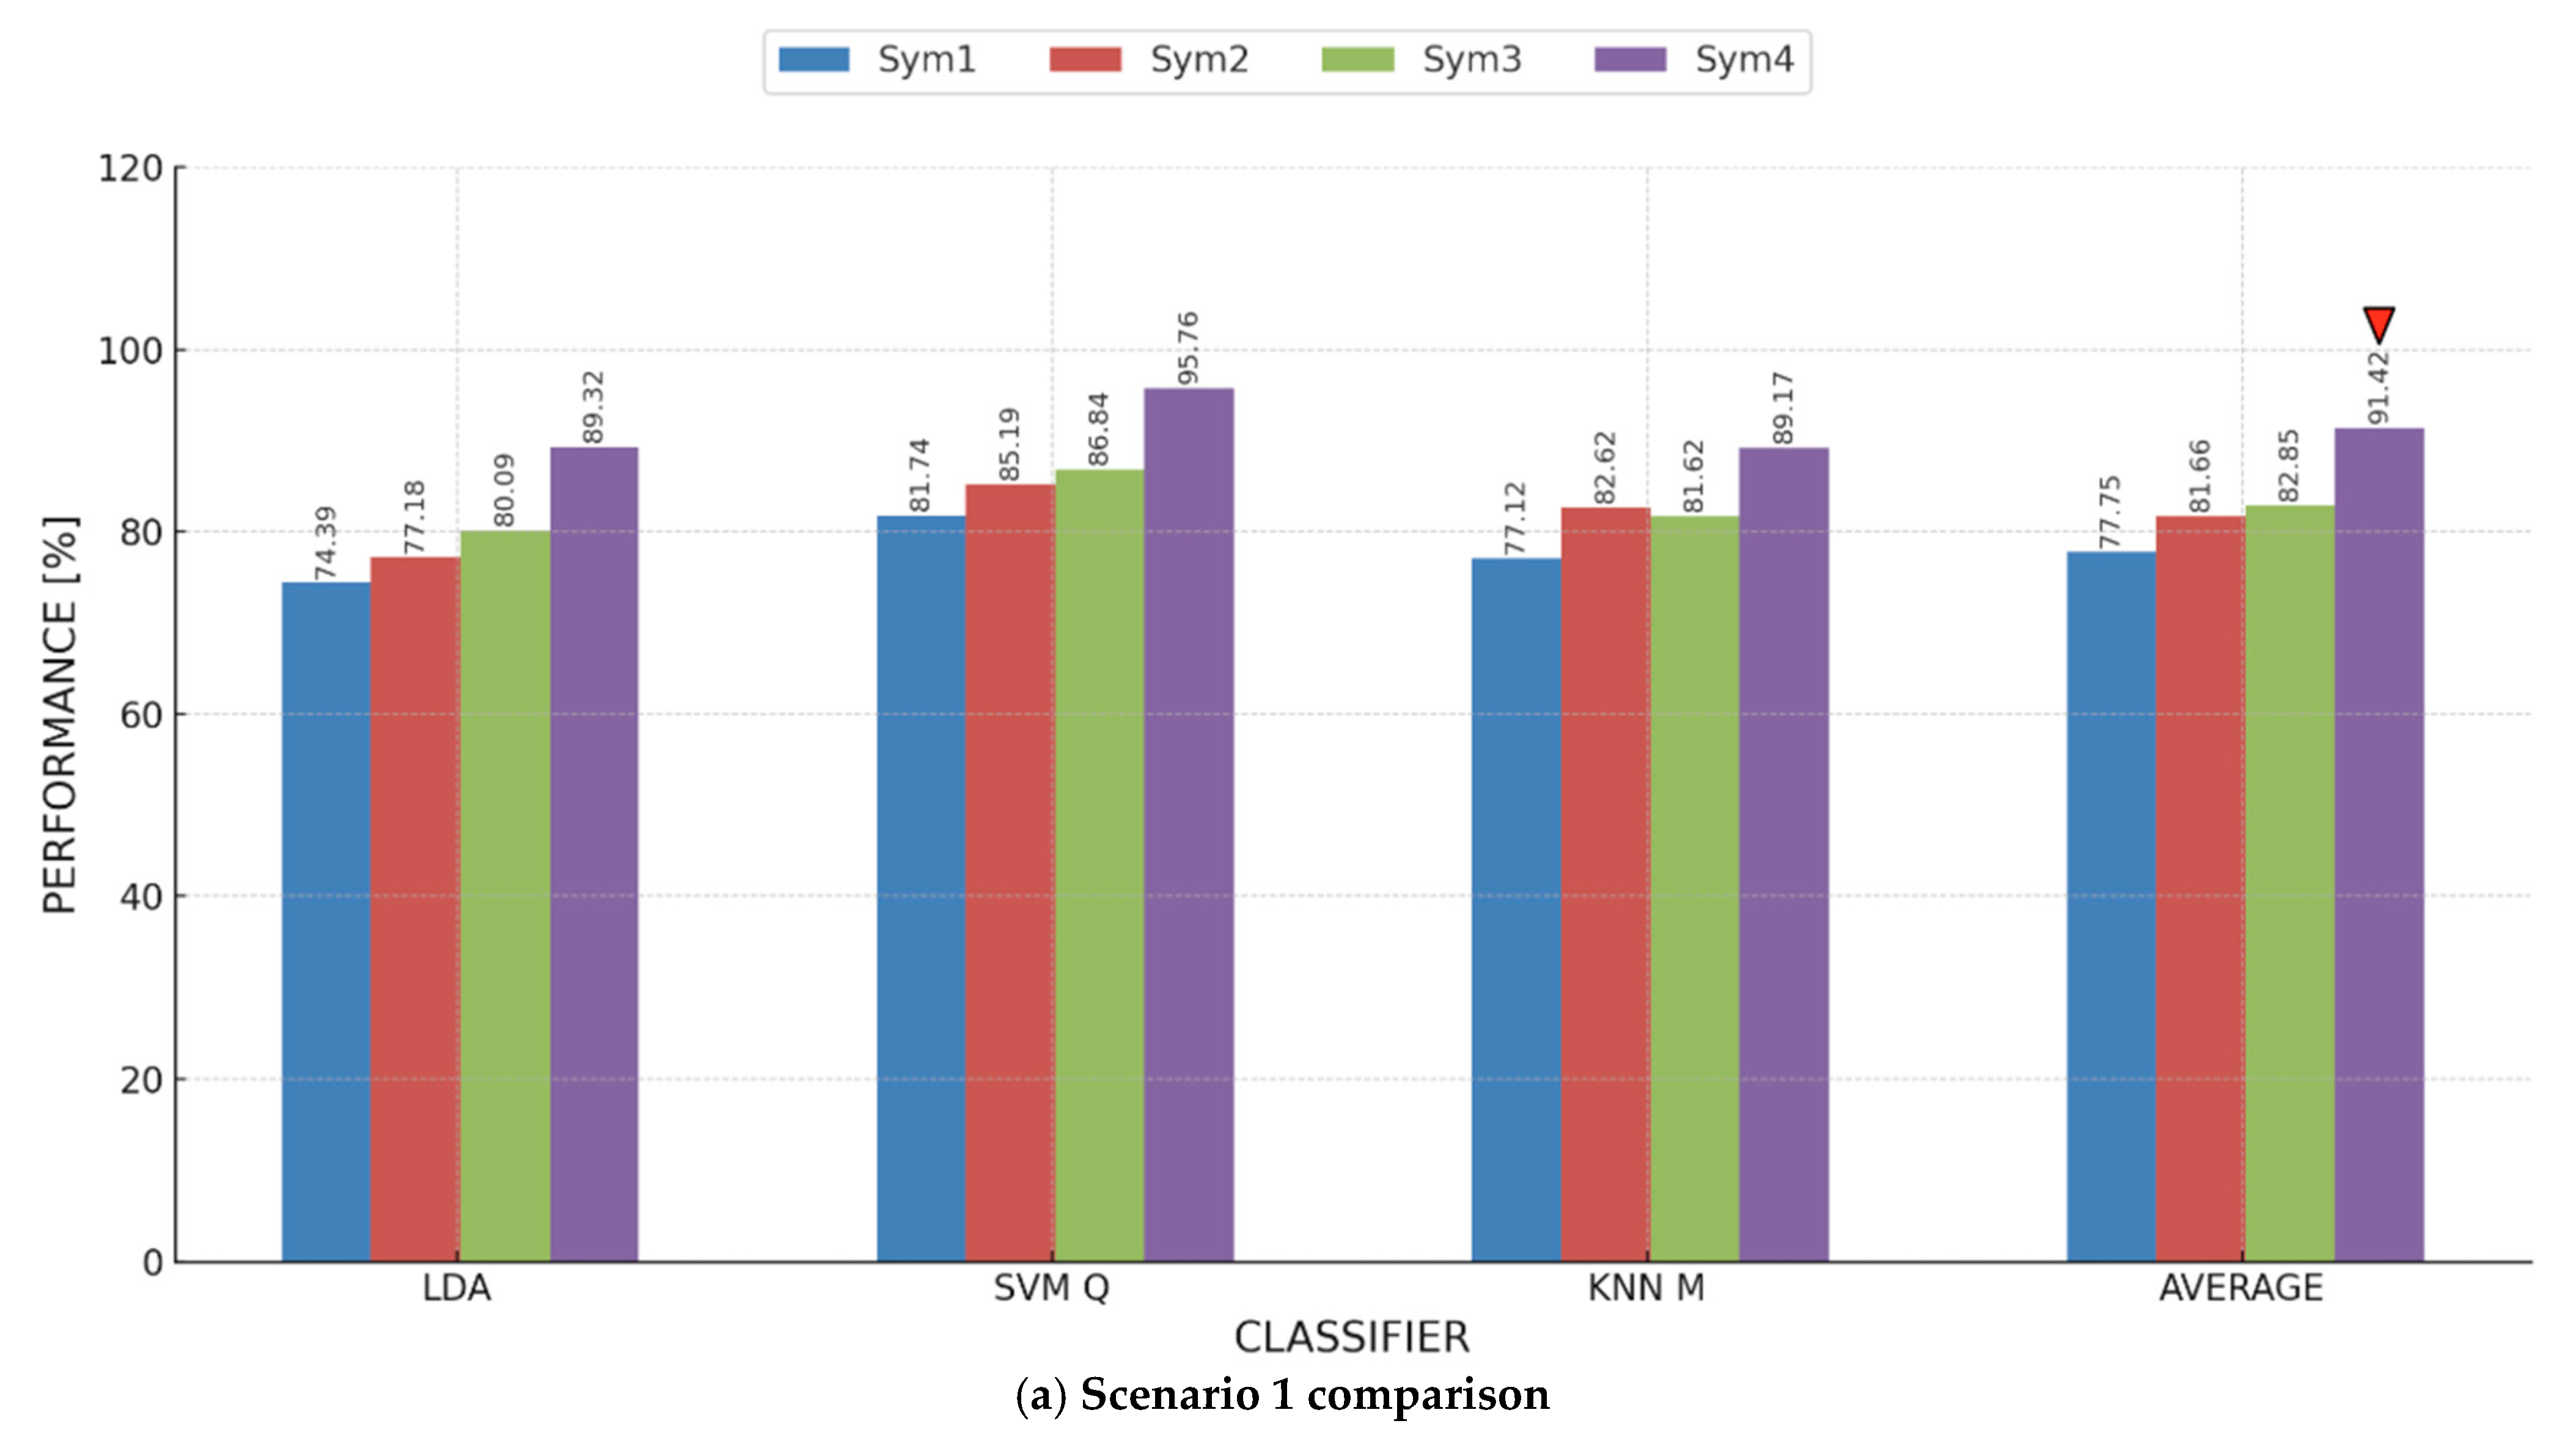
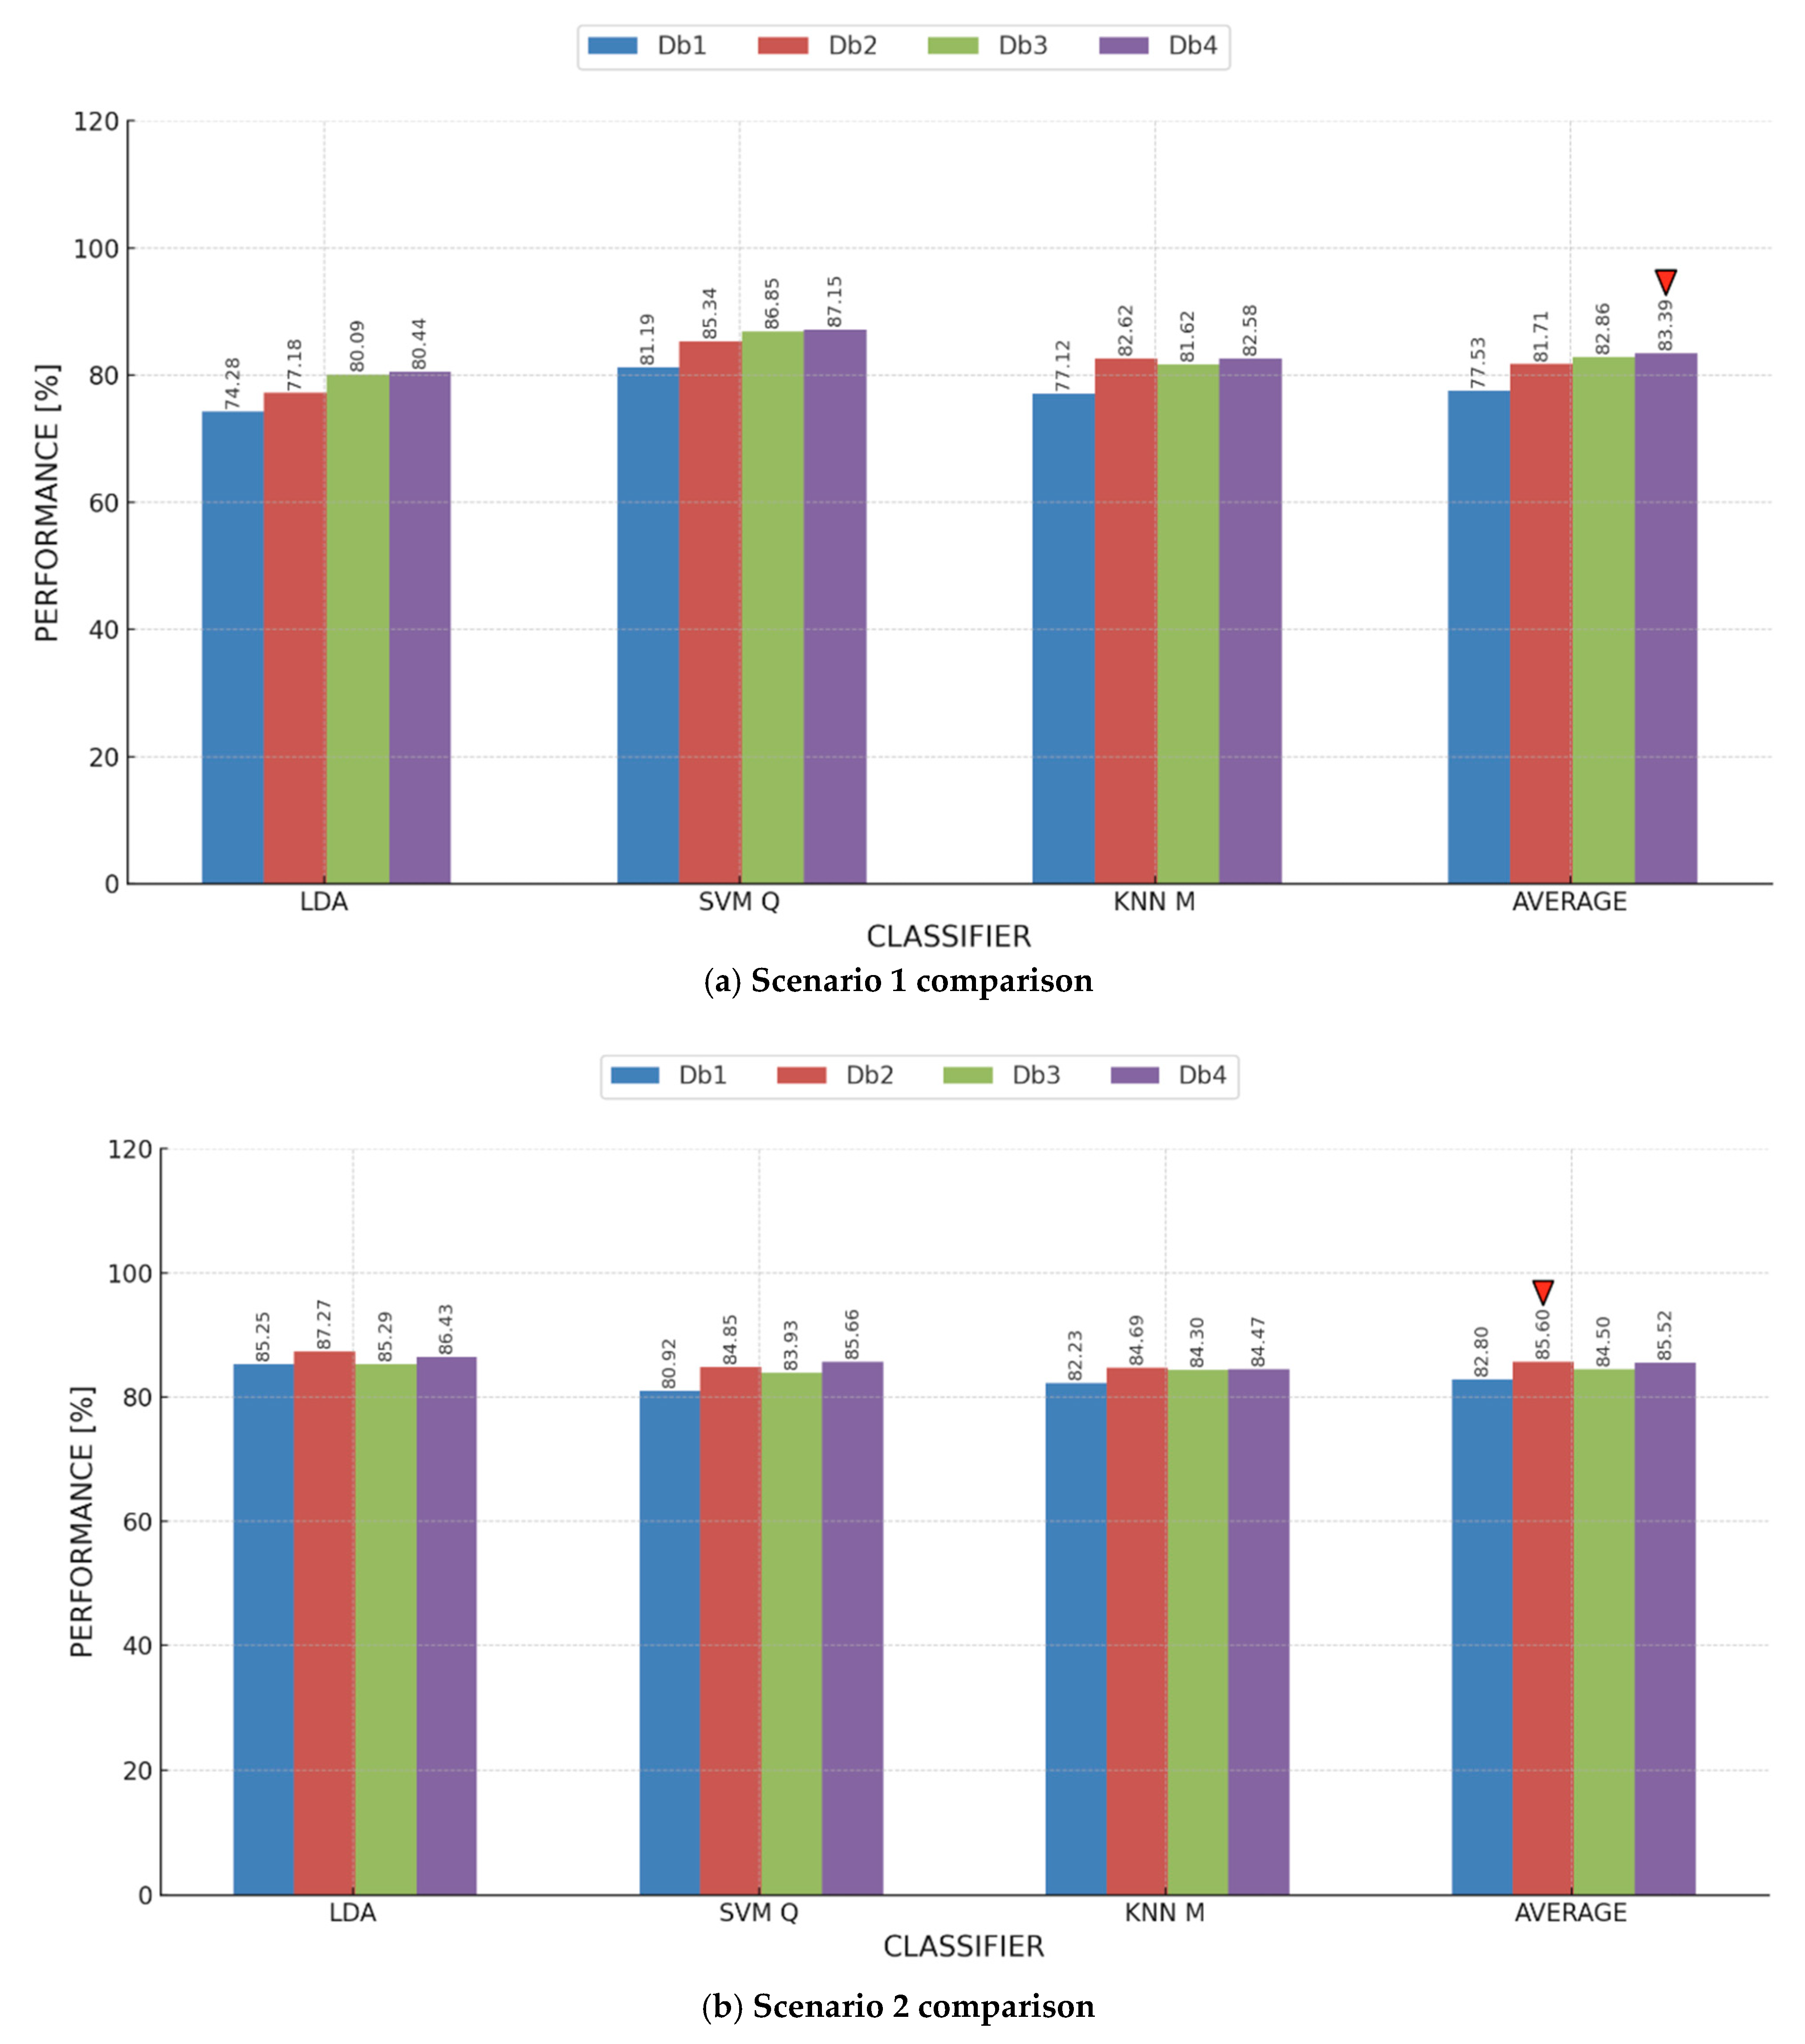
Figure 6, where a clear trend emerges: each electrode’s highest accuracy is achieved by a different ML model. For instance, KNN yielded the highest accuracy (78.96%) for AF7, while SVM was the most accurate (87.51%) for AF8. For TP9, the peak individual accuracy (79.89%) was achieved using KNN. Notably, the TP10 sensor recorded the highest average accuracy, with SVM achieving a peak accuracy of 95.76% and an overall sensor average of 91.42%. This emphasizes the significance of the TP10 sensor in our study, marking it as a focal point for further analysis.
In
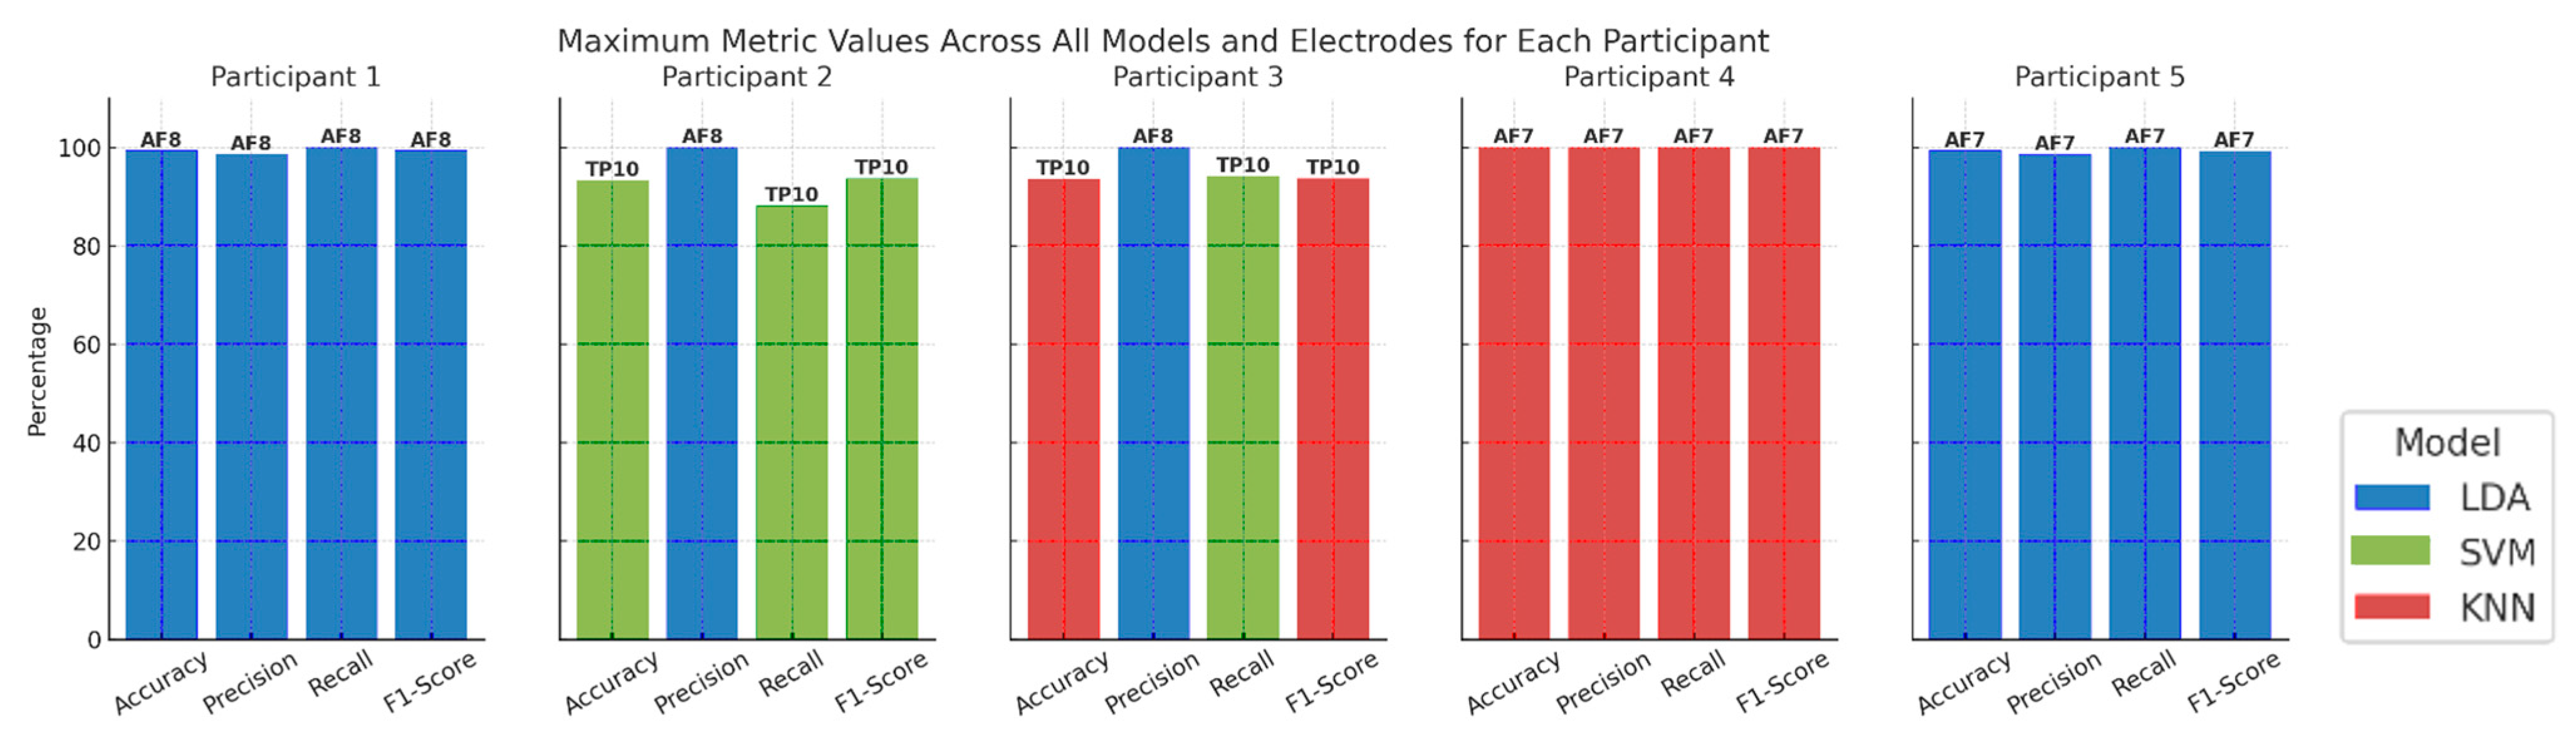
Figure 7, we present a different perspective. Effectively, it moves us closer to the vision, stated above, of having personalized strategies for stress detection. We compared the maximum metric values, across all models and electrodes for each participant. Basically, we analyzed
Table 1,
Table 2,
Table 3 and
Table 4, and we recorded, for each participant, the model and the electrode that attained the maximum value for each of the four adopted performance metrics. Especially for Participants 1, 4, and 5, it is apparent that there is an electrode that consistently gives higher values for all the adopted metrics than the other electrodes. It is also apparent that, on an individual level, we might be able to find a model that is more indicative than other models, e.g., KNN for Participant 4 and LDA for Participants 1 and 5. We believe that, following this analysis, a stress detection system can be tuned or customized to perform better on an individual level.
4.3.2. Scenario 2: VR Data as Training Data and MAE Data as Testing Data
In Scenario 2, where classifiers were trained on VR-generated stress data and tested on MAE stress data, the results shown in
Table 5 center on the performance of stress detection models employing the AF7 electrode. For the three classifiers—LDA, SVM, and KNN—the table offers key performance measures across five participants. The findings show variation in classifier performance among individuals.
Table 9 shows that SVM had the best average accuracy (80.02%), followed by LDA (78.15%) and KNN (75.97%), among the classifiers. Using LDA and SVM, Participant 2 achieved the best individual accuracies (93.64% and 91.36%, respectively), indicating strong model performance for this particular participant. With LDA, Participant 3 had the lowest accuracy (59.13%), reflecting perhaps unique individual variations in stress responses or EEG signal quality.
Across all classifiers, precision values were continually high; SVM attained the highest average precision (96.24%), shortly followed by KNN (96.19%) and LDA (94.03%). These findings show that, when predicting stress, all of the classifiers were quite confident; yet precision by itself cannot explain missing detections. For average recall scores, SVM attained 75.30%, outperforming LDA (74.59%) and KNN (70.38%). The average F1-score was also greatest for SVM (83.49%), followed by KNN (80.57%) and LDA (82.05%). These results confirm that, although all three classifiers showed great accuracy, SVM was the most consistent in stress detection among participants; hence, it is the best-performing model for the AF7 electrode in this context.
Participant 2 routinely scored better accuracy across all classifiers, with accuracies of 93.64% (LDA), 91.36% (SVM), and 85.91% (KNN). This suggests that, maybe because of clearer stress-related neural patterns, EEG signals from this individual were more consistently classified. With accuracy values of 59.13% (LDA), 63.04% (SVM), and 64.78% (KNN), Participant 3 displayed the lowest classification performance, demonstrating either greater variation in stress responses or signal inconsistencies that influenced model predictions.
The addition of CIs and ANOVA test statistics contributes to a more robust assessment of the reported performance metrics of the AF7 electrode from Scenario 2, as displayed in
Table 10. The 95% CIs demonstrate the variation in the classifier performance metrics for each participant across all trials, and any narrower intervals indicate a greater level of consistency. For instance, the SVM classifier reported a higher average accuracy (80.02%) and relatively narrow confidence (68.79–91.25) as compared to the other two classifiers. Thus, this classifier had the highest reliability in performing a robust and consistent classification on the accuracy metric at the AF7 electrode location. Although the ANOVA test showed an overall statistically significant difference among the classifiers for accuracy (
p = 0.048), recall (
p = 0.032), and F1-score (
p = 0.041), that is not to say that each metric was characterized by a uniform distribution amongst the classifiers. The SVM also had greater accuracy and recall than the LDA and KNN classifiers, as we would expect from its average and 95% confidence interval metrics. These results support the rationale for stating that the SVM classifier was the most effective stress detection classification for the AF7 electrode, but it also highlighted the need to include participant-level variability and statistical significance when discussing potential high-accuracy claims. The lack of significance in precision (
p = 0.087) indicates that all three classifiers performed similarly in correctly classifying positive cases, but differences in recall and F1-score highlight the consideration needed in selecting models with respect to sensitivity and specificity.
Table 11 displays the classification performance of the AF8 electrode in Scenario 2. The LDA classifier attained the highest average accuracy of 83.16%, followed by SVM at 82.12% and KNN M at 80.54%, suggesting that AF8 is a better choice than AF7 for stress detection in the Scenario 2 context. Upon examining the performance of individual participants, Participant 2 attained the highest accuracy (100%) across all classifiers, indicating remarkable consistency in stress classification using AF8. Likewise, Participant 1 demonstrated consistently high accuracy (97.87%, 97.87%, and 96.81%) across LDA, SVM, and KNN, evidencing the reliability of the AF8 electrode for these subjects. Conversely, Participant 5 demonstrated the lowest classification accuracy (between 56.85% and 58.90%), indicating possible discrepancies in the measurement of their stress responses with AF8. Participant 3 demonstrated moderate performance, achieving accuracy rates ranging from 78.70% to 82.61%, whereas Participant 4 showed marginally inferior accuracy (68.97–76.44%), highlighting variability in classifier efficacy among individuals.
Upon analyzing classifier-specific trends, LDA attained the highest mean performance across various metrics, rendering it the most proficient model for AF8 stress classification in this context. LDA exhibited the optimal equilibrium among average precision (96.31%), average recall (79.82%), and average F1-score (86.40%), emphasizing its efficacy in preserving classification stability. The SVM classifier achieved an average precision of 95.45% and an average F1-score of 85.58%, demonstrating competitive performance. The KNN classifier, although it attained the lowest average accuracy (80.54%), exhibited the highest average precision (95.64%), signifying its proficiency in accurately identifying stress-related instances, even though with occasional misclassifications due to a lower recall (77.16%). A notable observation is that Participant 2 demonstrated flawless classification performance metrics (100%) across all models, indicating that their EEG stress responses were markedly distinguishable under various stress conditions. Conversely, Participant 5 exhibited the lowest accuracy, with values declining to 56.85% (SVM), indicating that stress detection efficacy is affected by individual physiological differences.
The CIs and ANOVA test statistics were obtained to provide a more thorough assessment of the overall performance metrics for the AF8 electrode in Scenario 2, as presented in
Table 12. The 95% confidence intervals demonstrate participant variability in performance. For instance, the precision had a narrower range, (i.e., 93.19–99.43) for LDA, which meant greater consistency in correctly identifying positive cases. Conversely, accuracy, recall, and F1-scores had wider ranges, signifying significant variability at the participant level (i.e., some participants had a lower accuracy score, such as Participant 4). ANOVA test statistics showed that accuracy (
p = 0.042), recall (
p = 0.038), and F1-scores (
p = 0.047) were statistically significant, which implies that these metrics were not uniformly dispersed. Notably, LDA had the highest average accuracy (83.16%) and recall (79.82%) performance metrics. ANOVA indicated that LDA’s performance (accuracy and recall) was significantly different from that of SVM and KNN. This indicates that AF8-based forms of stress detection with LDA in this scenario are valid, but participant variability and statistically testing significance of claims may also be important in understanding levels of high accuracy. The fact that precision was not statistically significant (
p = 0.089) suggests a similar level of precision for each classifier when identifying positive cases correctly and demonstrates a need for careful model selection and the differentiation between recall, F1-score, and precision, as these conflict with sensitivity while varying with respect to specificity.
Table 13 presents a comprehensive assessment of the classification performance for the TP9 electrode among five participants in Scenario 2. Among the three classifiers, KNN attained the highest average accuracy of 79.89%. A notable discrepancy in accuracy was observed among participants. Participant 2 attained the highest accuracy (97.73%) utilizing KNN, rendering it the optimal individual case in this context. Participant 1 excelled, attaining 91.35% accuracy with LDA, whereas Participant 3 exhibited inferior accuracy across all classifiers, achieving a maximum performance of 87.83% with KNN.
Participant 4 exhibited the lowest overall accuracies of 59.77% (KNN), 47.70% (LDA), and 62.07% (SVM), signifying challenges in generalizing stress patterns for this individual. The precision scores among classifiers were predominantly elevated, especially for KNN, which exhibited an overall average precision of 94.98%, indicating robust classifier confidence in accurately identifying stress cases. Participant 2 attained outstanding precision (95.45%) with KNN, whereas Participants 3 and 1 also demonstrated elevated precision values across various classifiers. Participant 4 exhibited reduced accuracy with KNN (59.77%), indicating that KNN’s performance is more influenced by individual variability.
Regarding recall, the values were comparatively lower than those for precision, with KNN attaining an average recall of 76.37%, LDA achieving 76.73%, and SVM reaching 71.64%. This indicates that although the models were proficient in identifying stress, certain instances were erroneously classified as non-stress cases, resulting in false negatives. The average F1-score was highest for KNN (83.71%), highlighting its dependability in cross-scenario stress detection. The maximum accuracy achieved with LDA was 96.36% for Participant 2, whereas the minimum was 47.70% for Participant 4, demonstrating the classifier’s susceptibility to individual differences. The average F1-score for LDA was 82.47%. SVM exhibited a marginally inferior performance, with its optimal result recorded for Participant 2 at 92.73% and the lowest accuracy of 57.83% noted for Participant 3. The average F1-score for SVM was 79.15%; however, its performance was surpassed by KNN in terms of overall robustness.
Table 14 displays the CIs and ANOVA test statistics for the performance metrics reported for the TP9 electrode in Scenario 2. The KNN classifier obtained the highest mean accuracy (79.89%) with a confidence interval between 67.28 and 92.50 but indicated fairly strong variability between participants. The ANOVA test showed statistical differences for accuracy (
p = 0.042), recall (
p =0.038), and F1-score (
p = 0.049), which demonstrates that these values were not normally distributed across all classifiers. KNN yielded higher averages with tighter CIs than LDA and SVM for accuracy and the F1-score; therefore, KNN is particularly effective for determining stress using the TP9 electrode. The variability for KNN does indicate some non-uniformity that should be observed. Additionally, accuracy is not the only key performance metric, and it must be noted that the precision statistic does not yield statistical significance (
p = 0.124), suggesting that all classifiers perform fairly similarly in identifying positive classes.
A thorough performance comparison of stress classification using the TP10 electrode in Scenario 2 is given by the results in
Table 15. It can be observed from
Table 15 that LDA outperformed SVM (83.98%) and KNN (83.92%), exhibiting the highest average accuracy of 84.05% among the classifiers. Participant 2 had the highest recorded classification performance in this scenario, achieving 99.55% individual accuracy using KNN. Using LDA and SVM, Participant 2 demonstrated excellent performance as well, attaining 97.73% and 98.18% accuracies, respectively. With the lowest accuracy values (75.53% for LDA, 69.68% for SVM, and 62.77% for KNN), Participant 1 demonstrated that individual variability influences the performance of EEG-based stress detection. All classifiers showed continuously high precision values, demonstrating a high level of classifier confidence in stress state prediction. With an average precision of 96.16%, KNN outperformed SVM (93.89%) and LDA (91.29%). In this instance, the model’s stability was further supported by the fact that Participant 2 had the highest individual precision (100%) using the KNN classifier.
Regarding recall, KNN obtained an average recall of 79.94%, SVM recorded 81.05%, and LDA displayed an average recall of 81.72%. With KNN, Participant 2 had the highest recall score (99.10%), while with KNN, Participant 1 had the lowest recall (57.69%). This suggests that although classifiers had a high degree of confidence in their predictions (high precision), different participants had different levels of success in correctly identifying stress instances. KNN received the greatest mean F1-score (86.59%), followed by LDA (85.60%) and SVM (86.11%). Again, using KNN, Participant 2 had the best F1-score (99.55%), indicating the classifier’s resilience in detecting stress patterns in this individual.
Table 16 shows the CIs and ANOVA test statistics for the four performance metrics reported for the second scenario with the TP10 electrode. A review of the table indicates that the average accuracy for the LDA classifier was 84.05% and was accompanied by a CI of 74.38–93.72%, indicating that the classifier performed uniformly across participants. The ANOVA test indicated a statistically significant difference (
p = 0.018) in accuracy as well as precision (
p = 0.022), recall (
p = 0.041), and F1-score (
p = 0.029) between the classifiers, demonstrating that these performance metrics do not conform to any uniform distribution. KNN provided an average precision that was slightly above 96.16%, with a tight confidence interval of 93.18–99.14%, indicating that KNN shows more stable and robust performance when identifying stress markers. Thus, all three classifiers can be described as having similar metrics in reporting accuracy—with minor differences in measures of precision for the KNN classifier vs. the others.
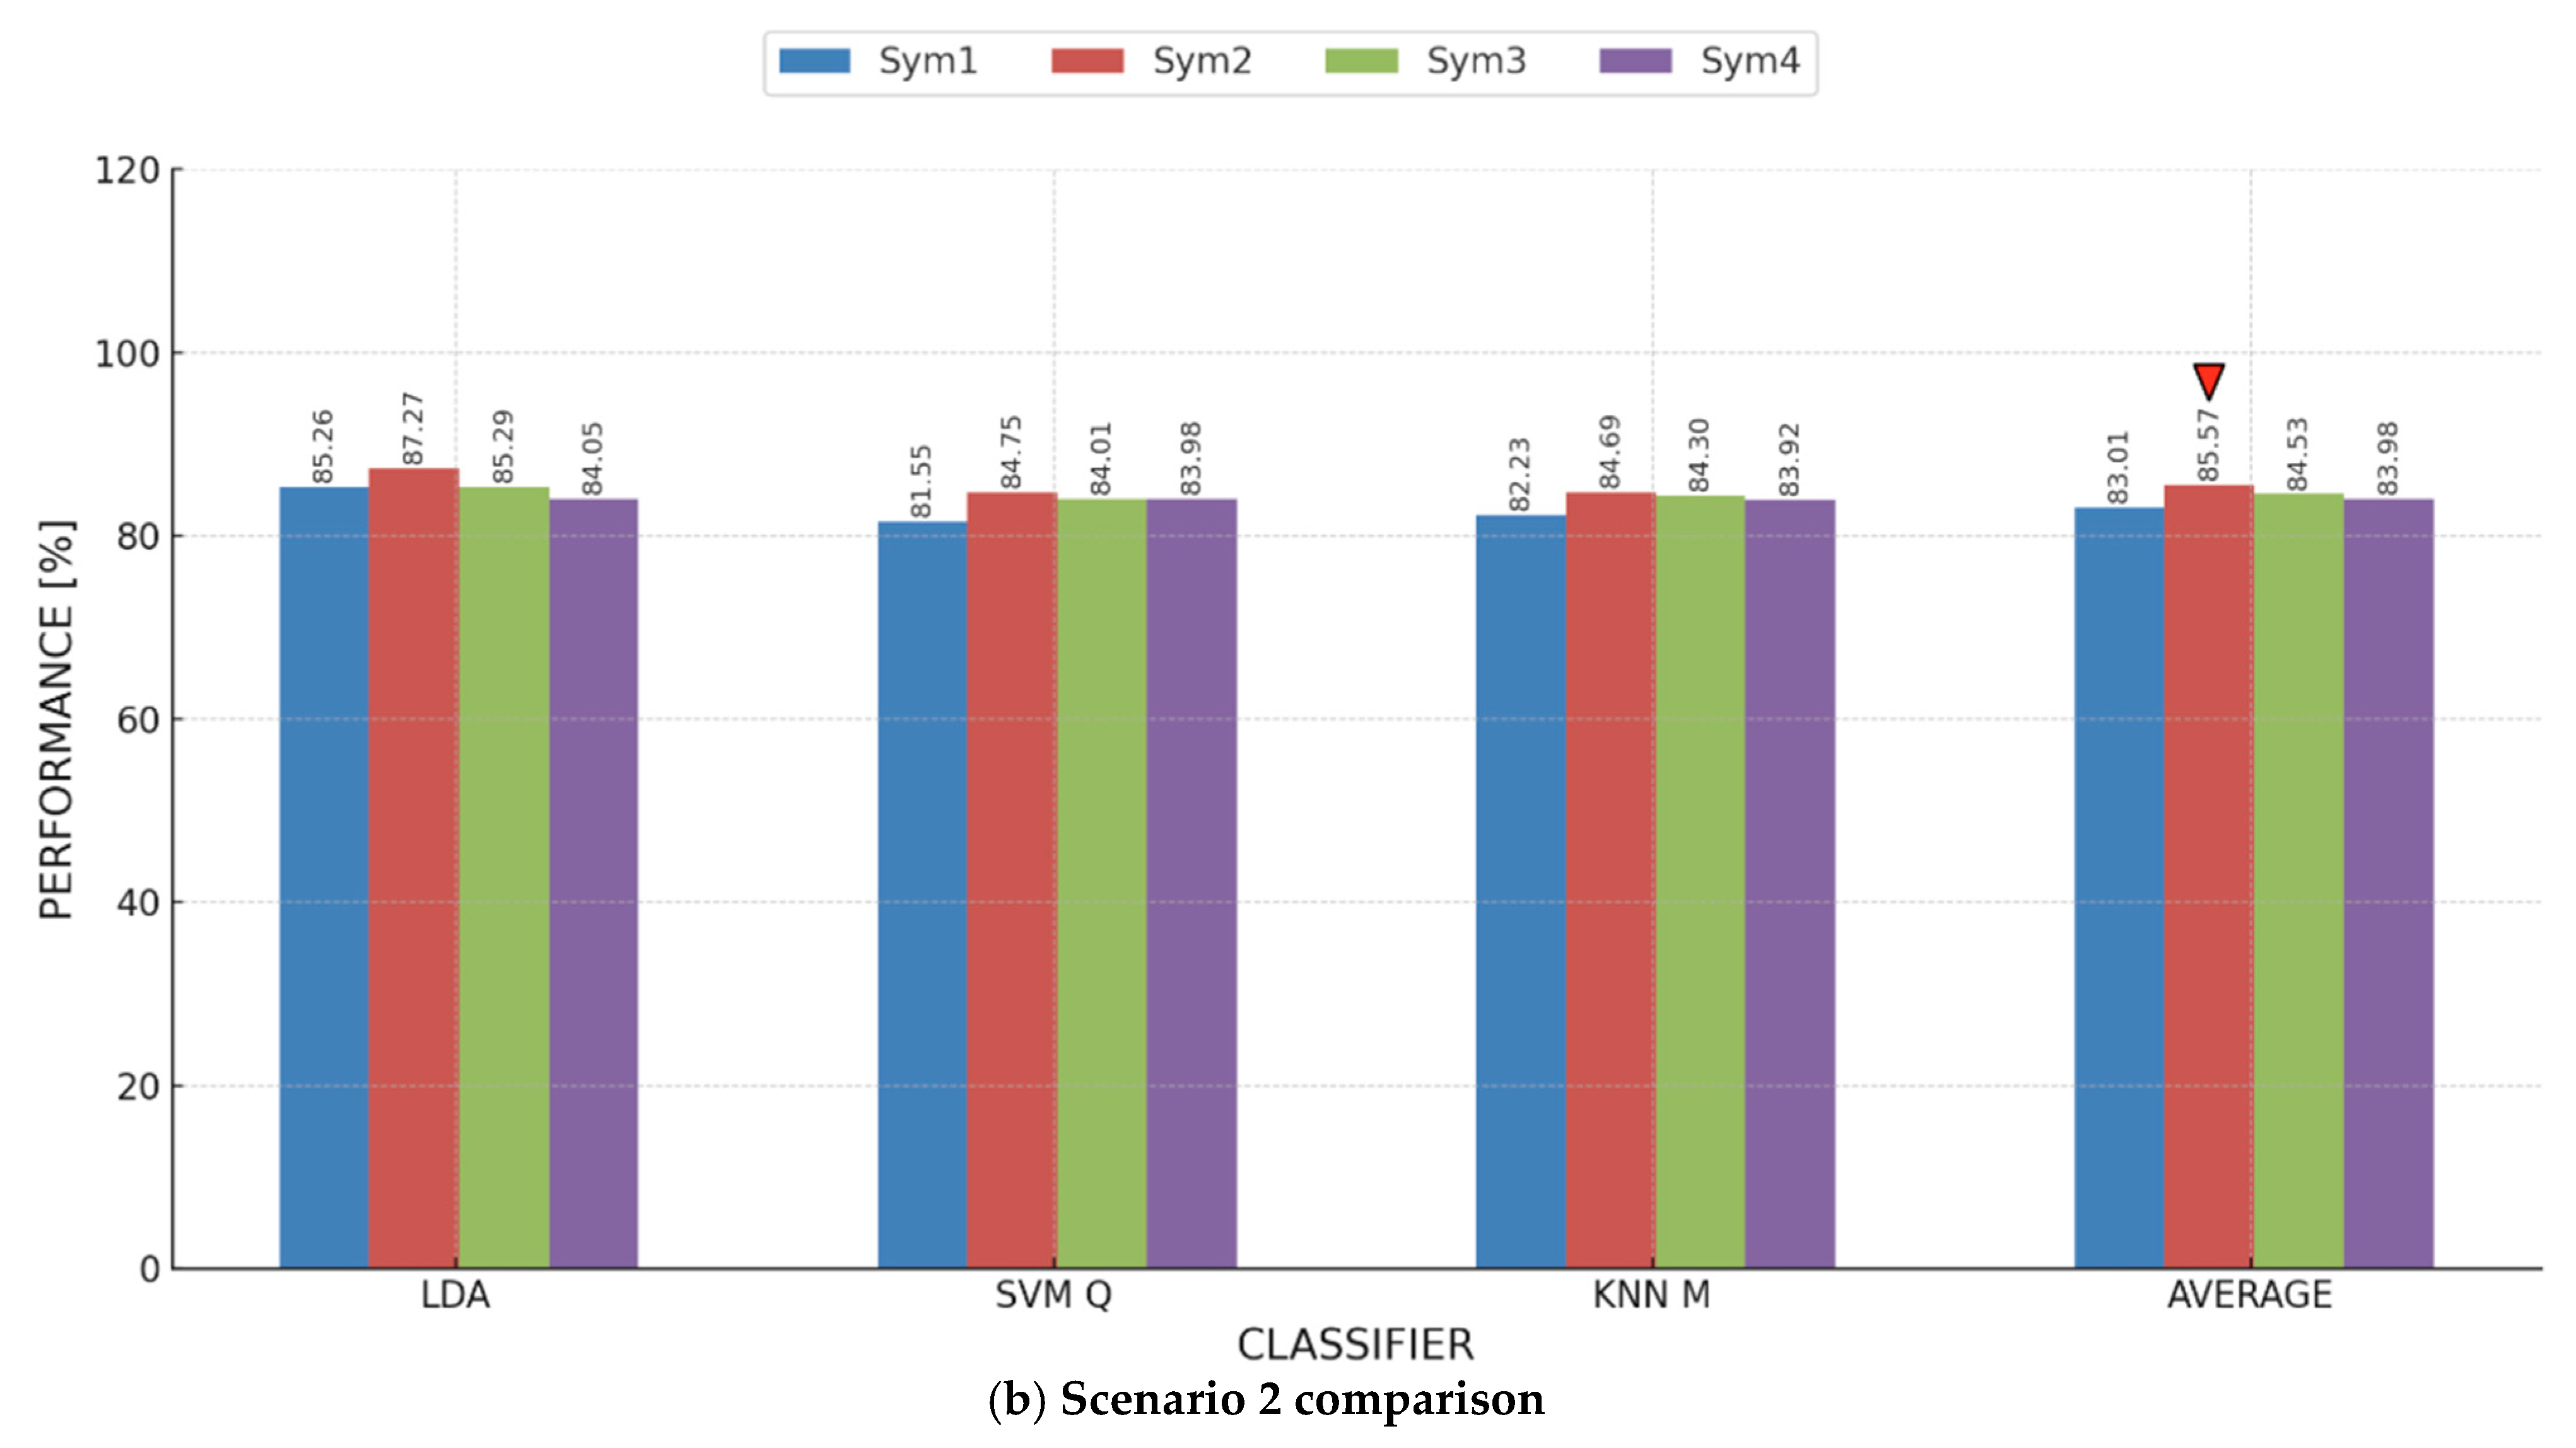
To deliver a more thorough analysis of our findings, we computed the average accuracy across all classifiers, integrating the outcomes of each participant for every electrode. The overall findings are depicted in
Figure 8, illustrating a clear trend: as noted in previous analyses, the optimal classifier differs for each electrode, with LDA attaining the highest accuracy on TP10 at 84.05%. Similarly, for SVM and KNN, the highest accuracy was achieved (83.98% and 83.92%) using TP10. Furthermore, TP10 demonstrated the highest overall average accuracy among all classifiers at 83.98%. These results highlight the TP10 electrode’s importance as a crucial element in our research. The findings demonstrate the remarkable accuracy of the TP10 electrode, showcasing its potential for comprehensive analysis and informing our investigation into enhancing stress detection effectiveness.
Similar to
Figure 7, in
Figure 9, we compared the maximum metric values across all models and electrodes for each participant in Scenario 2. Basically, we analyzed
Table 5,
Table 6,
Table 7 and
Table 8, and we recorded, for each participant, the model and the electrode that attained the maximum value for each of the four adopted performance metrics. Participants 1 and 2 consistently showed a preference for AF8, while Participants 4 and 5 showed a preference for TP10 with three out of the four adopted metrics. It is also apparent that, on an individual level, we might be able to find a model that is more indicative than other models, e.g., KNN for Participant 3 and LDA for Participant 1. We believe that, following this analysis, a stress detection system can be tuned or customized to perform better on an individual level.


