1. Introduction
False information is intentionally crafted to captivate users, who often disseminate it rapidly within their social circles. Despite being refuted by official sources, misinformation can propagate swiftly and gain widespread acceptance. Numerous studies have shown that false news spreads significantly faster than reliable information [
1]. A notable example is the 2016 U.S. presidential election, during which over 37 million social media users shared at least 529 false news articles related to the election [
2]. These narratives were embraced by segments of the population, exerting tangible social and political effects both during and after the election.
More recently, the COVID-19 pandemic highlighted the devastating impact of misinformation, with numerous false narratives concerning counterfeit medications and unverified prescriptions causing widespread misinformation [
3]. Tragically, some of these narratives resulted in fatalities; for instance, the erroneous belief that consuming alcohol could cure COVID-19 led to over 800 deaths in Iran [
4]. Such examples underscore the heightened vulnerability of individuals to false information during crises [
5].
Over the years, significant research efforts have been devoted to detecting fake news. Early approaches primarily relied on conventional techniques such as text processing [
6,
7,
8]. However, the exponential growth of social media usage, coupled with advances in machine learning and deep learning, has shifted the focus toward more sophisticated methods [
9]. These advancements have facilitated the development of robust approaches capable of handling the growing complexity and volume of social media data.
Fake news detection strategies can be broadly categorized into two main approaches. The first focuses on unimodal detection, which analyzes a single modality, such as text [
10,
11], images [
12,
13], or videos [
14,
15]. The second centers on multimodal approaches, which integrate multiple modalities (e.g., text, images, social context) and have demonstrated superior accuracy, owing to the inherently multimodal nature of social media posts [
16].
For example, Chandrakant et al. [
17] proposed a cooperative deep learning model combining text and images for fake news detection in online social networks. Their method incorporated user feedback to estimate trust levels and used a VGG-16 convolutional neural network (CNN) to achieve performance improvements of 10–15% over Naive Bayes and SVM classifiers. Similarly, Galli et al. [
18] analyzed various machine learning and deep learning models for fake news detection, evaluating strategies that achieved up to 76.5% accuracy through a multimodal approach combining text and image features. Additionally, Bondielli et al. [
19] introduced a multimodal strategy that explored image–text relationships, achieving 76% accuracy by integrating text and image classifiers.
Building on recent advancements, this research focuses on detecting fake news on the social media platform X (formerly Twitter) by leveraging a diverse set of deep learning and machine learning techniques. The key innovations and contributions of this study are summarized as follows:
A novel three-dimensional multimodal fusion approach: this approach integrates textual, visual, and social context features to enhance the detection of fake news on X, addressing the critical need for comprehensive feature representation in fake news analysis where different modalities may contain complementary deception cues.
Advanced ViLBERT-Multi-Task model: this vision–language transformer model is particularly suited for our task as it simultaneously processes text and images through co-attentional layers, capturing nuanced cross-modal relationships essential for identifying inconsistencies between visual content and textual claims, a common characteristic of fake news.
Addressing class imbalance: the synthetic minority over-sampling technique (SMOTE) is employed to counteract the natural skew in social media datasets where genuine content typically dominates, preventing model bias toward majority classes and improving detection of deceptive content.
Comprehensive evaluation: extensive experiments are conducted to demonstrate the efficacy of the proposed solution.
In summary, the core innovations lie in the design of multimodal architecture leveraging the ViLBERT-Multi-Task model, the adoption of data augmentation strategies to handle imbalance, and the superior performance achieved by the proposed models that incorporating social context.
The remainder of this paper is organized as follows:
Section 2 reviews related work on fake news detection approaches.
Section 3 details the proposed methodology, including multimodal architecture, feature extraction, data augmentation techniques, and classification models.
Section 4 describes the experimental setup, including datasets, evaluation metrics, and implementation details.
Section 5 analyzes the results, compares the proposed models to state-of-the-art methods, and discusses key findings. Finally,
Section 6 concludes the paper and outlines potential future directions.
2. Related Work
Existing research on fake news detection primarily follows two methodological approaches: unimodal and multimodal analysis. Unimodal approaches analyze a single data modality, such as text, images, or videos [
20,
21], while multimodal approaches combine two or more modalities [
22,
23], demonstrating superior detection accuracy through cross-modal feature fusion. A specific subset of fake news, known as deepfakes, has also gained significant attention. These synthetic media involve AI-generated manipulation of videos [
23,
24] through altered images or audio elements to create realistic but misleading content [
25], The detection of sophisticated forgeries has evolved into a specialized research domain [
26,
27], requiring advanced multimodal analysis techniques to identify subtle artifacts across different media types.
2.1. Unimodal Fake News Detection
Unimodal fake news detection approaches focus on a single data modality. This can include textual content, visual features, or social context.
2.1.1. Fake News Detection Using Textual Features
Text analysis remains the most widely studied modality for fake news detection [
28], leveraging statistical and semantic features to assess authenticity from textual data. For instance, Patwa et al. [
4] developed a model for detecting COVID-19-related fake news using tweets. They employed the TF-IDF method for feature extraction and evaluated four machine learning models (SVM, decision tree, logistic regression, and gradient boosting) to classify tweets as fake or genuine.
Similarly, Bangyal et al. [
29] utilized deep learning models, including CNN, LSTM, RNN, and GRU, to classify fake news. These models outperformed traditional methods like K-NN, decision trees, and logistic regression on the COVID Fake News Dataset. Abdelminaam et al. [
30] further extended this research with LSTM and GRU-based models trained on the CoAID dataset [
31]. Meanwhile, Kaliyar et al. [
32] proposed two architectures: a convolutional LSTM (C-LSTM) and a multichannel convolutional neural network (MCNN) [
33]. Other notable contributions include Alenezi and Alqenaei’s [
34] hybrid K-NN, LSTM, and MC-CNN models, as well as Alouffi et al.’s [
35] CNN-LSTM framework.
2.1.2. Fake News Detection Using Visual Features
Visual content often garners more attention than text and is frequently manipulated to spread false information [
36]. Fake news creators may alter images or use genuine visuals in misleading contexts [
37]. Existing research on detecting fake news through visual features faces challenges in addressing the vast volume of user-shared data [
38]. One prominent technique employed in creating fake news with images involves face replacement [
39].
Zhang et al. [
40] developed a model to detect face-swapping manipulations using bag-of-words features and SVMs [
41]. However, the emergence of generative adversarial networks (GANs) has made detecting deepfakes increasingly difficult. Hsu et al. [
42] addressed this with their common fake feature network (CFFN), which employs CNNs for classification but struggles with unseen datasets. Gandhi and Jain [
43] proposed the deep image prior (DIP) model, based on ResNet, for improved visual feature classification.
2.1.3. Fake News Detection Using Social Media Context
Social media context leverages user-related behavioral data and preferences. The credibility of users can be influenced by factors such as the status of their profile (e.g., verified account, update frequency) and their social reputation [
44,
45]. Social reputation comprises metrics that reflect user behavior, including metrics such as retweets, friends, and followers numbers, posts and comments numbers, hashtags usage (#), and inclusion of URLs.
The social media context is utilized to detect abnormal profiles or patterns that increase the likelihood of classifying news as fake from specific users. For example, Gupta et al. [
46] analyzed social media data using graph propagation techniques and decision trees to identify fake images during Hurricane Sandy in 2012.
In a similar vein, Jin et al. [
47,
48] focused on leveraging social media context to detect fake news by using propagation graphs for credibility analysis, demonstrating that graph optimization (accuracy: 86%) outperformed decision trees (accuracy: 72%).
2.2. Multimodal Fake News Detection
Multimodal fake news detection involves the fusion of two or more modalities [
49]. This approach aims to leverage multiple sources of information to enhance the accuracy of detection.
2.2.1. Fake News Detection Based on Textual and Visual Features
Kar et al. [
50] proposed three multilingual models for detecting fake news on the X social media network using text and images. The first model utilized BERT for English tweets, while the second and third models employed an adapted version of BERT called mBERT for English, Hindi, and Bengali languages [
51]. Serrano et al. [
52] presented a model for detecting fake news related to COVID-19 using videos and comments extracted from YouTube. They employed TF-IDF and a variant of BERT called RoBERTa [
53] on the first hundred comments to develop a multimodal model. Zhang et al. [
54] utilized a neural network-based model called “FAKEDETECTOR” to detect fake news on the PolitiFact dataset. However, their framework achieved a relatively lower accuracy (63%) compared to other research works.
2.2.2. Fake News Detection Based on Textual Features and Media Social Context
One of the notable research works in the field of text and image-based fake news detection is the TI-CNN (text and image-based convolutional neural network) model proposed by Yang et al. [
55]. The authors conducted experiments by separately training CNN models on text and image data.
Singhal et al. [
56] proposed the “SpotFake+” model. The authors extract and classify multimodal news based on semantic and contextual features of text and images. In another study, Khattar et al. [
57] introduced a multi-variation auto-encoder (MVAC) to learn a shared representation of text and images with correlation on the social media platform. Wang et al. [
58] proposed the event adversarial neural network (EANN) model, which consists of three components: a multimodal feature extractor, a fake news detector, and an event discriminator. The purpose of this model is to generalize from a specific event and make it applicable to similar events. For instance, a model trained on the COVID-19 pandemic could be adapted to other types of pandemics.
Cheema et al. [
59] introduced a model based on ViLBERT [
60] for detecting fake news on Twitter. ViLBERT incorporates fused attention mechanisms for text and image features. However, a major drawback of this work is the utilization of an unbalanced training set, which may introduce data bias.
Lastly, Madani et al. [
61] proposed a framework for detecting COVID-19-related fake news on Twitter. The authors extract the social context of tweets and use the “TextBlob” library to extract text features attention. They employed five classifiers (NB, RF, SVM, LoR, and MLP) to determine the authenticity of the tweets.
2.2.3. Fake News Detection Based on Textual, Visual, and Media Social Context Features
At the time of writing this research paper, only a limited number of studies have been published focusing on multimodal fake news detection utilizing more than two modalities. One notable paper in this area is by Jin et al. [
48]. The authors employed text, image, and social context modalities to detect fake news. Their proposed model was based on various variants of recurrent neural networks (RNNs). Through experiments conducted on the Twitter and Weibo datasets, it was observed that the model based on att-RNN (attention-based RNN) achieved the highest performance, with an accuracy of 68% on the X dataset and 78% for Weibo dataset, respectively.
While these foundational studies demonstrate the potential of multimodal approaches, our work advances this research direction by developing a comprehensive methodological framework that systematically integrates and evaluates all three modalities (text, visual, and social context) through rigorous experimentation. The proposed methodology and experiments are detailed as follows.
3. Methodology
The objective of this work is to classify tweets as either genuine or fake by leveraging a multimodal approach that integrates textual, visual, and social context features. This section formalizes the problem and outlines the proposed fake news detection method.
3.1. Problem Formulation
To represent multimodal information, a tuple e = (T, V, S) is defined, where T, V, and S denote the textual, visual, and social context features, respectively.
Let E = {, , …, , …, } represents a collection of n tweet features.
The task of fake news detection is formulated as an inference problem, where genuine tweets have a higher credibility compared to fake ones.
The aim is to predict, for each tweet
∊ E, whether it is fake or genuine. To achieve this, a set
Y is defined to represent the classification labels:
If is equals to 0 then is classified as fake news; otherwise, it is considered genuine news.
Each tweet is represented as a tuple of features where each element represents the features of the three modalities studied: text, visual, and social context.
The dataset
X is defined as set of tweet features
The function . represents a function that extracts the textual and visual features from tweet . Where the features of modalities K and L of tweet , are defined as k, l ∊ {}, k ≠ l and .
represents a function that extracts a social media feature from tweet . = . is defined as the features of the social context modality of tweet .
Feature fusion is achieved using a function
c, which combines
into a unified representation:
The final classification is performed using a binary classifier f, which predicts yi based on Xi.
The mathematical representation of the problem is as follows:
Then
f: →∊ Y 3.2. Proposed Fake News Detection Method
Tweets typically consist of text and optionally include an image or video. To determine the authenticity of a tweet, it is essential to consider whole information including text and the associated image, as well as the social context surrounding it. This social context includes factors such as the user’s profile, update status, social reputation, geolocation, and the context in which the tweet was published.
For example, the social reputation of a user can be evaluated based on various metrics, such as the number of tweets, retweets, friends, and followers they have, as well as the frequency of publishing or retweeting.
By considering both the textual content, image, and the social context, it becomes more possible to effectively verify the reliability of a tweet and determine its authenticity [
61].
The ViLBERT model [
60] is employed for extracting fused attention features from both the text
and images
). This process is represented as the function
where
k∊ {T, V} and
k ≠ 1.
As shown in
Figure 1, the proposed fake news detection process consists of five stages, which are described as follows:
Feature selection of the tweet: this stage involves extracting features from the tweet based on three modalities: text (), images (), and the structured features of the social context ().
Preprocessing of the features: the features obtained in the previous stage undergo preprocessing to extract the attention of both the text and images using the ViLBERT model . Additionally, the structured features of the social context are extracted = . The result of this stage is a tuple Xi = .
Features extraction: this stage involves further extracting features from a tuple Xi obtained in the previous stage.
Fusion of the obtained features: the features extracted in the previous stage are fused together using the function Xi = c .
Binary classification: in this final stage, a binary classification is performed on the obtained fused features (Xi) using a predefined classifier. This classification determines whether the tweet is fake or genuine.
These five stages together constitute the process of detecting fake news.
4. Materials and Methods
Fake news has emerged as a prominent challenge in contemporary society [
62,
63,
64]. Major events such as the U.S. presidential election or the COVID-19 pandemic have generated a significant amount of fake news [
65,
66,
67]. Given the abundance of fake news on the internet, those related to the COVID-19 pandemic on the X social media platform are chosen as a case of study. Two datasets, LESA and MediaEval COVID-19, are selected for the experiments.
The experiments were conducted using the Colab-Pro environment, which provides 35 GB of RAM. To implement the research environment, a well-defined workflow was established, as illustrated in
Figure 2.
The LESA COVID-19 dataset consists of 1340 tweets, of which 83% are classified as genuine and 17% as fake. The MediaEval COVID-19 dataset contains 1725 tweets, of which 72% are classified as genuine and 28% as fake.
4.1. Data Preprocessing
During the preprocessing stage, two main components were performed: textual data cleaning and visual feature extraction. Each component follows a rigorous methodology to ensure optimal feature representation for subsequent multimodal fusion.
4.1.1. Text Preprocessing
First, text preprocessing involved removing URLs, hashtags, and user mentions. Next, the BERT Tokenizer function was employed to tokenize the cleaned text into a sequence of tokens. Subsequently, token embeddings, segment embeddings, and positional embeddings were generated using the “tokenize()” function preparing the text for feature extraction via the BERT model. The textual preprocessing pipeline involves the following sequential steps:
Removal of all URLs using regular expression matching
Elimination of social media-specific markers including:
- ▪
Hashtags (#) denoting topics or categories
- ▪
User mentions (@) referencing other accounts
Standardization of Unicode characters and normalization of text encoding
- 2.
Tokenization and Sequence Construction:
Application of the BERT Tokenizer (WordPiece algorithm) to decompose text into subword tokens
Generation of a structured input sequence comprising:
- ▪
Classification token at sequence starts
- ▪
Tokenized text content
- ▪
Separator token as sequence separator
Padding/truncation to maintain uniform sequence length (typically 512 tokens)
Token embeddings: vector representations of each sub-word unit
Segment embeddings: identification of sequence membership
Positional embeddings: encoding of token order information using sinusoidal functions
4.1.2. Visual Feature Preprocessing
Regarding the image modality, region extraction is performed using Faster R-CNN, which is based on the ResNeXt-152 architecture and trained on the Visual Genome dataset. If no objects were detected in an image, features were extracted from the entire image using ResNet-152, treating it as a single region.
This dual approach enabled the capture of relevant visual features from both object-rich and object-sparse images, ensuring robust feature extraction. Combining Faster R-CNN and ResNet-152 ensures a robust feature extraction pipeline, enhancing image–text fusion for analysis. Visual preprocessing employs a hierarchical approach:
- 1.
Region-Based Feature Extraction:
Utilization of Faster R-CNN with ResNeXt-152 backbone
Pretrained on Visual Genome dataset (1600 object categories)
Region proposal network generates candidate regions of interest
Feature extraction from each region of interest (2048-dimensional vectors)
Confidence thresholding (p > 0.7) for reliable object detection
- 2.
Whole-Image Fallback Processing:
Activation when no objects meet confidence thresholds
Global feature extraction using ResNet-152
Produces single 2048-dimensional feature vector
Spatial coordinates set to full image dimensions
- 3.
Feature Representation:
Region features concatenated with normalized spatial coordinates (4D: x_min, y_min, x_max, y_max)
Sequence initialization with image special token
Maximum of 36 regions retained (standard ViLBERT input size)
Padding with zero vectors for images with fewer detected regions
This dual-path architecture ensures comprehensive visual representation, capturing both localized object features and global image characteristics. The extracted features maintain spatial relationships while being optimized for attention mechanisms in subsequent processing stages.
4.2. Parallel Extraction of Text and Image Features
Once the textual and visual features have been preprocessed and structured, the next step involves their joint extraction and representation to enable effective multimodal learning. To achieve this, we leverage the ViLBERT-Multi-Task model, which processes both modalities in parallel. Textual and visual features were extracted in parallel using the ViLBERT-Multi-Task model [
60], which has been pretrained on 12 datasets corresponding to various tasks. Preprocessed text and image features were fed into this model, resulting in two 1024-dimensional feature vectors representing the textual and visual information, respectively.
The preprocessing outputs are structured as parallel sequences of textual and visual tokens, properly formatted for input to the ViLBERT model’s multimodal attention layers. This rigorous preparation enables effective cross-modal feature fusion and relationship learning during model training and inference.
4.3. Features Fusion
In this stage, feature fusion was achieved by concatenating feature vectors from the three modalities: text, image, and social context. Assume the dataset of tweets contains N tweets and given that textual and visual features extracted in the previous stage are represented by 1024-element vectors. These vectors are concatenated to form a matrix of textual features with N rows and 1024 columns.
A matrix of visual features with the same dimensions is created by the same process. A matrix of social context features with N rows and 5 columns (representing five previously selected social context features) is also generated.
Finally, the concatenation of the three matrices produced a unified dataset of N×2053, encapsulating the multimodal information for subsequent analysis and classification.
4.4. Data Augmentation
Both LESA and MediaEval datasets exhibited a significant class imbalance, with genuine tweets outnumbering fake ones. This imbalance can lead to machine learning models favoring the majority class over the minority class, potentially compromising the model’s performance. To address this issue, the synthetic minority oversampling technique (SMOTE) [
68] was applied for data augmentation of the fake news class.
SMOTE generates synthetic samples for the minority class by interpolating existing samples based on k-nearest neighbors (K-NN).
Several variants of SMOTE were explored to enhance data augmentation, including borderline-SMOTE [
69], SVM-SMOTE [
70], and adaptive synthetic sampling (ADASYN) [
71], were also explored to enhance data augmentation.
4.5. Classification Models
In the final stage, three classifiers were implemented to classify tweets as genuine or fake.
4.5.1. Support Vector Machine (SVM) Classifiers
The SVM is a well-suited classification method for datasets with a relatively small size and a large number of features. The “C” and “γ” parameters of SVM help in mitigating the overfitting issues. The ThunderSVM library was employed, utilizing the RBF (radial basis function) kernel, which is suitable for handling complex data. The “C” parameter was chosen from the interval [0.01, 100], and the “γ” parameter was selected from the interval [0.01, 10]. To avoid overfitting, dimension reduction was applied using principal component analysis (PCA). A grid search cross-validation algorithm was employed to find the optimal values for “C” and “γ”.
Additionally, a 5-fold cross-validation was conducted on the training set using the KFold function. This experiment allows users to obtain the best validation score, the optimal model, and the number of principal components.
4.5.2. Feedforward Neural Network (FNN) Classifier
The FNN was implemented using the Keras Sequential API with TensorFlow. FNN is an artificial neural network with forward propagation, well-suited for handling complex data. The hyperparameter intervals were initialized, including 2053 input layer neurons, multiple hidden layers with varying neurons, activation functions, optimizers, and dropout rates. As shown in
Table 1, to obtain the optimal FNN architecture and hyperparameters that maximize the model’s score, early stopping callbacks were utilized to prevent overfitting.
4.5.3. One-Dimensional Convolutional Neural Network (CNN-1D) Classifier
The second implemented deep learning classifier was CNN-1D. This classifier was selected due to its excellent performance in dimension reduction using convolutional layers and max-pooling, which helps to mitigate overfitting. CNN-1D operates exclusively with one-dimensional convolutional layers, which aligns perfectly with the used dataset’s structure (1, 2053).
In implementing CNN-1D, a similar approach to the FNN-based model was followed, utilizing the sequential method from Keras Sequential API. The model was designed to reduce dimensionality through convolutional layers, max-pooling layers, and dropout layers to preserve critical features. However, in CNN-1D, only one flatten layer and one dense layer were utilized. The Adamax optimizer, the binary_crossentropy loss function, and the ReLU activation function were employed.
To address overfitting concerns, the “L2” regularization function was incorporated and an early stopping callback function was applied.
The architecture of CNN-1D model is detailed in
Table 2. Through this design, the purpose is to leverage the strengths of CNN-1D to effectively reduce dimensionality and capture relevant features in the data while ensuring the model’s generalization and robustness through regularization techniques and early stopping.
In conclusion, the performances of SVM, FNN, and CNN-1D classifiers were compared to determine which one delivers the best results. The classification models were carefully fine-tuned using appropriate hyperparameters and techniques to avoid overfitting and ensure reliable performance on the binary classification task.
5. Experimental Evaluation
The experimental evaluation was conducted to demonstrate the effectiveness of incorporating social context features in improving fake news detection. The experiments were performed on the LESA and MediaEval datasets, with models evaluated using balanced accuracy, F1-score, G-Mean, and ROC-AUC, among other metrics. Balanced accuracy was emphasized due to the imbalanced nature of the datasets, as it provides a more reliable measure than accuracy for such cases.
The experiments were structured to compare models with and without social context features, as well as to assess the impact of data augmentation. The configurations included tests using two modalities (text and image) and three modalities (text, image, and social context), both with and without data augmentation techniques such as SMOTE, ADASYN, and SVM-SMOTE.
Results were compared with those reported in the literature to critically analyze the performance of the proposed models and identify areas for potential improvement.
Six tests were performed to evaluate the impact of modalities and data augmentation techniques:
Test N°1: utilizing only two modalities, text and image (T + V), without any augmentation.
Test N°2: incorporating three modalities, text, image, and social context (T + V + S), without any augmentation.
Test N°3: incorporating three modalities, text, image, and social context (T + V + S), with data augmentation using ADASYN.
Test N°4: incorporating three modalities, text, image, and social context (T + V + S), with data augmentation using Borderline-SMOTE.
Test N°5: incorporating three modalities, text, image, and social context (T + V + S), with data augmentation using SMOTE.
Test N°6: incorporating three modalities, text, image, and social context (T + V + S), with data augmentation using SVM-SMOTE.
5.1. Models Experiments with SVM Based Model Classifier
For the SVM-based model, the optimal values of “C” and “γ” were searched that strike a balance between bias and variance to achieve the best performance on the given datasets. The results were obtained with various values of “C” and “γ” among these values:
The purpose is to find a compromise between underfitting and overfitting to ensure that the SVM model generalizes well to unseen data while effectively capturing patterns in the training set.
The obtained results indicate that the hyperparameter “γ” increases in each test, leading to the model gradually converging toward the optimal values. When “γ” has small values, the implemented model behaves similarly to a linear model. However, the impact of the “C” parameter becomes less significant with larger values of “γ”.
The largest value of “γ” was used in the test results in a narrow decision boundary, indicating overfitting. This is supported by the training AUC of 0.984, while the model struggles to generalize to the test set, as indicated by the AUC of 0.545.
It is important to note that small values of “C” do not necessarily imply a better decision boundary or a good model. The optimal values for “C” and “γ” depend on the complexity of the dataset, the number of features, and the presence of fuzzy tweets that cannot be easily classified as genuine or fake. The best model is one that can generalize well across multiple datasets, rather than having the best performance on a single dataset but poor performance on others.
In conclusion, the values obtained with C = 1.25 and γ = 0.25 (
Figure 3) are likely the best choices for the proposed model, as they strike a balance between bias and variance, allowing for effective generalization and performance on various datasets. It is important to consider the trade-off between overfitting and underfitting while selecting the optimal hyperparameters for the SVM model.
The results obtained from the six tests using optimal SVM parameters are presented in
Table 3.
Figure 4,
Figure 5,
Figure 6,
Figure 7,
Figure 8 and
Figure 9 illustrate ROC curves for the six tests on LESA dataset (note that the dotted line in all the following figures represents the bisector of the quadrant.).
Figure 4 is the ROC curve associated with the SVM model using the optimal hyperparameters C = 1.25 and γ = 0.25, as determined in previous experiments (
Figure 3). The training AUC (area under the ROC curve) is calculated to be 0.779, while the test AUC is measured at 0.749. These AUC values are considered optimal based on experimental evaluations.
The ROC curve provides valuable insights into the model’s performance by plotting the true positive rate (sensitivity) against the false positive rate (specificity) at various classification thresholds. The closer the ROC curve is to the top-left corner of the graph, the better the model’s ability to distinguish between the two classes (genuine and fake tweets). AUC is a single metric that summarizes the overall performance of the classifier, where a higher AUC value indicates better discrimination between classes.
With the training and test AUC values being relatively close and high, this suggests that the SVM model generalizes well to unseen data, effectively distinguishing between genuine and fake tweets. This robust performance, coupled with the balanced accuracy and other evaluation metrics, supports the effectiveness of the SVM-based model in tackling the binary classification of fake news in the given dataset.
Like the experiments on LESA, the tests performed on MediaEval shows that the addition of social context features increases the performance of the model (Test N°1 vs. Test N°2).
Figure 10,
Figure 11,
Figure 12,
Figure 13,
Figure 14 and
Figure 15 illustrates ROC curves for the six tests on the MediaEval dataset.
Conversely, the comparison of Test N°2 (dataset without augmentation) and other tests show that only the augmentation using SMOTE (Test N°5) achieves better performance than other tests (balanced accuracy = 0.77, AUC-ROC = 0.77 (
Figure 14), G-Mean = 0.77 and F1-score = 0.80).
The analysis of the tests results reveals several important findings:
The addition of social context features in Test N°2 (balanced accuracy = 0.739, AUC-ROC = 0.739, G-Mean = 0.737, F1-score = 0.80) outperforms Test N°1 (balanced accuracy = 0.656, AUC-ROC = 0.658, G-Mean = 0.644, F1-score = 0.78) in all metrics for the two datasets. indicating that including social context features significantly improves the model’s performance.
Data augmentation in Tests N°3, N°4, N°5, and N°6 enhanced the model’s performance. Augmentation with SMOTE and SVM-SMOTE methods yields the most effective improvements, surpassing the results of Test N°2 (without augmentation). This can be attributed to their respective techniques based on K-NN and SVM, which effectively address the data imbalance problem and create a more balanced dataset for training.
Among the various augmentation techniques tested, data augmentation using SMOTE in Test N°5 exhibits the best performance (balanced accuracy = 0.77, AUC-ROC = 0.77, G-Mean = 0.77 and F1-score = 0.80). The results of Test N°5 surpass those of Test N°2, suggesting that SMOTE data augmentation effectively addresses data imbalance and leads to improved model performance on the MediaEval dataset.
5.2. Models Experiments with FNN-Based Classifier
The second proposed model based on feedforward neural networks (FNN) was included to evaluate the impact of deep learning approaches. The experiments were conducted on both LESA and MediaEval datasets. SMOTE was used as the data augmentation technique since it provided the best results in the previous experiments. The results of the FNN-based model on the two datasets are presented in
Table 4.
Despite efforts to optimize hyperparameters and apply regularization techniques like dropout and early stopping, the FNN model exhibited limited performance due to the small dataset sizes. On the LESA dataset, the balanced accuracy reached 64.4%, while on MediaEval it improved slightly to 67.2%. These results highlight the challenges faced by deep learning models in scenarios with limited data.
To address the issue of overfitting, a technique called eight epochs fitting was employed, which involves training the model over eight periods to reduce overfitting.
Figure 16 illustrates the evolution of training and validation AUC scores over the eight periods. Furthermore,
Figure 17 demonstrates that validation error decreases in each period as the training error decreases.
Finally,
Figure 18 provides evidence that the classifier is capable of generalizing well on the entire test dataset. Despite the challenges faced in achieving optimal performance, the FNN-based model demonstrated promising generalization capabilities.
Indeed, the results obtained on the MediaEval dataset were superior to those obtained on LESA. This improvement can be attributed to the larger size of MediaEval. However, even with the larger dataset, the performance of the FNN-based model on MediaEval were not as strong as those achieved by the SVM-based model. This observation aligns with earlier findings on LESA, where the FNN model struggled to perform optimally due to the relatively small dataset size compared to the model’s requirements.
Similarly to the behavior observed on LESA,
Figure 19 illustrates that the validation AUC in MediaEval is close to the training AUC, suggesting a good fit to the data.
Additionally,
Figure 20 shows that the validation error curve closely follows the training error curve in MediaEval. This demonstrates consistent performance across both training and validation phases. Lastly,
Figure 21 demonstrates that the FNN-based classifier can generalize effectively on the entire test dataset in MediaEval.
5.3. Models Experiments with CNN-1D-Based Classifier
The last phase of experiments involved testing the CNN-1D-based model. The tests were also conducted with data augmentation using SMOTE. The results obtained from these tests are summarized in
Table 5.
The CNN-1D model was also evaluated but similarly faced limitations due to the small datasets. On the LESA dataset, the balanced accuracy reached 68.2%, while on MediaEval, it improved to 73.6%. Although these results were better than those of the FNN model, they still fell short of the SVM model, which more effectively utilized the multimodal features, including social context. As shown in
Figure 22, the validation accuracy increases faster than the training accuracy, indicating a potential overfitting issue. This behavior is further supported by
Figure 23, which illustrates that the validation error decreases alongside the training error in each training period, indicating that the model is fitting too closely to the training data.
However,
Figure 24 provides some positive insights, showing that the ROC curves of the training, validation, and test sets are relatively close, suggesting that the model has a decent level of generalization capability. Despite the overfitting tendencies, the CNN-1D model still manages to capture relevant patterns and relationships in the data to achieve reasonably good performance metrics, especially when considering the challenges of dealing with a small dataset. As shown in
Figure 25, the validation accuracy on MediaEval increases gradually and closely follows the training accuracy, indicating that the model is fitting well to the training data without significant overfitting. Additionally,
Figure 26 depicts the reduction in validation error as the training error decreases, supporting the model’s ability to classify data accurately based on what it has learned during training.
Moreover,
Figure 27 exhibits the ROC curves of the training, validation, and test sets, demonstrating that the model is capable of generalizing well across different datasets. This indicates that the CNN-1D model has captured relevant patterns and features on MediaEval and can perform effectively on unseen data.
The larger size of MediaEval dataset likely contributes to the improved performance of CNN-1D model. Deep learning models, such as CNNs, are data-hungry and require substantial amounts of data for optimal performance.
5.4. Discussion
The comparison of Test N°5 between proposed models based on SVM, FNN, and CNN-1D classifiers on LESA and MediaEval datasets is summarized in
Table 6.
The results underline the significant impact of adding social context features to multimodal fake news detection frameworks. Across all tested configurations, the inclusion of social context consistently enhanced performance metrics such as balanced accuracy, F1-score, and G-Mean. The SVM-based model demonstrated the strongest ability to leverage these features, outperforming both FNN and CNN-1D models on all metrics.
While FNN and CNN-1D models showed some promise, particularly on the larger MediaEval dataset, their performance was limited by the smaller size of LESA. These findings reinforce the importance of dataset size for deep learning models and highlight the robustness of SVM in handling high-dimensional, multimodal data with fewer samples.
The preliminary results confirm that the proposed model with SVM classifier is the most effective for fake news detection on the LESA and MediaEval datasets due to its robustness and adaptability to small, high-dimensional datasets. However, the increasing performance trends of the FNN and CNN-1D models highlight the potential for deep learning to surpass SVM when larger datasets are available. Future work should focus on collecting more extensive datasets, optimizing deep learning architectures, and incorporating advanced techniques to maximize the potential of all models for fake news detection tasks.
6. Comparison and Analysis
In this section, a comparison study of the obtained results is performed against the main similar works in the literature, particularly focusing on MediaEval dataset which is the most widely used dataset. The comparison is based on the accuracy, balanced accuracy and F1-score metrics. However, some papers in the literature use only accuracy as a metric, which can be misleading in the case of unbalanced datasets like MediaEval.
As shown in
Table 7, the proposed solutions of three-dimensional features fusion, outperform most of the other works in terms of balanced-accuracy and F1-score. It is worth noting that some papers report high accuracy values but much lower balanced accuracy values, highlighting the importance of considering balanced accuracy for unbalanced datasets.
Notably, the balanced accuracy of the proposed models is consistently higher than their accuracy values. This reinforces the significance of the impact of social context information as an important modality in fake news detection on social media platforms.
The fusion of text, image and social context using a combination of ViLBERT-Multi-Task with SVM and CNN-1D classifiers demonstrates promising results for fake news detection. These models achieve superior balanced accuracy, and F1-scores compared to many existing works, emphasizing their robustness in handling unbalanced datasets. Future efforts should focus on larger datasets and further optimization to enhance the models’ performance and provide a more holistic comparison with the literature.
7. Challenges and Future Work
While the proposed model demonstrates promising results, several limitations emerge that require systematic examination to guide future improvements. The following analysis identifies three key challenges, while also highlighting critical paths forward for real-world deployment, including computational optimization and ethical safeguards.
7.1. Error Analysis and Model Limitations
A comprehensive examination of misclassified instances reveals three principal challenges impacting model performance. First, the inherent class imbalance in the LESA and MediaEval datasets, where fake tweets constitute only 17% and 28% of samples, respectively, introduces significant bias during training. While synthetic oversampling techniques such as SMOTE and its variants partially mitigate this issue, the artificially generated samples fail to fully capture the linguistic sophistication and contextual nuances characteristic of authentic misinformation. This limitation manifests particularly in cases involving neologisms or deliberate lexical distortions employed to evade detection.
Second, the model demonstrates reduced efficacy when processing text-dominant visual content, such as memes or document screenshots, where overlaid text is often stylized or partially obscured. Standard optical character recognition systems achieve only marginal accuracy under these conditions, impeding the model’s ability to perform robust cross-modal verification.
Third, linguistic phenomena including sarcasm and irony present persistent challenges, as the current architecture lacks sufficient pragmatic understanding to reliably discern intent from surface-level text features alone. These limitations highlight the need for improved data curation protocols and more sophisticated multimodal fusion techniques to enhance future iterations.
For instance, tweets with sarcastic posts (e.g., “Of course, the vaccine implants 5G chips.
![Ai 06 00078 i001]()
) were often mislabeled as fake, highlighting gaps in pragmatics understanding. These cases underscore the need for hybrid datasets combining real and carefully validated synthetic samples, alongside advanced sarcasm detection modules.
7.2. Real-World Deployment and Ethical Considerations
Transitioning the proposed framework from experimental validation to production-scale implementation necessitates addressing both technical and ethical constraints. From a computational perspective, model compression via quantization-aware training can reduce inference latency by approximately 72%, while a tiered edge-cloud deployment architecture would enable efficient processing of high-volume social media streams. These optimizations must be coupled with rigorous fairness audits, employing tools such as “Fairlearn” to identify and mitigate potential demographic biases in model predictions.
The implementation of human oversight mechanisms remains critical for maintaining accountability, particularly for borderline cases where model confidence scores fall within ambiguous thresholds. Concurrently, the integration of explainability frameworks, including SHAP (Shapley additive explanations) value analysis, ensures transparent decision-making processes that can be audited and refined. To future-proof the system against evolving misinformation tactics, ongoing adversarial testing using benchmarks like “MisinfoChallenge” will be essential. Together, these measures form a comprehensive governance framework that balances detection accuracy with ethical responsibility in real-world applications.
8. Conclusions
In conclusion, this research addresses the critical challenge of fake news detection by proposing a sophisticated multimodal approach that integrates textual, visual, and social context information. The methodology includes meticulous data preprocessing, simultaneous extraction of text and image features, fusion of modalities, data augmentation using SMOTE, and classification employing different classifiers.
The experimental evaluation on the MediaEval and LESA datasets highlighted the significant role of incorporating social context features in improving detection performance. Results showed that the addition of social context consistently enhanced key metrics such as balanced accuracy and F1-score. The SVM-based model, leveraging the full set of multimodal features, outperformed deep learning models on both datasets due to its robustness in handling high-dimensional data and smaller sample sizes.
While FNN and CNN-1d exhibited potential for larger datasets, their performance was constrained by the limited size of available datasets. Nevertheless, their trends suggest that deep learning models could benefit significantly from larger and more diverse datasets, potentially surpassing SVM in future work.
A comparative analysis with existing scientific literature reinforces the crucial role of social context features in enhancing detection models. The proposed solutions, particularly the combination of Multi-Task ViLBERT with SVM and CNN-1D, demonstrated superior balanced accuracy and robustness for unbalanced datasets, outperforming several state-of-the-art approaches.
Nevertheless, critical challenges such as class imbalance, text-dominant image processing, and linguistic ambiguity require targeted solutions, including hybrid datasets, advanced OCR integration, and pragmatics-aware architecture, to further improve model generalizability.
This study establishes the importance of social context in enhancing multimodal fake news detection frameworks. By leveraging the synergies between textual, visual, and social context features, the proposed methodology presents a comprehensive solution for combating misinformation on social media platforms.
Future research should focus on scaling these approaches to larger datasets, exploring advanced deep learning architectures, and further refining the integration of social context to address evolving challenges in fake news detection. Especially on addressing the identified challenges through scalable architectures, bias mitigation frameworks, and adversarial testing, ensuring both performance and ethical reliability in real-world applications.
In summary, this work contributes to the ongoing fight against fake news by introducing a robust and scalable multimodal framework that underscores the critical role of social context. It lays the foundation for future advancements, ensuring more accurate and trustworthy detection systems for real-world applications.
Author Contributions
Conceptualization, H.N.D., H.M. and L.S.; methodology, H.N.D., H.M. and L.S.; software, H.N.D. and H.M.; validation, H.N.D., H.M. and L.S.; formal analysis, H.N.D. and L.S.; investigation, H.N.D., H.M. and L.S.; resources, H.N.D., H.M. and L.S.; data curation, H.N.D. and H.M.; writing—original draft preparation, H.N.D.; writing—review and editing, H.N.D. and L.S.; visualization, H.N.D., H.M. and L.S.; supervision, H.N.D. and L.S.; project administration, L.S. All authors have read and agreed to the published version of the manuscript.
Funding
This research received no external funding.
Institutional Review Board Statement
Not applicable.
Informed Consent Statement
Not applicable.
Data Availability Statement
MediaEval and LESA datasets are available under request in their official website.
Acknowledgments
We would like to express our gratitude to the creators and maintainers of the MediaEval Fake News Dataset and the LESA Dataset for providing access to these valuable resources. These datasets have been instrumental in supporting the experimental evaluation of our proposed methodology for fake news detection.
Conflicts of Interest
The authors declare no conflicts of interest.
Abbreviations
The following abbreviations are used in this manuscript:
| ADAMAX | Adam optimization algorithm using infinity norm |
| ADASYN | Adaptive synthetic sampling |
| Att-RNN | Attention recurrent neural network |
| AUC | Area under the curve |
| BERT | Bidirectional encoder representations from transformers |
| CFNN | Cascading feedforward neural network |
| CNN | Convolutional neural network |
| CNN-1D | One-dimensional convolutional neural network |
| Conv-1D | 1D convolution |
| COVID-19 | Coronavirus disease 2019 |
| C-LSTM | Convolutional long short-term memory |
| COLAB-PRO | Google Colab Professional |
| DIP | Digital image processing |
| EANN | Evolutionary adversarial neural network |
| FNN | Feedforward neural network |
| F1-score | Harmonic mean of precision and recall |
| GAN | Generative adversarial network |
| GRU | Gated recurrent unit |
| G-Mean | Geometric mean |
| KNN | k-nearest neighbors |
| LESA | Linguistic encapsulation and semantic amalgamation |
| LSTM | Long short-term memory |
| LoR | Logistic regression |
| MaxPool1D | One-dimensional max pooling |
| mBERT | Multilingual BERT |
| MCNN | Multi-scale convolutional neural network |
| MediaEval | Media evaluation |
| MLP | Multilayer perceptron |
| MVAC | Multi-view active classification |
| NB | Naïve Bayes |
| RAM | Random access memory |
| ResNet | Residual network |
| RF | Random forest |
| RNN | Recurrent neural network |
| RoBERT | Robust BERT |
| ROC | Receiver operating characteristic |
| SHAP | Shapley additive explanations |
| SMOTE | Synthetic minority oversampling technique |
| SVM | Support vector machine |
| TI-CNN | Text–image convolutional neural network |
| TF-IDF | Term frequency–inverse document frequency |
| URI | Uniform resource identifier |
| US | United state |
| VGG | Visual geometry group network |
References
- Meel, P.; Vishwakarma, D.K. Fake news, rumor, information pollution in social media and Web: A contemporary survey of state-of-the-arts, challenges, and opportunities. Expert Syst. Appl. 2020, 153, 112986. [Google Scholar] [CrossRef]
- Allcott, H.; Gentzkow, M. Social media and fake news in the 2016 election. J. Econ. Perspect. 2017, 31, 211–236. [Google Scholar] [CrossRef]
- Erku, D.A.; Belachew, S.A.; Abrha, S.; Sinnollareddy, M.; Thomas, J.; Steadman, K.J.; Tesfaye, W.H. When fear and misinformation go viral: Pharmacists’ role in deterring medication misinformation during the ‘infodemic’ surrounding COVID-19. Res. Social Adm. Pharm. 2021, 17, 1954–1963. [Google Scholar] [CrossRef]
- Patwa, P.; Sharma, S.; Pykl, S.; Guptha, V.; Kumari, G.; Akhtar, M.S.; Ekbal, A.; Das, A.; Chakraborty, T. Fighting an infodemic: COVID-19 fake news dataset. In Combating Online Hostile Posts in Regional Languages During Emergency Situations; Springer International: Cham, Switzerland, 2021; pp. 21–29. [Google Scholar] [CrossRef]
- Chakraborty, T. Multi-modal Fake News Detection. In Data Science for Fake News; Springer: Cham, Switzerland, 2021; pp. 41–70. [Google Scholar] [CrossRef]
- Castillo, C.; Mendoza, M.; Poblete, B. Information credibility on Twitter. In Proceedings of the 20th International Conference on World Wide Web (WWW’11), Hyderabad, India, 28 March–1 April 2011; pp. 675–684. [Google Scholar] [CrossRef]
- Marchi, R. With Facebook, blogs, and fake news, teens reject journalistic “objectivity”. J. Commun. Inquiry 2012, 36, 246–262. [Google Scholar] [CrossRef]
- Rubin, V.L.; Chen, Y.; Conroy, N.K. Deception detection for news: Three types of fakes. Proc. Assoc. Inf. Sci. Technol. 2016, 52, 1–4. [Google Scholar] [CrossRef]
- Qu, Z.; Meng, Y.; Muhammad, G.; Tiwari, P. QMFND: A quantum multimodal fusion-based fake news detection model for social media. Inf. Fusion 2024, 104, 102172. [Google Scholar] [CrossRef]
- Alameri, S.A.; Mohd, M. Comparison of Fake News Detection using Machine Learning and Deep Learning Techniques. In Proceedings of the 3rd International Cyber Resilience Conference (CRC), Langkawi Island, Malaysia, 29–-31 January 2021; pp. 1–6. [Google Scholar] [CrossRef]
- Zhang, L.; Zhang, X.; Zhou, Z.; Zhang, X.; Yu, P.S.; Li, C. Knowledge-aware multimodal pretraining for fake news detection. Inf. Fusion. 2025, 114, 102715. [Google Scholar] [CrossRef]
- Balshetwar, S.V.; Abilash, R.S.; Jermisha, D.R. Fake news detection in social media based on sentiment analysis using classifier techniques. Multimed. Tools Appl. 2023, 82, 35781–35811. [Google Scholar] [CrossRef]
- Gupta, M.; Zhao, P.; Han, J. Evaluating event credibility on Twitter. In Proceedings of the SIAM International Conference on Data Mining; Society for Industrial and Applied Mathematics: Philadelphia, PA, USA, 2012; pp. 153–164. [Google Scholar] [CrossRef]
- Kumar, A.; Singh, D.; Jain, R.; Jain, D.K.; Gan, C.; Zhao, X. Advances in DeepFake detection algorithms: Exploring fusion techniques in single and multi-modal approach. Inf. Fusion 2025, 118, 102993. [Google Scholar] [CrossRef]
- Hu, L.; Wei, S.; Zhao, Z.; Wu, B. Deep learning for fake news detection: A comprehensive survey. AI Open 2022, 3, 133–155. [Google Scholar] [CrossRef]
- Raza, S.; Ding, C. Fake news detection based on news content and social contexts: A transformer-based approach. Int. J. Data Sci. Anal. 2022, 13, 335–362. [Google Scholar] [CrossRef] [PubMed]
- Chandrakant, M.; Sarojananda, M.; Sarangi, M.R. A cooperative deep learning model for fake news detection in online social networks. J. Ambient Intell. Humanized Comput. 2023, 14, 4451–4460. [Google Scholar] [CrossRef]
- Galli, A.; Masciari, E.; Moscato, V.; Sperl, G. A comprehensive benchmark for fake news detection. J. Intell. Inf. Syst. 2022, 59, 237–261. [Google Scholar] [CrossRef]
- Bondielli, A.; Dell’Oglio, P.; Lenci, A.; Marcelloni, F.; Passaro, L.C.; Sabbatini, M. Multi-fake-detective at EVALITA 2023: Overview of the multimodal fake news detection and verification task. In Proceedings of the 8th Evaluation Campaign of Natural Language Processing and Speech Tools for Italian, Parma, Italy, 7–8 September 2023. [Google Scholar]
- Bai, Y.; Liu, Y.; Li, Y. Learning frequency-aware cross-modal interaction for multimodal fake news detection. IEEE Trans. Comput. Social. Syst. 2024, 11, 6568–6579. [Google Scholar] [CrossRef]
- Liu, Y.; Wu, Y.-F. Early detection of fake news on social media through propagation path classification with recurrent and convolutional networks. In Proceedings of Thirty-Second AAAI Conference on Artificial Intelligence, New Orleans, LA, USA,., 2–7 February 2018. [Google Scholar] [CrossRef]
- Kumar, S.; Asthana, R.; Upadhyay, S.; Upreti, N.; Akbar, M. Fake news detection using deep learning models: A novel approach. Trans. Emerg. Telecommun. Technol. 2019, 31. [Google Scholar] [CrossRef]
- Mostafa, M.; Almogren, A.S.; Al-Qurishi, M.; Alrubaian, M. Modality Deep-learning Frameworks for Fake News Detection on Social Networks: A Systematic Literature Review. ACM Comput. Surv. 2024, 57, 1–50. [Google Scholar] [CrossRef]
- Shin, D.; Koerber, A.; Lim, J.S. Impact of misinformation from generative AI on user information processing: How people understand misinformation from generative AI. New Media Soc. 2024, 1461–4448. [Google Scholar] [CrossRef]
- Nguyen, Q.V.H.; Nguyen, D.T.; Huynh-The, T.; Nahavandi, S.; Nguyen, T.T.; Pham, Q.-V.; Nguyen, C.M. Deep learning for deepfakes creation and detection: A survey. Comput. Vis. Image Underst. 2022, 223, 103525. [Google Scholar] [CrossRef]
- Chadha, A.; Kumar, V.; Kashyap, S.; Gupta, M. Deepfake: An overview. In Proceedings of the 2nd International Conference on Computing, Communication, and Cyber-Security, Warangal, India, 29–31 August 2023; Springer: Singapore, 2021; pp. 557–566. [Google Scholar] [CrossRef]
- Senthil Raja, M.; Arun Raj, L. Fake news detection on social networks using machine learning techniques. Mater. Today Proc. 2022, 62 Pt 7, 4821–4827. [Google Scholar] [CrossRef]
- Zannettou, S.; Sirivianos, M.; Blackburn, J.; Kourtellis, N. The web of false information: Rumors, fake news, hoaxes, clickbait, and various other shenanigans. J. Data Inf. Qual. 2019, 11, 1–37. [Google Scholar] [CrossRef]
- Bangyal, W.H.; Qasim, R.; Ahmad, Z.; Dar, H.; Rukhsar, L.; Aman, Z.; Ahmad, J. Detection of fake news text classification on COVID-19 using deep learning approaches. Comput. Math. Methods Med. 2021, 2021, 5514220. [Google Scholar] [CrossRef] [PubMed]
- Abdelminaam, D.S.; Ismail, F.H.; Taha, M.; Taha, A.; Houssein, E.H.; Nabil, A. Coaid-deep: An optimized intelligent framework for automated detecting COVID-19 misleading information on Twitter. IEEE Access 2021, 9, 27840–27867. [Google Scholar] [CrossRef] [PubMed]
- Cui, L.; Lee, D. CoAID: COVID-19 healthcare misinformation dataset. arXiv 2020, arXiv:2006.00885. [Google Scholar] [CrossRef]
- Kaliyar, R.K.; Goswami, A.; Narang, P. A hybrid model for effective fake news detection with a novel COVID-19 dataset. In Proceedings of the ICAART, Online Streaming, 4–6 February 2021; Volume 2. [Google Scholar] [CrossRef]
- Kaliyar, R.K.; Goswami, A.; Narang, P. MCNNet: Generalizing fake news detection with a multichannel convolutional neural network using a novel COVID-19 dataset. In Proceedings of the 8th ACM IKDD CODS and 26th COMAD, Bangalore, India, 2–4 January 2021; p. 437. [Google Scholar] [CrossRef]
- Alenezi, M.N.; Alqenaei, Z.M. Machine learning in detecting COVID-19 misinformation on Twitter. Future Internet 2021, 13, 244. [Google Scholar] [CrossRef]
- Alouffi, B.; Alharbi, A.; Sahal, R.; Saleh, H. An Optimized Hybrid Deep Learning Model to Detect COVID-19 Misleading Information. Comput. Intell. Neurosci. 2021, 2021, 9615034. [Google Scholar] [CrossRef]
- Cao, J.; Qi, P.; Sheng, Q.; Yang, T.; Guo, J.; Li, J. Exploring the role of visual content in fake news detection. In Disinformation, Misinformation, and Fake News in Social Media; Springer: Cham, Switzerland, 2020; pp. 141–161. [Google Scholar] [CrossRef]
- Li, Q.; Tao, Q.; Joty, S.; Cai, J.; Luo, J. VQA-E: Explaining, elaborating, and enhancing your answers for visual questions. In Proceedings of the Computer Vision–ECCV 2018, Munich, Germany, 8–14 September 2018; pp. 570–586. [Google Scholar] [CrossRef]
- Shu, K.; Mahudeswaran, D.; Wang, S.; Lee, D.; Liu, H.; Chen, H. Fake news detection on social media: A data mining perspective. ACM SIGKDD Explor. Newsl. 2017, 19, 22–36. [Google Scholar] [CrossRef]
- Yu, P.; Xia, Z.; Fei, J.; Lu, Y. A survey on deepfake video detection. IET Biometrics 2021, 10, 607–624. [Google Scholar] [CrossRef]
- Zhang, Y.; Zheng, L.; Thing, V.L. Automated face swapping and its detection. In Proceedings of the 2nd International Conference on Signal and Image Processing (ICSIP), Singapore, 4–6 August 2017; pp. 15–19. [Google Scholar] [CrossRef]
- Huang, G.B.; Ramesh, M.; Berg, T. Labeled Faces in the Wild: A Database for Studying Face Recognition in Unconstrained Environments. 2007; pp. 7–49. Available online: https://inria.hal.science/inria-00321923v1 (accessed on 1 April 2025).
- Hsu, C.C.; Zhuang, Y.X.; Lee, C.Y. Deep fake image detection based on pairwise learning. Appl. Sci. 2020, 10, 370. [Google Scholar] [CrossRef]
- Gandhi, A.; Jain, S. Adversarial perturbations fool deepfake detectors. In Proceedings of the International Joint Conference on Neural Networks (IJCNN), Shenzhen, China, 18–22 July 2020; pp. 1–8. [Google Scholar] [CrossRef]
- Hamed, S.K.; Ab Aziz, M.J.; Yaakub, M.R. Enhanced feature representation for multimodal fake news detection using localized fine-tuning of improved BERT and VGG-19 models. Arab. J. Sci. Eng. 2024, 1–17. [Google Scholar] [CrossRef]
- Nguyen, V.H.; Sugiyama, K.; Nakov, P.; Kan, M.Y. FANG: Leveraging Social Context for Fake News Detection Using Graph Representation. In Proceedings of the 29th ACM International Conference on Information & Knowledge Management (CIKM ‘20), Virtual Event, 19–23 October 2020; pp. 1165–1174. [Google Scholar] [CrossRef]
- Gupta, A.; Lamba, H.; Kumaraguru, P.; Joshi, A. Faking Sandy: Characterizing and identifying fake images on Twitter during Hurricane Sandy. In Proceedings of the 22nd International Conference on World Wide Web (WWW’13), Rio de Janeiro, Brazil, 13–17 May 2013; pp. 729–736. [Google Scholar] [CrossRef]
- Jin, Z.; Cao, J.; Zhang, Y.; Zhou, J.; Tian, Q. Novel visual and statistical image features for microblogs news verification. IEEE Trans. Multimed. 2016, 19, 598–608. [Google Scholar] [CrossRef]
- Jin, Z.; Cao, J.; Luo, J. Multimodal fusion with recurrent neural networks for rumor detection on microblogs. In Proceedings of the 25th ACM International Conference on Multimedia (MM), Mountain View, CA, USA, 23–27 October 2017; pp. 795–816. [Google Scholar] [CrossRef]
- Luvembe, A.M.; Li, W.; Li, S.; Liu, F.; Wu, X. CAF-ODNN: Complementary attention fusion with optimized deep neural network for multimodal fake news detection. Inf. Process. Manage. 2024, 61, 103653. [Google Scholar] [CrossRef]
- Kar, D.; Bhardwaj, M.; Samanta, S.; Azad, A.P. No rumours please! A multi-indic-lingual approach for COVID fake-tweet detection. In Proceedings of the 2021 Grace Hopper Celebration India (GHCI), Bengaluru, India, 19 February–12 March 2021; pp. 1–5. [Google Scholar] [CrossRef]
- Garain, A. Covid-19 tweets dataset for Bengali language. 2020. In Proceedings of the 20th ISCRAM Conference, Omaha, NE, USA, 28–31 May 2023. [Google Scholar] [CrossRef]
- Serrano, J.C.M.; Papakyriakopoulos, O.; Hegelich, S. NLP-based feature extraction for the detection of COVID-19 misinformation videos on YouTube. In Proceedings of the 1st Workshop NLP COVID-19 ACL, Online, 5–10 July 2020; pp. 1–7. Available online: https://aclanthology.org/2020.nlpcovid19-acl.17/ (accessed on 1 April 2025).
- Liu, Y.; Ott, M.; Goyal, N.; Du, J.; Joshi, M.; Chen, D.; Levy, O.; Lewis, L.; Stoyanov, V. RoBERTa: A robustly optimized BERT pretraining approach. arXiv 2019, arXiv:1907.11692. [Google Scholar] [CrossRef]
- Zhang, J.; Dong, B.; Yu, P.S. FakeDetector: Effective Fake News Detection with Deep Diffusive Neural Network. 2020 IEEE 36th International Conference on Data Engineering (ICDE), Dallas, TX, USA, 20–24 April 2020; pp. 1826–1829. [Google Scholar] [CrossRef]
- Yang, Y.; Zheng, L.; Zhang, J.; Cui, Q.; Li, Z.; Yu, P.S. TI-CNN: Convolutional neural networks for fake news detection. arXiv 2018, arXiv:1806.00749. [Google Scholar] [CrossRef]
- Singhal, S.; Kabra, A.; Sharma, M.; Shah, R.R.; Chakraborty, T.; Kumaraguru, P. SpotFake+: A multimodal framework for fake news detection via transfer learning. In Proceedings of the AAAI Conference on Artificial Intelligence, New York, NY, USA, 7–12 February 2024; Volume 34, pp. 13915–13916. [Google Scholar] [CrossRef]
- Khattar, D.; Goud, J.S.; Gupta, M.; Varma, V. MVAE: Multimodal Variational Autoencoder for Fake News Detection. In Proceedings of WWW ‘19: The World Wide Web Conference, San Francisco, CA, USA, 13–17 May 2019. pp. 2915–2921. [CrossRef]
- Wang, Y.; Ma, F.; Jin, Z.; Yuan, Y.; Xun, G.; Jha, K.; Su, L.; Gao, J. EANN: Event Adversarial Neural Networks for Multi-Modal Fake News Detection. In Proceedings of the 24th ACM SIGKDD International Conference on Knowledge Discovery & Data Mining (KDD ‘18), London, UK, 19–23 August 2018; pp. 849–857. [Google Scholar] [CrossRef]
- Cheema, G.S.; Hakimov, S.; Müller-Budack, E.; Ewerth, R. On the role of images for analyzing claims in social media. arXiv 2021, arXiv:2103.09602. [Google Scholar]
- Lu, J.; Batra, D.; Parikh, D.; Lee, S. ViLBERT: Pretraining task-agnostic visiolinguistic representations for vision-and-language tasks. In Proceedings of the Advances in Neural Information Processing Systems, San Diego, CA, USA, 2–7 December 2019; pp. 13–23. [Google Scholar] [CrossRef]
- Peng, L.; Jian, S.; Kan, Z.; Qiao, L.; Li, D. Not all fake news is semantically similar: Contextual semantic representation learning for multimodal fake news detection. Inf. Process. Manag. 2024, 61, 103564. [Google Scholar] [CrossRef]
- Yadav, A.; Gupta, A. An emotion-driven, transformer-based network for multimodal fake news detection. Int. J. Multimed. Inf. Retr. 2024, 13, 1–16. [Google Scholar] [CrossRef]
- Uppada, S.K.; Patel, P. An image and text-based multimodal model for detecting fake news in OSN’s. J. Intell. Inf. Syst. 2022, 61, 367–393. [Google Scholar] [CrossRef]
- Tufchi, S.; Yadav, A.; Ahmed, T. A comprehensive survey of multimodal fake news detection techniques: Advances, challenges, and opportunities. Int. J. Multimed. Inf. Retr. 2023, 12, 1–27. [Google Scholar] [CrossRef]
- Nassif, A.B.; Elnagar, A.; Elgendy, O.; Afadar, Y. Arabic fake news detection based on deep contextualized embedding models. Neural Comput. Appl. 2022, 34, 16019–16032. [Google Scholar] [CrossRef]
- Glazunova, S. Conspiracy, Propaganda, or ‘Fake News’? How YouTube Audiences Responded to RT Coverage of COVID-19. Probl. Post-Communism 2025, 1, 13. [Google Scholar] [CrossRef]
- Vardhan, K.V.; Josephine, B.M.; Rao, K.V.S.N.R. Fake news detection in social media using supervised learning techniques. In Proceedings of the International Conference on Sustainable Computing and Data Communication Systems (ICSCDS), Erode, India, 7–9 April 2022; pp. 695–698. [Google Scholar] [CrossRef]
- Chawla, N.V.; Bowyer, K.W.; Hall, L.O.; Kegelmeyer, W.P. SMOTE: Synthetic minority over-sampling technique. J. Artif. Intell. Res. 2002, 16, 321–357. [Google Scholar] [CrossRef]
- Han, H.; Wang, W.Y.; Mao, B.H. Borderline-SMOTE: A new over-sampling method in imbalanced data sets learning. In Advances in Intelligent Computing; Springer: Berlin/Heidelberg, Germany, 2005; pp. 878–887. [Google Scholar] [CrossRef]
- Tang, J.; Alelyani, S.; Liu, H. Feature selection for classification: A review. In Data Classification: Algorithms and Applications; CRC Press: Boca Raton, FL, USA, 2014; pp. 37–64. [Google Scholar]
- He, H.; Bai, Y.; Garcia, E.A.; Li, S. ADASYN: Adaptive synthetic sampling approach for imbalanced learning. In Proceedings of the IEEE International Joint Conference on Neural Networks (IEEE World Congress on Computational Intelligence), Hong Kong, China, 1–8 June 2008; pp. 1322–1328. [Google Scholar] [CrossRef]
Figure 1.
Conceptual schemes of proposed model.
Figure 1.
Conceptual schemes of proposed model.
Figure 2.
Workflow of implemented model.
Figure 2.
Workflow of implemented model.
Figure 3.
Experiment with SVM parameter (c = 1.25, γ = 0.25).
Figure 3.
Experiment with SVM parameter (c = 1.25, γ = 0.25).
Figure 4.
ROC curve for test N°1 (LESA).
Figure 4.
ROC curve for test N°1 (LESA).
Figure 5.
ROC curve for test N°2 (LESA).
Figure 5.
ROC curve for test N°2 (LESA).
Figure 6.
ROC curve for test N°3 (LESA).
Figure 6.
ROC curve for test N°3 (LESA).
Figure 7.
ROC curve for test N°4 (LESA).
Figure 7.
ROC curve for test N°4 (LESA).
Figure 8.
ROC curve for test N°5 (LESA).
Figure 8.
ROC curve for test N°5 (LESA).
Figure 9.
ROC curve for test N°6 (LESA).
Figure 9.
ROC curve for test N°6 (LESA).
Figure 10.
ROC curve for test N°1 (MediaEval).
Figure 10.
ROC curve for test N°1 (MediaEval).
Figure 11.
ROC curve for test N°2 (MediaEval).
Figure 11.
ROC curve for test N°2 (MediaEval).
Figure 12.
ROC curve for test N°3 (MediaEval).
Figure 12.
ROC curve for test N°3 (MediaEval).
Figure 13.
ROC curve for test N°4 (MediaEval).
Figure 13.
ROC curve for test N°4 (MediaEval).
Figure 14.
ROC curve for test N°5 (MediaEval).
Figure 14.
ROC curve for test N°5 (MediaEval).
Figure 15.
ROC curve for test N°6 (MediaEval).
Figure 15.
ROC curve for test N°6 (MediaEval).
Figure 16.
Training and validation AUC per period of FNN-based model (LESA).
Figure 16.
Training and validation AUC per period of FNN-based model (LESA).
Figure 17.
Training and validation error per period of FNN-based model (LESA).
Figure 17.
Training and validation error per period of FNN-based model (LESA).
Figure 18.
ROC curve of FNN-based model (LESA).
Figure 18.
ROC curve of FNN-based model (LESA).
Figure 19.
Training and validation AUC per period of FNN-based model (MediaEval).
Figure 19.
Training and validation AUC per period of FNN-based model (MediaEval).
Figure 20.
Training and validation error per period of FNN-based model (MediaEval).
Figure 20.
Training and validation error per period of FNN-based model (MediaEval).
Figure 21.
ROC curve of FNN-based model (MediaEval).
Figure 21.
ROC curve of FNN-based model (MediaEval).
Figure 22.
Training and validation accuracy per period of CNN-1d-based model (LESA).
Figure 22.
Training and validation accuracy per period of CNN-1d-based model (LESA).
Figure 23.
Training and validation error per period of CNN-1d-based model (LESA).
Figure 23.
Training and validation error per period of CNN-1d-based model (LESA).
Figure 24.
ROC curve of CNN-1d-based model (LESA).
Figure 24.
ROC curve of CNN-1d-based model (LESA).
Figure 25.
Training and validation accuracy per period of CNN-1d-based model (MediaEval).
Figure 25.
Training and validation accuracy per period of CNN-1d-based model (MediaEval).
Figure 26.
Training and validation error per period of CNN-1d-based model (MediaEval).
Figure 26.
Training and validation error per period of CNN-1d-based model (MediaEval).
Figure 27.
ROC curve of CNN-1d-based model (MediaEval).
Figure 27.
ROC curve of CNN-1d-based model (MediaEval).
Table 1.
Architecture of FNN based model.
Table 1.
Architecture of FNN based model.
| Layers | Type of Layer | Number of Neurons | Activation Function | Regulation Function | Optimizer | Batch Size | Error Function |
|---|
| 1st | Input layer | 2053 | - | - | ADAMAX | 512 | Binary_
crossentropy |
| 2nd | Dense | 260 | Relu | L2 (l = 0.01) |
| 3rd | Dense | 260 | Relu | L2 (l = 0.001) |
| 4th | Dropout | - | - | - |
| 5th | Dense | 260 | Relu | L2 (l = 0.001) |
| 6th | Dense | 260 | Relu | L2 (l = 0.001) |
| 7th | Dense | 260 | Relu | L2 (l = 0.001) |
| 8th | Dropout | - | - | - |
| 9th | Dense | 1 | Sigmoid | |
Table 2.
Architecture of CNN-1d based model.
Table 2.
Architecture of CNN-1d based model.
| Layers | Type of Layer | Number of Neurons | Activation Function | Regulation Function | Optimizer | Batch Size | Error Function |
|---|
| 1st | Input layer | 2053 | - | - | Adamax | 32 | Binary_
crossentropy |
| 2nd | Conv-1d | 64 | Relu | L2 (l = 0.01) |
| 3rd | Conv-1d | 64 | Relu | L2 (l = 0.01) |
| 4th | Dropout | - | - | - |
| 5th | MaxPool1D | - | - | - |
| 6th | Conv-1d | 128 | Relu | L2 (l = 0.001) |
| 7th | Conv-1d | 128 | Relu | L2 (l = 0.001) |
| 8th | MaxPool1D | - | - | - |
| 9th | Dropout | - | - | - |
| 10th | Flatten | - | - | - |
| 11th | Dense | 512 | Relu | L2(l = 0.001) |
| 12th | Dense | 1 | Sigmoid | - |
Table 3.
Tests results of proposal model with SVM based classifier.
Table 3.
Tests results of proposal model with SVM based classifier.
| Modalities | N° | Type of Augmentation | Balanced-Accuracy | AUC-ROC | G-Mean | F-1 Score | C | γ |
|---|
| | | | LESA | Media-Eval | LESA | Media-Eval | LESA | Media-Eval | LESA | Media-Eval | LESA | Media-Eval | LESA | Media-Eval |
|---|
| T + V | 1 | None | 0.656 | 0.717 | 0.658 | 0.717 | 0.644 | 0.717 | 0.78 | 0.74 | 2.09 | 3.728 | 0.55 | 0.1 |
| T + V+S | 2 | None | 0.739 | 0.769 | 0.739 | 0.769 | 0.737 | 0.769 | 0.80 | 0.79 | 2.09 | 1.5 | 0.1 | 0.9 |
| 3 | ADASYN | 0.740 | 0.76 | 0.740 | 0.76 | 0.739 | 0.76 | 0.79 | 0.78 | 1.5 | 1.4 | 0.1 | 0.46 |
| 4 | Borderline-SMOTE | 0.732 | 0.744 | 0.732 | 0.744 | 0.732 | 0.743 | 0.77 | 0.78 | 0.9 | 0.4 | 0.1 | 1.35 |
| 5 | SMOTE | 0.756 | 0.77 | 0.756 | 0.77 | 0.755 | 0.77 | 0.80 | 0.80 | 1.25 | 0.46 | 0.1 | 1.3 |
| 6 | SVM-SMOT | 0.749 | 0.743 | 0.749 | 0.743 | 0.746 | 0.742 | 0.83 | 0.79 | 1.25 | 0.46 | 0.25 | 1.3 |
Table 4.
Tests results of proposed models with FNN-based classifier.
Table 4.
Tests results of proposed models with FNN-based classifier.
| | Validation Score | Test Score |
|---|
| Datasets | AUC-ROC | Balanced
Accuracy | AUC-ROC | G-Mean | F-1 Score |
|---|
| Lesa | 71.1 | 0.644 | 0.644 | 0.638 | 0.61 |
| Media-Eval | 77.85 | 0.672 | 0.671 | 0.669 | 0.73 |
Table 5.
Tests results of proposed model with CNN-1D-based classifier.
Table 5.
Tests results of proposed model with CNN-1D-based classifier.
| | Validation Score | Test Score |
|---|
| Datasets | Accuracy | Balanced-Accuracy | AUC-ROC | G-Mean | F-1 Score |
|---|
| Lesa | 0.781 | 0.682 | 0.683 | 0.678 | 0.77 |
| MediaEval | 0.732 | 0.736 | 0.736 | 0.735 | 0.74 |
Table 6.
Performances comparison between proposed models.
Table 6.
Performances comparison between proposed models.
| | | Test Score |
|---|
| Datasets | Models | Balanced Accuracy | AUC-ROC | G-Mean | F-1 Score |
|---|
| Lesa | SVM | 0.756 | 0.756 | 0.755 | 0.80 |
| FNN | 0.644 | 0.644 | 0.638 | 0.61 |
| CNN-1d | 0.682 | 0.683 | 0.678 | 0.77 |
| MediaEval | SVM | 0.77 | 0.77 | 0.77 | 0.80 |
| FNN | 0.672 | 0.671 | 0.669 | 0.73 |
| CNN-1d | 0.736 | 0.736 | 0.735 | 0.74 |
Table 7.
Performances comparison between proposed models and models in the literature.
Table 7.
Performances comparison between proposed models and models in the literature.
| Authors | Models | Datasets | Performances |
|---|
| Khattar et al. [57] | Multi-Variational Auto-Encoder with Binary classifier (MVAE) | MediaEval dataset (Twitter) | Accuracy = 74%
F1-Score = 79% |
| Jin et al. [48] | Word2Vec + VGG19 + att-RNN | MediaEval dataset | Accuracy = 68%
F1-Score = 80% |
| Cheema et al. [59] | ViLBERT + SVM | MediaEval dataset (Twitter) | Accuracy = 80%
Balanced Accuracy = 71.7%
F1-Score = 79% |
| Wang et al. [58] | Text-CNN + VGG19 (EANN) | MediaEval dataset (Twitter) | Accuracy = 71%
F1-Score = 72% |
| Our Solution | ViLBERT-Multi-Task+SVM
ViLBERT-Multi-Task+CNN-1d
ViLBERT-Multi-Task+FNN | MediaEval dataset (Twitter) | - SVM:
Balanced Accuracy = 77%
F1-Score= 80%
- CNN-1d:
Balanced Accuracy = 74%
F1-Score = 73%
- FNN:
Balanced Accuracy = 67%
F1-Score = 74% |
| Disclaimer/Publisher’s Note: The statements, opinions and data contained in all publications are solely those of the individual author(s) and contributor(s) and not of MDPI and/or the editor(s). MDPI and/or the editor(s) disclaim responsibility for any injury to people or property resulting from any ideas, methods, instructions or products referred to in the content. |
© 2025 by the authors. Licensee MDPI, Basel, Switzerland. This article is an open access article distributed under the terms and conditions of the Creative Commons Attribution (CC BY) license (https://creativecommons.org/licenses/by/4.0/).


 ) were often mislabeled as fake, highlighting gaps in pragmatics understanding. These cases underscore the need for hybrid datasets combining real and carefully validated synthetic samples, alongside advanced sarcasm detection modules.
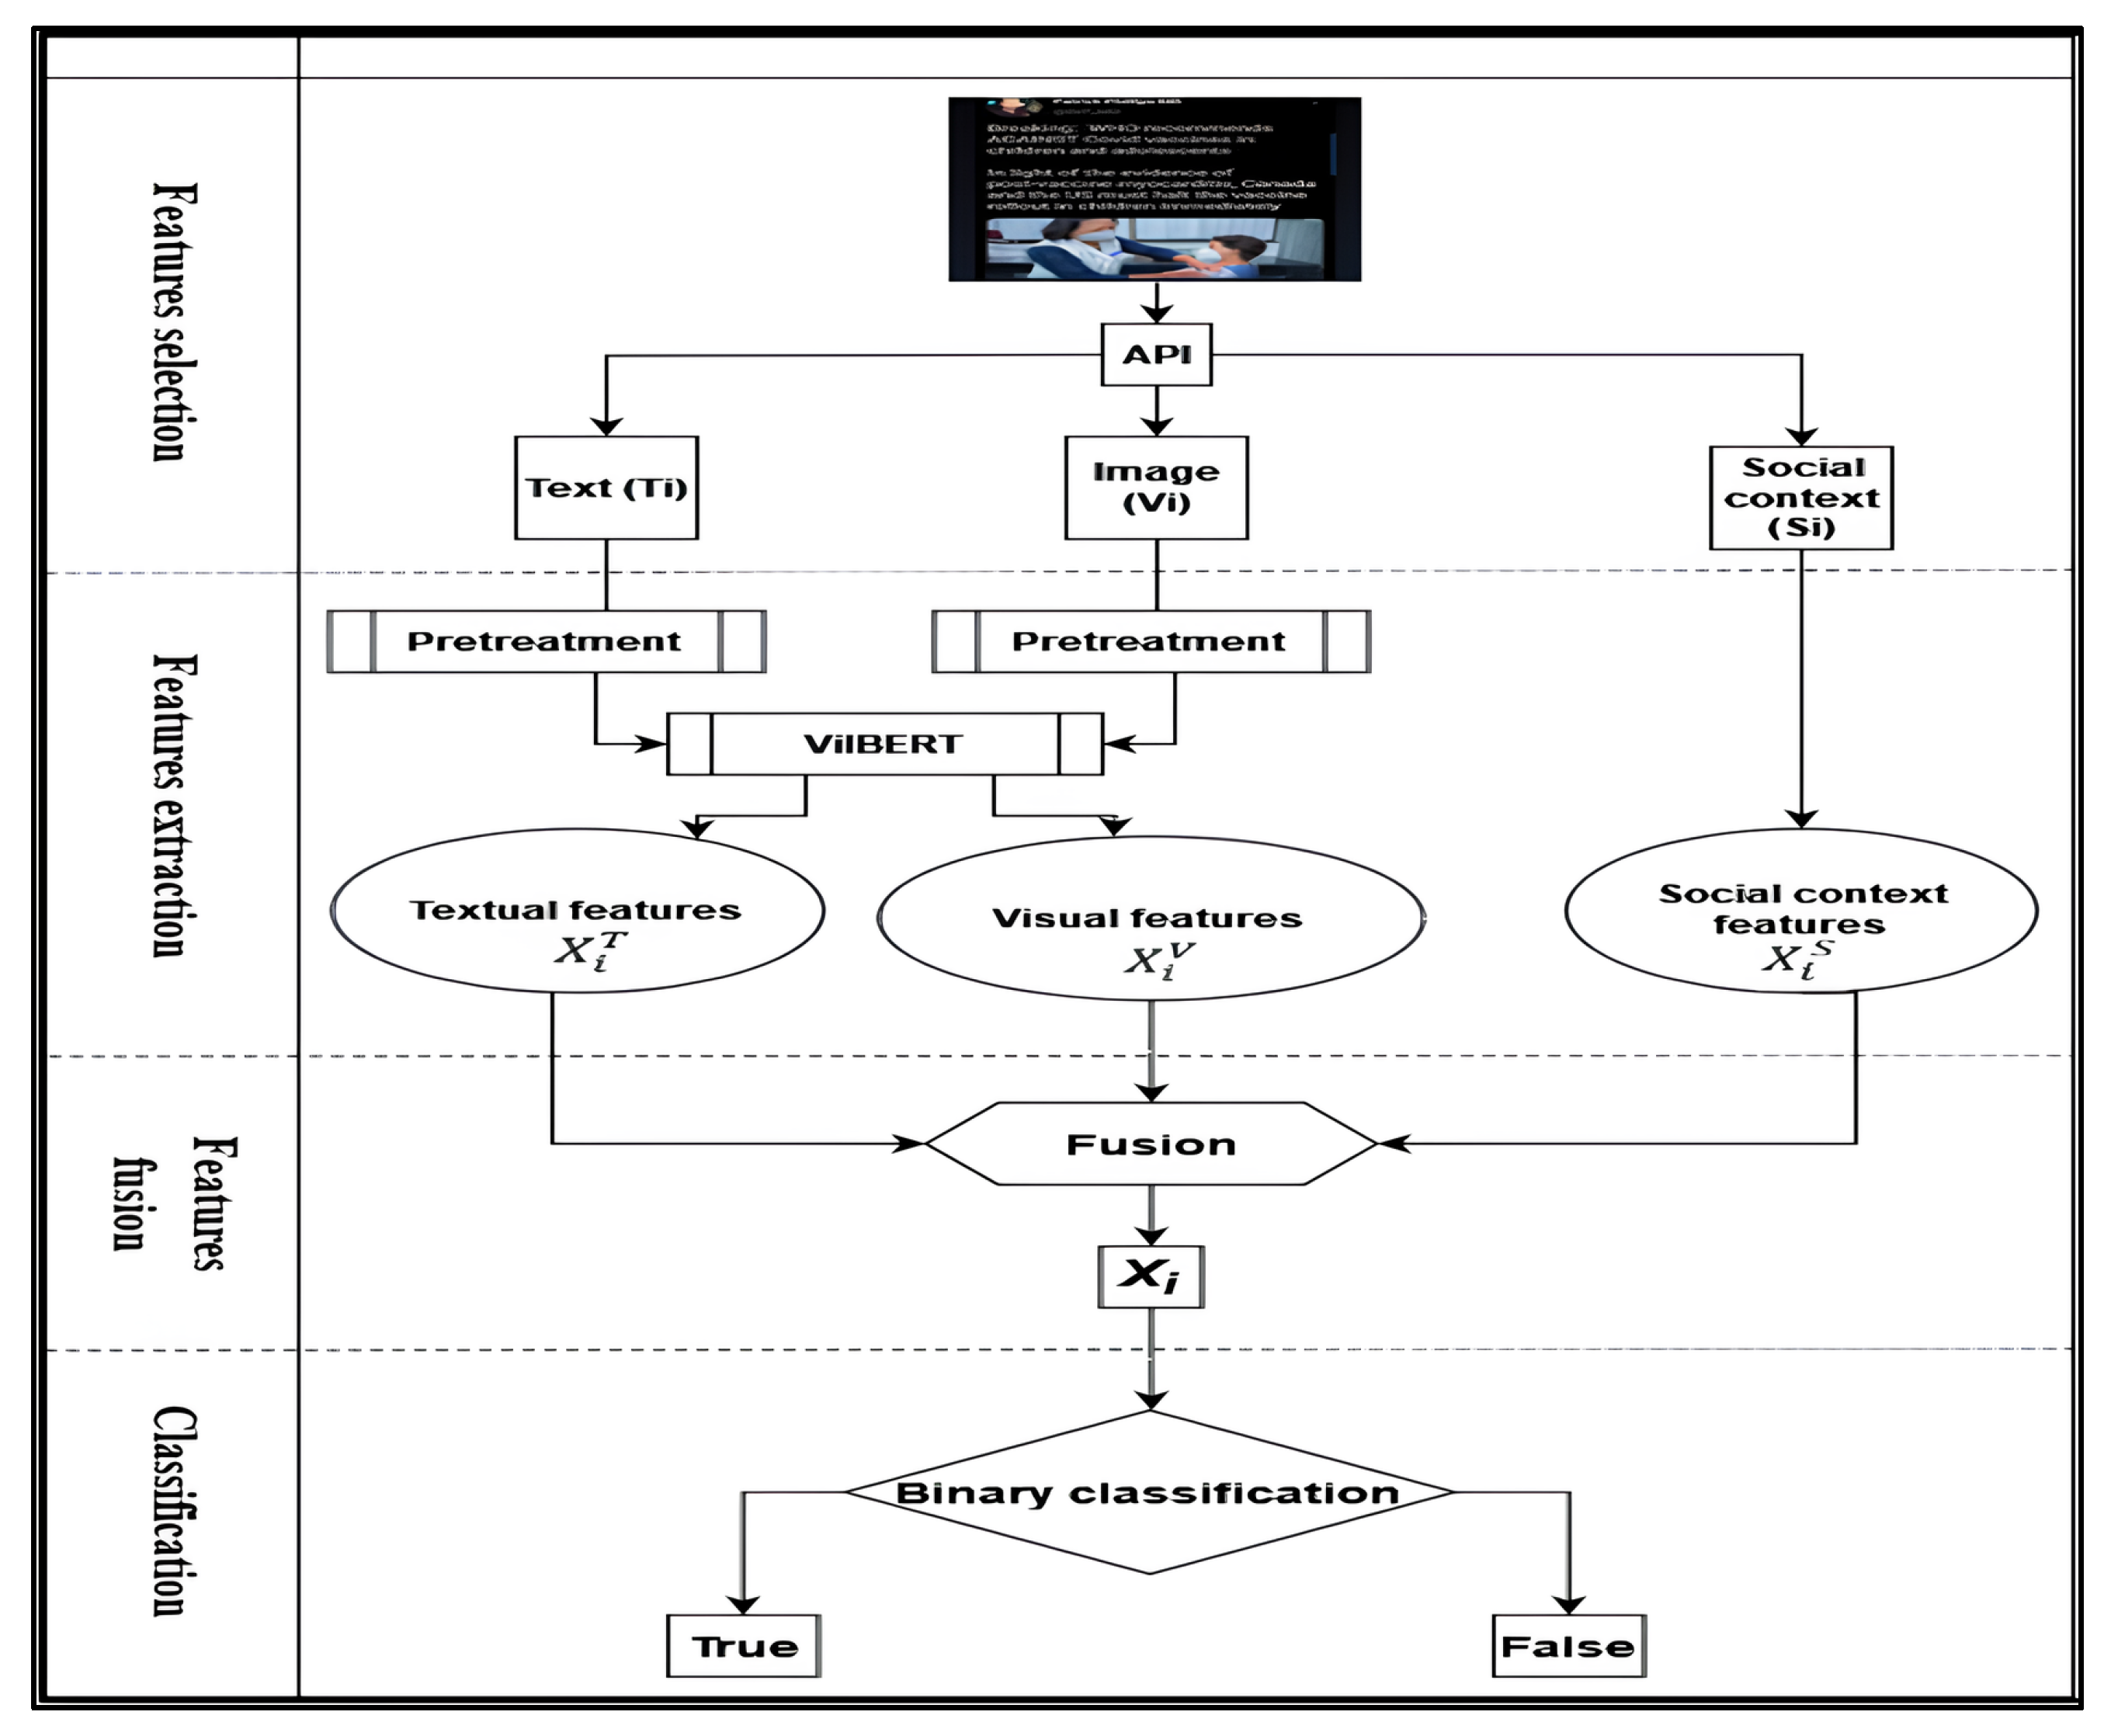
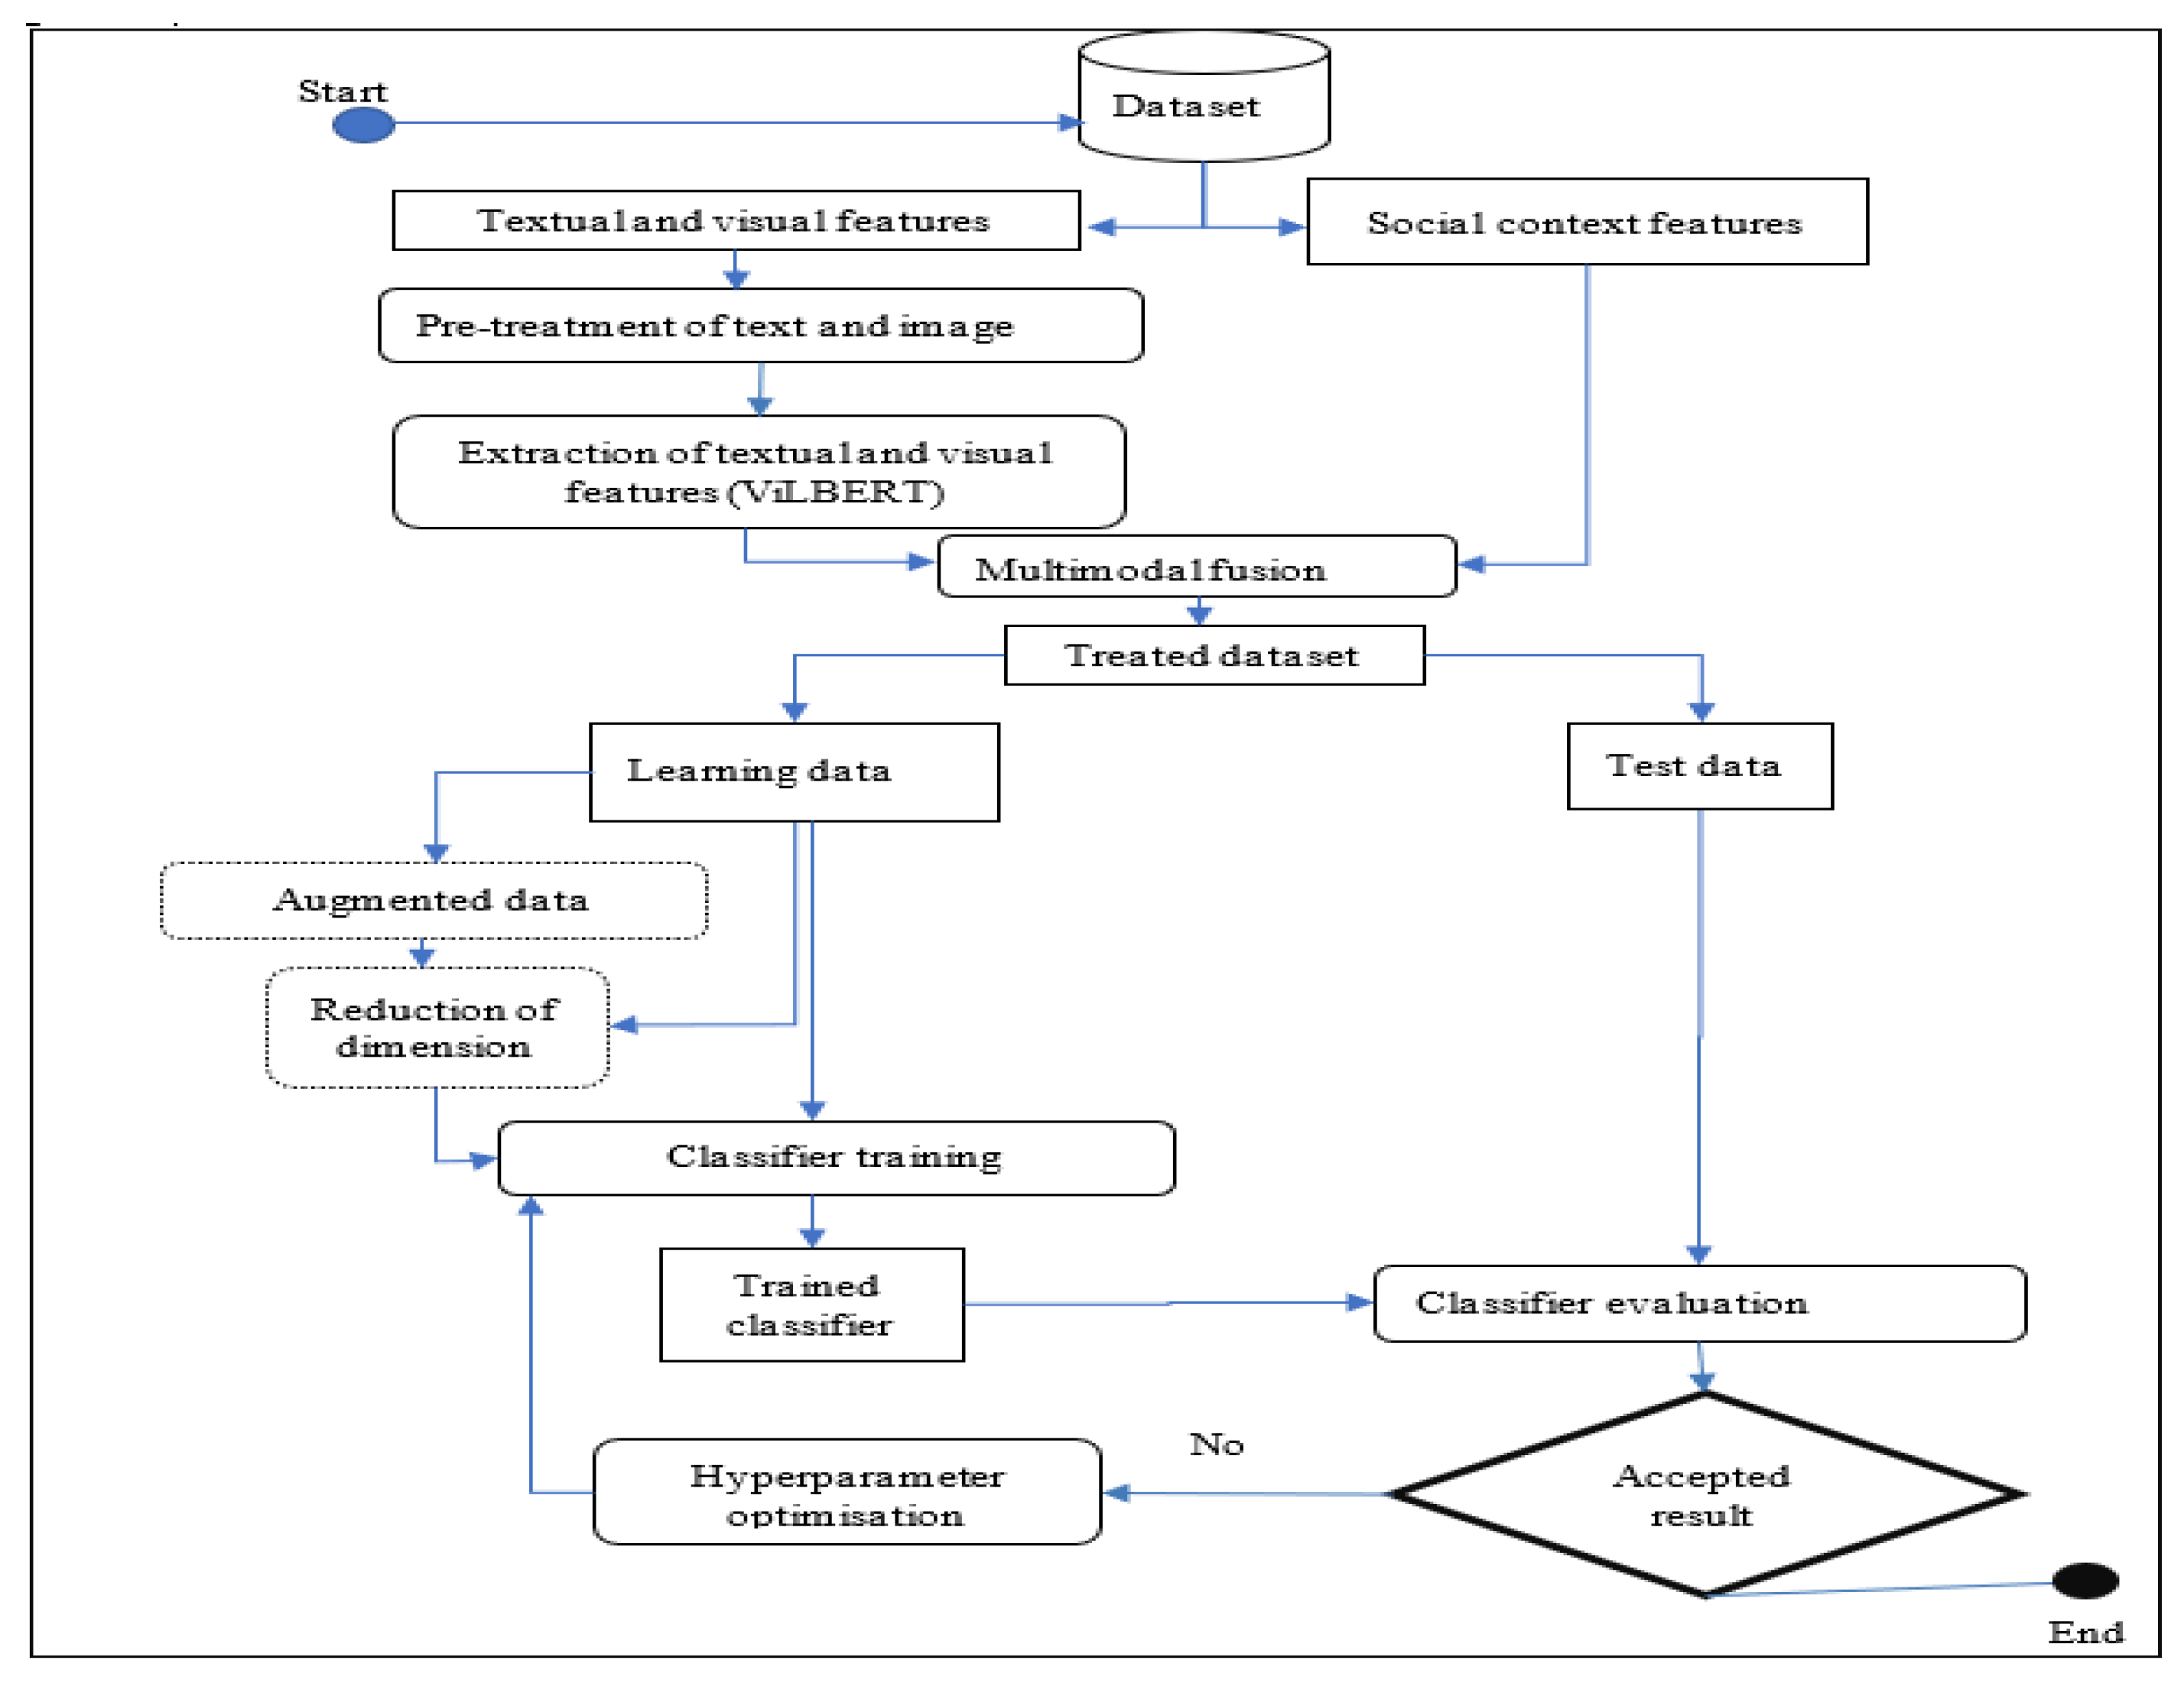
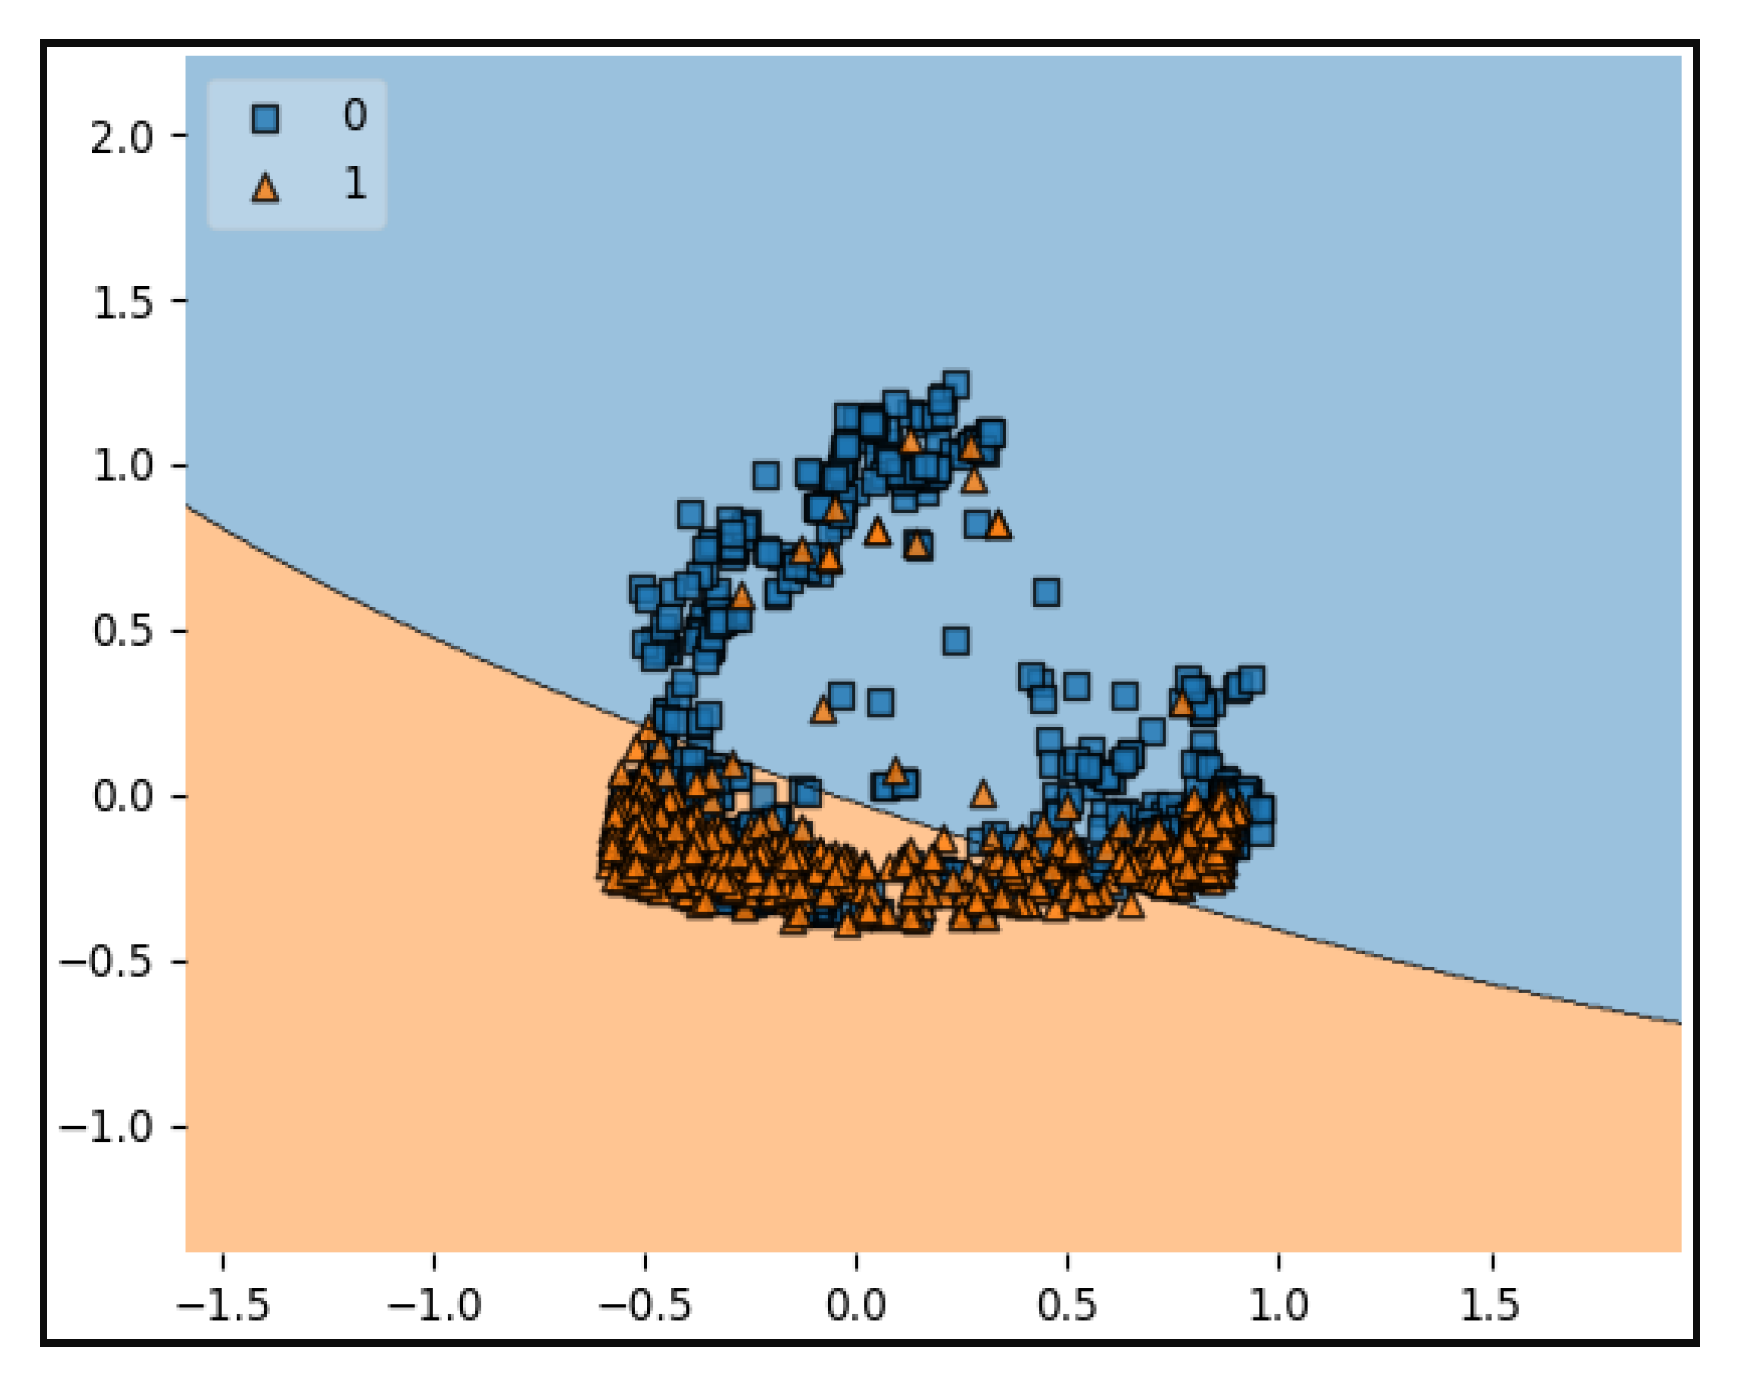

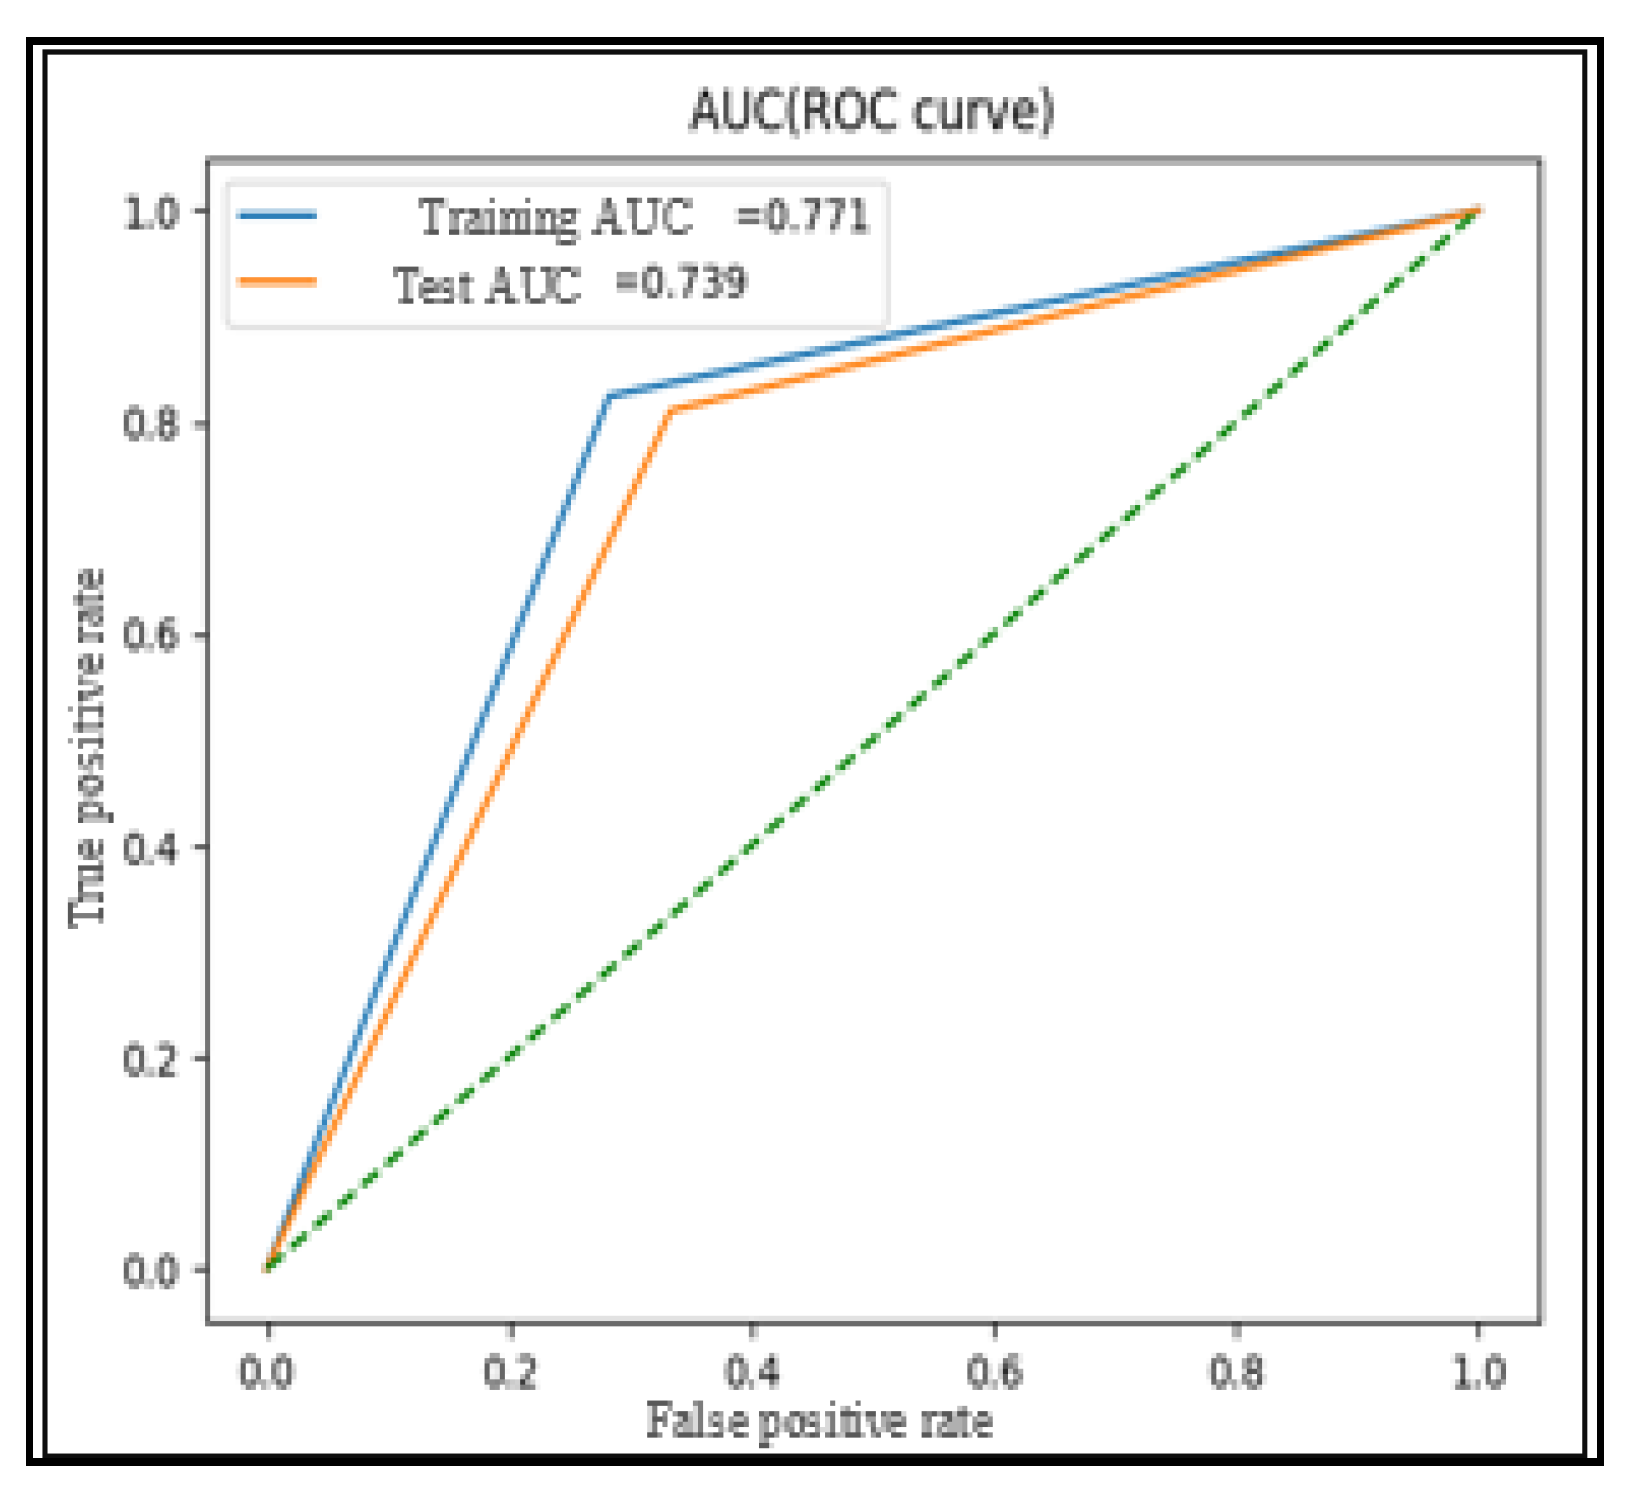
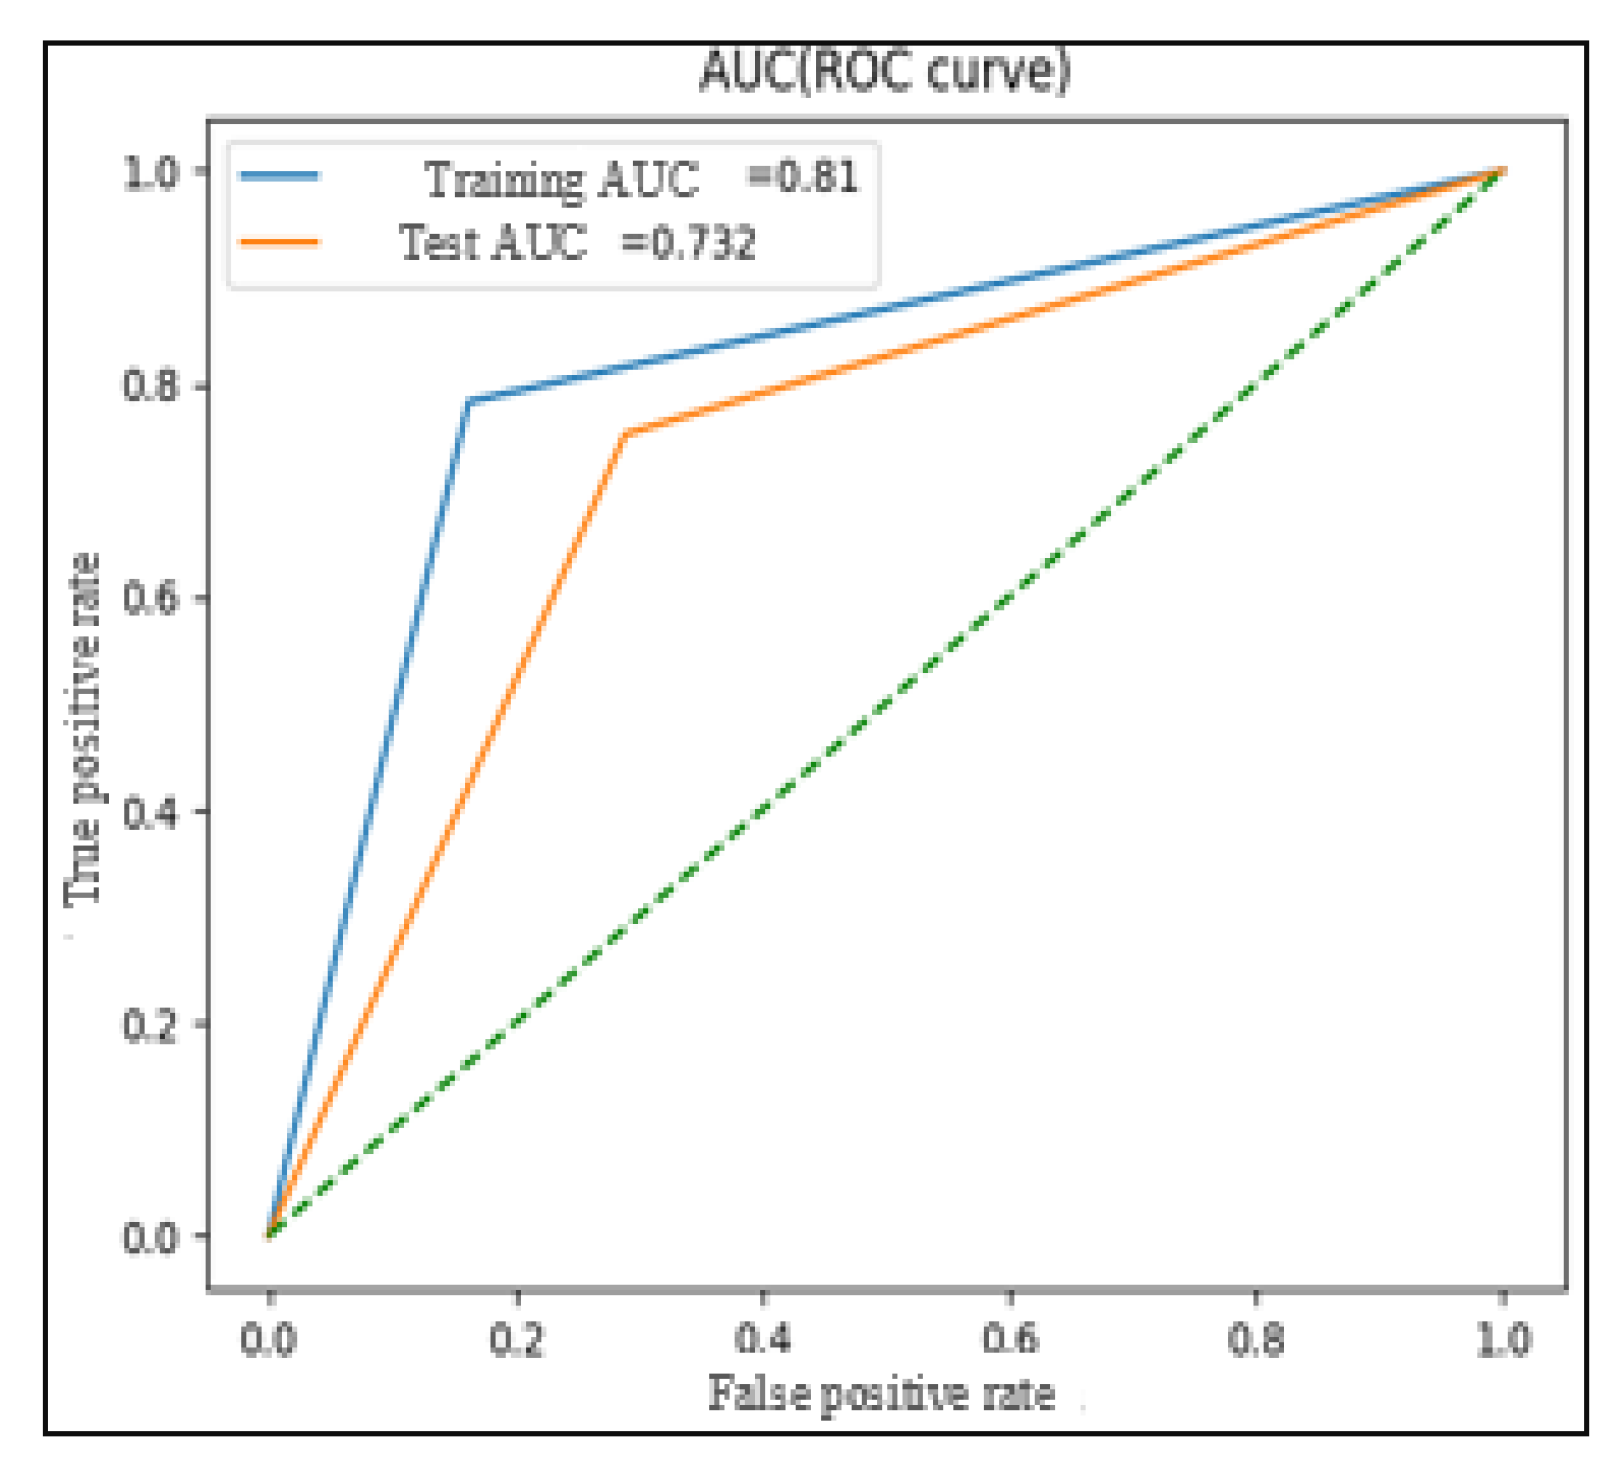
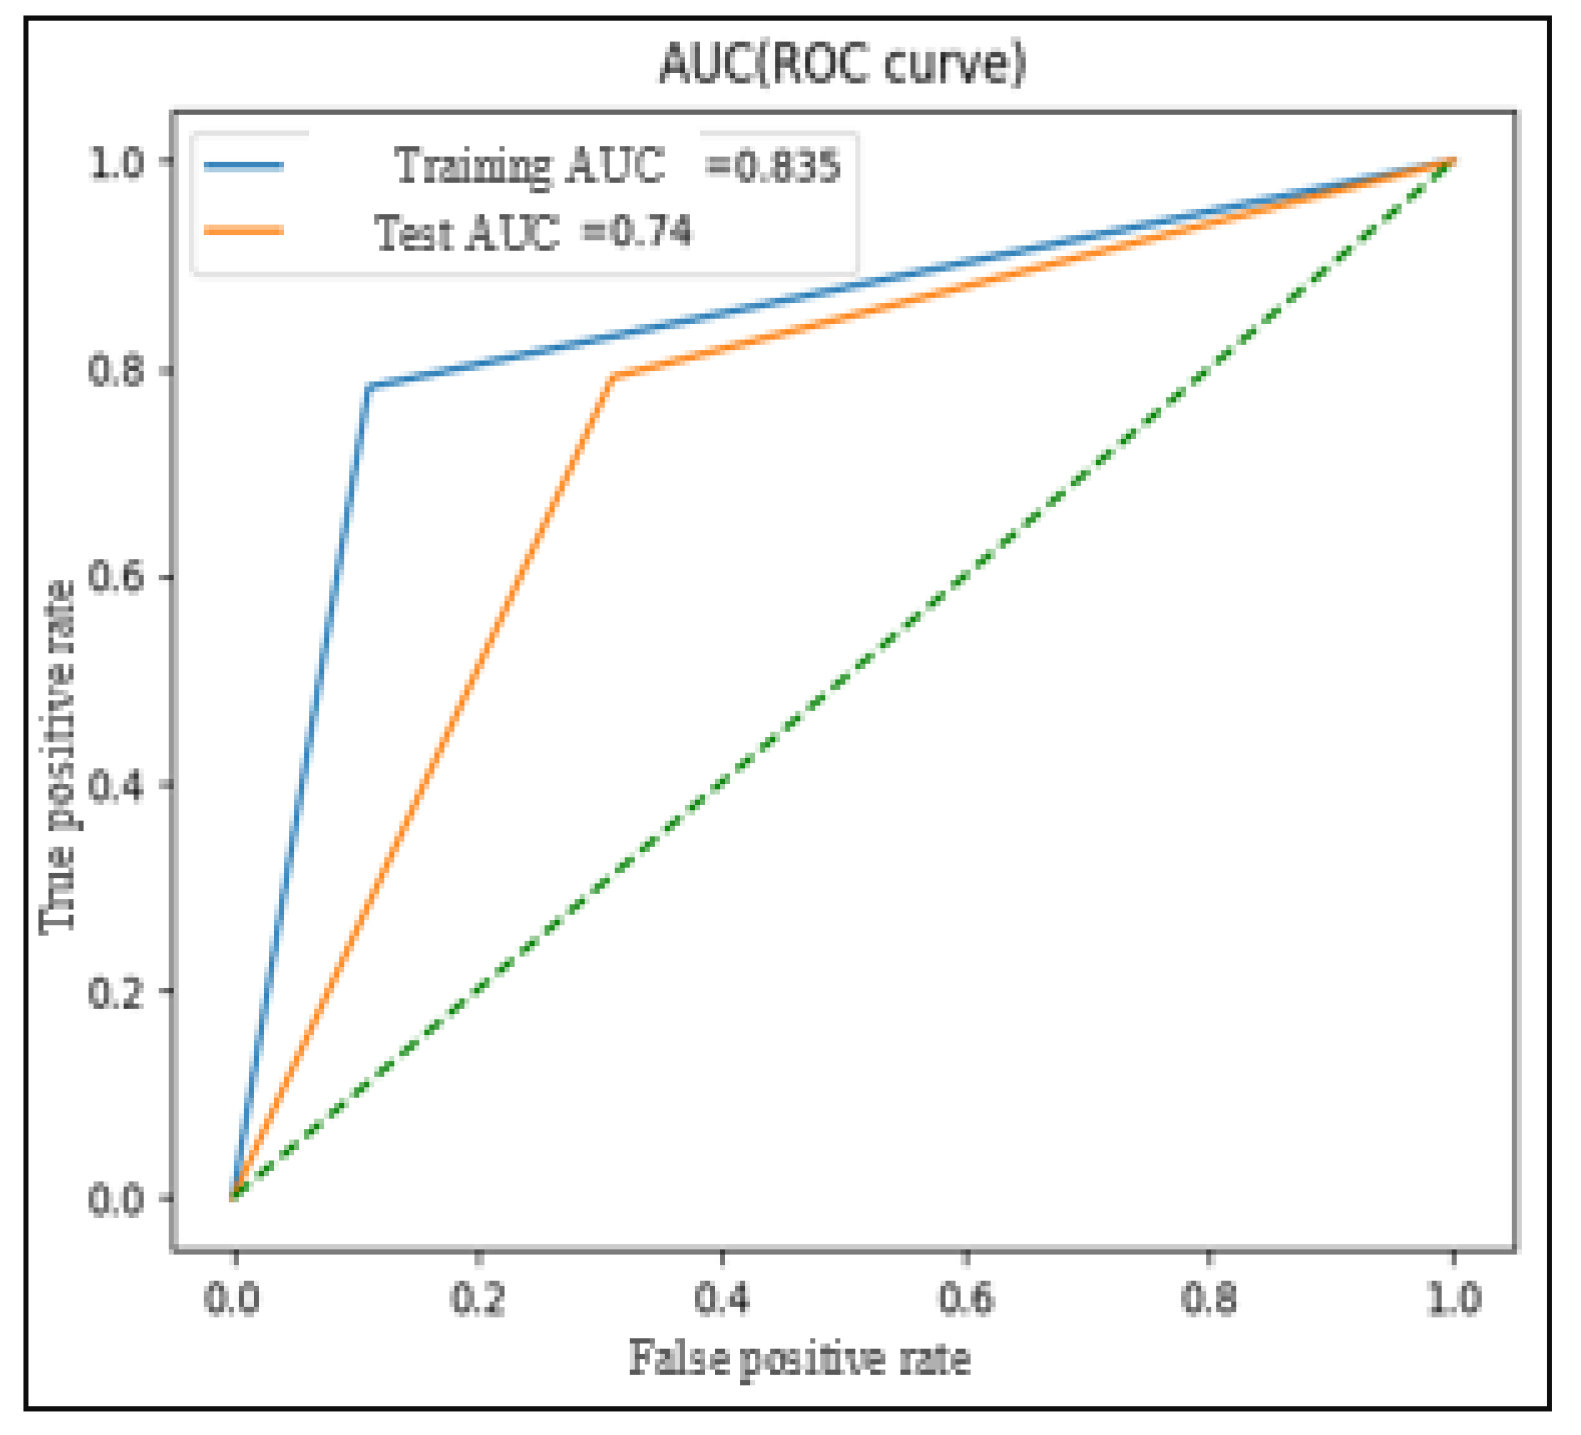
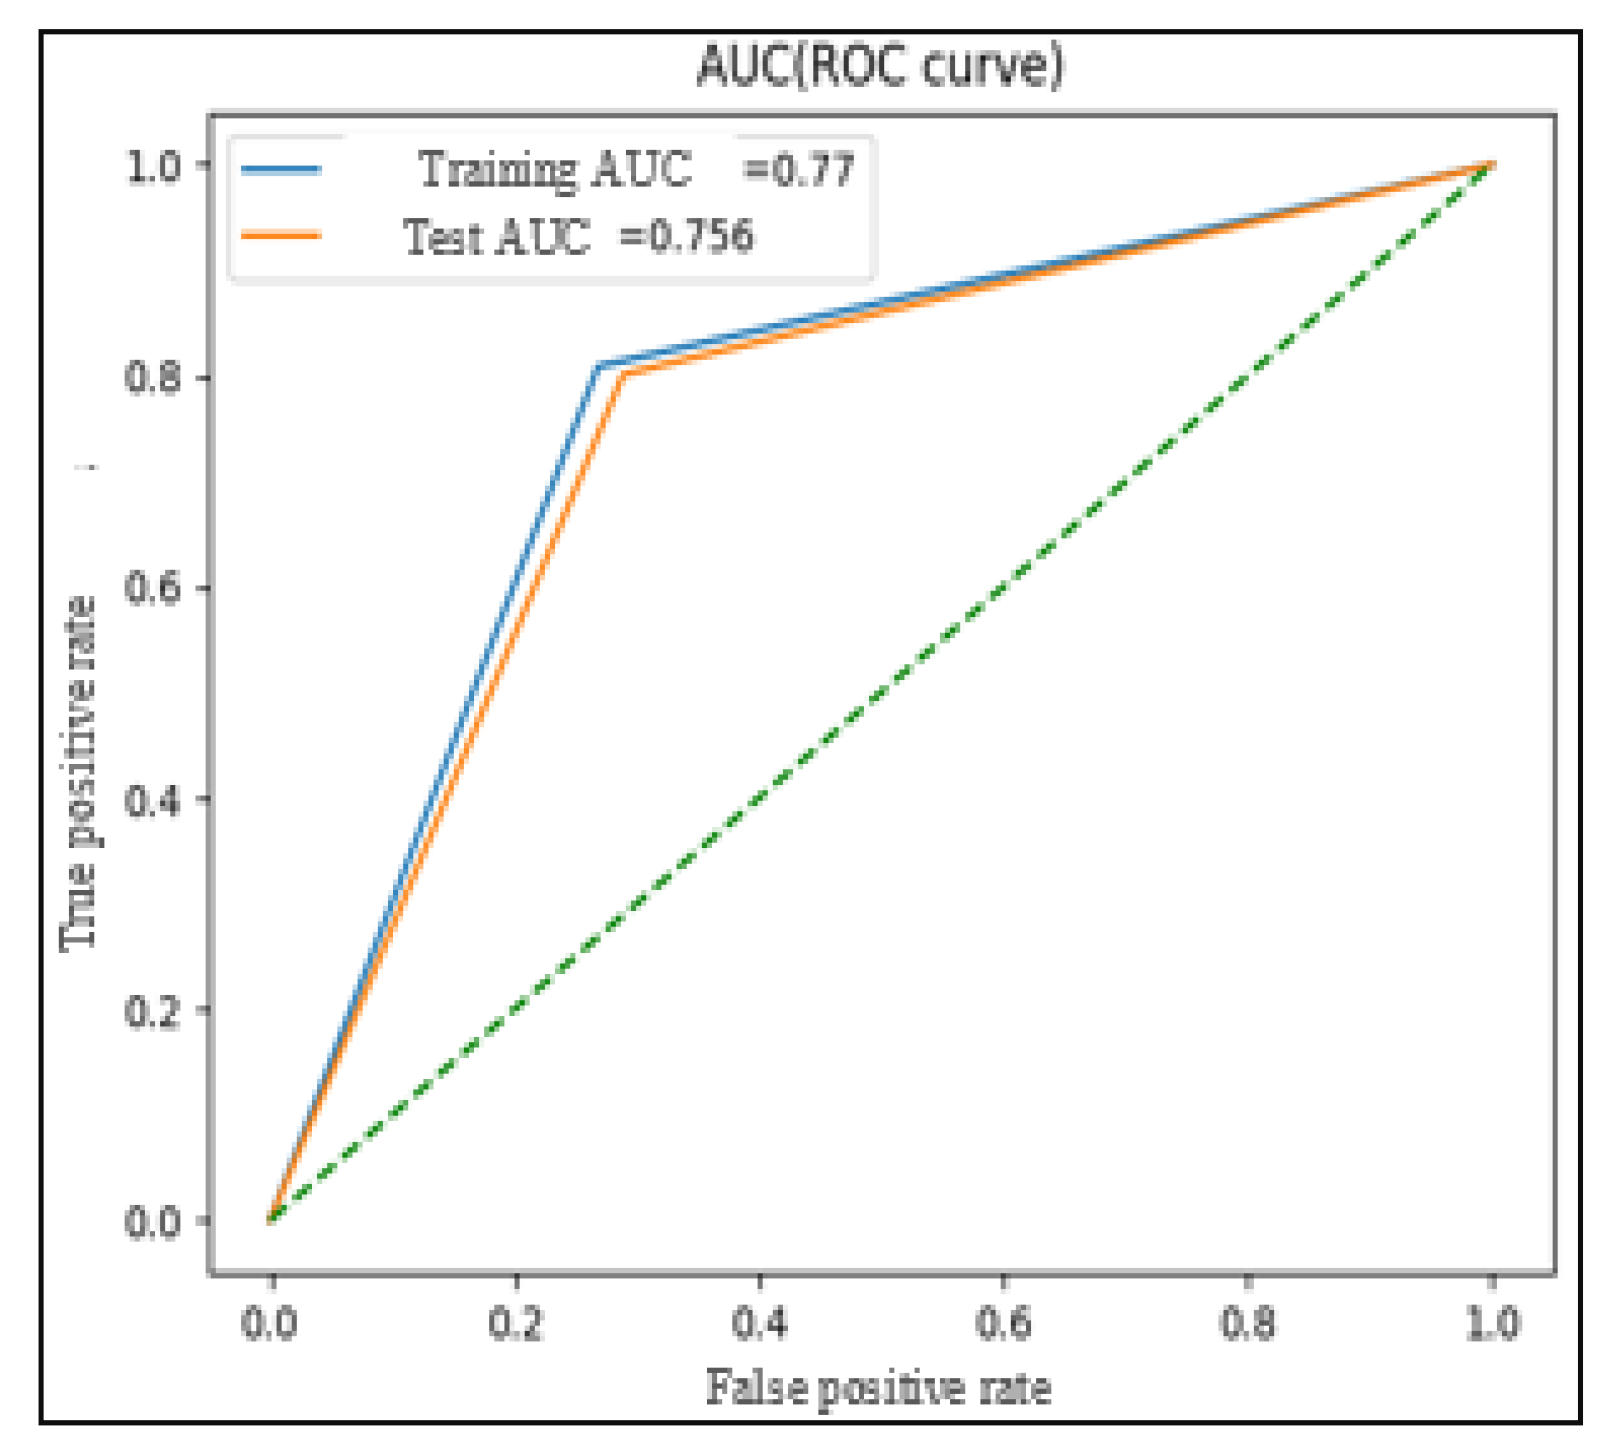

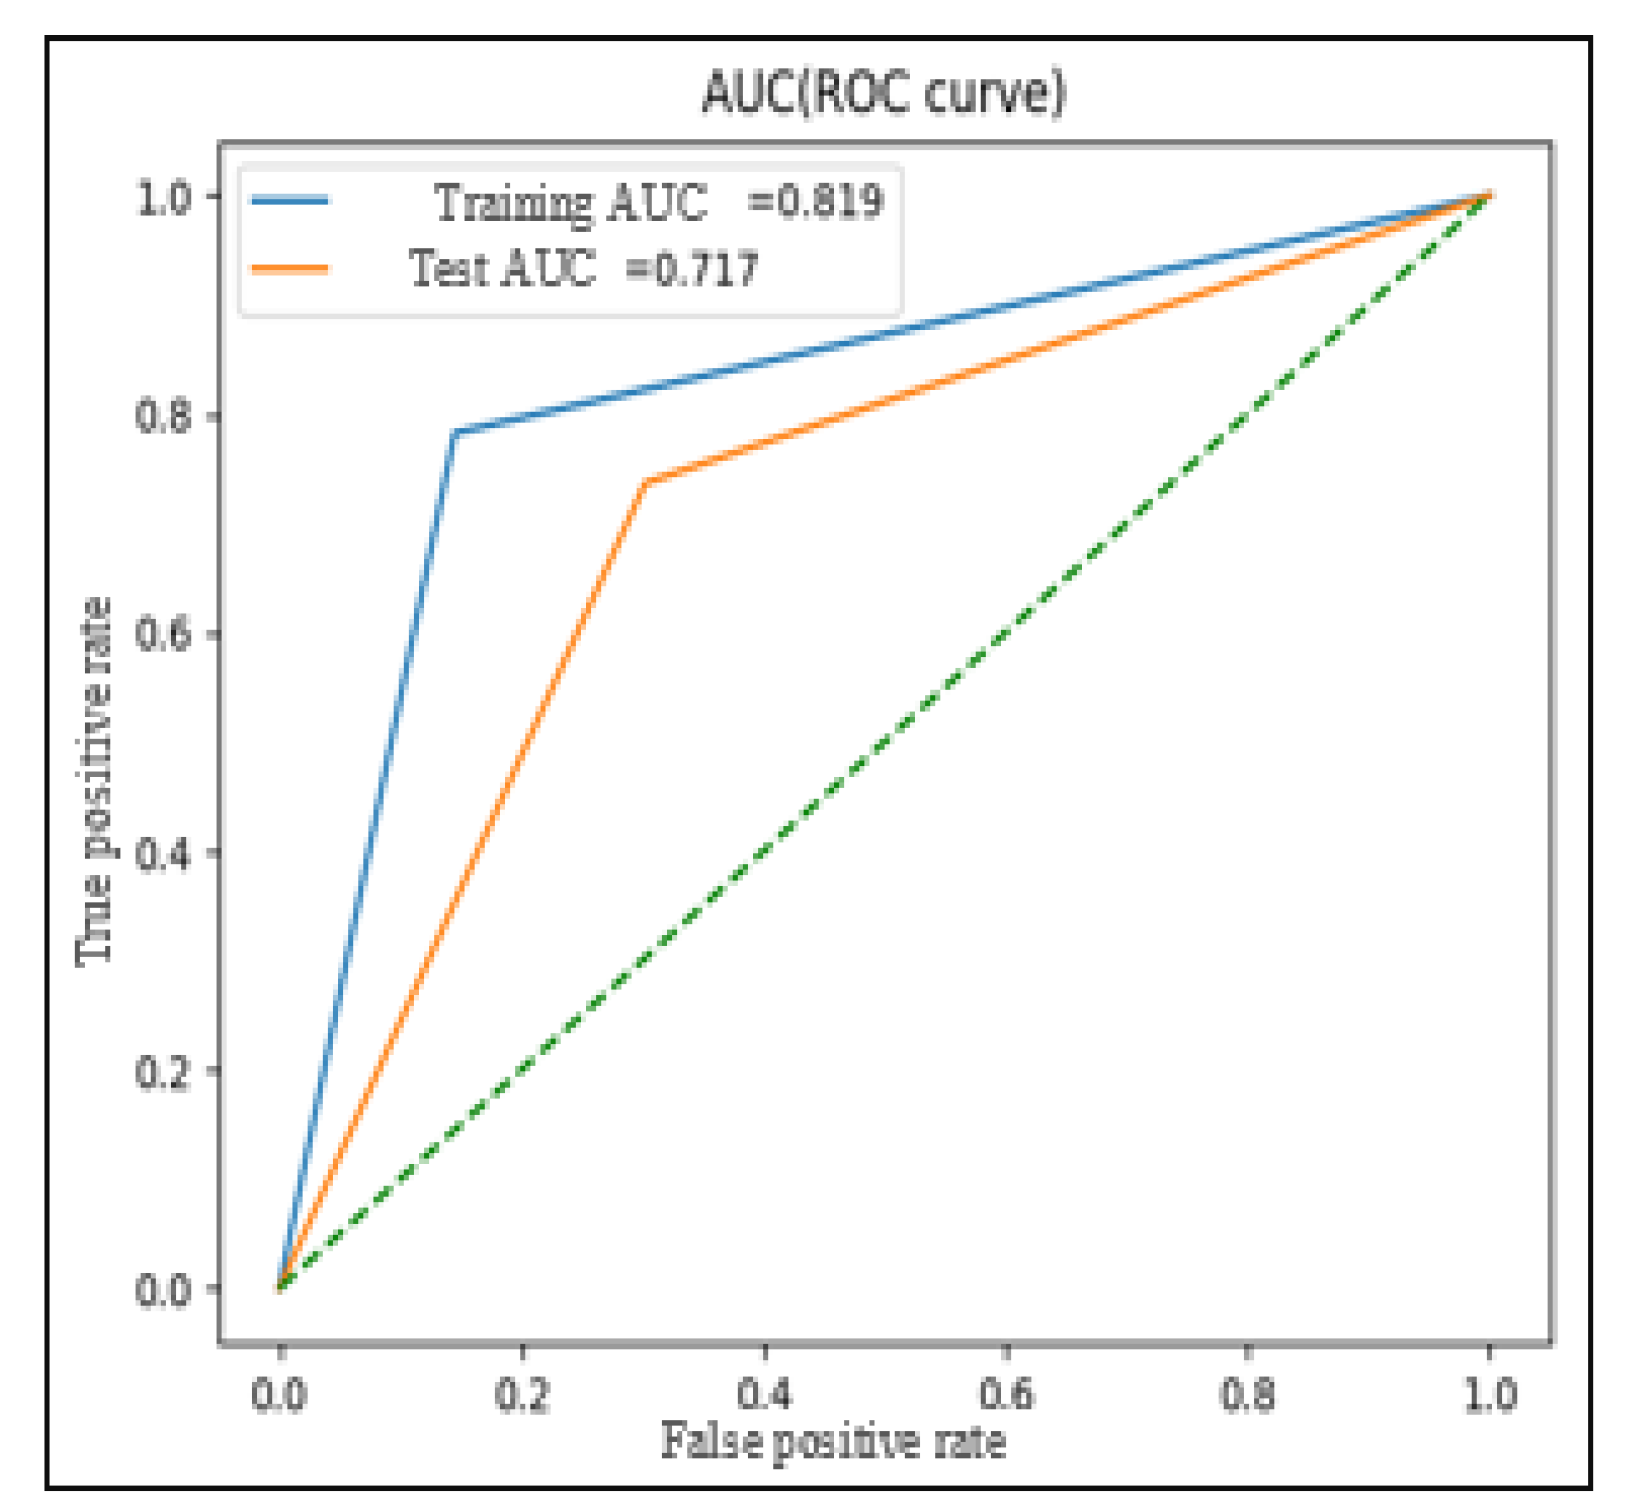

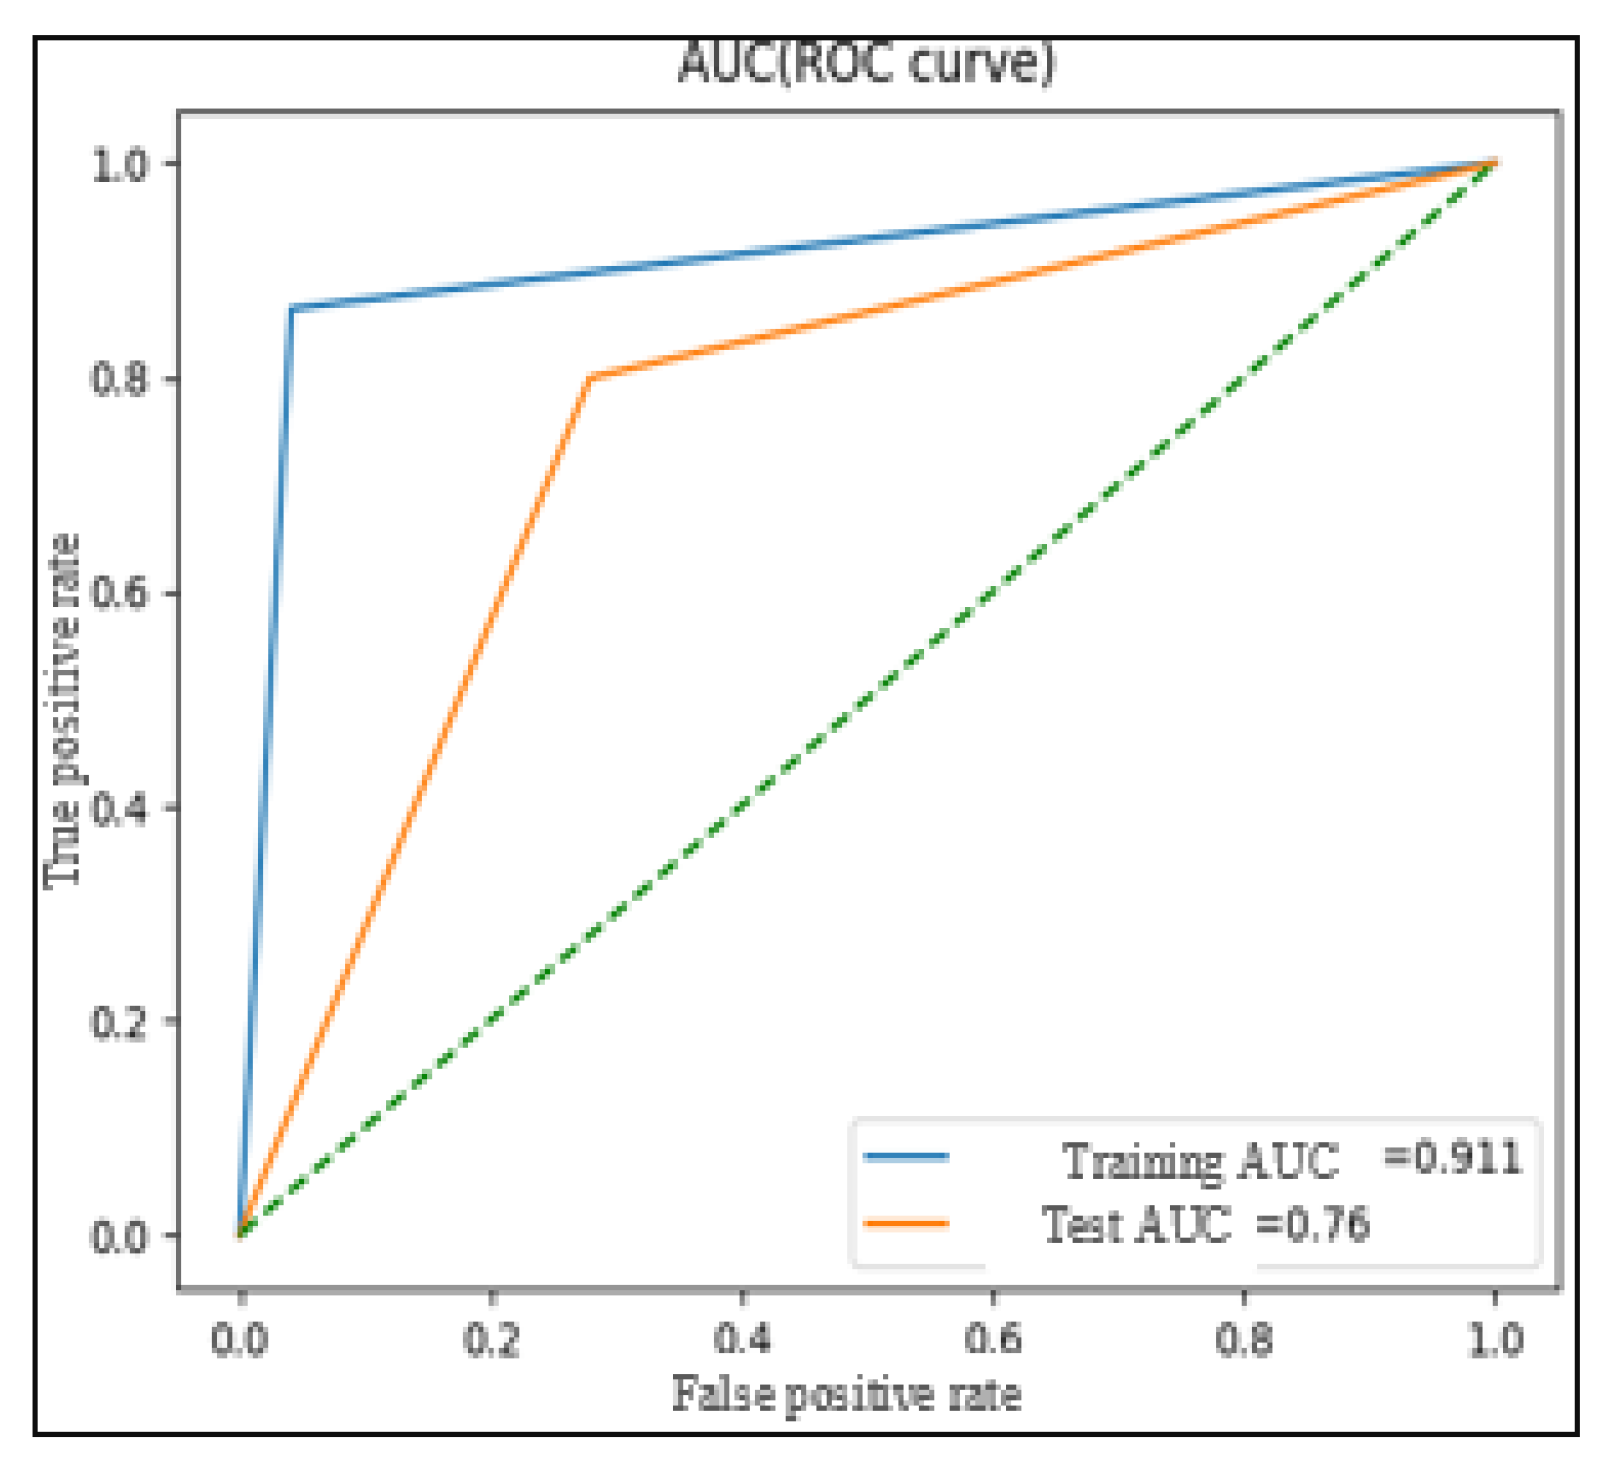

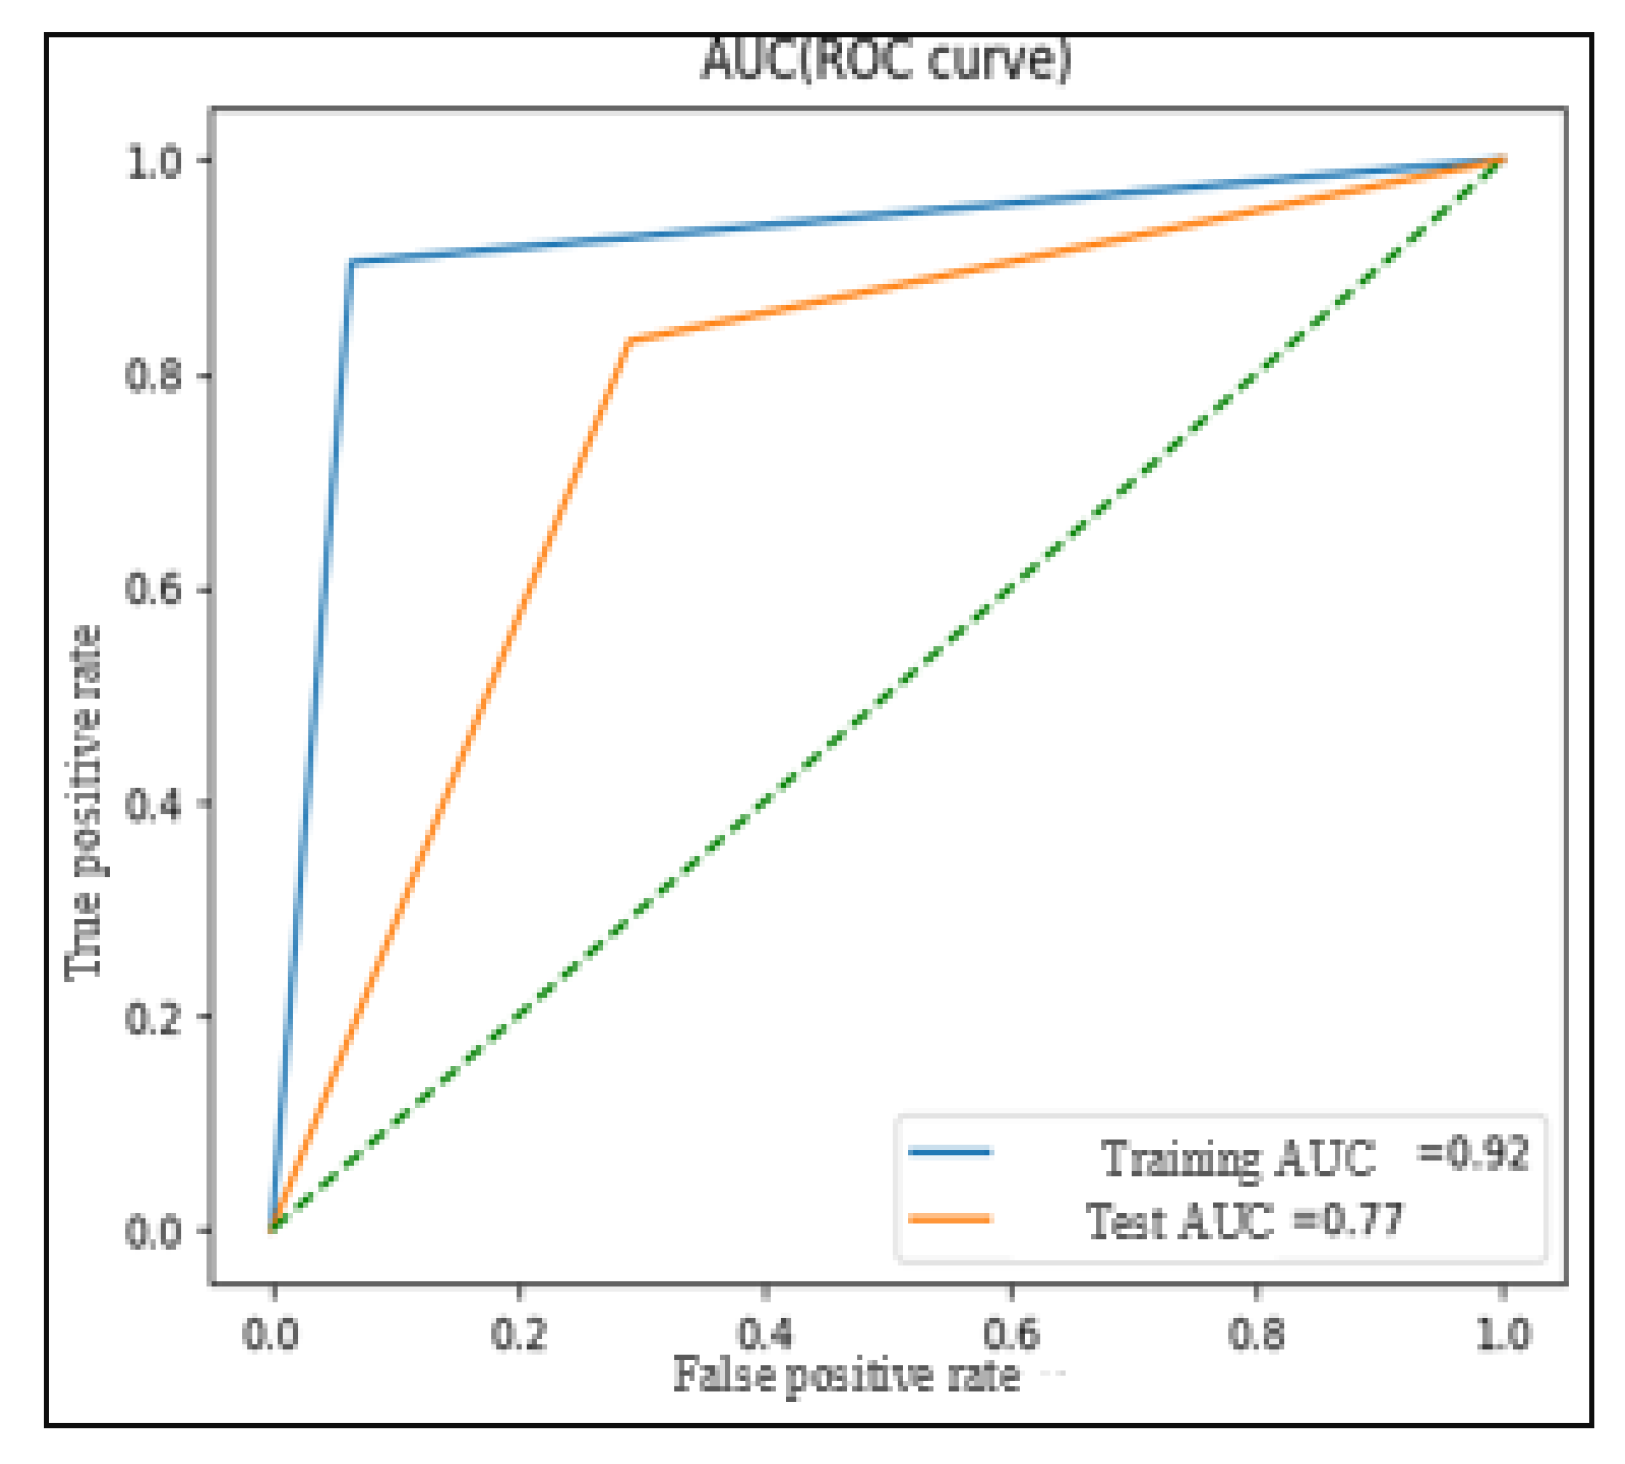
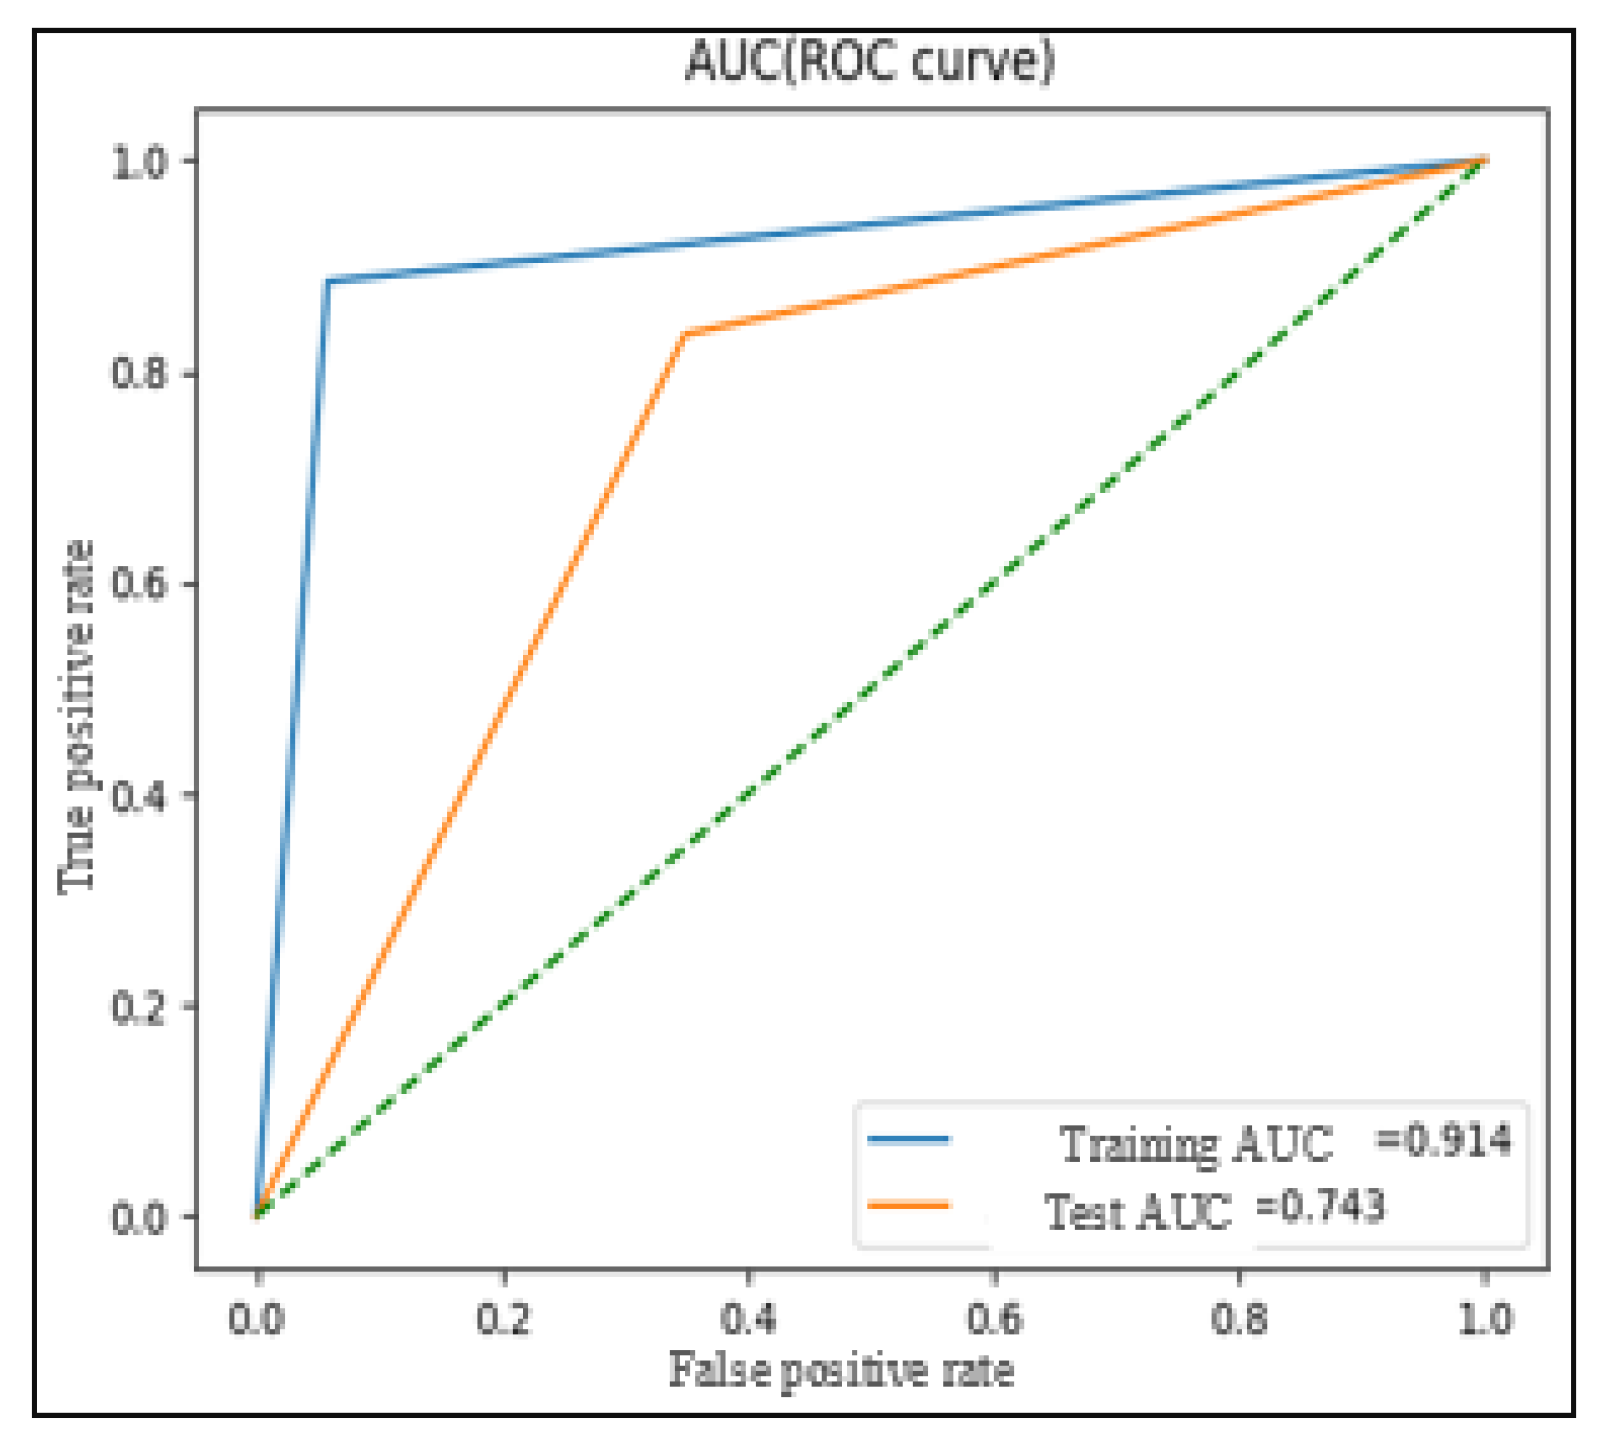
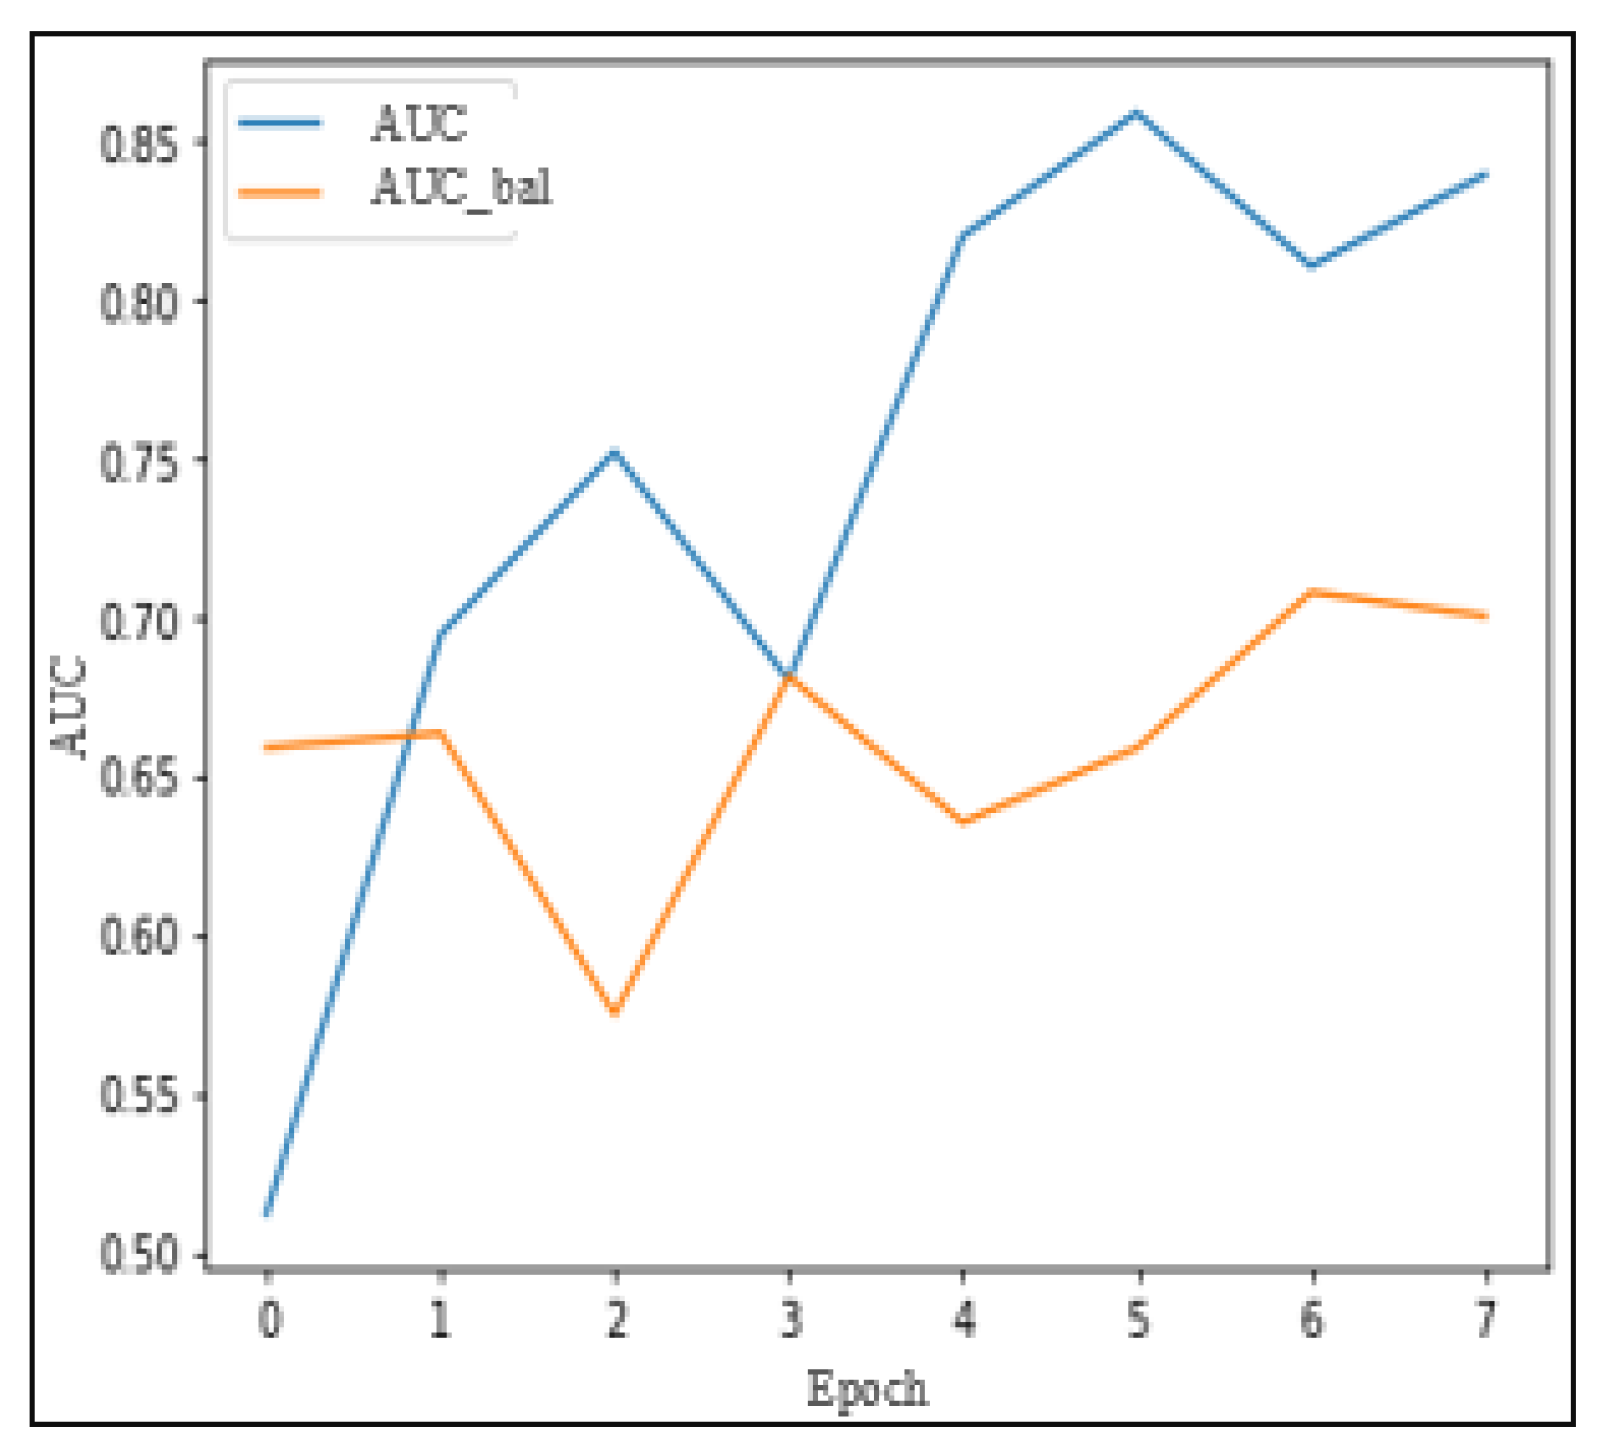
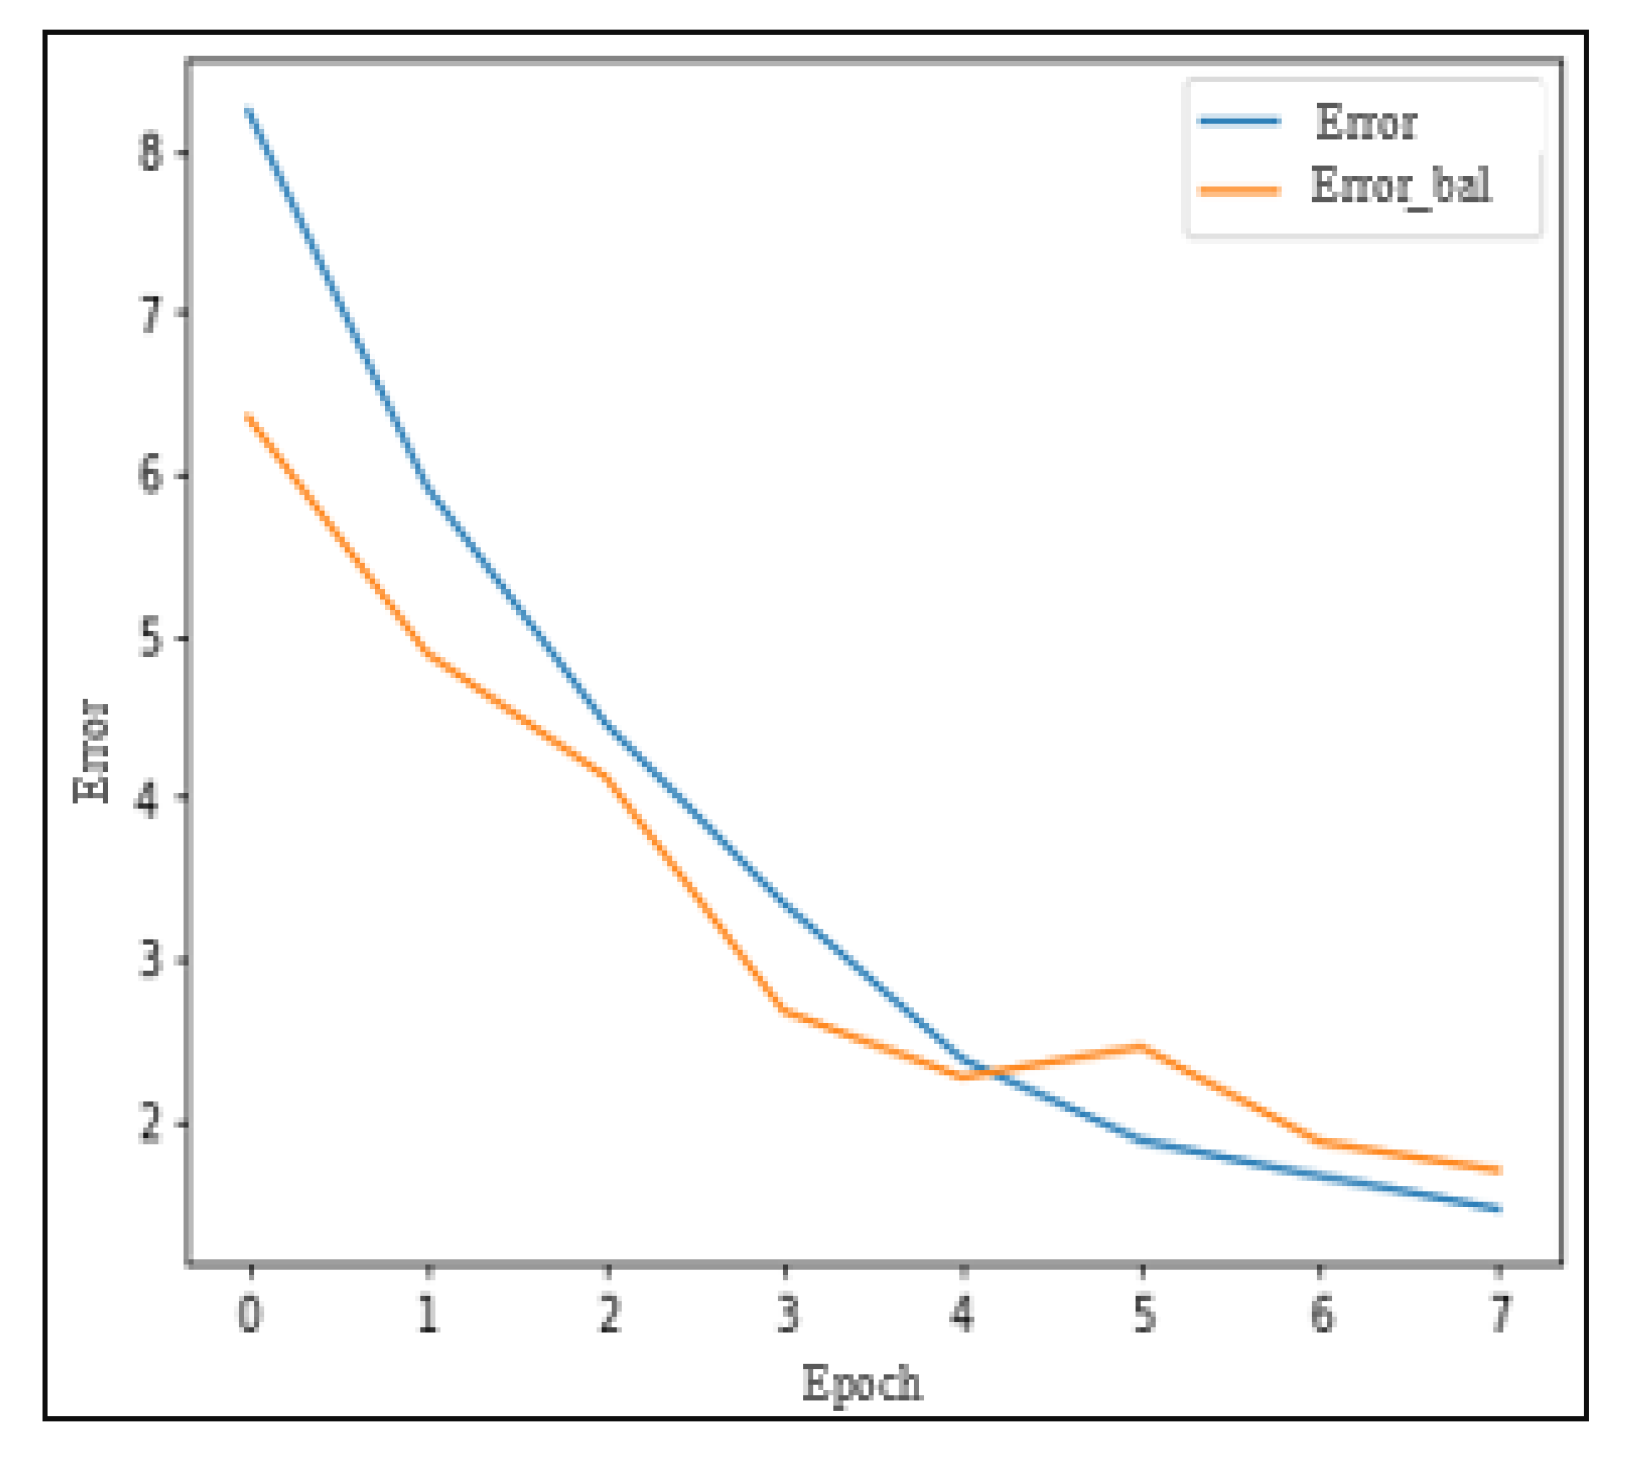
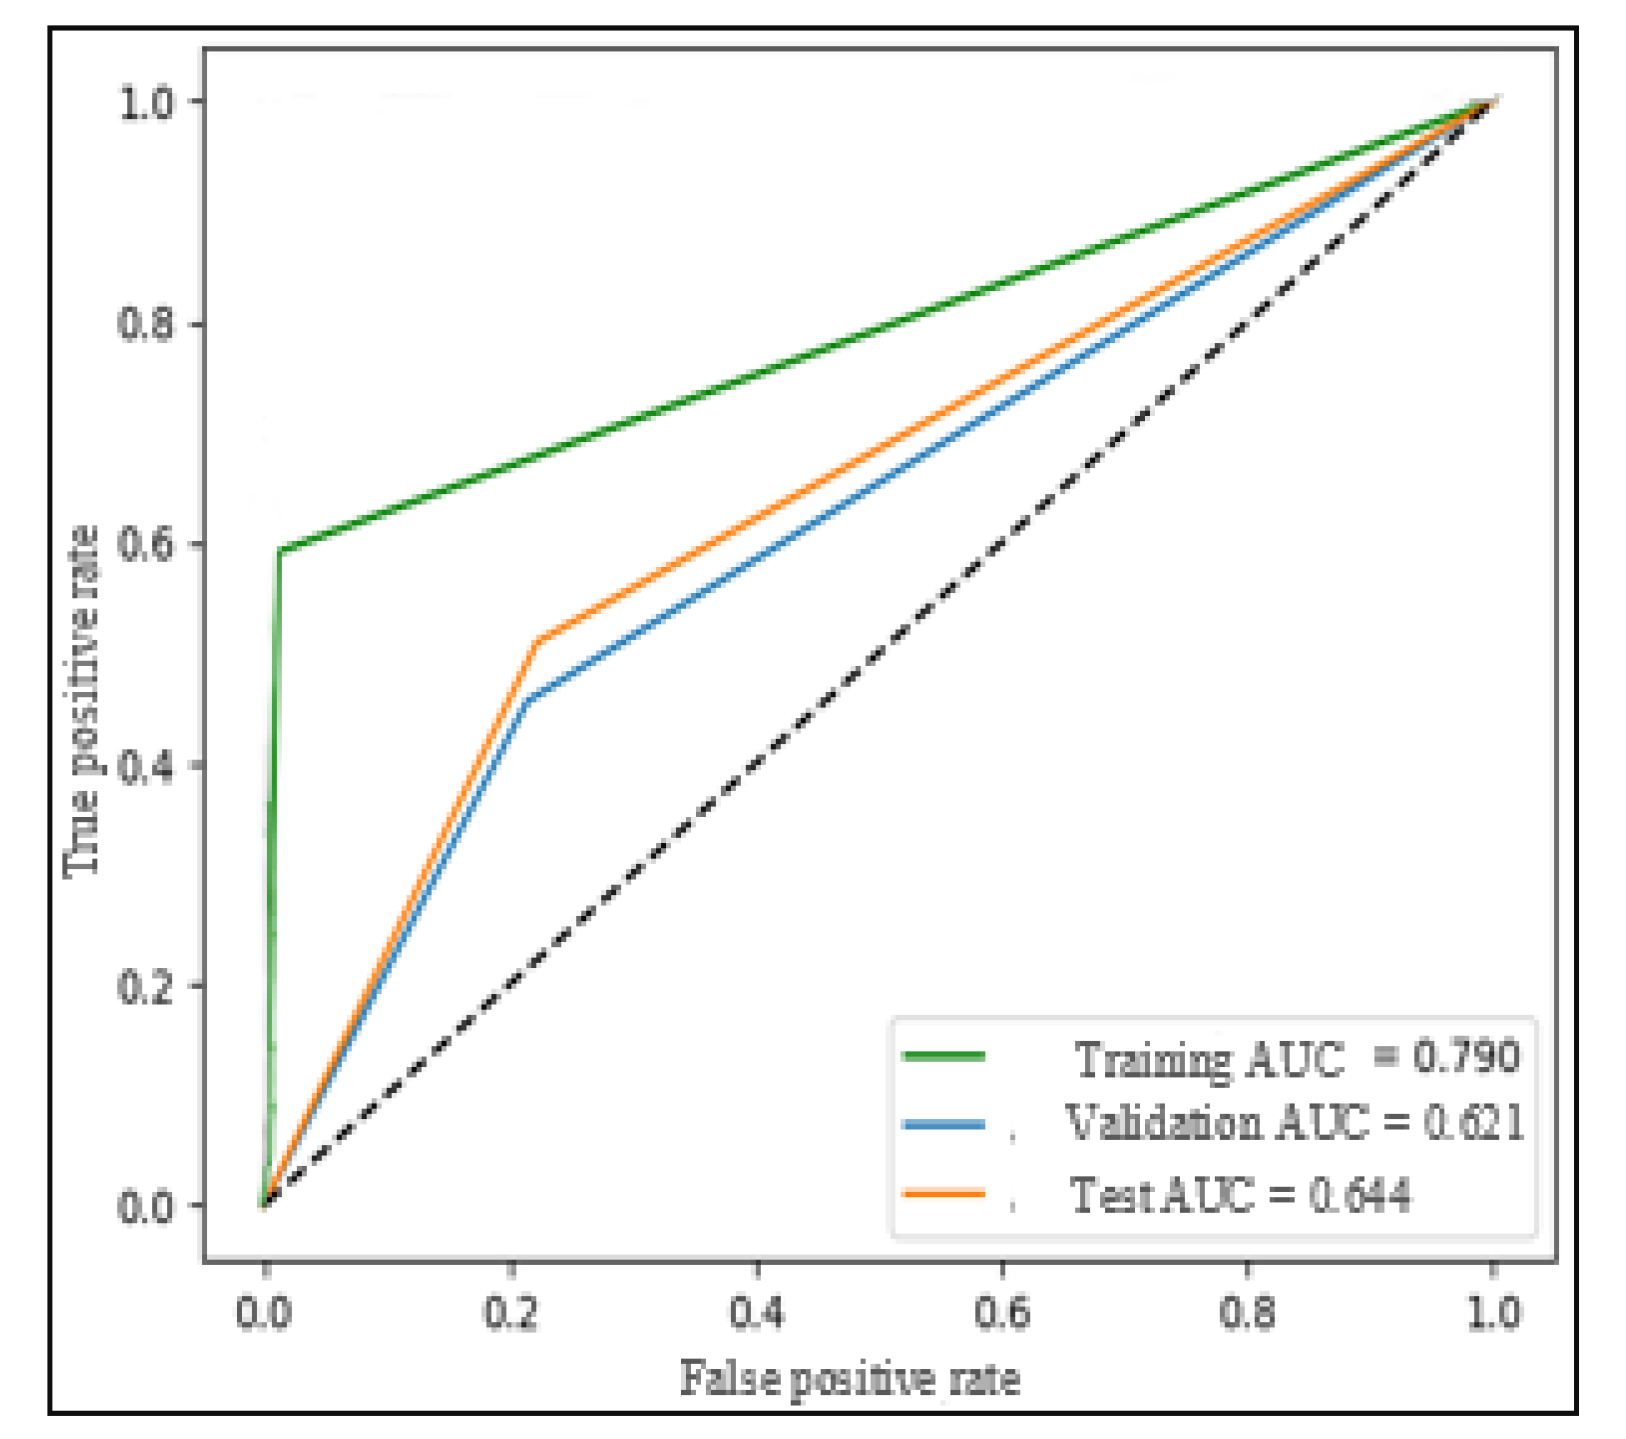
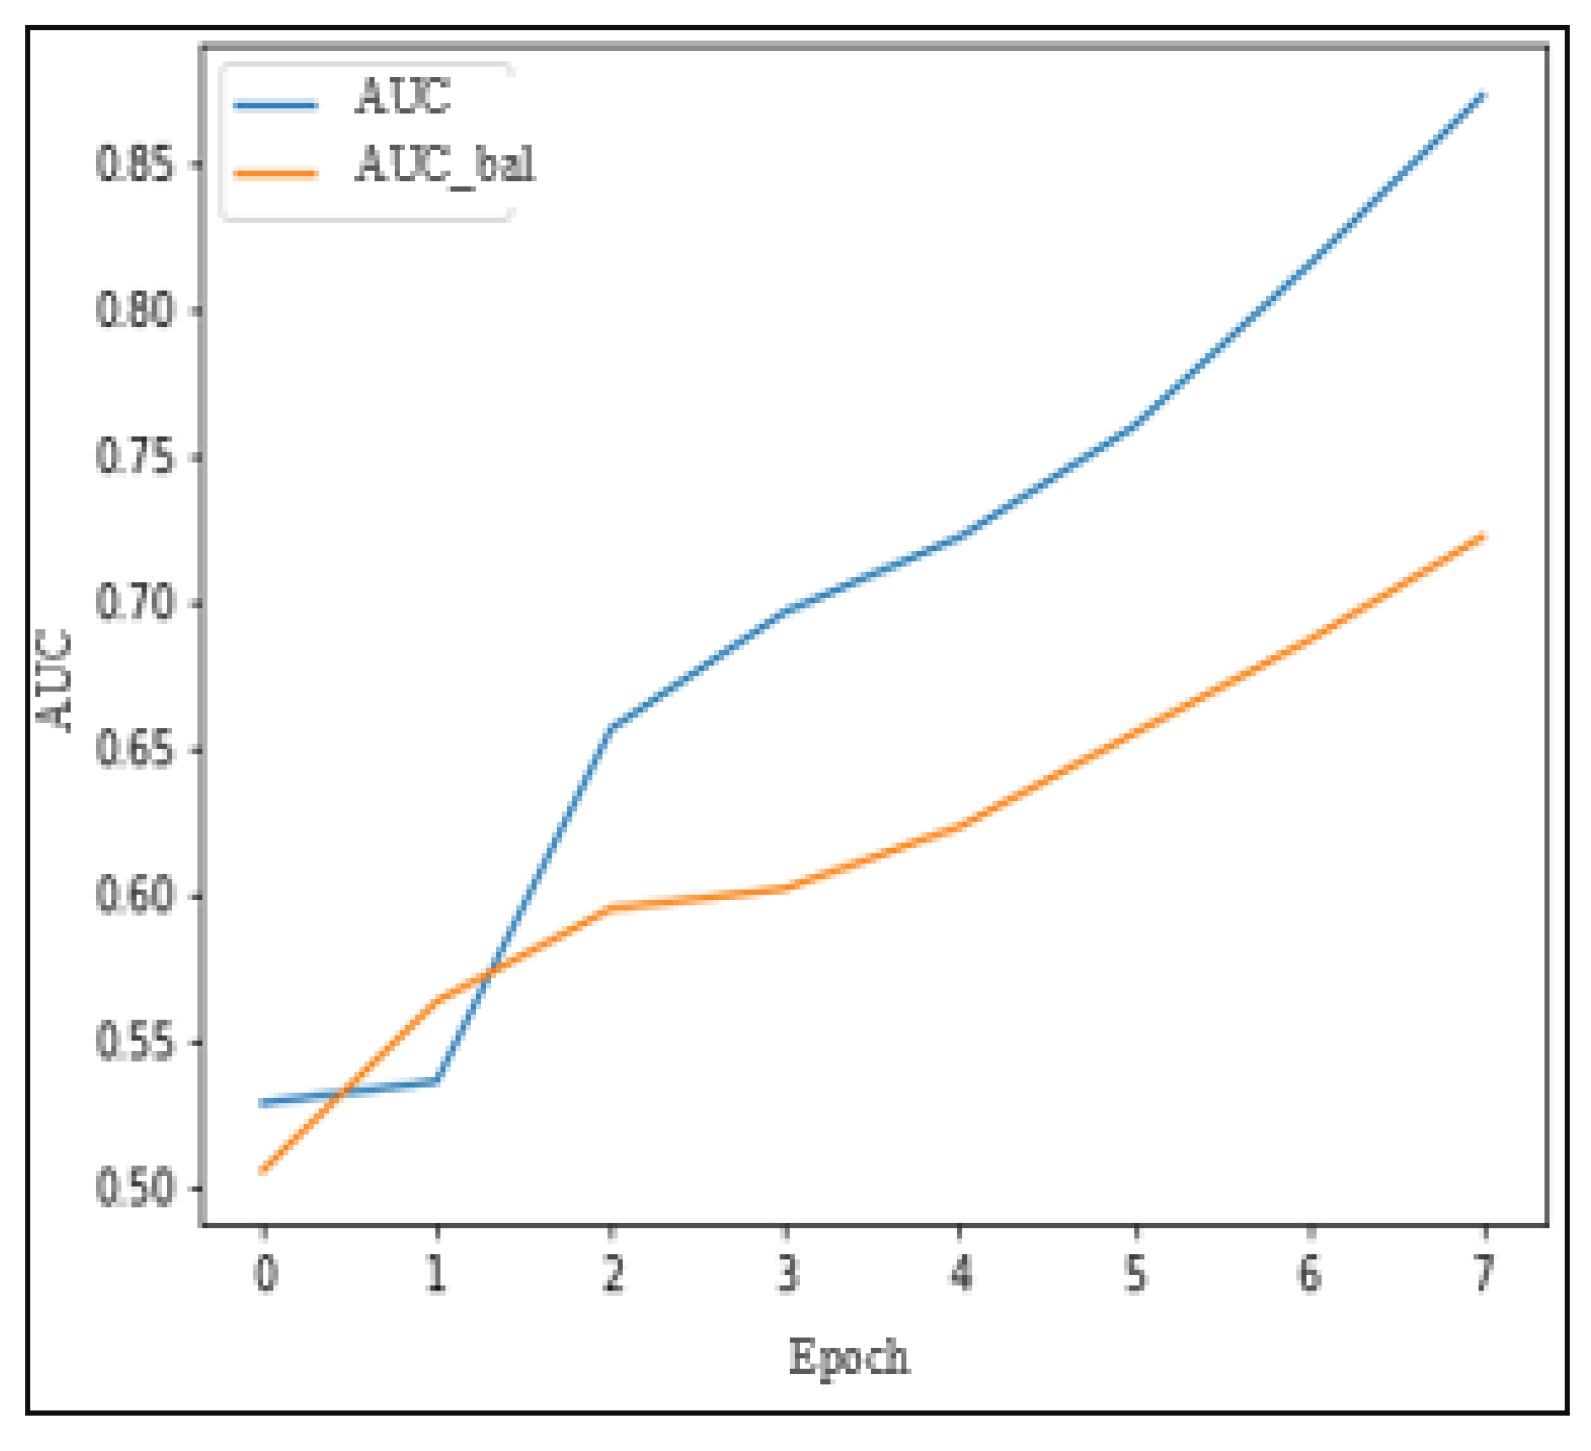
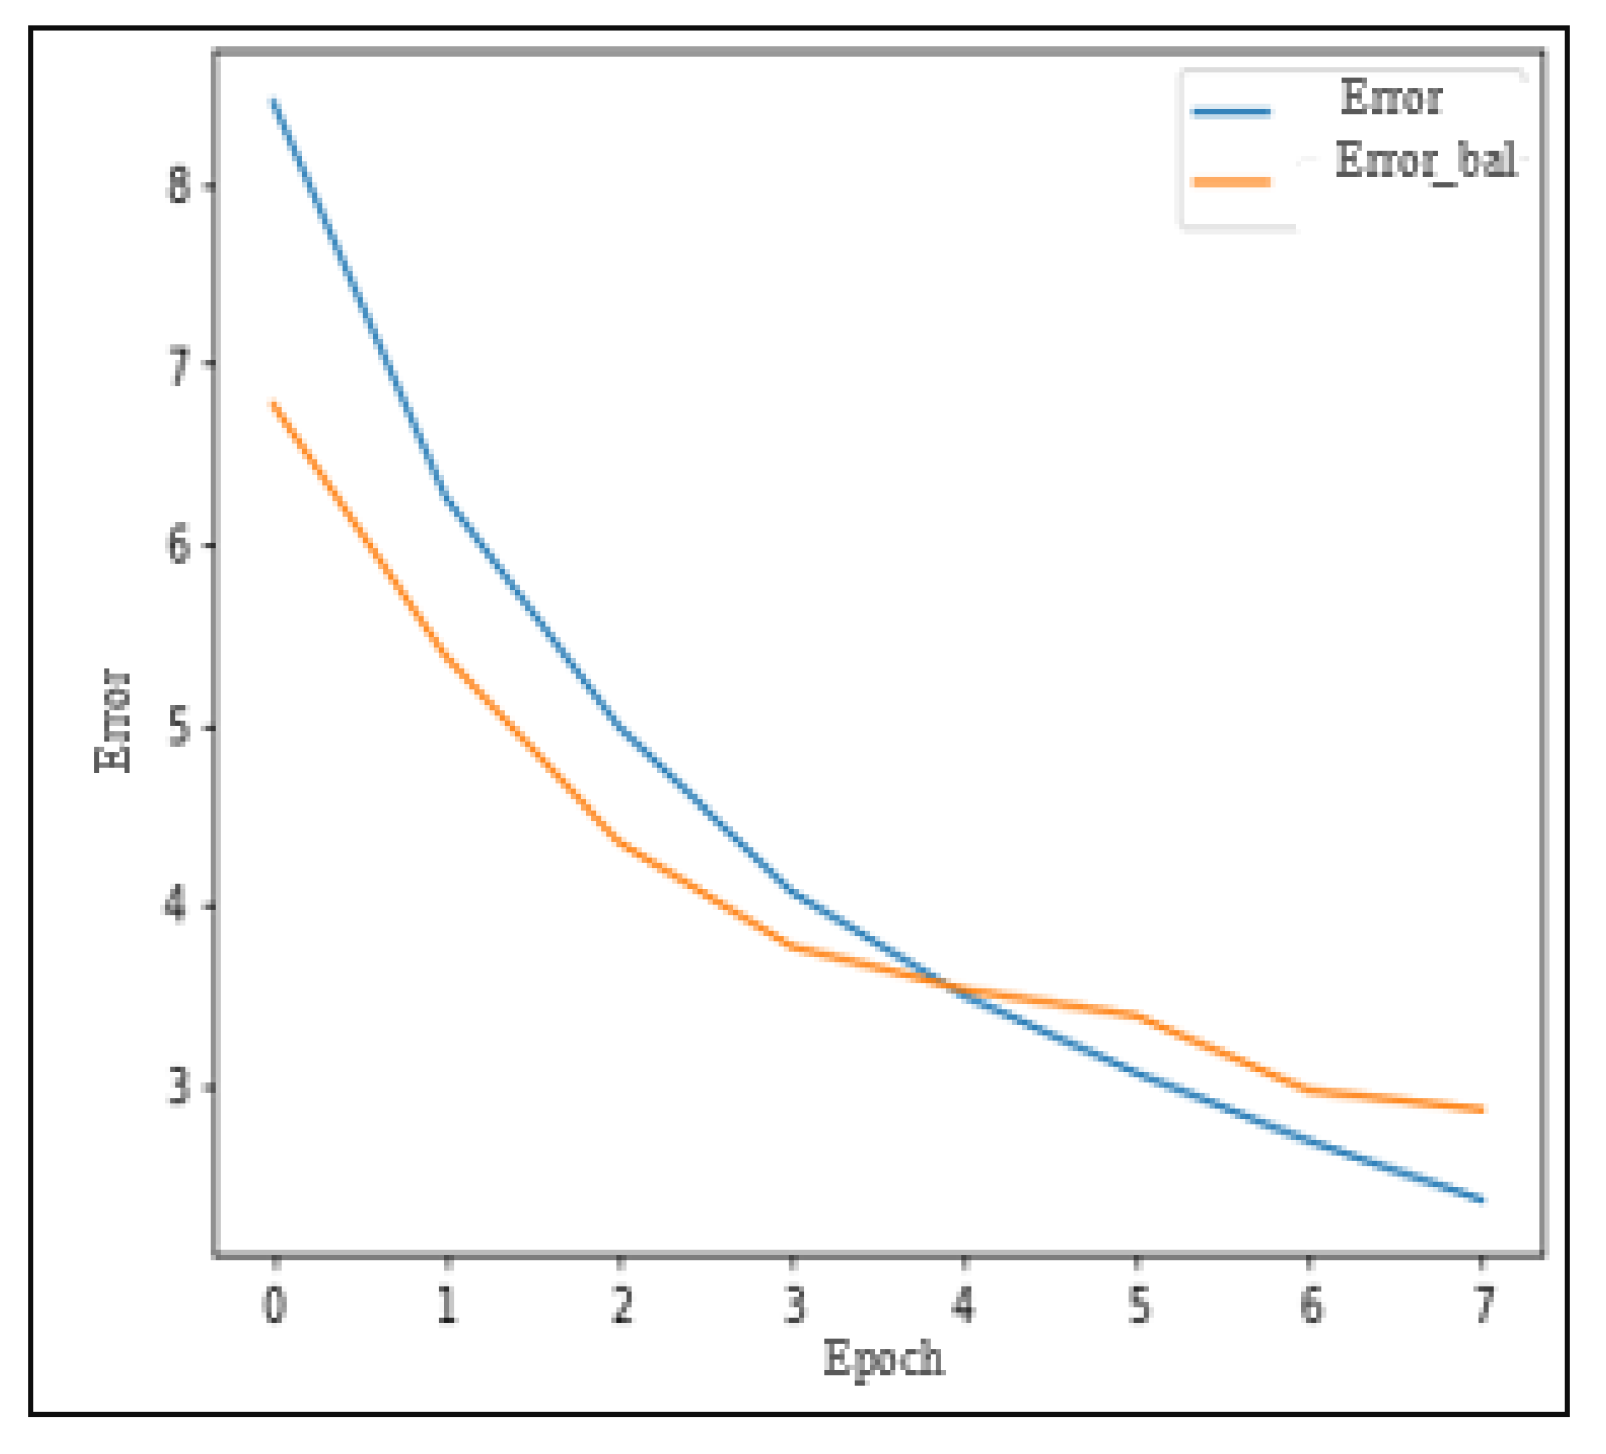
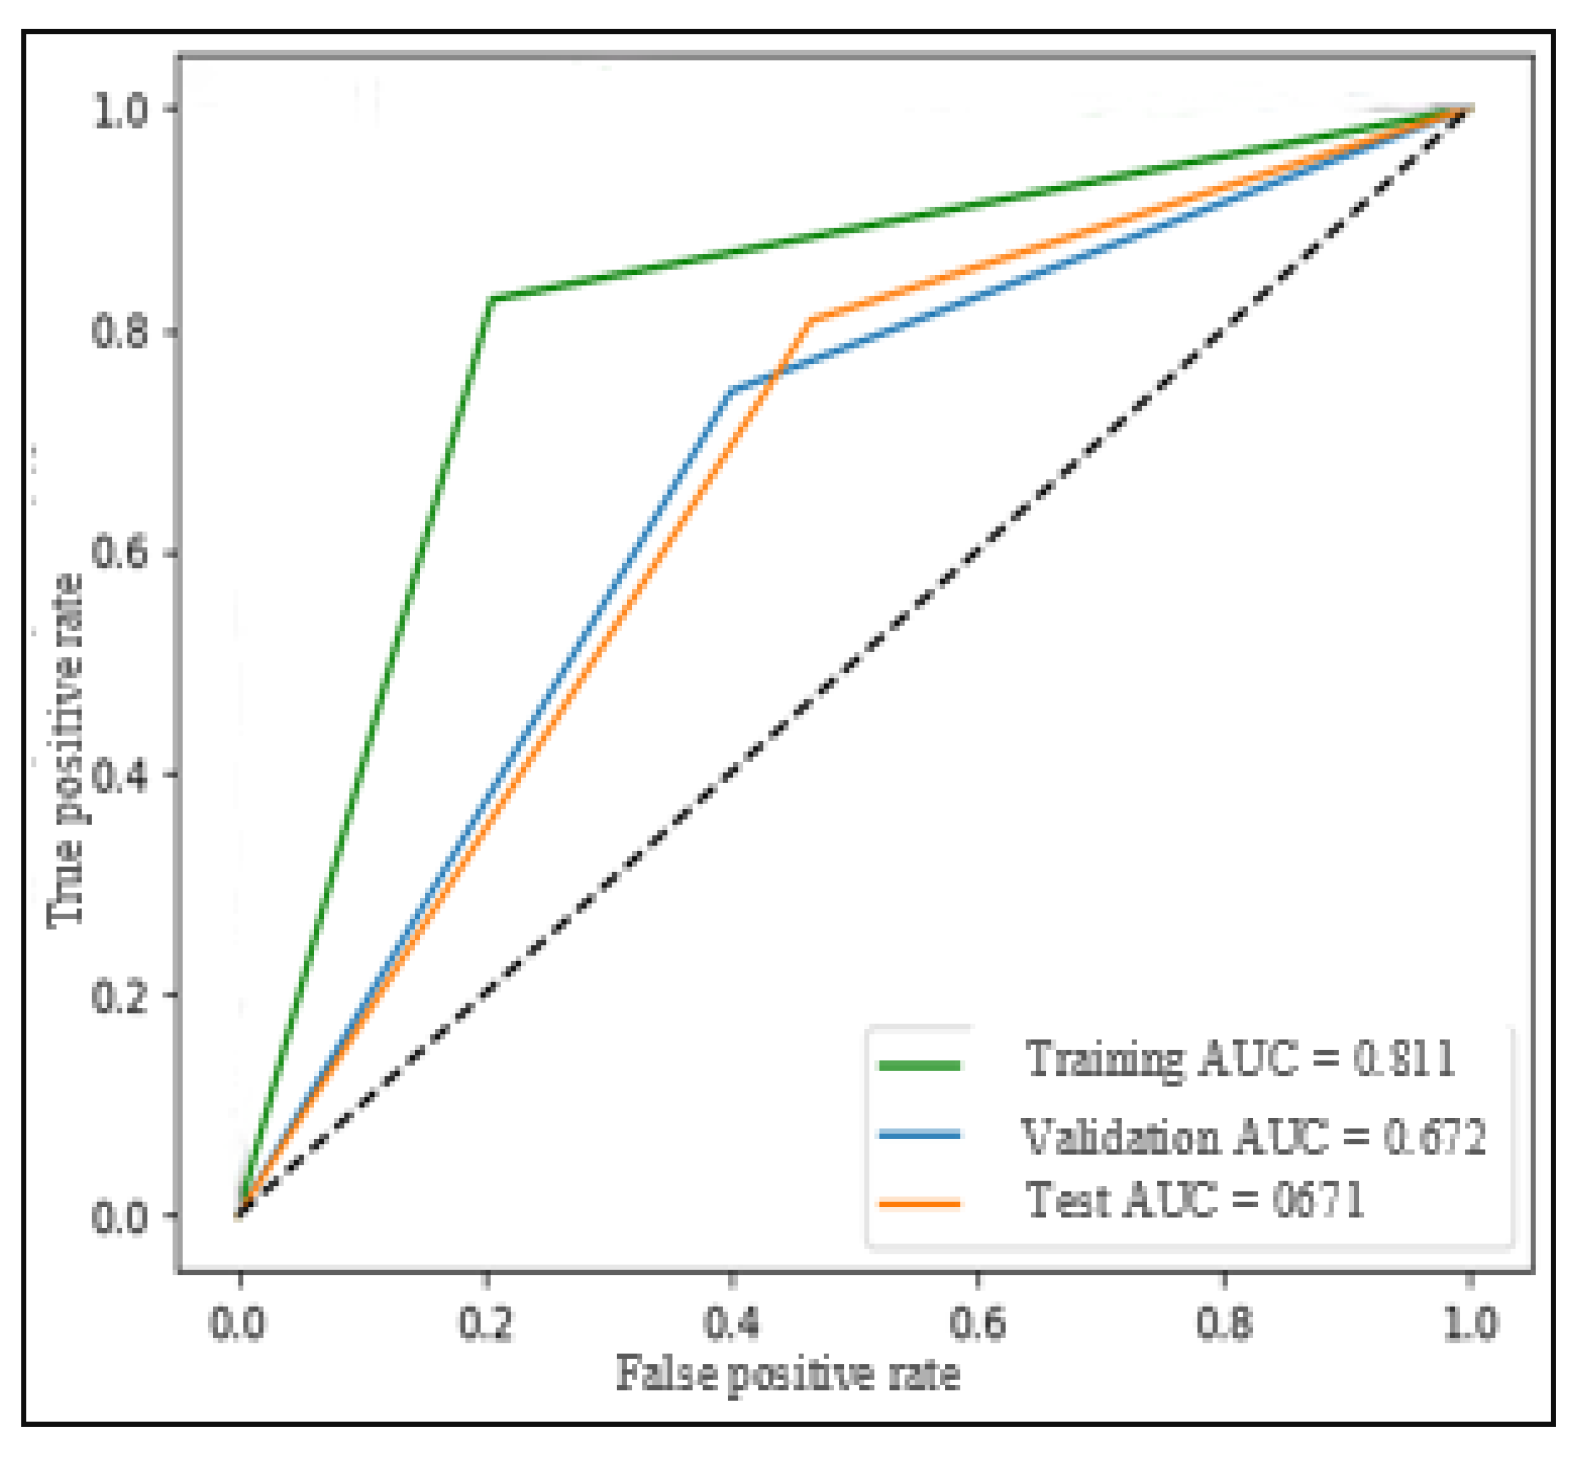
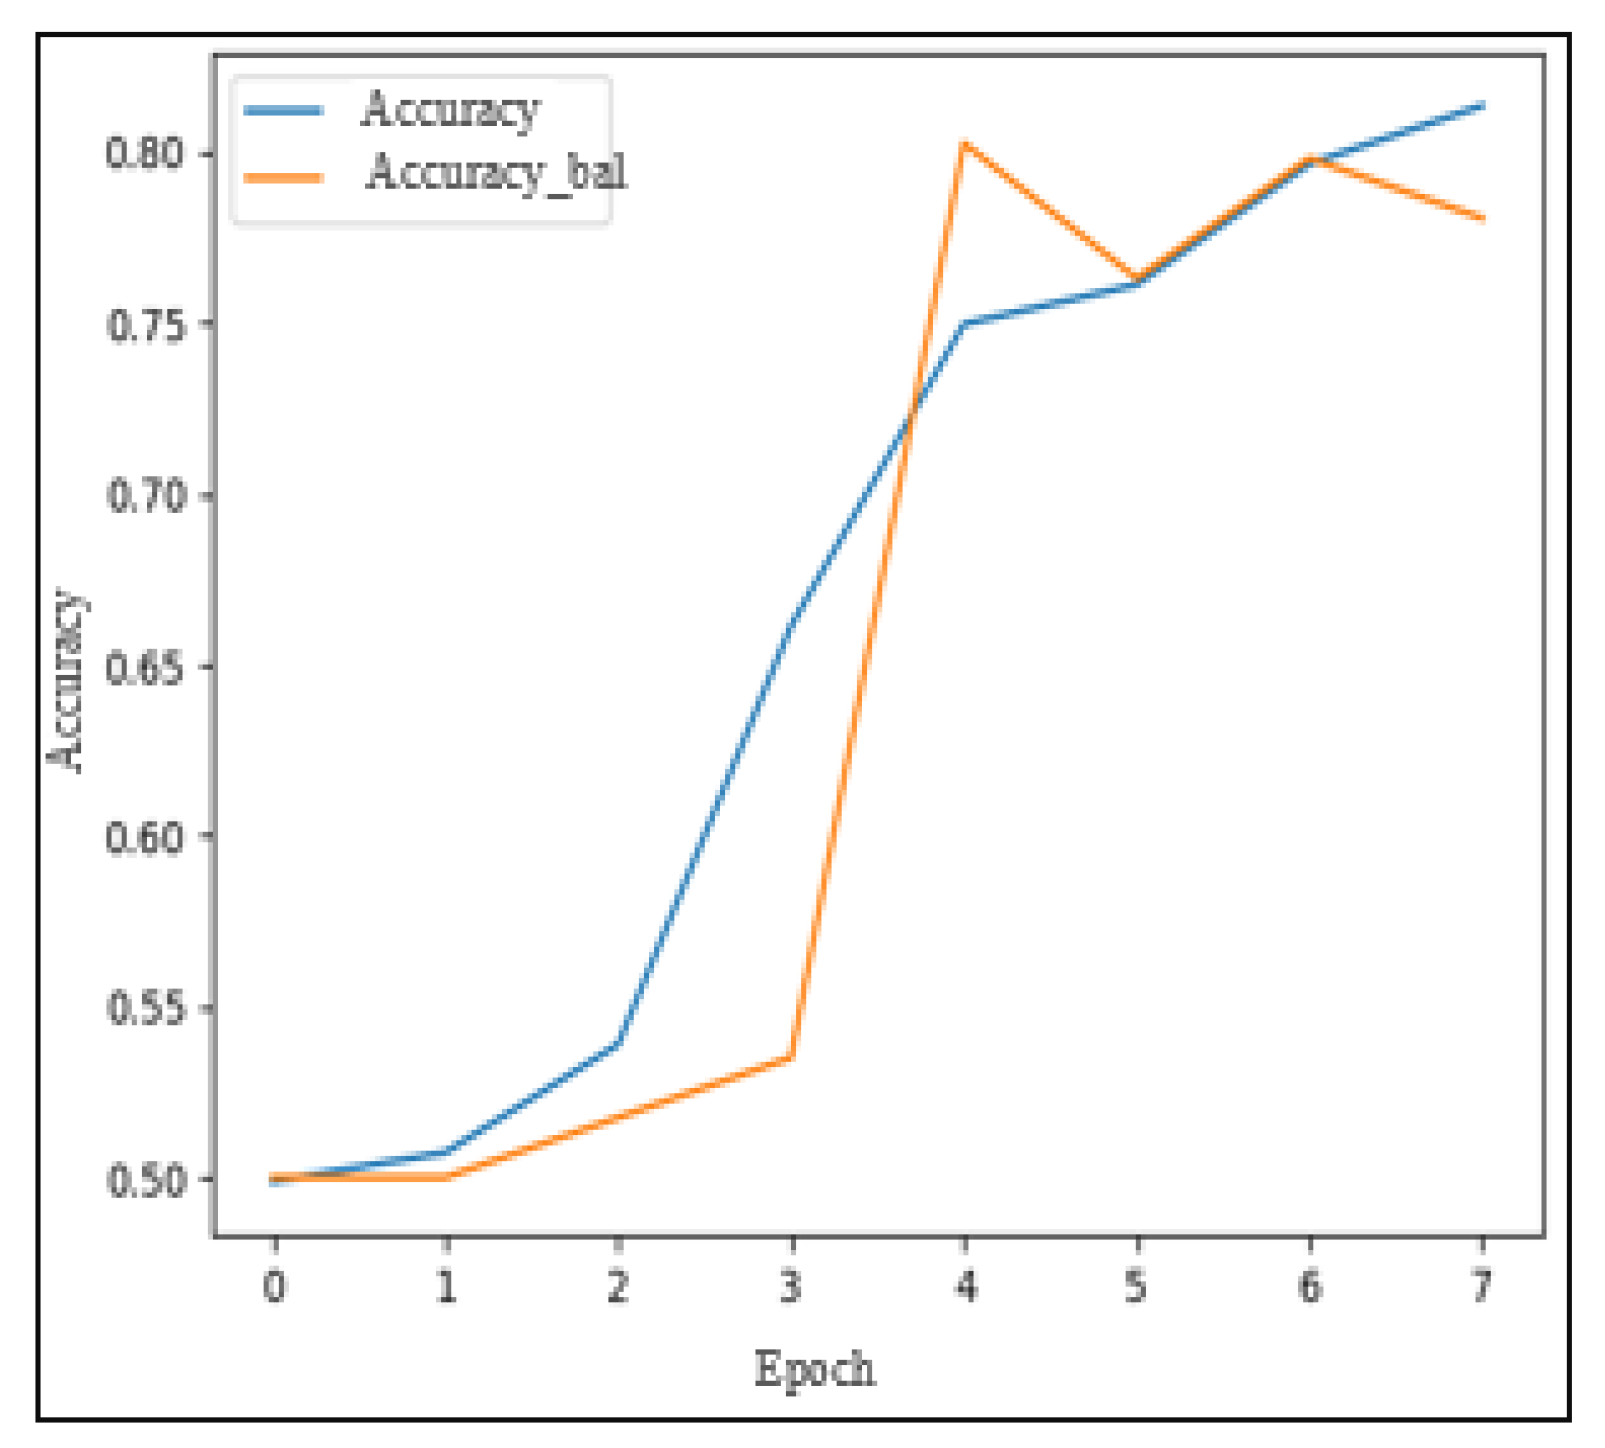
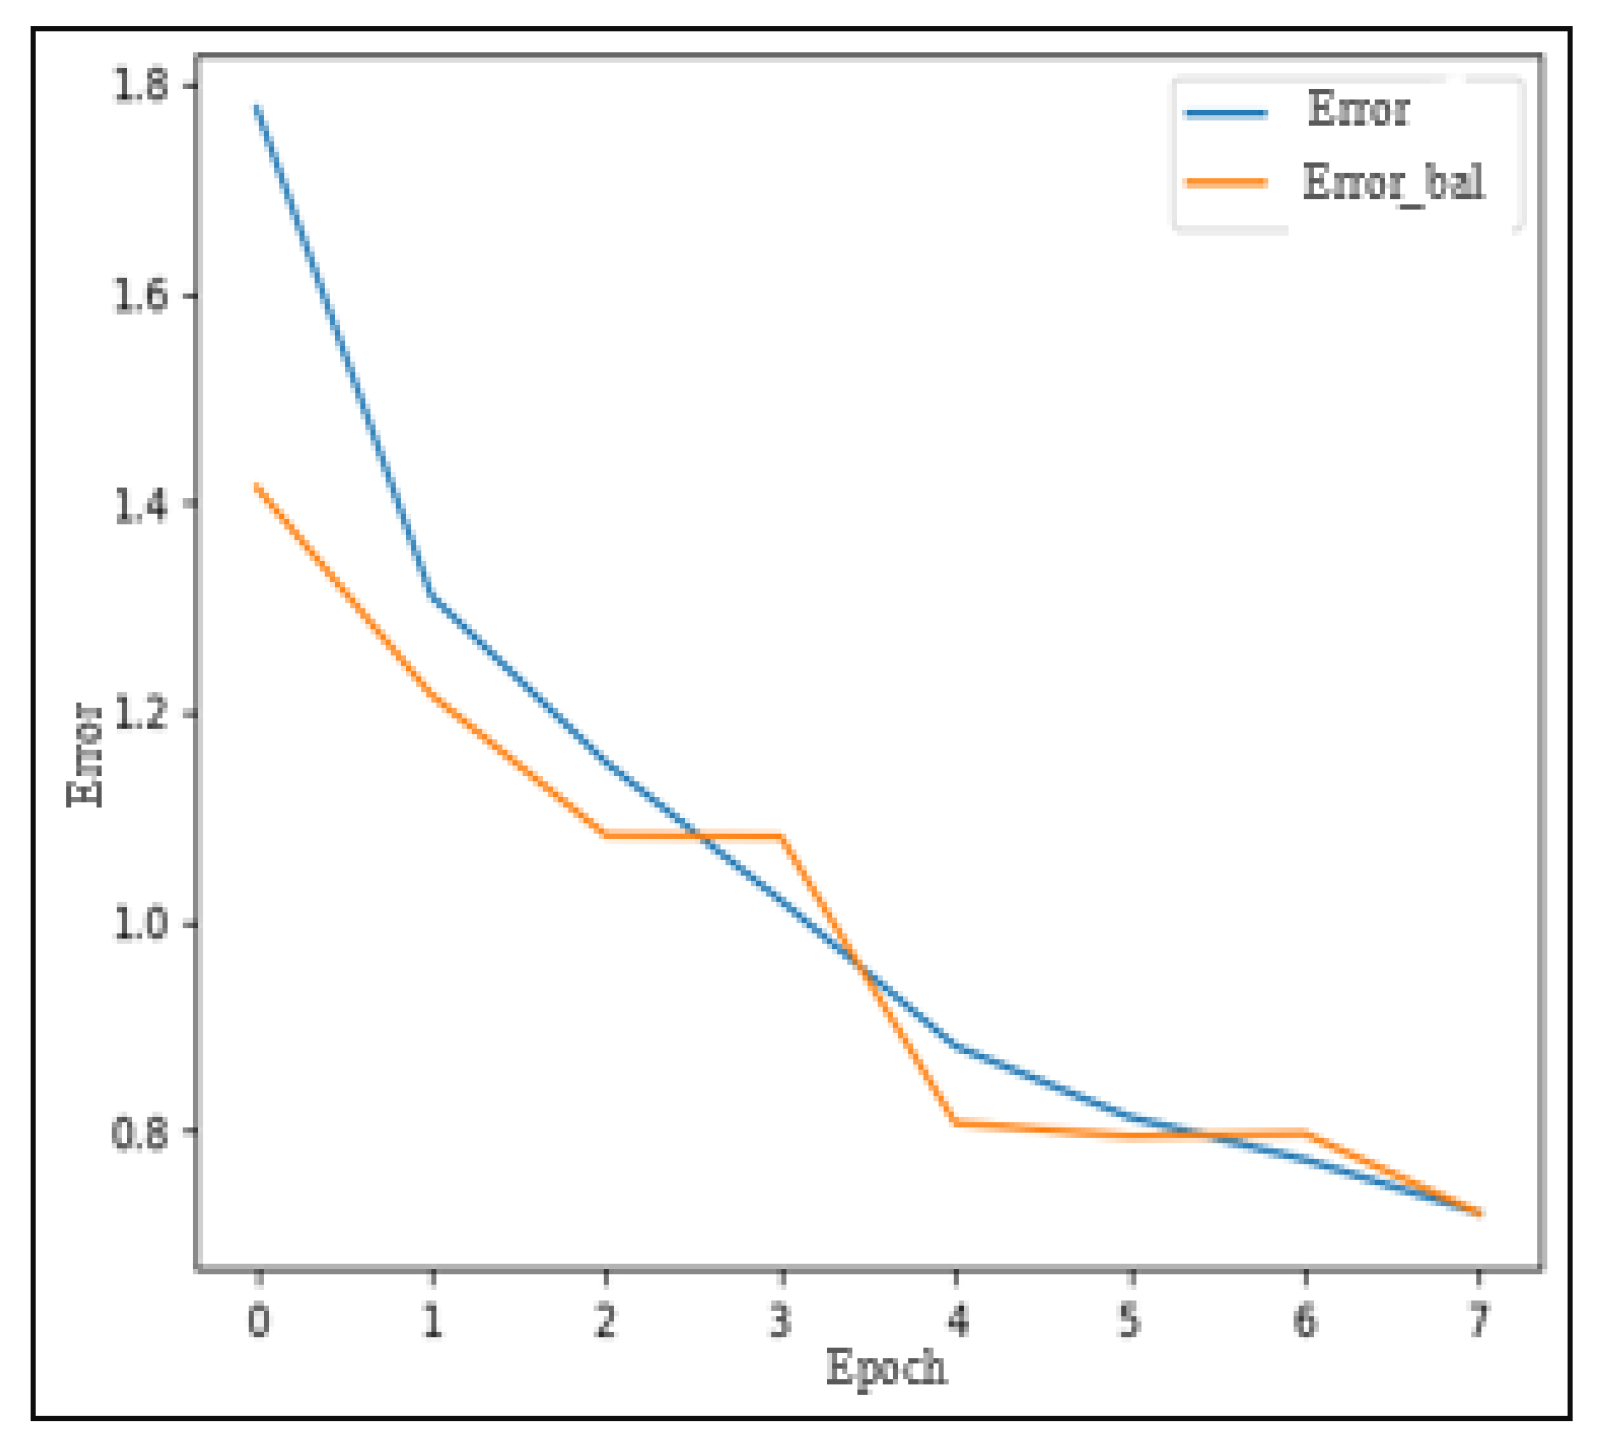
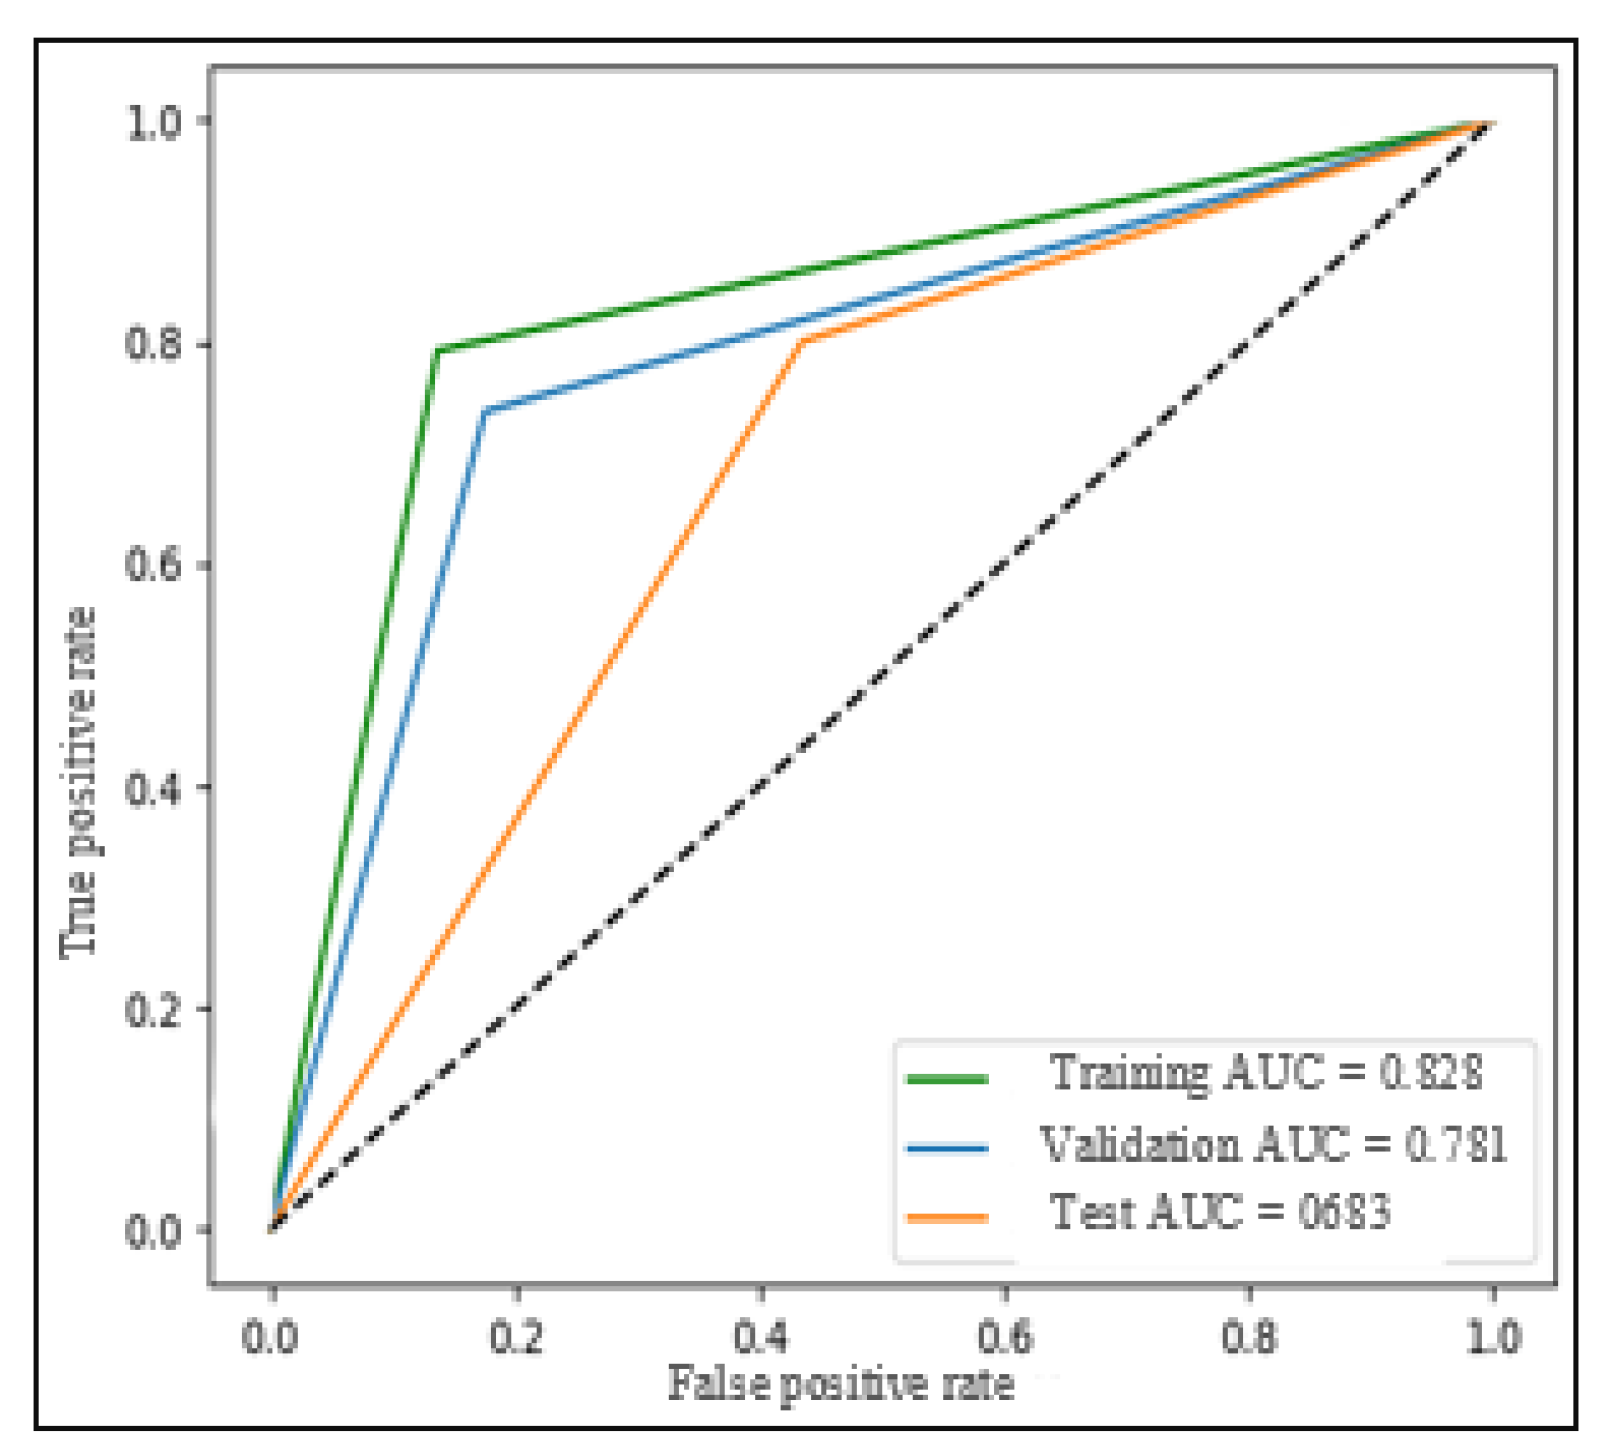
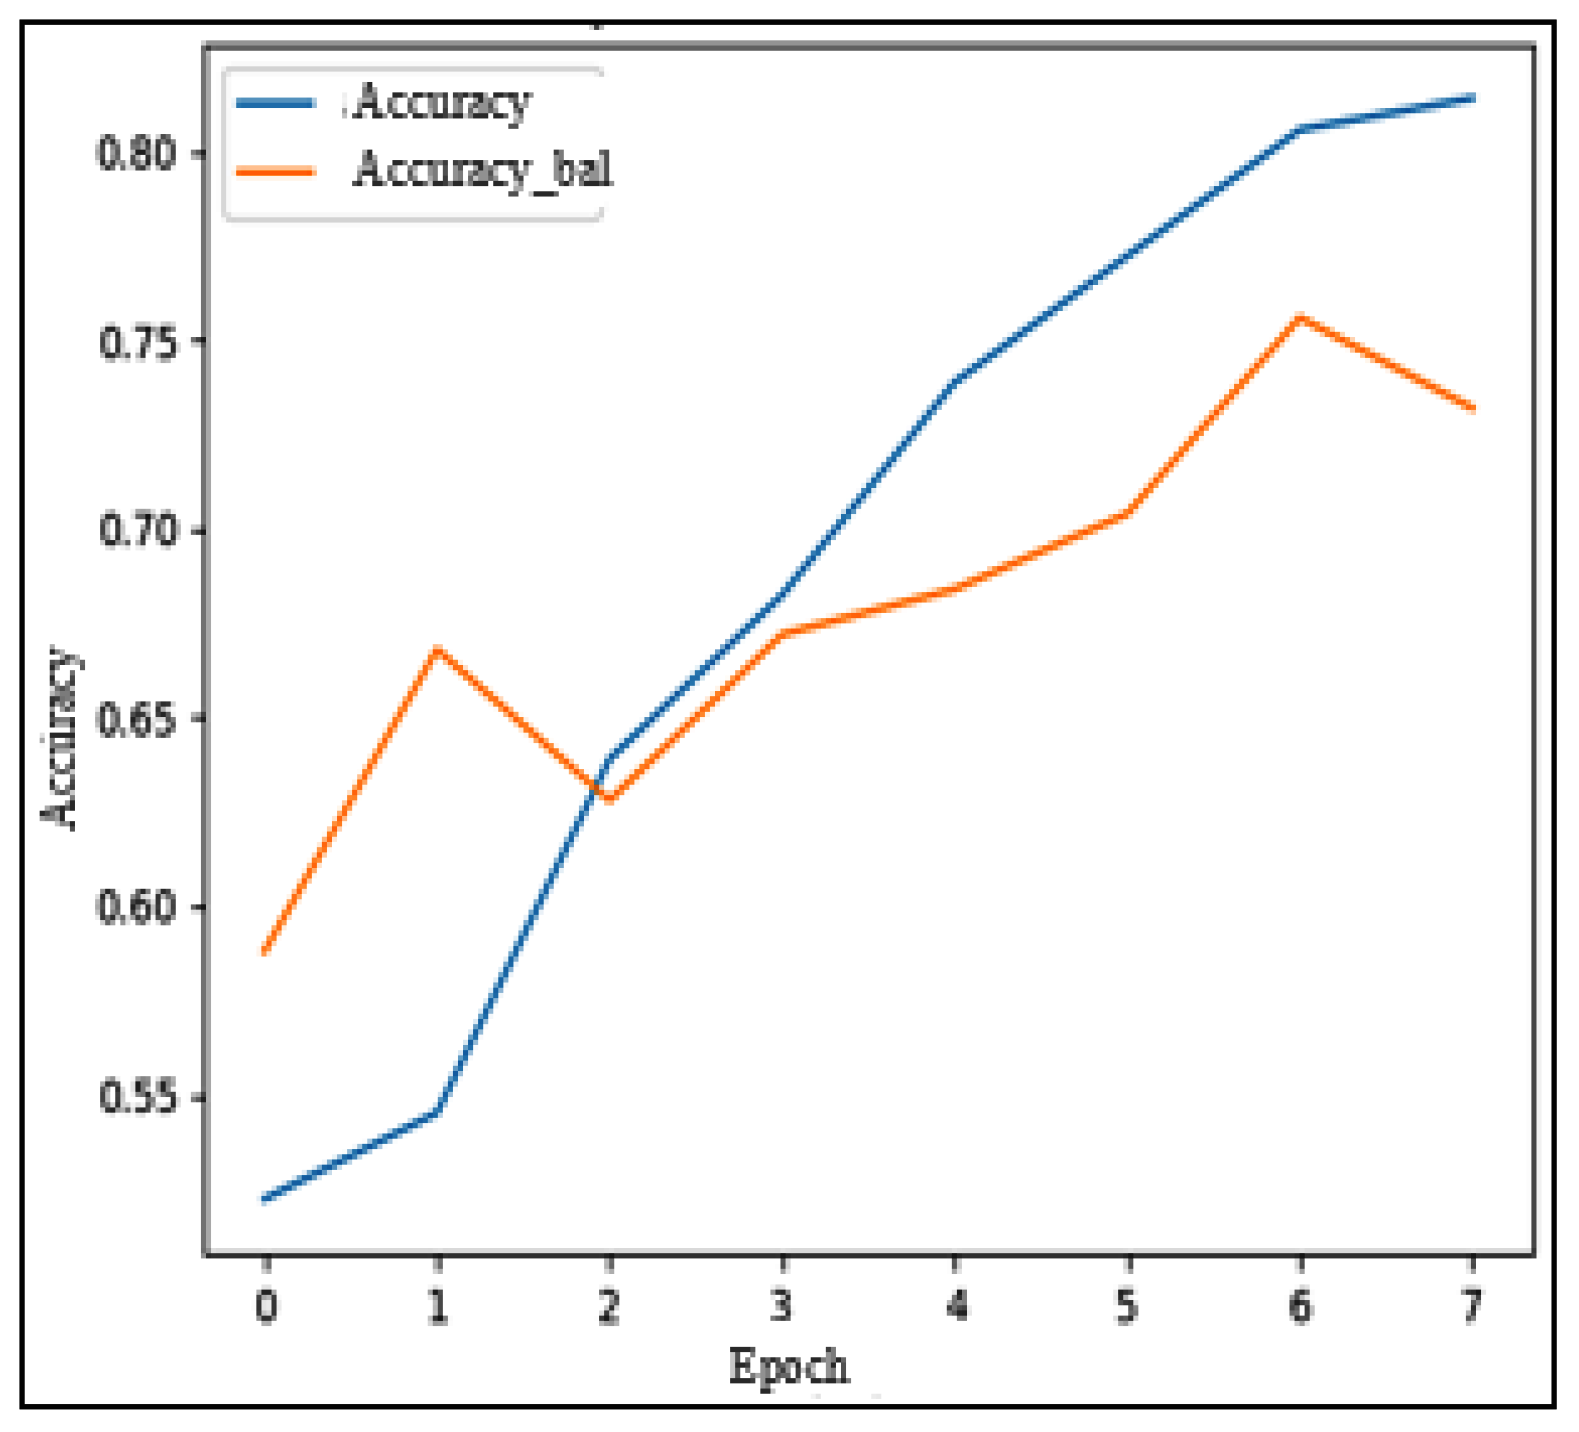
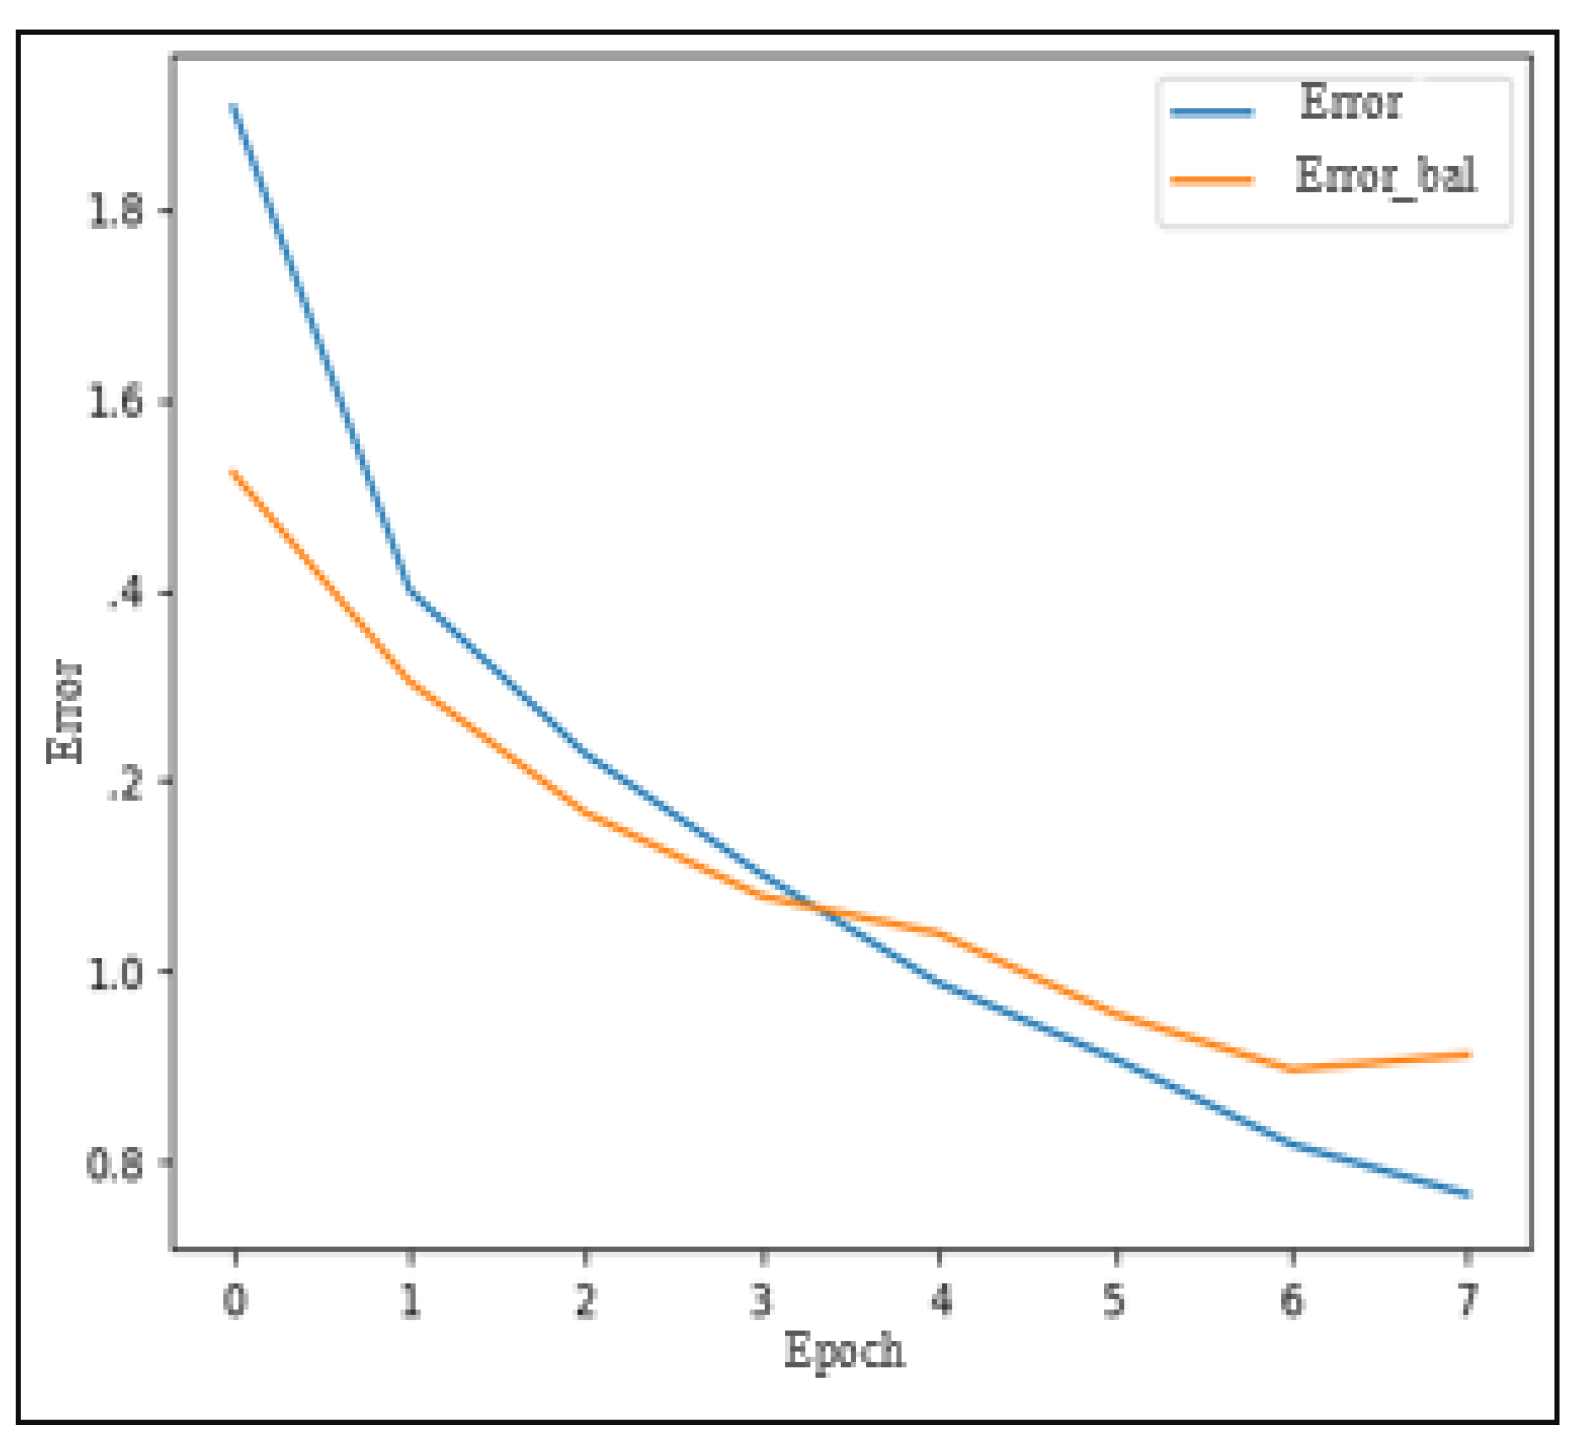
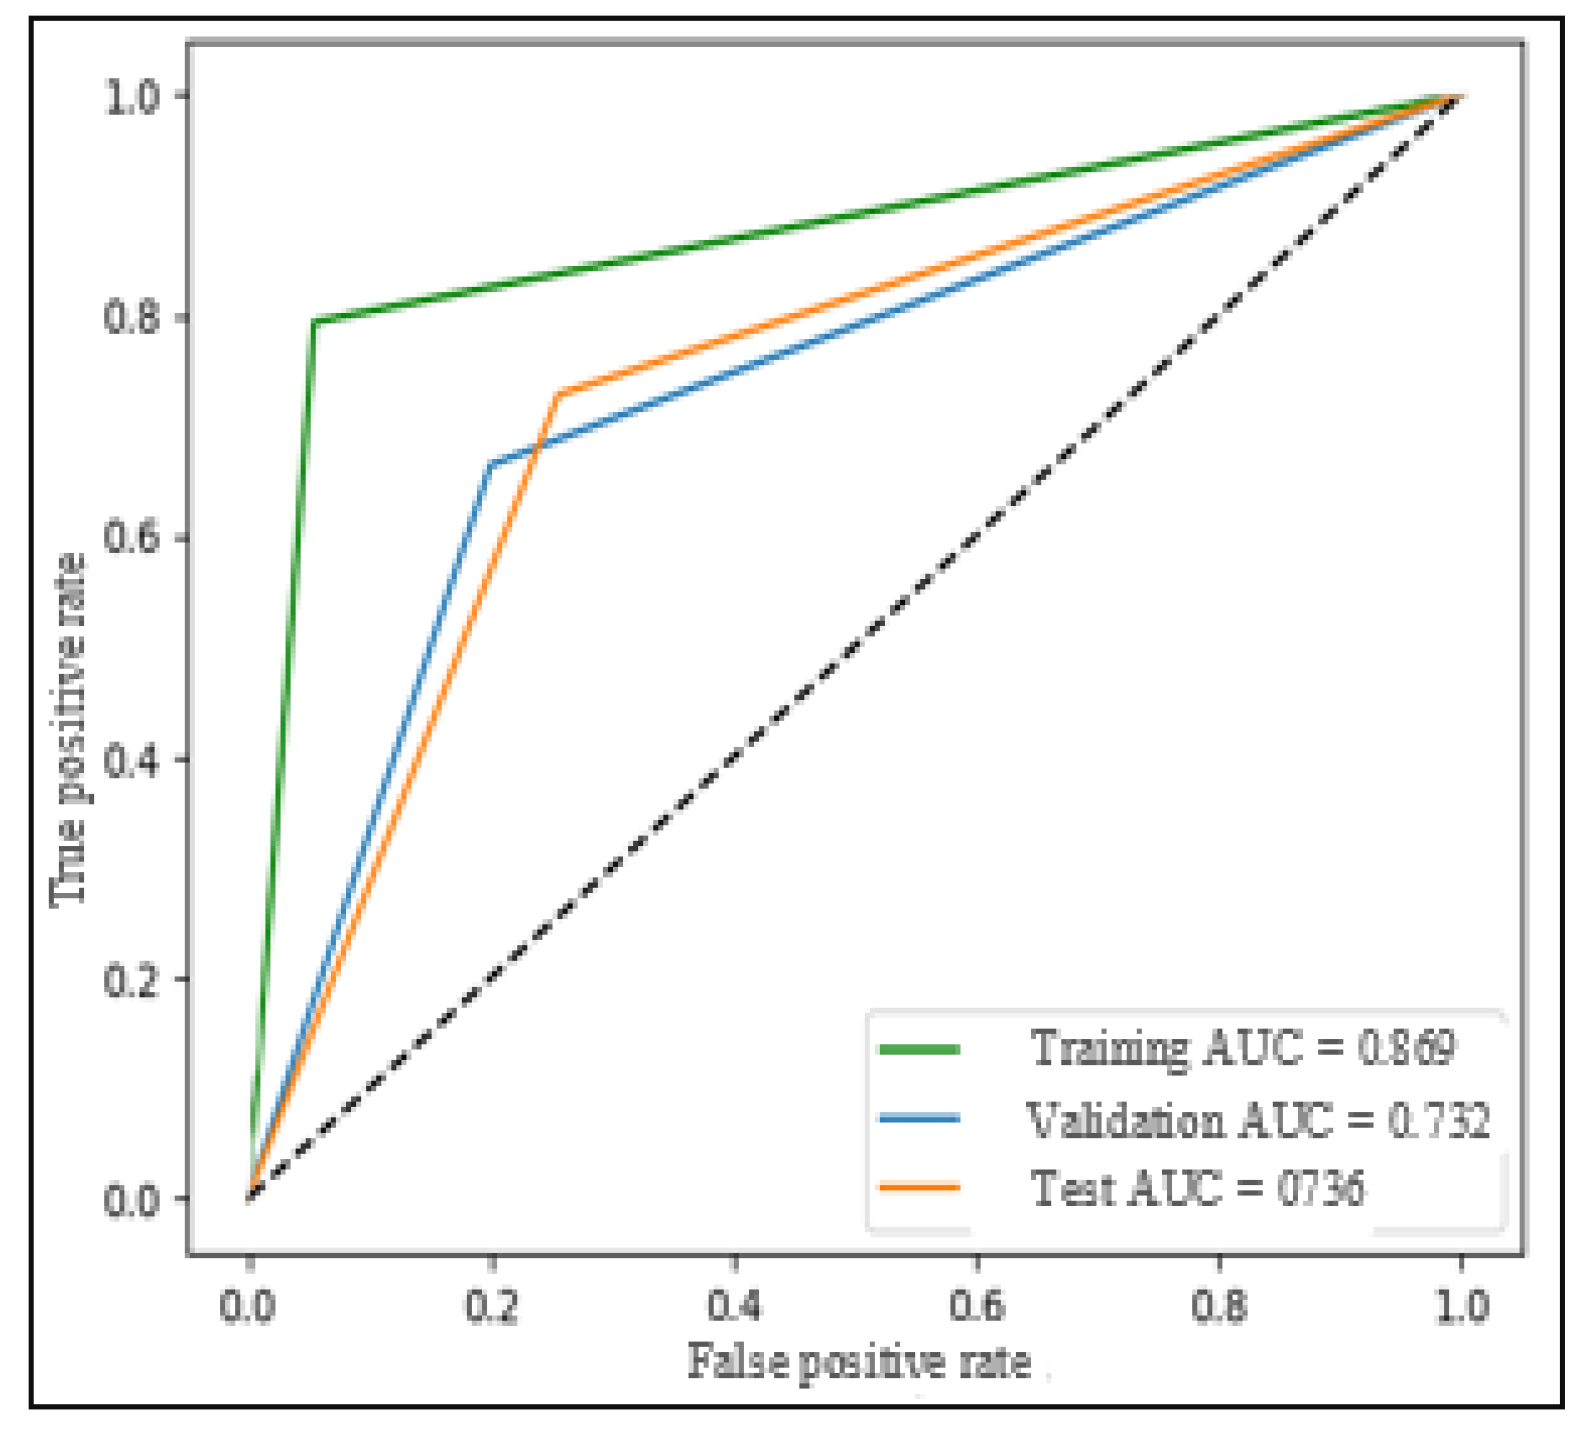
