Article

GeNetFormer: Transformer-Based Framework for Gene Expression Prediction in Breast Cancer

by
Oumeima Thaalbi
and
Moulay A. Akhloufi
*
Perception, Robotics, and Intelligent Machines (PRIME), Department of Computer Science, Université de Moncton, Moncton, NB E1A 3E9, Canada
*
Author to whom correspondence should be addressed.
Submission received: 27 January 2025 / Revised: 18 February 2025 / Accepted: 19 February 2025 / Published: 21 February 2025
(This article belongs to the Section Medical & Healthcare AI)

Abstract

:
Background: Histopathological images are often used to diagnose breast cancer and have shown high accuracy in classifying cancer subtypes. Prediction of gene expression from whole-slide images and spatial transcriptomics data is important for cancer treatment in general and breast cancer in particular. This topic has been a challenge in numerous studies. Method: In this study, we present a deep learning framework called GeNetFormer. We evaluated eight advanced transformer models including EfficientFormer, FasterViT, BEiT v2, and Swin Transformer v2, and tested their performance in predicting gene expression using the STNet dataset. This dataset contains 68 H&E-stained histology images and transcriptomics data from different types of breast cancer. We followed a detailed process to prepare the data, including filtering genes and spots, normalizing stain colors, and creating smaller image patches for training. The models were trained to predict the expression of 250 genes using different image sizes and loss functions. GeNetFormer achieved the best performance using the MSELoss function and a resolution of 256 × 256 while integrating EfficientFormer. Results: It predicted nine out of the top ten genes with a higher Pearson Correlation Coefficient (PCC) compared to the retrained ST-Net method. For cancer biomarker genes such as DDX5 and XBP1, the PCC values were 0.7450 and 0.7203, respectively, outperforming ST-Net, which scored 0.6713 and 0.7320, respectively. In addition, our method gave better predictions for other genes such as FASN (0.7018 vs. 0.6968) and ERBB2 (0.6241 vs. 0.6211). Conclusions: Our results show that GeNetFormer provides improvements over other models such as ST-Net and show how transformer architectures are capable of analyzing spatial transcriptomics data to advance cancer research.

1. Introduction

Breast cancer is the most common cancer in women worldwide and one of the principal causes of cancer-related death. In 2018, around 2.09 million new cases were diagnosed and 630,000 women died from the disease [1]. In 2020, approximately 2.3 million new cases were diagnosed [2]. The number of cases continues to rise, making breast cancer a major public health challenge. The disease is influenced by a combination of genetic, environmental, and lifestyle factors [1]. Genetic mutations represent around 5–10% of cases, while 20–30% are associated with preventable factors such as diet, obesity, and hormone exposure [1]. Early detection of breast cancer through regular screening is essential, as it improves survival rates. However, in advanced stages, the disease often propagates through the body. This results in poorer responses to treatment, which confirms the need for improved diagnostic and therapeutic methods. The integration of histopathology and molecular pathology has prompted progress in breast cancer research. Techniques such as hematoxylin and eosin (H&E) staining are used to identify tumor morphology, and, currently, spatial transcriptomics (ST) technologies enhance it by combining gene expression profiling with spatial localization, providing additional information on tumor biology. However, the high cost and technical complexity of ST limit its applicability. As a result, the use of artificial-intelligence-based digital pathology to analyze histopathological images gives a valuable alternative for patient treatment stratification around the world [2]. In this regard, progress in deep learning has made it possible to predict gene expression from whole-slide images (WSIs) [3]. These approaches are helping researchers to look closely at the molecular basis of breast cancer in more detail. A state-of-the-art model, ST-Net, which is based on DenseNet-121 and represents the first innovation in this field, was able to locally predict 250 genes using the STNet dataset. The best PCC values were obtained for the genes GNAS, ACTG1, FASN, DDX5, and XBP1 [4]. The BrST-Net framework introduces an auxiliary network (AuxNet) to improve the gene expression prediction results, in particular for B2M, ACTG1, ACTB, TMSB10, and GNAS, which are the top five predicted genes among the 250 in the STNet dataset, using EfficientNet-b0 combined with AuxNet. This framework also demonstrates the adaptability of advanced CNN-based architectures in mapping gene expression from WSIs [5]. SEPAL [6] is a graph-based approach using a graph neural network (GNN) and trained on 256 genes, incorporating both local and global spatial features, and also uses the same dataset. Each model has illustrated the development of deep learning for accurate breast cancer gene expression analysis through the different architectures and innovative techniques applied. The purpose of this study is to illustrate the application of transformer-based architectures to breast cancer gene expression prediction. Transformers, originally developed for natural language processing (NLP), have shown exceptional potential in computer vision tasks due to their global attention mechanisms [7]. Unlike convolutional neural networks (CNNs), which were good at extracting local features from images but had difficulty at capturing patterns of long-term relationships, transformers can analyze both small details and global relationships [7]. This capability has made transformers well suited to tasks that require an analysis of global tissue patterns. Using a dataset of 68 WSIs of H&E associated with the ST data cited in [4], our study focuses on predicting the expression of 250 genes selected on the basis of their mean expression values. A leave-one-patient-out approach was used to allow good evaluation and generalization. Equally, several configurations with different loss functions (MSELoss and Smooth L1 Loss (SL1Loss)) and input resolutions (224 × 224 and 256 × 256) were tested to optimize model performance. For this purpose, eight advanced transformer models, EfficientFormer, FasterViT, BEiT v2, Swin Transformer v2, PyramidViT v2, MobileViT v2, MobileViT, and EfficientViT, were optimized and evaluated. To the best of our knowledge, this is the first comprehensive comparison of these models for gene expression prediction in breast cancer from ST data. This innovative approach motivated us to investigate and identify the most effective models, with the aim of improving breast cancer genetic expression knowledge and patient therapy results through the application of artificial intelligence. The main contributions of this article are as follows:
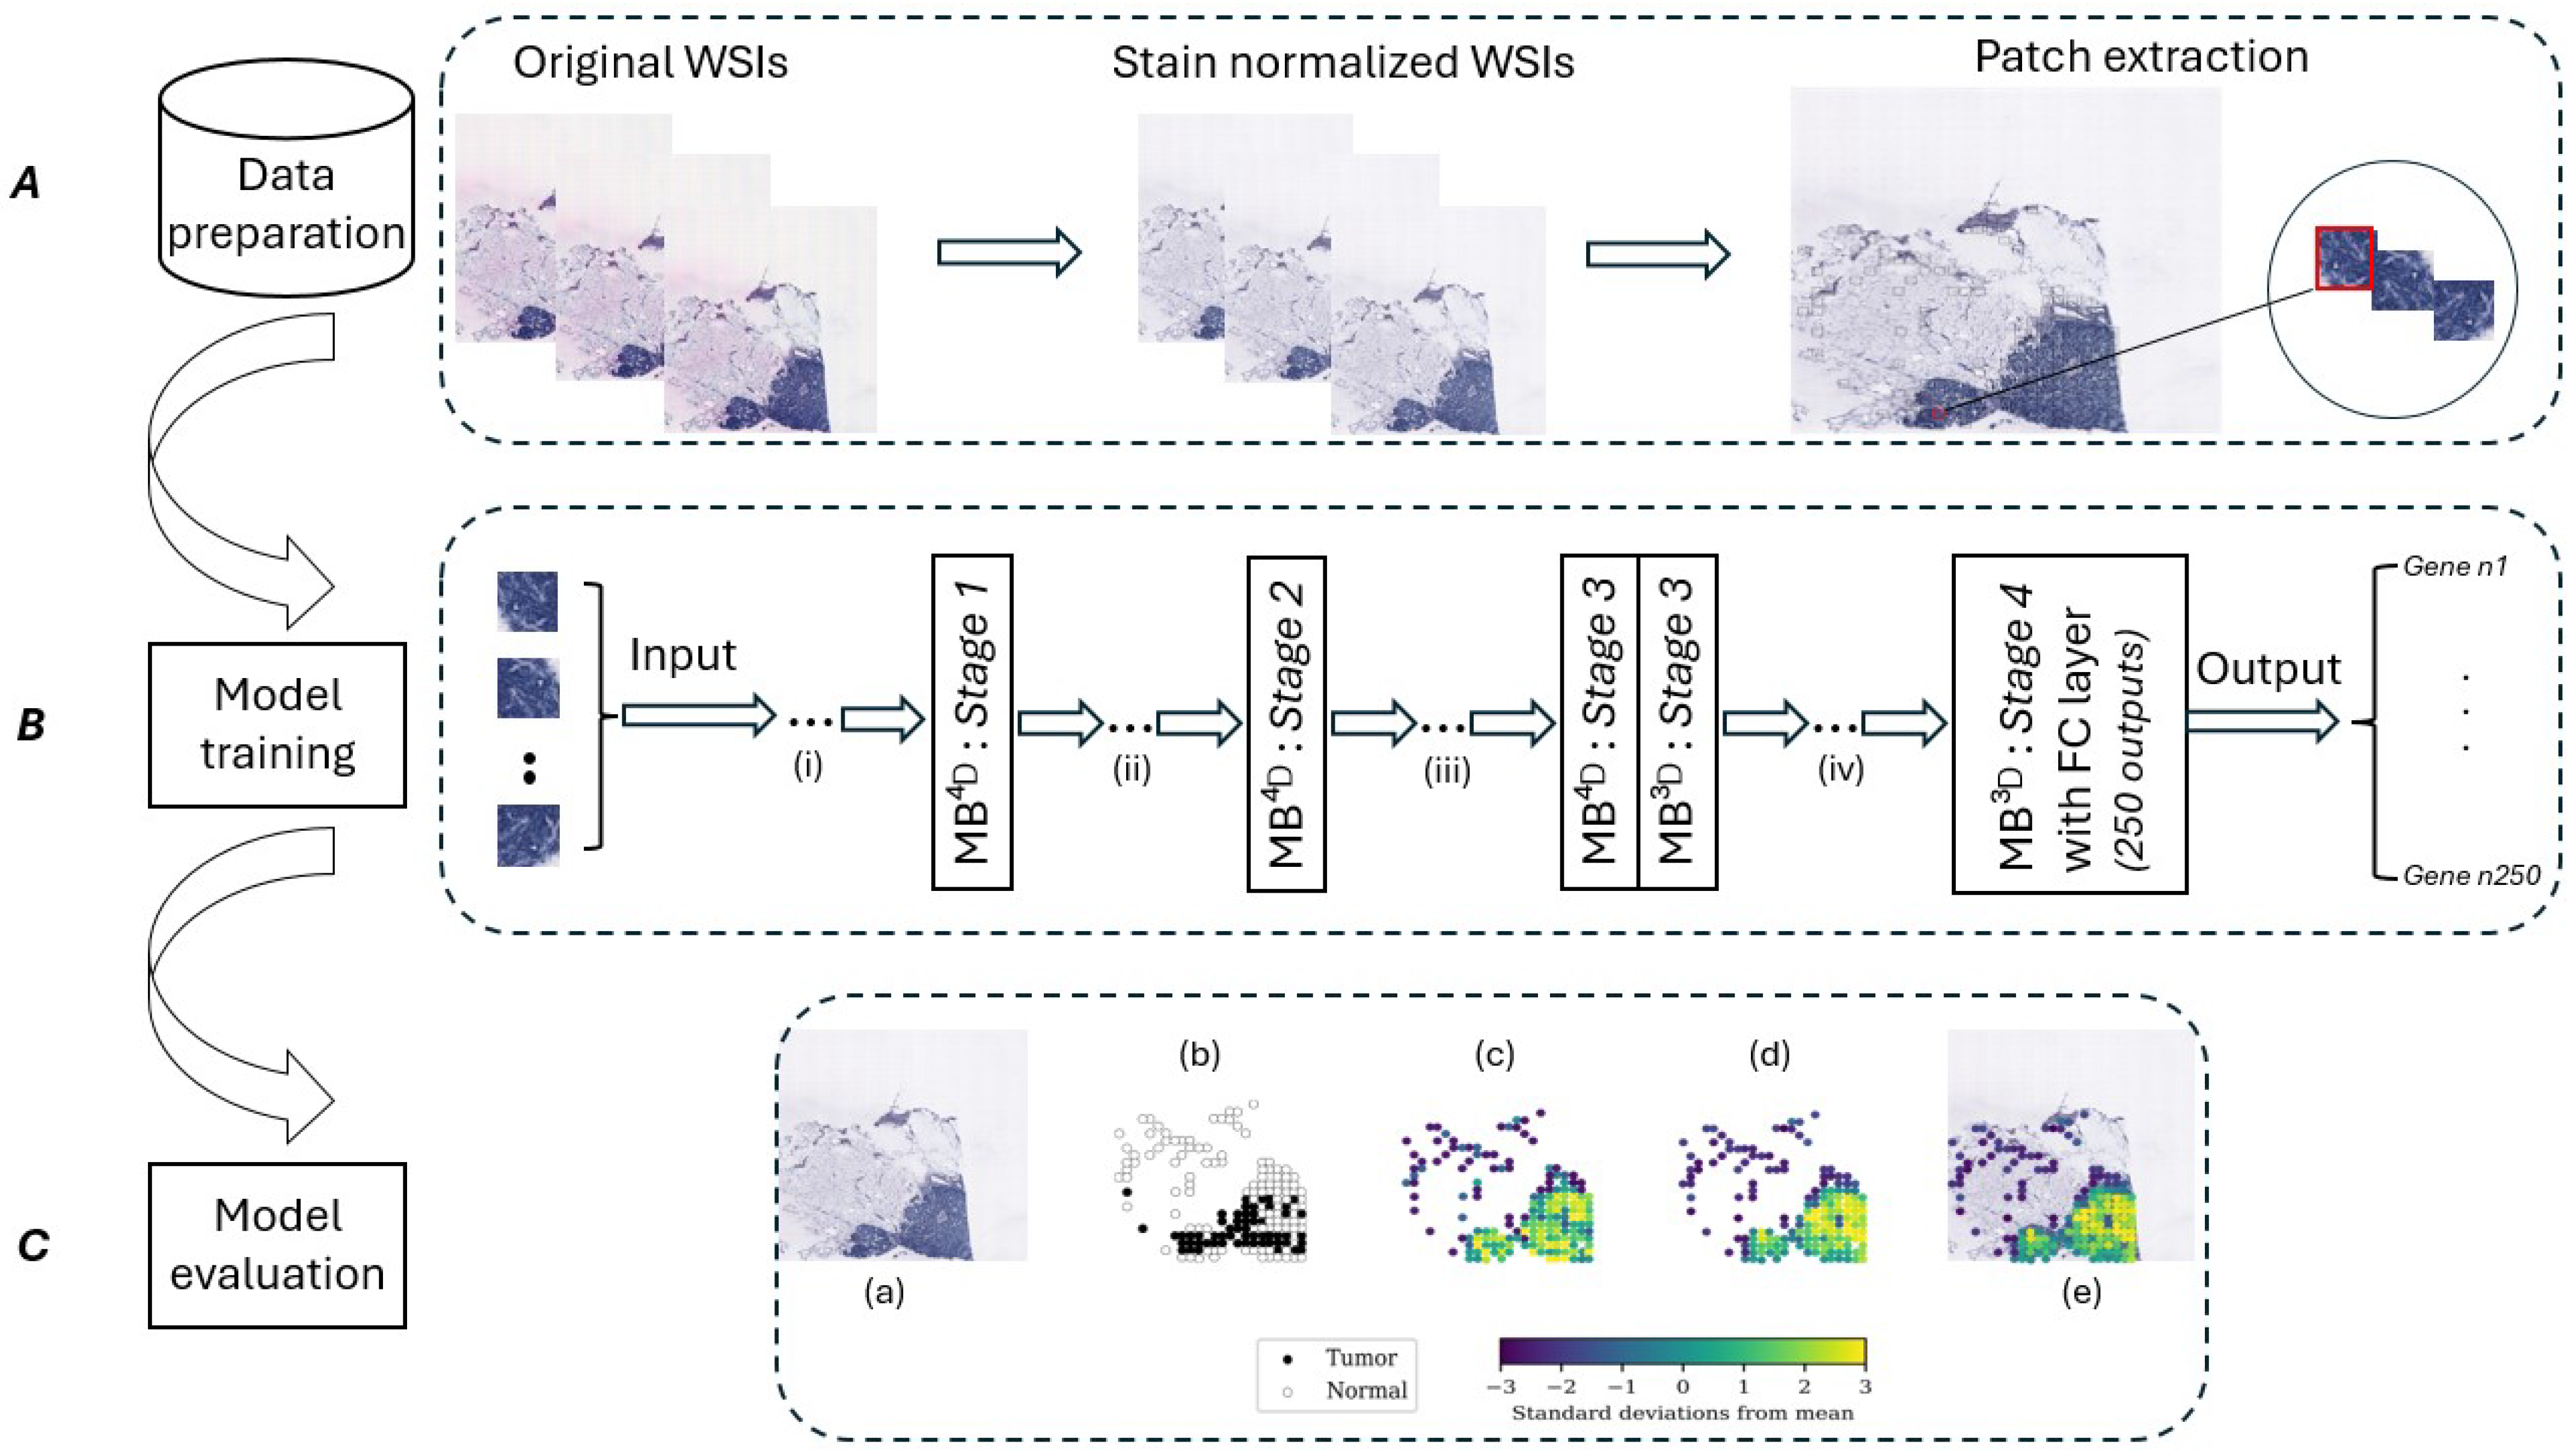
  • In this work, we propose GeNetFormer, a deep learning framework for gene expression prediction tasks. We evaluate the effectiveness of transformer-based models on WSIs and ST data in breast cancer.
  • Our experiments on eight benchmark transformer-based architectures provide a detailed comparison of these models. Furthermore, we analyze the influence of different loss functions and input resolutions on their performance.
  • This paper shows the potential of transformer-based models to advance cancer research and set new benchmarks in the field.

2. Related Work

Gene expression prediction using WSIs and ST data has received much attention in recent studies. Researchers have developed various methods based on CNNs, ViTs, and GNNs to predict gene expression and molecular subtypes. In this section, we review these methods, focusing on their approaches and performance.

2.1. Approaches Using the STNet Dataset

In this section, we present the methods developed using the STNet dataset. The ST-Net model [4] was one of the first initiatives to link ST data to WSIs using DenseNet-121. It was trained on the STNet dataset of 68 tissue sections that contain 30,612 spots from 23 patients, and achieved median correlations of 0.34, 0.33, 0.31, 0.30, and 0.29 for the biomarkers GNAS, ACTG1, FASN, DDX5, and XBP1, respectively. This model was trained on the expression of n = 250 genes by treating the task as a multivariate regression problem and recognized for its ability to generalize across datasets and predict the spatial expression of important cancer biomarkers. Rahaman et al. [5] proposed the BrST-Net framework and trained 10 models for n = 250 genes, namely, ResNet101, Inception-v3, EfficientNet-b0, EfficientNet-b1, EfficientNet-b2, EfficientNet-b3, EfficientNet-b4, EfficientNet-b5, ViT-B-16, and ViT-B-32, on the STNet dataset. With and without auxiliary networks, EfficientNet-b0 was the best-performing model. B2M was predicted with a median PCC of 0.6325 and was the top one predicted gene. Working with the STNet dataset, Mejia et al. [6] developed another graph-based approach called SEPAL, which used GNNs to represent spatial data by modeling multiple patches as a graph to predict n = 256 genes. The model operated in two phases: local learning, where an image encoder was fine-tuned, and spatial learning, where the input patch and its neighboring patches were structured as a graph with a central node that represented the target patch for gene expression prediction. The model was also tested on the 10x Genomics breast cancer dataset. The Exemplar Guided Network (EGN) proposed by Yang et al. [8] combines a representation extractor, a vision transformer (ViT) backbone, and an exemplar bridging block to refine features using the nearest exemplars. It was trained on STNet and 10xProteomic datasets. This method showed good capability to integrate WSIs and ST data with low MSE and high PCC values.

2.2. Approaches Using HER2+ Dataset

Other methods were developed using the HER2+ dataset [9]. Pang et al. [10] created HisToGene, a modified transformer model adapted for WSIs and ST data. The model extracted patches from WSIs based on spatial coordinates and used multi-head attention layers to predict gene expression. On the HER2+ dataset, the best achieved mean correlation was 0.32 for the GNAS gene. The IGI-DL approach introduced by Gao et al. [11] used the HER2+ dataset and combined CNNs and GNNs to predict spatial gene expression and analyze tumor microenvironment heterogeneity. The top one predicted gene was ERBB2, with mean correlations of 0.374. On the external test set, the top one prediction was B2M, with mean correlations of 0.703. The Hist2ST model, in [12], combines three key modules to predict spatial gene expression using the HER2+ dataset. The convmixer module extracts localized 2D features from WSIs, the transformer module captures global spatial dependencies through self-attention, and the GNN module, based on GraphSAGE, learns local spatial relationships from neighboring spots. The model achieved average R values of 0.39 for FN1, the top gene.

2.3. Approaches Using Other Datasets

Some methods were based on the use of different datasets. The Hist2RNA model [13], trained on TCGA images associated with ST data with n = 335 genes, uses pre-trained CNNs, such as EfficientNet, RegNet, DenseNet, Inception, and ResNet. It aggregates image features from patches to predict gene expression and achieved a correlation of 0.82 across patients and 0.29 across genes on a held-out test set. The model also predicted biomarkers such as ESR1, PGR, and ERBB2 with high accuracy in external datasets. Qu et al. [14] proposed a two-stage model using ResNet for feature extraction and multi-layer perceptrons (MLPs) with self-attention for n = 659 genes from the Genomic Data Commons database. The model was developed for two tasks: prediction of point mutations and prediction of CNAs in breast-cancer-related genes. For point mutations, it identified 6 out of 18 genes, including TP53 (AUC 0.729), RB1 (AUC 0.852), and CDH1 (AUC 0.776). For CNAs, it predicted 6 out of 35 genes with good performance, including FGFR1 (AUC 0.794) and EIF4EBP1 (AUC 0.742).

3. Materials and Methods

3.1. Dataset

In our study, we trained the models on the fifth edition of the human breast cancer in situ capturing transcriptomics dataset, which was first introduced in the ST-Net paper [4]. This dataset contains 68 sections from 23 breast cancer patients. Each patient has 3 sections, except for one patient who has 2 sections. These images are WSIs of H&E-stained samples, and have corresponding ST data. Each section was scanned at 20× magnification, resulting in images of size 10,000 × 10,000 pixels in JPG format. The number of spots in each replicate ranged from 256 to 712, with a spot diameter of 100 µm. The dataset contains 30,612 spots and includes spot coordinates, count matrices, and coordinate files. It also represents different subtypes of breast cancer, namely, luminal A, luminal B, triple negative, human epidermal growth factor receptor 2 (HER2) luminal, and non-luminal HER2.

3.2. Data Pre-Processing and Augmentation

Several pre-processing steps were applied to prepare the data for analysis. First, spots with at least 1000 total counts were selected for spot filtering, inspired by Rahaman et al. [5], and gene normalization was applied to ensure high-quality data with sufficient profiling depth. This filtering step resulted in approximately 28,792 spot files, which were used to generate corresponding image patches. This left about 6000 genes for analysis. To address issues with zeros, a pseudo-count of 1 was added to each value, and the total expression of each spot was normalized. The normalized counts were then log transformed to scale the values appropriately. Second, stain normalization was applied to the WSIs samples, as shown in Figure 1, using the Vahadane method, inspired by Vahadane et al. [15], which has shown effectiveness in maintaining color consistency and improving usability, as illustrated by studies such as [5,16]. Third, due to the large size of the WSIs, which were typically 10,000 × 10,000 pixels, smaller image patches centered on ST spots were extracted, making the data compatible with transformer models. Finally, the provided list of genes with Ensembl identifiers (IDs) was translated into gene symbols using the HUGO Gene Nomenclature Committee (HGNC) database to ensure unique gene symbols to facilitate electronic data retrieval and reduce ambiguities. In the augmentation step, several techniques were applied to increase the diversity of the training data, which helped the model to generalize better and reduce overfitting. For instance, random horizontal and vertical flipping involved randomly flipping image patches either horizontally, vertically, or both, and random rotation of 90 degrees involved randomly rotating each image patch by 90 degrees. This process provided simulation of different orientations and perspectives of the same tissue structure in realistic scenarios, which thus helped the model to learn invariant features independent of image direction and rotation.

3.3. Proposed Approach

To predict gene expression from WSIs with high performance, we propose a multi-stage deep learning framework named GeNetFormer. This framework has three main phases: data preparation, model training, and model evaluation. In the data preparation phase, as described in Section 3.2, we used pre-processing and data augmentation techniques. WSIs were stain normalized to create uniformity across samples, and then patch extraction centered on ST spots was performed to provide standardized inputs for training. The model training phase integrated different transformer models to process features from the patches. In particular, we separately evaluated 8 pre-trained and modified transformer architectures within this framework (EfficientFormer, FasterViT, BEiT v2, Swin Transformer v2, PyramidViT v2, MobileViT v2, MobileViT, and EfficientViT). The training pipeline was targeted to refine the extracted features and, in the final stage, incorporate a fully connected (FC) layer to produce predictions for 250 gene outputs. To determine the best model for our framework, we performed several tests, as described below in this paper, to evaluate their performance in our task. The best-performing model was EfficientFormer. In the evaluation phase, the framework validated the predictions with visual overlays that showed the ground truth versus the predicted patterns of gene expression. For the robustness of our method, we trained the framework with the leave-one-patient-out technique and applied early stopping during training. Full details are given below, and the architecture of the GeNetFormer framework is shown in Figure 2.
Transformers were first introduced in NLP by Vaswani [17] with the concept of “Attention is All You Need”. The self-attention mechanism was the innovation that allows the model to capture global dependencies, making transformers useful for sequential data [17]. This architecture quickly received attention beyond NLP and was adapted to computer vision tasks, especially classification with ViTs, proposed by Dosovitskiy [18]. ViTs showed that transformers could process images by dividing them into patches and processing them as sequences, outperforming traditional convolutional networks on many benchmarks. Over time, several improvements have been proposed, resulting in new models such as EfficientFormer, FasterViT, etc., which have made transformers a relevant framework for several tasks in both speech and vision. In the following section, we discuss some of the recent transformer-based models used in this research and their specific innovations. All these models have been trained on the ImageNet dataset [19].
  • EfficientFormer is a fully transformer-based architecture designed for low-latency applications. As detailed in [20], the network starts with a patch embedding layer (PatchEmbed) followed by a series of meta transformer blocks (MB), which is expressed as follows:
    Y = i = 1 m MB i ( PatchEmbed ( X 0 B , 3 , H , W ) ) ,
    where X 0 represents the input image with a batch size B , a channel depth of 3 (for RGB images), and spatial dimensions H × W . Y denotes the final output of the network after m meta transformer blocks.
    Each meta transformer block (MB) consists of two components: a token mixer (TokenMixer) and a multi-layer perceptron (MLP) [20]. This relation is expressed as follows:
    X i + 1 = MB i ( X i ) = MLP ( TokenMixer ( X i ) ) ,
    here, X i i > 0 represents the intermediate feature passed into the ith block, and X i + 1 is the output of that block [20]. The network is divided into four stages, with each stage processing features at a fixed spatial resolution [20]. Within each stage, multiple meta transformer blocks are used [20]. This design avoids the integration of MobileNet components and maintains a pure transformer-based architecture adapted for efficient computation [20]. It uses a method called latency-driven slimming to focus on the most important layers, making it faster [20]. The model also introduces a dimension-consistent design to divide the network into 4D and 3D partitions [20]. This design allows the network to benefit from the global modeling capabilities of multi-head self-attention (MHSA) [20].
  • FasterViT [21] is a hybrid ViT which is designed to optimize the trade-off between accuracy and latency, focusing on high throughput for vision tasks on GPUs [21]. Its architecture combines dense convolutions in the early stages and hierarchical attention mechanisms in the later stages to balance memory-bound and compute-bound operations [21]. For different datasets and model sizes, it can scale effectively to higher-resolution input images [21]. The architecture begins with a stem that transforms the input image x R H × W × 3 into overlapping patches [21]. Moreover, downsampler blocks reduce the spatial resolution between stages by a factor of 2 [21]. FasterViT introduces carrier tokens (CTs), which formulate the concept of hierarchical attention to facilitate efficient global learning [21]. The input feature map x R H × W × d is first partitioned into local windows:
    x ^ l = Split k × k ( x ) ,
    where k is the window size. Carrier tokens x ^ ct are then initialized by pooling:
    x ^ ct = AvgPool H 2 n 2 L ( Conv 3 × 3 ( x ) ) ,
    where H 2 is the spatial size, n 2 L is the number of carrier tokens, and Conv 3 × 3 includes positional encoding. The complexity of hierarchical attention is given by the following:
    O ( k 2 H 2 d + L H 2 d + H 4 k 4 L 2 d ) ,
    where k is the window size, L is the number of carrier tokens, H 2 is the spatial size, and d is the feature dimension.
  • BEiT v2 [22] builds on the masked image modeling (MIM) framework by using a semantic visual tokenizer to convert images into discrete visual tokens [22]. It uses ViTs as its backbone, which divide input images into patches [22]. To train the tokenizer, BEiT v2 introduces vector-quantized knowledge distillation (VQ-KD), where a transformer encoder and a quantizer map image patches to discrete codes [22]. BEiT v2 follows the MIM approach, masking 40% of the image patches and replacing them with a learnable embedding [22]. The model reconstructs the masked patches by predicting their visual tokens with a softmax classifier [22], optimizing the MIM loss:
    L MIM = x D i M log p ( z i x i M ) ,
    to improve the global representation, the [CLS] token is pre-trained with a bottleneck mechanism that aggregates patch-level information, and refined with a flat transformer decoder [22]. The final pre-training loss combines the masked image modeling (MIM) loss and the decoder’s masked prediction loss [22]. BEiT v2 can learn both patch-level and global representations by ensuring feature quantization and global information aggregation [22].
  • Swin Transformer v2 [23] addresses important challenges in scaling model capacity and resolution for vision tasks. To improve training stability, it introduces residual post-normalization, which normalizes residual outputs before merging them into the main branch [23]. This reduces the accumulation of activation amplitudes in deeper layers [23]. It also replaces dot product attention with scaled cosine attention [23], defined as follows:
    Sim ( q i , k j ) = cos ( q i , k j ) τ + B i j ,
    where τ is a learnable scalar and B i j represents the relative position bias.
    To handle mismatches between low-resolution pre-training and high-resolution fine-tuning, Swin Transformer v2 introduces log-spaced continuous position bias (Log-CPB) [23], which smooths the transfer of relative position biases across different window sizes [23]. The position bias is computed using a meta-network:
    B ( Δ x , Δ y ) = G ( Δ x , Δ y ) ,
    where G is a small MLP, and coordinates are transformed into log space as
    Δ x ^ = sign ( Δ x ) · log ( 1 + | Δ x | ) , Δ y ^ = sign ( Δ y ) · log ( 1 + | Δ y | ) ,
    Swin Transformer v2 also incorporates memory-efficient techniques such as zero-redundancy optimizers, activation check-pointing, and sequential self-attention computation [23]. It shows important advancements in scaling model capacity and resolution [23].
  • PyramidViT v2 [24] improves on the original PyramidViT v1 by addressing three major limitations: high computational complexity, loss of local continuity, and inflexibility in handling variable input resolutions [24]. To address these issues, PyramidViT v2 introduces three innovations: a linear spatial reduction attention layer (SRA) to reduce the computational cost of attention, overlapping patch embedding instead of non-overlapping patches to model local continuity, and convolutional feed-forward networks to eliminate the need for fixed-size positional embeddings [24]. PyramidViT v2’s hierarchical architecture follows a pyramid structure, with spatial resolution decreasing and channel dimensions increasing over four stages [24]. It scales with different variants by adjusting parameters such as channel dimensions and number of layers [24]. PyramidViT v2 shows improvements in classification, detection, and segmentation tasks [24].
  • MobileViT [25] is a lightweight ViT designed to combine the strengths of CNNs and transformers for mobile vision tasks [25]. It incorporates convolutional properties to improve global representation learning [25]. The core of the MobileViT architecture is the MobileViT block [25], which combines convolutions and transformers to encode both local and global information [25]. For an input tensor X R H × W × C , an n × n convolutional layer followed by a 1 × 1 convolutional layer is applied to produce X L R H × W × d , where the n × n convolution encodes local spatial information and the 1 × 1 convolution projects the tensor into a higher dimensional space ( d > C ) [25]. To capture global information, X L is unfolded into non-overlapping patches X U R P × N × d [25], where P is the patch size and N is the number of patches. Transformers are then applied to learn the relationships between patches [25]:
    X G ( p ) = Transformer ( X U ( p ) ) , 1 p P ,
    The resulting global representation X G is folded back to X F R H × W × d [25], projected to the original dimension C, and merged with the input X via concatenation followed by another n × n convolution [25]. The hierarchical structure of MobileViT consists of an initial 3 × 3 convolution layer, followed by MobileNetV2 blocks for downsampling and MobileViT blocks for feature extraction [25]. The spatial dimensions decrease progressively through the network, allowing for multi-scale representation learning [25]. MobileViT shows high performance in a variety of tasks [25].
  • MobileViT v2 [26] is a hybrid network of CNNs and ViTs optimized for mobile devices that addresses the inefficiencies of multi-head self-attention (MHA) by introducing separable self-attention [26]. Multi-head self-attention (MHA) on MobileVit, with its O ( k 2 ) complexity (where k is the number of tokens or patches), is replaced by a separable self-attention approach that reduces complexity to O ( k ) [26]. Separable self-attention computes context scores which re-weight the input tokens to produce a context vector that encodes global information [26]. This is achieved through element-wise operations such as summation and multiplication, eliminating expensive operations such as batch-wise matrix multiplication [26]. The simplicity of element-wise operations ensures faster inference and lower memory consumption compared to its previous version, MobileViT [26]. MobileViT v2 is also state of the art for tasks such as object detection and segmentation, with marked improvements in both accuracy and latency over MobileViT v1 [26].
  • EfficientViT [27] is a lightweight and memory-efficient ViT designed for high-speed and resource-constrained applications. It addresses inefficiencies in memory access, computation redundancy, and parameter usage through three innovations: a sandwich layout, cascaded group attention (CGA), and parameter reallocation [27]. EfficientViT uses a single memory-bound multi-head self-attention (MHSA) layer sandwiched between feed-forward network (FFN) layers to reduce memory overhead and improve inter-channel communication [27]. To minimize redundancy in the attention heads, cascaded group attention (CGA) splits input features across the heads and refines them progressively [27]. EfficientViT reallocates parameters by increasing channel width for critical modules and decreasing redundant dimensions [27]. This ensures that parameters are used optimally without affecting performance [27]. EfficientViT achieves state-of-the-art performance in tasks such as classification and detection.
Table 1 presents the main features of the state-of-the-art transformer architectures used in this work. Each model illustrates different innovations that can be used for various tasks, from handling high-resolution images to achieving lightweight processing suitable for mobile applications. EfficientFormer and FasterViT are known for their efficiency and high performance, which can make them good for tasks requiring both accuracy and speed. Models such as BEiT v2 excel in global feature extraction. This can make them useful for biomedical applications involving complex patterns, such as gene expression prediction.
Based on the advantages of these state-of-the-art architectures, we hypothesized that they could be applied to the task of gene expression prediction. EfficientFormer, with its metablock design and latency slimming, can process large WSI patches while balancing local and global feature extraction, thus guaranteeing efficient real-time prediction. FasterViT, with its hierarchical focus and hybrid architecture, can handle high-resolution images. This makes it useful for capturing spatial relationships within tissues. Similarly, BEiT v2 provides global feature extraction through its semantic visual tokenizer and patch aggregation and can provide a better knowledge of tissue morphology. Swin Transformer v2, with its hierarchical structure and advanced attention mechanisms, can handle large datasets, as well as complex WSIs and ST data. PyramidViT v2 reduces computational complexity while preserving local details and maintaining robust performance. MobileViT v2 and MobileViT provide lightweight, resource-efficient architectures, ideal for mobile or peripheral applications in clinical environments. Finally, EfficientViT combines memory efficiency with feature learning thanks to its cascading group attention, which helps it to adapt to large-scale task. These advantages can make these models ideal for advancing genetic research by addressing the complexity of the data.

3.4. Evaluation Metrics

In this study, we used the MAE, RMSE, and PCC as metrics, to evaluate the performance of our models in predicting gene expression. Each metric is essential to understanding how well the models work.
  • The MAE measures the average difference between predicted ( y ^ i ) and actual ( y i ) gene expression values. It treats all errors equally.
    M A E = 1 n i = 1 n | y i y ^ i | ,
    lower MAE values mean that the model predicts closer to the actual gene expressions.
  • The RMSE also measures the difference between predictions and actual gene expression values, but gives more weight to larger errors by squaring them.
    R M S E = 1 n i = 1 n ( y i y ^ i ) 2 ,
    smaller RMSE values indicate that the model is making fewer major errors.
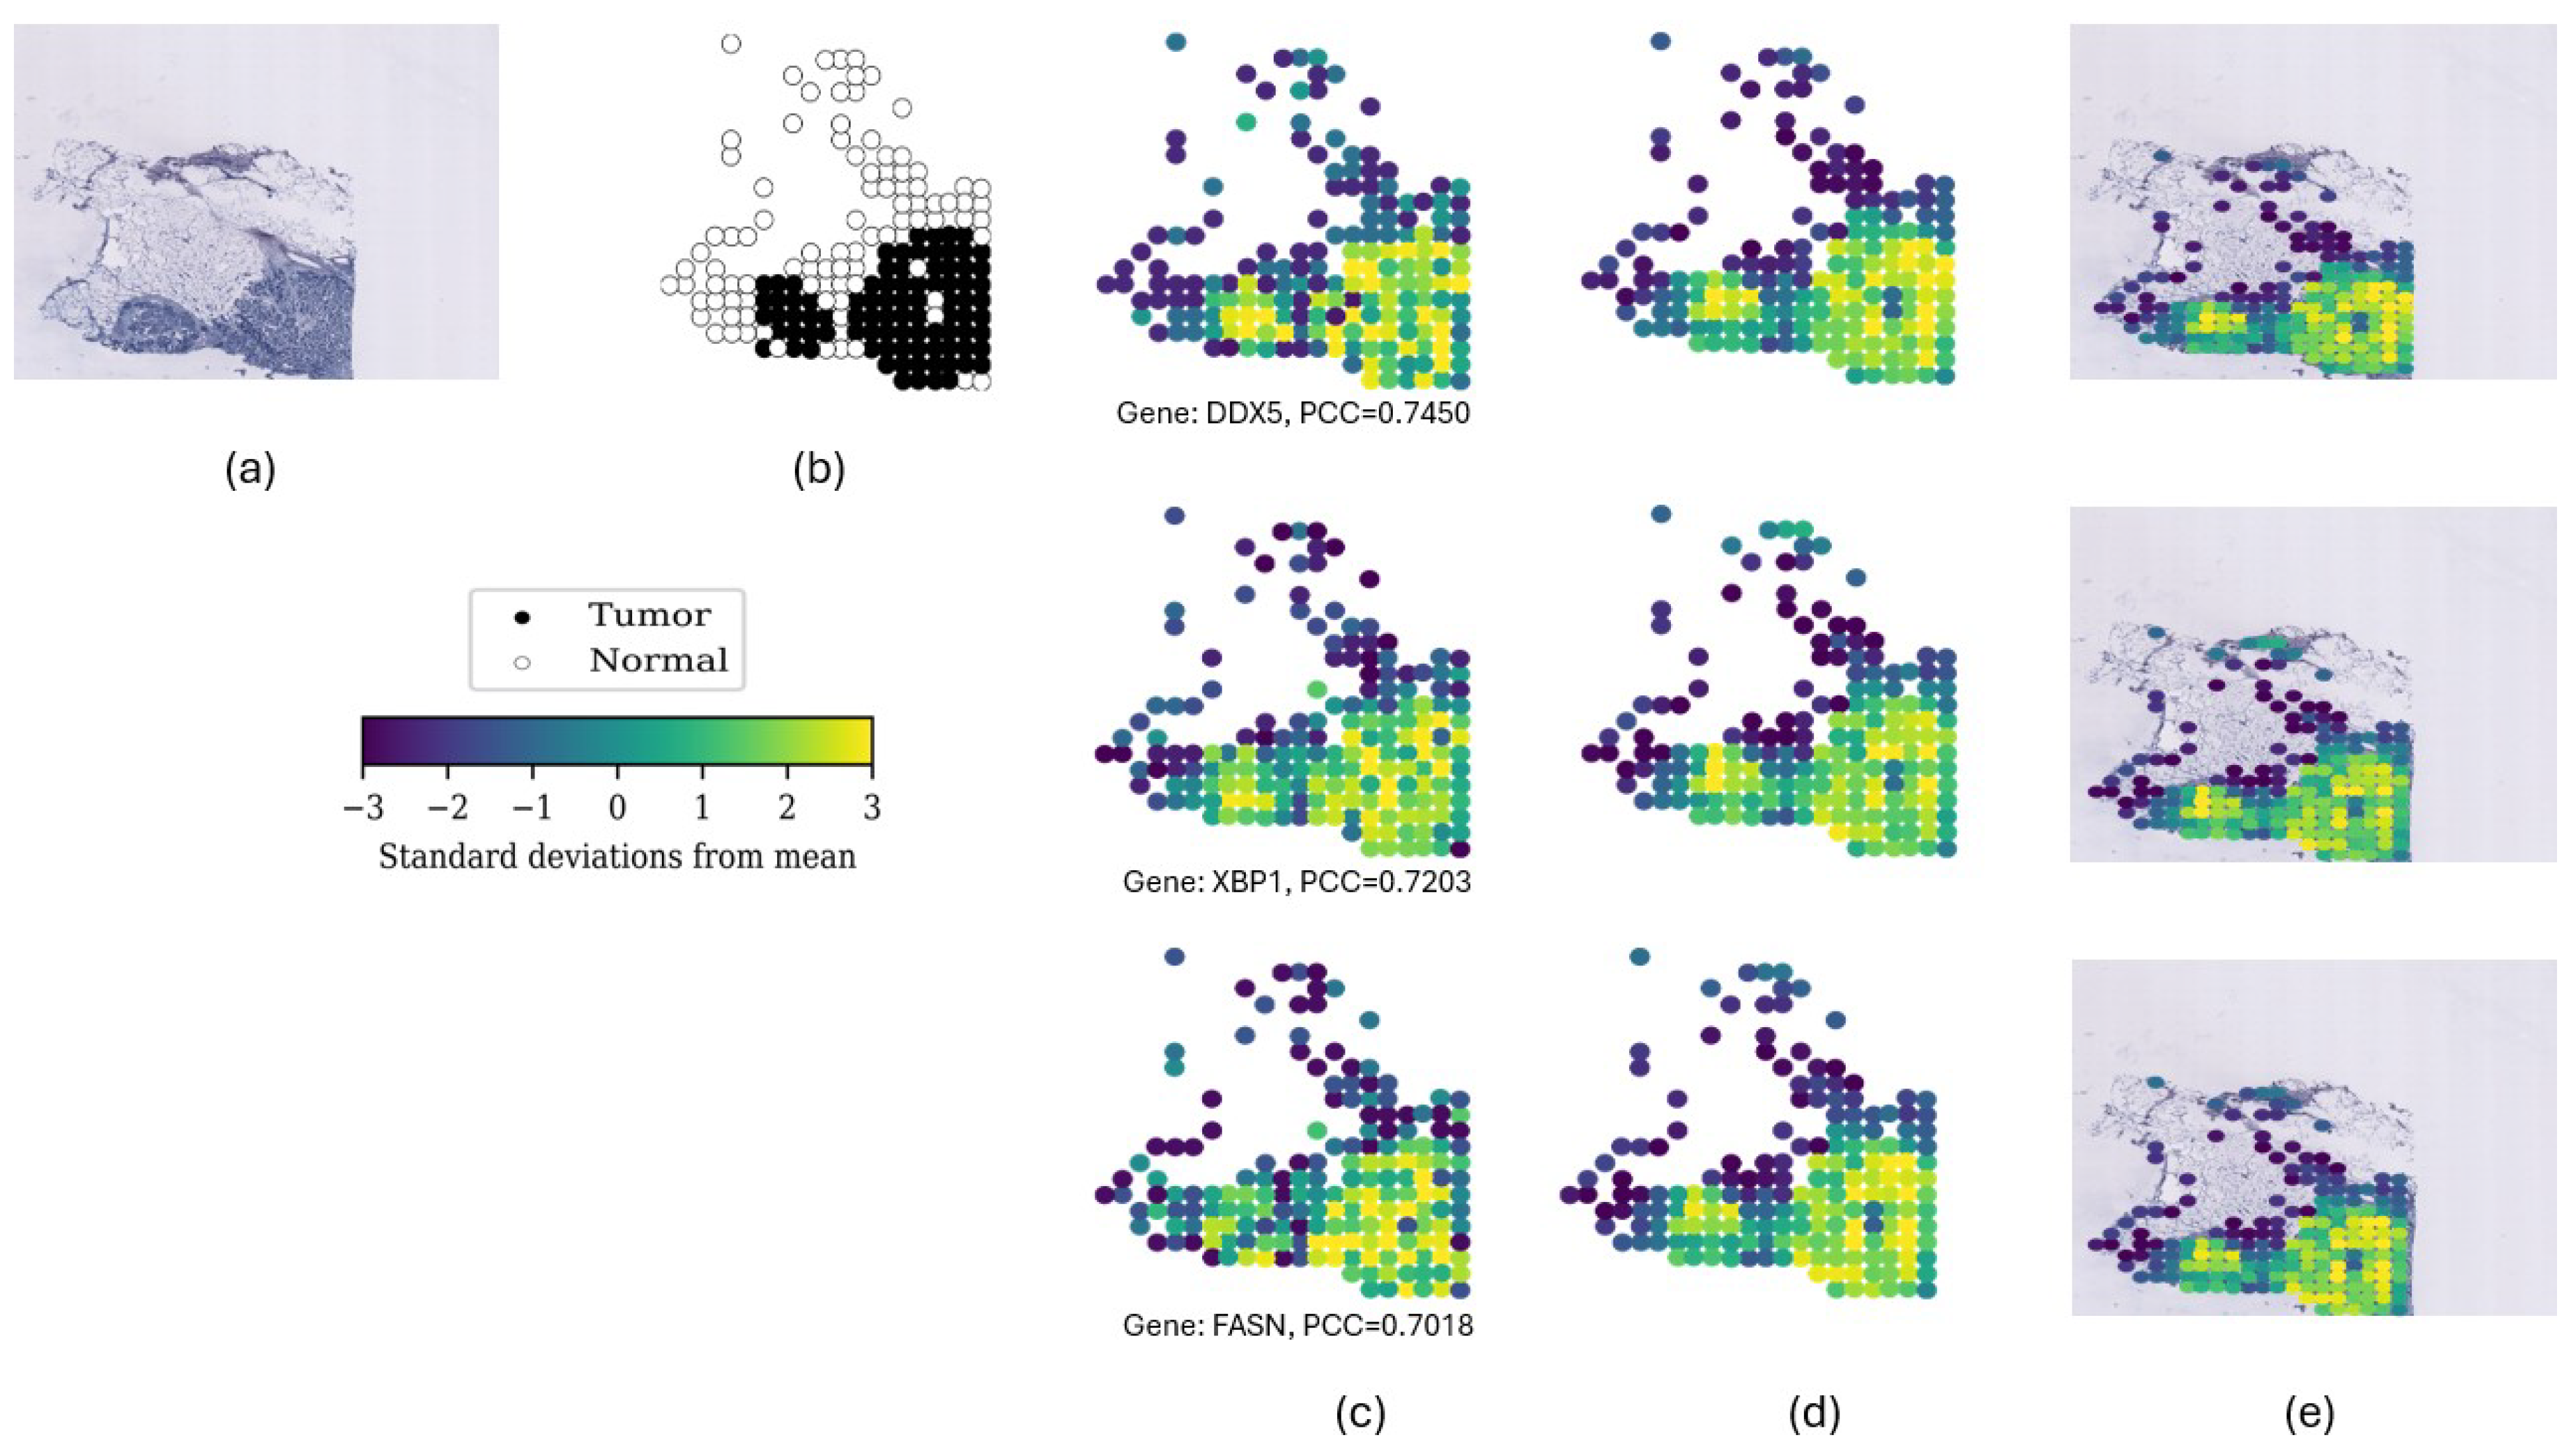
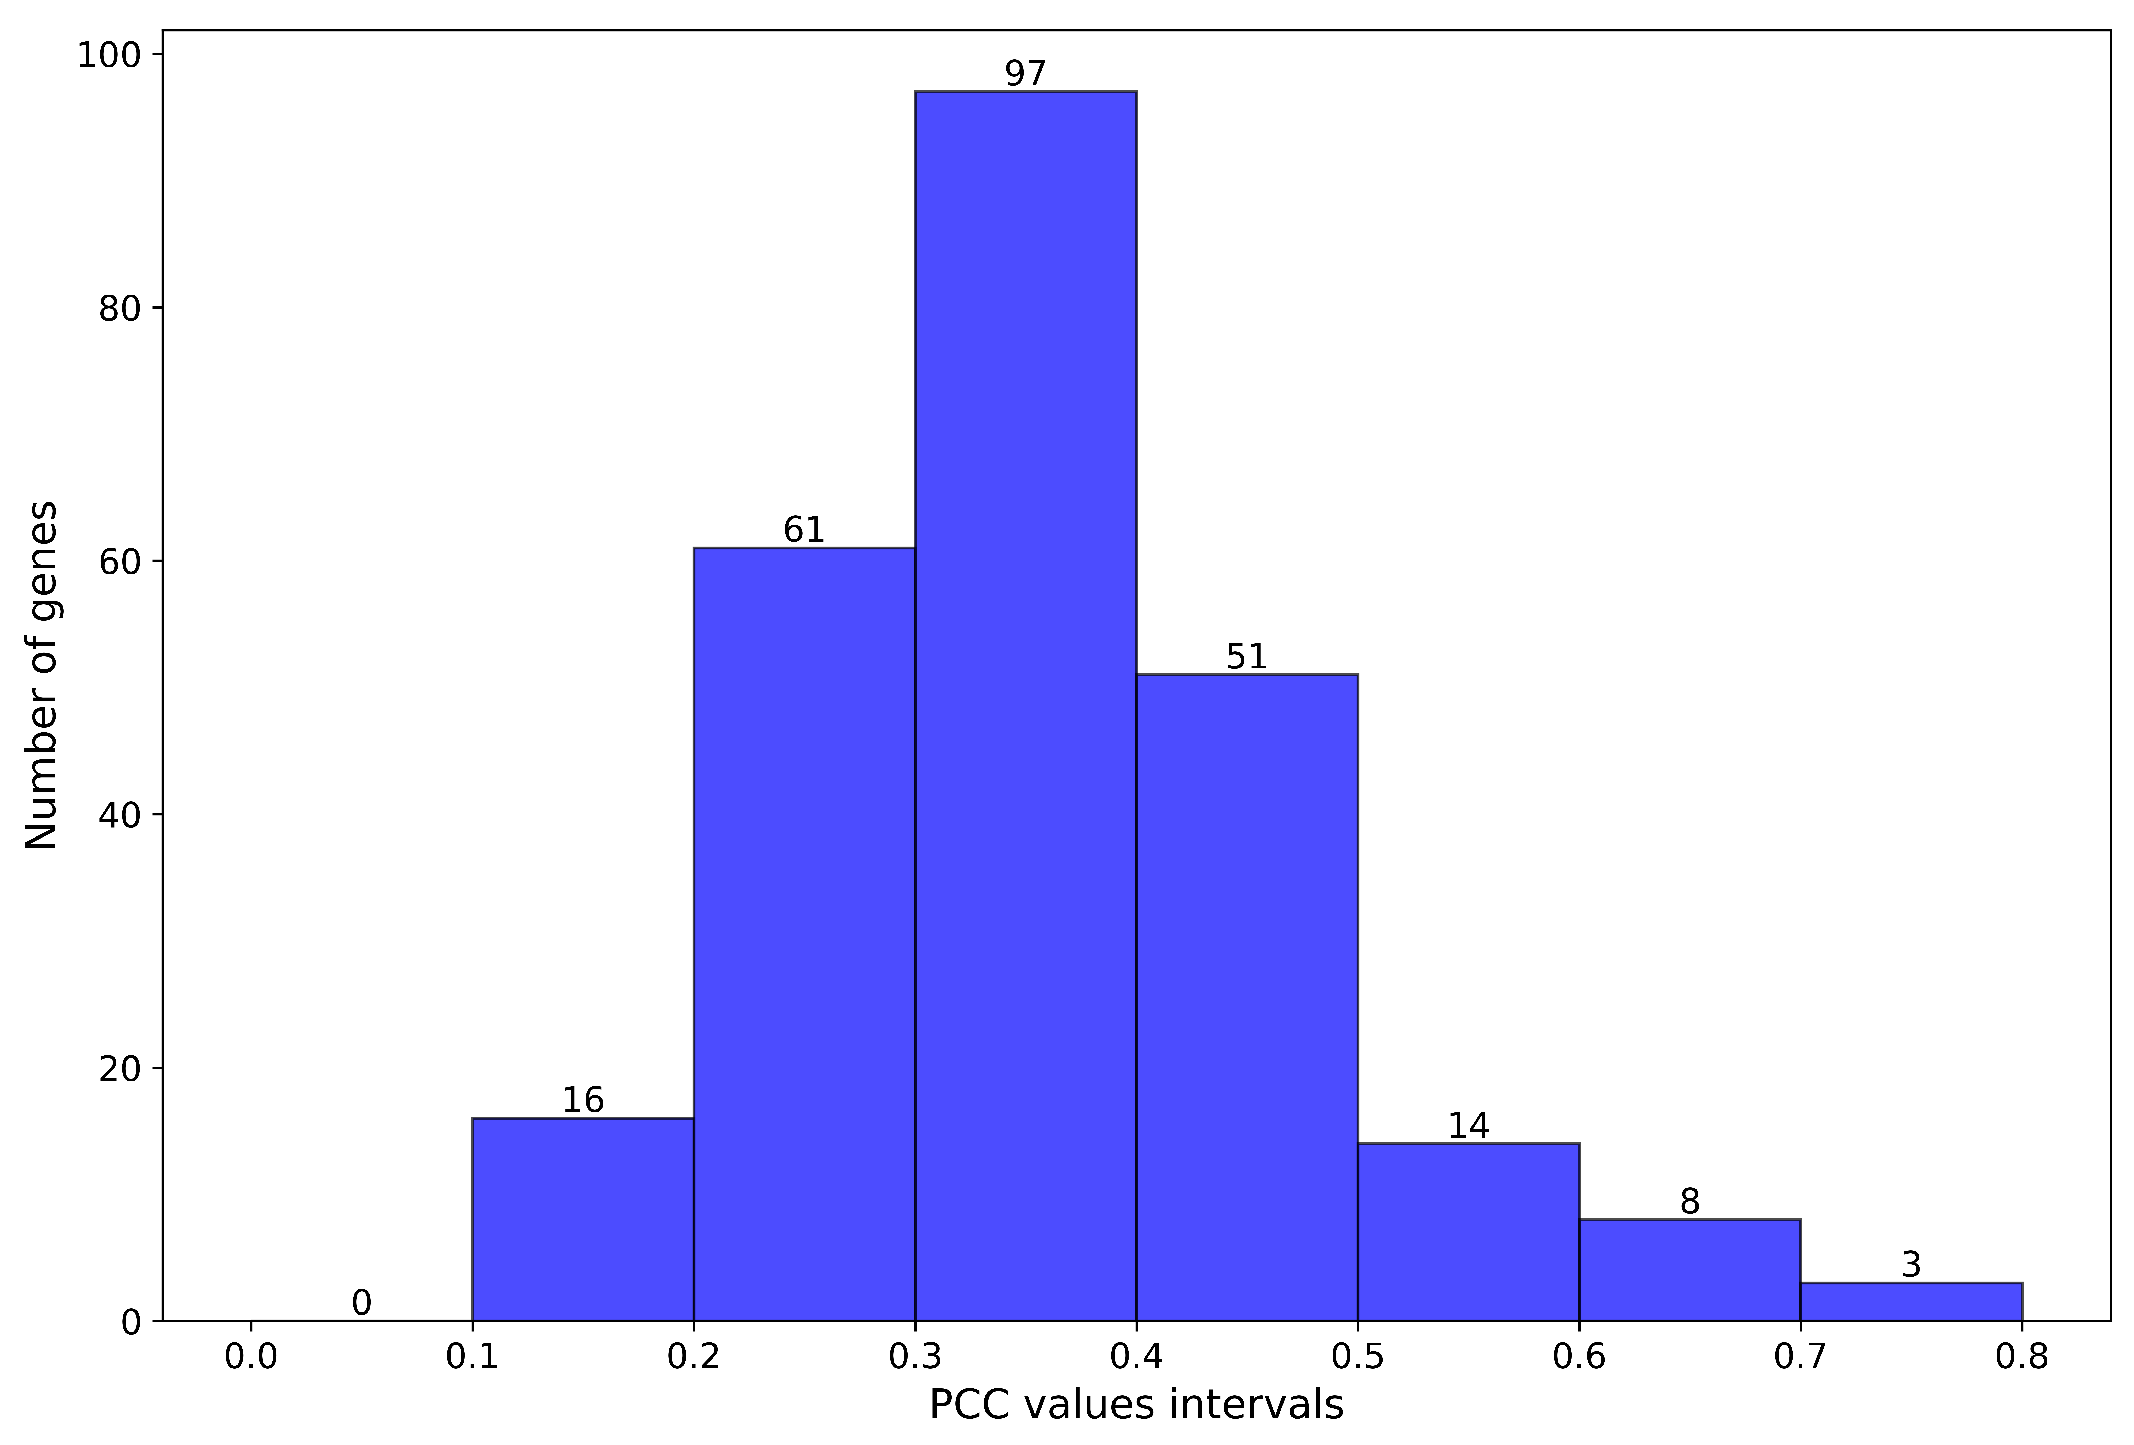
  • The PCC indicates the strength of the relationship between predicted and actual gene expression values.
    P C C = i = 1 n ( y i y ¯ ) ( y ^ i y ^ ¯ ) i = 1 n ( y i y ¯ ) 2 i = 1 n ( y ^ i y ^ ¯ ) 2 ,
    PCC values close to 1 indicate a strong positive correlation.

3.5. Loss Functions

The loss functions are useful in training deep learning models by measuring the difference between predictions and ground truth. They control the optimization process by adjusting model parameters. In this section, we describe the MSELoss and the SL1Loss functions used in our approach.
  • The MSELoss function calculates the average squared difference between predicted and actual gene expression values during training. Larger errors are penalized more heavily than smaller errors.
    M S E = 1 n i = 1 n ( y i y ^ i ) 2 ,
  • The SL1Loss function combines the advantages of the MAE and MSE. It treats small errors like an MAE and large errors like an MSE. This balance makes the model more robust, especially in datasets with outliers or noise.
    SL 1 Loss = 0.5 ( y i y ^ i ) 2 if | y i y ^ i | < 1 , | y i y ^ i | 0.5 otherwise .

4. Results

4.1. Experiments

The GeNetFormer framework was specifically designed to predict the expression of 250 genes, which were selected based on their highest mean expression levels. This selection ensured that the focus was on those biologically meaningful genes with robust expression patterns. To avoid overfitting during training, we applied early stopping, which monitored the performance on the validation set and stopped training when no improvement was observed. The dataset was divided into training, validation, and test sets using a leave-one-patient-out approach. The framework was trained on the training set, validated on the validation set, and tested on the remaining patient. This process was repeated for all 23 patients, to ensure that the framework’s performance was generalized across different samples. After testing, the best Pearson Correlation Coefficient (PCC) value for each gene between all patients was selected, to produce a final ranked list of 250 predicted genes from the highest to lowest PCC.
Several tests were performed with different configurations to validate the framework properly. We tested two loss functions, MSELoss and SL1Loss, on two image resolutions, 224 × 224 and 256 × 256. Four different configurations were tested with the eight transformer models. These tests allowed us to understand how different loss functions and resolutions affect the framework’s ability to predict gene expression. To refine and evaluate the loss functions, we applied the Mean Absolute Error (MAE) and the Root Mean Squared Error (RMSE) as additional metrics. The MAE provided a direct measure of prediction scores by calculating the mean absolute difference between predicted and actual values. The RMSE, on the other hand, served to enhance our understanding of the framework performance when larger deviations occurred. These metrics were crucial for improving the framework by comparing the effectiveness of the loss function and selecting the most appropriate one for our task.
The final results for each configuration were evaluated using the best PCC, which measures the correlation between predicted and actual gene expression values. The PCC is important for ranking the genes, because it provides a good indication of the quality of the prediction. By selecting the best PCC for each gene between all patients, we were sure that the 250 predicted genes represented the highest level of performance.
Training was performed with a batch size of 32 using an NVIDIA GeForce RTX 3090 (Santa Clara, CA, USA) (https://www.nvidia.com/ accessed on 2 Feburary 2025) 24 GB with the PyTorch (version 2.4) library. The learning rate was set to 10 6 , which allowed stable optimization throughout the training process. This combination of full testing, advanced evaluation metrics, and selected hyperparameters resulted in a reliable genetic prediction framework.
In the rest of this section, we present the performance of the framework when integrating the different transformer models in predicting gene expression. Among all patients, we selected the highest value of PCC for each gene for all models.

4.2. MSELoss Function

4.2.1. Resolution 224 × 224 Pixels

This part gives the results for the use of the MSELoss function with image patches of size 224 × 224. Integrating a different transformer model on the framework in each test produced different results. Table 2 shows the PCC values for the top 10 genes and the different performance of each integrated model for each gene. The results show that EfficientFormer was the best-performing integrated model for predicting gene expression, and achieved the highest PCC values for 5 out of 10 genes, namely, DDX5 (0.7411), COX6C (0.6527), PTMA (0.6412), HSPB1 (0.6332), and ERBB2 (0.6323). ST-Net performed best for two genes, XBP1 (0.7273) and FASN (0.6996). BEiT v2 also perfomed well, especially for ACTG1 (0.6885) and HSP90AB1 (0.6714), where it achieved the highest PCC value. MobileVit v2 predicted one gene well, ENSG00000269028 (0.6441). The other models provided balanced results but were still behind the top performers. Globally, EfficientFormer delivered the best results for most genes, while ST-Net was still good for some genes.

4.2.2. Resolution 256 × 256 Pixels

In this part, we present the results obtained using the MSELoss function on patches of size 256 × 256. Each test with the different integrated models on the framework showed different performances, as shown in Table 3. The integration of EfficientFormer always achieved the highest PCC values for seven out of the ten genes and nine genes compared to ST-Net. These genes were DDX5 (0.7450), FASN (0.7018), HSP90AB1 (0.6726), COX6C (0.6548), PTMA (0.6486), HSPB1 (0.6391), and ERBB2 (0.6241). FasterViT also achieved good results, with the best PCC values for ACTG1 (0.6771) and ENSG00000269028 (0.6392). ST-Net achieved the best result only for XBP1 (0.7320). Therefore, EfficientFormer remained the integrated model.

4.3. Sl1loss Function

4.3.1. Resolution 224 × 224 Pixels

Table 4 shows the performance of the different models using the SL1Loss function with image patches of size 224 × 224. EfficientFormer also achieved the highest PCC values for 6 out of 10 genes. These genes were DDX5 (0.7437), HSP90AB1 (0.6608), COX6C (0.6455), PTMA (0.6418), HSPB1 (0.6318), and ENSG00000255823 (0.6260). ST-Net had the best results for XBP1 (0.7273) and FASN (0.6948). PyramidViT v2 had the best prediction for ACTG1 (0.6881), while MobileViT v2 had the best prediction for ENSG00000269028 (0.6436). The other models such as FasterViT and BEiT v2 provided lower PCC values compared to the best-performing model.

4.3.2. Resolution 256 × 256 Pixels

Table 5 shows the performance of the different models using the SL1Loss function with a larger patch size of 256 × 256. EfficientFormer achieved the highest PCC values for 4 out of 10 genes: DDX5 (0.7525), PTMA (0.6492), HSPB1 (0.6294), and ERBB2 (0.6272). However, ST-Net outperformed the other models for three genes: XBP1 (0.7320) and COX6C (0.6439). The rest of the models also showed good predictive ability. PyramidViT v2 achieved the best result for ACTG1 (0.6912), while BEiT v2 was the best at predicting the KRT19 gene (0.6483), and Swin Transformer v2 achieved the best result for HSP90AB1 (0.6718). Despite these results, the other models provided lower PCC values compared to the top performers, especially EfficientFormer, which had an improved performance compared to all models here as well as in the other tests.

4.4. Comparison with ST-Net Performance

This section provides a comparative overview of the GeNetFormer framework with the different integrated transformer models used in this study versus ST-Net, based on their performance in different configurations (loss functions and resolutions). The focus is on the PCC obtained for the first 10 genes. Table 6 summarizes the main results and the best PCC values in each configuration compared to ST-Net. The integration of EfficientFormer showed the best performance, outperforming ST-Net in predicting eight genes with a higher PCC using MSELoss at 224 × 224 resolution, nine genes using MSELoss at 256 × 256 resolution, eight genes using SL1Loss at 224 × 224 resolution, and seven genes using SL1Loss at 256 × 256 resolution. MobileViT v2 achieved a higher PCC for four genes with MSELoss at 224 × 224 resolution, six genes with MSELoss at 256 × 256 resolution, five genes with SL1Loss at 224 × 224 resolution, and four genes with SL1Loss at 256 × 256 resolution. Swin Transformer v2 also performed well, matching MobileViT v2 with four genes better predicted with MSELoss at 224 × 224 resolution, six genes with MSELoss at 256 × 256 resolution, and five genes with SL1Loss at 224 × 224 resolution. FasterViT predicted four genes with a higher PCC using MSELoss at 224 × 224 and 256 × 256 resolution, and five genes using SL1Loss at 224 × 224 resolution. BEiT v2 predicted five genes with a higher PCC than ST-Net using MSELoss at 224 × 224 resolution. Finally, PyramidViT v2 predicted four genes with a higher PCC using SL1Loss at 224 × 224 resolution. MobileViT failed to outperform ST-Net in more than two genes in any configuration. Furthermore, EfficientViT was the worst-performing model, having the lowest PCC values across all configurations.
This analysis shows that our GeNetFormer framework integrating EfficientFormer consistently outperformed the other models and achieved the highest PCC for the majority of genes in all configurations. This confirms its relevance to gene expression prediction tasks. Not only did it outperform the ST-Net in all configurations, predicting more genes with higher PCCs, it also displayed great adaptability to different loss functions and resolutions, thus making it a reliable model. The visualization of the predictions for some selected genes is shown in Figure 3, and the PCC value distribution of the 250 genes is shown in Figure 4.

5. Discussion

Recently, the development of ST has enabled gene expression analysis of WSIs and it has improved our ability to capture spatial information. Some studies such as [4,5] have focused on using CNN models to predict genes locally expressed in a spot as CNNs were widely used in medical imaging and have also been applied to whole-slide histopathology images to identify and determine cancer subtypes, predict mutations, etc. On the other hand, transformers have also been used for a variety of computer vision tasks, especially image classification and object detection. In this work, we wanted to investigate the performance of some advanced transformer-based models on our multivariate regression problem using the STNet dataset. We integrated eight transformer models separately on our GeNetFormer framework. We focused on EfficientFormer, FasterViT, BEiT v2, MobileViT v2, Swin Transformer v2, PyramidViT v2, MobileViT, and EfficientViT. To the best of our knowledge, these models have not been compared with other state-of-the-art CNNs for gene expression prediction. The idea is that CNNs always have the disadvantage of convolutional layers, which may be less efficient compared to the attention mechanism of transformers, which can focus on global relationships in an image and thus provide stronger learning capabilities. Each model has a fully connected layer at the end of the network, consisting of non-shared weights used to predict the expression of each gene. We trained our GeNetFormer framework on the 250 genes with the highest mean expression to focus on more informative genes. We used the RMSE and MAE and PCC as metrics and tested the performance on 23 patients, applying the leave-one-patient-out technique. Each experiment was performed on 22 patients for training and validation and tested on the remaining patient. We then selected the maximum PCC for each gene across all patients. We achieved better results than the first method in the field, ST-Net, which we retrained with our method. We used different loss functions (MSELoss, SL1Loss) and different windows (224 × 224, 256 × 256).
Other studies, such as [4,5,6], worked on the same dataset and used only the MSELoss function, and the results were based only on the 224 × 224 resolution. Our work shows the impact of testing different loss functions and resolutions on the PCC value improvement. The best network that was integrated in our framework was the EfficientFormer; it achieved the best scores in terms of PCC and continuously predicted more genes with the highest PCC than ST-Net [4] across different tests. Among the top 10 predicted genes, EfficientFormer with MSELoss function and 256 × 256 resolution was able to predict 9 genes with a higher PCC, with the highest difference exceeding 0.0737, while ST-Net [4] predicted only 1 gene with a higher PCC. The top 10 genes that were predicted were DDX5, XBP1, FASN, ACTG1, HSP90AB1, COX6C, PTMA, HSPB1, ENSG00000269028, and ERBB2, with PCC values of 0.7450, 0.7203, 0.7018, 0.6761, 0.6726, 0.6548, 0.6486, 0.6391, 0.6269, and 0.6241, respectively. In contrast, ST-Net gave PCC values of 0.6713, 0.7320, 0.6968, 0.5886, 0.6204, 0.6306, 0.6345, 0.5581, 0.6211, and 0.5812 for the same genes. These genes are known as cancer biomarkers when they are highly overexpressed. Among them, HSP90AB1, COX6C, FASN, and ACTG1 are among the 10 genes showing the greatest difference in expression between tumor and normal tissues. Examining other studies, the best median PCC achieved for the B2M gene in [5] was 0.6325, and the best PCC achieved for the ENSG00000145824 gene in [6] was 0.6390. This shows that our method always has better PCC values. Of all the tested models, EfficientFormer was the most efficient integrated network with the MSELoss function and 256 × 256 resolution, and easily outperformed five networks, BEiT v2, Swin Transformer v2, PyramidViT v2, MobileViT, and EfficientViT, as it had the best PCC for 10 genes. It predicted nine out of ten genes better than MobileViT v2 and seven genes better than FasterVit.

Role of the Predicted Biomarkers in BC Progression

DDX5 (DEAD-box protein 5) is frequently amplified in breast cancer, often together with ERBB2, and drives aggressive tumor behavior in certain subtypes. Its amplification, especially in luminal subtypes, is critical for cancer cell proliferation, and its depletion affects these cells [28]. XBP1 is an important target in breast cancer development, particularly in triple-negative breast cancer (TNBC), where it favors tumor growth, metastasis, and therapy resistance. By supporting cancer cell survival under ER stress and facilitating angiogenesis, XBP1 also drives relapse and progression [29]. FASN is overexpressed in approximately 70% of TNBC cases and supports cancer cell survival by increasing fatty acid synthesis for energy and membrane production. It also stabilizes oncogenic proteins, contributes to chemoresistance, and has been correlated with poor prognosis and aggressive tumors [30]. ACTG1, encoding γ -actin, is implicated in breast cancer progression and metastasis as it increases cell motility, invasion, and anchorage-independent growth. Its overexpression has been associated with poor prognosis and resistance to anti-mitotic drugs [31]. HSP90AB1 is overexpressed in breast cancer tissues and stabilizes proteins involved in cancer signaling, promoting tumor growth and metastasis. Its correlation with poor survival and high tumor grades has underscored its importance in aggressive cancers [32]. COX6C, a component of mitochondrial complex IV, is critical for maintaining mitochondrial function in breast cancer, where it helps reduce oxidative stress and prevent apoptosis. Its overexpression, often seen as a compensatory response, underscores its importance in cancer metabolism [33]. PTMA, a small nuclear protein, increases tumor growth by increasing cell division and blocking apoptosis. It is linked to p53 signaling and cell cycle regulation and correlates with aggressive tumors and poor outcomes [34]. HSPB1, encoding heat shock protein beta-1 (HSP27), is associated with advanced tumor stages, lymph node involvement, and hormone receptor positivity in breast cancer. It favors cell proliferation, migration, invasion, and metastasis while preventing apoptosis [35]. ERBB2 (also known as HER2) amplification or overexpression occurs in approximately 15% of breast cancer cases and drives aggressive behavior. Established HER2-targeted therapies, such as trastuzumab and pertuzumab, have improved outcomes for patients with HER2-positive tumors [36]. These biomarkers have contributed to various aspects of breast cancer progression such as proliferation, metastasis, chemoresistance, and survival under stress. Their unique relationships to tumor biology have made them important in breast cancer issues, and provide opportunities for the development of targeted therapies and improved patient outcomes.

6. Conclusions

This study has proposed the GeNetFormer framework and provided a detailed evaluation of state-of-the-art transformer architectures as the integrated network in the framework for predicting gene expression from WSIs and ST in breast cancer research. Eight advanced models, EfficientFormer, FasterViT, BEiT v2, Swin Transformer v2, PyramidViT v2, MobileViT v2, MobileViT, and EfficientViT, were evaluated using different loss function configurations (MSE and Smooth L1) and input resolutions (224 × 224 and 256 × 256). EfficientFormer appeared to be the most robust network in our framework, outperforming the other networks and the ST-Net approach, which was used in the first study on this topic, in terms of the number of genes with high PCC values, while PyramidViT v2, FasterViT, and BEiT v2 showed good results for some genes. Despite the encouraging results, one of the limitations of this study is that it is part of a recent field of research. Therefore, the available data and methods remain limited, underscoring the need for research and development in this area. This study also has other limitations, such as its reliance on a single dataset. In future work, we will address these limitations by testing the framework on diverse datasets representing breast cancer. External validation on independent datasets should also be conducted to ensure greater generalization. Finally, the integration of a deep multimodal approach would enrich the clinical utility and biological insights derived from research in the field.

Author Contributions

Conceptualization, O.T. and M.A.A.; methodology, O.T. and M.A.A.; validation, O.T. and M.A.A.; formal analysis, O.T. and M.A.A.; writing—original draft preparation, O.T.; writing—review and editing, M.A.A.; funding acquisition, M.A.A. All authors have read and agreed to the published version of the manuscript.

Funding

This research was enabled in part by support provided by the Natural Sciences and Engineering Research Council of Canada (NSERC), funding reference number RGPIN-2024-05287.

Institutional Review Board Statement

Not applicable.

Informed Consent Statement

Not applicable.

Data Availability Statement

This work uses a public dataset: https://data.mendeley.com/datasets/29ntw7sh4r/5 (accessed on 17 February 2025).

Conflicts of Interest

The authors declare no conflict of interest.

Abbreviations

The following abbreviations are used in this manuscript:
H&EHematoxylin and eosin
STSpatial transcriptomics
WSIsWhole-slide images
CNNConvolutional neural network
GNNGraph neural network
ViTVision transformer
MAEMean Absolute Error
RMSERoot Mean Squared Error
PCCPearson Correlation Coefficient
NLPNatural language processing

References

  1. Obeagu, E.I.; Obeagu, G.U. Breast cancer: A review of risk factors and diagnosis. Medicine 2024, 103, e36905. [Google Scholar] [CrossRef] [PubMed]
  2. Jiang, B.; Bao, L.; He, S.; Chen, X.; Jin, Z.; Ye, Y. Deep learning applications in breast cancer histopathological imaging: Diagnosis, treatment, and prognosis. Breast Cancer Res. 2024, 26, 137. [Google Scholar] [CrossRef] [PubMed]
  3. Thaalbi, O.; Akhloufi, M.A. Deep learning for breast cancer diagnosis from histopathological images: Classification and gene expression: Review. Netw. Model. Anal. Health Inform. Bioinform. 2024, 13, 52. [Google Scholar] [CrossRef]
  4. He, B.; Bergenstråhle, L.; Stenbeck, L.; Abid, A.; Andersson, A.; Borg, Å.; Maaskola, J.; Lundeberg, J.; Zou, J. Integrating spatial gene expression and breast tumour morphology via deep learning. Nat. Biomed. Eng. 2020, 4, 827–834. [Google Scholar] [CrossRef]
  5. Rahaman, M.M.; Millar, E.K.; Meijering, E. Breast cancer histopathology image-based gene expression prediction using spatial transcriptomics data and deep learning. Sci. Rep. 2023, 13, 13604. [Google Scholar] [CrossRef]
  6. Mejia, G.; Cárdenas, P.; Ruiz, D.; Castillo, A.; Arbeláez, P. SEPAL: Spatial Gene Expression Prediction from Local Graphs. In Proceedings of the IEEE/CVF International Conference on Computer Vision, Paris, France, 1–6 October 2023; pp. 2294–2303. [Google Scholar] [CrossRef]
  7. Liu, Z.; Qian, S.; Xia, C.; Wang, C. Are transformer-based models more robust than CNN-based models? Neural Netw. 2024, 172, 106091. [Google Scholar] [CrossRef]
  8. Yang, Y.; Hossain, M.Z.; Stone, E.A.; Rahman, S. Exemplar guided deep neural network for spatial transcriptomics analysis of gene expression prediction. In Proceedings of the IEEE/CVF Winter Conference on Applications of Computer Vision, Waikoloa, HI, USA, 2–7 January 2023; pp. 5039–5048. [Google Scholar] [CrossRef]
  9. Andersson, A.; Larsson, L.; Stenbeck, L.; Salmén, F.; Ehinger, A.; Wu, S.Z.; Al-Eryani, G.; Roden, D.; Swarbrick, A.; Borg, Å.; et al. Spatial deconvolution of HER2-positive breast cancer delineates tumor-associated cell type interactions. Nat. Commun. 2021, 12, 6012. [Google Scholar] [CrossRef]
  10. Pang, M.; Su, K.; Li, M. Leveraging information in spatial transcriptomics to predict super-resolution gene expression from histology images in tumors. bioRxiv 2021. [Google Scholar] [CrossRef]
  11. Gao, R.; Yuan, X.; Ma, Y.; Wei, T.; Johnston, L.; Shao, Y.; Lv, W.; Zhu, T.; Zhang, Y.; Zheng, J.; et al. Predicting Gene Spatial Expression and Cancer Prognosis: An Integrated Graph and Image Deep Learning Approach Based on HE Slides. bioRxiv 2023. [Google Scholar] [CrossRef]
  12. Zeng, Y.; Wei, Z.; Yu, W.; Yin, R.; Yuan, Y.; Li, B.; Tang, Z.; Lu, Y.; Yang, Y. Spatial transcriptomics prediction from histology jointly through transformer and graph neural networks. Briefings Bioinform. 2022, 23, bbac297. [Google Scholar] [CrossRef]
  13. Mondol, R.K.; Millar, E.K.; Graham, P.H.; Browne, L.; Sowmya, A.; Meijering, E. hist2RNA: An efficient deep learning architecture to predict gene expression from breast cancer histopathology images. Cancers 2023, 15, 2569. [Google Scholar] [CrossRef] [PubMed]
  14. Qu, H.; Zhou, M.; Yan, Z.; Wang, H.; Rustgi, V.K.; Zhang, S.; Gevaert, O.; Metaxas, D.N. Genetic mutation and biological pathway prediction based on whole slide images in breast carcinoma using deep learning. NPJ Precis. Oncol. 2021, 5, 87. [Google Scholar] [CrossRef] [PubMed]
  15. Vahadane, A.; Peng, T.; Sethi, A.; Albarqouni, S.; Wang, L.; Baust, M.; Steiger, K.; Schlitter, A.M.; Esposito, I.; Navab, N. Structure-preserving color normalization and sparse stain separation for histological images. IEEE Trans. Med. Imaging 2016, 35, 1962–1971. [Google Scholar] [CrossRef] [PubMed]
  16. Rehman, Z.; Wan Ahmad, W.; Ahmad Fauzi, M.; Abas, F.S.; Cheah, P.L.; Looi, L.; Toh, Y. Comprehensive analysis of color normalization methods for HER2-SISH histopathology images. J. Eng. Sci. Technol 2024, 19, 146–159. [Google Scholar]
  17. Vaswani, A. Attention is all you need. Adv. Neural Inf. Process. Syst. 2017. [Google Scholar] [CrossRef]
  18. Dosovitskiy, A. An image is worth 16x16 words: Transformers for image recognition at scale. arXiv 2020, arXiv:2010.11929. [Google Scholar] [CrossRef]
  19. Deng, J.; Dong, W.; Socher, R.; Li, L.J.; Li, K.; Fei-Fei, L. ImageNet: A large-scale hierarchical image database. In Proceedings of the 2009 IEEE Conference on Computer Vision and Pattern Recognition, Miami, FL, USA, 20–25 June 2009; pp. 248–255. [Google Scholar] [CrossRef]
  20. Li, Y.; Yuan, G.; Wen, Y.; Hu, J.; Evangelidis, G.; Tulyakov, S.; Wang, Y.; Ren, J. Efficientformer: Vision transformers at mobilenet speed. Adv. Neural Inf. Process. Syst. 2022, 35, 12934–12949. [Google Scholar] [CrossRef]
  21. Hatamizadeh, A.; Heinrich, G.; Yin, H.; Tao, A.; Alvarez, J.M.; Kautz, J.; Molchanov, P. Fastervit: Fast vision transformers with hierarchical attention. arXiv 2023, arXiv:2306.06189. [Google Scholar] [CrossRef]
  22. Peng, Z.; Dong, L.; Bao, H.; Ye, Q.; Wei, F. Beit v2: Masked image modeling with vector-quantized visual tokenizers. arXiv 2022, arXiv:2208.06366. [Google Scholar] [CrossRef]
  23. Liu, Z.; Hu, H.; Lin, Y.; Yao, Z.; Xie, Z.; Wei, Y.; Ning, J.; Cao, Y.; Zhang, Z.; Dong, L.; et al. Swin transformer v2: Scaling up capacity and resolution. In Proceedings of the IEEE/CVF Conference on Computer Vision and Pattern Recognition, New Orleans, LA, USA, 18–24 June 2022; pp. 12009–12019. [Google Scholar] [CrossRef]
  24. Wang, W.; Xie, E.; Li, X.; Fan, D.P.; Song, K.; Liang, D.; Lu, T.; Luo, P.; Shao, L. Pvt v2: Improved baselines with pyramid vision transformer. Comput. Vis. Media 2022, 8, 415–424. [Google Scholar] [CrossRef]
  25. Mehta, S.; Rastegari, M. Mobilevit: Light-weight, general-purpose, and mobile-friendly vision transformer. arXiv 2021, arXiv:2110.02178. [Google Scholar] [CrossRef]
  26. Mehta, S.; Rastegari, M. Separable self-attention for mobile vision transformers. arXiv 2022, arXiv:2206.02680. [Google Scholar] [CrossRef]
  27. Liu, X.; Peng, H.; Zheng, N.; Yang, Y.; Hu, H.; Yuan, Y. Efficientvit: Memory efficient vision transformer with cascaded group attention. In Proceedings of the IEEE/CVF Conference on Computer Vision and Pattern Recognition, Vancouver, BC, Canada, 17–24 June 2023; pp. 14420–14430. [Google Scholar] [CrossRef]
  28. Mazurek, A.; Luo, W.; Krasnitz, A.; Hicks, J.; Powers, R.S.; Stillman, B. DDX5 regulates DNA replication and is required for cell proliferation in a subset of breast cancer cells. Cancer Discov. 2012, 2, 812–825. [Google Scholar] [CrossRef] [PubMed]
  29. Chen, X.; Iliopoulos, D.; Zhang, Q.; Tang, Q.; Greenblatt, M.B.; Hatziapostolou, M.; Lim, E.; Tam, W.L.; Ni, M.; Chen, Y.; et al. XBP1 promotes triple-negative breast cancer by controlling the HIF1α pathway. Nature 2014, 508, 103–107. [Google Scholar] [CrossRef]
  30. Chaturvedi, S.; Biswas, M.; Sadhukhan, S.; Sonawane, A. Role of EGFR and FASN in breast cancer progression. J. Cell Commun. Signal. 2023, 17, 1249–1282. [Google Scholar] [CrossRef]
  31. Suresh, R.; Diaz, R.J. The remodelling of actin composition as a hallmark of cancer. Transl. Oncol. 2021, 14, 101051. [Google Scholar] [CrossRef]
  32. Liu, H.; Zhang, Z.; Huang, Y.; Wei, W.; Ning, S.; Li, J.; Liang, X.; Liu, K.; Zhang, L. Plasma HSP90AA1 predicts the risk of breast cancer onset and distant metastasis. Front. Cell Dev. Biol. 2021, 9, 639596. [Google Scholar] [CrossRef]
  33. de Oliveira, R.C.; Dos Reis, S.P.; Cavalcante, G.C. Mutations in Structural Genes of the Mitochondrial Complex IV May Influence Breast Cancer. Genes 2023, 14, 1465. [Google Scholar] [CrossRef]
  34. Kumar, A.; Kumar, V.; Arora, M.; Kumar, M.; Ammalli, P.; Thakur, B.; Prasad, J.; Kumari, S.; Sharma, M.C.; Kale, S.S.; et al. Overexpression of prothymosin-α in glioma is associated with tumor aggressiveness and poor prognosis. Biosci. Rep. 2022, 42, BSR20212685. [Google Scholar] [CrossRef]
  35. Huo, Q.; Wang, J.; Xie, N. High HSPB1 expression predicts poor clinical outcomes and correlates with breast cancer metastasis. BMC Cancer 2023, 23, 501. [Google Scholar] [CrossRef]
  36. Moutafi, M.; Robbins, C.J.; Yaghoobi, V.; Fernandez, A.I.; Martinez-Morilla, S.; Xirou, V.; Bai, Y.; Song, Y.; Gaule, P.; Krueger, J.; et al. Quantitative measurement of HER2 expression to subclassify ERBB2 unamplified breast cancer. Lab. Investig. 2022, 102, 1101–1108. [Google Scholar] [CrossRef]
Figure 1. STNet dataset images. (a) Original whole-slide images. (b) Stain-normalized images using the Vahadane method [15].
Ai 06 00043 g001
Figure 2. Overview of the GeNetFormer framework (integrating EfficientFormer, the best-performing model), for predicting gene expression from WSIs. (A) Data preparation: WSIs were stain normalized and then the patches were extracted. (B) Model training: Patches were fed into the integrated network comprising multiple stages of M B 4 D and M B 3 D blocks, with intermediate layers labeled as (i), (ii), (iii), and (iv), representing the hierarchical progression of feature extraction, ending with a fully connected (FC) layer producing 250 outputs corresponding to gene expressions. (C) Model evaluation: The model’s predictions of an individual gene were evaluated using samples of WSIs: (a) test samples, (b) binary designation of tumor (black) and normal (white) regions, (c) ground truth, (d) model predictions of an individual gene, and (e) overlay of predictions on the test sample.
Ai 06 00043 g002
Figure 3. Visualization of different individual gene expression predictions by the GeNetFormer framework. (a) Original test sample. (b) Binary labels of tumor (black) and normal (white) regions. (c) Ground truth. (d) Model predictions of the genes DDX5 (PCC = 0.7450), XBP1 (PCC = 0.7203), and FASN (PCC = 0.7018). (e) Overlay of the predictions on the original test sample.
Ai 06 00043 g003
Figure 4. PCC value distribution for the 250 genes predicted by GeNetFormer.
Ai 06 00043 g004
Table 1. Main features of the state-of-the-art transformer architectures used in this work.
ModelInnovationsProcessing TimeAdvantages in State of the Art
EfficientFormerMetaBlock +
Latency slimming
FastHigh accuracy with efficiency, real-time tasks.
FasterViTHierarchical attention mechanismsModerateHigh-resolution data processing efficiency.
BEiT v2Semantic visual tokenizerSlowHigh global feature comprehension.
Swin Transformer v2Scaled cosine attention +
Log-spaced continuous position bias
ModerateHigh resolution and large data processing efficiency.
PyramidViT v2Linear spatial reduction attention +
Overlapping patch embedding +
Convolutional feed-forward networks
ModerateHigh efficiency of large image processing.
MobileViT v2Separable self-attentionVery FastLightweight, ideal for mobile devices.
MobileViTMobileViT blocksVery FastLightweight, ideal for mobile devices.
EfficientViTSandwich layout +
Cascaded group attention +
Parameter reallocation
FastBalancing memory efficiency and accuracy.
Table 2. Presentation of the top PCC values for 10 genes using the MSELoss function and a resolution of 224 × 224. The best PCC value across all models is underlined. (GeNetFormer-Eff: abbreviation of GeNetFormer with integrated EfficientFormer; GeNetFormer-FVT: abbreviation of GeNetFormer with integrated FasterViT; GeNetFormer-BE2: abbreviation of GeNetFormer with integrated BEiT v2; GeNetFormer-MVT2: abbreviation of GeNetFormer with integrated MobileViT v2; GeNetFormer-ST2: abbreviation of GeNetFormer with integrated Swin Transformer v2; GeNetFormer-PVT2: abbreviation of GeNetFormer with integrated PyramidViT v2; GeNetFormer-MVTS: abbreviation of GeNetFormer with integrated MobileViT; GeNetFormer-EffV: abbreviation of GeNetFormer with integrated EfficientViT).
GeneGeNetFormer-EffGeNetFormer-FVTGeNetFormer-BE2GeNetFormer-MVT2GeNetFormer-ST2GeNetFormer-PVT2GeNetFormer-MVTSGeNetFormer-EffVST-Net
DDX50.74110.71550.70910.70880.69400.68880.65110.61860.6738
XBP10.71010.70400.71240.69530.69470.64170.69330.58990.7273
FASN0.69460.65890.67740.67710.61340.60350.59020.59830.6996
ACTG10.67370.68270.68850.63750.63550.66200.65450.56370.5921
HSP90AB10.66450.63270.67140.64080.62750.62270.58390.58040.6294
COX6C0.65270.49180.63310.51590.63900.55640.61720.52100.6390
PTMA0.64120.62650.49420.63060.52830.53410.58100.56710.6356
HSPB10.63320.49690.59760.50580.46410.45160.49550.42810.5630
ERBB20.63230.56940.50710.57710.52090.51100.43460.49930.6072
ENSG000002690280.62580.60780.63310.64410.61580.54920.41740.55740.5847
Table 3. Presentation of the top PCC values for 10 genes using the MSELoss function and a resolution of 256 × 256. The best PCC value across all models is underlined. (GeNetFormer-Eff: abbreviation of GeNetFormer with integrated EfficientFormer; GeNetFormer-FVT: abbreviation of GeNetFormer with integrated FasterViT; GeNetFormer-BE2: abbreviation of GeNetFormer with integrated BEiT v2; GeNetFormer-MVT2: abbreviation of GeNetFormer with integrated MobileViT v2; GeNetFormer-ST2: abbreviation of GeNetFormer with integrated Swin Transformer v2; GeNetFormer-PVT2: abbreviation of GeNetFormer with integrated PyramidViT v2; GeNetFormer-MVTS: abbreviation of GeNetFormer with integrated MobileViT; GeNetFormer-EffV: abbreviation of GeNetFormer with integrated EfficientViT).
GeneGeNetFormer-EffGeNetFormer-FVTGeNetFormer-BE2GeNetFormer-MVT2GeNetFormer-ST2GeNetFormer-PVT2GeNetFormer-MVTSGeNetFormer-EffVST-Net
DDX50.74500.70680.65560.72220.71010.70640.66660.52100.6713
XBP10.72030.72700.68620.71280.71600.66010.70400.56930.7320
FASN0.70180.64830.65350.69000.64610.61970.62250.54570.6968
ACTG10.67610.67710.63620.64940.66150.66930.67280.44350.5886
HSP90AB10.67260.63960.61450.64620.65560.64560.59640.50770.6204
COX6C0.65480.50680.57840.54600.54440.57210.64560.34300.6306
PTMA0.64860.60720.56390.64470.51540.53330.58590.34750.6345
HSPB10.63910.53790.56060.58090.53300.44580.50030.34960.5581
ERBB20.62410.58940.62330.57970.50730.50420.48700.48380.6211
ENSG000002690280.62690.63920.57420.63900.58720.55660.44220.51750.5812
Table 4. Presentation of the top PCC values for 10 genes using the SL1Loss function and a resolution of 224 × 224. The best PCC value across all models is underlined. (GeNetFormer-Eff: abbreviation of GeNetFormer with integrated EfficientFormer; GeNetFormer-FVT: abbreviation of GeNetFormer with integrated FasterViT; GeNetFormer-BE2: abbreviation of GeNetFormer with integrated BEiT v2; GeNetFormer-MVT2: abbreviation of GeNetFormer with integrated MobileViT v2; GeNetFormer-ST2: abbreviation of GeNetFormer with integrated Swin Transformer v2; GeNetFormer-PVT2: abbreviation of GeNetFormer with integrated PyramidViT v2; GeNetFormer-MVTS: abbreviation of GeNetFormer with integrated MobileViT; GeNetFormer-EffV: abbreviation of GeNetFormer with integrated EfficientViT).
GeneGeNetFormer-EffGeNetFormer-FVTGeNetFormer-BE2GeNetFormer-MVT2GeNetFormer-ST2GeNetFormer-PVT2GeNetFormer-MVTSGeNetFormer-EffVST-Net
DDX50.74370.72110.70770.71520.70440.71630.67730.65290.6712
XBP10.70850.71220.62230.67970.69510.68520.70840.55230.7273
FASN0.69350.66630.59750.67770.61290.61510.59380.61000.6948
ACTG10.66450.68590.61270.64500.65010.68810.65960.54750.5961
HSP90AB10.66080.64500.58300.64460.64780.63570.60530.60050.6304
COX6C0.64550.53240.53530.50420.51850.56090.63520.61920.6399
PTMA0.64180.62730.52770.62960.55510.54770.57890.56510.6352
HSPB10.63180.51690.46390.48120.47930.47130.50330.42150.5740
ENSG000002690280.63140.60950.54670.64360.58720.57100.37590.50690.5693
ENSG000002558230.62600.60470.52520.62520.58720.55190.34580.51310.5615
Table 5. Presentation of the top PCC values for 10 genes using the SL1Loss function and a resolution of 256 × 256. The best PCC value across all models is underlined. (GeNetFormer-Eff: abbreviation of GeNetFormer with integrated EfficientFormer; GeNetFormer-FVT: abbreviation of GeNetFormer with integrated FasterViT; GeNetFormer-BE2: abbreviation of GeNetFormer with integrated BEiT v2; GeNetFormer-MVT2: abbreviation of GeNetFormer with integrated MobileViT v2; GeNetFormer-ST2: abbreviation of GeNetFormer with integrated Swin Transformer v2; GeNetFormer-PVT2: abbreviation of GeNetFormer with integrated PyramidViT v2; GeNetFormer-MVTS: abbreviation of GeNetFormer with integrated MobileViT; GeNetFormer-EffV: abbreviation of GeNetFormer with integrated EfficientViT).
GeneGeNetFormer-EffGeNetFormer-FVTGeNetFormer-BE2GeNetFormer-MVT2GeNetFormer-ST2GeNetFormer-PVT2GeNetFormer-MVTSGeNetFormer-EffVST-Net
DDX50.75250.71850.67070.73190.71740.72720.65600.56980.6907
XBP10.69300.72500.69530.70230.71680.69660.71380.64220.7320
FASN0.69540.66610.64980.68390.64830.62550.60060.64570.6991
ACTG10.69030.68470.64410.65560.66770.69120.65040.56990.6037
HSP90AB10.66660.65440.63380.65760.67180.65720.57880.61050.6474
COX6C0.62820.54490.58190.52220.56000.58510.63300.34880.6439
PTMA0.64920.61980.54410.64320.54690.54270.58520.51880.6379
HSPB10.62940.56450.58720.51390.54210.50830.49790.29020.5969
ERBB20.62720.59390.61830.58980.45080.52880.50820.48800.6224
KRT190.61730.54380.64830.42200.58010.35540.26080.23390.5980
Table 6. Overview of the framework performance with the different integrated models vs. ST-Net performance. The highest PCC values of the different models vs. ST-Net PCC values for the top 10 predicted genes are underlined. (GeNetFormer-Eff: abbreviation of GeNetFormer with integrated EfficientFormer; GeNetFormer-FVT: abbreviation of GeNetFormer with integrated FasterViT; GeNetFormer-BE2: abbreviation of GeNetFormer with integrated BEiT v2; GeNetFormer-MVT2: abbreviation of GeNetFormer with integrated MobileViT v2; GeNetFormer-ST2: abbreviation of GeNetFormer with integrated Swin Transformer v2; GeNetFormer-PVT2: abbreviation of GeNetFormer with integrated PyramidViT v2; GeNetFormer-MVTS: abbreviation of GeNetFormer with integrated MobileViT; GeNetFormer-EffV: abbreviation of GeNetFormer with integrated EfficientViT).
GeneGeNetFormer-EffGeNetFormer-FVTGeNetFormer-BE2GeNetFormer-MVT2GeNetFormer-ST2GeNetFormer-PVT2GeNetFormer-MVTSGeNetFormer-EffVST-Net
MSELoss—224 × 224 resolution
DDX50.74110.71550.70910.70880.69400.68880.65110.61860.6738
XBP10.71010.70400.71240.69530.69470.64170.69330.58990.7273
FASN0.69460.65890.67740.67710.61340.60350.59020.59830.6996
ACTG10.67370.68270.68850.63750.63550.66200.65450.56370.5921
HSP90AB10.66450.63270.67140.64080.62750.62270.58390.58040.6294
COX6C0.65270.49180.63310.51590.63900.55640.61720.52100.6390
PTMA0.64120.62650.49420.63060.52830.53410.58100.56710.6356
HSPB10.63320.49690.59760.50580.46410.45160.49550.42810.5630
ERBB20.63230.56940.50710.57710.52090.51100.43460.49930.6072
ENSG000002690280.62580.60780.63310.64410.61580.54920.41740.55740.5847
MSELoss—256 × 256 resolution
DDX50.74500.70680.65560.72220.71010.70640.66660.52100.6713
XBP10.72030.72700.68620.71280.71600.66010.70400.56930.7320
FASN0.70180.64830.65350.69000.64610.61970.62250.54570.6968
ACTG10.67610.67710.63620.64940.66150.66930.67280.44350.5886
HSP90AB10.67260.63960.61450.64620.65560.64560.59640.50770.6204
COX6C0.65480.50680.57840.54600.54440.57210.64560.34300.6306
PTMA0.64860.60720.56390.64470.51540.53330.58590.34750.6345
HSPB10.63910.53790.56060.58090.53300.44580.50030.34960.5581
ERBB20.62410.58940.62330.57970.50730.50420.48700.48380.6211
ENSG000002690280.62690.63920.57420.63900.58720.55660.44220.51750.5812
SL1Loss—224 × 224 resolution
DDX50.74370.72110.70770.71520.70440.71630.67730.65290.6712
XBP10.70850.71220.62230.67970.69510.68520.70840.55230.7273
FASN0.69350.66630.59750.67770.61290.61510.59380.61000.6948
ACTG10.66450.68590.61270.64500.65010.68810.65960.54750.5961
HSP90AB10.66080.64500.58300.64460.64780.63570.60530.60050.6304
COX6C0.64550.53240.53530.50420.51850.56090.63520.61920.6399
PTMA0.64180.62730.52770.62960.55510.54770.57890.56510.6352
HSPB10.63180.51690.46390.48120.47930.47130.50330.42150.5740
ENSG000002690280.63140.60950.54670.64360.58720.57100.37590.50690.5693
ENSG000002558230.62600.60470.52520.62520.58720.55190.34580.51310.5615
SL1Loss—256 × 256 resolution
DDX50.75250.71850.67070.73190.71740.72720.65600.56980.6907
XBP10.69300.72500.69530.70230.71680.69660.71380.64220.7320
FASN0.69540.66610.64980.68390.64830.62550.60060.64570.6991
ACTG10.69030.68470.64410.65560.66770.69120.65040.56990.6037
HSP90AB10.66660.65440.63380.65760.67180.65720.57880.61050.6474
COX6C0.62820.54490.58190.52220.56000.58510.63300.34880.6439
PTMA0.64920.61980.54410.64320.54690.54270.58520.51880.6379
HSPB10.62940.56450.58720.51390.54210.50830.49790.29020.5969
ERBB20.62720.59390.61830.58980.45080.52880.50820.48800.6224
KRT190.61730.54380.64830.42200.58010.35540.26080.23390.5980
Disclaimer/Publisher’s Note: The statements, opinions and data contained in all publications are solely those of the individual author(s) and contributor(s) and not of MDPI and/or the editor(s). MDPI and/or the editor(s) disclaim responsibility for any injury to people or property resulting from any ideas, methods, instructions or products referred to in the content.

