Article

A General-Purpose Knowledge Retention Metric for Evaluating Distillation Models Across Architectures and Tasks

by
Arjay Alba
1,2,3,* and
Jocelyn Villaverde
1,2
1
School of Graduate Studies, Mapua University, Manila 1002, Philippines
2
School of Electrical, Electronics, and Computer Engineering, Mapua University, Manila 1002, Philippines
3
College of Engineering, Bulacan State University, Malolos 3000, Philippines
*
Author to whom correspondence should be addressed.
AI 2025, 6(10), 273; https://doi.org/10.3390/ai6100273
Submission received: 14 September 2025 / Revised: 27 September 2025 / Accepted: 30 September 2025 / Published: 21 October 2025

Abstract

Background: Knowledge distillation (KD) compresses deep neural networks by transferring knowledge from a high-capacity teacher model to a lightweight student model. However, conventional evaluation metrics such as accuracy, mAP, IoU, or RMSE focus mainly on task performance and overlook how effectively the student internalizes the teacher’s knowledge. Methods: This study introduces the Knowledge Retention Score (KRS), a composite metric that integrates intermediate feature similarity and output agreement into a single interpretable score to quantify knowledge retention. KRS was primarily validated in computer vision (CV) through 36 experiments covering image classification, object detection, and semantic segmentation using diverse datasets and eight representative KD methods. Supplementary experiments were conducted in natural language processing (NLP) using transformer-based models on SST-2, and in time series regression with convolutional teacher–student pairs. Results: Across all domains, KRS correlated strongly with standard performance metrics while revealing internal retention dynamics that conventional evaluations often overlook. By reporting feature similarity and output agreement separately alongside the composite score, KRS provides transparent and interpretable insights into knowledge transfer. Conclusions: KRS offers a stable diagnostic tool and a complementary evaluation metric for KD research. Its generality across domains demonstrates its potential as a standardized framework for assessing knowledge retention beyond task-specific performance measures.

1. Introduction

Deep neural networks (DNNs) have become essential in tasks such as image classification, object detection [1,2,3], and natural language processing [4]. However, deploying them on resource-constrained devices—such as mobile phones and embedded systems—is often hindered by high computational and memory demands [5]. This challenge has driven research into model compression techniques that reduce complexity without sacrificing accuracy. Among these, Knowledge Distillation (KD) is widely used: a lightweight student model is trained to mimic a high-capacity teacher model. Originally proposed by [6], KD has since evolved into response-based, feature-based, and relation-based methods [7], such as response-based KD transfers logits; feature-based KD aligns intermediate representations; and relation-based KD captures structural dependencies between features [8]. These approaches support different tasks and architectures, but their evaluation remains inconsistent.
Most KD studies rely on task-specific metrics such as accuracy, mAP, or IoU. While useful, these metrics emphasize outcomes rather than the process of knowledge transfer, overlooking dimensions such as internal representation retention, interpretability, and efficiency [9]. Knowledge retention—the degree to which a student internalizes the teacher’s knowledge—has thus emerged as an important evaluation focus [10,11]. Yet no standardized metric directly measures it. Existing approaches infer retention indirectly through accuracy or by isolating feature similarity or output agreement.
To address this gap, we introduce the Knowledge Retention Score (KRS), a composite metric that integrates intermediate feature similarity and output agreement to quantify knowledge retention. KRS enables consistent evaluation of KD methods across architectures and datasets, complementing traditional performance metrics with deeper insights into the distillation process. While our validation emphasizes computer vision, the design of KRS makes it extendable to domains such as NLP, audio, and time series, positioning it as a versatile framework for evaluating KD effectiveness.

2. Literature Review

Knowledge Distillation (KD) encompasses diverse strategies for transferring knowledge from teacher to student, broadly categorized as response-based, feature-based, and relation-based.
Response-based KD, introduced by [6], distills knowledge from the softmax outputs (logits) of the teacher model. By using these “soft labels,” the student not only learns the correct class but also the teacher’s confidence distribution. While simple and effective, this method limits transfer to the output layer and ignores richer internal representations [12].
Feature-based KD addresses this by aligning intermediate feature maps. Approaches such as FitNets [8] and Attention Transfer (AT) [13] use internal representations or attention maps to help students capture spatial and semantic patterns learned by the teacher—particularly useful for vision tasks like classification and detection.
Relation-based KD extends transfer to the structural relationships in the teacher’s knowledge. Relational Knowledge Distillation (RKD) [14], for example, models pairwise distances or dependencies between data points, enabling the student to capture not only what the teacher knows but also how that knowledge is structured.
Despite these advances, KD evaluations remain heavily dependent on accuracy or task-specific metrics [5,7,15]. Such metrics fail to capture whether the student has internalized complex features or relational cues, especially in tasks requiring contextual or spatial reasoning [16]. They also lack interpretability [17], which is critical in sensitive domains such as healthcare [18] and finance [19]. Finally, they ignore efficiency—the central motivation for KD—sometimes favoring methods with marginal accuracy gains but high resource costs.
To overcome these shortcomings, some studies have introduced feature similarity measures (e.g., cosine similarity [14], mean squared error (MSE) [20], and Centered Kernel Alignment (CKA) [21]), to evaluate alignment at intermediate layers. Others rely on output agreement metrics, such as KL Divergence [20], mutual information [22], or Top-N agreement [23], to assess prediction-level consistency.
Individually, these metrics offer useful insights, but none provide a complete picture. By combining feature similarity and output agreement, evaluation can better reflect both representational alignment and decision-level consistency [24]. This motivates the development of a composite metric like KRS, which integrates these perspectives into a single, interpretable framework.

3. Materials and Methods

This section focuses on developing and validating the Knowledge Retention Score (KRS) as a general-purpose metric for evaluating Knowledge Distillation (KD) performance across different tasks and model architectures.

3.1. Developing the Knowledge Retention Score (KRS)

The Knowledge Retention Score (KRS) is a composite metric designed to evaluate how effectively a student model retains the knowledge of its teacher during distillation. Unlike traditional task-specific metrics that measure only end-task performance, KRS incorporates both intermediate feature alignment and final output consistency. These two components—Feature Similarity Score (FSS) and Average Output Agreement (AOAg)—represent distinct but complementary perspectives of knowledge transfer. By combining them into a single interpretable value, KRS enables standardized comparison of KD methods across tasks, datasets, and model architectures while capturing retention at both representational and predictive levels.

3.1.1. Feature Similarity Calculation

Feature similarity is a key component of KRS because it measures how well the student model’s intermediate representations align with those of the teacher. This alignment reflects the student’s ability to capture hierarchical features—such as spatial and semantic patterns—that are essential for effective knowledge transfer in complex tasks.
To compute feature similarity, we compare feature maps from selected teacher and student layers using Centered Kernel Alignment (CKA), chosen for its robustness in high-dimensional spaces. Given the feature maps of the teacher and student models at layer l, denoted Tl(x) and Sl(x) for input x, we first compute their centered Gram matrices, KT and KS:
K T = T l x · T l x T 1 n T l x · T l x T · 1 1 · T l x · T l x T + 1 n 2 · 1 · T l x · T l x T · 1
where n is the number of elements in the feature map and 1 is an n × n matrix of ones. A similar calculation yields KS.
The CKA similarity is then defined as:
CKA l ( T l x , S l ( x ) ) = T r ( K T · K S ) T r ( K T · K T ) · T r ( K S · K S )
where Tr is the trace of the matrix, which is defined as the sum of elements along its main diagonal. Equation (2) will yield a scalar value ranging from 0 to 1. A CKA score of 1 indicates perfect alignment between the feature maps of the teacher and the student, and a score of 0 is the opposite. For a comprehensive feature similarity score, we average the CKA similarity values across multiple layers and inputs in the dataset using Layer-Wise Averaging shown in Equation (3):
Avg   Feature   Similariy l = 1 D x D CKA l ( T l x ,   S l ( x ) )
where D is the dataset used. This yields an average similarity score for each layer, reflecting how well the student replicates the teacher’s feature representations at that level. To obtain a single feature similarity score, we further average across all selected layers:
Feature   Similarity   Score = 1 L l L Avg   Feature   Similarity l
This aggregated score represents the feature similarity component of the KRS, providing a comprehensive measure of feature alignment across the model.

3.1.2. Output Agreement Calculation

The second component of KRS, output agreement, measures how closely the student replicates the teacher’s predictions. Unlike feature similarity, which captures representational alignment, output agreement evaluates the final decision boundaries, providing a complementary perspective on knowledge transfer.
For this study, we use Kullback–Leibler (KL) Divergence, a standard measure of the difference between two probability distributions. In KD, KL Divergence quantifies how well the student’s predicted probabilities approximate those of the teacher.
Let PT(x) and PS(x) denote the teacher’s and student’s probability distributions for input x. The KL Divergence is defined as:
KL P T x | | P S x = i P T ( x ) i · l o g P T ( x ) i P S ( x ) i
where PT(x)i and PS(x)i are the predicted probabilities for the i-th class. Smaller values indicate higher similarity between teacher and student predictions.
Because KL Divergence is minimized rather than maximized, we transform it into a normalized Output Agreement Score:
Output   Agreement   Score ( x ) = 1   KL P T x | | P S x C
where C is the maximum KL value computed during validation. This ensures that OAS ranges between 0 and 1, with higher values reflecting stronger agreement.
Finally, the overall Average Output Agreement (AOAg) across the dataset is obtained by averaging over all inputs:
Average   Output   Agreement =   1 D x D   Output   Agreement   Score ( x )
where |D| is the dataset size. This score forms the second component of KRS, complementing feature similarity by quantifying alignment at the output level.

3.1.3. Combining Feature and Output Components

The final KRS integrates the two components—feature similarity and output agreement—into a single composite measure. This ensures that evaluation captures both intermediate representation alignment and final prediction consistency, providing a holistic view of the student’s retention of the teacher’s knowledge.
Formally, KRS is defined as:
KRS = α·Feature Similarity Score + β·Average Output Agreement
where α and β are weights assigned to the feature similarity and output agreement components, respectively, with α + β = 1. The values of α and β can be adjusted based on the importance of feature retention versus output alignment for a given application or task.
In this study, we used task-specific α and β values to reflect the relative importance of intermediate features versus final predictions. For image classification tasks, we set α = 0.3 and β = 0.7 to emphasize output-level agreement. For object detection and segmentation tasks, we set α = 0.7 and β = 0.3 to prioritize feature alignment, which is critical for spatial reasoning and localization.
The task-specific weighting of α and β in KRS does not merely reflect arbitrary preferences but is grounded in the observation that knowledge retention emphasizes different dimensions across tasks. In Section 4.2.5, we present a sensitivity analysis showing how KRS behaves under varying α values across classification, detection, and segmentation. The results support our choice of default α values, as the highest KRS values align with the components that are more critical for each task. Thus, our proposed configuration of KRS enables both flexibility and robustness, providing a task-aware evaluation framework.

3.1.4. Rationale for Composite Metric Design

The KRS is designed as a composite metric that combines two independently interpretable components—Feature Similarity Score (FSS) and Average Output Agreement (AOAg). Each captures a distinct dimension of the knowledge transfer process in Knowledge Distillation (KD). Feature similarity, measured via CKA, evaluates how well the student reproduces the teacher’s internal representations, which are crucial for deep understanding and generalization. Output agreement, measured through KL divergence or IoU depending on the task, reflects how closely the student aligns with the teacher’s final predictions and decision boundaries.
The rationale for combining these components follows the Additive Utility Model in multi-criteria decision-making (MCDM) [25]. In this framework, multiple normalized and meaningful indicators can be linearly aggregated into a single score when they represent distinct yet complementary perspectives of a system. This principle has long been applied in composite indices beyond KD, such as the Human Development Index (HDI) in economics [26], the F1-score in information retrieval (harmonic mean of precision and recall) [27], and the BLEU score in natural language processing (geometric mean of n-gram precisions) [28]. By analogy, KRS integrates feature-level and output-level alignment into a single interpretable value that reflects both the “internal thinking” and the “external behavior” of the student model.
The additive form of KRS also offers clear boundary and monotonicity properties:
  • KRS decreases proportionally when either FSS or AOAg decreases, with the degree of reduction determined by their respective weights (α, β).
  • If both FSS and AOAg approach zero, KRS also approaches zero, reflecting the intuition that successful knowledge transfer requires alignment at both representational and predictive levels.
  • KRS is strictly monotonic with respect to each component, with partial derivatives ∂KRS/∂FSS = α and ∂KRS/∂AOAg = β. This ensures transparency in how weightings influence the final score.
Lemma 1. 
Basic Properties of KRS
Let KRS = α·FSS + β·AOAg with  α , β 0  and  α + β = 1 . Assume  F S S ,   A O A g 0 , 1 .  Then:
(a) 
(Range)  K R S 0 , 1
(b) 
(Boundary) If  F S S 0  and  A O A g 0 ,  then  K R S 0
(c) 
(Monotonicity)
K R S F S S = α , K R S A O A g = β
Hence, KRS is monotonic in each component, and strictly monotonic whenever its corresponding weight is positive.
(d) 
(Sensitivity) The marginal contribution of each component is linear and weight-controlled: increasing FSS by  Δ  raises KRS by  α Δ increasing AOAg by Δ raises KRS by  β Δ .
Proof. 
Items a and b follow from convex combination of bounded terms. Item c follows by direct differentiation. Item d follows from linearity.
The choice of weights (α, β) is task-aware rather than arbitrary. As shown in the sensitivity analysis (Section 4.2.5), classification tasks benefit from emphasizing AOAg (lower α), while detection and segmentation benefit from emphasizing FSS (higher α). The selected defaults (α = 0.3 for classification, α = 0.7 for detection/segmentation) are therefore empirically validated, aligning with the characteristics of each task.
While future work may explore alternative aggregation strategies—such as multiplicative, attention-weighted, or data-driven formulations—that could capture non-linear interactions between FSS and AOAg, these approaches would require careful normalization and added complexity. In contrast, the current additive weighted-average formulation balances simplicity, interpretability, and empirical validity, making it a practical baseline for evaluating KD effectiveness across diverse tasks. Importantly, KRS is not intended to replace the separate reporting of FSS and AOAg; rather, it complements them by providing a stable, holistic indicator that moderates trade-offs between the two components and prevents misleading conclusions when one improves disproportionately.

3.1.5. KRS for Image Segmentation Tasks

The KRS defined in Equation (8) is designed for object detection and classification tasks only. While this formulation is effective for tasks where outputs are vector-based predictions, it does not provide an optimal measure for segmentation tasks, where predictions are pixel-wise and require spatial alignment.
In segmentation, output agreement must capture the similarity of segmentation masks between the teacher and student models, reflecting accurate spatial and class over-lap. Thus, for image segmentation, we replace KL Divergence with Intersection over Un-ion (IoU), a metric that directly evaluates the overlap between the teacher’s and student’s segmentation maps.
So, for every image x in the test set, let S(x) represent the segmentation mask output from the student model and T(x) represent the segmentation mask from the teacher model. The IoU for output agreement is calculated as:
IoU T x , S x = T ( x ) S ( x ) T ( x ) S ( x )
where T ( x ) S ( x ) is the number of pixels where the teacher and student segmentation masks overlap (agree on the segmentation), and T ( x ) S ( x ) is the total number of pixels in either mask. This IoU score provides a pixel-wise evaluation of agreement, specifically assessing how accurately the student replicates the teacher’s spatial segmentation.
To obtain the overall Output Agreement Score for the dataset, we average the IoU values across all validation or test samples:
Average   Output   Agreement IoU = 1 D x D   IoU T x , S x
This average IoU represents the degree of alignment between teacher and student across the entire segmentation task, ensuring that spatial and class overlap is consistently maintained. The KRS for segmentation tasks combines the Feature Similarity Score (CKA) of Equation (4) and the Average Output Agreement (IoU) in Equation (10), and is defined as:
KRS s e g = α · Feature   Similarity   Score + β · Average   Output   Agreement IoU
By adjusting the output agreement component to use IoU, this formulation of KRS accurately evaluates knowledge retention for segmentation tasks, where spatial fidelity and pixel-level agreement are crucial for performance.

3.1.6. Interpreting the KRS

The final KRS is a single scalar value representing the overall knowledge retention of the student model. Ranging from 0 to 1, a KRS of 1 indicates perfect knowledge retention by the student, while a score of 0 signifies minimal or no retention.

3.2. Experimental Setup

The experimental setup involves selecting appropriate datasets, teacher–student model pairs, and KD techniques to rigorously evaluate the Knowledge Retention Score (KRS). This setup ensures that KRS can be tested across different architectures and tasks, validating its robustness and generalizability.

3.2.1. Dataset

To evaluate KRS effectively, we use a variety of datasets that cover different types of tasks. For image classification, a well-known classification dataset such as CIFAR-100 and Tiny ImageNet is used. These datasets contain labeled images of objects and allow us to assess KRS in a standard classification task. For object detection task, a dataset like COCO (Common Objects in Context) [29], Pascal VOC [30], and Oxford IIIT Pet is used. Object detection datasets introduce additional complexity with multi-object scenarios, enabling the evaluation of KRS in more complex feature extraction and prediction contexts. By using datasets with different characteristics (e.g., classification vs. detection, simple vs. complex images), we can evaluate the versatility of KRS across various types of tasks. Each dataset is then split into training, validation, and test sets, as shown in Table 1. The training set is used to train the student network using KD, while the test set is used to compute the final KRS, ensuring that KRS reflects generalizable knowledge retention. For the COCO dataset, we adopted the standard split of 5000 images for validation and 41,000 for testing. While this split is naturally imbalanced, it reflects the widely accepted benchmarking setup used in object detection studies. To mitigate instability in hyperparameter tuning, we applied conservative and cross-validated hyperparameter settings derived from prior studies and ensured that model selection was guided by trends across multiple checkpoints—not single best-validation snapshots. Moreover, final performance was assessed on the test set to avoid overfitting to the validation set.

3.2.2. Teacher–Student Model Pairs

We select several teacher–student model pairs to test KRS across varying architecture complexities and parameter sizes. For instance, we will use ResNet-101/ResNet-18 to assess knowledge transfer across models with similar architectures but different capacities. Another pair is the VGG-19/AlexNet, which showcases two different architectures. Variants like WRN-40-2/WRN-16-1 are included to assess knowledge retention across wide network architectures. EfficientNet-B7/EfficientNet-Lite pair assesses KRS in the context of highly optimized, efficient models.
In Table 2, we summarized the compression rate of the abovementioned teacher–student pair used in this study.

3.2.3. Dataset–Model Pairing Strategy

The dataset–model pairing strategy for validating the KRS was intentionally crafted to ensure generalizability across a broad spectrum of computer vision tasks, teacher–student architectures, and distillation methodologies. This approach minimizes selection bias and supports the goal of evaluating KRS under realistic and varied conditions.
To address task diversity, the study includes datasets for image classification, object detection, and image segmentation. For classification, CIFAR-100, Tiny ImageNet, and Oxford-IIIT Pet were selected to capture differences in class granularity and dataset complexity. Object detection experiments used COCO and PASCAL VOC, which provide challenging, multi-object scenarios with extensive annotation formats. For segmentation, the Oxford-IIIT Pet dataset was adapted to pixel-level labeling, enabling the assessment of knowledge retention in tasks with spatial and structural outputs. This variety ensures that KRS is validated using multiple evaluation metrics such as accuracy, mean average precision (mAP), and Intersection over Union (IoU).
In terms of architectural diversity, the selected model pairs reflect various forms of compression and network transformation. These include depth reduction, as seen in the ResNet-101 to ResNet-18 pair; structural mismatch, as exemplified by VGG-19 and AlexNet; width reduction, using WRN-40-2 and WRN-16-1; and efficiency-oriented architectures, such as those in the EfficientNet-B7 to EfficientNet-Lite combinations. These pairings span models with differing design philosophies and computational profiles, al-lowing KRS to be evaluated under heterogeneous network conditions.
To further ensure methodological coverage, the study includes a wide range of knowledge distillation techniques categorized under three principal types. Response-based approaches include Vanilla Knowledge Distillation and Student-Friendly Knowledge Distillation (SKD). Feature-based methods comprise FitNet, Attention Transfer (ART), and the Uncertainty-aware Efficient Teacher (UET). Relation-based strategies such as Gradient-based Knowledge Distillation (GKD), Global Logits Distillation (GLD), and Cross-Relation Consistency Distillation (CRCD) are also represented. These techniques were selected not only for their representational completeness in the KD literature but also for the availability of stable and well-documented implementation protocols.
Through this deliberate selection of datasets, models, and methods, the experimental design ensures that KRS is rigorously evaluated across multiple task complexities, architectural configurations, and distillation paradigms, supporting its potential as a scalable and general-purpose metric for knowledge retention.

3.2.4. Knowledge Distillation Techniques

In Table 3, we outline the comprehensive pairing of the datasets used in this study, alongside the corresponding teacher–student network pairs and the KD methods implemented to validate the KRS. This table provides a clear overview of how each dataset is matched with appropriate model architectures and the specific KD techniques replicated to assess the robustness and applicability of KRS across different tasks.
For the image classification task, we implemented Vanilla KD as it represents the foundational KD approach specifically designed for image classification. Additionally, SKD (Student-friendly KD) was selected due to the clear implementation guidelines provided by its authors and its demonstrated promising results in prior studies. This combination allows for a thorough evaluation of KRS using both a classic and an advanced response-based KD method.
For the object detection task, we implemented FitNet, the earliest feature-based KD model, to serve as a benchmark. Alongside FitNet, we incorporated two modern KD techniques: ART (Ambiguity-aware Teacher KD) and UET (Uncertainty Estimation-Discriminative Knowledge Extraction-Knowledge Transfer). Both ART and UET introduce uncertainty awareness into the KD process and have reported improved performance in recent studies. By using KRS, we aim to assess whether these newer methods genuinely enhance knowledge retention compared to FitNet, providing a more comprehensive evaluation of their effectiveness.
For the image segmentation task, we implemented GKD (Graph-based Knowledge Distillation), the first relation-based KD method, as a foundational benchmark. In addition, we included GLD (Global and Local Logits Densely Connected Relations) due to its significant impact and recognition within the research community. We also consider Complementary Relation Contrastive Distillation (CRCD) for its impact and replicability. This combination allows us to evaluate KRS’s effectiveness in assessing knowledge retention across both pioneering and influential relation-based KD techniques.

3.3. Implementation Strategy

To reduce bias in the experiment, it is essential to follow the same steps and procedures for each teacher–student model pair, dataset, and KD technique to ensure consistency and fairness in the evaluation process. This section outlines our implementation strategies.

3.3.1. Image Augmentation

In this study, image augmentation is employed during the training phase to enhance the generalization and robustness of both the teacher and student models. Various techniques, including random cropping, flipping, and brightness adjustments, are used to generate a diverse set of training examples, helping to prevent overfitting and improve performance on new data.

3.3.2. Training Process

The training process in this study consists of two distinct phases. In the first phase, both the teacher and student networks are built from scratch and trained on the datasets listed in Table 3. Training is conducted using standard stochastic gradient descent (SGD) with momentum, and learning rates are initialized based on model type and task complexity.
Hyperparameter tuning is performed using Random Search due to its practical balance between exploration efficiency and ease of implementation across multiple model dataset configurations. To ensure fairness and methodological rigor, we apply a uniform search budget of 30 trials for each teacher–student–dataset combination. All random searches are executed using a fixed random seed (seed = 42) to guarantee reproducibility. Convergence is assessed using early stopping with a patience of 10 epochs, based on validation loss, to prevent overfitting and reduce unnecessary computation. These constraints are carefully enforced to ensure that no distillation method gains advantage through prolonged or more refined tuning.
Baseline performance is measured using the validation dataset, where accuracy (A) is used for classification tasks, mean average precision (mAP) for object detection, and Intersection over Union (IoU) for image segmentation. Additionally, we compute the KRS between the teacher and the student model to establish the student’s initial knowledge retention prior to distillation. This allows us to isolate and analyze the effect of the KD process in improving not only task-specific performance, but also internal representational alignment as captured by KRS.

3.3.3. Knowledge Distillation

In the second phase of training, we implement the KD model to transfer knowledge from the teacher network to the student, as specified in Table 3. Each KD method is meticulously replicated according to the original procedures outlined by the respective authors to ensure methodological fidelity. To maintain consistency across all teacher–student pairs listed in Table 3, the teacher network remains in inference mode throughout the knowledge transfer process. As in the first phase, we calculate accuracy (A), mean average precision (mAP), and Intersection over Union (IoU), depending on the task being performed.

3.3.4. Evaluation of Student’s Performance Using KRS

Upon completing the KD process, both the teacher and student networks are set to inference mode to evaluate their accuracy (A), mean average precision (mAP), and Inter section over Union (IoU) on the test dataset. To determine the KRS for the student model, intermediate features must be captured from both the teacher and student networks at various levels of abstraction. Figure 1 provides an example of these feature maps taken from different layers in the ResNet-101 and ResNet-18 models, specifically from the outputs of Conv2_x, Conv3_x, Conv4_x, and Conv5_x. For other teacher–student network pairs used in this study, Table 4 lists the layers from which feature maps are extracted. The selection of feature layers for computing CKA similarity in KRS is based on both architectural design and established practices in representation similarity analysis. For each model pair, we chose layers that represent progressively deeper semantic understanding—from early convolutional blocks to the final pooling or fully connected layers. For example, in ResNet-based models, we extract features from Conv2_x through Conv5_x, following prior work indicating that these layers capture hierarchical representation shifts. For non-ResNet architectures such as VGG or EfficientNet, layers are selected to reflect comparable semantic depth and transformation complexity. Table 4 summarizes the selected layers per architecture. This manual selection allows consistency across experiments while ensuring that the comparison covers a representative spectrum of learned features.

4. Results and Discussion

In total, we conducted 36 experiments in this study, based on the combinations outlined in Table 3.

4.1. Performance Improvement Before and After KD

4.1.1. Analysis Using Conventional Performance Metrics

As shown in Figure 2, KD consistently improves student model performance across all experiments, datasets, and metrics—demonstrating its effectiveness in enhancing generalization.
In Figure 2a, accuracy improvements are most evident in the Oxford-IIIT Pet dataset and more modest in Tiny ImageNet. The former’s lower class count and distinct visual features facilitate easier knowledge transfer. In contrast, Tiny ImageNet’s high interclass similarity poses a greater challenge. ResNet-18 consistently outperforms AlexNet before and after KD, owing to its deeper architecture and skip connections, which improve feature extraction and mitigate gradient issues, making it more effective for complex classification tasks.
Figure 2b shows mAP results for object detection, with student models performing slightly better on PASCAL VOC than COCO, likely due to VOC’s simpler scenes and categories. Across both datasets, EfficientNet-Lite surpasses WRN-16-1, benefiting from compound scaling that optimizes depth, width, and resolution for nuanced feature extraction.
In Figure 2c, KD leads to improved IoU scores in image segmentation, particularly for EfficientNet-derived students, which maintain high-resolution features vital for accurate segmentation. ResNet-based students follow, aided by depth and residual connections, while WRN-16-1 and especially AlexNet lag behind, limited by their shallower architectures.
While these improvements across accuracy, mAP, and IoU confirm KD’s utility, traditional metrics capture only surface-level performance. They miss how well the student internalizes the teacher’s knowledge—especially in complex or relational tasks. This limitation motivates the need for KRS, which assesses both feature alignment and output agreement, offering a more complete picture of knowledge transfer quality.

4.1.2. Student Model Performance Using KRS Before and After KD

After evaluating KD performance using standard metrics, we next examine the baseline KRS between teacher and student models before distillation. As defined in Equation (8), KRS combines Feature Similarity Score (FSS) and Average Output Agreement (AOA), weighted by α and β. For image classification tasks, we set α = 0.3 and β = 0.7 to emphasize logit-based outputs. For object detection and segmentation, α = 0.7 and β = 0.3 prioritize feature alignment, which is critical for spatial reasoning.
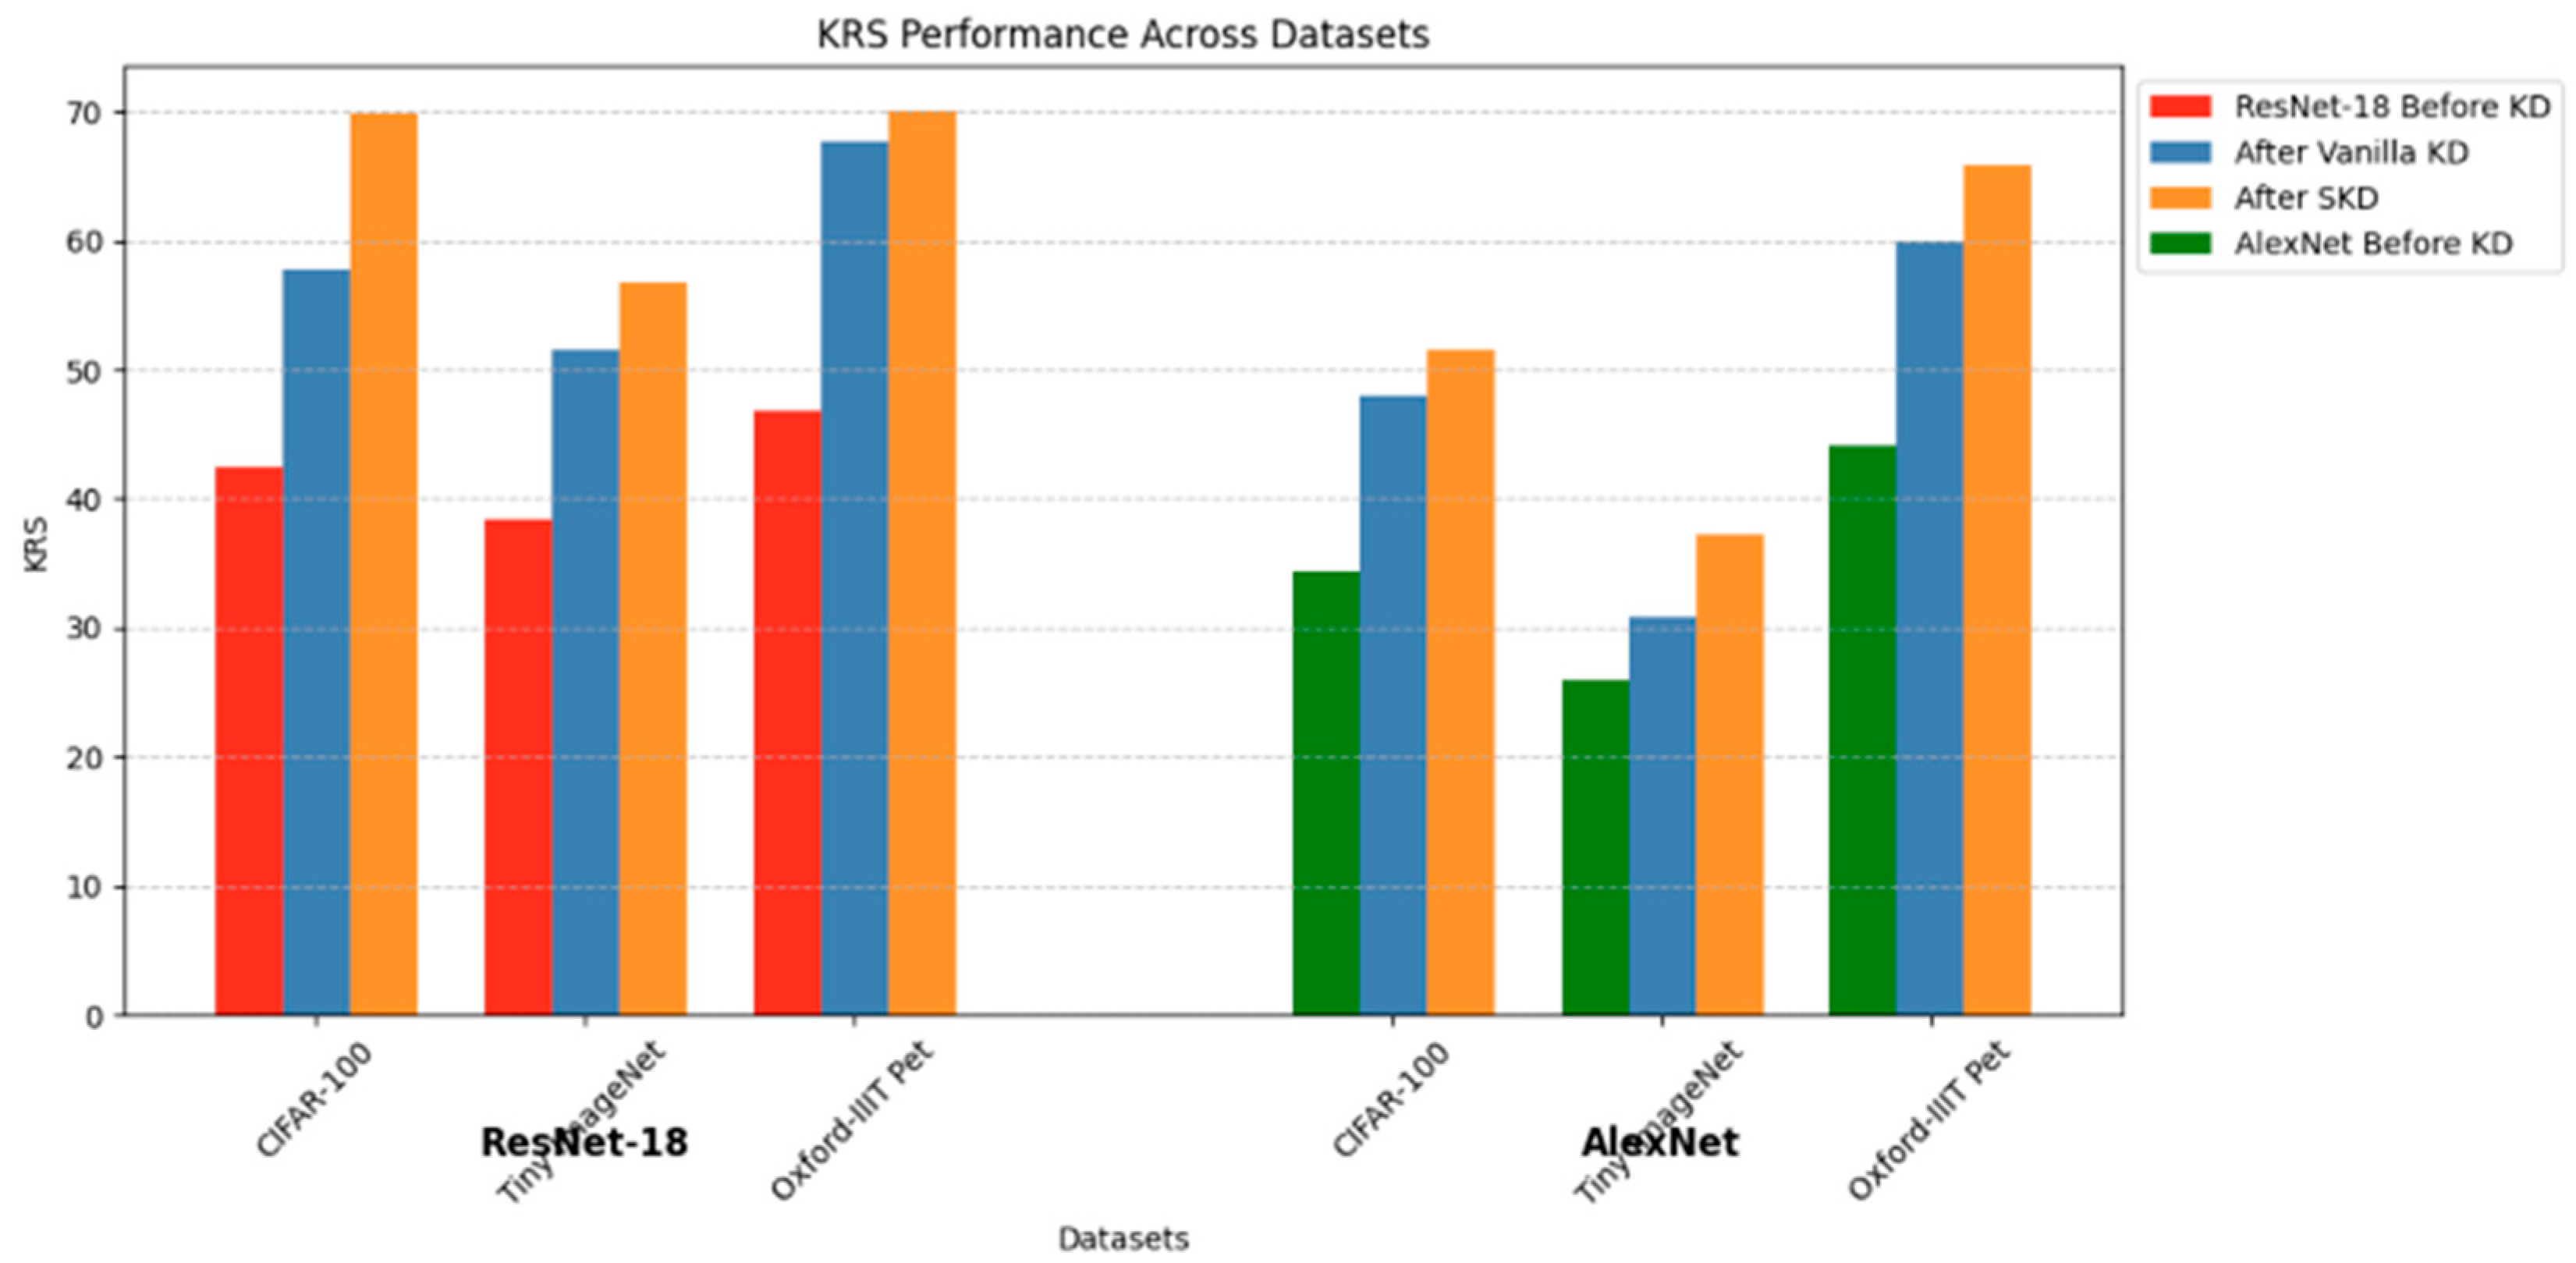
Figure 3 presents results for image classification task. Across all datasets, KD consistently improves KRS for both ResNet-18 and AlexNet, though the magnitude varies by KD method, architecture, and dataset complexity. ResNet-18 shows higher baseline KRS and greater improvements, e.g., on CIFAR-100, its KRS increases from 42.5 (pre-KD) to 57.7 (Vanilla KD) and 69.8 (SKD)—a 27.3-point gain. By contrast, AlexNet rises from 34.4 to 48.0 (Vanilla KD) and 51.5 (SKD), gaining 17.1 points. This pattern holds for Tiny ImageNet and Oxford-IIIT Pet, highlighting ResNet-18’s superior retention capability.
SKD consistently outperforms Vanilla KD, thanks to its student-friendly strategy that tailors teacher outputs to the student’s capacity. On Tiny ImageNet, AlexNet gains 6.5 points with SKD vs. 4.8 with Vanilla KD; ResNet-18 improves by 18.4 vs. 13.2 points, respectively. This shows SKD’s effectiveness, particularly for simpler models like AlexNet.
These results underscore the role of architecture in knowledge retention. ResNet-18’s residual connections support better optimization and representation learning, enabling it to absorb complex knowledge more effectively. In contrast, AlexNet’s shallow design limits its retention capacity, as reflected in its consistently lower KRS gains.
The data reveals that simpler datasets like Oxford-IIIT Pet tend to yield higher KRS gains, especially for smaller models. For example, AlexNet improves by 21.8 points on Oxford-IIIT Pet using SKD, compared to 13.2 on CIFAR-100 and 11.3 on Tiny ImageNet. A notable exception occurs with ResNet-18 on CIFAR-100, where the KRS gain (27.3 points) exceeds the 23.2-point gain on Oxford-IIIT Pet. This can be attributed to CIFAR-100’s greater feature complexity, which provides richer knowledge for SKD to transfer. ResNet-18’s residual connections help it exploit this complexity more effectively. In contrast, simpler datasets offer less room for improvement once baseline performance is high.
Thus, while simpler datasets generally yield better gains, complex datasets can amplify SKD’s benefits when paired with deeper student architectures.
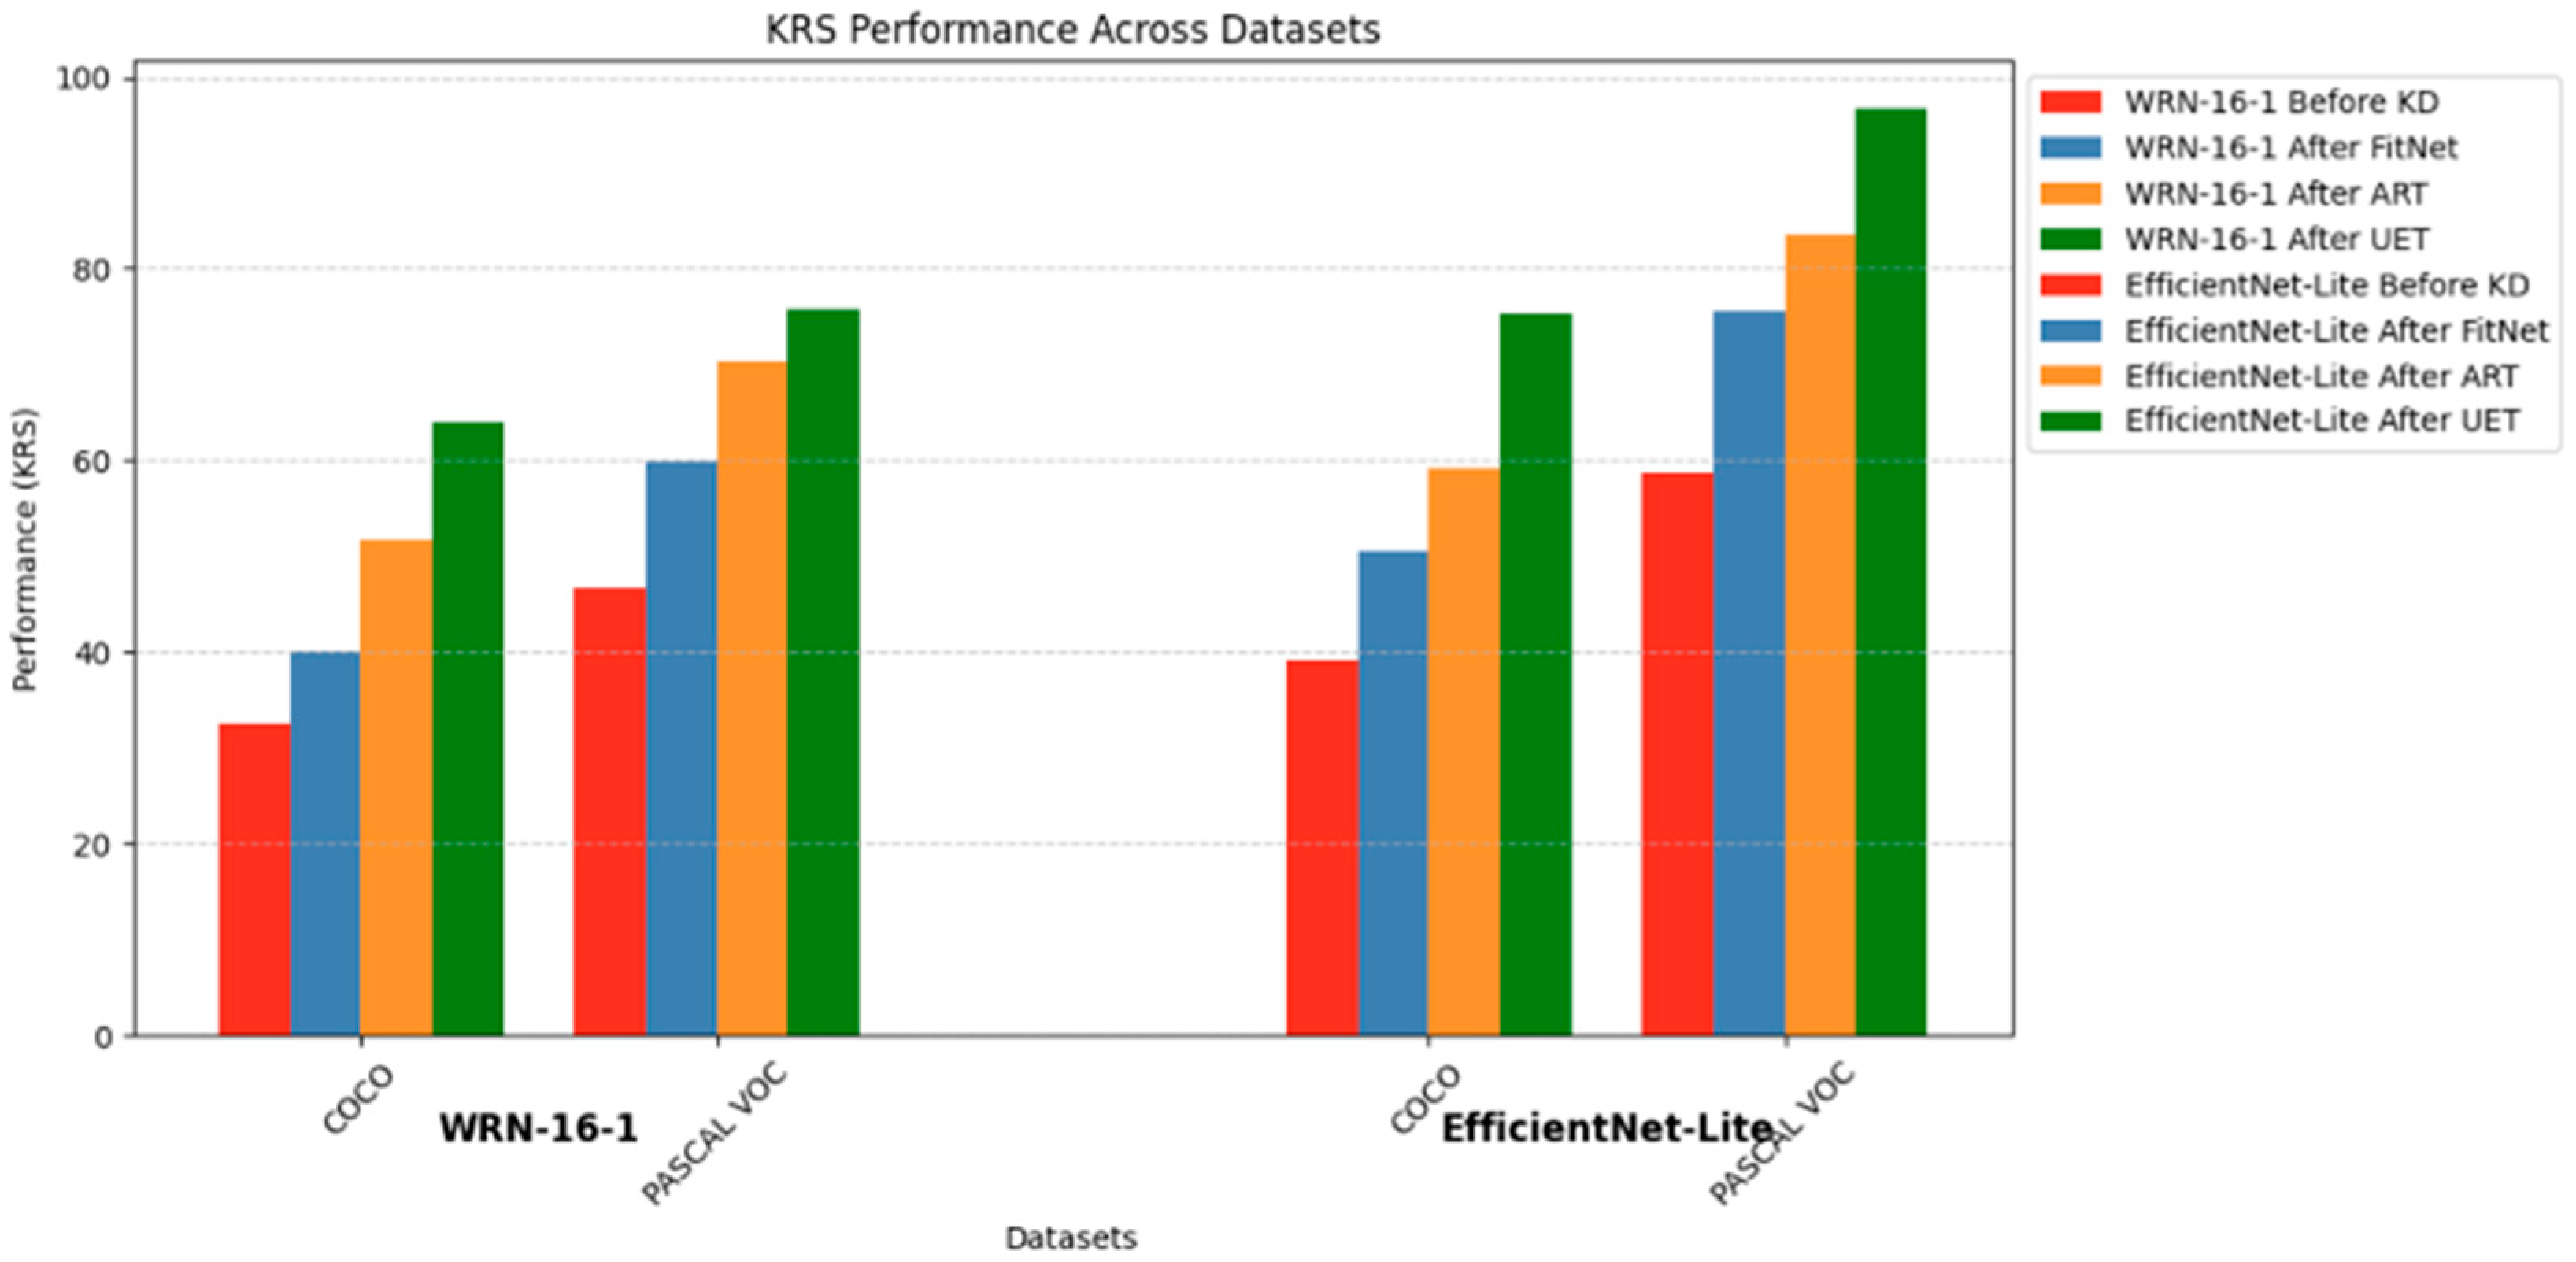
We next examine experiments for object detection. As shown in Figure 4, UET consistently delivers the highest KRS improvements, followed by ART and FitNet. For example, on COCO (Experiment 15), UET improves KRS by 31.3 points, compared to 19 for ART. On PASCAL VOC (Experiment 21), UET again leads with a 29.2-point gain.
This pattern holds across architectures. In one experiment, UET boosts EfficientNet-Lite’s KRS by 38.1 points, outperforming ART (24.9) and FitNet (16.8), demonstrating UET’s robustness in integrating uncertainty estimation for improved feature and output alignment.
Dataset complexity also plays a role. PASCAL VOC, being simpler, yields higher KRS gains than the more complex COCO. While COCO offers richer features, its diversity can challenge student models’ ability to fully absorb the teacher’s knowledge. In contrast, VOC’s simplicity enables more effective alignment and transfer.
Across all setups, FitNet shows steady but modest gains—e.g., only 13.2 points in Experiment 19—highlighting its limited capacity to exploit complex knowledge, especially compared to more advanced methods like UET.
Overall, these findings affirm the superiority of UET and illustrate how KD effectiveness depends on both the distillation method and dataset complexity, underscoring the need for task-appropriate strategies.
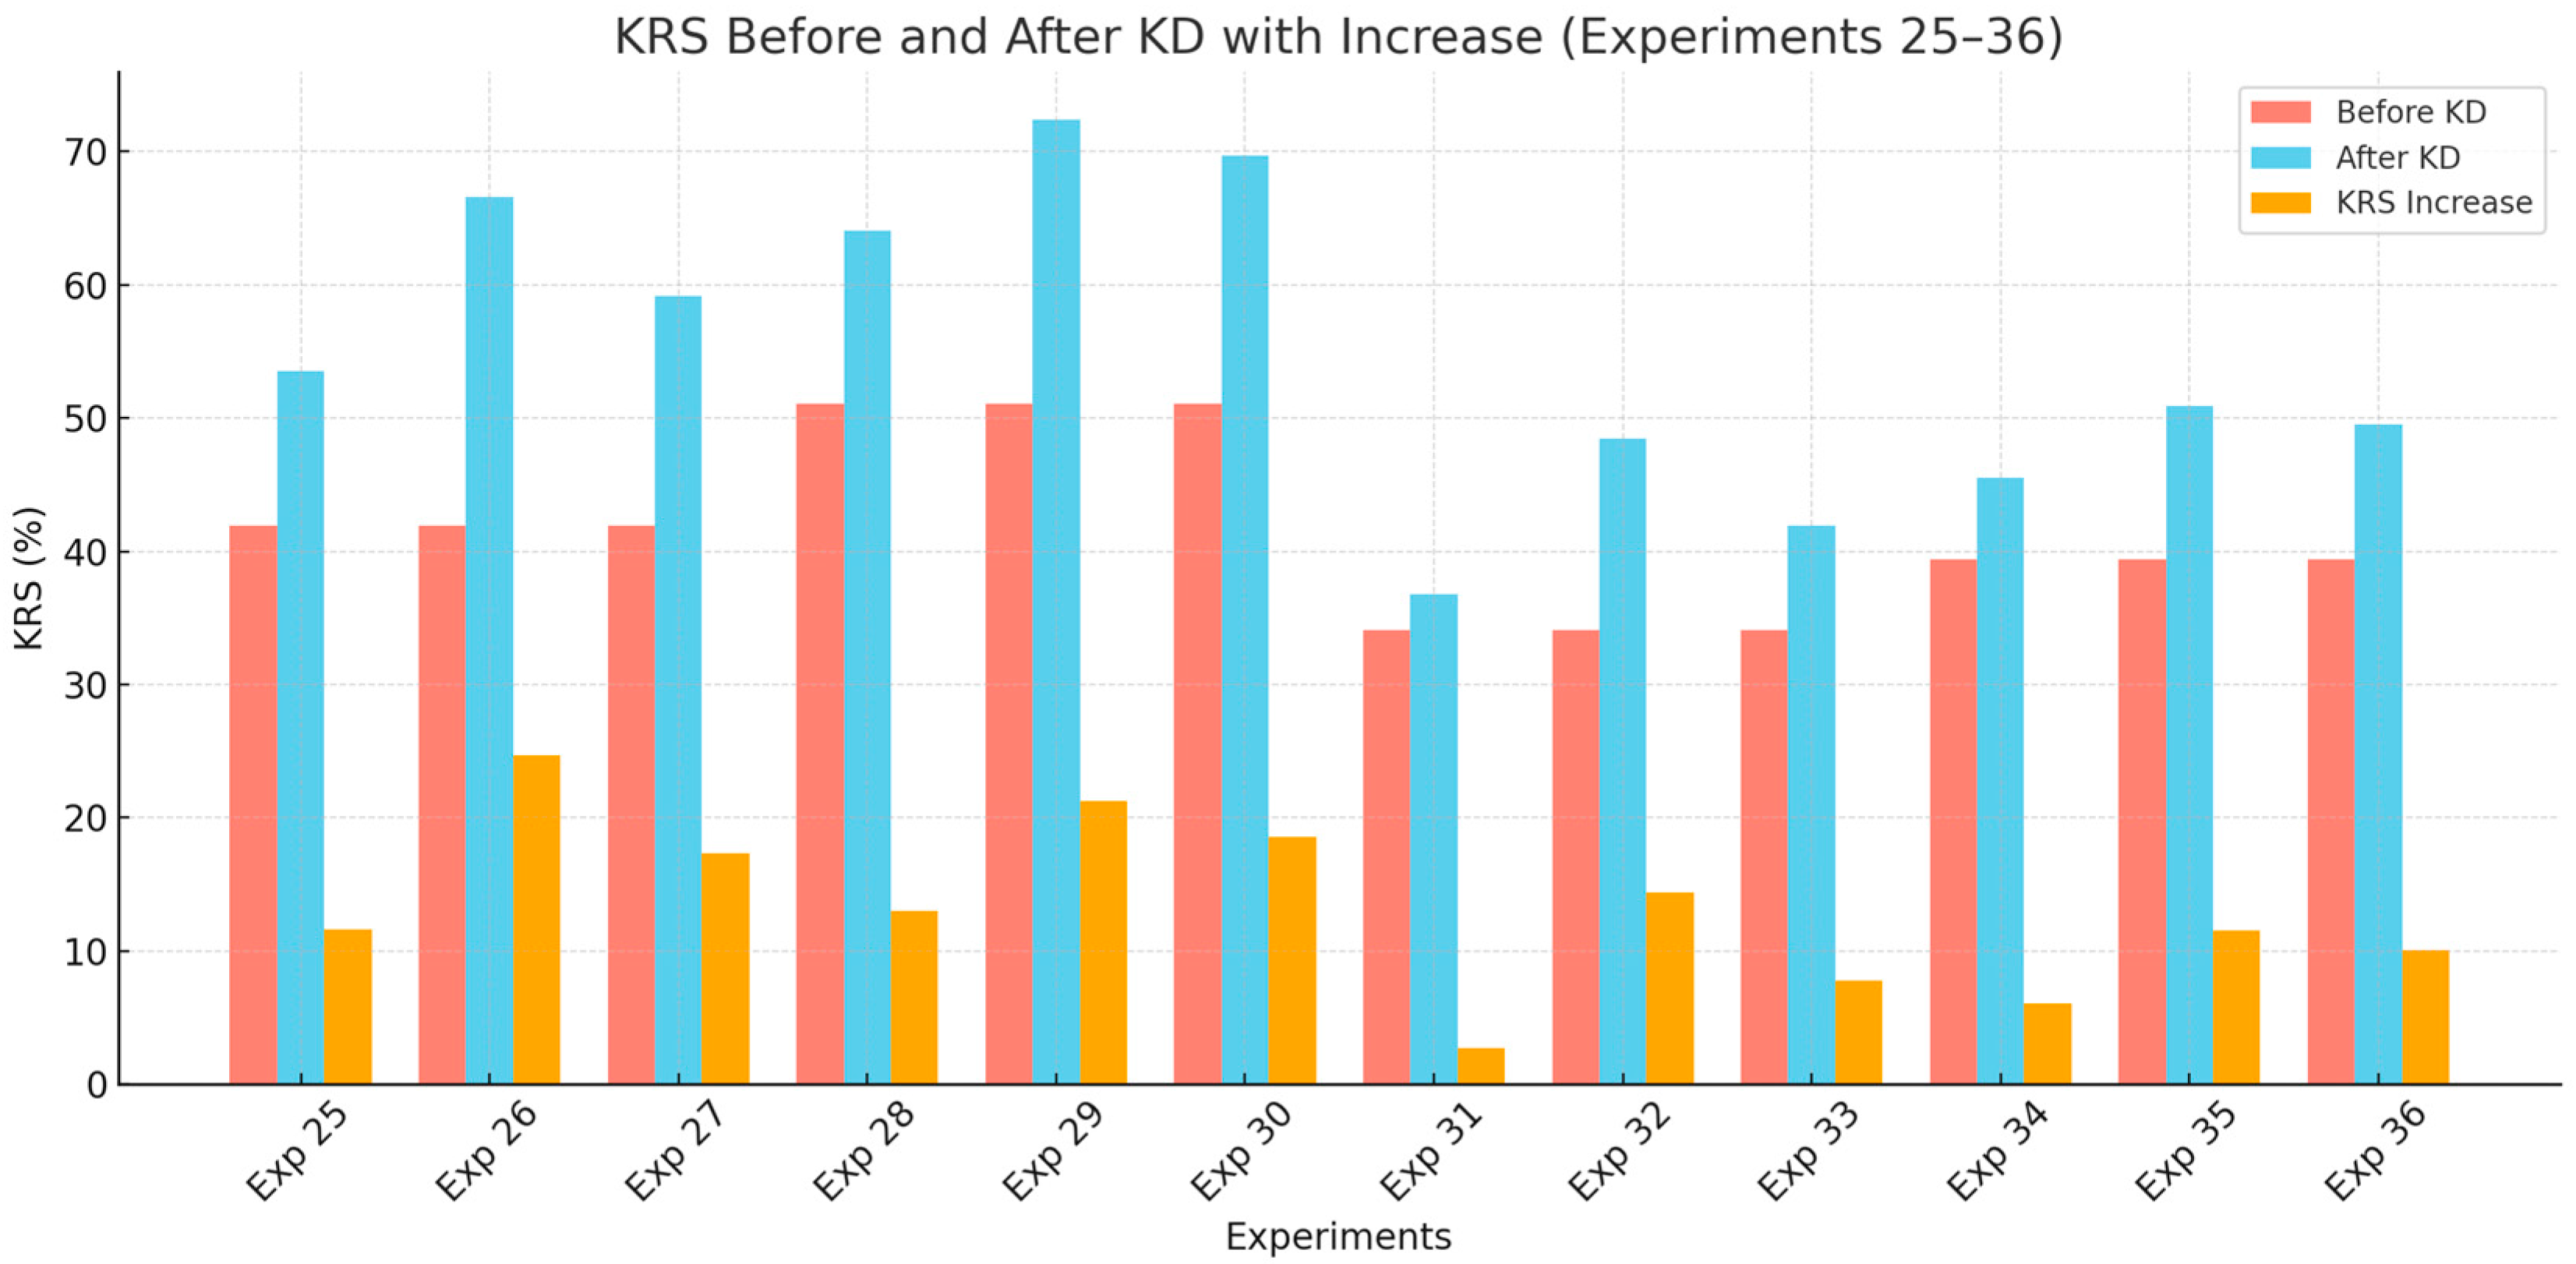
Finally, we analyze experiments focused on image segmentation. Across all setups, KRS significantly improves after applying KD, with GLD consistently achieving the highest gains, followed by CRCD and then GKD (Figure 5).
For example, in the ResNet-101/ResNet-18 pair, GLD improves KRS by 24.7 points, outperforming CRCD (17.3) and GKD (11.6). The same trend appears in the EfficientNet-B7/EfficientNet-Lite pair, where GLD achieves a 21.3-point gain, exceeding CRCD (18.6) and GKD (13.0). GLD’s edge is likely due to its stronger ability to model both global and local relationships.
In the VGG-19/AlexNet pair, all gains are smaller due to AlexNet’s limited capacity. GLD still leads (14.4 points), but CRCD (7.8) and GKD (2.7) show more modest improvements. A similar pattern is observed in the WRN-40-2/WRN-16-1 pair, with GLD (11.5) ahead of CRCD (10.1) and GKD (6.1).
Overall, GLD emerges as the most effective segmentation KD method, while CRCD is a strong alternative for deeper networks. GKD, though simpler, offers consistent—albeit smaller—gains.
These differences reinforce the importance of choosing the right KD method and aligning it with the model’s capacity and task type. The design of KRS reflects this need: by tuning α and β, it shifts emphasis between output agreement and feature similarity. This task-aware flexibility allows KRS to effectively evaluate knowledge transfer across diverse KD scenarios—without structural modification—supporting its potential as a broadly applicable evaluation metric.

4.2. Validation of the KRS Metric

This section presents the results of multiple validation strategies conducted to assess the effectiveness and reliability of the proposed KRS metric as a performance indicator for knowledge distillation models.

4.2.1. Correlation Between KRS and Standard Performance Metrics

To validate the reliability of the proposed KRS metric, we first examined its correlation with established performance metrics across different tasks. For image classification (Experiments 1 to 12), we computed the Pearson correlation between KRS and the student model’s accuracy after knowledge distillation. The results revealed a strong positive correlation (r = 0.943, p = 0.000005), indicating that KRS is highly aligned with the conventional accuracy metric in classification tasks.
For object detection (Experiments 13 to 24), we analyzed the relationship between KRS and mAP. The computed correlation was also strong (r = 0.884, p = 0.0001), suggesting that KRS effectively reflects model performance in detection tasks.
Lastly, for image segmentation (Experiments 25 to 36), the correlation between KRS and IoU was found to be exceptionally high (r = 0.968, p = 0.00000025), demonstrating that KRS closely tracks the performance of student models in segmentation scenarios. These results collectively support the validity of KRS as a reliable metric for evaluating knowledge distillation outcomes across different task types.
While the KRS metric incorporates elements such as CKA, KL divergence, and IoU, which are also present in some knowledge distillation (KD) loss functions, it is crucial to emphasize that KRS is exclusively used as a post hoc evaluation tool, not during training. This ensures that all KD models, regardless of their internal training loss components, are assessed using the same standardized criteria. The consistent improvements in KRS for models like SKD that do not explicitly use CKA or IoU—demonstrate that high KRS values are not exclusive to methods that share its components. Thus, KRS does not reward methods simply for overlapping mechanisms; instead, it objectively measures how well the student retains and reflects the teacher’s knowledge, ensuring a fair evaluation across diverse KD tasks and approaches.

4.2.2. Ablation Study: Decomposing KRS Before and After KD

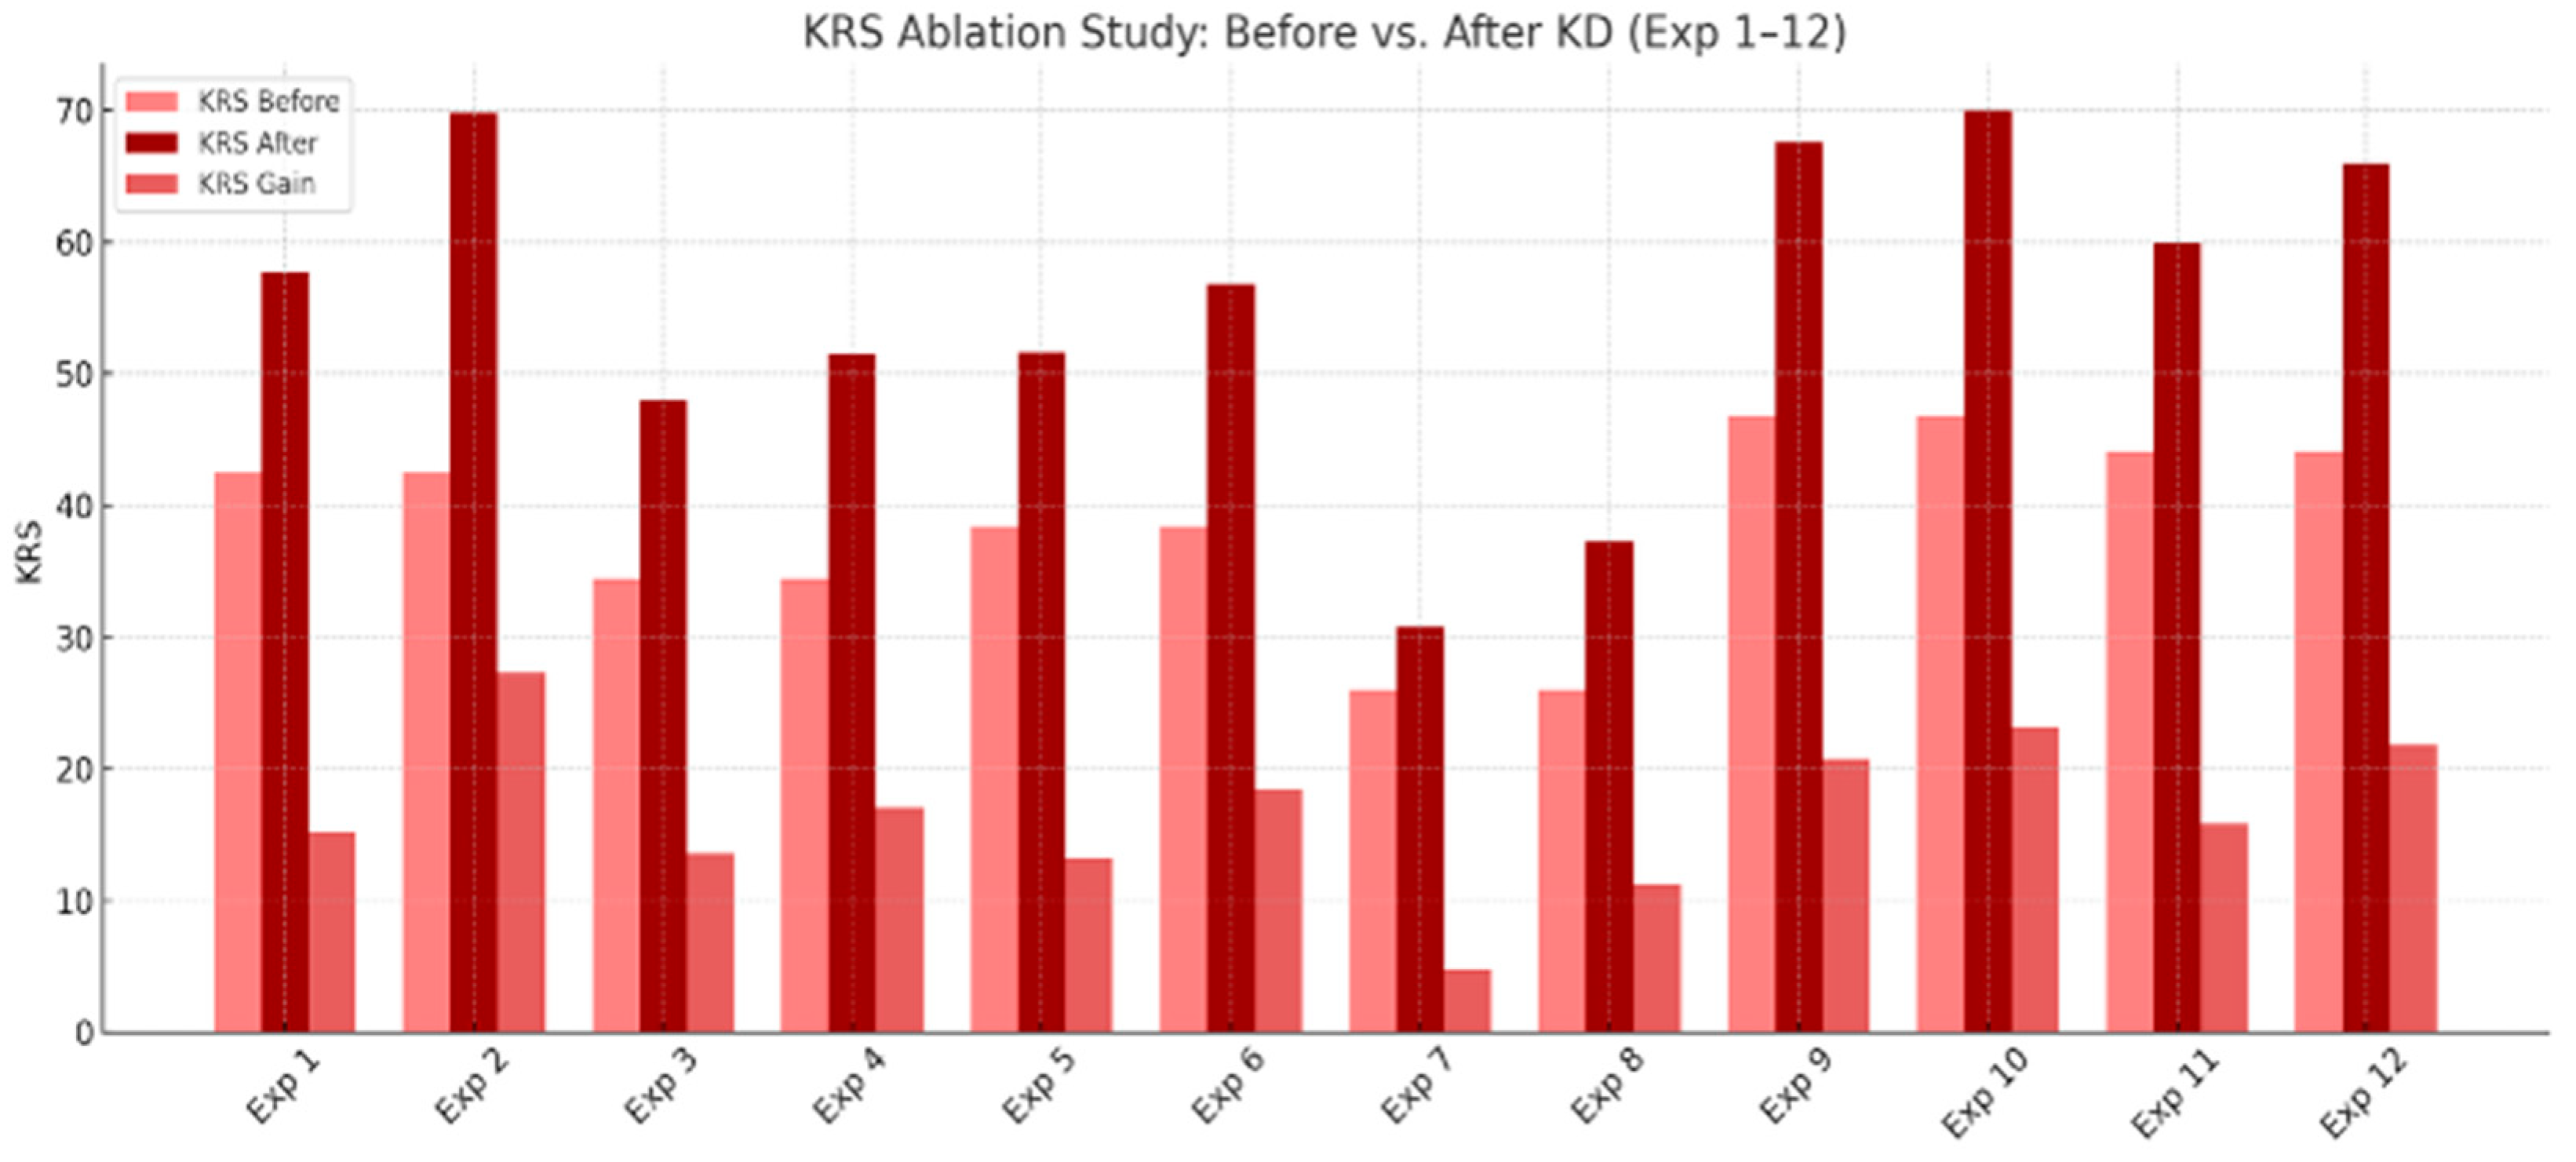
To assess how KRS reflects knowledge transfer, we conducted an ablation analysis using its two components—Feature Similarity Score (FSS) and Average Output Agreement (AOAg)—before and after KD. In image classification, both FSS and AOAg improved after KD, especially with SKD, which consistently outperformed Vanilla KD. For example, ResNet-18 on CIFAR-100 showed FSS rising from 32 to 39 and AOAg from 47 to 83 under SKD, resulting in a substantial KRS gain. Deeper models like ResNet-18 saw larger improvements than shallower ones like AlexNet, reinforcing the role of student capacity. These results validate KRS as a meaningful composite metric, sensitive to both technique and architecture. Results are shown in Figure 5.
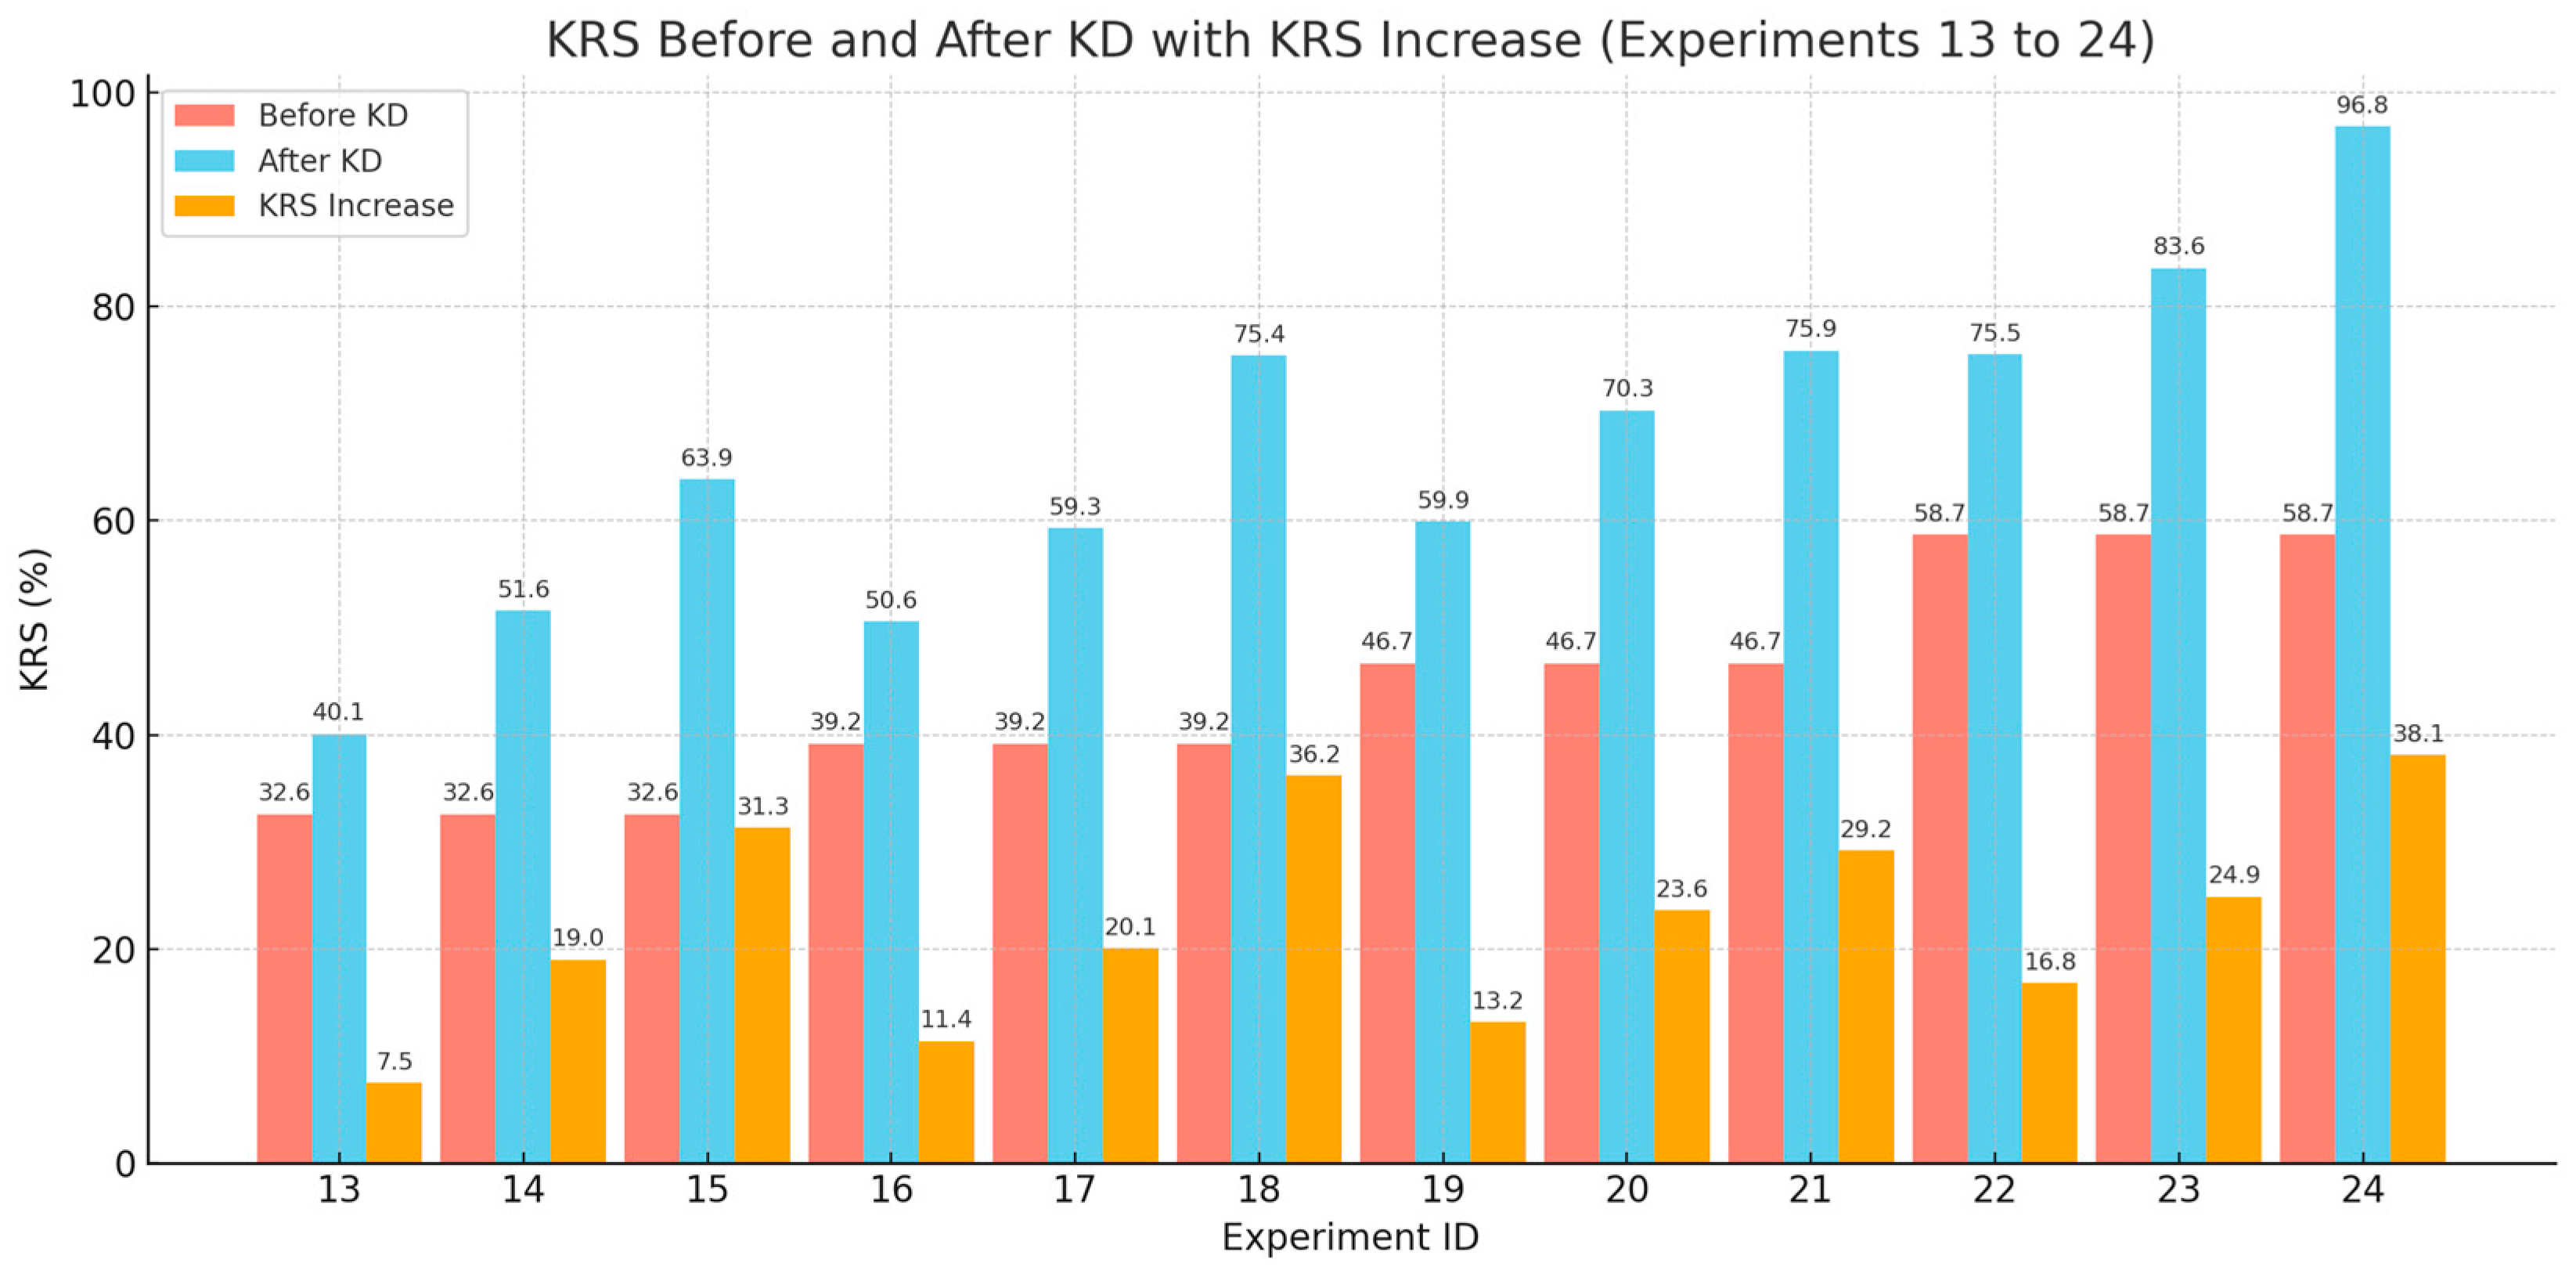
In object detection, KRS also increased across all KD methods. UET consistently yielded the highest gains compared to ART and FitNet, regardless of dataset. For instance, WRN-16-1 distilled via UET on COCO showed stronger improvement than on PASCAL VOC with FitNet—demonstrating that KRS captures nuanced variations based on KD method and dataset complexity.
Notably, KRS gains were larger in setups involving compact student models or challenging datasets, highlighting KD’s greater impact where capacity is constrained or tasks are complex. Overall, KRS successfully tracked improvements in feature alignment and output behavior, validating its robustness and interpretability for evaluating KD effectiveness in object detection (Figure 6).
In image segmentation, KRS again increased consistently post-KD, as can be seen in Figure 7. GLD produced the highest gains, excelling in holistic output transfer. CRCD performed well in deeper models due to its dense relational modeling, while GKD lagged, especially with limited capacity students like AlexNet. These patterns confirm that KRS is sensitive to both KD method and student architecture, reinforcing its utility in dense prediction tasks.

4.2.3. Sensitivity to KD Quality

To further evaluate the reliability of KRS, we examined its sensitivity to the quality of KD methods applied across different tasks. In this context, KD quality refers to the extent to which each method improves the performance and knowledge retention of the student model. A reliable metric should consistently reflect higher gains when stronger KD strategies are employed.
We first rank the performance of the KD methods used in this study depending on the average improvement of the student in terms of the conventional metrics used. Then, we also rank each KD method based on the average increase in the KRS. Finally, we compare the two rankings as shown in Table 5.
The table offers a dual perspective on how different KD strategies perform in enhancing both traditional task-based metrics and the proposed KRS, which captures retained knowledge more holistically. Across both rankings, Vanilla KD consistently appears as the least effective method, suggesting that while it offers basic improvements, it lacks the sophistication of more modern techniques in transferring knowledge. FitNet follows closely, indicating only moderate gains in both traditional metrics and knowledge retention. In contrast, UET emerges as the top-performing method in both categories. Its superior placement suggests that UET not only maximizes conventional performance outcomes but also enables the student model to internalize a substantial amount of the teacher’s knowledge, as reflected in the high KRS gains. Similarly, GLD and ART show consistently strong performance, placing them among the top-tier KD techniques across both evaluation dimensions.
To confirm this observation quantitatively, we computed a Kendall’s τ correlation coefficient between the two rankings. The result is τ = 1.0, indicating perfect concordance between the ordering of KD methods by conventional performance gains and their ordering by KRS gains. This statistical confirmation reinforces the validity of KRS as a reliable metric for assessing KD quality.
Importantly, this convergence does not imply redundancy. While KRS rankings align with conventional evaluations (ensuring validity), KRS additionally integrates internal feature similarity with external output agreement, providing a richer and more interpretable view of knowledge retention. This dual perspective addresses transparency concerns by ensuring that improvements in representational and predictive alignment are both captured. Thus, KRS functions as a complementary measure: consistent with traditional task outcomes while simultaneously offering insight into the underlying knowledge transfer process.

4.2.4. Trade-Off (Imbalance) Analysis

While the previous section established that KRS rankings are consistent with conventional performance-based rankings, it is also important to examine whether KRS provides additional interpretive value in situations where improvements in feature similarity (FSS) and output agreement (AOAg) are imbalanced. Across all experiments, both FSS and AOAg improved after KD, with no true conflict cases (i.e., one increasing while the other decreased). However, the degree of improvement often differed substantially, creating scenarios where relying on a single component could overemphasize one aspect of knowledge retention at the expense of the other.
Table 6 illustrates representative examples of such imbalance. In classification tasks (e.g., CIFAR-100 SKD, Exp. 2; Oxford-IIIT Pet SKD, Exp. 12), AOAg exhibited much larger gains than FSS. Because classification places higher emphasis on predictive alignment, KRS—using the task-aware weight setting of (α, β) = (0.3, 0.7)—tracked these AOAg-dominant improvements, yielding composite gains of +27.3 and +21.8, respectively. By contrast, in detection and segmentation tasks (e.g., COCO ART, Exp. 14; Oxford-IIIT Pet GLD, Exp. 26), FSS improved much more strongly than AOAg. With weights (0.7, 0.3), KRS reflected these FSS-dominant trends, yielding composite gains of +19.0 and +24.7, respectively. In some cases, such as COCO UET (Exp. 18), FSS exhibited extremely large improvements (+44 vs. +18 for AOAg), and KRS accordingly produced a strong but moderated gain of +36.2. Finally, in cases where both components improved modestly and more evenly (e.g., COCO FitNet, Exp. 13), KRS reflected the balanced contribution (+7.5).
This analysis shows that KRS behaves in a predictable and interpretable way, moderating imbalances between FSS and AOAg according to the task-aware weights. The predicted and observed ΔKRS values match exactly because of the linear sensitivity property, reinforcing the transparency of the formulation. More importantly, this moderation ensures that KRS provides a stable, single indicator that avoids misleading interpretations when improvements are disproportionately concentrated in one component. Thus, KRS complements the separate reporting of FSS and AOAg by integrating them into an interpretable composite score, directly addressing concerns regarding the added value of KRS beyond its components.

4.2.5. Architectural Generalization

Architectural generalization assesses how consistently a KD method performs across varying teacher–student network combinations. In the context of this study, it also serves as a validation mechanism for the KRS—determining whether KRS remains a reliable metric when applied to diverse model architectures.
Our findings reveal that high-performing KD methods such as UET, GLD, and ART yield substantial improvements in KRS across a wide range of architectural pairings. These include deep-to-shallow (e.g., ResNet-101 to ResNet-18), resource-constrained (e.g., EfficientNet-B9 to EfficientNet-Lite), and structurally different networks (e.g., VGG-19 to AlexNet). The consistency in KRS improvements across these combinations confirms its adaptability and reliability, regardless of the architectural design.
Furthermore, methods like Vanilla KD and FitNet, which are more sensitive to teacher–student alignment, demonstrated lower KRS gains especially in less compatible pairs—reinforcing that KRS can also capture limitations in knowledge transfer. This sensitivity strengthens the argument that KRS effectively reflects the internal learning dynamics of the student model beyond surface-level metrics like accuracy or mAP.
In summary, the alignment between KRS trends and architectural variations supports KRS not only as a reliable performance indicator but also as a metric with demonstrated applicability across heterogeneous model configurations. It provides nuanced insight into the effectiveness of KD methods in real-world applications where model structures are rarely standardized.

4.2.6. Sensitivity Analysis of KRS to α and β

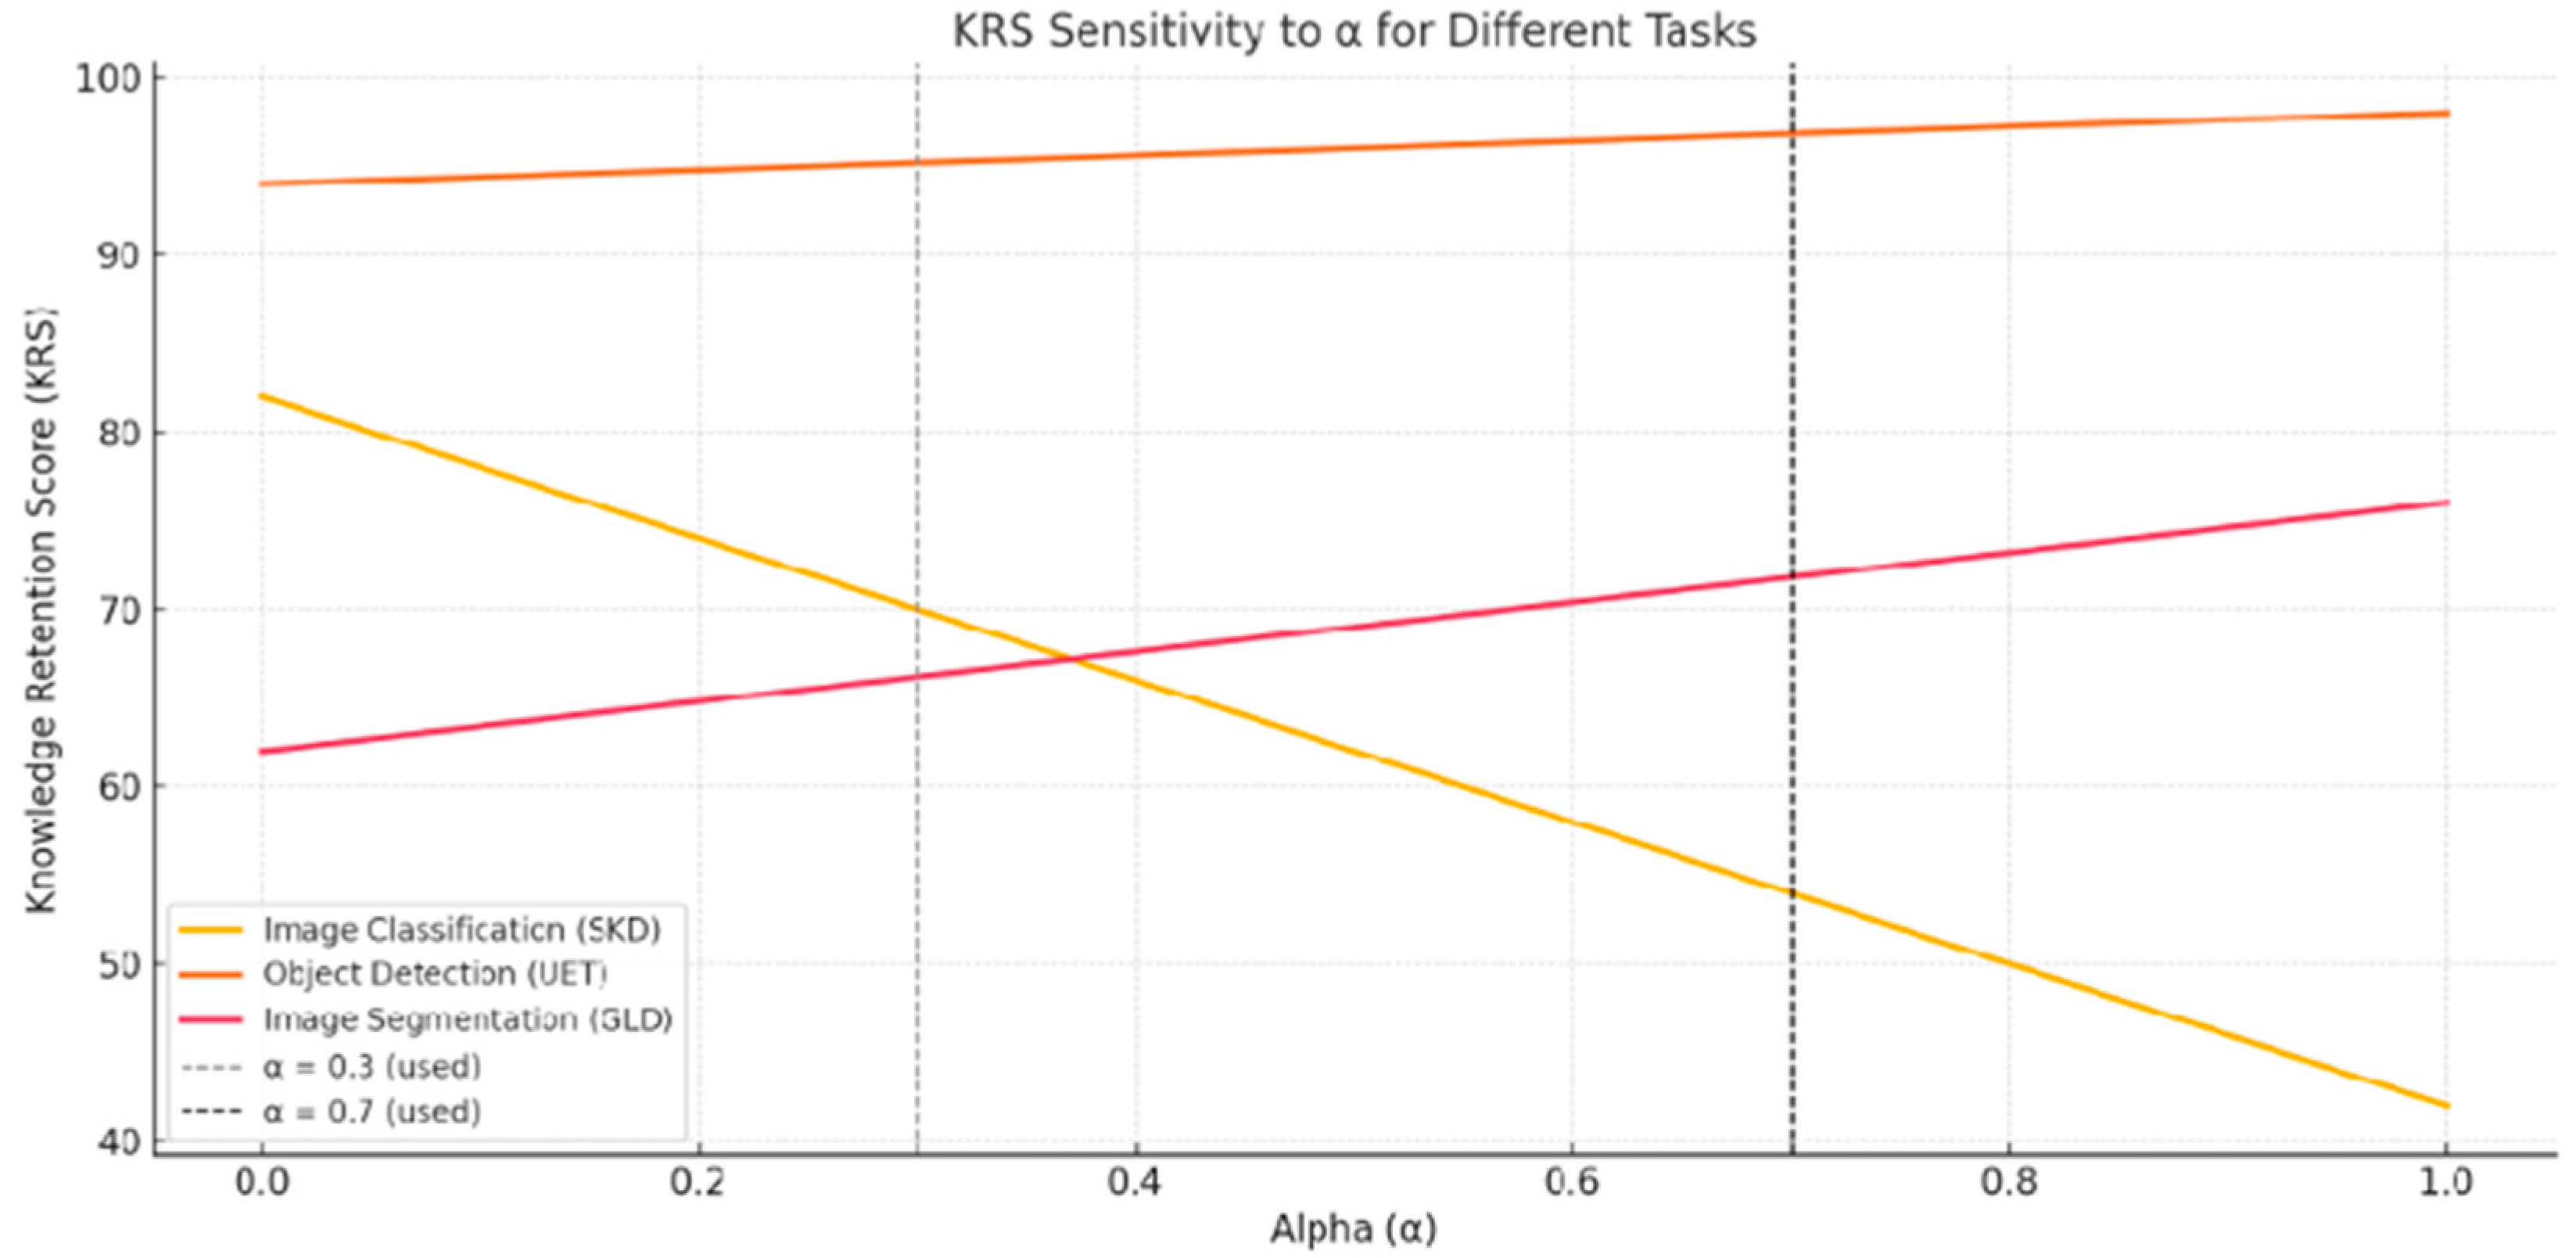
To assess the impact of the weighting parameters α and β on the KRS, we conducted a sensitivity analysis by systematically varying α from 0 to 1 (with β = 1 − α) in increments of 0.01. The results for three representative tasks—image classification (Oxford-IIIT, ResNet101/18 using SKD), object detection (PASCAL VOC, EfficientNetB7/Lite using UET), and image segmentation (Oxford-IIIT, EfficientNetB7/Lite using GLD)—are illustrated in Figure 8.
These specific teacher–student experiment pairs were selected because they yielded the highest performance in conventional task metrics (e.g., accuracy, mAP, mIoU) after knowledge distillation. Using top-performing pairs ensures that the observed trends in KRS reflect successful knowledge transfer scenarios and are not confounded by poorly trained student models.
The graph reveals distinct trends. For image classification, the KRS values are highest when α is near zero, indicating that the output agreement component contributes most significantly to knowledge retention in classification tasks. In contrast, both object detection and image segmentation show increasing KRS values as α increases, with peak scores occurring at α = 1. This suggests that feature similarity plays a more substantial role in measuring knowledge transfer for spatially complex tasks such as detection and segmentation.
The vertical dashed lines at α = 0.3 and α = 0.7 in the figure mark the specific weightings used in our main experiments. These values were selected based on a balance between task characteristics and interpretability: α = 0.3 emphasizes output alignment for classification tasks, while α = 0.7 emphasizes feature similarity for detection and segmentation tasks. Although these settings do not always correspond to the global maxima of KRS for each task, they demonstrate stable and reasonably high scores, supporting the robustness of our design.
This sensitivity analysis validates the rationale for adopting a composite metric. While individual components such as feature similarity or output agreement may dominate in specific task types, KRS offers a tunable and unified framework that maintains consistency across diverse applications. The ability to flexibly assign weights to each component ensures that KRS remains a reliable and interpretable measure of knowledge retention regardless of the underlying task.

4.2.7. Generalization to Transformer Architectures

To evaluate the generalizability of the KRS across architectural paradigms, we conducted an experiment using a transformer-based teacher–student pair: ViT-B/16 and DeiT-S on the CIFAR-100 classification task. As shown in Table 7, the DeiT-S student achieved a KRS of 45.9 before knowledge distillation, which improved to 62.3 after applying Vanilla KD. This 16.4-point increase was driven by a substantial rise in AOAg, from 54% to 74%, and a moderate gain in FSS, from 27% to 35%. These improvements suggest that KRS remains sensitive and interpretable even in transformer-based architectures, where internal representation alignment and output mimicry differ fundamentally from those in CNNs. Interestingly, the same teacher–student pair exhibited minimal gain under SKD, with KRS improving only from 45.9 to 48.3. This modest gain can be explained by the SKD design, which discards soft labels and focuses instead on intra-class compactness and inter-class separation. However, transformers like DeiT-S, which rely heavily on attention-based mechanisms rather than hierarchical spatial encoding, benefit significantly from soft-target supervision to refine their decision boundaries. Without access to the teacher’s softened logits, SKD fails to guide the student toward smoother class probability distributions—resulting in limited improvements in AOAg and KRS. Moreover, SKD’s feature supervision may not align well with transformer attention maps, which differ structurally from convolutional feature hierarchies, further limiting gains in FSS. These results affirm that KRS effectively generalizes across architectures and reflects model-specific dynamics. While CNN-based students like ResNet-18 benefit more from feature-level alignment under SKD, transformer-based students like DeiT-S achieve greater retention when soft target guidance is preserved, as in Vanilla KD. This finding reinforces KRS as a reliable metric for evaluating knowledge retention regardless of architectural class, provided that the KD method is compatible with the inductive biases of the model.

4.2.8. Comparative Evaluation of KRS Against Baseline Retention Metric

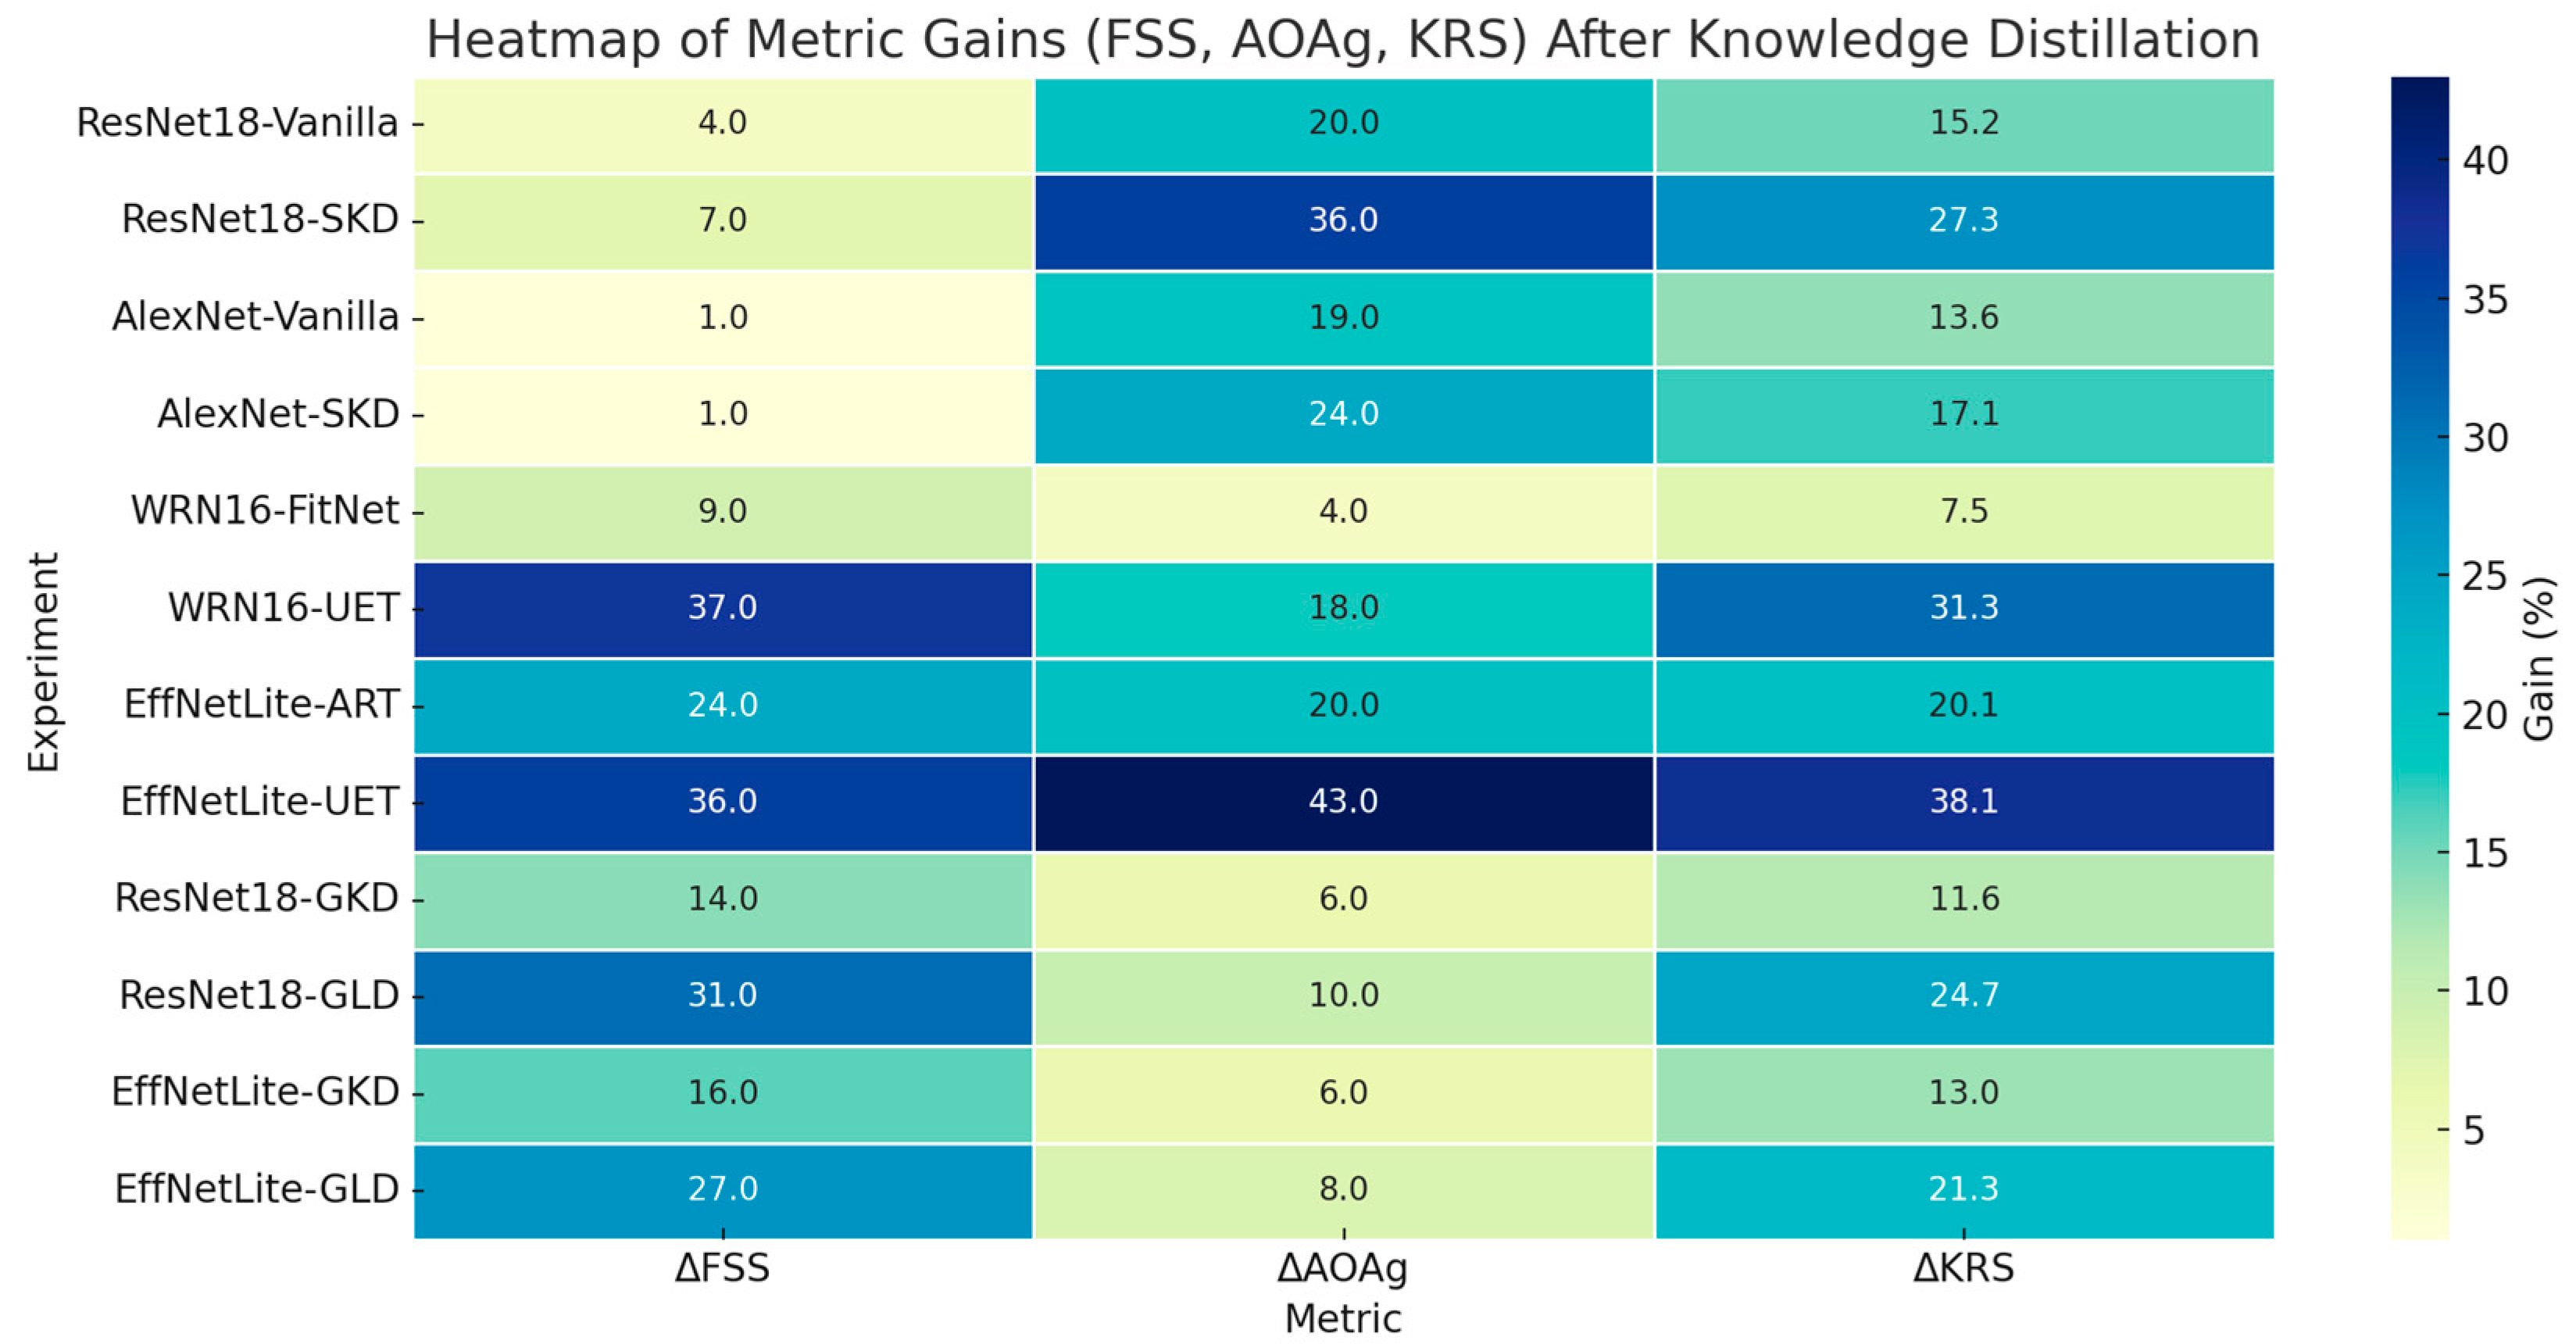
To evaluate the effectiveness of the proposed KRS, we compared it against its constituent components—FSS and AOAg—across 36 KD experiments involving diverse tasks, teacher–student architectures, and distillation strategies. Although KRS is computed from FSS and AOAg, this comparison is essential to determine whether the composite formulation offers practical advantages in interpretability, generalizability, and correlation with actual student improvement. As visualized in the heatmap (Figure 9), KRS captures retention behavior in a manner that balances the strengths and biases of FSS and AOAg. For example, in ResNet-18 trained using SKD, both FSS and AOAg exhibited substantial gains (7 and 36 points, respectively), yet KRS rose by 27.3 points—neither exaggerating the high AOAg nor neglecting the FSS. In another case, VGG-19 distilled to AlexNet under SKD showed an AOAg increase of 24 points with minimal FSS gain (1 point), but KRS moderated this with a more proportionate 17.1-point improvement. Such moderation prevents misleading interpretations that could occur when relying solely on a single retention axis. The heatmap also reveals that in many cases where only one component shows significant change, KRS reflects a tempered yet informative summary of the actual retention behavior—highlighting its robustness across architectural and task diversity. While alternative retention metrics such as Flow of Solution Procedure (FSP), Activation Flow Similarity (AFS), and Attention Similarity offer value in certain constrained contexts, their broader applicability remains limited. FSP, for instance, assumes architectural compatibility and requires matched intermediate feature maps, making it unsuitable for heterogeneous teacher–student pairs. AFS and attention-based metrics similarly rely on architectural features like explicit attention modules or transformer blocks, which are not available in many convolutional or lightweight models. These metrics are also primarily designed for image classification and lack extensibility to spatial tasks like object detection and segmentation. Moreover, publicly available implementations of these metrics are limited and often task-specific, hindering reproducibility and integration into broad KD pipelines. KRS addresses these limitations by offering an interpretable framework for quantifying knowledge retention that is applicable across multiple task types and adaptable to different model architectures. It provides a holistic measure that aligns well with actual student performance trends across KD methods, as supported by the experimental patterns in Figure 9. These findings affirm KRS as a scalable and scientifically grounded metric for evaluating the effectiveness of knowledge transfer in deep neural networks.

4.2.9. Statistical Significance Analysis

To further validate the effectiveness of the proposed KRS, a formal statistical analysis was conducted across 36 knowledge distillation experiments, spanning classification, detection, and segmentation tasks. The goal was to assess whether the observed improvements in KRS after distillation were statistically meaningful and aligned with performance gains in conventional metrics such as accuracy, mAP, and IoU.
Paired t-tests were applied to compare pre- and post-distillation KRS values within each task group. The results indicated statistically significant improvements in all three categories: classification (p = 1.03 × 10 5 ), detection (p = 3.51 × 10 5 ), and segmentation (p = 5.67 × 10 6 ), each well below the conventional alpha threshold of 0.05. These findings suggest that KD methods consistently lead to a measurable increase in knowledge retention as captured by KRS.
To quantify the variability in KRS improvements, 95% confidence intervals were computed for each task type. For classification, the average post-KRS was 54.76 (CI: [49.60, 59.92]), an increase from a pre-KRS mean of 38.28. Similarly, detection tasks showed an increase from 44.58 (CI: [37.54, 51.62]) to 66.92 (CI: [57.99, 75.84]), while segmentation increased from 42.13 (CI: [38.24, 46.03]) to 55.70 (CI: [50.06, 61.34]). These intervals reinforce the conclusion that the gains observed in KRS are not due to random variation but reflect consistent improvements attributable to distillation.
Figure 10 presents a box plot comparing the distribution of KRS values before and after distillation across the three task categories. The visual representation complements the statistical tests by highlighting the shift in median and interquartile ranges, offering an intuitive summary of KRS behavior across tasks.
Overall, these results confirm that KRS captures statistically significant improvements in knowledge retention across multiple KD strategies and task types, further validating its role as a reliable and interpretable metric in knowledge distillation evaluation.

4.2.10. Qualitative Analysis of Knowledge Retention Behavior

While earlier sections presented quantitative evaluations of KRS, a deeper understanding of knowledge retention benefits from qualitative analysis. This section offers visualizations that illustrate behavioral differences between student and teacher models before and after distillation, highlighting both representational and output-level alignment.
We focus on two representative examples using Cross-layer Centered Kernel Alignment (CKA) heatmaps and CIFAR-100 output comparisons. These are contextualized with corresponding KRS values to show how the metric captures meaningful improvements in both internal feature alignment and predictive consistency.
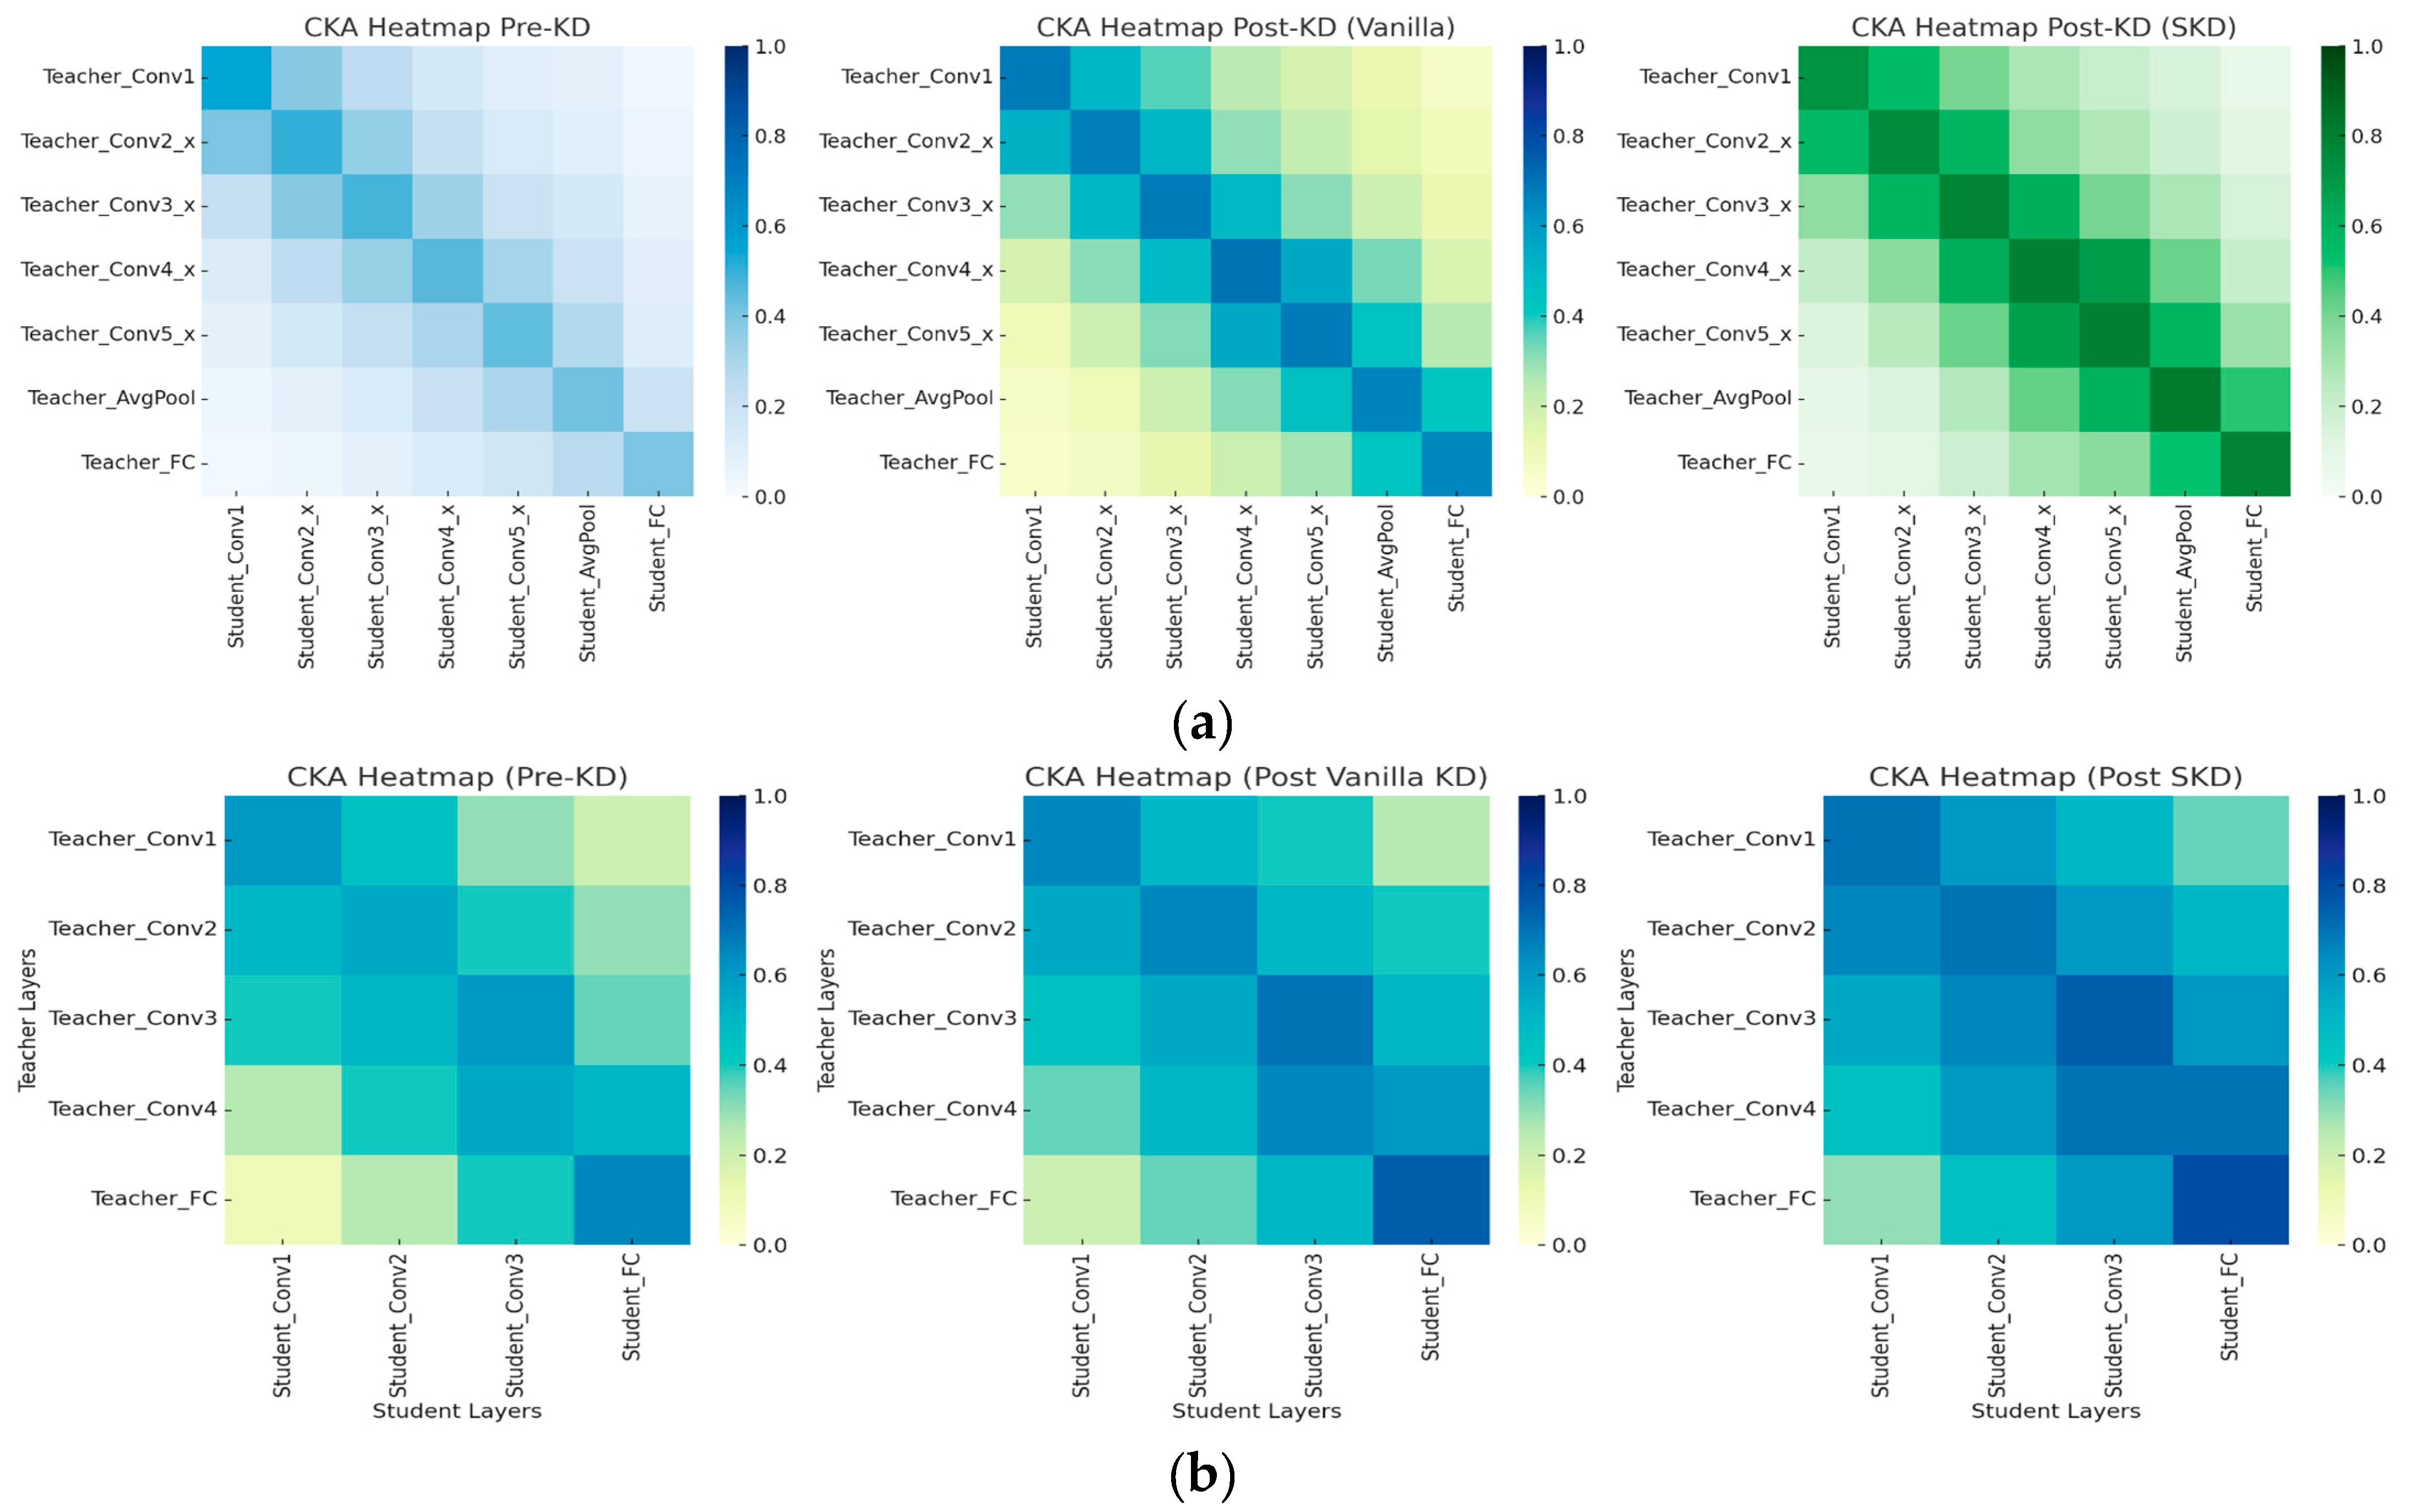
Figure 11 shows CKA heatmaps for ResNet-101 → ResNet-18 and VGG-19 → AlexNet, before KD, after Vanilla KD, and after SKD. In the ResNet pair, pre-KD similarity is low across most convolutional layers. Vanilla KD improves alignment in intermediate and deeper layers, while SKD further strengthens it—particularly in Conv4_x and Conv5_x. These trends align with KRSs rising from 42.5 (pre-KD) to 57.7 (Vanilla KD) and 69.8 (SKD).
In the VGG to AlexNet case, initial alignment is minimal. Vanilla KD modestly improves mid-level features, while SKD enhances similarity in fully connected layers. KRS follows this trend, increasing from 34.4 to 48.0 (Vanilla KD) and 51.5 (SKD).
These layer-wise visualizations confirm that KRS reflects tangible improvements in representational mimicry. Thus, KRS serves not only as a scalar score but also as an interpretable, diagnostic tool for understanding the depth and fidelity of knowledge transfer during KD.
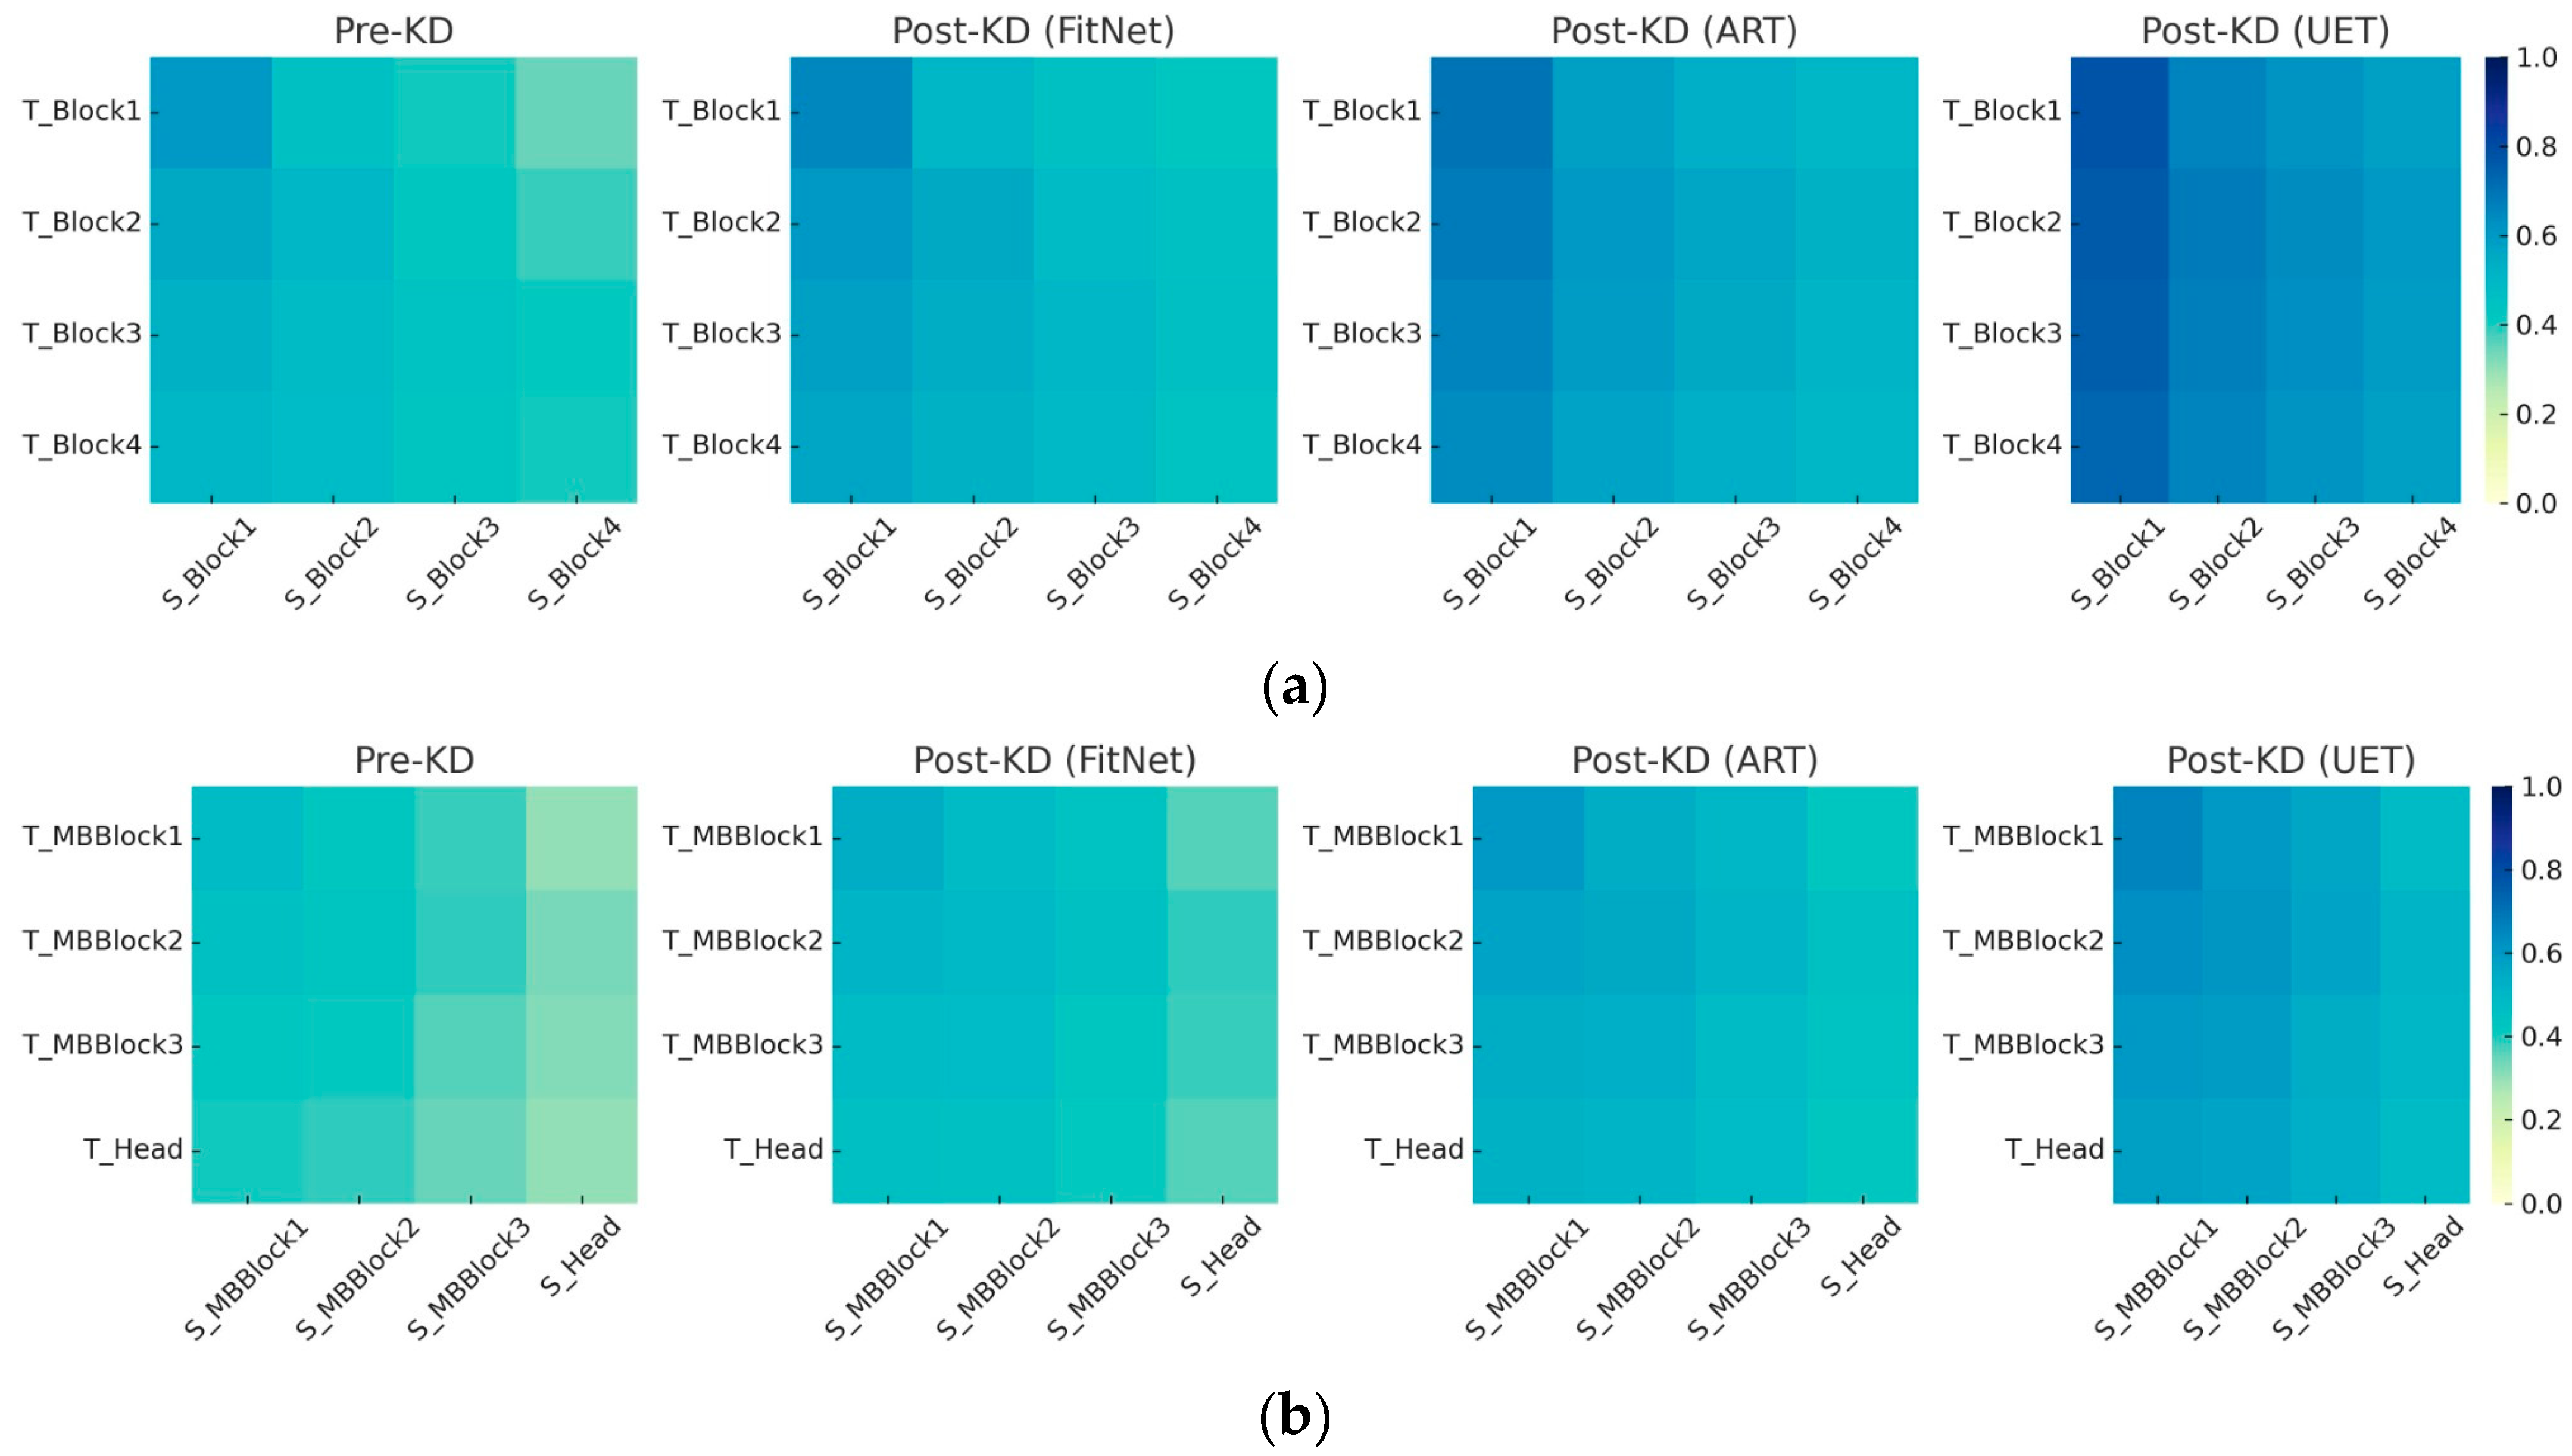
To further illustrate how KRS reflects internal knowledge retention, we present cross-layer CKA heatmaps for two object detection teacher–student pairs: WRN-40-2 → WRN 16-1 and EfficientNet-B7 → EfficientNet-Lite. These visualizations qualitatively show how different KD methods influence internal representation alignment. In the WRN pair (Figure 12a), pre-KD alignment is weak, especially in deeper residual blocks. FitNet shows modest improvement; ART strengthens alignment across all blocks; and UET achieves the most consistent and substantial gains. These patterns align with their respective KRSs—UET > ART > FitNet—showing that KRS captures both output-level and feature-level learning. A similar pattern is seen in the EfficientNet pair (Figure 12b). Initial alignment between MBConv blocks and head layers is low to moderate. FitNet slightly improves block-level similarity, ART enhances it further, and UET again shows the most comprehensive alignment. The corresponding KRS gains mirror these visual changes, confirming that KRS tracks improvements in internal representation fidelity, not just prediction accuracy. Together, these examples show that KRS offers a more complete view of knowledge transfer than performance metrics alone. The heatmaps act as visual validation of KRS and support its role as a diagnostic tool for evaluating distillation quality across diverse architectures.
To complete the qualitative analysis across vision tasks, we examine feature alignment in semantic segmentation using the ResNet-101 → ResNet-18 pair. Figure 13 presents CKA heatmaps before and after applying GKD, GLD, and CRCD—three relation-based KD methods.
The pre-KD heatmap shows low similarity, especially in deeper layers (Conv4_x and Conv5_x), highlighting the student’s limited ability to capture the teacher’s spatial representations despite architectural similarity. GKD brings modest improvements in Conv3_x and Conv4_x, while GLD enhances alignment more broadly. CRCD achieves the most uniform and intense alignment across all stages, reflecting a stronger spatial knowledge transfer.
These trends mirror the previously reported KRS values, where CRCD outperforms GLD and GKD in segmentation. The visual progression confirms that higher KRS correlates with deeper feature-level mimicry. In sum, this visualization affirms that KRS effectively captures structural alignment in dense prediction tasks, providing insight beyond output-level performance. It strengthens the case for KRS as a robust metric for evaluating internal knowledge retention in semantic segmentation.
To highlight KRS’s interpretability at the case level, we analyze a sample from CIFAR-100 with ground truth “Cat.” Table 8 presents the top-1 prediction, top-3 output distribution, and KRS components (FSS, AOAg) across teacher and student models before and after KD. Before distillation, the student (ResNet-18) misclassifies the image as “Dog” (43.6%), while the teacher (ResNet-101) correctly predicts “Cat” (92.1%). The student’s confused output order—Dog, Cat, Deer—leads to low AOAg (47) and FSS (32), resulting in KRS = 42.5. After Vanilla KD, the student correctly predicts “Cat” (67.4%). Though some divergence remains (e.g., presence of “Fox”), both AOAg (67) and FSS (36) improve, raising KRS to 57.7. With SKD, the student confidently predicts “Cat” (81.5%), matching the teacher’s top-3 predictions (Cat, Dog, Tiger). This yields the highest metrics: AOAg = 83, FSS = 39, and KRS = 69.8.
This case shows that KRS captures both behavioral and representational improvements, validating it as a dual-perspective metric for evaluating knowledge transfer—not just accuracy gains but also internal feature alignment.

4.2.11. Relevance of KRS to Mobile and Edge Deployment

Modern AI applications increasingly rely on deploying compact student models on mobile and edge devices, where hardware resources are constrained, and on-device decision reliability is critical. In such scenarios, performance monitoring tools must be both lightweight and informative.
The Knowledge Retention Score (KRS) provides an interpretable metric to assess whether a compact student model faithfully retains the knowledge of its larger teacher across different task settings, even after significant compression. This is particularly important in edge AI pipelines where full accuracy metrics may not always be available post-deployment (e.g., no ground truth in real-time inference). KRS, as an internal alignment measure, can serve as a proxy to flag potential degradation in model performance. Moreover, our experiments involve student models that reflect realistic deployment targets—including ResNet-18, AlexNet, WRN-16-1, and EfficientNet-Lite—all of which are widely used in mobile AI. The consistent correlation of KRS with standard performance metrics (accuracy, mAP, IoU) across these models affirms that KRS remains stable and informative even under extreme compression. Finally, because KRS can be computed without access to ground truth (only teacher– student predictions and features are required), it is feasible to implement in privacy-preserving or low-connectivity environments. This makes it suitable for edge-based monitoring, model selection, and online re-training scenarios in mobile applications.

4.2.12. Evaluating KRS in Natural Language Processing Tasks

To evaluate the generalizability of the KRS beyond computer vision, we extended its application to Natural Language Processing (NLP) tasks. This supports our objective of positioning KRS as an evaluation metric for knowledge distillation that is applicable across different task types and responsive to variations in model architecture. Although originally formulated and validated within vision-based student–teacher frameworks, the two components of KRS—Feature Similarity Score (FSS) and Average Output Agreement (AOAg)—are equally applicable in NLP, where intermediate representations and output distributions are integral to effective model compression. To validate this cross-domain applicability, we selected three representative KD approaches in NLP that vary in complexity and distillation granularity: DistilBERT, Patient Knowledge Distillation (PKD), and TinyBERT. DistilBERT represents a vanilla KD strategy, where the student learns only from the soft target logits of a BERT-base teacher [37]. PKD offers a more nuanced approach by transferring knowledge from selected intermediate layers of the teacher to the student [38]. In contrast, TinyBERT implements a comprehensive, multi-objective KD framework involving the alignment of embeddings, hidden states, attention matrices, and output logits [39]. Together, these three methods span a wide range of KD strategies, enabling a robust evaluation of KRS across diverse distillation scenarios.
Experiments were conducted on the SST-2 dataset from the GLUE benchmark, a binary sentiment classification task. In all setups, BERT-base served as the teacher model. The student models—DistilBERT, PKD-based student, and TinyBERT—were trained and fine-tuned using PyTorch 2.4.0 and the HuggingFace Transformers library, with a consistent learning rate of 2 × 10 5 , batch size of 32, and three training epochs. Evaluation was carried out on the SST-2 validation set. To compute KRS, we extracted the hidden states from the final transformer layer to calculate FSS, and the softmax outputs to compute AOAg. Both scores were normalized to the [0, 1] range prior to applying the KRS formula. A sensitivity analysis was also performed by varying the alpha (FSS weight) and beta (AOAg weight) parameters from 0 to 1 in increments of 0.01 to examine the adaptability and robustness of KRS in NLP settings. All experiments were executed on an NVIDIA RTX 3070 GPU to ensure consistent computational conditions.
Table 9 presents the performance of three student models—DistilBERT, TinyBERT, and PKD—each configured with six transformer layers and evaluated on the SST-2 sentiment classification task. The table includes validation accuracy, FSS, AOAg, and the resulting KRS for both pre- and post-KD settings, with BERT-base serving as the teacher model for reference.
To compute KRS before applying KD, each student model was fine-tuned independently using only hard labels and no teacher guidance. After training, FSS was calculated via cosine similarity between the final hidden states of the teacher and student, while AOAg was derived from a KL divergence-based similarity of their softmax outputs. Both components were normalized to the [0, 1] range and combined to yield the pre-KD KRS. These values establish a baseline for evaluating how much alignment was gained through the distillation process.
All three student models showed substantial improvements in both accuracy and KRS after KD was applied. DistilBERT improved from 89.31% to 92.27% in accuracy, with a corresponding KRS increase from 0.41 to 0.68. TinyBERT and PKD exhibited similar gains, with TinyBERT improving from 85.78% to 92.88% in accuracy and PKD reaching 93.12%, both accompanied by significant rises in FSS and AOAg. These trends indicate that KD effectively enhances both internal representations and output behavior, and that KRS is sensitive to these improvements.
In computing KRS, we chose α = 0.5 and β = 0.5 to assign equal importance to representational and output alignment. This balanced weighting supports fair comparison across models with differing KD objectives—such as DistilBERT’s output-only strategy versus TinyBERT’s multi-objective design. A full sensitivity analysis of α and β is provided in the succeeding section.
Taken together with the results from vision-based tasks, the NLP findings in this section reinforce the cross-domain applicability of KRS. Despite variation in KD strategies, architecture design, and task modality, KRS consistently reflected meaningful improvements in knowledge retention and closely tracked downstream performance. This consistency across both vision and language domains affirms KRS as a generalizable and reliable metric for evaluating the effectiveness of knowledge distillation.
Sensitivity Analysis of α and β in NLP Knowledge Distillation
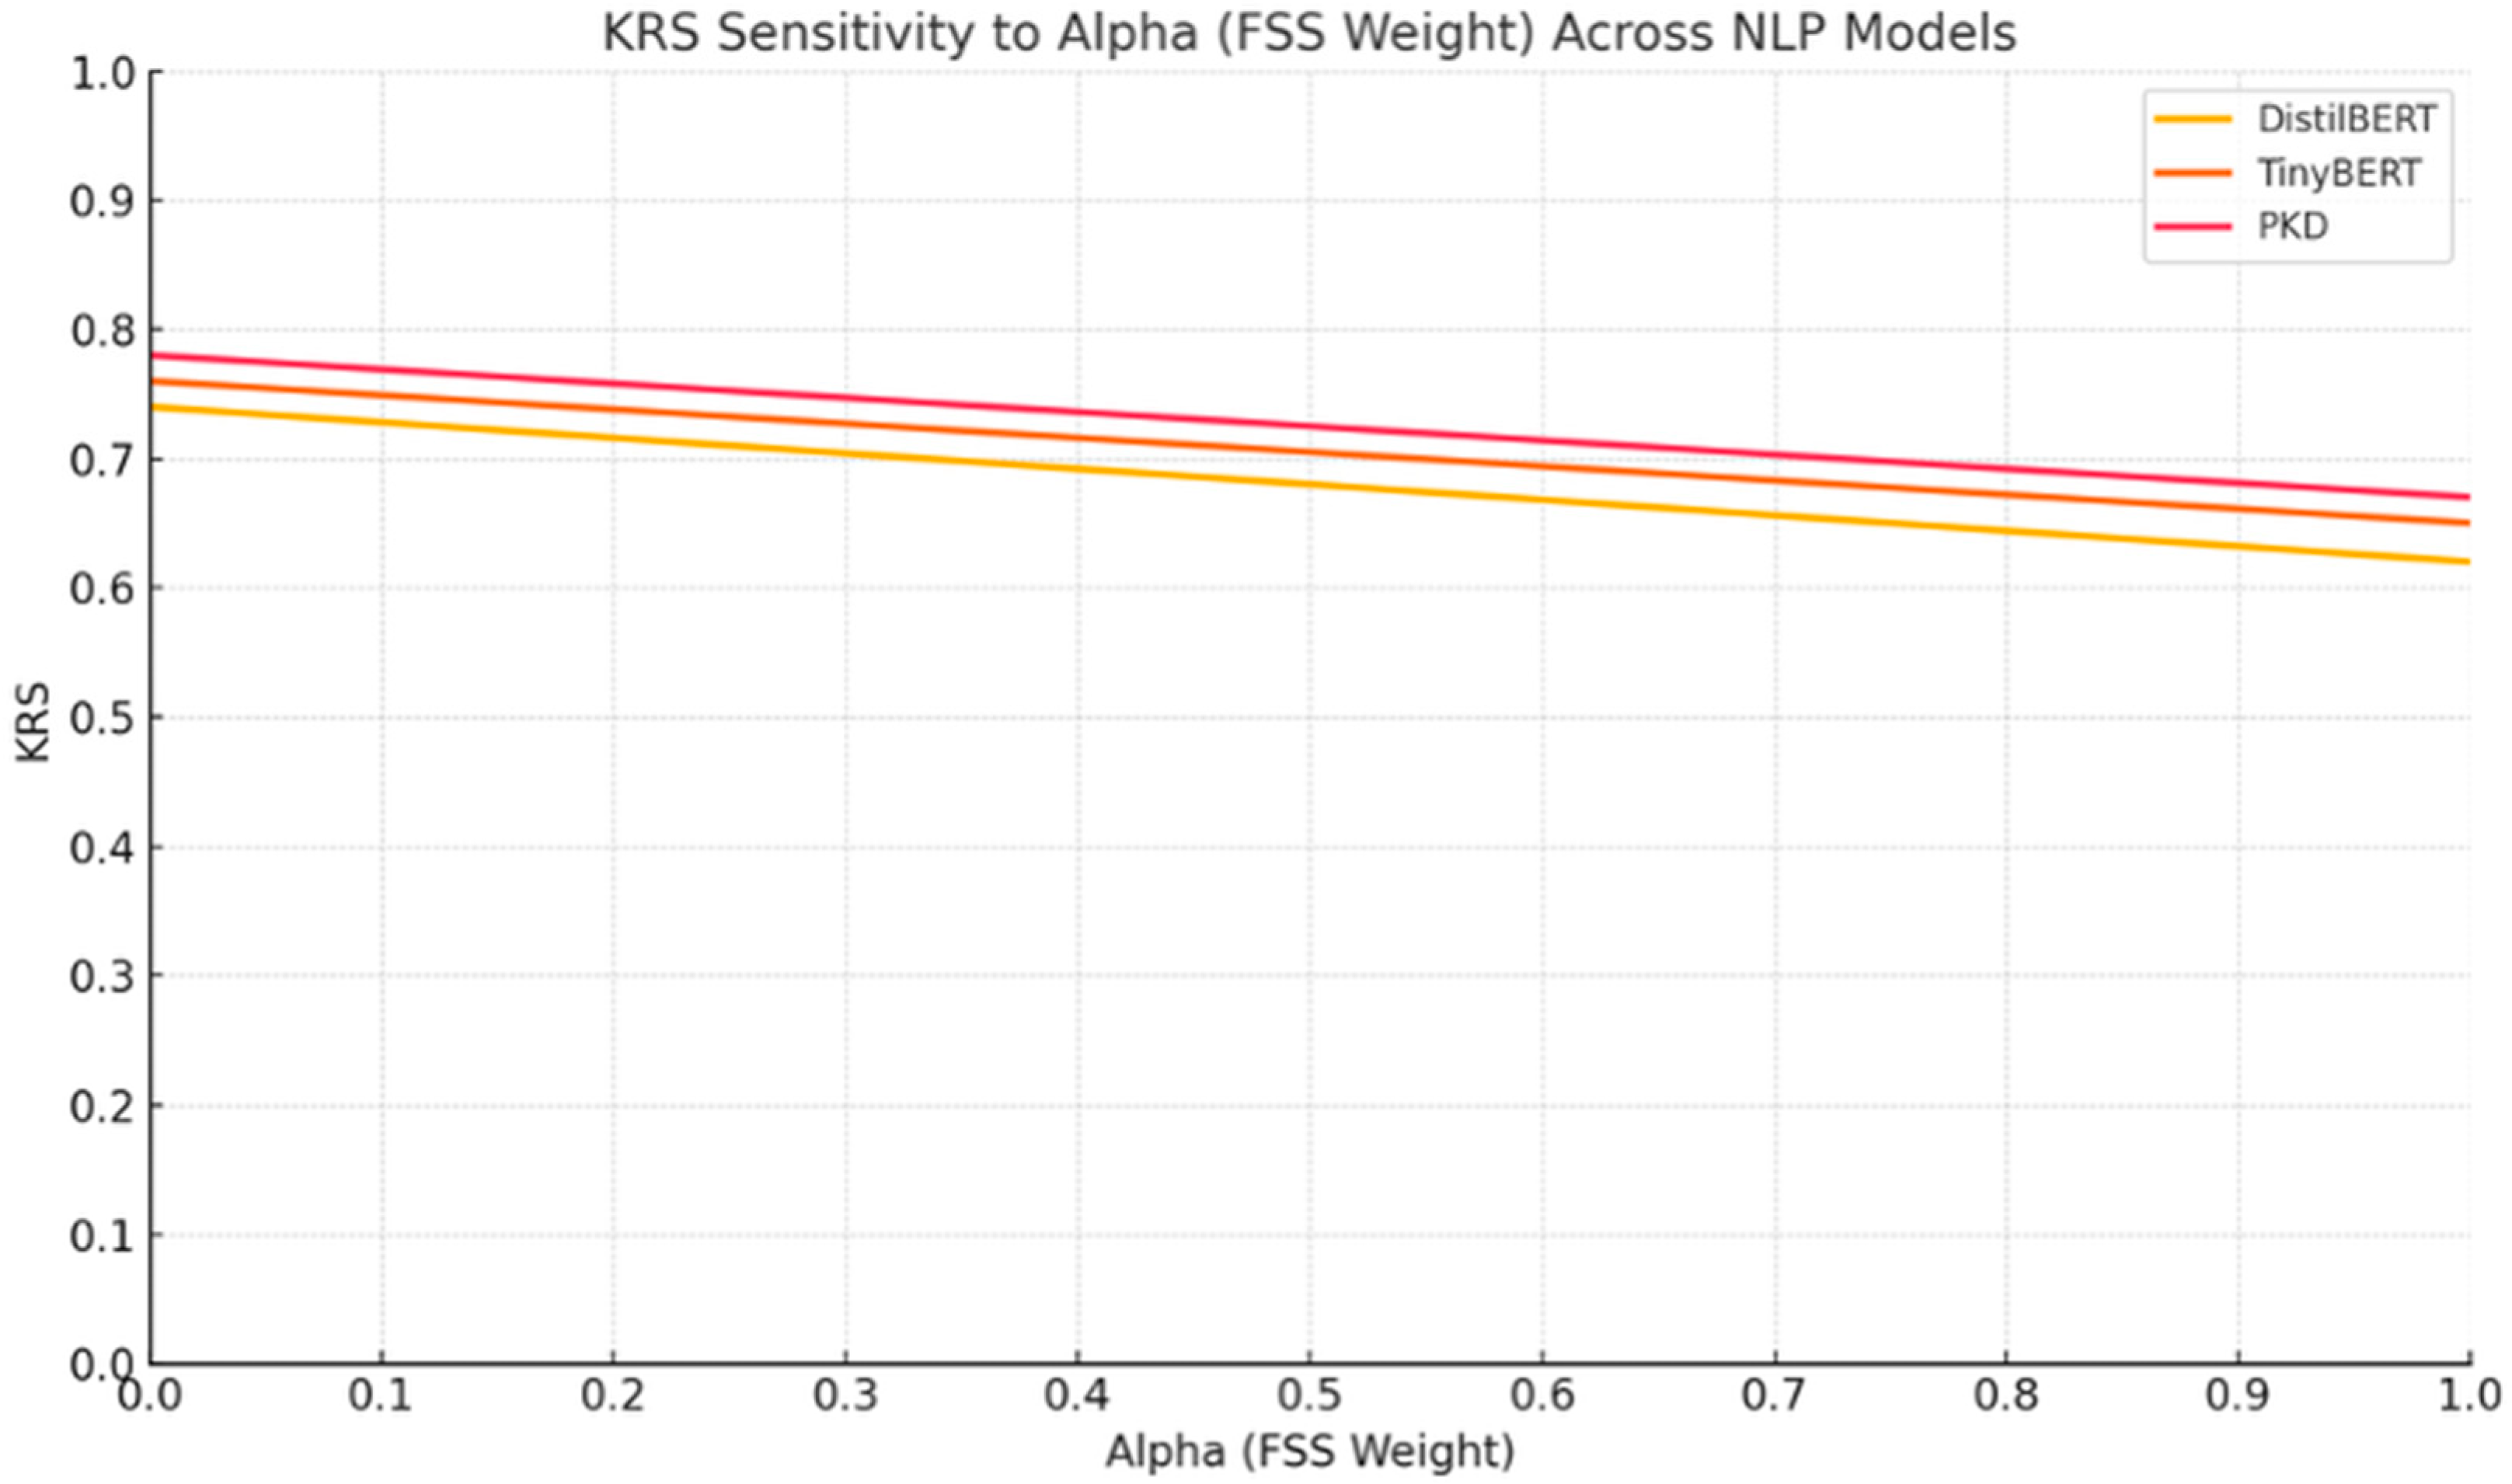
Figure 14 presents the sensitivity of the KRS to varying α values, which control the relative weight of the FSS in the KRS formula. As α increases from 0 to 1, all three models—DistilBERT, TinyBERT, and PKD—exhibit a smooth, linear decline in KRS. This indicates that while both FSS and AOAg contribute to knowledge retention, the AOAg component (weighted by β = 1 − α) tends to exert a slightly stronger influence in aligning student behavior with the teacher.
The stability of the curves across the entire α range demonstrates that KRS behaves predictably under different weighting schemes, with no abrupt changes or inconsistencies. This supports the robustness of KRS as a metric. Based on this observation, our use of α = 0.5 and β = 0.5 remains a justifiable and neutral choice. It ensures that both intermediate representation similarity and output agreement are considered, making the score applicable across distillation strategies with varying focus—whether output-only (DistilBERT), feature-based (PKD), or multi-objective (TinyBERT).
Overall, the sensitivity analysis reinforces that KRS is a stable and interpretable metric across a range of configurations and that the default setting of α = 0.5 offers a balanced view of knowledge retention.
Beyond Accuracy: Evaluating Knowledge Retention Through KRS
While validation accuracy is commonly used to evaluate the effectiveness of knowledge distillation, it provides only a surface-level measure of student performance. Our findings demonstrate that KRS offers a more nuanced perspective by simultaneously capturing both representational and output-level alignment with the teacher. For instance, although TinyBERT and DistilBERT achieved similar post-KD accuracies on SST-2 (92.88% vs. 92.27%, respectively), their KRSs revealed a wider disparity (0.71 vs. 0.68), indicating that TinyBERT retained teacher knowledge more effectively. In contrast, models with comparable accuracy but lower KRS likely relied more on task-specific learning rather than generalized knowledge transfer. This reinforces the value of KRS as a complementary metric that can distinguish between surface-level accuracy and deeper knowledge fidelity.

4.2.13. Extending KRS to Time Series Regression

To explore the broader applicability of KRS, we propose its extension to time series regression tasks. In this setting, student models are trained to mimic the behavior of a more complex teacher model when predicting continuous-valued sequences. Since classification-based similarity metrics like softmax KL divergence are no longer applicable, we reformulate the Agreement on Output Aggregation (AOAg) component to suit the regression context.
Specifically, AOAg is redefined as the inverse of the normalized mean squared error (MSE) between the teacher and student outputs, ensuring that higher agreement corresponds to lower prediction error. Given a sequence of outputs from the teacher T = {t1, t2, …, tn} and students S = {s1, s2, …, sn}, we compute:
A O A g r e g = 1 M S E ( S , T ) m a x ( M S E )
where max(MSE) is determined based on the worst-case deviation observed during training. This normalization bounds AOAg between 0 and 1. Feature Similarity Score (FSS) remains unchanged and is computed as the cosine similarity between latent representations of the student and teacher networks at selected layers.
The KRS formulation thus becomes directly compatible with time series tasks, providing a unified metric to assess knowledge retention across both classification and regression domains. This highlights the adaptability of KRS beyond NLP and CV, paving the way for its application in broader domains such as sensor analytics, financial forecasting, and health monitoring.
We evaluated the applicability of KRS in a time series regression setting by selecting a representative and practical task: electrical demand forecasting. For this experiment, we used the UCI Household Electric Power Consumption dataset, where the objective was to predict the next hour’s active power consumption based on the past 24 h of readings. To model the task, we adopted a two-tier architecture: a deeper LSTM network as the teacher, and a smaller, shallower LSTM as the student. The choice reflects typical constraints in real-world deployments where lightweight models are needed at the edge. We applied FitNet, as it allows the student to mimic the internal feature representations of the teacher, which is ideal for sequential data.
The results in Table 10 highlight the performance of the student model before and after applying feature-based knowledge distillation (FKD) for a time series regression task. Notably, the student’s predictive performance improved across all metrics: the Mean Absolute Error (MAE) decreased from 0.213 to 0.167, Root Mean Square Error (RMSE) from 0.297 to 0.241, and R2 increased from 0.802 to 0.872. These gains clearly indicate that the student model, guided by the teacher, learned a more accurate mapping from input to output.
Beyond predictive performance, the Knowledge Retention Score (KRS) provides a deeper view into how well the student internalized the teacher’s behavior. Post-KD, the Feature Similarity Score (FSS) rose from 0.43 to 0.68, indicating significantly better alignment in internal representations. Simultaneously, the Output Agreement (AOAg) improved from 0.35 to 0.70, reflecting a closer match in the shape and scale of the output sequences. As a composite of these factors, the KRS increased from 0.39 to 0.69.
This reinforces that KRS serves as a critical interpretability tool even in regression contexts. While conventional metrics like MAE and RMSE only assess output correctness, KRS reveals how much of the teacher’s learned knowledge structure the student has actually retained. This is especially valuable in time series forecasting, where model behavior over time (i.e., internal dynamics) can influence reliability, generalizability, and down-stream integration with control systems. In this light, KRS acts as a sanity check—helping us trust not just the predictions, but the process behind them.

4.3. Reflections on Composite Versus Component Metrics

While the FSS and AOAg independently capture critical aspects of student–teacher alignment, their isolated interpretation can be limiting, especially in cases where one improves and the other deteriorates. The KRS offers a unified measure that integrates these complementary signals into a single interpretable metric. This integration not only simplifies comparative evaluation across models and tasks but also facilitates clearer diagnostics in complex distillation scenarios. Rather than replacing FSS or AOAg, KRS builds upon them to reflect both representational and behavioral fidelity in a holistic manner. Furthermore, the use of task-sensitive weighting—where α and β are adjusted based on the underlying modality and distillation objective—ensures that KRS adapts meaningfully across classification, detection, language understanding, and regression tasks. This makes KRS a practical and versatile tool for researchers seeking a generalizable yet nuanced metric for evaluating knowledge distillation.

4.4. Using KRS as a Tuning Signal in Knowledge Distillation

Beyond post-training evaluation, the Knowledge Retention Score (KRS) serves as a practical diagnostic tool during the tuning of KD models. By combining Feature Similarity Score (FSS) and Average Output Agreement (AOA), KRS provides insight into both internal representation alignment and output-level mimicry, enabling deeper monitoring of the student’s learning progress.
In vanilla KD, tuning the softmax temperature and KD-to-hard loss weight influences AOA. A higher temperature softens teacher outputs, improving the student’s ability to learn inter-class relationships—often reflected in increased AOA and KRS. Emphasizing the KD loss in the loss function can also enhance alignment with the teacher’s output distribution.
For feature-based KD methods (e.g., FitNet, CRCD, GLD), optimizing which intermediate layers to align significantly affects FSS. Higher FSS is observed when student and teacher share similar architectures, such as ResNet-101 and ResNet-18, and when alignment targets semantically rich layers. These refinements contribute to stronger knowledge retention, improving overall KRS.
Monitoring AOA and FSS during training enables real-time strategy adjustments. A high AOAg but low FSS may suggest the need for feature-level supervision, while the reverse may point to issues in output behavior requiring adjustments in temperature or loss weighting.
In sum, KRS is not just an evaluation metric—it is a dynamic, interpretable guide for hyperparameter tuning and method optimization in KD pipelines, helping to refine strategies to better match the student’s capacity and architecture.
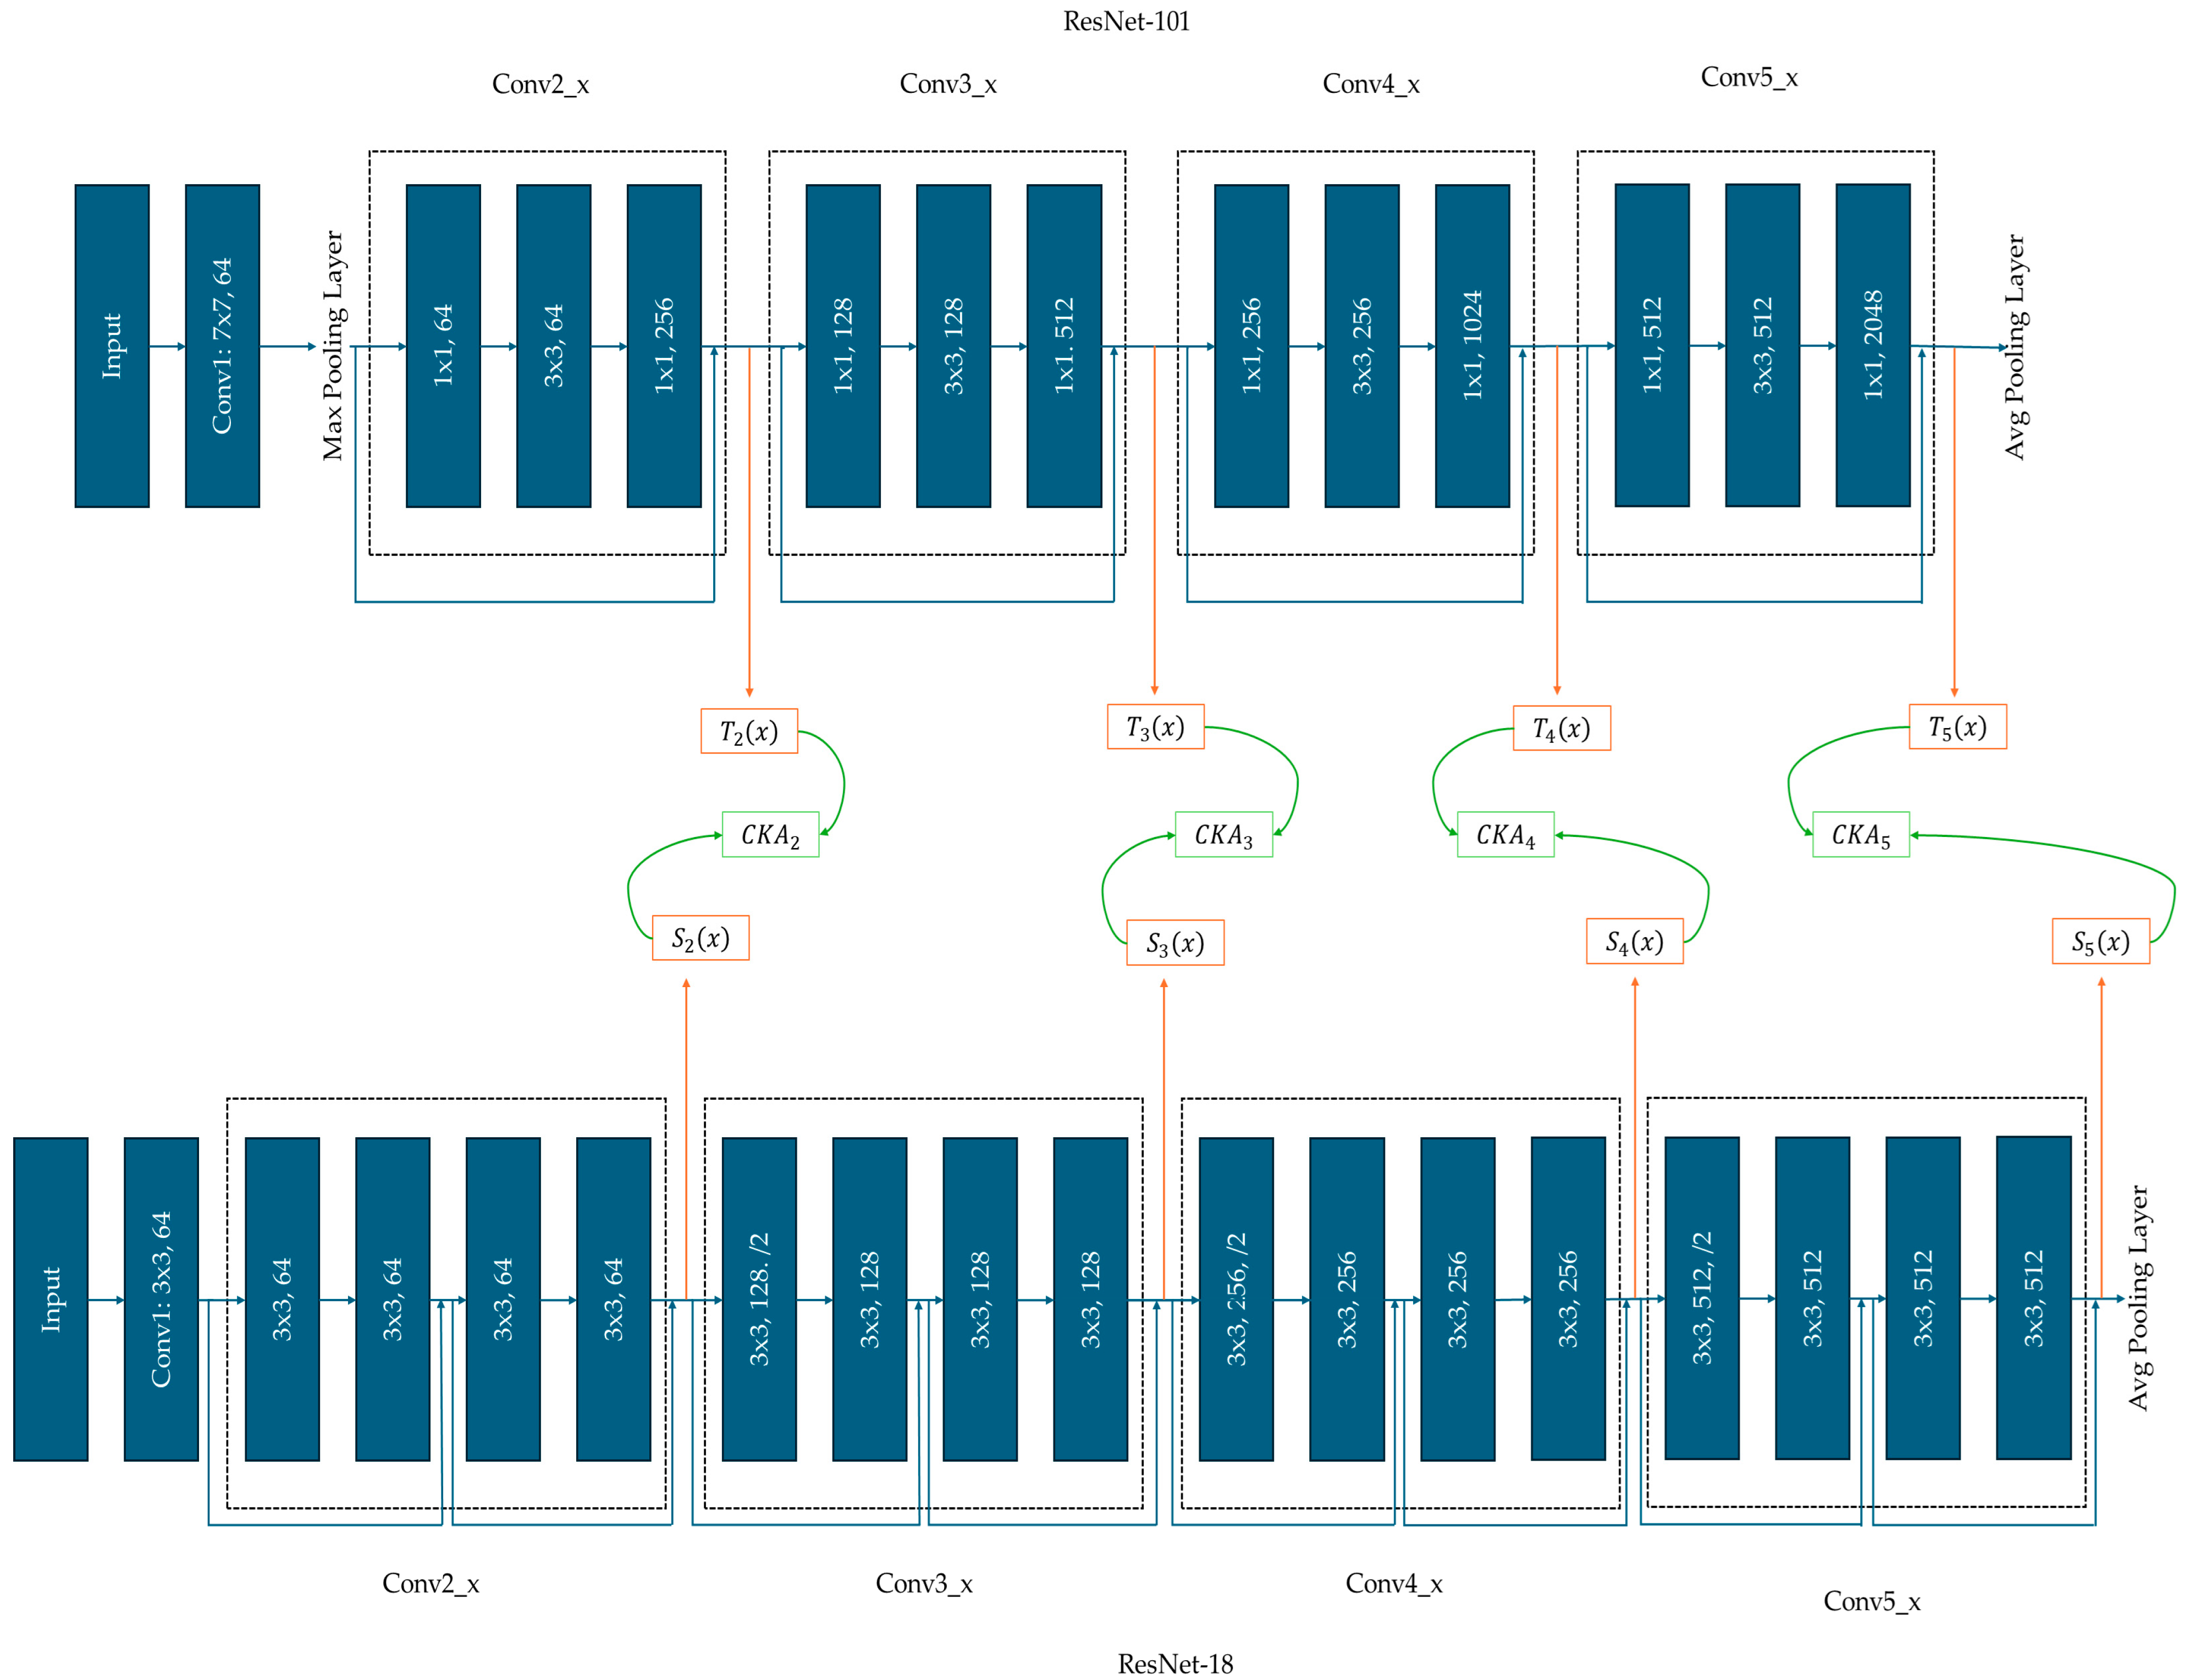
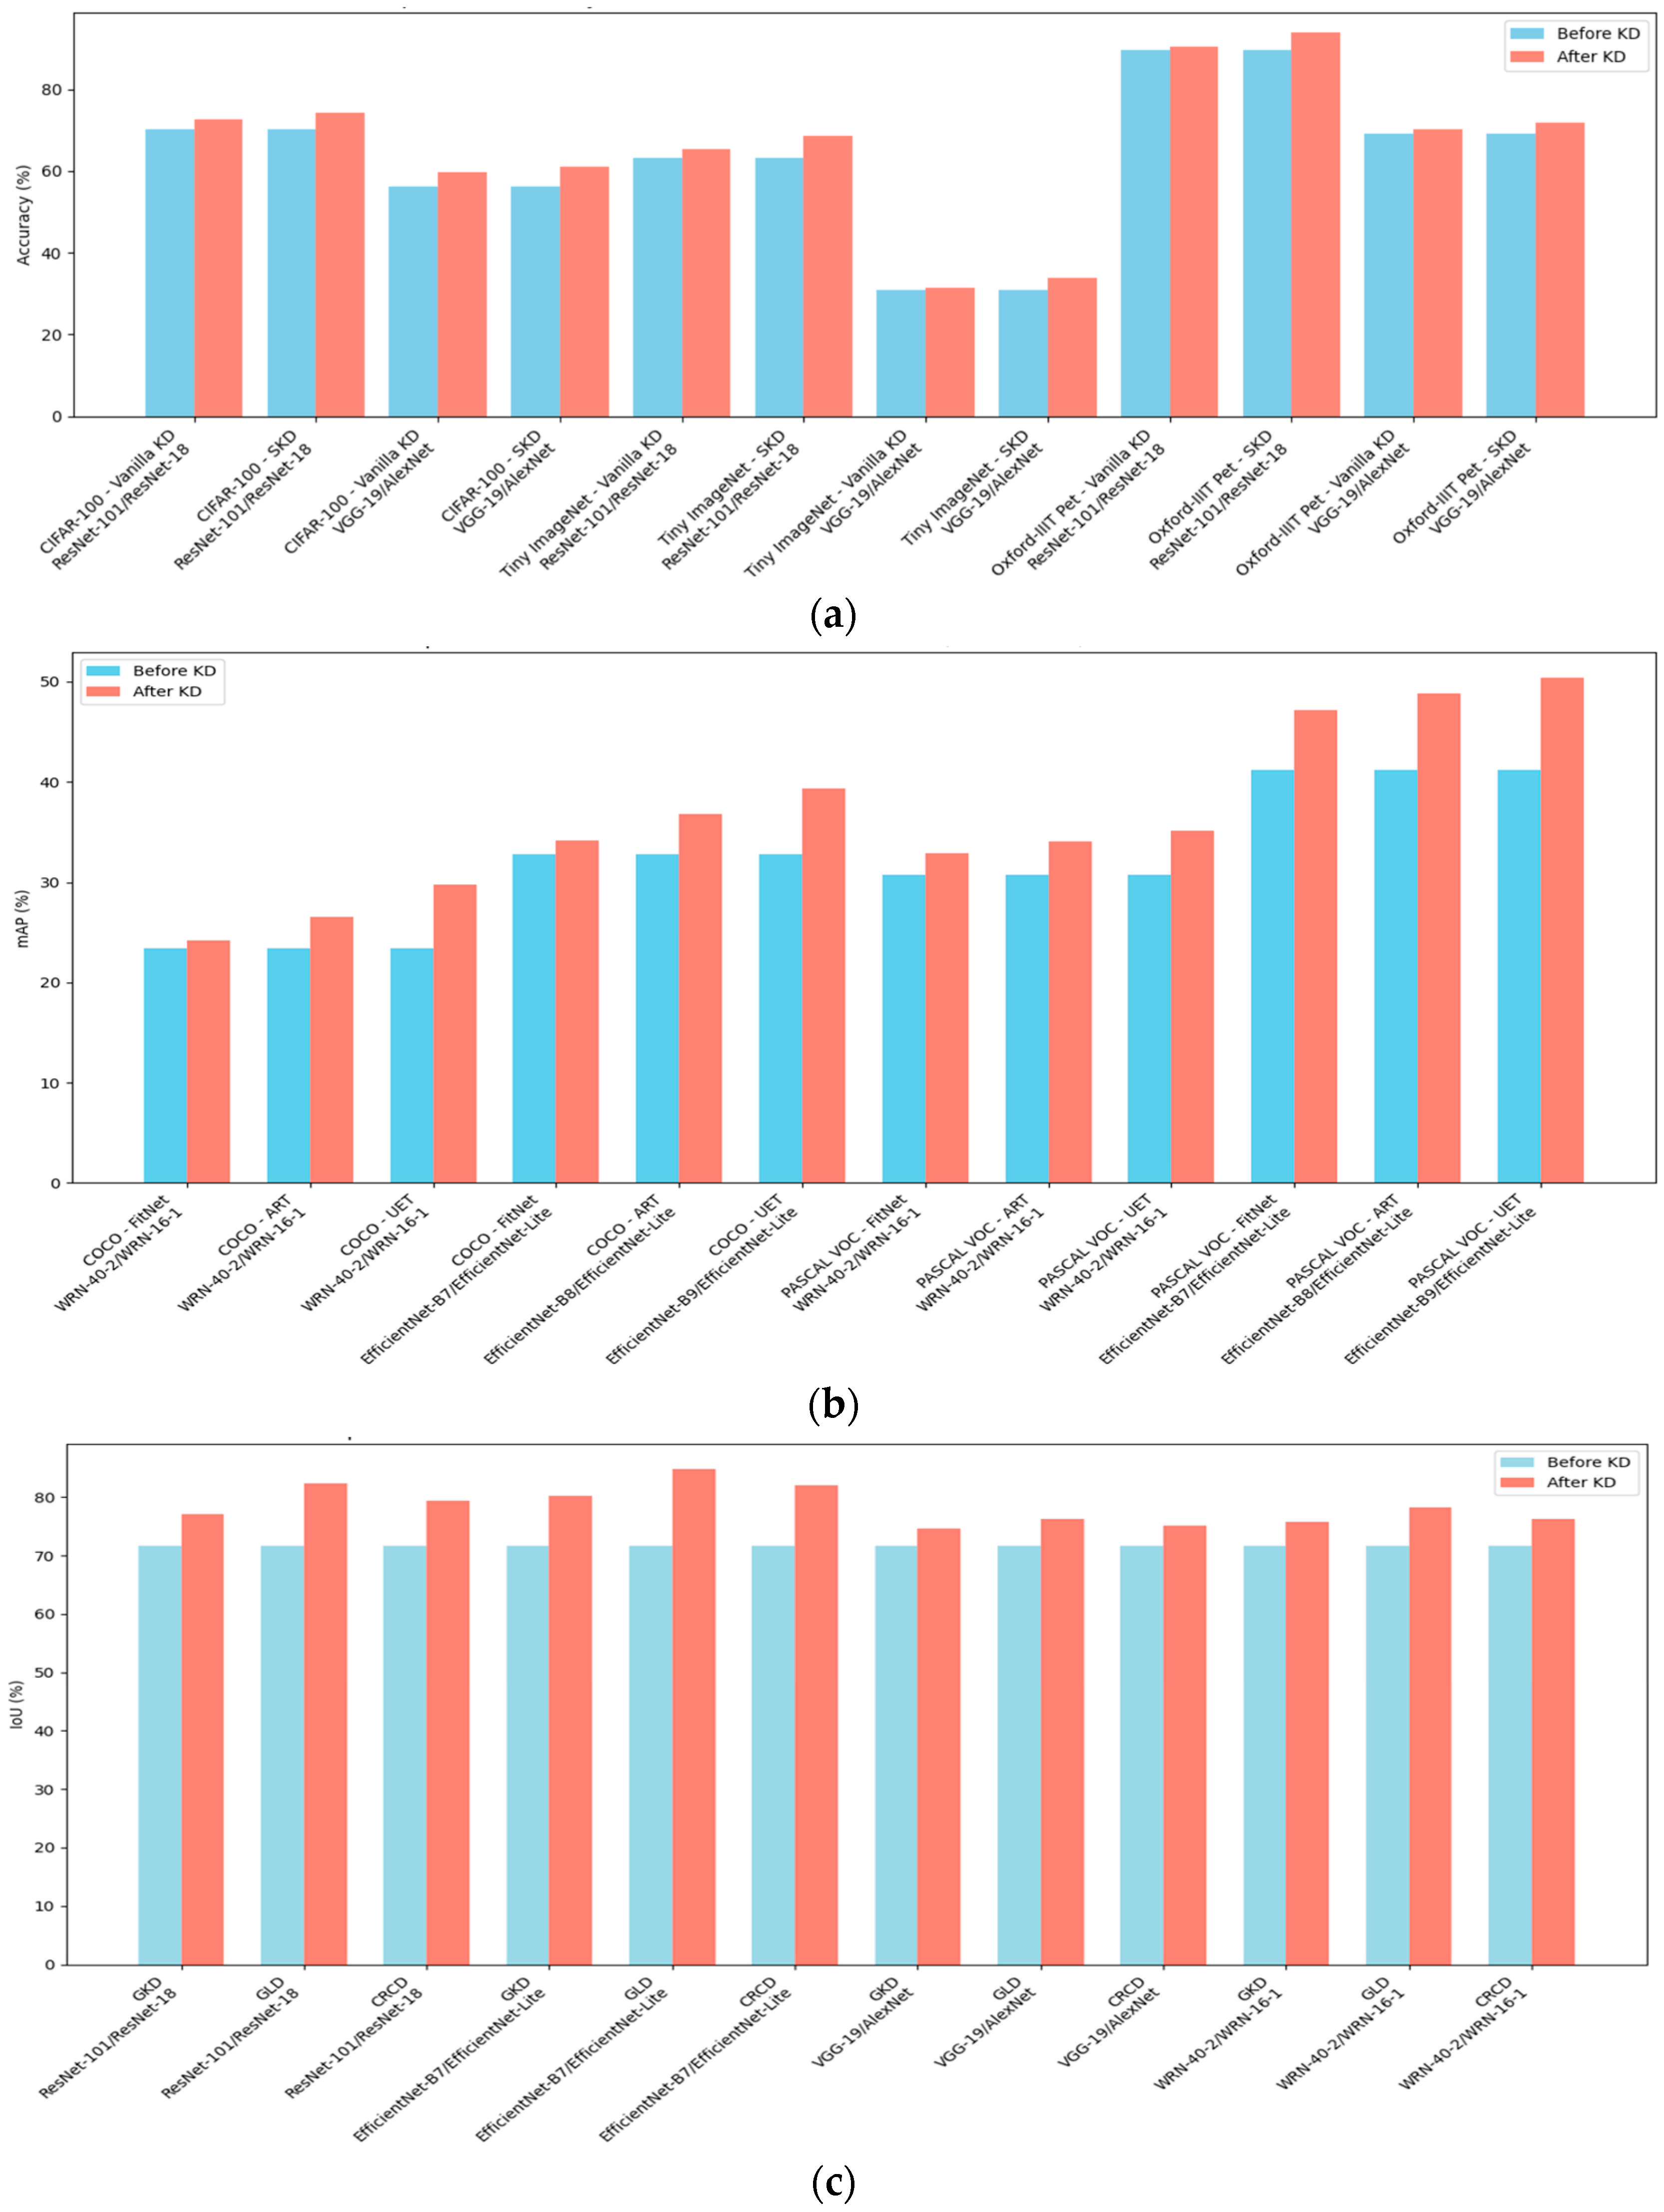
5. Conclusions and Future Work

This paper presented the Knowledge Retention Score (KRS), a novel and interpretable metric designed to evaluate the effectiveness of knowledge transfer in student models after the knowledge distillation (KD) process. KRS integrates intermediate feature similarity (FSS) and output-level agreement (AOAg) into a single, task-sensitive metric, offering a more holistic view of knowledge retention than traditional metrics such as accuracy, mAP, and IoU. We evaluated KRS across 40 experiments involving diverse KD methods, student–teacher architectures, and task domains—including image classification, object detection, semantic segmentation, natural language processing (NLP), and time series regression. Results showed that KRS correlates strongly with standard performance metrics while revealing internal learning dynamics that are often overlooked. Higher KRS values consistently reflected better knowledge retention, especially in models trained with more expressive or uncertainty-aware KD methods. The formulation of KRS was shown to be adaptable, with α and β weights adjusted to reflect the nature of each task—for example, output-focused alignment in classification and deeper representational matching in segmentation and detection. To further ground the interpretability and usefulness of KRS, we conducted sensitivity analyses across tasks and offered qualitative insights into how KRS reconciles conflicting signals between FSS and AOAg. In NLP and regression, where traditional structural interpretability is limited, KRS still captured meaningful improvements from distillation, validating its application beyond vision-based tasks.
Despite these strengths, several limitations must be acknowledged. First, the calculation of feature similarity currently relies on manually selected layers, which may introduce bias and limit reproducibility. Future work could investigate automated strategies such as attention-weighted layer selection, activation-magnitude heuristics, or integration with Neural Architecture Search (NAS) to enhance scalability. Second, the present study adopts an additive utility model for combining FSS and AOAg; while this formulation provides interpretability and simplicity, alternative approaches (e.g., multiplicative or attention-weighted aggregation) may capture richer, non-linear interactions and warrant further exploration. Third, KRS evaluation was conducted in an offline setting, which restricts its immediate applicability to real-time or streaming scenarios. Efficient approximations of CKA and KL/IoU would be needed to extend KRS to online monitoring or continual learning tasks. Fourth, while KRS is introduced as a post hoc evaluation metric, its differentiable structure suggests the possibility of embedding it directly into KD training as a loss function or regularization term, which future studies may validate. Fifth, this work did not integrate explicit uncertainty quantification into KRS, though techniques such as Monte Carlo Dropout or ensemble variance could enrich interpretability in safety-critical domains. Finally, while our evaluation relied on numeric results, incorporating visualization methods—such as similarity heatmaps or attention maps—could further enhance transparency and user interpretability.
Looking ahead, we propose expanding the utility of KRS in additional domains such as speech processing and reinforcement learning, while also conducting more comprehensive studies in natural language processing (NLP) and time series regression to further solidify its cross-domain applicability. Future work could explore using KRS as an auxiliary loss signal during KD training, or as a criterion for automated student model selection under resource constraints. Ultimately, we envision KRS not just as an evaluation tool, but as a bridge between diagnostic insight and optimization in knowledge distillation research.

Author Contributions

Writing—original draft, A.A.; Writing—review and editing, J.V. All authors have read and agreed to the published version of the manuscript.

Funding

This research was funded by the Southeast Asian Regional Center for Graduate Study and Research in Agriculture (SEARCA), GBG24-1209.

Institutional Review Board Statement

Not applicable.

Informed Consent Statement

Not applicable.

Data Availability Statement

The datasets used in this study are openly available from the following sources: CIFAR-100—Canadian Institute for Advanced Research (https://www.cs.toronto.edu/~kriz/cifar.html, accessed on 15 November 2024); Tiny ImageNet—Stanford University (https://www.kaggle.com/c/tiny-imagenet, accessed on 15 November 2024); COCO—COCO Consortium (https://cocodataset.org, accessed on 25 November 2024); PASCAL VOC—Visual Object Classes Challenge (https://www.kaggle.com/datasets/gopalbhattrai/pascal-voc-2012-dataset, accessed on 27 November 2024); Oxford-IIIT Pet—Visual Geometry Group (https://www.robots.ox.ac.uk/~vgg/data/pets/, accessed on 30 November 2024); SST-2 (Stanford Sentiment Treebank v2)—GLUE Benchmark (https://gluebenchmark.com/tasks, accessed on 25 May 2025); and Individual Household Electric Power Consumption Data Set—UCI Machine Learning Repository (https://archive.ics.uci.edu/ml/datasets/individual+household+electric+power+consumption, accessed on 16 June 2025).

Conflicts of Interest

The authors declare no conflicts of interest.

References

  1. Rawat, W.; Wang, Z. Deep Convolutional Neural Networks for Image Classification: A Comprehensive Review. Neural Comput. 2017, 29, 2352–2449. [Google Scholar] [CrossRef] [PubMed]
  2. Zhao, Z.Q.; Zheng, P.; Xu, S.T.; Wu, X. Object Detection with Deep Learning: A Review. IEEE Trans. Neural Netw. Learn. Syst. 2018, 30, 3212–3232. [Google Scholar] [CrossRef]
  3. Guo, Y.; Liu, Y.; Georgiou, T.; Lew, M.S. A Review of Semantic Segmentation Using Deep Neural Networks. Int. J. Multimed. Inf. Retr. 2018, 7, 87–93. [Google Scholar] [CrossRef]
  4. Otter, D.W.; Medina, J.R.; Kalita, J.K. A Survey of the Usages of Deep Learning for Natural Language Processing. IEEE Trans. Neural Netw. Learn. Syst. 2021, 32, 604–624. [Google Scholar] [CrossRef] [PubMed]
  5. Gou, J.; Yu, B.; Maybank, S.J.; Tao, D. Knowledge Distillation: A Survey. Int. J. Comput. Vis. 2021, 129, 1789–1819. [Google Scholar] [CrossRef]
  6. Hinton, G.; Vinyals, O.; Dean, J. Distilling the Knowledge in a Neural Network. arXiv 2015, arXiv:1503.02531. [Google Scholar] [CrossRef]
  7. Yang, C.; Yu, X.; An, Z.; Xu, Y. Categories of Response-Based, Feature-Based, and Relation-Based Knowledge Distillation. In Advancements in Knowledge Distillation: Towards New Horizons of Intelligent Systems, Studies in Computational Intelligence; Springer International Publishing: Cham, Switzerland, 2023; Volume 1100, pp. 10–41. [Google Scholar]
  8. Romero, A.; Ballas, N.; Kahou, S.E.; Chassang, A.; Gatta, C.; Bengio, Y. FitNets: Hints for Thin Deep Nets. arXiv 2014, arXiv:1412.6550. [Google Scholar]
  9. Alkhulaifi, A.; Alsahli, F.; Ahmad, I. Knowledge Distillation in Deep Learning and Its Applications. PeerJ Comput. Sci. 2021, 7, e474. [Google Scholar] [CrossRef]
  10. Patel, G.; Reddy Mopuri, K.; Qiu, Q. Learning to Retain While Acquiring: Combating Distribution-Shift in Adversarial Data-Free Knowledge Distillation. arXiv 2023, arXiv:2302.14290. [Google Scholar]
  11. Singh, P.; Mazumder, P.; Rai, P.; Namboodiri, V.P. Rectification-Based Knowledge Retention for Continual Learning. arXiv 2021, arXiv:2103.16597. [Google Scholar] [CrossRef]
  12. Hu, C.; Li, X.; Liu, D.; Wu, H.; Chen, X.; Wang, J.; Liu, X. Teacher-Student Architecture for Knowledge Distillation: A Survey. arXiv 2023, arXiv:2308.04268. [Google Scholar] [CrossRef]
  13. Ji, M.; Heo, B.; Park, S. Show, Attend and Distill: Knowledge Distillation via Attention-Based Feature Matching. Proc. AAAI Conf. Artif. Intell. 2021, 35, 7945–7952. [Google Scholar] [CrossRef]
  14. Park, S.; Kang, D.; Paik, J. Cosine Similarity-Guided Knowledge Distillation for Robust Object Detectors. Sci. Rep. 2024, 14, 18888. [Google Scholar] [CrossRef] [PubMed]
  15. Wang, L.; Yoon, K.-J. Knowledge Distillation and Student-Teacher Learning for Visual Intelligence: A Review and New Outlooks. arXiv 2020, arXiv:2004.05937. [Google Scholar] [CrossRef] [PubMed]
  16. Zagoruyko, S.; Komodakis, N. Paying More Attention to Attention: Improving the Performance of Convolutional Neural Networks via Attention Transfer. arXiv 2016, arXiv:1612.03928. [Google Scholar]
  17. Sun, T.; Chen, H.; Hu, G.; Zhao, C. Explainability-Based Knowledge Distillation. Pattern Recognit. 2024, 159, 111095. [Google Scholar] [CrossRef]
  18. Mi, J.; Wang, L.F.; Liu, Y.; Zhang, J. KDE-GAN: A Multimodal Medical Image-Fusion Model Based on Knowledge Distillation and Explainable AI Modules. Comput. Biol. Med. 2022, 151, 106273. [Google Scholar] [CrossRef]
  19. Franciscus, B.; Vosters, C.; Sebastian, J.; Jauregui, O.; Hendrix, P. Knowledge Distillation to Improve Model Performance and Explainability: A Decision-Critical Scenario Analysis; Tilburg University: Tilburg, The Netherlands, 2020. [Google Scholar]
  20. Kim, T.; Oh, J.; Kim, N.Y.; Cho, S.; Yun, S.Y. Comparing Kullback-Leibler Divergence and Mean Squared Error Loss in Knowledge Distillation. IJCAI Int. Jt. Conf. Artif. Intell. 2021, 14, 2628–2635. [Google Scholar] [CrossRef]
  21. Saha, A.; Bialkowski, A.; Khalifa, S. Saha, Bialkowski, Khalifa: Representation Distillation Using CKA Distilling Representational Similarity Using Centered Kernel Alignment (CKA); BMVA Press: Berlin, Germany, 2022. [Google Scholar]
  22. Shrivastava, A.; Qi, Y.; Ordonez, V. Estimating and Maximizing Mutual Information for Knowledge Distillation. arXiv 2021, arXiv:2110.15946. [Google Scholar]
  23. Lee, J.-W.; Choi, M.; Lee, J.; Shim, H. Collaborative Distillation for Top-N Recommendation. arXiv 2019, arXiv:1911.05276. [Google Scholar] [CrossRef]
  24. Alba, A.R.; Villaverde, J.F. Performance assessment of knowledge distillation models using the knowledge retention score. In Proceedings of the IET Conference Proceedings; Institution of Engineering and Technology, Iskandar Puteri, Malaysia, 11–13 December 2024; Volume 2024, pp. 372–379. [Google Scholar]
  25. Keeney, R.L.; Raiffa, H. Decisions with Multiple Objectives: Preferences and Value Trade-Offs. IEEE Trans. Syst. Man. Cybern. 1979, 9, 403. [Google Scholar]
  26. Sagar, A.D.; Najam, A. The Human Development Index: A Critical Review. Ecol. Econ. 1998, 25, 249–264. [Google Scholar] [CrossRef]
  27. Sasaki, Y. The Truth of the F-Measure. 2007. Available online: https://people.cs.pitt.edu/~litman/courses/cs1671s20/F-measure-YS-26Oct07.pdf (accessed on 30 November 2024).
  28. Reiter, E. A Structured Review of the Validity of BLEU. Comput. Linguist. 2018, 44, 393–401. [Google Scholar] [CrossRef]
  29. Lin, T.Y.; Maire, M.; Belongie, S.; Hays, J.; Perona, P.; Ramanan, D.; Dollár, P.; Zitnick, C.L. Microsoft COCO: Common Objects in Context. Eur. Conf. Comput. Vis. 2014, 8693 LNCS, 740–755. [Google Scholar] [CrossRef]
  30. Everingham, M.; Eslami, S.M.A.; Van Gool, L.; Williams, C.K.I.; Winn, J.; Zisserman, A. The Pascal Visual Object Classes Challenge: A Retrospective. Int. J. Comput. Vis. 2015, 111, 98–136. [Google Scholar] [CrossRef]
  31. Yuan, M.; Lang, B.; Quan, F. Student-Friendly Knowledge Distillation. Knowl. Based Syst. 2024, 296, 111915. [Google Scholar] [CrossRef]
  32. Cho, Y.; Ham, G.; Lee, J.H.; Kim, D. Ambiguity-Aware Robust Teacher (ART): Enhanced Self-Knowledge Distillation Framework with Pruned Teacher Network. Pattern Recognit. 2023, 140, 109541. [Google Scholar] [CrossRef]
  33. Yi, J.; Mao, J.; Liu, T.; Li, M.; Gu, H.; Zhang, H.; Chang, X.; Wang, Y. Teaching with Uncertainty: Unleashing the Potential of Knowledge Distillation in Object Detection. arXiv 2024, arXiv:2406.06999. [Google Scholar] [CrossRef]
  34. Lee, S.; Song, B.C. Graph-Based Knowledge Distillation by Multi-Head Attention Network. arXiv 2019, arXiv:1907.02226. [Google Scholar]
  35. Kim, Y.; Park, J.; Jang, Y.H.; Ali, M.; Oh, T.H.; Bae, S.H. Distilling Global and Local Logits with Densely Connected Relations. In Proceedings of the IEEE International Conference on Computer Vision, Montreal, QC, Canada, 10–17 October 2021; pp. 6270–6280. [Google Scholar] [CrossRef]
  36. Zhu, J.; Tang, S.; Chen, D.; Yu, S.; Liu, Y.; Rong, M.; Yang, A.; Wang, X. Complementary Relation Contrastive Distillation. In Proceedings of the IEEE Computer Society Conference on Computer Vision and Pattern Recognition, Nashville, TN, USA, 20–25 June 2021; pp. 9256–9265. [Google Scholar] [CrossRef]
  37. Sanh, V.; Debut, L.; Chaumond, J.; Wolf, T. DistilBERT, a Distilled Version of BERT: Smaller, Faster, Cheaper and Lighter. arXiv 2020, arXiv:1910.01108. [Google Scholar] [CrossRef]
  38. Sun, S.; Cheng, Y.; Gan, Z.; Liu, J. Patient Knowledge Distillation for BERT Model Compression. arXiv 2019, arXiv:1908.09355. [Google Scholar] [CrossRef]
  39. Jiao, X.; Yin, Y.; Shang, L.; Jiang, X.; Chen, X.; Li, L.; Wang, F.; Liu, Q. TinyBERT: Distilling BERT for Natural Language Understanding. arXiv 2019, arXiv:1909.10351. [Google Scholar]
Figure 1. Example of teacher–student network pair with layer selection by which intermediate features will be extracted.
Ai 06 00273 g001
Figure 2. The figure shows the performance of the student model pre- and post-KD. (a) represents image classification task; (b) object detection; and (c) image segmentation.
Ai 06 00273 g002
Figure 3. The figure shows the performance of the student model (i.e., ResNet-18 and AlexNet) across datasets before and after KD process.
Ai 06 00273 g003
Figure 4. Performance of WRN-16-1 and EfficientNet-Lite using the KRS in various datasets before and after selected KD method.
Ai 06 00273 g004
Figure 5. KRS ablation study before and after KD for experiments on image classification.
Ai 06 00273 g005
Figure 6. KRS ablation study before and after KD for object detection.
Ai 06 00273 g006
Figure 7. KRS ablation study before and after KD for experiments 25 to 36.
Ai 06 00273 g007
Figure 8. KRS values at varying α for various computer vision tasks. The differing optimal α per task supports our decision to assign α values based on task characteristics, ensuring that KRS meaningfully reflects the dominant knowledge aspect being transferred.
Ai 06 00273 g008
Figure 9. Heatmap of percentage gains in FSS, AOAg, and KRS after KD across various teacher–student pairs and KD methods. Highlights improvements in feature and output alignment, as well as overall knowledge retention.
Ai 06 00273 g009
Figure 10. Distribution of pre-KRS and post-KRS across all task type.
Ai 06 00273 g010
Figure 11. (a) Heatmap featuring the CKA between ResNet-101 and ResNet-18 before and after KD. (b) Heatmap showing the CKA of VGG-19 and AlexNet before and after KD. The heatmap shows stronger alignment after KD.
Ai 06 00273 g011
Figure 12. (a) Heatmap for WRN-40-2 and WRN-16-1 CKA pre and post KD. (b) Heatmap for CKA of EfficientNet-B7 to EfficientNet-Lite before and after KD. The heatmap shows stronger alignment after KD.
Ai 06 00273 g012
Figure 13. CKA heatmap pre and post KD on ResNet-101 and ResNet-18 on image segmentation task. The heatmap shows stronger alignment after KD.
Ai 06 00273 g013
Figure 14. KRA at various level of α across DistilBERT, TinyBERT, and PKD.
Ai 06 00273 g014
Table 1. Data split of various datasets used in this study.
DatasetTotal ImagesTraining SetValidation SetTest Set
CIFAR-10060,00050,000500010,000
Tiny ImageNet120,000100,00010,00010,000
COCO164,000118,000500041,000
PASCAL VOC11,540807817311731
Oxford IIIT Pet7349523911051105
Table 2. Parameter compression rate of the teacher–student pair used in this study.
Teacher Model/Student ModelCompression Rate (%)
ResNet-101/ResNet-1873.71
VGG-19/AlexNet57.34
WRN-40-2/WRN-16-192.60
EfficientNet-B7/EfficientNet-Lite91.97
Table 3. Overall summary of the datasets, teacher–student pairs, and KD methods used in this study per CV task.
TaskDatasetTeacher/StudentKD Method
Image ClassificationCIFAR-100
Tiny ImageNet
Oxford-IIIT Pet
ResNet-101/ResNet-18
VGG-19/AlexNet
Vanilla KD [6],
SKD [31]
Object DetectionCOCO
PASCAL VOC
WRN-40-2/WRN-16-1
EfficientNet-B7/EfficientNet-Lite
FitNet [8],
ART [32], UET [33]
Image SegmentationOxford-IIIT PetResNet-101/ResNet-18
EfficientNet-B7/EfficientNet-Lite
VGG-19/AlexNet
WRN-40-2/WRN-16-1
GKD [34], GLD [35], CRCD [36]
Table 4. Summary of layers to where feature map will be extracted.
Teacher/StudentLayers to Capture from the TeacherLayers to Capture from the Student
ResNet-101/ResNet-18Conv2_x, Conv3_x,
Conv4_x, Conv5_x
Conv2_x, Conv3_x,
Conv4_x, Conv5_x
VGG-19/AlexNetConv1_2, Conv2_2, Conv3_4, Conv4_4, Conv5_4Conv1, Conv2, Conv3,
Conv4, Conv5
WRN-40-2/WRN-16-1Block 2, Block 3, Block 4Block 2, Block 3, Final Block
EfficientNet-B7/
EfficientNet-Lite
MBConv2_1, MBConv3_3, MBConv4_5,Corresponding MBConv blocks
Table 5. Comparison of KD methods based on gains in conventional metrics and KRS.
Lowest to Highest Ranking of KD Methods by Conventional Metrics GainLowest to Highest KRS Gainers
Vanilla KDVanilla KD
FitNetFitNet
GKDGKD
CRCDCRCD
ARTART
GLDGLD
UETUET
Table 6. Selected imbalance cases showing how KRS moderates unequal gains in feature similarity (FSS) and output agreement (AOAg) according to task-aware weights (α, β).
Exp. No.Task/DatasetKD MethodΔFSSΔAOAgWeight (α, β)Predicted ΔKRSObserved ΔKRSNote
2Classification/CIFAR-100SKD+7+36(0.3, 0.7)27.327.3AOAg-dominant (KRS tracks AOAg)
12Classification/Oxford-IIIT PetSKD+5+29(0.3, 0.7)21.821.8AOAg-dominant (KRS tracks AOAg)
14Detection/COCOART+22+12(0.7, 0.3)19.019.0FSS-dominant (KRS tracks FSS)
26Segmentation/Oxford-IIIT PetGLD+31+10(0.7, 0.3)24.724.7FSS-dominant (KRS tracks FSS)
18Detection/COCOUET+44+18(0.7, 0.3)36.236.2FSS-dominant (KRS tracks FSS)
13Detection/COCOFitNet+9+4(0.7, 0.3)7.57.5FSS-dominant (KRS tracks FSS)
Table 7. KRS of DeiT-S before and after Vanilla and SKD.
TeacherStudentKD
Method
Student
Accuracy (%)
Before KD (%)After KD (%)Difference After KD (%)
Before KDAfter KDFSSAOAgKRSFSSAOAgKRSAFSSAOAgKRS
ViT-B/16DeiT-SVanilla KD68.9773.27275445.9357462.34.3828.116.4
ViT-B/16DeiT-SSKD55.4259.64275445.9285748.34.22111.12.4
Table 8. Summary of top-1 prediction, top-3 output distribution, and corresponding retention metrics (KRS, FSS, AOAg) across teacher and student models before and after Vanilla and SKD on ResNet-101/ResNet-18 pair.
AspectT: ResNet-101S: ResNet-18
(Pre-KD)
S: ResNet-18
(Post Vanilla KD)
S: ResNet-18 (Post SKD)
Top-1 PredictionCat (92.1%)Dog (43.6%)Cat (67.4%)Cat (81.5%)
Output Distribution (Top 3)Cat, Dog, TigerDog, Cat, DeerCat, Dog, FoxCat, Dog, Tiger
KRS-42.557.769.8
FSS-323639
AOAg-476783
Table 9. Pre- and Post-KD performance of various NLP models.
ModelKD AppliedParams (M)SST-2
Accuracy (%)
FSSAOAgKRS
BERT-base (Teacher)-11093.91---
DistilBERT6No6689.310.340.470.41
DistilBERT6Yes6692.270.620.740.68
TinyBERT6No5985.780.310.420.37
TinyBERT6Yes5992.880.650.760.71
PKD6No5287.620.360.450.41
PKD6Yes5293.120.670.780.73
Table 10. Performance of student model before and after KD using FitNet on time series regression task.
ModelTrainingMAERMSER2 ScoreFSSAOAgKRS
Teacher (LSTM-128)-0.2150.2780.947---
Student (LSTM-32)Before KD0.3670.4550.8120.520.580.55
Student (LSTM-32)After FitNet0.2740.3190.9030.750.810.78
Disclaimer/Publisher’s Note: The statements, opinions and data contained in all publications are solely those of the individual author(s) and contributor(s) and not of MDPI and/or the editor(s). MDPI and/or the editor(s) disclaim responsibility for any injury to people or property resulting from any ideas, methods, instructions or products referred to in the content.