Article

Bio-Inspired Optimization of Transfer Learning Models for Diabetic Macular Edema Classification

by
A. M. Mutawa
1,*,
Khalid Sabti
2,
Bibin Shalini Sundaram Thankaleela
1 and
Seemant Raizada
2
1
Computer Engineering Department, College of Engineering and Petroleum, Kuwait University, Safat 13060, Kuwait
2
Kuwait Specialized Eye Center, Safat 13060, Kuwait
*
Author to whom correspondence should be addressed.
AI 2025, 6(10), 269; https://doi.org/10.3390/ai6100269
Submission received: 18 September 2025 / Revised: 12 October 2025 / Accepted: 14 October 2025 / Published: 17 October 2025

Abstract

Diabetic Macular Edema (DME) poses a significant threat to vision, often leading to permanent blindness if not detected and addressed swiftly. Existing manual diagnostic methods are arduous and inconsistent, highlighting the pressing necessity for automated, accurate, and personalized solutions. This study presents a novel methodology for diagnosing DME and categorizing choroidal neovascularization (CNV), drusen, and normal conditions from fundus images through the application of transfer learning models and bio-inspired optimization methodologies. The methodology utilizes advanced transfer learning architectures, including VGG16, VGG19, ResNet50, EfficientNetB7, EfficientNetV2-S, InceptionV3, and InceptionResNetV2, for analyzing both binary and multi-class Optical Coherence Tomography (OCT) datasets. We combined the OCT datasets OCT2017 and OCTC8 to create a new dataset for our study. The parameters, including learning rate, batch size, and dropout layer of the fully connected network, are further adjusted using the bio-inspired Particle Swarm Optimization (PSO) method, in conjunction with thorough preprocessing. Explainable AI approaches, especially Shapley additive explanations (SHAP), provide transparent insights into the model’s decision-making processes. Experimental findings demonstrate that our bio-inspired optimized transfer learning Inception V3 significantly surpasses conventional deep learning techniques for DME classification, as evidenced by enhanced metrics including the accuracy, precision, recall, F1-score, misclassification rate, Matthew’s correlation coefficient, intersection over union, and kappa coefficient for both binary and multi-class scenarios. The accuracy achieved is approximately 98% in binary classification and roughly 90% in multi-class classification with the Inception V3 model. The integration of contemporary transfer learning architectures with nature-inspired PSO enhances diagnostic precision to approximately 95% in multi-class classification, while also improving interpretability and reliability, which are crucial for clinical implementation. This research promotes the advancement of more precise, personalized, and timely diagnostic and therapeutic strategies for Diabetic Macular Edema, aiming to avert vision loss and improve patient outcomes.

1. Introduction

Diabetes frequently results in diabetic retinopathy (DR), a condition that impairs vision and can lead to blindness. It is a microvascular complication caused by high blood sugar levels, which damages the tiny blood vessels that are used to nourish the retina. These vessels can weaken, develop microaneurysms, or become blocked, causing the eye to grow new, fragile vessels called neovascularization. This can lead to retinal detachment and severe vision loss. Diabetes mellitus, a severe public health issue on a global scale, is primarily caused by chronic hyperglycemia. It is anticipated that the number of individuals affected by diabetes will increase to 643 million by 2030 and 783 million by 2045, from the current 537 million. DR may be experienced by patients with diabetes [1]. The number of adults suffering from blindness due to late-diagnosed retinopathy is estimated at over 93 million. Automatic DR lesion segmentation is an efficient technique to enhance screening and diagnostic efficacy.
Diabetic retinopathy lesions, characterized by hard exudates, hemorrhages, soft exudates, and microaneurysms, are discernible in color fundus photographs owing to their practicality and non-invasive nature [2]. DME, which can develop at any stage of DR, is a crucial component of the illness. DME results from the extravasation of tissue fluid from macular arteries or retinal thickening during any phase of DR. Hemoglobin Elements (HEs) typically exhibit yellow or white clusters that vary in size, shape, and arrangement. When hemorrhages occur adjacent to or on the macula, DME ensues, resulting in macular thickening and swelling, which leads to clouded vision. The macula, the central region of the retina that provides crisp, detailed central vision, swells with DME. This enlargement, which can result in impaired vision and make it difficult to read and recognize faces, is brought on by fluid escaping from damaged blood vessels. The macula, which is crucial for detailed vision, is a region around the fovea with a diameter equivalent to that of the optic disc (OD). Glaucoma, the foremost cause of preventable blindness, impacts approximately 70 million individuals globally and is anticipated to affect 112 million by 2042. Timely identification and intervention are crucial to avert additional progression of DME and vision impairment. Manual grading of DME is laborious and susceptible to errors, resulting in issues such as inconsistent assessment standards, sluggish detection rates, and elevated workload intensity. The scarcity of ophthalmologists and the reliance on manual grading hinder the screening of DME in extensive populations. Screening is advised for early identification and intervention; nonetheless, it presently necessitates a clinical assessment together with quantitative functional and structural evaluations. An economical instrument for glaucoma detection could broaden screening accessibility to a more extensive patient demographic.
Modern imaging tools like OCT help identify unique layers in the retina and diagnose retinal features [3]. OCT is a primary modality employed to identify macular edema in DR [4]. Ophthalmic medicine has advanced OCT technology as a diagnostic instrument, yielding high-resolution retinal images. Computer-aided diagnosis (CAD) methodologies have proven beneficial in the automated classification of retinal OCT images [5]. DR and DME detection systems have been enhanced by advancements in artificial intelligence and digital imaging. Nevertheless, conventional methodologies are costly, time-consuming, and subject to subjective interpretation. An automated approach has been developed to assist physicians in grading DME, thereby mitigating the danger of irreversible vision impairment in patients [6]. Retinal fundus photography is also a recognized diagnostic instrument for ocular illnesses, facilitating the assessment of pathological characteristics of the retina and optic nerve head [7]. Deep learning techniques have been used to achieve automatic DR and DME detection; however, most of these approaches are engineering-focused. These algorithms make the far-fetched clinical demand that the distribution of training retinal images is the same as that of inference images. In medicine, these techniques are being introduced to improve the speed and efficiency of disease diagnosis and treatment. Each of the AI techniques presented in the paper is supported with an example of a possible medical application. Given the rapid development of technology, the use of AI in medicine shows promising results in the context of patient care. It is particularly important to keep a close eye on this issue and conduct further research in order to fully explore the potential of ML, ANNs, and DL, and bring further applications into clinical use in the future.
The major contribution of this study includes
  • We have developed an innovative dataset by amalgamating the OCT 2017 and OCTC8 public datasets. This aids in comprehending the study’s generalizability.
  • The parameters, such as learning rate, batch size, and dropout layer of the fully connected network, are further optimized using the Particle Swarm Optimization (PSO) approach, with comprehensive preprocessing.
  • The methodology employs sophisticated transfer learning architectures, such as VGG16, VGG19, ResNet50, EfficientNetB7, EfficientNetV2S, InceptionV3, and InceptionResNetV2, for the examination of binary and multi-class OCT datasets.
  • Explainable AI methodologies, particularly SHAP, offer clear insights into the decision-making processes of the model.

2. Literature Review

2.1. Diabetic Retinopathy

Identifying risk variables for DR and creating machine learning (ML)-based predictive models from routine laboratory data in individuals with type 2 diabetes mellitus [8]. The classification and regression tree (CART) model is the analytical instrument to discover clinical indicators that evaluate the risk factors for diabetic retinopathy (DR) and to ascertain the principal risk variables linked to DR [9]. Radial Basis Function Networks, Multilayer Perceptrons, Recurrent Neural Networks, Bag of Visual Words, and Convolutional Neural Networks are used by researchers in Ref. [10]. The model used by Rajeshwar et al. [11] utilizes ResNet50, InceptionV3, and VGG-19 for the extraction and classification of essential characteristics from retinal pictures. The system employs decision trees, K-nearest neighbors, support vector machines, and convolutional neural networks, utilizing a hybrid attention-based stacking ensemble to improve accuracy. The approach attains an accuracy of 99.768%.SegDRoWS is a comprehensive multi-scale feature fusion network designed to improve the accuracy of diabetic retinopathy (DR) segmentation proposed by Liu et al. [2].
Authors Lin et al. and Dou et al. [12] present a deep learning framework for assessing Diabetic Retinopathy utilizing multi-view fundus pictures. It presents a trainable retinal vascular reinforcement block and a cross-view spatial region aligning the vision transformer (ViT) to collect spatial correlations. In the feature space, the author has gathered photographs from the same domain rather than those of the same grade. This affects the ability of deep learning models to generalize. The authors propose a global-aware channel similarity to mitigate the effect of lesion location and size. A grade-aware contrastive learning technique is proposed to guide the acquisition of domain-invariant features. Clinical information from 4259 type 2 diabetic mellitus (T2DM) patients at Beijing Tongren Hospital was examined in this study. A prediction model was created using the Extreme Gradient Boosting (XGBoost) technique and compared to four other algorithms. With an F1-score of 0.752, sensitivity of 0.754, specificity of 0.759, accuracy of 0.757, and AUC of 0.831, the XGBoost model outperformed the others. Clinicians can use this approach to identify high-risk patients and inform individualized treatment plans [8]. We examined a deep learning model’s capacity to identify central retinal artery occlusion (CRAO) utilizing OCT data from two German institutions. The model was trained via a nested multiclass five-fold cross-validation classification framework, categorizing patients with CRAO into three groups [13].
The study by Tan-Torres et al. sought to evaluate the efficacy of deep learning systems (DLSs) for DR in younger populations, who frequently exhibit anatomical variations such as pronounced retinal sheen. The research encompassed 321 individuals aged 18 to 25, concentrating on DME [14]. A hybrid approach using the Quantum Chimp Optimization Algorithm (QCOA) and SqueezeNet to improve DR classification accuracy is used, and the method involves feature extraction and classification, with QCOA optimizing SVM parameters. The approach achieves classification accuracy, sensitivity, and specificity rates of 99.80%, 99.90%, and 100%, enhancing patient outcomes [15].

2.2. Diabetic Macular Edema

The authors Zubair et al., in their paper, present an effective approach for the early identification and staging of DME, utilizing enhanced picture relative subtraction, Gabor wavelet filtering, and sophisticated fuzzy c-means clustering algorithms. The model attains average accuracies of 96.17%, 98.60%, 97.85%, and 98.80% for optic disc recognition, fovea localization, exudates segmentation, and DME classification, respectively [16]. A novel lesion-based CNN algorithm is proposed for the efficient detection of DME, improving prediction accuracy. The model outperforms other deep learning models, with an accuracy of 96% compared to ResNet, VGG16, and Inception [17]. This article reviews the innovation in AI, companies producing technologies, and studies that have provided data to guide the use of AI in treating patients with DME. AI, machine learning, and deep learning are different concepts, with AI focusing on tasks mimicking human intelligence, machine learning allowing computers to learn independently, and deep learning using multilayered artificial neural networks (ANNs [18]). The writers in this paper introduce a method called Squeeze-and-Excitation embedded DenseNet121 (SEDense) to classify DME grades with 88.35% accuracy, outperforming other models and reducing the workload for ophthalmologists in diagnosing DME grades [19]. This study presents a novel end-to-end architecture that integrates ResNet50 with channel attention to enhance efficiency and accuracy, without incorporating lesion segmentation or simplifying the grading assignment. The suggested network demonstrates elevated accuracy, specificity, sensitivity, and F1 score, with experimental findings indicating superior performance [20]. Researchers in the work sought to develop an AI system to facilitate ophthalmology referrals for individuals with diabetic macular edema. A deep fusion model was built for the classification of DME and the identification of hard exudates, utilizing 35,001 fundus pictures from Taiwan. The model was assessed utilizing a private dataset and an anatomical landmark detector, amalgamating the two on an edge device with constrained computational resources [21].
The study introduced by Kumar et al. applies a transfer learning approach for the identification of DME instances using retinal fundus pictures. A pre-trained DenseNet121 is employed to extract feature vectors from fundus pictures, which are subsequently input into a classification layer. The model was trained using 577 fundus images across three diabetic macular edema classes and validated with 103 testing photos [22]. Ensemble methods for DR classification, utilizing pre-trained model weights and data augmentation strategies used by Nida et al. The three-layer classifier employs dropout and ReLU activation to mitigate overfitting and efficiently extract features. The Quadratic Weighted Kappa metric is emphasized for precise diagnosis, attaining exceptional QWK scores in the Eyepacs, Aptos, and Messidor datasets [23]. The relationship between DME localized features and point-wise retinal sensitivity (RS) using microperimetry and deep learning-based automated quantification on OCT scans. Results showed that stimuli with intraretinal fluid (IRF) and ellipsoid zone (EZ) thickness significantly decreased RS compared to areas without DME [24].

2.3. Glaucoma Detection

Deep learning methods are applied in the paper [25] for the detection of glaucoma. Attention-based Dilated Hybrid Network (ADHNet) is used for detection, while Trans-Mobile Net with a novel loss function is used for segmentation. This approach outperforms traditional methods with a 94% accuracy rate. Early detection of eye illnesses improves treatment results, and trustworthy options for managing eye health are offered. A DL algorithm has been developed to detect referable GON in color fundus images, with higher sensitivity and specificity than eye care providers. The algorithm’s performance on an independent dataset supports its predictions. This could improve clinical decisions, reduce undiagnosed patients, and intervene before permanent vision loss occurs in underserved populations worldwide [7].

2.4. Pre-Processing Methods

Rescaling pixel values to normalize image data [26] presented by Ikram et al. produced a model accuracy of 93% using the ResViT Fusion net model. Pre-processing of data is proposed by Navaneethan et al. to attenuate image variation, convert intensities, denoise, and enhance contrast in the fundus images [27]. A preprocessing approach based on MAP-estimated local region filtering was proposed by Muthuswamy et al. in [28]. Contrast-limited adaptive histogram equalization and Gaussian filtering adapted by Fu et al. [29]. Artificial Bee Colony Optimization was applied by the authors for image segmentation [30]. Adaptive histogram equalization and histogram equalization models execute the preprocessing of fundus images [31]. Researchers Berbar et al. applied histogram equalization and a median filter to the image dataset. Subsequently, contrast-limited adaptive histogram equalization is executed, followed by the application of the unsharp filter [32]. The local binary pattern (LBP) preprocessing method was adopted by Pan et al. in [33]. Green channel conversion, CLAHE, and Gaussian filtering (GF) applied by author DS, R et al. [34].

2.5. Feature Extraction

SegDRoWS is a comprehensive multi-scale feature fusion network designed to improve the accuracy of DR segmentation. The system comprises a three-stage encoder, a detail-preserving inter-stage feature fusion block, an edge guidance branch (EGB), and a lightweight decoder. The IMFF encoder investigates intra-stage multi-scale characteristics, but the DIFF block maintains details and facilitates inter-stage feature fusion. SegDRoWS attains unprecedented results on three public datasets with only 2.27 million parameters [2]. This study by Fu et al. [20] presents a novel end-to-end architecture that integrates ResNet50 with channel attention to enhance efficiency and accuracy, without incorporating lesion segmentation or simplifying the grading assignment. The suggested network demonstrates elevated accuracy, specificity, sensitivity, and F1 score, with experimental findings indicating superior performance. Different feature extraction methods, such as Adaptive iso map [35], Force-Invariant Improved Feature Extraction [36], Concordance Correlative Regression [28], wavelet-based Chimp optimization algorithm (WBCOA) [37], are some feature extraction methods applied in the research studies.

2.6. Deep and Machine Learning Models

This study by Sushith et al. suggests the use of an Attention Dual Transformer with Adaptive Temporal Convolutional (ADT-ATC) model to identify DR in retinal fundus images. The model incorporates temporal dependencies and processes multi-scale spatial features. In comparison to conventional deep learning models, experiments demonstrate enhanced performance with 98.2% accuracy on DRIVE and 97.7% accuracy on DR datasets [38]. The article by Sunil et al. [10]. presents an efficient categorization of DR models with diverse prediction algorithms, including Radial Basis Function Networks, Multilayer Perceptron, Recurrent Neural Networks, Bag of Visual Words, and Convolutional Neural Networks. Nonetheless, deep-learning algorithms frequently necessitate substantial quantities of labeled data, which can be costly and labor-intensive to acquire. The Shape Adaptive Box Linear Filtering-based Gradient Deep Belief Network Classifier (SAGDEB) model seeks to enhance the accuracy of DR identification. The model has three phases: pre-processing, feature extraction, and classification. The SAGDEB model uses a retinal image dataset and a Tversky similarity index to evaluate retrieved features. The model attains a superior 6% PSNR, 5% DR detection accuracy, a reduced 46% error rate, and a 13% decrease in DR detection time relative to previous methodologies [35]. An Adaptive Gabor Filter (AGF) that is based on the Chaotic Map [1]. Work by Rajesjwar et al. introduces a hybrid model that integrates image processing techniques with deep learning algorithms to identify diabetic retinopathy (DR) at an early stage. The model employs a hybrid attention-based stacking ensemble to improve accuracy, as well as ResNet50, InceptionV3, and VGG-19 for feature extraction and classification. The system achieves an accuracy of 99.768% when assessed using metrics such as the confusion matrix, accuracy, and ROC curve [11].
A deep learning model utilizing Swin Transformer V2 is suggested for the early diagnosis of OCT images. The model employs self-attention, the PolyLoss function, and heat maps to enhance accuracy. The model attained 99.9% accuracy on OCT 2017 and 99.5% on OCT-C8, demonstrating efficacy in the automatic classification of several fundus disorders [5]. To analyze these images, a deep learning method called FunSwin is proposed, using the Swin Transformer framework and integrating transfer learning and data enhancement strategies. Experiments show FunSwin outperforms other methods in binary and multiclass classification tasks [6].
The study by Jakub Kufel et al. presents an insight on ML, ANNS, and DL AI in medicine. ML involves the application of algorithms to automate decision-making processes using models that have not been manually programmed but have been trained on data. ANNs that are a part of ML aim to simulate the structure and function of the human brain. DL, on the other hand, uses multiple layers of interconnected neurons. This enables the processing and analysis of large and complex databases [39].

2.7. Optimization Methods

The classification phase incorporates the Attention layer, the dense block of DenseNet, and the Optimized Gated Recurrent Unit (OGRU), utilizing a Self-Adaptive Northern Goshawk Optimization (SANGO) method to improve classification efficacy [1]. Fundus image grading was performed by Fuzzy probabilistic C-ordered means, and the hyperparameters of the model AlexNet were improved by the Nutcracker optimizer, Deep feed forward neural [40] by the researchers [34]. Multi-head self-attention Gated Graph Convolutional Networks utilizing the Binary Chimp Optimization Algorithm for DR Detection (DRD-MHSAGGCN-BCOA) aimed at classifying diabetic retinal images [36]. Quantum Chimp Optimization Algorithm (QCOA) integrated with SqueezeNet applied in [15] for improving accuracy. Weight allocation is accomplished through a Differential Evolution Optimization (DEO) method grounded in an Evolutionary Algorithm [41]. Modified Generative Adversarial-based Crossover Salp Grasshopper (MGA-CSG) [27], Gazelle Optimization (GO) [42], Red Fox optimization (deep LSTM-RFO) algorithm [31]. Discrete migratory bird optimizer [43], and grasshopper optimization [44] the approach applied by the researchers to improve accuracy. Red Deer optimization algorithm (MRDOA) presented by the researchers Reddy et al. for the optimal feature selection [45]. Minji et al. applied a Gray wolf optimizer to optimize the convolutional neural network [46]. Khaparde used a Spiral bacterial colony optimization algorithm for optimizing features within the U-net. Table 1 shows the analysis of different models.

3. Methodology

This block diagram in Figure 1 depicts a comprehensive workflow for a medical image classification system, intended to classify retinal images. The procedure commences with Input Data, generally unprocessed OCT images, which are subjected to Pre-Processing to standardize image dimensions and normalize pixel values, hence assuring uniformity for the ensuing stages. The curated dataset is systematically partitioned into Training, Validation, and Testing datasets, a conventional procedure for constructing, refining, and objectively assessing the model. The system’s foundation is the transfer learning models and PSO, demonstrating a sophisticated methodology that utilizes transfer learning concepts for feature analysis and classification judgments. The resultant classification outputs are meticulously evaluated utilizing diverse performance metrics, including accuracy, precision, recall, F1-score, Matthew’s correlation coefficient, Kappa coefficient, and Misclassification rate, to measure the model’s efficacy. The system ultimately produces a Binary Class output, distinctly categorizing the input image as either “DME” or “Normal”, and a multiclass output categorizing NORMAL, CNV, DME, and DRUSEN, offering direct diagnostic support.

3.1. Data Collection

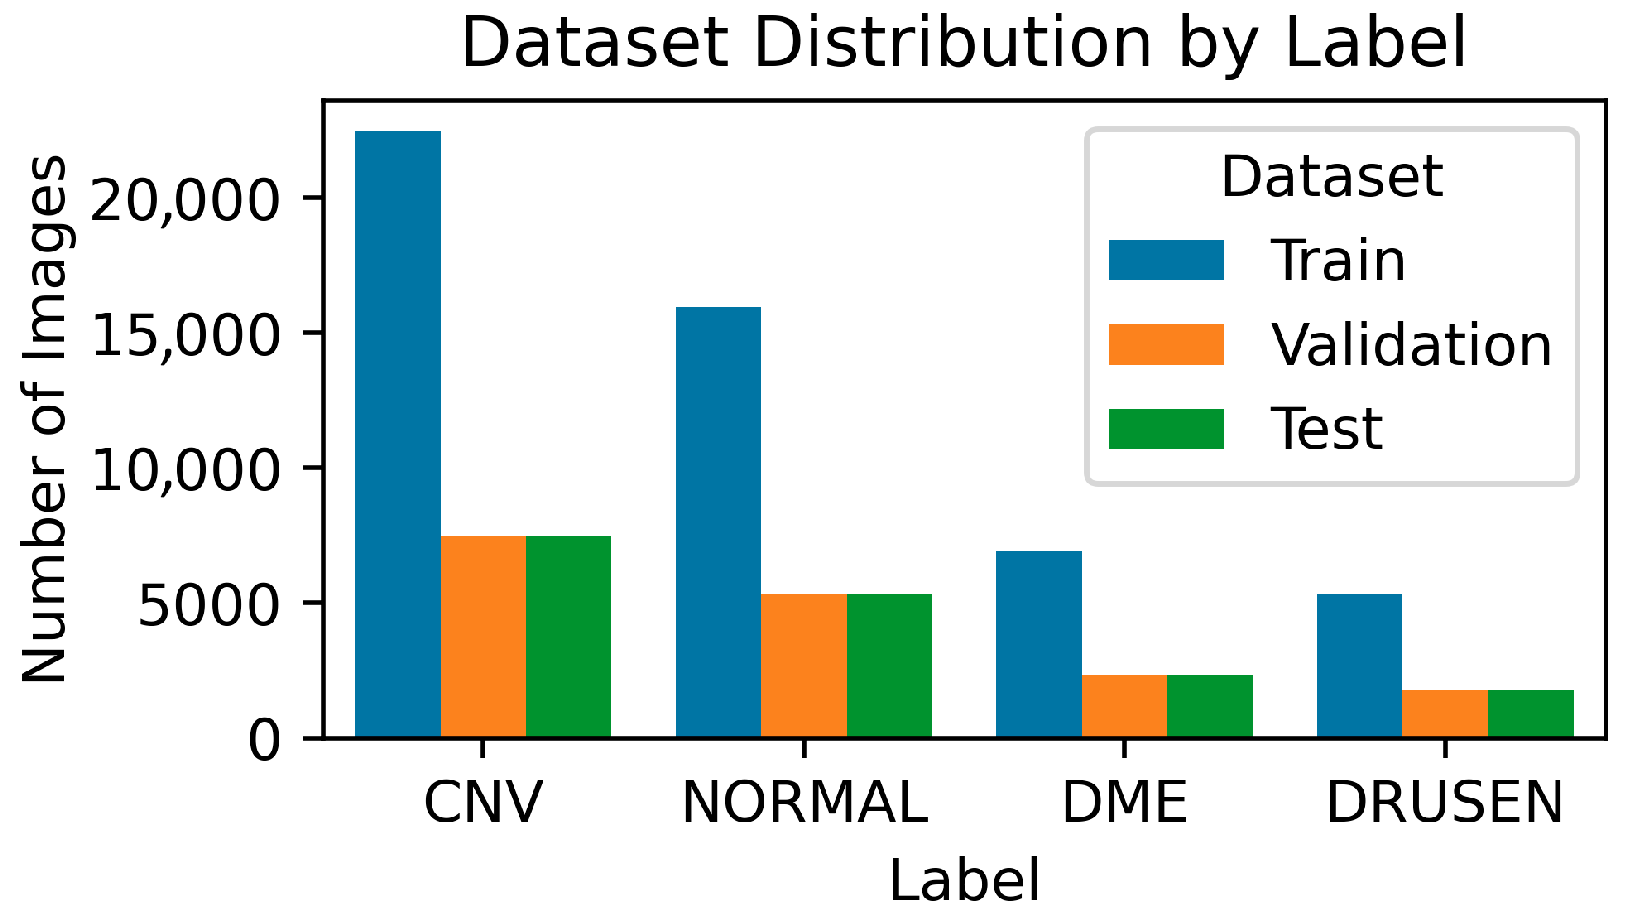
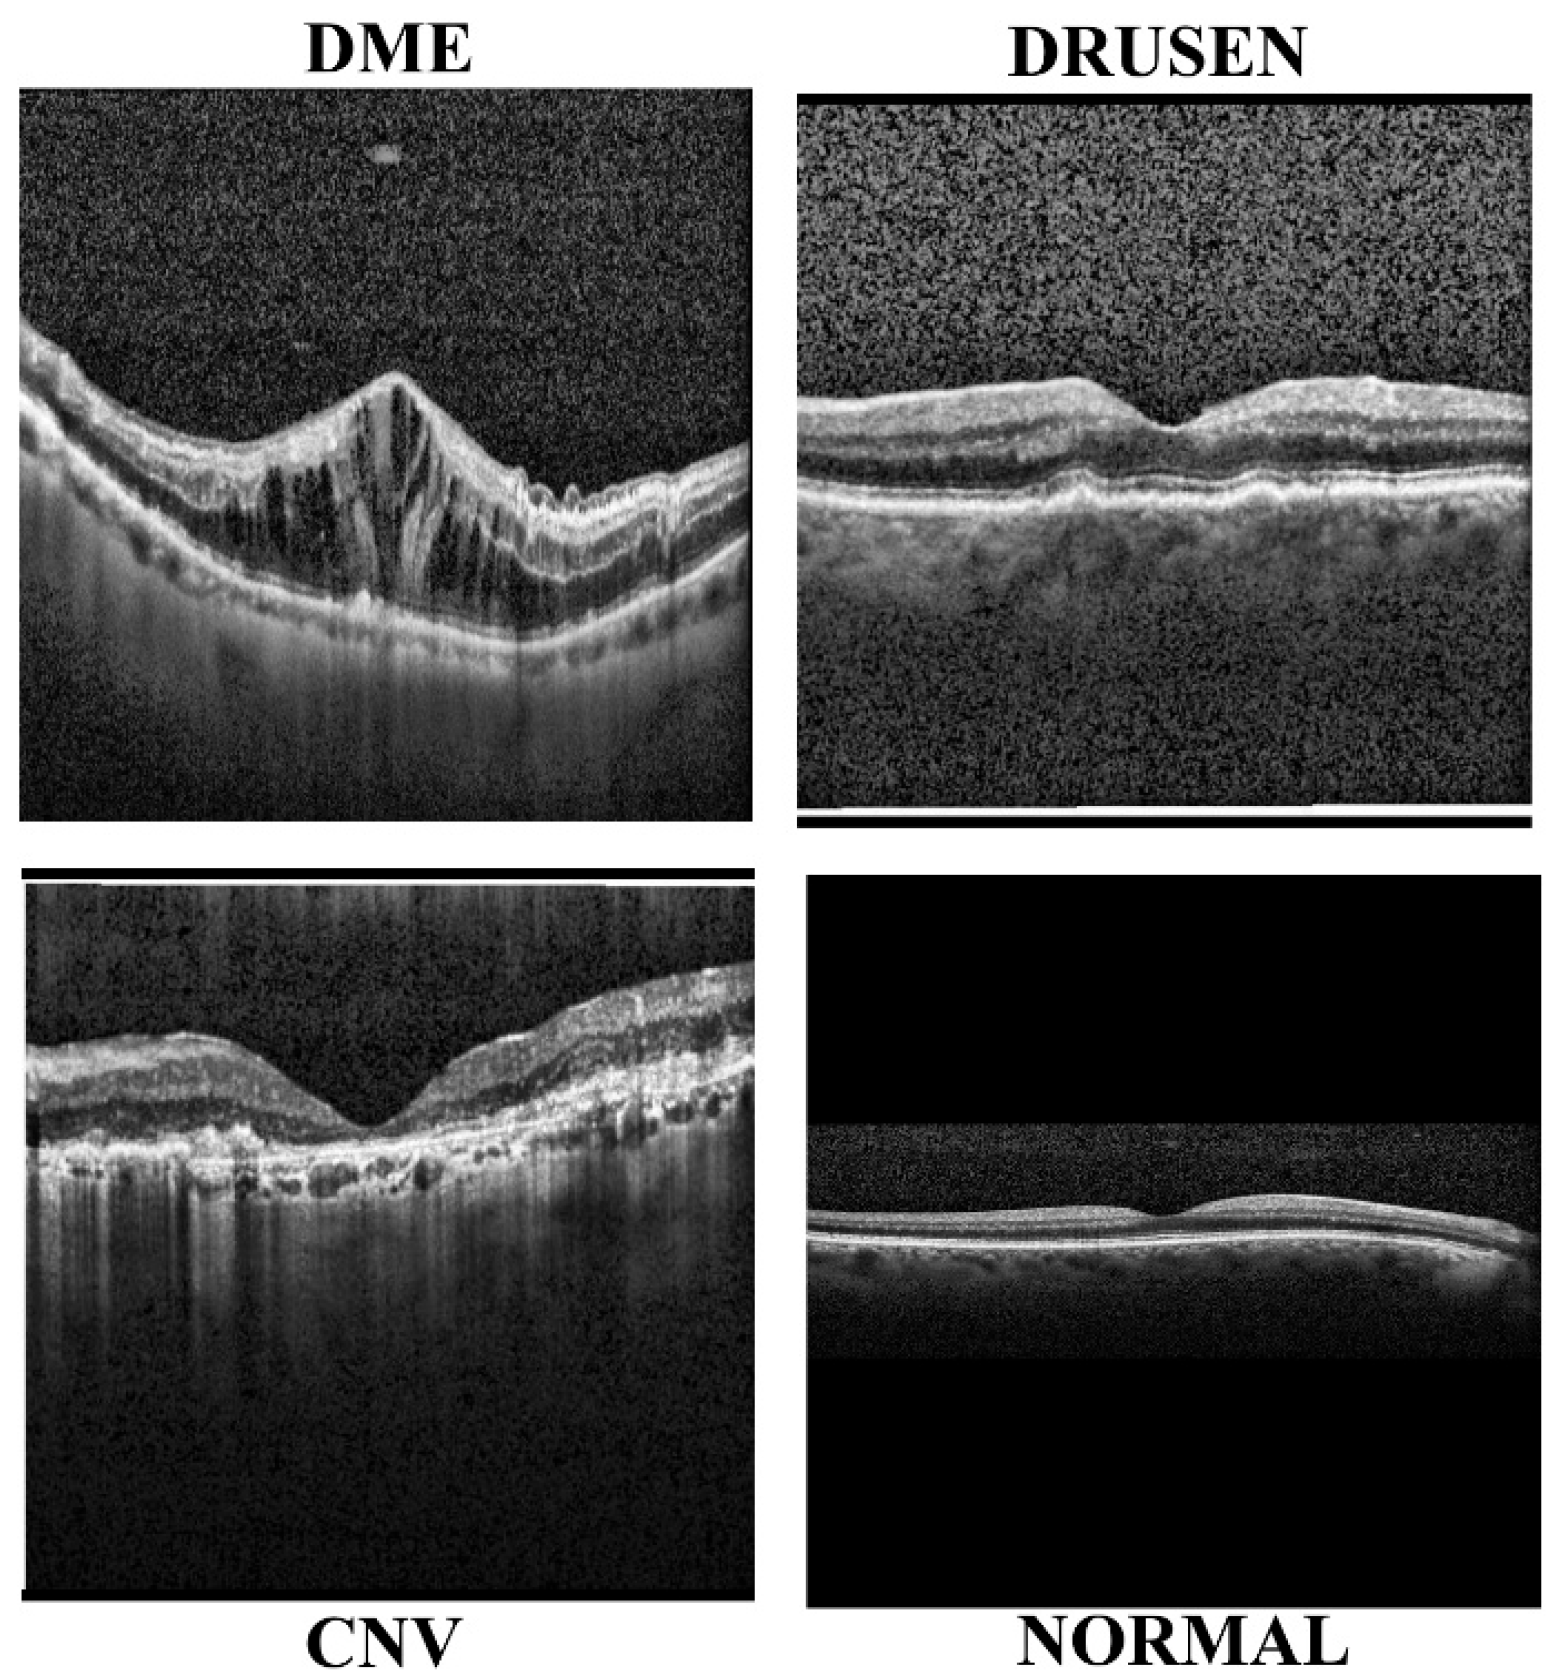
OCT is an imaging modality employed to obtain high-resolution cross-sectional images of the retinas in living subjects. The dataset is structured into three directories (train, test, val) and includes subdirectories for each image category (NORMAL, CNV, DME, DRUSEN). There exist 84,495 X-ray images (JPEG) categorized into four groups: NORMAL, CNV, DME, and DRUSEN. OCT images (Spectralis OCT, Heidelberg Engineering, Heidelberg, Germany) were chosen from retrospective cohorts of adult patients at the Shiley Eye Institute of the University of California San Diego, the California Retinal Research Foundation, Medical Center Ophthalmology Associates, Shanghai First People’s Hospital, and Beijing Tongren Eye Center from 1 July 2013 to 1 March 2017. Approximately 30 million OCT scans are conducted annually, and the analysis and interpretation of these images require considerable effort [47]. The Dataset Distribution by label in the bar chart in Figure 2 offers a clear depiction of the image count for four specific medical conditions. This chart is essential for understanding the dataset’s composition and inherent class distribution biases. The analysis is based on the mentioned database, and we have also combined the OCT2017 Figure 2 and OCTC8 [48] Figure 3 datasets for our work. The sample class images are shown in Figure 4.
A NORMAL OCT scan serves as the baseline, with a smooth, deep foveal pit, intact and clearly delineated retinal layers, which include the ELM and EZ, and no fluid or aberrant thickening. Pathological states are distinguished by the type and location of fluids or deposits. CNV, which is related to Age-Related Macular Degeneration, is defined as active leakage that results in the presence of intra-retinal fluid (IRF) or subretinal fluid (SRF), which is frequently accompanied by a neovascular complex or a Pigment Epithelial Detachment (PED). DME, a diabetes consequence, is distinguished by diffuse retinal thickness and the appearance of numerous large or small cystoid pockets filled with fluid (IRF) in the macula. Finally, DRUSEN, which stands for dry Age-Related Macular Degeneration, is defined by focal, dome-shaped deposits of material located specifically beneath the Retinal Pigment Epithelium (RPE) layer, while the retina retains its normal structure and is free of significant fluid accumulation.

3.2. Model Architecture

3.2.1. DenseNet121

The DenseNet121 design, part of the Densely Connected Convolutional Networks family, was chosen for its novel “dense connectivity” structure. This architecture allows each layer to obtain feature maps from all prior layers within its dense block, facilitating feature reuse and markedly mitigating the vanishing gradient issue. This architecture consists of several dense blocks linked by transition layers that execute downsampling. The principal advantages are its remarkable parameter efficiency and improved feature propagation, rendering it particularly successful for applications necessitating a profound comprehension of hierarchical features while preserving a relatively compact model size.

3.2.2. MobileNetV2

MobileNetV2 was selected as a lightweight and efficient model, specifically engineered for mobile and embedded vision applications with severely limited computational resources. The fundamental innovation is the implementation of depth-wise separable convolutions and “inverted residual blocks.” These blocks initially augment the feature dimensions by point-wise convolution, subsequently employ depth-wise convolution, and finally reduce the features to a smaller dimension, frequently utilizing a linear bottleneck. This architecture markedly decreases computational expense and memory usage relative to conventional convolutions, facilitating efficient inference on resource-constrained systems without substantially sacrificing accuracy.

3.2.3. VGG16

The VGG16 model, a seminal design in convolutional neural networks, was incorporated as a classic and resilient baseline. Renowned for its simplicity and consistency, VGG16 comprises layers of modest 3 × 3 convolutional filters succeeded by 2 × 2 max-pooling layers, which progressively diminish spatial dimensions while augmenting channel depth. Although it has greater computational requirements and a higher parameter count than contemporary architectures, its extensive array of small convolutional filters enables the acquisition of intricate, hierarchical features, rendering it a dependable option for transfer learning owing to its robust feature extraction abilities pre-trained on ImageNet.

3.2.4. VGG19

Like VGG16, the VGG19 architecture is a more profound variation, comprising 19 layers with a greater quantity of convolutional blocks and layers. It adheres to the notion of employing consistent 3 × 3 convolutional filters across the network, hence fostering a uniform architecture. The augmented depth relative to VGG16 enables the capturing of more intricate feature representations. VGG19 enhances VGG16’s core strengths and generalizability in feature extraction, providing slight performance improvements in certain applications, albeit this comes with increased computational complexity and memory requirements.

3.2.5. ResNet50

The ResNet50 model was selected for its capacity to train exceptionally deep neural networks, a significant advance facilitated by the incorporation of “residual connections” or “skip connections”. These connections facilitate the direct transmission of gradients through the network by circumventing one or more layers, so effectively alleviating the vanishing gradient issue in extremely deep topologies. ResNet50 consists of several residual blocks, each executing feature transformation and subsequently adding the block’s input to its output. This design facilitates the creation of highly precise models, rendering ResNet50 a prevalent and high-performing option for diverse computer vision applications.

3.2.6. EfficientNetB7

EfficientNetB7 is the largest and most precise variation in the EfficientNet family, characterized by its systematic “compound scaling” approach. This method consistently adjusts network depth, width, and input resolution through a predetermined set of scaling coefficients identified by a neural architecture search. EfficientNetB7 exhibits remarkable accuracy on ImageNet while achieving a superior balance of computational economy and parameter count relative to other leading models with comparable performance. The architecture emphasizes the optimization of accuracy within a specified resource allocation, rendering it appropriate for rigorous picture classification contexts.

3.2.7. EfficientNetV2S

EfficientNetV2S is a recent advancement within the EfficientNet lineage, specifically refined for accelerated training and enhanced performance across many workloads. It expands on the principles of compound scaling while integrating training-aware neural architecture search and introducing Fused-MBConv blocks in its initial phases. These fused blocks substitute depthwise/pointwise convolutions with a singular dense layer, resulting in expedited training durations while preserving competitive accuracy and parameter efficiency. EfficientNetV2S achieves an optimal equilibrium among model size, inference velocity, and classification efficacy, presenting a formidable choice for practical implementations.

3.2.8. InceptionV3

InceptionV3 is a distinguished convolutional network recognized for its novel “Inception modules”, which facilitate the execution of convolutions with various filter sizes (1 × 1, 3 × 3, 5 × 5) and pooling operations concurrently within a single layer. This enables the network to simultaneously record patterns at various scales. Significant architectural enhancements encompass the decomposition of bigger convolutions to diminish computing expenses and the incorporation of auxiliary classifiers to enhance gradient propagation in the deeper sections of the network. InceptionV3 offers an optimal combination of improved accuracy and computing efficiency for intricate picture recognition jobs. Performance parameters mentioned in Table 2.

3.3. Biological Optimization: Particle Swarm

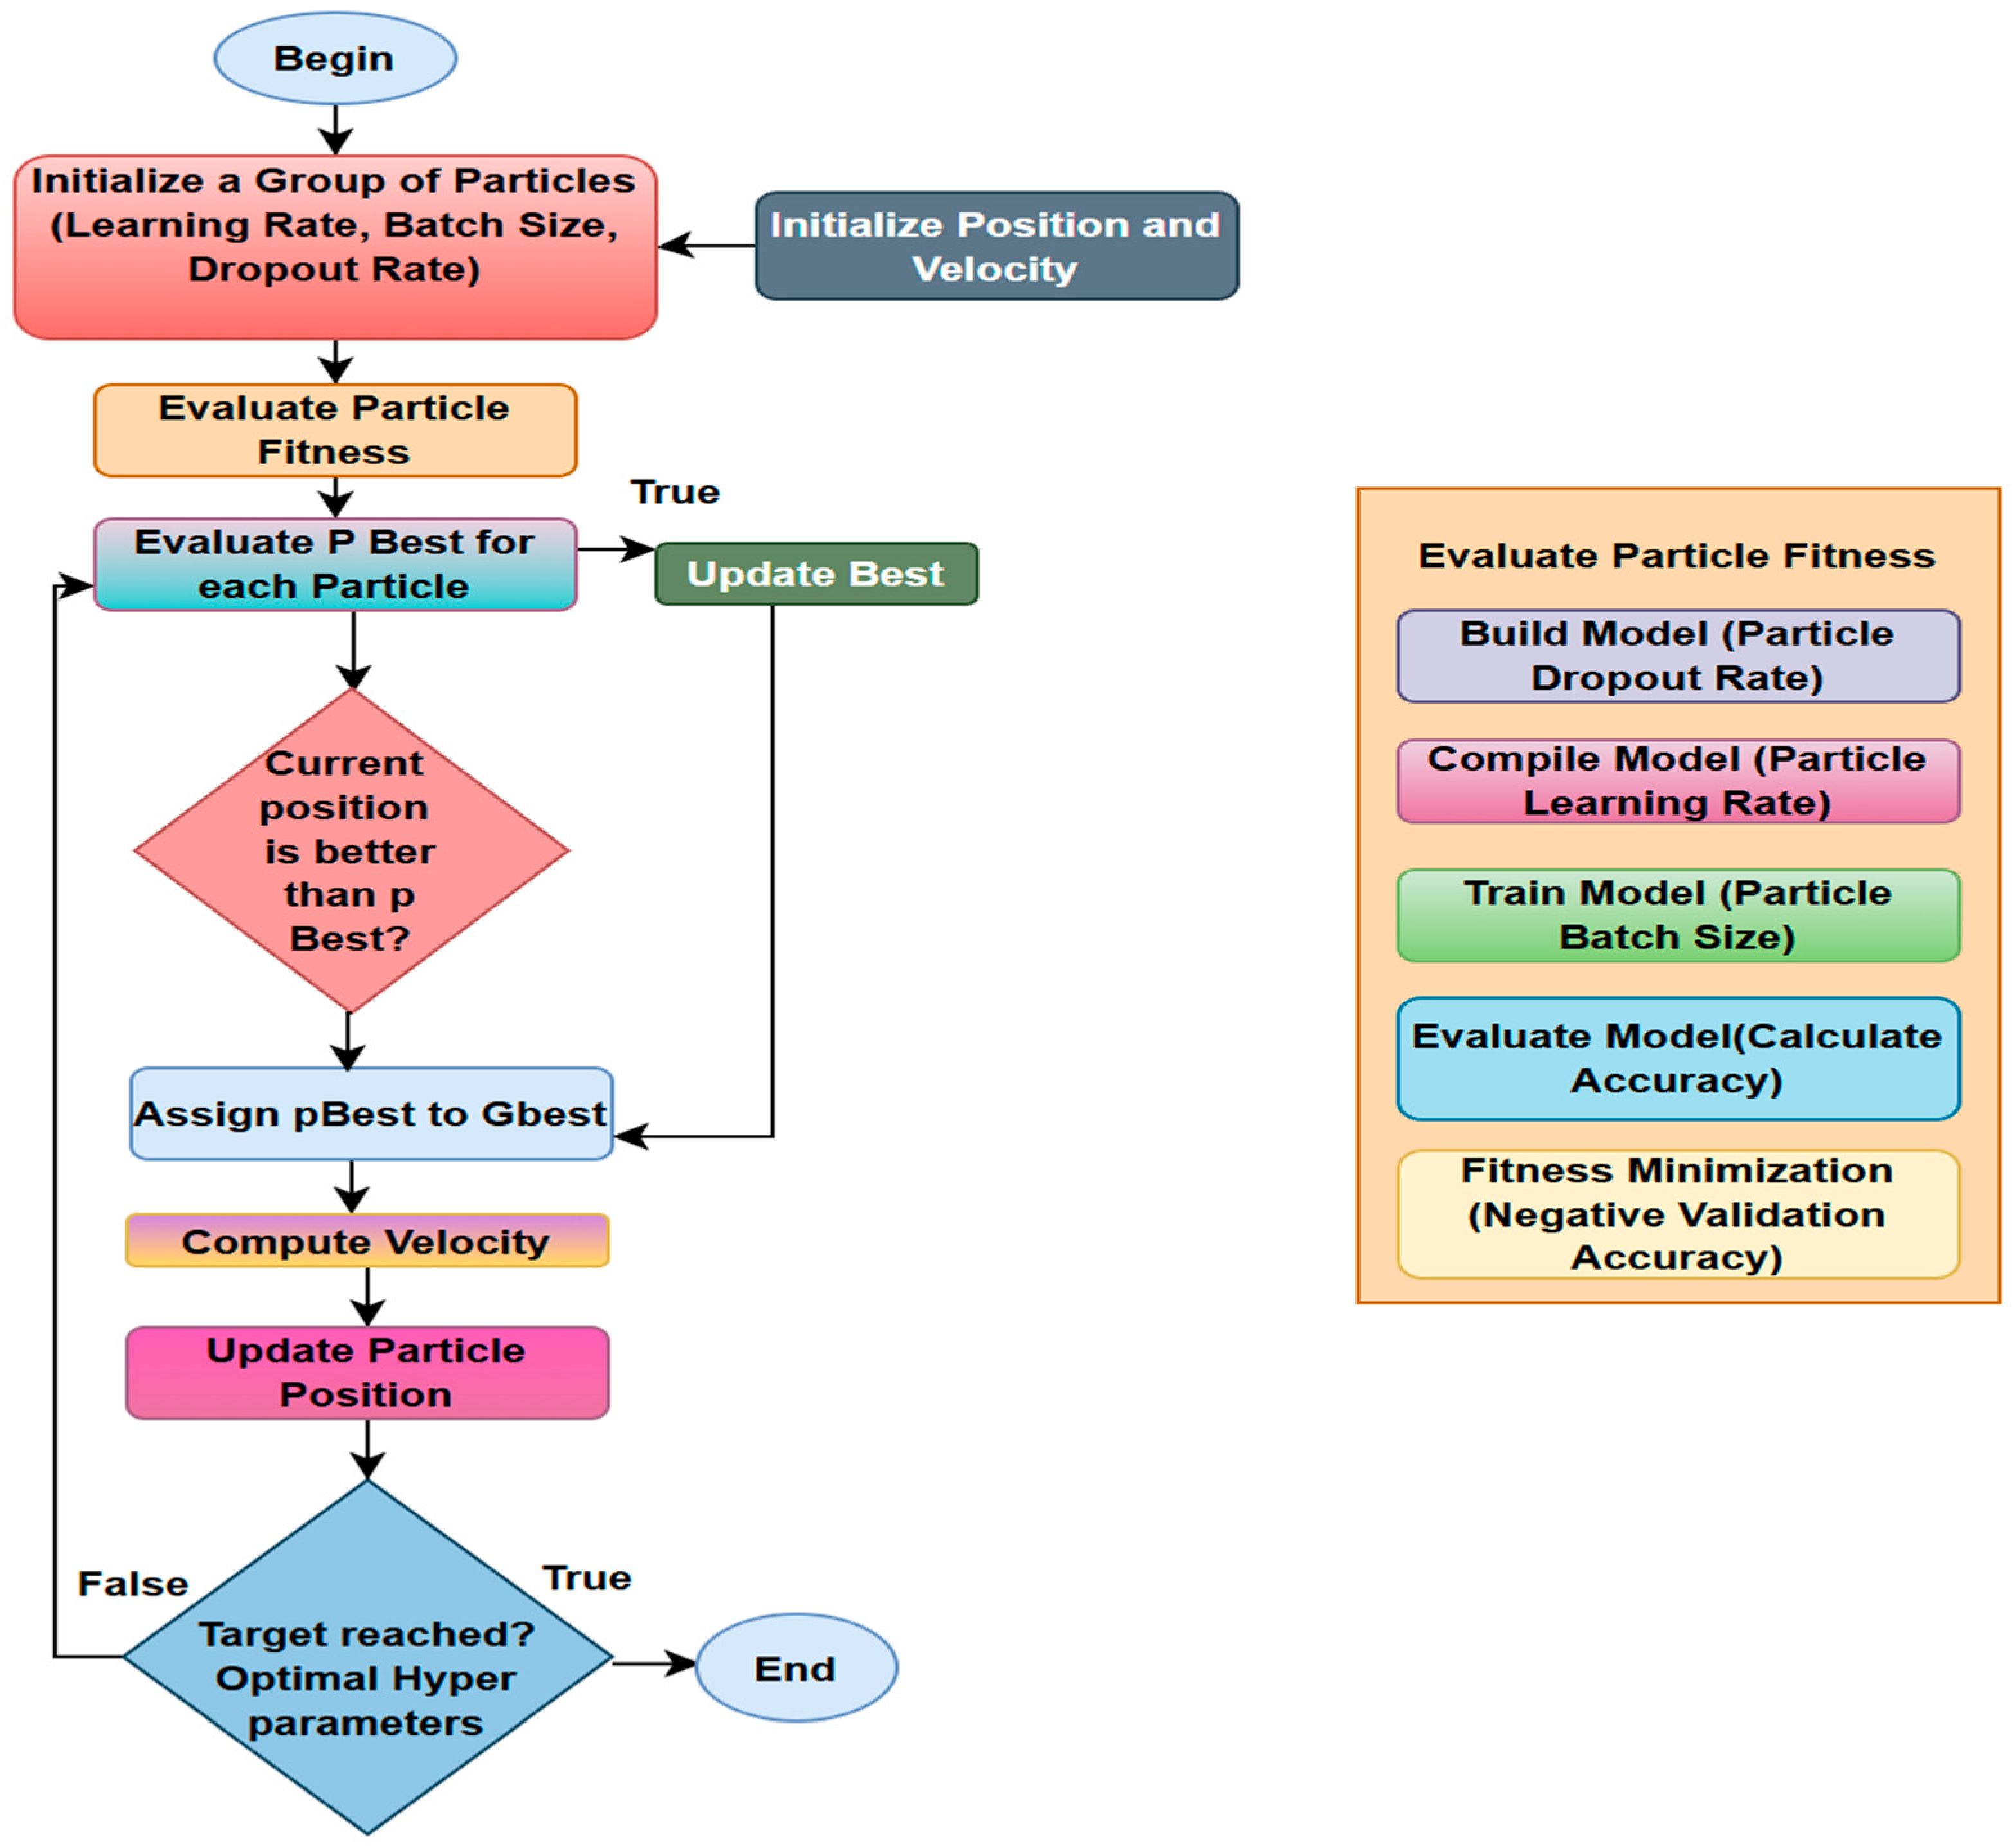
PSO is a robust metaheuristic commonly utilized in DME investigation to improve automated diagnostic systems. PSO is a stochastic, population-based metaheuristic method that excels at optimizing the hyperparameters of machine and deep learning models [49]. Every particle in the swarm signifies a distinct candidate solution, comprising a combination of the model’s adjustable hyperparameters [50]. The optimization process begins with the initialization of a swarm, where a certain number of particles is randomly distributed within the hyperparameter search space. We have utilized batch size, dropout, and learning rate as our tuning parameters. The fundamental mechanism of the PSO algorithm functions iteratively across a predetermined number of generations, with each particle’s fitness assessed through the application of an objective function. The goal function is essential for connecting the PSO method with the performance of the machine learning model. The model is configured with the particle’s hyperparameter settings and is trained using the training dataset. The model’s performance is assessed on an independent validation dataset with a selected metric, and the objective function yields a singular scalar value indicative of the model’s performance. Upon assessing the fitness of each particle, the algorithm modifies two critical parameters, the personal best position (p_best) and the global best position (g_best). Particles modify their velocities and placements in the search space for the subsequent iteration, driven by inertia, cognitive factors, and social factors. This iterative process, propelled by individual learning and social collaboration, allows the swarm to effectively navigate the hyperparameter space and converge on an optimal hyperparameter configuration for the machine learning model.
Equation (1) represents the velocity equation, wherein each particle in the swarm modifies its velocity based on the calculated values of the individual and global optimal solutions, as well as its present position. The coefficients of c1 and c2 represent acceleration factors about individual and societal dimensions. They are referred to as trust parameters, with c1 representing the degree of self-confidence a particle possesses and c2 representing the degree of confidence a particle has in its neighbors. Alongside the random variables r1 and r2, they delineate the stochastic impact of cognitive and social behaviors.
v i t + 1 = v i t I n e r t i a + c 1 r 1 p b e s t i t p i t P e r s o n a l   i n f l u e n c e + c 2 r 2 g b e s t t p i t S o c i a l   i n f l u e n c e
The second Equation (2) represents the position equation, wherein each particle adjusts its position based on the newly computed velocity.
p i t + 1 = p i t + v i t + 1
The characteristics of position and velocity are interdependent; velocity is contingent upon position and vice versa. The flow diagram of PSO is shown in Figure 5.
  • Initialize: Generate a swarm of particles, each representing a random set of hyperparameter values. Set each particle’s best position (pBest) as well as the swarm’s overall best location (gBest). Evaluate by training the model and calculating the fitness function, which is the validation loss for each particle’s parameter set.
  • Update: Update pBest if the particle’s current position is superior. Update gBest if one of the particles’ pBest is the best overall.
  • Move: Each particle adjusts its velocity and position in response to its pBest and the swarm’s gBest.
  • Stop: Repeat until the maximum number of iterations is achieved or gBest no longer improves. The final gBest represents the optimal parameter set.
PSO algorithm, executed using the pyswarm library, depends on certain essential parameters to direct its search for optimal solutions. These parameters regulate the behavior of the particle swarm as it navigates the hyperparameter space. The objective function delineates the target for the PSO, which is to minimize negative validation accuracy to increase real accuracy. The lb and ub arrays define the allowable range for each hyperparameter, establishing the limits for the search. The swarm size dictates the quantity of individual “particles” such as learning rate, batch size, and dropout rate, that simultaneously navigate this space, hence affecting the scope of the search. Maximum iteration denotes the upper limit on the number of iterations the swarm will do, regulating the length and intensity of the optimization procedure. The core behavior of PSO, though not explicitly defined in this code, is influenced by inertia weight (omega), personal best acceleration coefficient (phip), and global best acceleration coefficient (phig), which pyswarm employs with default values, determining how particles reconcile their individual search history with the collective findings of the swarm.

3.4. Experimental Setup

Data augmentation was utilized to improve the model’s resilience and generalization abilities, reducing overfitting by artificially enlarging the training sample. This was accomplished by the ImageDataGenerator from Keras preprocessing set up to implement diverse transformations in real-time. The transformations encompassed rescaling populations iteratively over a predetermined number of generations, evaluating each particle’s “fitness” by applying horizontal flipping. An independent test set was created and loaded without shuffling to preserve prediction order for uniform evaluation.

3.4.1. PSO Parameters

The SHAP Feature Impact graphic illustrates the contribution of each hyperparameter to the projected Validation Accuracy. Lower learning rates diminish accuracy, whereas greater learning rates have variable effects. Elevated dropout rates adversely affect performance, whereas diminished dropout rates typically enhance accuracy. The batch size influences validation accuracy, with bigger sizes linked to enhanced performance. The SHAP plot in Figure 6 indicates that Dropout Rate FC and Batch Size exert distinct influences on accuracy, with reduced dropout and increased batch size typically enhancing accuracy. The influence of the learning rate is intricate, indicating an ideal range instead of a linear correlation. Table 3 shows PSO parameters.

3.4.2. Hyperparameter Settings

The input image size was configured to (224, 224) pixels, signifying that all photos were shrunk to this uniform dimension before being processed by the models. A batch size of 32 was employed, indicating that 32 photos were processed concurrently in each training iteration. The training method included two essential callbacks: Early Stopping (ES) with a patience of 10 epochs (ES (10)) and Reduce Learning Rate on Plateau (RLROP) with a patience of 5 epochs (RLROP (5)). Early Stopping ceases training if validation performance fails to increase for 10 consecutive epochs, thereby averting overfitting, whereas Reduce Learning Rate on Plateau diminishes the learning rate if the validation metric ceases to improve for 5 epochs, facilitating more effective model convergence. Each model underwent training for a maximum of 60 epochs. The ADAM optimizer was selected to modify the model’s weights throughout the training process. To improve generalization and mitigate overfitting, data augmentation techniques were employed, encompassing Rescaling, Flipping, and rotating images by a maximum of 20 degrees. The dataset was ultimately partitioned into a train-test split ratio of 70:30, indicating that 70% of the data was allocated for training and 30% for assessing the model’s performance given in Table 4.

4. Results

4.1. Binary Classification

We have thoroughly assessed the efficacy of eight notable deep learning architectures, such as DESNET 121, EfficientNetB7, EfficientNetV2S, RESNET50, VGG-16, VGG-19, MobileNetV2, and Inception V3, presumably within an image classification framework. Performance is evaluated based on five principal metrics: Accuracy, Precision, Recall, F1-Score, and AUC Score, each ranging from 0.0 to 1.0, with higher values signifying superior performance. The findings distinctly identify MobileNetV2 and Inception V3 as the foremost models, each attaining nearly flawless scores of 0.9800 in Accuracy, Precision, Recall, and F1-Score, with Inception V3 marginally surpassing MobileNetV2 in AUC (0.9814 compared to 0.9750), signifying enhanced overall discriminative capability. DESNET 121 and VGG-16 exhibit robust performance, with metrics ranging from 0.9400 to 0.9600. Conversely, EfficientNetB7 demonstrates the poorest performance, particularly in Precision (0.2500) and F1-Score (0.3300), with an AUC of 0.5000, indicating performance equivalent to random chance. RESNET50 has unexpectedly inferior performance relative to its established reputation, underperforming compared to numerous other models in our assessment. This comparative research highlights the essential significance of model selection for certain tasks and datasets, along with the necessity of thorough assessment metrics beyond simple accuracy to comprehensively assess a model’s strengths and flaws.
Through a thorough investigation of all performance metrics, InceptionV3 is identified as the preeminent model among the eight assessed deep learning architectures. It constantly attains the minimal Misclassification Rate (0.0186), signifying superior accuracy and the least number of errors. Moreover, InceptionV3 exhibits the highest Matthews Correlation Coefficient (0.9635), the highest Jaccard Index (0.9641), and the highest Kappa Coefficient (0.9628) mentioned in Table 5. These sophisticated metrics validate their remarkable robustness and balanced classification abilities, particularly in situations with possible class imbalance, indicating a near-perfect concordance and correlation between their predictions and the actual labels, much exceeding random chance. This exceptional performance is validated by its elevated Area Under the Curve (AUC) scores, attaining 0.98 for binary classification and 0.98 micro-average for multiclass situations, reinforcing its discriminative capability.
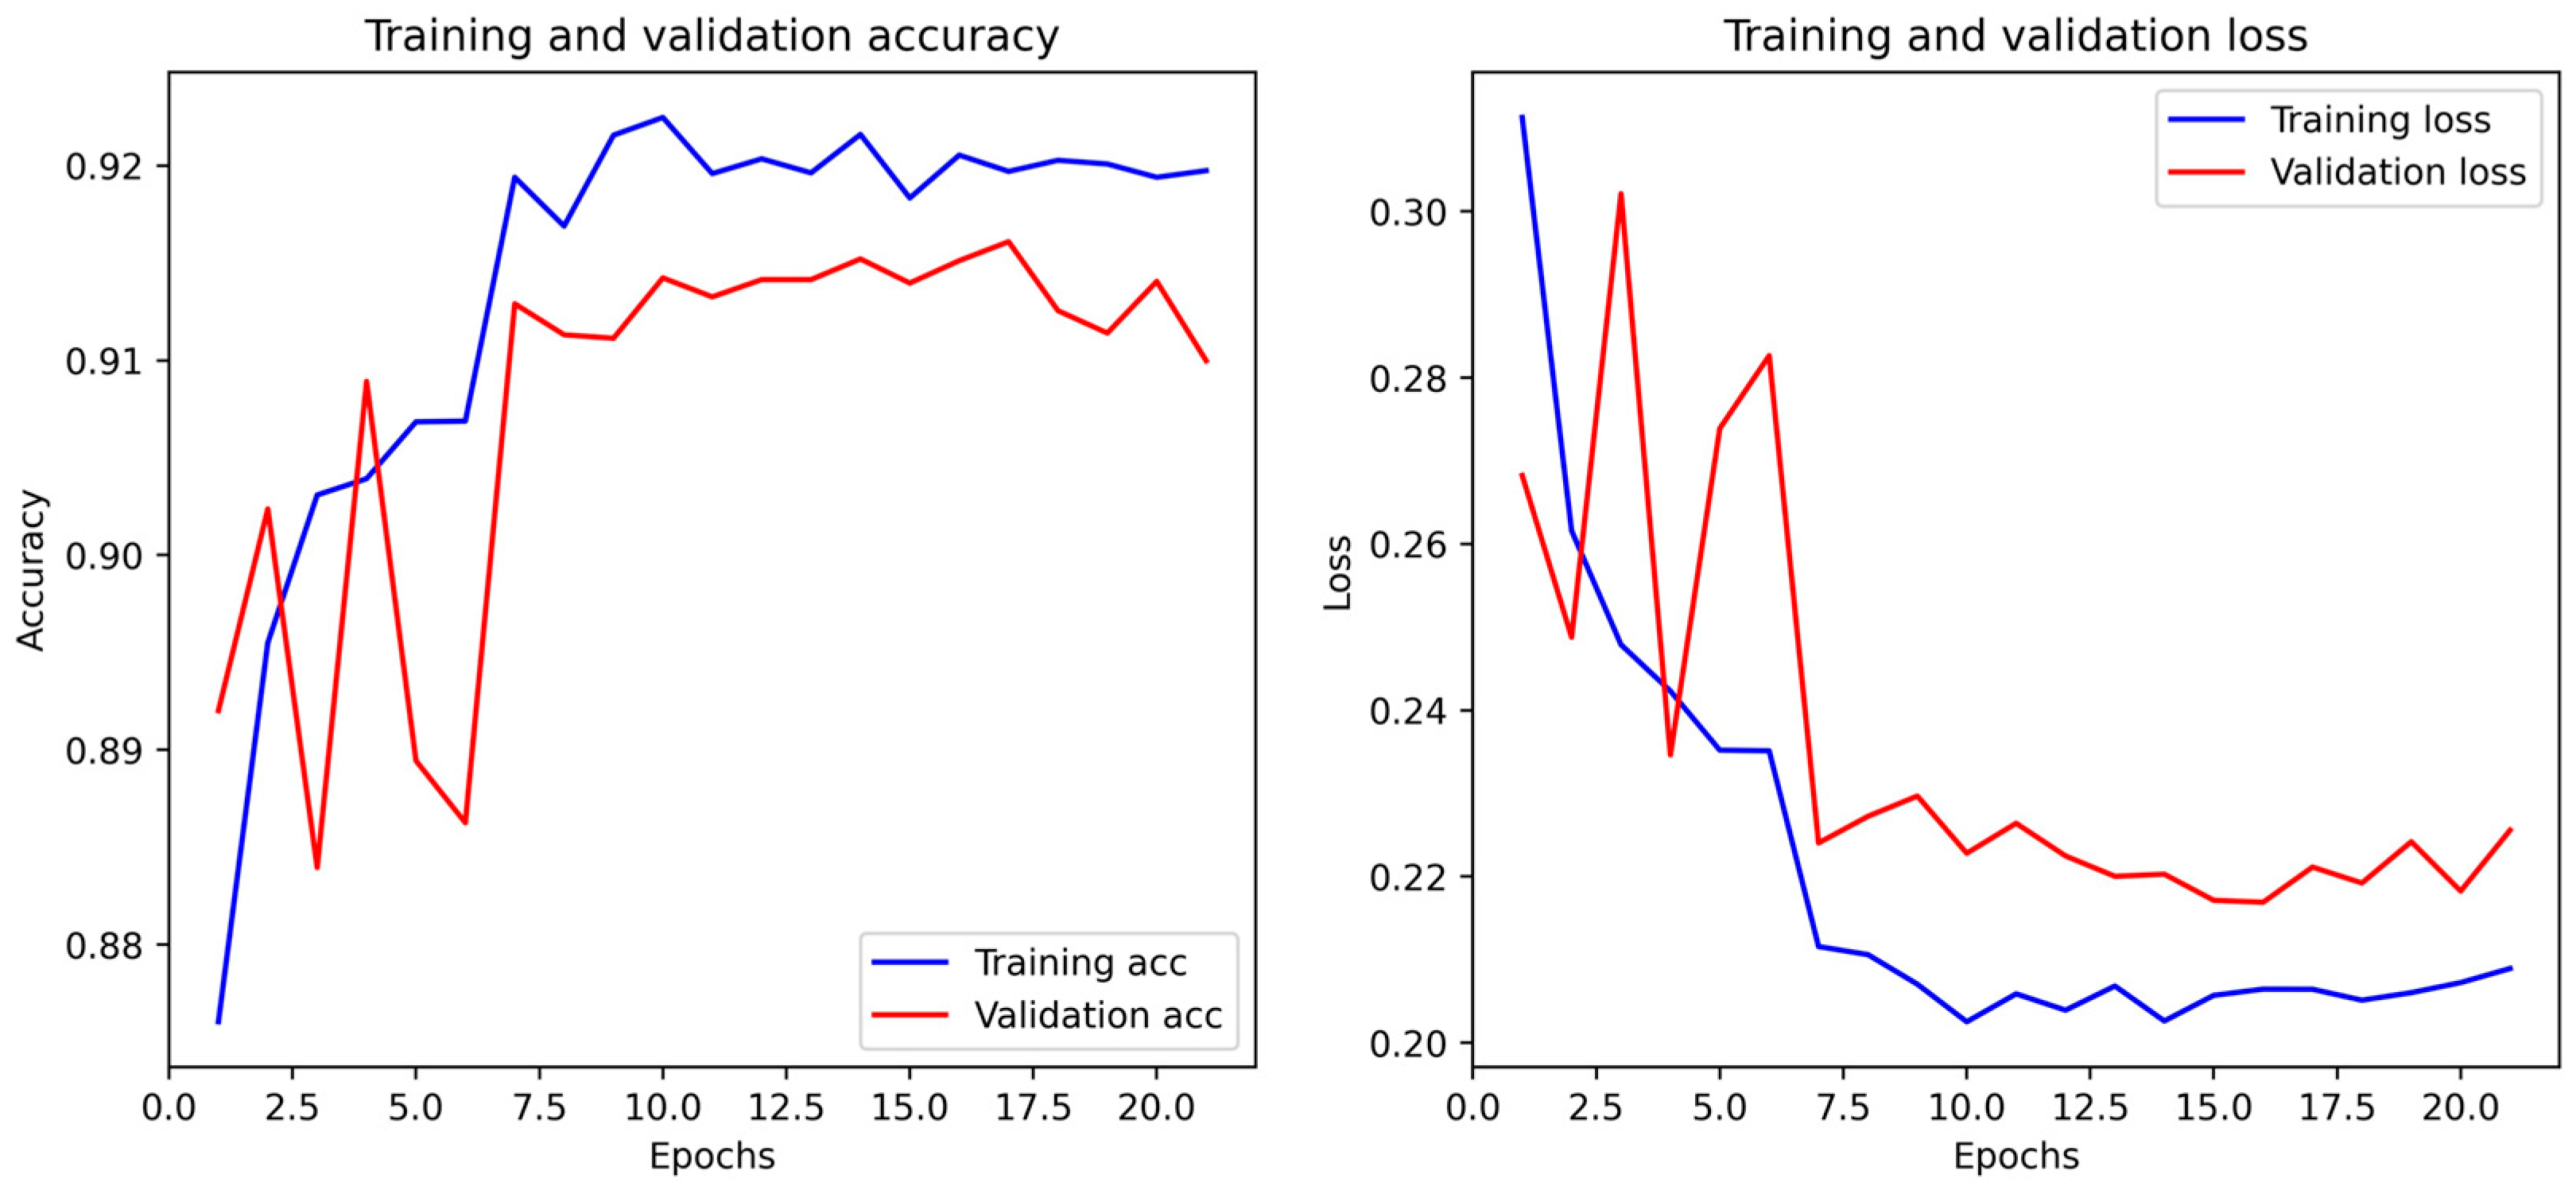
The visualization, consisting of two graphs, clearly depicts the learning trajectory and performance of a deep learning model. The left graph illustrates a distinct rising trajectory for both training and validation accuracy metrics. The training accuracy, denoted by the blue line, swiftly increases from roughly 87.5% to a stable range between 91.5% and 92.5%, signifying consistent learning from the training data. Simultaneously, the red line, denoting validation accuracy, increases markedly from an initial 89% to a peak of approximately 91.5%. The accompanying graph on the right, depicting training and validation loss, corroborates these findings. The training loss (blue line) consistently declines from an initial 0.31 to approximately 0.20–0.21, indicating successful error reduction on the observed data. The validation loss (red line), albeit exhibiting more oscillations in the initial epochs, generally decreases from around 0.27 to about 0.22, hence affirming the model’s capacity for generalization shown in Figure 7.
This ROC curve figure succinctly depicts the efficacy of eight deep learning models in a binary classification challenge, with each curve representing the trade-off between the True Positive Rate (sensitivity) and the False Positive Rate. The Area Under the Curve (AUC) functions as a singular measure of discriminative ability, spanning from 0.5 (random chance) to 1.0 (flawless categorization). This investigation identifies InceptionV3 (AUC = 0.98), MobileNetV2 (AUC = 0.97), DenseNet121 (AUC = 0.96), and VGG16 (AUC = 0.94) as the premier models, exhibiting exceptional proficiency in reliably differentiating between the two classes with elevated sensitivity and few false positives. VGG19 (AUC = 0.92) demonstrates commendable, if marginally inferior, performance, whilst EfficientNetV2S (AUC = 0.76) exhibits moderate efficacy. In sharp contrast, ResNet50 (AUC = 0.68) and EfficientNetB7 (AUC = 0.50) are categorized as low performing, with EfficientNetB7 demonstrating performance superior to random chance, thus proving ineffectual for this classification task. The graphics in Figure 8 distinctly show InceptionV3, MobileNetV2, and DenseNet121 as the most robust and dependable models for this binary classification context.

4.2. Multi-Class Classification

This table contrasts various deep learning models on a multiclass OCT dataset, emphasizing accuracy, precision, recall, and F1-score. Accuracy represents the ratio of right forecasts to total predictions, whereas high precision signifies the model’s effectiveness in predicting a given condition. Precision is the ratio of accurate identifications to the total instances the model predicted that class. A high recall signifies that the model effectively identifies all true instances of a specific ailment, which is essential in medical diagnosis. MobileNetV2 has superior performance, achieving Accuracy, Precision, Recall, and F1-Score values of 0.91, 0.92, 0.91, and 0.91, respectively. DESNET 121 and Inception V3 provide exceptional performance, with all metrics at 0.90 or 0.91. VGG-16 and VGG-19 exhibit equal performance with an Accuracy and Recall of 0.88, and a Precision of 0.90, yielding F1-scores of 0.87 and 0.88, respectively. Underperformers encompass EffectiveNetB7 and RESNET50, which exhibit markedly inferior performance across all criteria. The exceedingly low accuracy and F1-score (0.10) of EffectiveNetB7 signify that the model frequently errs, demonstrating a deficient equilibrium between accuracy and recall. RESNET50 exhibits subpar performance, particularly in Precision and F1-Score, indicating difficulties in accurately distinguishing various circumstances in the OCT2017 dataset. Similarly, Mobile Net produces 80% accuracy, and Inception V3 produces 78% accuracy in the OCT2017 + OCTC8 dataset given in Table 6.
Through a thorough investigation of all performance metrics, InceptionV3 is identified as the preeminent model among the eight assessed deep learning architectures. It constantly attains the lowest Misclassification Rate (0.0904), signifying the highest accuracy and few errors. Moreover, InceptionV3 has the greatest Matthews Correlation Coefficient (0.8822), an elevated Jaccard Index (0.8335), and a Kappa Coefficient of 0.8795. These sophisticated metrics validate their remarkable robustness and balanced classification abilities, particularly in situations with possible class imbalance, indicating a significant concordance and correlation between their predictions and the actual labels that exceed just random chance. This exceptional performance is further validated by its elevated Area Under the Curve (AUC) values, attaining 0.98 for overall classification and a Micro-average AUC of 0.98 for multiclass situations. Although MobileNetV2 exhibits comparable performance, with a marginally superior raw accuracy (0.91) and similar advanced metrics (e.g., MCC 0.8870), it is frequently preferred for its efficiency mentioned in Table 7. In contrast, InceptionV3 maintains a consistent advantage across all evaluation criteria, rendering it the optimal selection for this multiclass classification task. The accuracy and loss plot is given below in Figure 9 and Figure 10.
The presented figure displays sets of accuracy and loss plots, presumably depicting the performance of a deep learning model, across around 18 epochs. It includes an “Accuracy” plot and a “Loss” plot, illustrating both training (blue) and validation (red) curves. Inception V3 exhibits a robust learning trajectory, with accuracy increasing rapidly until it levels off at approximately 84–85%, while loss declines dramatically and stabilizes between 0.425 and 0.450. The close alignment of the training and validation curves in the Inception V3 Model, with validation performance consistently approximating training performance, signifies effective generalization and a lack of substantial overfitting. The figure shows the accuracy loss plot of the model, Figure 10.
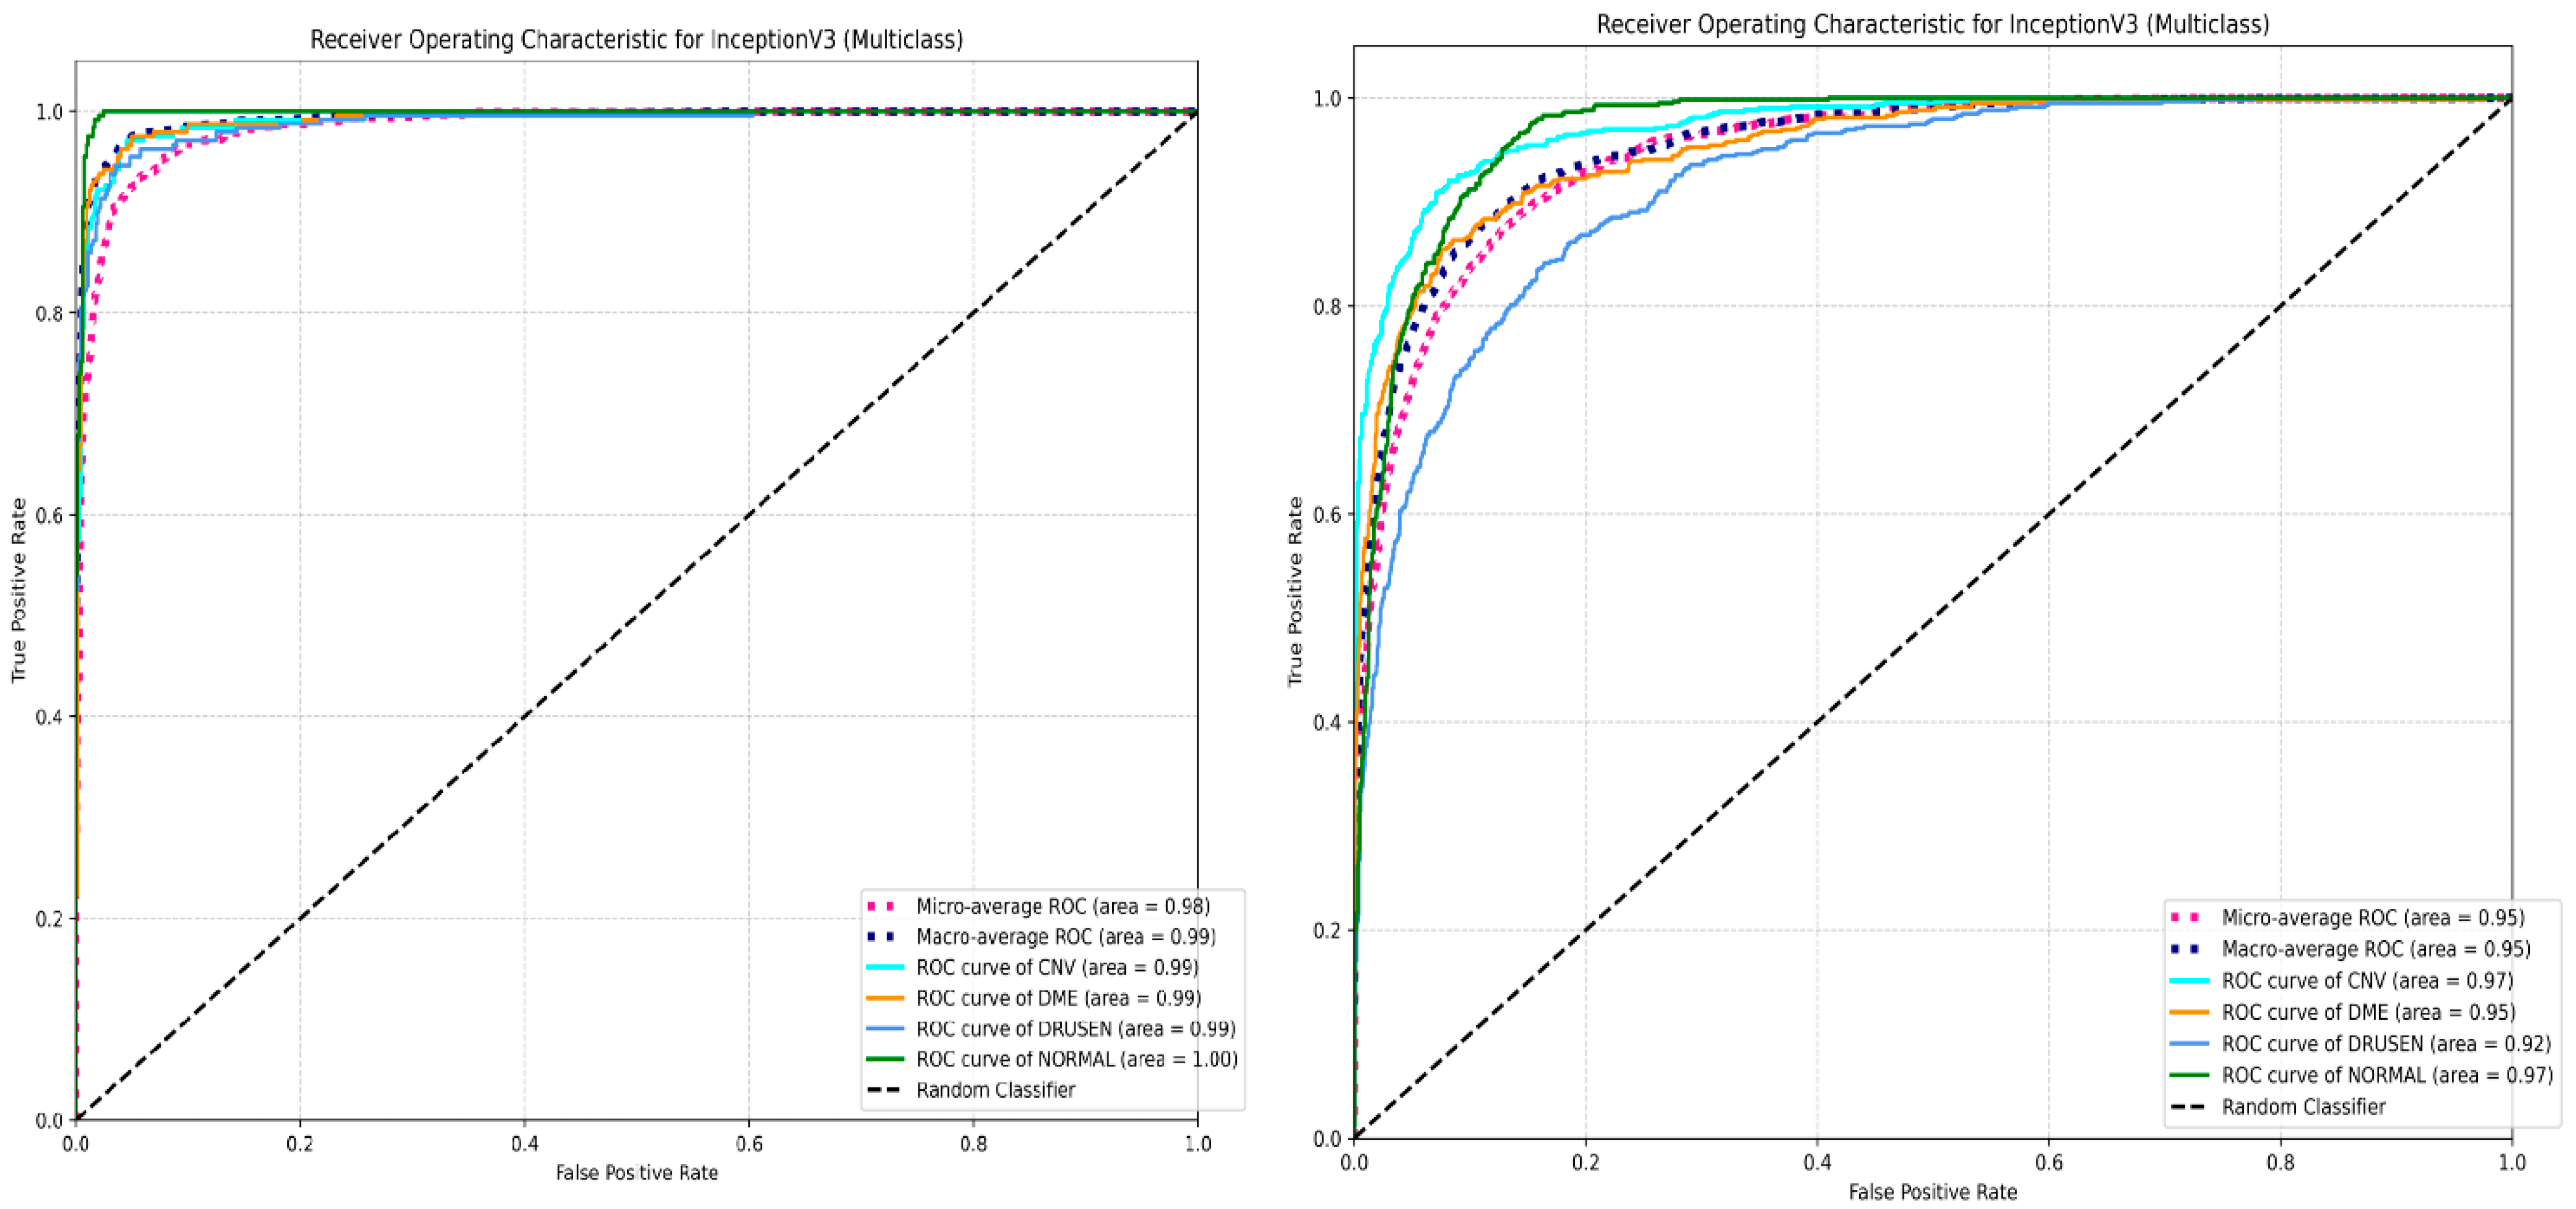
Figure 11 shows an examination of the Receiver Operating Characteristic (ROC) curve for an InceptionV3 deep learning model utilized in a multiclass classification task involving the OCT 2017 and OCT2017 + OCT C8 datasets, respectively. The x-axis of the graphic denotes the False Positive Rate (FPR), whilst the y-axis signifies the True Positive Rate (TPR). A dashed black diagonal line represents a random classifier, functioning as a baseline for comparison. The individual ROC curves for the four classified retinal conditions, Choroidal Neovascularization (CNV), Diabetic Macular Edema (DME), Drusen, and Normal, demonstrate outstanding performance, with high Area Under the Curve (AUC) scores for CNV, DME, and Drusen, and a low error for Normal cases. This signifies that the models are exceptionally proficient at differentiating between these disorders and healthy eyes.

4.3. Wilcoxon Test

The p value 0.0020 and the significance level alpha is 0.05 show that the Wilcoxon test indicated a statistically significant difference between InceptionV3 and MobileNetV2, leading to the rejection of the null hypothesis. The implied direction of difference indicates that InceptionV3 consistently outperformed MobileNetV2 in all matched observations. In the hypothetical case presented, InceptionV3 exhibited consistently superior accuracies compared to MobileNetV2, signifying that InceptionV3 outperformed MobileNetV2 in this comparison on the OCT dataset.

4.4. Biological Optimization: PSO

Table 8 shows the PSO performance parameters.
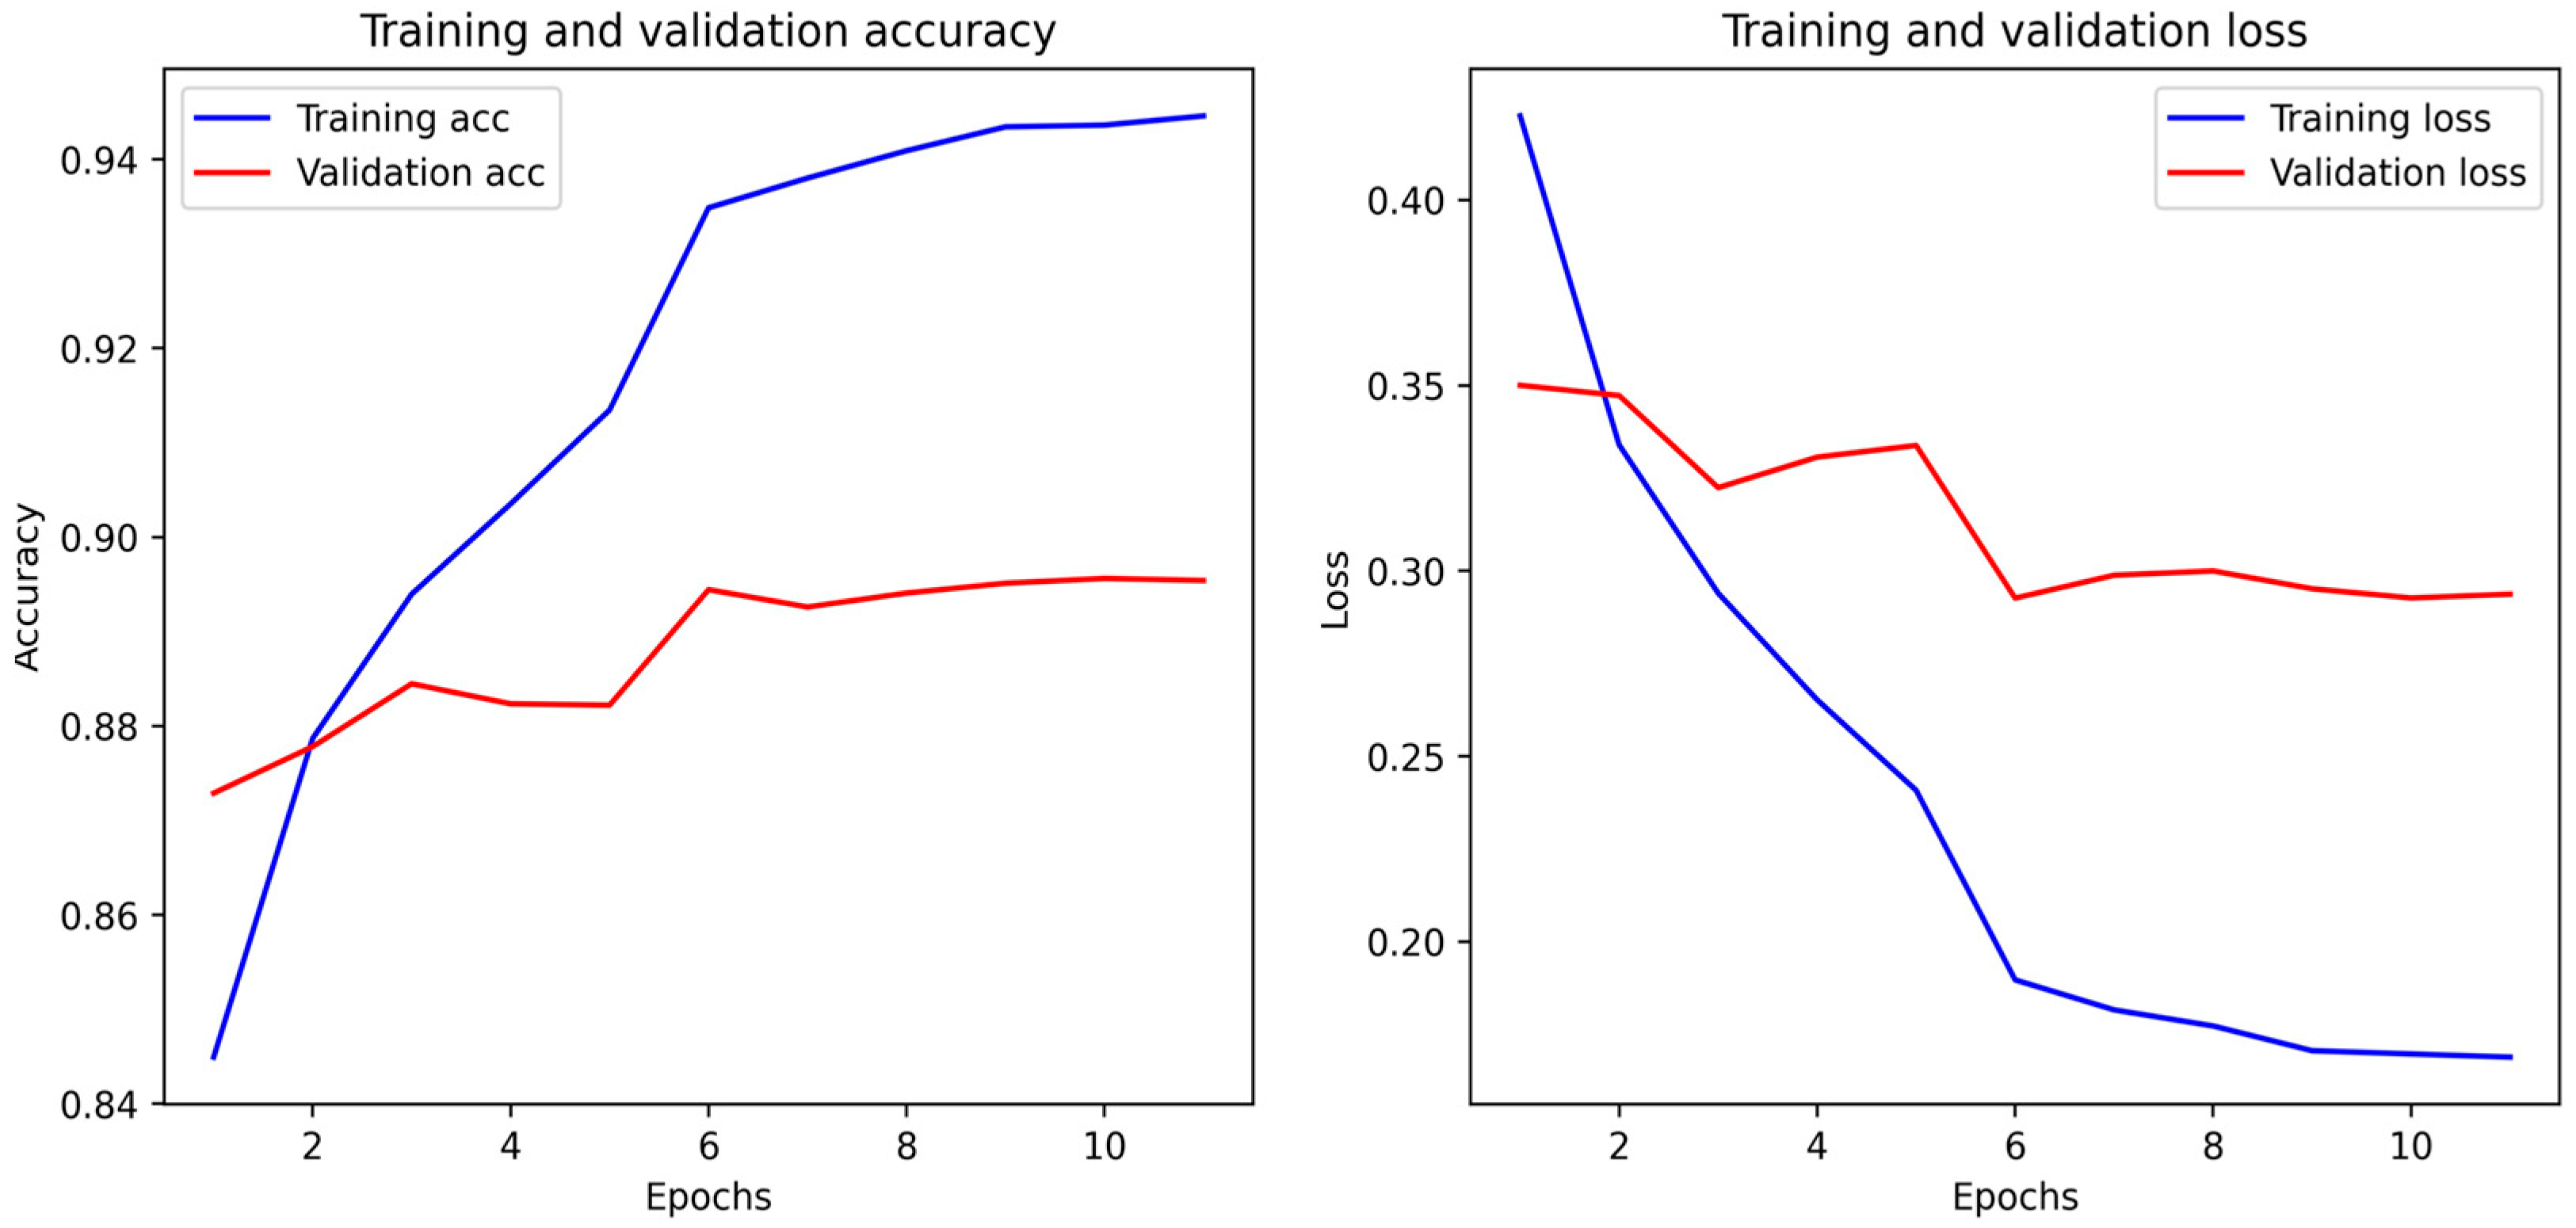
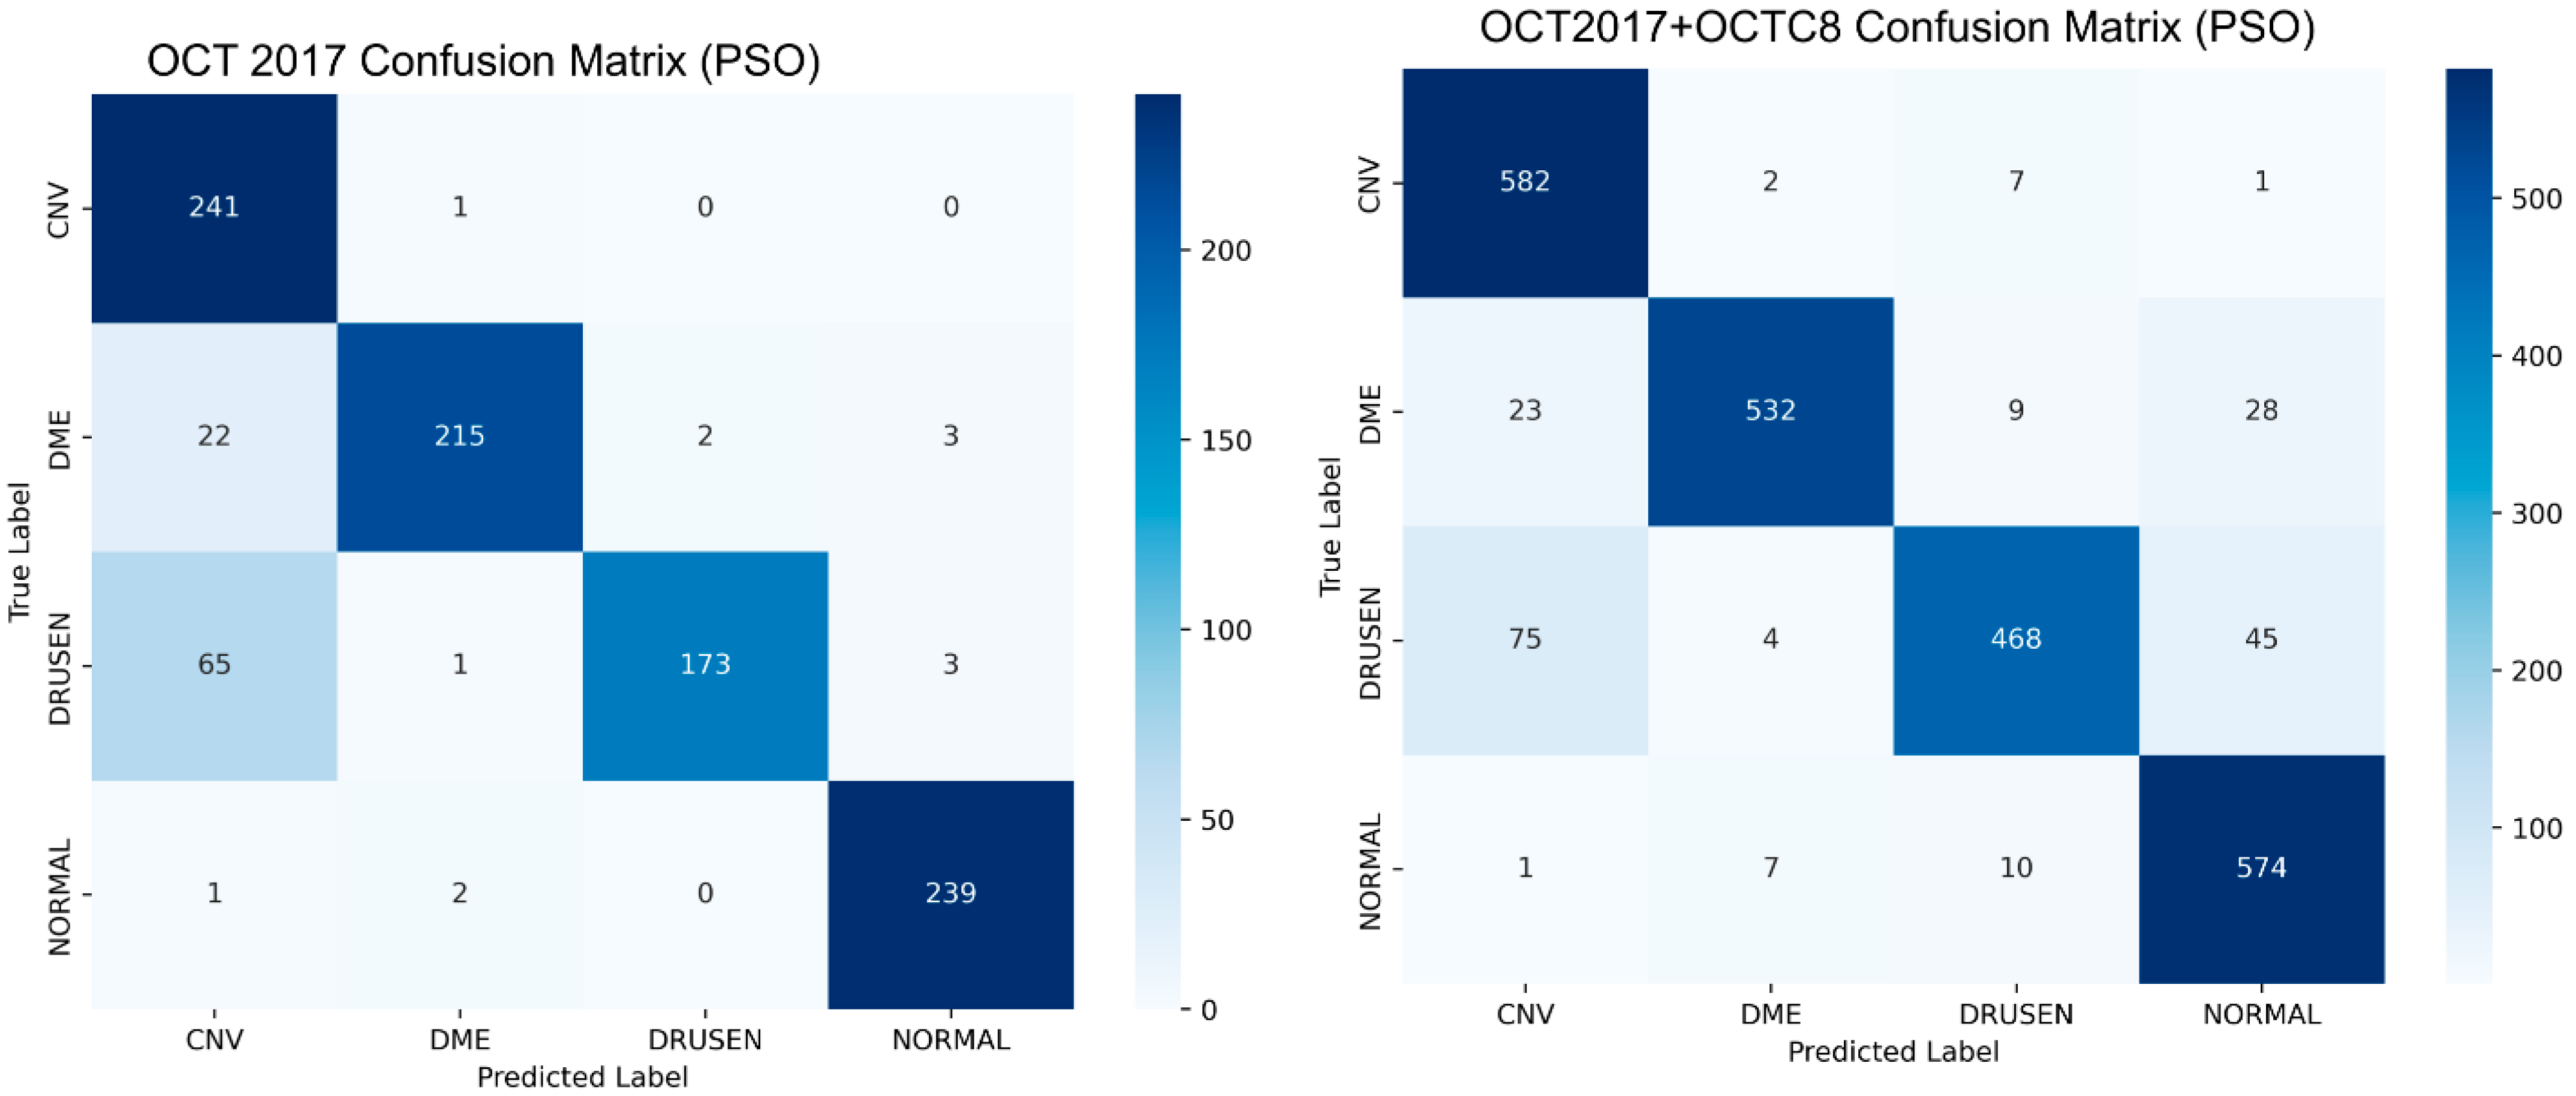
The image below Figure 12 and Figure 13 illustrates the performance of an InceptionV3 model tuned by Particle Swarm Optimization (PSO) on the OCT 2017 dataset and the combined dataset. The top-left graph illustrates the model’s accuracy throughout training, with training accuracy consistently increasing and validation accuracy stable between 86 and 87%, signifying effective learning and generalization to a certain extent. A confusion matrix in Figure 14 provides an in-depth analysis of the model’s classification performance on the test set. It demonstrates robust performance for categories such as ‘CNV’ and ‘NORMAL’, exhibiting a significant quantity of accurately classified samples along the diagonal.
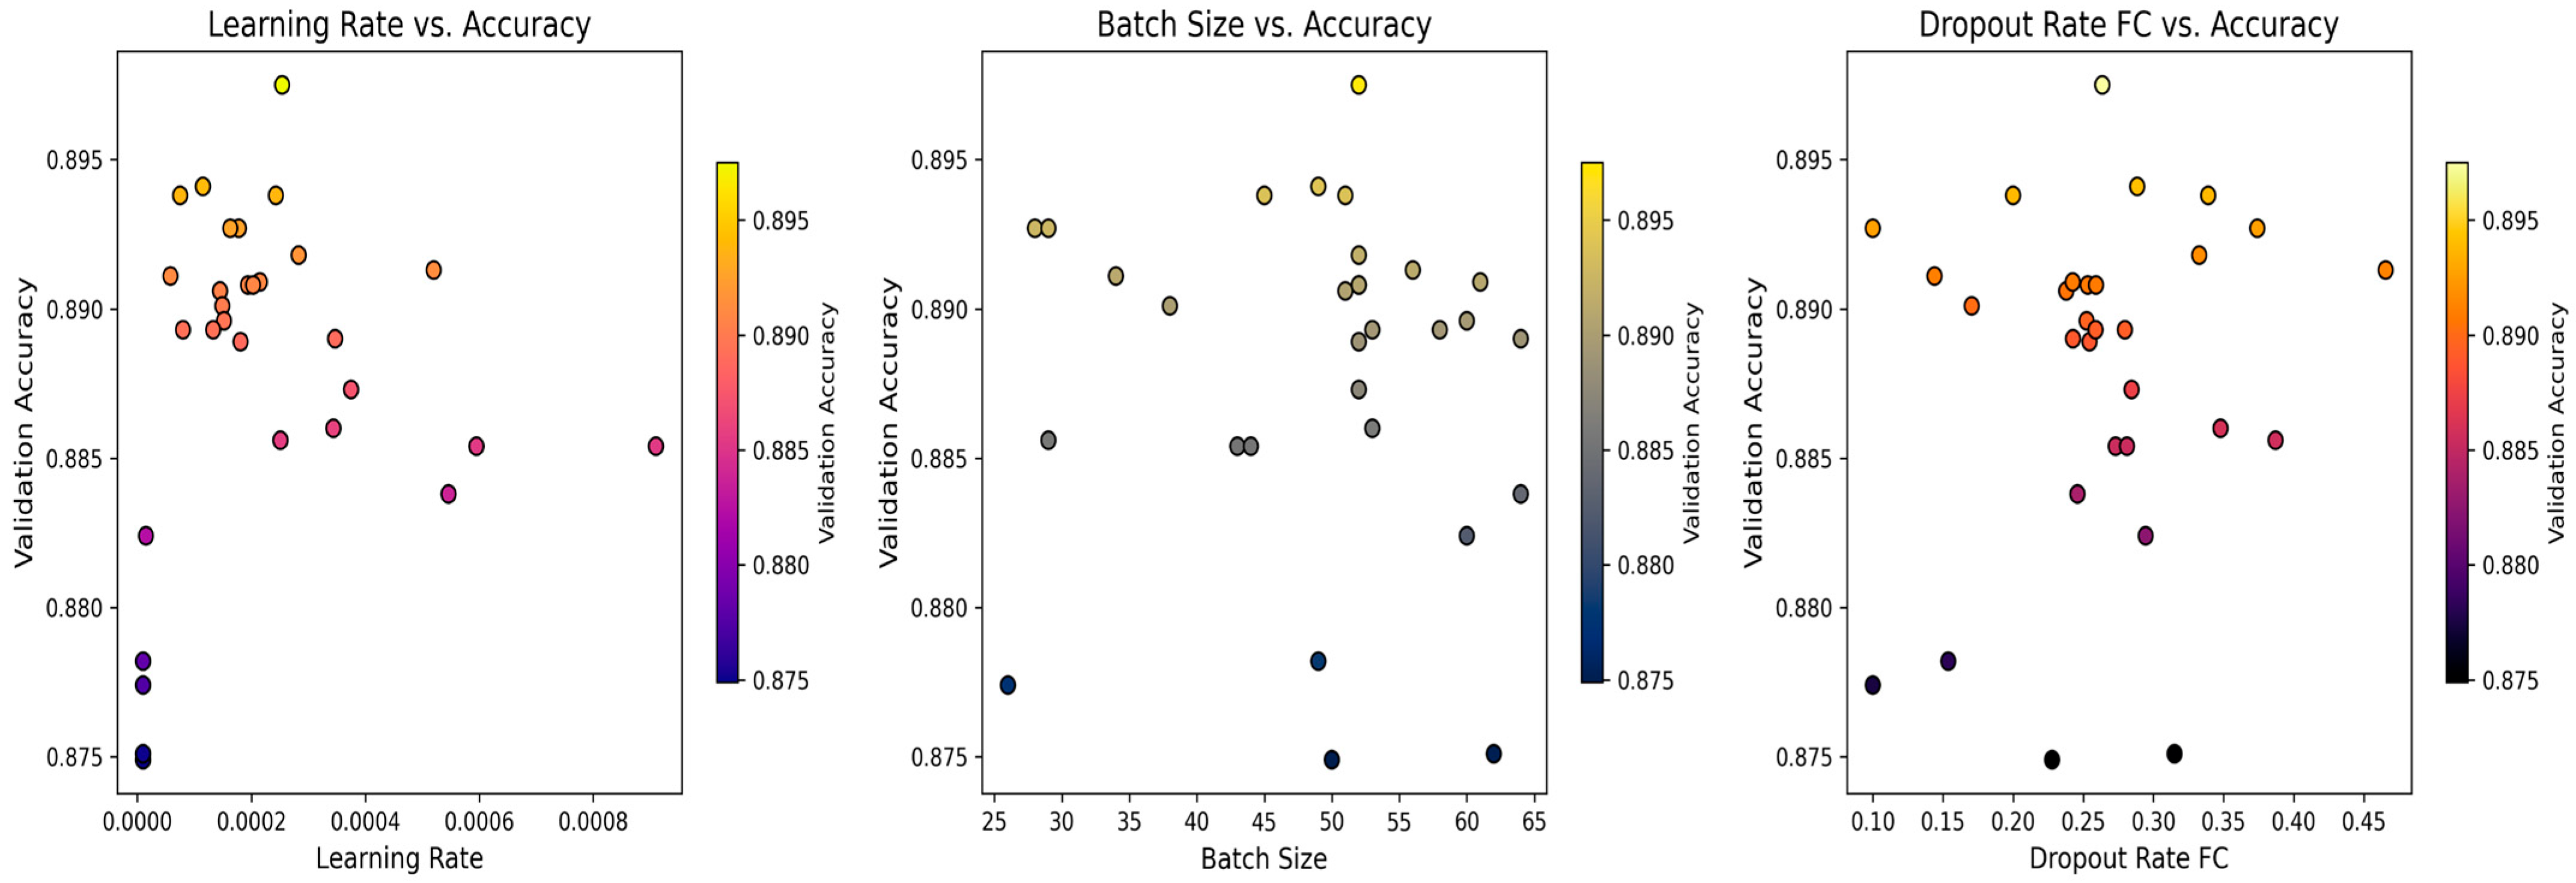
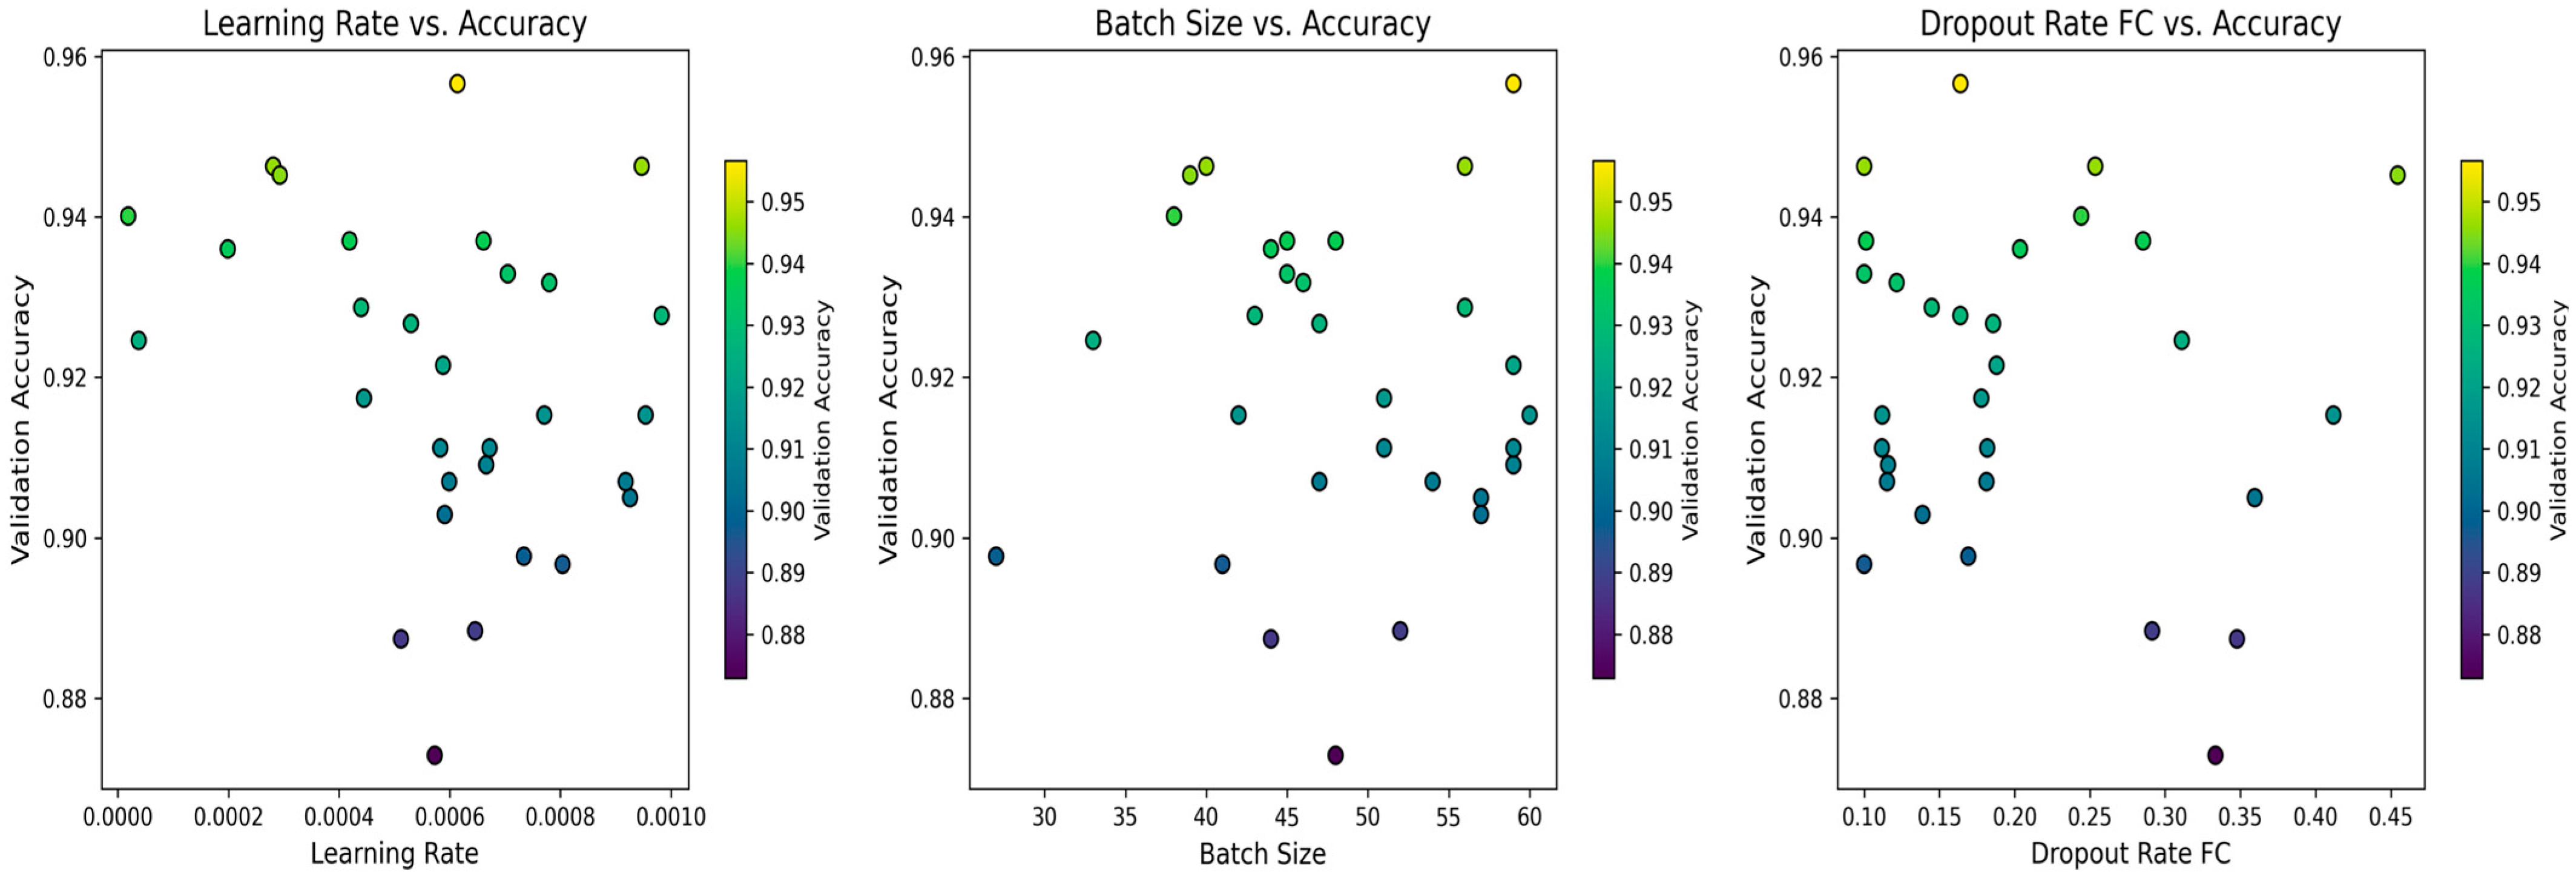
The validation accuracy of the InceptionV3 model is examined through three 2D scatter plots. The graphs indicate that elevated validation accuracies are predominantly observed in the intermediate range of learning rates, with a few lower accuracy values dispersed throughout the spectrum. Batch sizes exceeding 50 generally produce superior validation performance. The optimal accuracies are found at lower dropout rates, particularly below 0.20. As the dropout rate escalates, a general trend towards diminished accuracies is observed, while certain modestly favorable accuracies persist at elevated dropout rates. Lower accuracy is generally associated with higher dropout rates, suggesting that excessive dropout may hinder the model’s learning efficacy. The 2D scatter graphs in Figure 15 elucidate the specific sensitivities of the InceptionV3 model to each hyperparameter for both datasets, indicating that optimal performance is achieved with a moderate learning rate, bigger batch sizes, and reduced dropout rates for the fully connected layers.
The “Hyperparameter Optimization Convergence” graph in Figure 16 shows the best validation accuracy achieved over each iteration of the hyperparameter search for InceptionV3. It shows a significant improvement in early iterations, from below 0.89 to almost 0.95 by the 3rd iteration. The best accuracy remains stable at around 0.89 and 0.945 for several iterations, suggesting the optimizer explored good configurations but not necessarily better ones. The graph indicates the efficiency and effectiveness of the hyperparameter optimization process.
The Parallel Coordinates Plot in Figure 17 is an effective instrument for examining hyperparameter tuning in InceptionV3. Vertical axes denote several hyperparameters, whereas lines illustrate trials in the optimization process. The graphic facilitates the identification of ideal areas, parameter relationships, and ineffective zones. The vivid yellow lines signify excellent precision, whilst the black lines denote low accuracy. The concentration and distribution of lines signify the extent of investigation. This graphic enhances the 3D trajectory, facilitating the comparison of parameter combinations with their respective performance, especially in recognizing high-performing setups.
The 3D image in Figure 18 illustrates the search process for optimal hyperparameters of the InceptionV3 model, where each point signifies a training attempt with a distinct combination of these parameters. The diagram demonstrates the hyperparameter space examined, the validation accuracy terrain, and the optimization trajectory. The optimal point, a hyperparameter combination yielding a Validation Accuracy of 0.89 and 0.9566, respectively. This image clearly illustrates the search process and the most advantageous combinations inside the multi-dimensional hyperparameter space.
Hyperparameter Optimization Trajectory-OCT2017.
The optimized parameters for both models, as determined by PSO, are listed in the table.

4.5. Score CAM

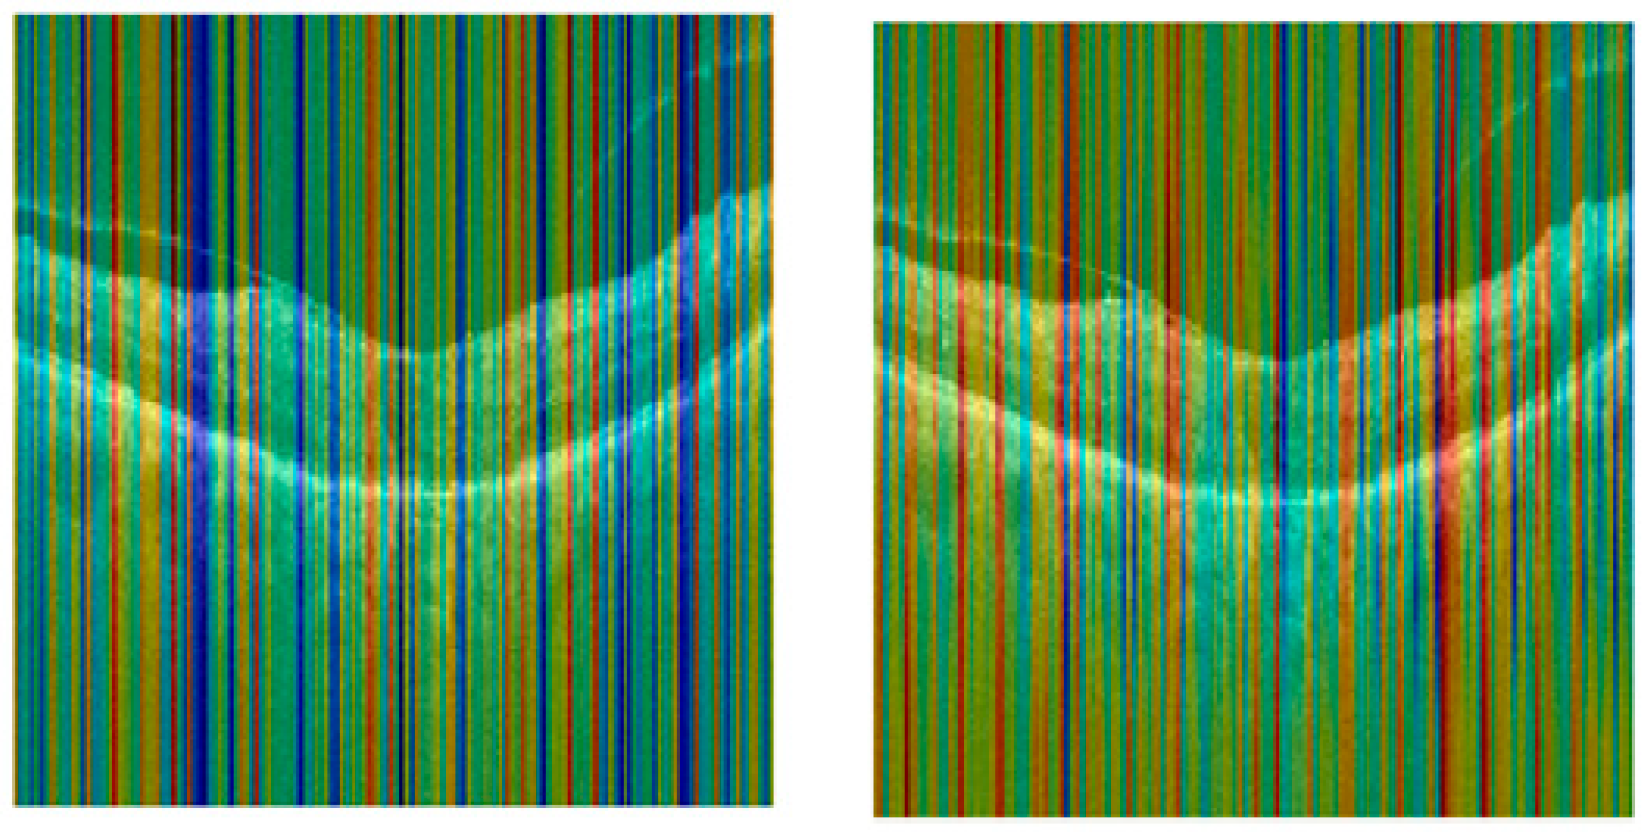
Figure 19 Inception V3 and MobileNetV2 Score-CAM offer the visual rationale for the model’s forecast. For the sample OCT picture, the Score-CAM heatmap for the ‘DME’ class demonstrates that the maximum activation, which is red and yellow patches, is limited to the center macular area, especially matching the inner retinal layers. This localization is closely linked with the clinical manifestation of macular edema based on the intraretinal fluid and thickness, suggesting that the models are focused on the correct pathological aspects to arrive at its diagnosis. This satisfactorily verifies the model’s interpretability and clinical relevance.

5. Discussion

The research illustrates the capability of transfer learning models in identifying nuanced characteristics of various eye disorders. The InceptionV3 model showed outstanding efficacy in a binary and multiclass classification test, distinguishing ‘Normal’ from DME, CNV, and DRUSEN utilizing the OCT2017 and OCT2017 + OCTC8 datasets. The model reached an impressive accuracy of around 90% on the OCT2017 dataset, and an accuracy of about 80% on the combined OCT2017 + OCT C8 dataset. The methodical use of PSO for hyperparameter tuning yielded substantial performance improvements in both models and datasets. The precise adjustment of training dynamics, governed by learning rate, batch size, and regularization strength (dropout), is essential for the ultimate performance and generalization of the model. The model attained high accuracy on the bigger dataset, indicating its appropriateness for real-world applications where computational resources may be limited. Both models achieved high F1-Scores, Kappa Coefficients, and Matthews Correlation Coefficients, indicating robust and reliable classification performance. The study concluded that InceptionV3 is highly effective for OCT image classification when properly tuned. Wilcoxon test confirms the model superiority over other models. Future endeavors may encompass the examination of alternative meta-heuristic optimization algorithms, the investigation of sophisticated data augmentation methodologies, and the execution of external validation on separate OCT datasets.

5.1. Ablation Study: Impact of Dropout Layer

An ablation study is a crucial tool for methodically analyzing the contributions of different components within a complex system, such as a deep learning pipeline for medical image categorization. We have conducted an ablation study on the OCT 2017 and OCT C8 combined dataset specifically to isolate and analyze the effect of the dropout regularization layer on the performance of both MobileNetV2 and InceptionV3 models. The incorporation of a dropout layer dramatically diminished the performance of both MobileNetV2 and Inception V3 models across all assessed measures. In contrast, eliminating the dropout layer (i.e., executing the models without dropout) resulted in considerable enhancements in accuracy, precision, recall, F1-score, Matthews Correlation Coefficient, Jaccard Index (IoU), and Kappa Coefficient, while also markedly decreasing the misclassification rate given in Table 9. This indicates that, for this dataset and model setup, the dropout layer functioned not as a regularizer but as a hindrance to learning, perhaps resulting in underfitting or obstructing the model’s capacity to successfully discern the underlying patterns. Table 10 shows the performance metrics of the OCT2017 +OCTC8 dataset after adding the dropout layer.

5.2. External Validation

We have accomplished external validation through the OCT dataset (OCTDL) containing over 2000 OCT pictures annotated by disease category and retinal pathology. The collection includes OCT scans from patients with Age-related Macular Degeneration, DME, Epiretinal Membrane (ERM), Retinal Artery Occlusion (RAO), Retinal Vein Occlusion (RVO), and Vitreomacular Interface Disease (VID). The images were captured with an Optovue Avanti RTVue XR employing raster scanning protocols that included dynamic scan length and image resolution. An experienced retinal specialist analyzed and catalogued each retinal B-scan, which was taken by centering on the fovea [47]. We have used Normal and DME categories for our external validation analysis. We have achieved 0.9278% of accuracy, 0.1628 loss, and a precision and recall of 0.927 in the novel unknown dataset for the Inception v3 model. We have accomplished the external validation on a novel dataset, which was gathered from a distinct patient population, clinical environment, or geographical region, compared to the data utilized during its development and internal assessment (training, validation, and internal test sets). This thorough evaluation validates the model’s generalizability and reproducibility before its implementation in a practical environment.

6. Conclusions

This study thoroughly assessed the efficacy of transfer learning models, basically the InceptionV3 architectures, for multi-class OCT image classification, analyzing the distinct and synergistic effects of dropout regularization and PSO for hyperparameter optimization. The utilization of PSO for hyperparameter optimization exhibited differing levels of efficacy among the models. For inception Net V3, PSO effectively determined an ideal hyperparameter set, resulting in an accurate enhancement of 0.910 from the unoptimized, no-dropout baseline of 0.90, demonstrating its advantageous impact on generalization. This indicates that for InceptionV3, the PSO search space may have been inadequately explored. The study ultimately demonstrated that PSO is an effective tool for optimizing deep learning models for OCT image categorization. Post-optimization, the optimized model exhibited strong classification performance across all metrics, with F1-Scores of 0.9080 Inception V3 with OCT2017 and OCT C8 combined dataset and 0.8967 for InceptionV3, Kappa Coefficients of 0.8807 for combined datasets and 0.8622 for OCT2017, and Matthews Correlation Coefficients of 0.8810 for the combined dataset and 0.8727 for OCT2017, indicating substantial concordance between predictions and actual labels. Qualitative analysis of the confusion matrices indicated that they well managed the CNV, DME, and NORMAL classes; however, the DRUSEN class posed the greatest classification difficulty. External validation on the new NOVAL OCTDL has proven that our model works well on unseen data, which helps us in assessing the generalizability, quantifying models’ transportability, and decision-making.

Future Work

We intend to employ ensemble learning techniques and incorporate longitudinal models alongside other biological optimization algorithms for parameter adjustment and model optimization. This work exclusively examines OCT pictures. Future initiatives may investigate the integration of the new dataset with pertinent clinical information, such as fundus photos, patient demographics, genetic markers, or electronic health record data, to develop a more comprehensive and tailored diagnostic system.

Author Contributions

Conceptualization, A.M.M. and K.S.; data curation, B.S.S.T. and S.R.; funding acquisition, A.M.M.; investigation, B.S.S.T.; methodology, A.M.M., B.S.S.T. and S.R.; project administration, A.M.M.; software, B.S.S.T.; supervision, A.M.M.; validation, A.M.M. and B.S.S.T.; writing—original draft, A.M.M. and B.S.S.T.; writing—review and editing, A.M.M., K.S., B.S.S.T. and S.R. All authors have read and agreed to the published version of the manuscript.

Funding

This research was funded by the Kuwait University Research Grant No. RE02-24.

Institutional Review Board Statement

Not applicable.

Informed Consent Statement

Not applicable.

Data Availability Statement

The data presented in this study are openly available in OCT dataset at https://www.mdpi.com/2313-433X/9/10/203, reference number [5].

Conflicts of Interest

The authors declare no conflicts of interest.

References

  1. Sharma, N.; Lalwani, P. A multi model deep net with an explainable AI based framework for diabetic retinopathy segmentation and classification. Sci. Rep. 2025, 15, 8777. [Google Scholar] [CrossRef]
  2. Liu, J.A.; Che, H.; Zhao, A.; Li, N.; Huang, X.; Li, H.; Jiang, Z. SegDRoWS: Segmentation of diabetic retinopathy lesions by a whole-stage multi-scale feature fusion network. Biomed. Signal Process. Control 2025, 105, 107581. [Google Scholar] [CrossRef]
  3. Li, Z.-Q.; Fu, Z.-X.; Li, W.-J.; Fan, H.; Li, S.-N.; Wang, X.-M.; Zhou, P. Prediction of Diabetic Macular Edema Using Knowledge Graph. Diagnostics 2023, 13, 1858. [Google Scholar] [CrossRef] [PubMed]
  4. Moannaei, M.; Jadidian, F.; Doustmohammadi, T.; Kiapasha, A.M.; Bayani, R.; Rahmani, M.; Jahanbazy, M.R.; Sohrabivafa, F.; Asadi Anar, M.; Magsudy, A.; et al. Performance and limitation of machine learning algorithms for diabetic retinopathy screening and its application in health management: A meta-analysis. Biomed. Eng. OnLine 2025, 24, 34. [Google Scholar] [CrossRef]
  5. Li, Z.; Han, Y.; Yang, X. Multi-Fundus Diseases Classification Using Retinal Optical Coherence Tomography Images with Swin Transformer V2. J. Imaging 2023, 9, 203. [Google Scholar] [CrossRef]
  6. Yao, Z.; Yuan, Y.; Shi, Z.; Mao, W.; Zhu, G.; Zhang, G.; Wang, Z. FunSwin: A deep learning method to analysis diabetic retinopathy grade and macular edema risk based on fundus images. Front. Physiol. 2022, 13, 961386. (In English) [Google Scholar] [CrossRef]
  7. Phene, S.; Dunn, R.C.; Hammel, N.; Liu, Y.; Krause, J.; Kitade, N.; Schaekermann, M.; Sayres, R.; Wu, D.J.; Bora, A.; et al. Deep Learning and Glaucoma Specialists: The Relative Importance of Optic Disc Features to Predict Glaucoma Referral in Fundus Photographs. Ophthalmology 2019, 126, 1627–1639. [Google Scholar] [CrossRef]
  8. Wan, X.; Zhang, R.; Wang, Y.; Wei, W.; Song, B.; Zhang, L.; Hu, Y. Predicting diabetic retinopathy based on routine laboratory tests by machine learning algorithms. Eur. J. Med. Res. 2025, 30, 183. [Google Scholar] [CrossRef] [PubMed]
  9. Tao, T.; Liu, K.; Yang, L.; Liu, R.; Xu, Y.; Xu, Y.; Zhang, Y.; Liang, D.; Sun, Y.; Hu, W. Predicting diabetic retinopathy based on biomarkers: Classification and regression tree models. Diabetes Res. Clin. Pract. 2025, 222, 112091. [Google Scholar] [CrossRef] [PubMed]
  10. Sunil, S.S.; Vindhya, A.S. Efficient diabetic retinopathy classification grading using GAN based EM and PCA learning framework. Multimed. Tools Appl. 2025, 84, 5311–5334. [Google Scholar] [CrossRef]
  11. Rajeshwar, S.; Thaplyal, S.; M., A.; G., S.S. Diabetic Retinopathy Detection Using DL-Based Feature Extraction and a Hybrid Attention-Based Stacking Ensemble. Adv. Public Health 2025, 2025, 8863096. [Google Scholar] [CrossRef]
  12. Lin, Y.; Dou, X.; Luo, X.; Wu, Z.; Liu, C.; Luo, T.; Wen, J.; Ling, B.W.-K.; Xu, Y.; Wang, W. Multi-view diabetic retinopathy grading via cross-view spatial alignment and adaptive vessel reinforcing. Pattern Recognit. 2025, 164, 111487. [Google Scholar] [CrossRef]
  13. Beuse, A.; Wenzel, D.A.; Spitzer, M.S.; Bartz-Schmidt, K.U.; Schultheiss, M.; Poli, S.; Grohmann, C. Automated Detection of Central Retinal Artery Occlusion Using OCT Imaging via Explainable Deep Learning. Ophthalmol. Sci. (Online) 2025, 5, 100630. [Google Scholar] [CrossRef] [PubMed]
  14. Tan-Torres, A.; Praveen, P.A.; Jeji, D.; Brant, A.; Yin, X.; Yang, L.; Singh, P.; Ali, T.; Traynis, I.; Jadeja, D.; et al. Validation of a Deep Learning Model for Diabetic Retinopathy on Patients with Young-Onset Diabetes. Ophthalmol. Ther. 2025, 14, 1147–1155. (In English) [Google Scholar] [CrossRef] [PubMed]
  15. Bilal, A.; Shafiq, M.; Obidallah, W.J.; Alduraywish, Y.A.; Tahir, A.; Long, H. Quantum chimp-enanced SqueezeNet for precise diabetic retinopathy classification. Sci. Rep. 2025, 15, 12890. [Google Scholar] [CrossRef] [PubMed]
  16. Zubair, M.; Umair, M.; Naqvi, R.A.; Hussain, D.; Owais, M.; Werghi, N. A comprehensive computer-aided system for an early-stage diagnosis and classification of diabetic macular edema. J. King Saud. Univ. Comput. Inf. Sci. 2023, 35, 101719. [Google Scholar] [CrossRef]
  17. Saini, D.J.B.; Sivakami, R.; Venkatesh, R.; Raghava, C.S.; Sandeep Dwarkanath, P.; Anwer, T.M.K.; Smirani, L.K.; Ahammad, S.H.; Pamula, U.; Amzad Hossain, M.; et al. Convolution neural network model for predicting various lesion-based diseases in diabetic macula edema in optical coherence tomography images. Biomed. Signal Process. Control 2023, 86, 105180. [Google Scholar] [CrossRef]
  18. Phan, C.; Hariprasad, S.M.; Mantopoulos, D. The Next-Generation Diagnostic and Therapeutic Algorithms for Diabetic Macular Edema Using Artificial Intelligence. Ophthalmic Surg. Lasers Imaging Retin. 2023, 54, 201–204. [Google Scholar] [CrossRef]
  19. Kumar, A.; Tewari, A.S. Classifying diabetic macular edema grades using extended power of deep learning. Multimed. Tools Appl. 2023, 83, 14151–14172. [Google Scholar] [CrossRef]
  20. Fu, Y.; Lu, X.; Zhang, G.; Lu, Q.; Wang, C.; Zhang, D. Automatic grading of Diabetic macular edema based on end-to-end network. Expert. Syst. Appl. 2023, 213, 118835. [Google Scholar] [CrossRef]
  21. Wang, T.-Y.; Chen, Y.-H.; Chen, J.-T.; Liu, J.-T.; Wu, P.-Y.; Chang, S.-Y.; Lee, Y.-W.; Su, K.-C.; Chen, C.-L. Diabetic Macular Edema Detection Using End-to-End Deep Fusion Model and Anatomical Landmark Visualization on an Edge Computing Device. Front. Med. 2022, 9, 851644. (In English) [Google Scholar] [CrossRef] [PubMed]
  22. Kumar, A.; Tewari, A.S.; Singh, J.P. Classification of diabetic macular edema severity using deep learning technique. Res. Biomed. Eng. 2022, 38, 977–987. [Google Scholar] [CrossRef]
  23. Nasir, N.; Afreen, N.; Patel, R.; Kaur, S.; Sameer, M. A transfer learning approach for diabetic retinopathy and diabetic macular edema severity grading. Rev. d’Intelligence Artif. 2021, 35, 497–502. [Google Scholar] [CrossRef]
  24. Stino, H.; Birner, K.; Steiner, I.; Hinterhuber, L.; Gumpinger, M.; Schürer-Waldheim, S.; Bogunovic, H.; Schmidt-Erfurth, U.; Reiter, G.S.; Pollreisz, A. Correlation of point-wise retinal sensitivity with localized features of diabetic macular edema using deep learning. Can. J. Ophthalmol. 2025, 60, 297–305. (In English) [Google Scholar] [CrossRef] [PubMed]
  25. Venkataiah, C.; Chennakesavulu, M.; Mallikarjuna Rao, Y.; Janardhana Rao, B.; Ramesh, G.; Sofia Priya Dharshini, J.; Jayamma, M. A novel eye disease segmentation and classification model using advanced deep learning network. Biomed. Signal Process. Control 2025, 105, 107565. [Google Scholar] [CrossRef]
  26. Ikram, A.; Imran, A. ResViT FusionNet Model: An explainable AI-driven approach for automated grading of diabetic retinopathy in retinal images. Comput. Biol. Med. 2025, 186, 109656. [Google Scholar] [CrossRef]
  27. Navaneethan, R.; Devarajan, H. Enhancing diabetic retinopathy detection through preprocessing and feature extraction with MGA-CSG algorithm. Expert. Syst. Appl. 2024, 249, 123418. [Google Scholar] [CrossRef]
  28. Muthusamy, D.; Palani, P. Deep learning model using classification for diabetic retinopathy detection: An overview. Artif. Intell. Rev. 2024, 57, 185. [Google Scholar] [CrossRef]
  29. Fu, Y.; Wei, Y.; Chen, S.; Chen, C.; Zhou, R.; Li, H.; Qiu, M.; Xie, J.; Huang, D. UC-stack: A deep learning computer automatic detection system for diabetic retinopathy classification. Phys. Med. Biol. 2024, 69, 045021. (In English) [Google Scholar] [CrossRef]
  30. Özbay, E. An active deep learning method for diabetic retinopathy detection in segmented fundus images using artificial bee colony algorithm. Artif. Intell. Rev. 2023, 56, 3291–3318. [Google Scholar] [CrossRef]
  31. Pugal Priya, R.; Saradadevi Sivarani, T.; Gnana Saravanan, A. Deep long and short term memory based Red Fox optimization algorithm for diabetic retinopathy detection and classification. Int. J. Numer. Method. Biomed. Eng. 2022, 38, e3560. (In English) [Google Scholar] [CrossRef]
  32. Berbar, M.A. Features extraction using encoded local binary pattern for detection and grading diabetic retinopathy. Health Inf. Sci. Syst. 2022, 10, 14. (In English) [Google Scholar] [CrossRef]
  33. Pan, Z.; Wu, X.; Li, Z. Central pixel selection strategy based on local gray-value distribution by using gradient information to enhance LBP for texture classification. Expert. Syst. Appl. 2019, 120, 319–334. [Google Scholar] [CrossRef]
  34. D S, R.; Saji, K.S. Hybrid deep learning framework for diabetic retinopathy classification with optimized attention AlexNet. Comput. Biol. Med. 2025, 190, 110054. [Google Scholar] [CrossRef]
  35. Singh, A.; Kumar, R.; Gandomi, A.H. Adaptive isomap feature extractive gradient deep belief network classifier for diabetic retinopathy identification. Multimed. Tools Appl. 2025, 84, 6349–6370. [Google Scholar] [CrossRef]
  36. Bindu Priya, M.; Manoj Kumar, D. MHSAGGCN-BCOA: A novel deep learning based approach for diabetic retinopathy detection. Biomed. Signal Process. Control 2025, 105, 107569. [Google Scholar] [CrossRef]
  37. Venkaiahppalaswamy, B.; Prasad Reddy, P.; Batha, S. Hybrid deep learning approaches for the detection of diabetic retinopathy using optimized wavelet based model. Biomed. Signal Process. Control 2023, 79, 104146. [Google Scholar] [CrossRef]
  38. Sushith, M.; Lakkshmanan, A.; Saravanan, M.; Castro, S. Attention dual transformer with adaptive temporal convolutional for diabetic retinopathy detection. Sci. Rep. 2025, 15, 7694. [Google Scholar] [CrossRef]
  39. Kufel, J.; Bargieł-Łączek, K.; Kocot, S.; Koźlik, M.; Bartnikowska, W.; Janik, M.; Czogalik, Ł.; Dudek, P.; Magiera, M.; Lis, A. What is machine learning, artificial neural networks and deep learning?—Examples of practical applications in medicine. Diagnostics 2023, 13, 2582. [Google Scholar] [CrossRef]
  40. Vasireddi, H.K.; K, S.D.; G, N.V.R. Deep feed forward neural network-based screening system for diabetic retinopathy severity classification using the lion optimization algorithm. Graefes Arch. Clin. Exp. Ophthalmol. 2022, 260, 1245–1263. (In English) [Google Scholar] [CrossRef]
  41. Asif, S. DEO-Fusion: Differential evolution optimization for fusion of CNN models in eye disease detection. Biomed. Signal Process. Control 2025, 107, 107853. [Google Scholar] [CrossRef]
  42. Karthika, S.; Durgadevi, M. Improved ResNet_101 assisted attentional global transformer network for automated detection and classification of diabetic retinopathy disease. Biomed. Signal Process. Control 2024, 88, 105674. [Google Scholar] [CrossRef]
  43. Al-Kahtani, N.; Varela-Aldás, J.; Aljarbouh, A.; Ishak, M.K.; Mostafa, S.M. Discrete migratory bird optimizer with deep transfer learning aided multi-retinal disease detection on fundus imaging. Results Eng. 2025, 26, 104574. [Google Scholar] [CrossRef]
  44. Bhimavarapu, U. Diagnosis and multiclass classification of diabetic retinopathy using enhanced multi thresholding optimization algorithms and improved Naive Bayes classifier. Multimed. Tools Appl. 2024, 83, 81325–81359. [Google Scholar] [CrossRef]
  45. Reddy, S.R.G.; Varma, G.P.S.; Davuluri, R.L. Resnet-based modified red deer optimization with DLCNN classifier for plant disease identification and classification. Comput. Electr. Eng. 2023, 105, 108492. [Google Scholar] [CrossRef]
  46. Minija, S.J.; Rejula, M.A.; Ross, B.S. Automated detection of diabetic retinopathy using optimized convolutional neural network. Multimed. Tools Appl. 2023, 83, 21065–21080. [Google Scholar] [CrossRef]
  47. Kulyabin, M.; Zhdanov, A.; Nikiforova, A.; Stepichev, A.; Kuznetsova, A.; Ronkin, M.; Borisov, V.; Bogachev, A.; Korotkich, S.; Constable, P.A.; et al. Octdl: Optical coherence tomography dataset for image-based deep learning methods. Sci. Data 2024, 11, 365. [Google Scholar] [CrossRef] [PubMed]
  48. Naren, O.S. Retinal OCT Image Classification—C8. Kaggle 2021. [Google Scholar] [CrossRef]
  49. Bhimavarapu, U.; Battineni, G. Automatic Microaneurysms Detection for Early Diagnosis of Diabetic Retinopathy Using Improved Discrete Particle Swarm Optimization. J. Pers. Med. 2022, 12, 317. (In English) [Google Scholar] [CrossRef] [PubMed]
  50. Melin, P.; Sánchez, D.; Cordero-Martínez, R. Particle swarm optimization of convolutional neural networks for diabetic retinopathy classification. In Fuzzy Logic and Neural Networks for Hybrid Intelligent System Design; Springer: Berlin/Heidelberg, Germany, 2023; pp. 237–252. [Google Scholar]
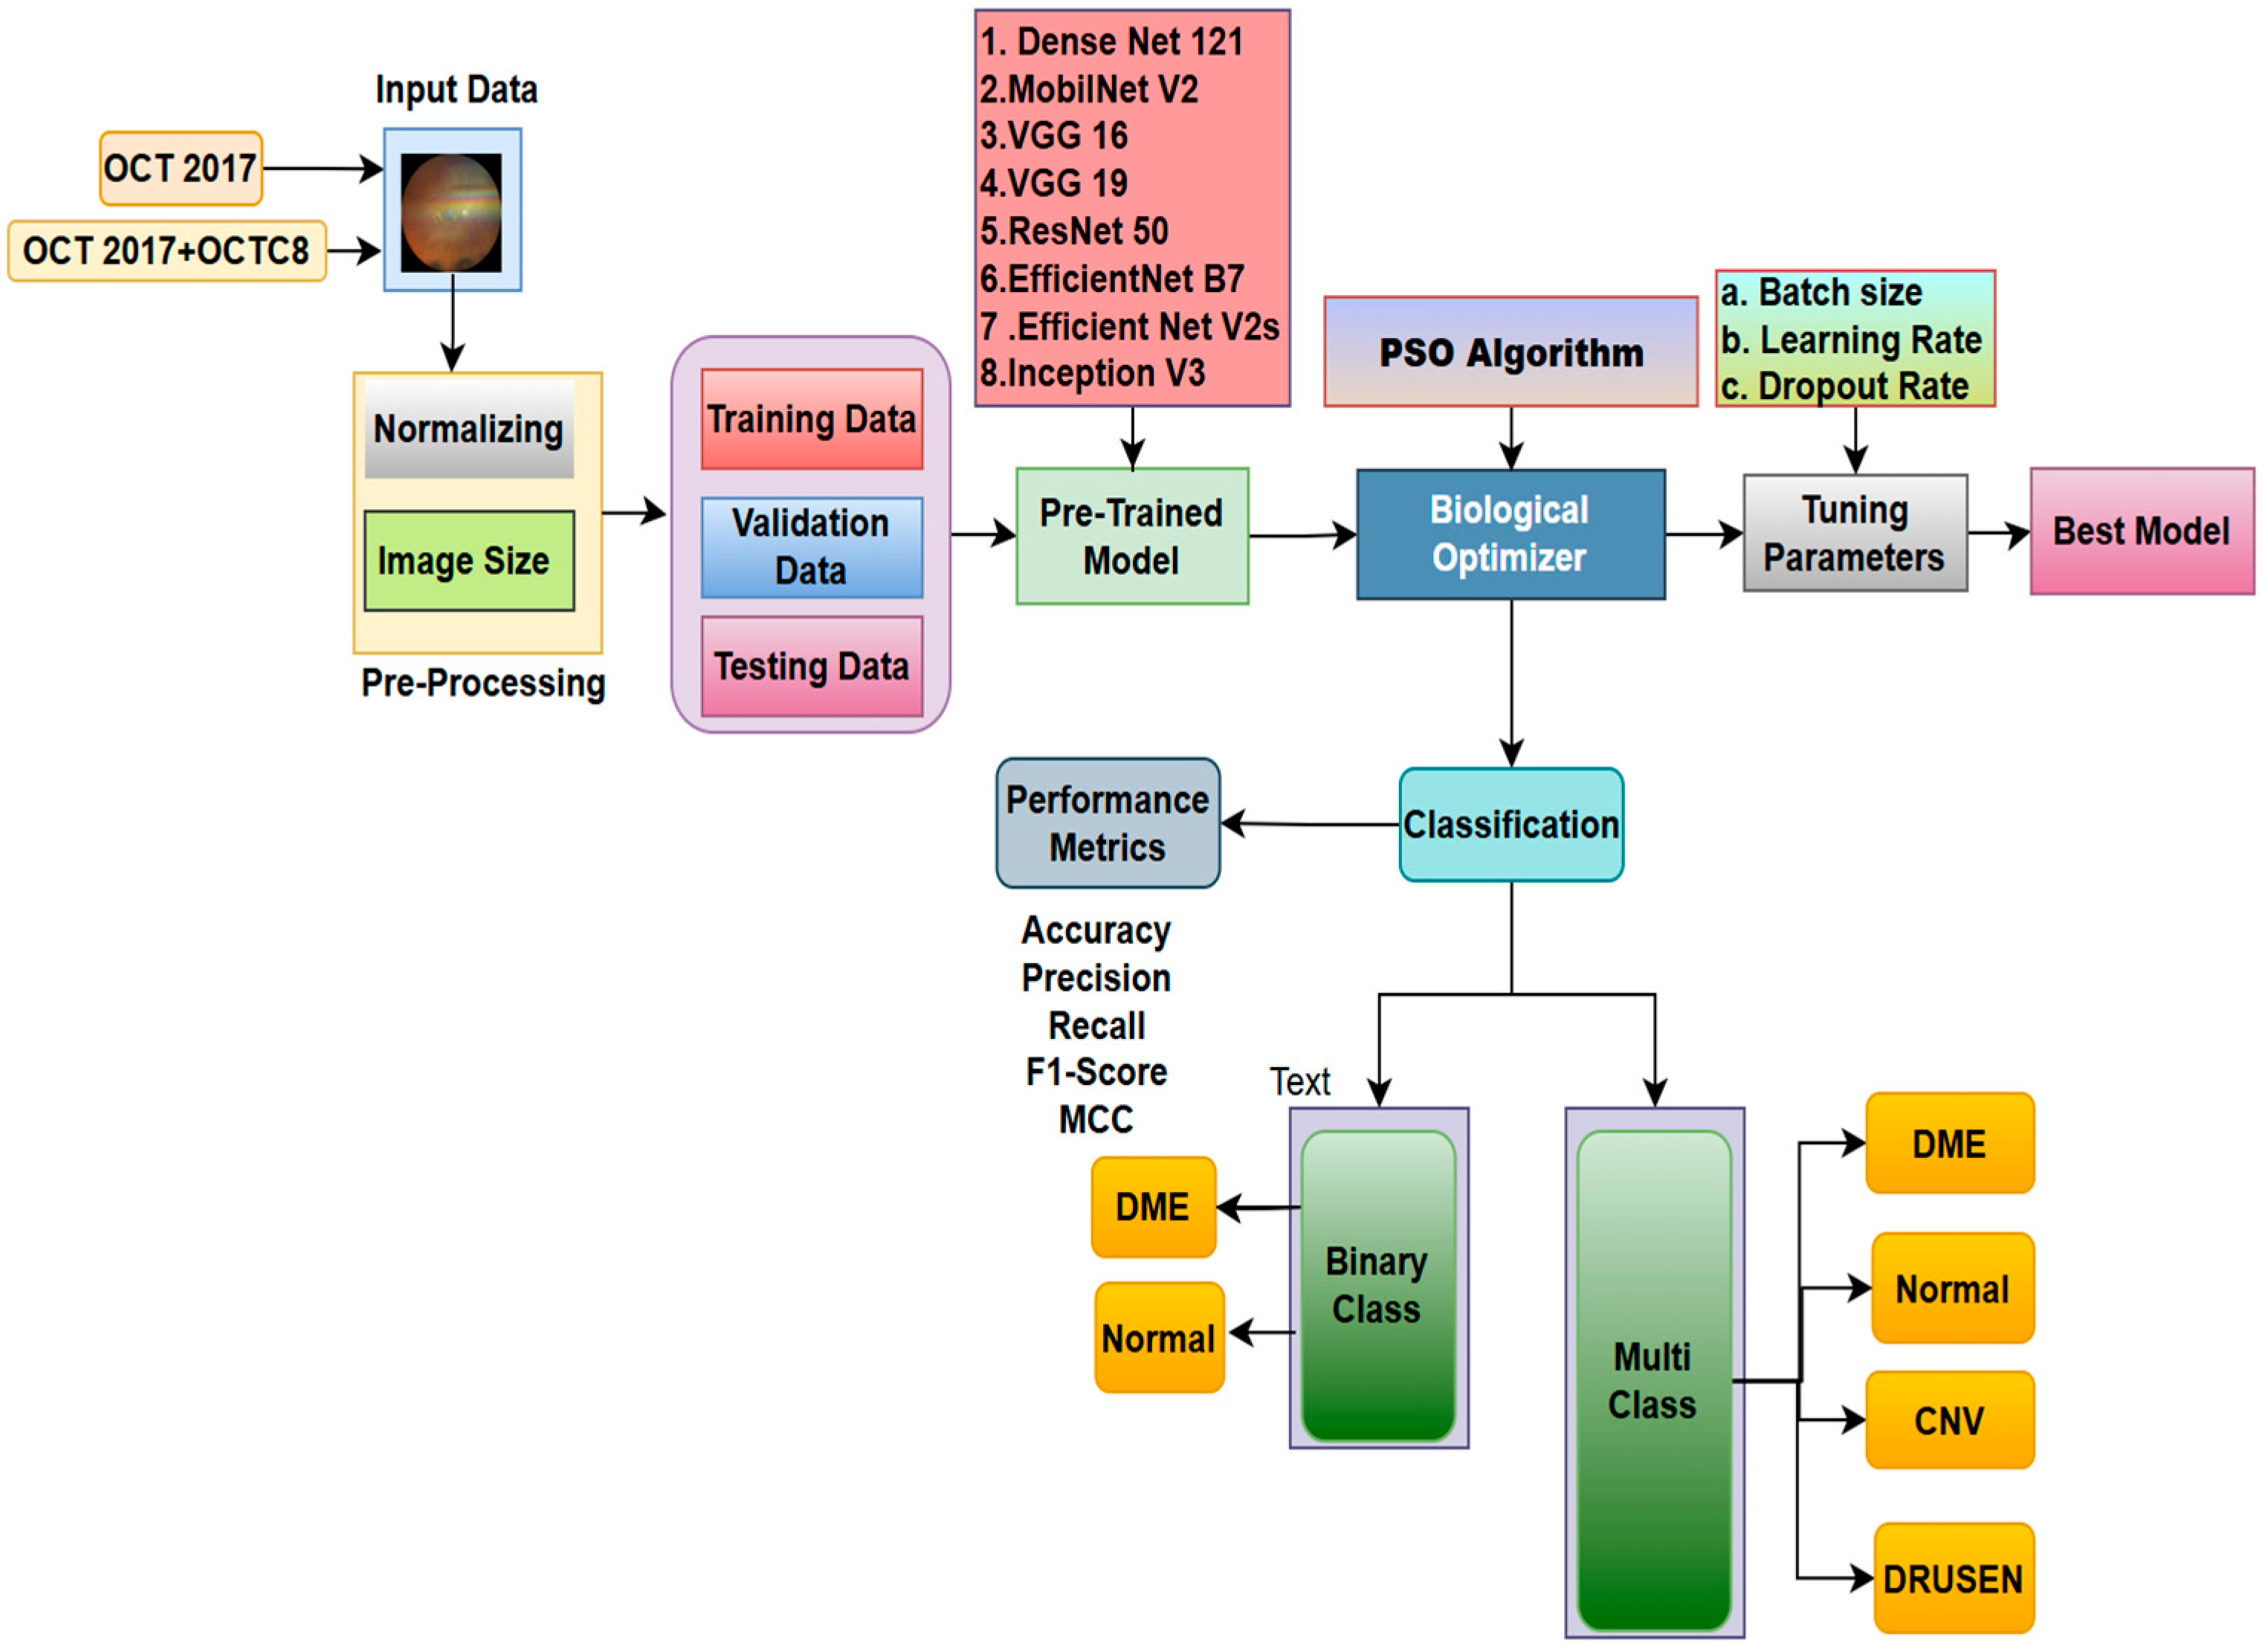
Figure 1. Block diagram for the proposed work.
Ai 06 00269 g001
Figure 2. Data Distribution for OCT2017.
Ai 06 00269 g002
Figure 3. Multi-class Data Distribution for OCT2017 and OCT2017 + OCT C8 datasets.
Ai 06 00269 g003
Figure 4. Sample class images.
Ai 06 00269 g004
Figure 5. Flow diagram of PSO for Parameter tuning.
Ai 06 00269 g005
Figure 6. Parameters Impact on Model.
Ai 06 00269 g006
Figure 7. Accuracy Loss plot of Inception V3 and MobileNet.
Ai 06 00269 g007
Figure 8. ROC Curve for Pretrained Models.
Ai 06 00269 g008
Figure 9. Accuracy Loss plot of Inception V3 for OCT2017 Dataset.
Ai 06 00269 g009
Figure 10. Accuracy Loss plot of Inception V3 for OCT2017 +OCTC8 Dataset.
Ai 06 00269 g010
Figure 11. ROC Plot for InceptionV3 with OCT 2017 and Mobile Net with OCT 2017 + C8 Dataset.
Ai 06 00269 g011
Figure 12. Accuracy and Loss plot for Inception V3 with PSO for the OCT 2017 dataset.
Ai 06 00269 g012
Figure 13. Accuracy and Loss plot for Mobile Net with PSO for the OCT 2017 + OCTC8 dataset.
Ai 06 00269 g013
Figure 14. Matrix plot for Inception V3 for the OCT 2017 dataset and OCT2017 + OCTC8 dataset with PSO.
Ai 06 00269 g014
Figure 15. PSO travel Path for OCT2017 and Combined Dataset.
Ai 06 00269 g015aAi 06 00269 g015b
Figure 16. Optimization Curves.
Ai 06 00269 g016
Figure 17. Coordinates Plots for both datasets.
Ai 06 00269 g017
Figure 18. Optimization Trajectory OCT2017 and OCT2017 + OCTC8 datasets.
Ai 06 00269 g018
Figure 19. Score Cam results for Inception V3 and Mobile Net for DME.
Ai 06 00269 g019
Table 1. Analysis of different models in DME classification.
ReferencesData Set and No. of SubjectsMethods and Models UsedEvaluation MetricsCrucial FindingsResearch Challenges
[8]T2DM-4259
External validation-N = 323
eXtreme Gradient Boosting (XGBoost), support vector machine (SVM), gradient boosting decision tree (GBDT), neural network (NN), and logistic regression (LR). The Shapley Additive Explanation (SHAP)AUC, sensitivity, specificity, F1-score, SHAP9:1 split ratioLimited Models used can be tried with transformer models.
[38]DRIVE
JPEG 40 color fundus images, including 7 abnormal pathology cases.
ADTATC (Attention dual transformer with adaptive temporal convolutional)Precision, Recall, Specificity,
F1-ScoreAccuracy, kappa coefficient
Batch size −32, epoch −50, loss function-categorical entropy loss. Dropout rate −0.5.Limited to supervised algorithms, Optimization algorithms can be used in the work.
[1]DiaRetDB1, APTOS 2019 dataset, Kaggle EyePACS.AGF and Contrast-Limited Adaptive Histogram Equalization (CLAHE)-Preprocessing
modified U-Net Architecture-Segmentation
DenseNet, and an OGRU enhanced by the SANGO algorithm -Classification
IoU, accuracy, precision, recall, F1-measure, and
Matthew Correlation Coefficient (MCC), Negative Predictive Value (NPV), Intersection over Union (IoU), and Dice Similarity Coefficient (DSC).
K-Fold cross validation  =  5
Self-adaptive Northern goshawk optimization for convergence rate
Optimized GRU Parameters tuned
[10]2750 samples provided by the Kaggle platform
3 classes
Deep ConvNetSpecificity, Sensitivity,
AUC ROC
80% and 20% train-test split
transfer learning, data augmentation, and class balancing.
optimizing the preprocessing techniques, optimizing the balancing techniques
[5]The OCT2017 dataset contains 84,452 retinal OCT images with 4 classesSwin Transformer V2Accuracy, Precision, Recall, F1-scoreThe loss function is improved by introducing PolyLossData set limitations and requirements of experts in the field.
[6]MESSIDOR dataset (1200 color numerical images)FunSWINAccuracy, Precision, Recall, F1-scoreModel convergence performanceData Limitations
[13]Eyepacs
Aptos
Messidor2
RESNET, VGG, EFFICIENT NETAccuracy, Precision, Recall, F1-scoreQuadratic Weighted KappaFuture work—Federated Learning (FL)
Table 2. Performance parameters of the transfer learning model.
Model NameCore Concept/InnovationKey Architectural FeaturesApprox. Parameters (Base Model, Include Top = False)
DenseNet121Dense Connectivity, Feature ReuseEach layer is connected to all subsequent layers within a dense block; transition layers for down-sampling.~7 M
MobileNetV2Lightweight, Mobile-FirstInverted residual blocks with linear bottlenecks; depth-wise separable convolutions.~2.2 M
VGG16Simplicity, UniformityStacks of small 3 × 3 convolutional filters; max-pooling layers. Relatively deep (16 layers).~14.7 M
VGG19Deeper VGG VariantLike VGG16, but with 19 layers (more 3 × 3 convolutional layers per block).~20.0 M
ResNet50Residual Learning, Skip ConnectionsResidual blocks that add input directly to the block output via “skip connections” to learn identity mappings.~23.5 M
EfficientNetB7Compound ScalingSystematically scales network depth, width, and resolution using a compound coefficient; uses inverted residual blocks (MBConv) and Squeeze-and-Excitation blocks.~66 M
EfficientNetV2SFaster Training, Improved EfficiencyBuilds on Efficient Net with training-aware neural architecture search; uses Fused-MBConv layers in early stages for faster training; smaller expansion ratios and 3 × 3 kernels in MBConv.~21 M
InceptionV3Parallel Convolutions, Factorization“Inception modules” performing parallel convolutions with different filter sizes (e.g., 1 × 1, 3 × 3, 5 × 5); factorization of convolutions (e.g., 5 × 5 into 1 × 5 and 5 × 1); auxiliary classifiers.~21.8 M
Table 3. PSO Parameters.
ParametersRange
Swam Size5
Maximum iteration5
Lower Bounds[0.00001, 16, 0.1]
Upper Bounds[0.001, 64, 0.5]
OptimizerADAM
Table 4. Hyperparameters of the Model.
ParametersRange
Image Size(224, 224)
Batch Size32
CallbacksES (10), RLROP (5)
Epochs60
OptimizerADAM
Data AugmentationRescale, Flip, Rotate (20)
Train-test-split70:30
Table 5. Performance Metrics of Binary Classification.
ModelsAccuracyPrecisionRecallF1-ScoreMisclassification RateMatthews Correlation CoefficientJaccard Index (IOU)Kappa Coefficient
DESNET 1210.9600.9600.9600.9600.0720.7040.5450.667
EfficentNetB70.5000.2500.5000.3300.5000.000.5000.000
Efficient Net V2S0.7700.8300.7700.7600.2290.6000.6820.541
RESNET500.6300.7700.6300.5800.3650.3790.5740.268
VGG-160.9400.9500.9400.9400.0550.8940.8990.888
VGG-190.9200.9300.9200.9200.0820.8450.8570.834
MobileNetV20.9800.9800.9800.9800.0240.9510.9520.950
Inception V30.9800.9800.9800.9800.0180.9630.9640.962
Table 6. Performance metrics of the OCT 2017 Dataset.
ModelsAccuracyPrecisionRecallF1-ScoreMisclassification RateMatthews Correlation CoefficientJaccard Index (IoU)Kappa Coefficient
DESNET 1210.900.910.900.900.010.870.810.86
EfficentNetB70.250.060.250.100.750.00.060.86
Efficient Net V2S0.530.710.530.430.410.410.300.86
RESNET500.480.250.480.320.520.260.240.86
VGG-160.880.900.880.870.120.840.770.86
VGG-190.880.900.880.880.120.840.780.86
MobileNetV20.910.920.910.910.080.880.840.86
Inception V30.900.910.900.900.010.870.810.86
Table 7. Performance metrics of OCT2017 + OCT C8 Combined dataset.
ModelsAccuracyPrecisionRecallF1-ScoreMisclassification RateMatthews Correlation CoefficientJaccard Index (IoU)Kappa Coefficient
DESNET 1210.8090.8310.8090.8040.1900.7550.6760.7461
EfficentNetB70.250.06250.25000.1000.75000.000.06250.00
Efficient Net V2S0.48820.600.48820.36770.51180.32800.25800.3176
RESNET500.4460.2290.4460.30080.5530.2300.2160.2618
VGG-160.78550.81400.78550.7720.21450.72560.64010.7140
VGG-190.77360.80400.77360.76540.22640.71090.62350.6982
MobileNetV20.89700.90560.89700.89560.10300.86640.81260.8626
Inception V30.9090.91570.90960.90860.09040.88220.83350.8795
Table 8. Performance Metrics using PSO.
ModelsAccuracyPrecisionRecallF1-ScoreMisclassification RateMatthews Correlation CoefficientJaccard Index (IoU)Kappa Coefficient
Inception V3 (OCT 2017)0.8960.91960.89670.89670.10330.87270.81930.8622
InceptionV3 (OCT 2017 + OCTC8)0.9130.91600.91050.90800.0894430.88100.83520.8807
Table 9. Optimized PSO parameters.
ModelsLearning RateBatch-SizeDropout Rate
Inception V30.000614590.9566
Mobile Net0.000254520.2636
Table 10. Performance metrics of the OCT2017 + OCT C8 Combined dataset after adding a dropout layer.
ModelsAccuracyPrecisionRecallF1-ScoreMisclassification RateMatthews Correlation CoefficientJaccard Index (IoU)Kappa Coefficient
MobileNetV20.80030.82210.80030.79430.19970.74300.66280.7337
Inception V30.78420.80180.78420.77870.21580.71990.64050.7123
Disclaimer/Publisher’s Note: The statements, opinions and data contained in all publications are solely those of the individual author(s) and contributor(s) and not of MDPI and/or the editor(s). MDPI and/or the editor(s) disclaim responsibility for any injury to people or property resulting from any ideas, methods, instructions or products referred to in the content.