Article

From Eye Movements to Personality Traits: A Machine Learning Approach in Blood Donation Advertising

by
Stefanos Balaskas
1,*,
Maria Koutroumani
1,
Maria Rigou
1 and
Spiros Sirmakessis
2
1
Department of Management Science and Technology, School of Economics and Business, University of Patras, 26334 Patras, Greece
2
Electrical and Computer Engineering Department, University of the Peloponnese, 26334 Patra, Greece
*
Author to whom correspondence should be addressed.
AI 2024, 5(2), 635-666; https://doi.org/10.3390/ai5020034
Submission received: 13 April 2024 / Revised: 29 April 2024 / Accepted: 8 May 2024 / Published: 10 May 2024
(This article belongs to the Special Issue Machine Learning for HCI: Cases, Trends and Challenges)

Abstract

:
Blood donation heavily depends on voluntary involvement, but the problem of motivating and retaining potential blood donors remains. Understanding the personality traits of donors can assist in this case, bridging communication gaps and increasing participation and retention. To this end, an eye-tracking experiment was designed to examine the viewing behavior of 75 participants as they viewed various blood donation-related advertisements. The purpose of these stimuli was to elicit various types of emotions (positive/negative) and message framings (altruistic/egoistic) to investigate cognitive reactions that arise from donating blood using eye-tracking parameters such as the fixation duration, fixation count, saccade duration, and saccade amplitude. The results indicated significant differences among the eye-tracking metrics, suggesting that visual engagement varies considerably in response to different types of advertisements. The fixation duration also revealed substantial differences in emotions, logo types, and emotional arousal, suggesting that the nature of stimuli can affect how viewers disperse their attention. The saccade amplitude and saccade duration were also affected by the message framings, thus indicating their relevance to eye movement behavior. Generalised linear models (GLMs) showed significant influences of personality trait effects on eye-tracking metrics, including a negative association between honesty–humility and fixation duration and a positive link between openness and both the saccade duration and fixation count. These results indicate that personality traits can significantly impact visual attention processes. The present study broadens the current research frontier by employing machine learning techniques on the collected eye-tracking data to identify personality traits that can influence donation decisions and experiences. Participants’ eye movements were analysed to categorize their dominant personality traits using hierarchical clustering, while machine learning algorithms, including Support Vector Machine (SVM), Random Forest, and k-Nearest Neighbours (KNN), were employed to predict personality traits. Among the models, SVM and KNN exhibited high accuracy (86.67%), while Random Forest scored considerably lower (66.67%). This investigation reveals that computational models can infer personality traits from eye movements, which shows great potential for psychological profiling and human–computer interaction. This study integrates psychology research and machine learning, paving the way for further studies on personality assessment by eye tracking.

1. Introduction

We live in an era where generated data is abundant; harnessing it can turn this information into essential knowledge. Machine learning or predictive analytics is a combined research field of statistics, artificial intelligence, and computer science [1,2,3]. In general, machine learning is about a system’s ability to perceive its environment and improve its actions through the knowledge it gains from it. In other words, machine learning can be considered a collection of methods that can automatically recognize various patterns in data and then, based on those patterns, predict future outcomes or make decisions under specific situations [3,4,5]. All this has the potential to be exploited using various algorithms that allow machines to understand multiple conditions, and based on them, decisions are made. Within such a structure, several challenges occur that must be dealt with. A primary concern is how the system acquires and internalizes knowledge derived from environmental changes and the methodology used to represent said knowledge for future use [4,5,6]. Furthermore, it is critical to identify the factors contributing to improving the system’s actions and prevent one action from interfering with another during these changes. This implies that the challenges may manifest in a way that complicates knowledge discovery.
Conversely, within machine learning, data is curated, selected, and organised in a manner that optimally fulfils specific objectives. Consequently, the challenge of knowledge discovery is simplified to a search endeavor aimed at identifying the most accurate description (be it models or patterns) among a range of possible descriptions. The insights gained from this knowledge discovery process are valid within the database, but their applicability to real-world scenarios is not guaranteed [5,6,7]. The application of knowledge discovery methodologies covers a broad spectrum of disciplines, including, but not limited to, medicine, economics, and marketing [6,7,8,9].
The growing usage of advanced prediction systems and artificial intelligence technologies has sparked interest in psychology and neuroscience [6,9,10,11]. From the perspective of psychological science, the brain is recognised as an information-processing machine. A central tenet of this theory is that learning and developing knowledge is achieved through the dialectical relationship between a person’s external stimuli and their reactions to them [10,12,13]. Thus, external variables influence and shape a person’s behaviour. The advancement of computational modelling has aided the advancement of cognitive psychology, and comparisons are made between cognitive theory and computer algorithms. Innovative approaches to understanding the mechanisms of human interaction with artificial systems are developed regularly, drawing on the knowledge provided by these two scientific disciplines. Arguments have been made that, in the future, we will be able to create programs capable of analysing individuals’ behavioural profiles and predicting their actions over specific time intervals [9,10,12,14].
Personality traits play a critical role in determining a person’s behavior and the recognition of their distinctiveness by other people. These form the basis upon which the overall personality and behaviour of the individual are built in various environments and over time [1,15,16,17]. Although each personality is considered distinct, possessing unique patterns of thinking, feeling, and behavior that act as a psychological signature, certain elements allow for the development of a methodological approach for measuring personality dimensions, thereby contributing to the establishment of an empirical basis for conclusions within the spectrum of cognitive sciences and the integration of machine learning approaches [16,17].
The objective of this study is to investigate viewing behaviour in the context of blood donation, how emotional stimuli can affect eye-movement patterns, and how machine learning algorithms can predict personality traits through those patterns. For this purpose, we created advertisements encouraging citizens to donate blood while their visual behavior was captured using eye-tracking technology. Eye-tracking metrics such as the fixation duration, saccade amplitude, and others were used to reflect visual attention and engagement for the different elements which comprise the advertisements. We analysed the interaction effects of different emotions and messaging types that impact eye-movement behaviour using statistical models (such as non-parametric tests, robust regression models, and GLM analysis).
This study goes beyond traditional methods to uncover the intricate relationship between visual behaviour and personality traits with innovative machine learning strategies. The study of eye movements in relation to emotions and personality has been revolutionised by the new machine learning techniques. Our research builds on earlier works like those by refs. [13,18,19], while additionally incorporating Support Vector Machines (SVM), k-Nearest Neighbours (KNN) and Random Forests which not only increase the accuracy but also enhance the robustness of these analyses. In fact, our implementation of support vector machines (SVM) has proved extremely helpful in dealing with non-linearities and other complications that come with eye-tracking data models’ sensitivity and specificity being improved significantly. Additionally, our approach addresses an aspect often overlooked in previous research, the interpretability of ML outputs, while ensuring they remain useful for practical applications. Thus, our methodology advances theoretical foundations and practical implications in behavioural and psychological research which have not been explicitly touched upon, providing clear contributions to the field. The findings can offer valuable information for effective marketing material design to promote public health campaigns by highlighting the importance of emotional stimuli and message framing while providing constructive feedback on other cognitive psychology approaches that attempt to understand apparent behaviour and personality [13,18,20,21].
The article is structured as follows: Section 2 provides the relevant literature review, introduces the theoretical supports, points out how personality traits are essential in different domains, and explores the possibility of eye movements as substitutes for these traits. It lays the infrastructure by reviewing earlier psychometrics and eye-tracking technology investigations, thus justifying the rationale behind researchers investigating the relationship between eye movements and personality. Section 3 provides a detailed description of the methodology we constructed and evaluated in our research, followed by the analysis and presentation of our findings in Section 4. Section 5 discusses and interprets the results of our study and identifies related limitations. Finally, we conclude and provide suggestions for future research.

2. Literature Review

By understanding how different personality traits influence information-seeking behaviour, developers can tailor interfaces and systems to accommodate users’ preferences and tendencies better, ultimately enhancing user experience and task efficiency. In their study, Al-Samarraie et al. [22] investigated the influence of the Big Five personality traits on online information-seeking behaviour. It involved 75 participants aged between 22 and 39 years. The participants were engaged in three information-seeking tasks: factual, exploratory, and interpretive tasks. Their personality profiles were assessed using the International Personality Item Pool Representation of the NEO PI-R (IPIP-NEO). Personality traits, as well as their interaction with fixations, showed a significant effect.
Similarly, in the study of Sarsam et al. [23], the researchers tried to predict participants’ personality traits based on their viewing behaviour. They used four machine learning algorithms: Sequential Minimal Optimisation (SMO) or Support Vector Machine (SVM), Random Forest, Bootstrap Aggregating (Bagging), and Instance-Based Learner (IBk). These algorithms were selected for their effectiveness in handling classification tasks and their ability to capture complex relationships within the data. A sample of 96 students aged 23–28 years old participated. The SMO classifier achieved the highest accuracy in classification at 96.73%. Following SMO, the Random Forest algorithm attained an accuracy of 82.54%, while Bagging and IBk trailed behind with accuracies of 74.68% and 64.51%, respectively.
In ref. [24], it was revealed that personality traits exist in online communication. The analyst focused on server-side network data from 43 respondents and experimented with different algorithms to train data. Of the seven classifiers, ZeroR, DTNB, PART, J48, LMT, REPTree, and Logistic, the LMT gave the highest accuracy (84.96). The same year, Al-Samarraie et al. [25] aimed to explore the influence of personality traits on users’ preferences in visual design presentations. They investigated the eye-movement behaviour of 50 participants to find their preferences. They used a Bagging classifier with a genetic search method to assess how eye parameters correlated with personality dimensions. The performance evaluations of the predictions relied on two metrics in each trial: correctly classified instances (CCI) and receiver operating characteristics (ROC). The accuracy of the Bagging classifier in five experiments was between 0.69 and 0.93 for CCI and 0.70 and 0.92 for ROC. The researchers in ref. [26] examined the eye movement patterns of 96 participants while they viewed five different visual presentations. In their study, they developed a prediction model to determine participants’ personality traits based on their fixation and saccadic eye parameters. The chosen algorithm was a Bagging classifier that gave accuracy from 0.79 to 0.90 based on the five traits (extraversion, agreeableness, conscientiousness, neuroticism, and openness to experience). In later years ref. [27], employing machine learning algorithms, attempted to predict 154 participants’ emotional intelligence profiles based on their eye movement parameters. The results indicated that individuals with varying self-control, emotionality, and sociability levels exhibited distinct viewing behaviours in response to visual stimuli. Remarkably, the Random Forest exhibited the highest classification accuracy (94.97%) for these EI profiles, reaching 94.97%, suggesting a strong association between eye movements and EI.
Ref. [28] explored the potential of connecting users’ personality traits with their design preferences to inform UI design, aiming to enhance user satisfaction with their service. They engaged 87 participants to design UIs tailored to specific personality types, and then 50 students evaluated their satisfaction with these UIs. They used the Apriori algorithm to generate and define patterns within the big five personality traits. Wu et al. [29], using a free-viewing eye-tracking paradigm, canonical correlation, and regression analyses, found significant correlations between personality traits and fixations towards specific regions, particularly the eye regions. They observed that extraversion and agreeableness were associated with greater gaze selection, whereas openness to experience was linked to reduced gaze selection. In ref. [9], the authors investigated the influence of personality on physiological data recorded during driving in response to near crashes and risky situations utilising machine learning (ML) techniques. Five ML algorithms were employed to discern the driver’s personality traits based on the Big Five Inventory and STAI traits. The ROC Area Under the Curve (AUC) was utilised to measure improvement. The results indicated that comparing the pseudo-wrapped and all possibilities methods led to an average improvement of 8.3% across all personality traits and algorithms. The ROC AUC for personality trait detection ranged from 0.968 to 0.974, with better detection rates for openness, agreeableness, and neuroticism.
The paper of Sun et al. [30] focuses on integrating information technologies into education to leverage mass data reflecting students’ actions in online environments for learning analytics. They used the learning analytics dashboard (LAD) to represent personalised indicators for students based on their personality traits. Initially, the study employs learning behaviour engagement (LBE) to characterise students’ learning behaviours and analyse significant differences among students with varying personality traits. Subsequently, selected behavioural indicators are incorporated into the LAD and distributed across different areas of interest (AOI). Additionally, the study analyses eye movement data, including the fixation duration, fixation count, heat map, and track map, revealing significant differences in visual indicators within AOIs, which aligns with the results observed for behavioural indicators. The article of Taib, Berkovsky, Koprinska, Wang, Zeng, and Li [12] explores different machine learning methods’ performance, identifies the most and least accurately predicted traits, and evaluates the significance of various stimuli, features, and physiological signals. They deployed seven classifiers: AdaBoost (AB), Decision Tree (DT), Logistic Regression (LR), Naive Bayes (NB), Random Forest (RF), Support Vector Machine (SVM), and k-Nearest Neighbour (KNN). NB was the most accurate classifier, achieving acc = 0.860, and it also outperformed other classifiers by 9.1%.
Using deep learning (LSTM), Seota, Klein, and Van Zyl [10] studied student e-behaviour and personality to predict and forecast whether a student is at risk of failing the year. They designed a machine learning-based intervention process to supplement existing performance analysis and intervention methods. This methodology provides metrics to measure factors affecting student performance, enhancing existing performance evaluation and intervention systems in education. The classifier used was the Decision Tree classifier. With engineered online behaviour and personality features, a Cohen’s kappa coefficient (κ) of 0.51 was achieved for identifying at-risk students.
Berkovsky, Taib, Koprinska, Wang, Zeng, Li, and Kleitman [13] proposed a framework for objective personality detection using humans’ physiological responses to external stimuli. In their case study, subjects were exposed to affective image and video stimuli, and their physiological responses were captured using a commercial-grade eye-tracking sensor. They used seven classifiers: AdaBoost (AB), Decision Tree (DT), Logistic Regression (LR), Naive Bayes (NB), Random Forest (RF), Support Vector Machine (SVM), and k-Nearest Neighbour (KNN). The NB classifier, with an 85.71% accuracy in prediction, was the most accurate. The study of Perlman et al. [31] utilised eye-tracking technology to explore the relationship between visual scanning patterns in response to emotional facial expressions and individual personality differences. They found a positive correlation between neuroticism and the amount of time spent focusing on the eyes of fearful faces. Their findings with a significant, positive correlation between neuroticism and the duration of time spent on the eyes for the total stimulus set (r = 0.37, p = 0.05) suggest that personality may influence social interaction by affecting fundamental aspects of social cognition, such as eye contact.
The study Khatri, Marín-Morales, Moghaddasi, Guixeres, Giglioli, and Alcañiz [14] focuses on classifying consumers based on the Big Five personality traits while they engage in tasks within a virtual shop. Behavioural measures obtained from VR hardware, including eye-tracking, navigation, posture, and interaction, are used for personality recognition. For the prediction of the SVM classifier, they used a K-fold cross-validation method with 10-fold, which gave an accuracy level of 0.78 for extraversion, 0.81 for conscientiousness, 0.85 for agreeableness, 0.80 for negative emotionality, and 0.79 for open-mindedness. Hilliard et al. [32] investigated the potential of a five-minute, forced-choice, image-based assessment of the Big Five personality traits for selection purposes. The initial phase involved developing and refining the assessment tool. In contrast, the subsequent phase focused on establishing scoring algorithms, validating them through convergent and discriminant validity evaluations, and assessing the potential for adverse impact. The accuracy ranged from 0.77 to 0.86 for each personal trait. The research of Salima et al. [33] showcases the effectiveness of machine learning techniques in predicting personality traits from eye movements, aiming to minimize biases and errors associated with self-reported questionnaires. Through experiments utilising Random Forest, Gradient Boosting, and Extreme Gradient Boosting algorithms, the study successfully predicted individuals’ Big Five personality traits based on their visual behaviour. The Random Forest achieved 60% accuracy, and the model with all of them achieved 80% accuracy. Woods et al. [34] monitored the eye movements of 180 participants as they browsed their Facebook news feed and applied a machine learning technique to predict each participant’s self-reported Big Five personality traits based on their viewing behaviour. Their findings indicated that specific visual behaviours can provide valuable information about an individual’s personality traits and significantly outperform chance predictions with just 20 s of viewing behaviour data. They applied k-Nearest Neighbours, ridge classification, Support Vector Machines, and naive Bayes classifiers. The accuracy of traits was spotted between 0.36 and 0.40.

3. Research Methodology

3.1. Experimental Design and Procedure

The experiment occurred in the Department of Management Science and Technology specialised laboratory at the University of Patras. Seventy-five people participated, a satisfying number that allowed for both qualitative and quantitative assessment of eye-tracking indicators, including the fixation count, fixation duration, saccade duration, and saccade amplitude. A within-subjects repeated measures design was employed, with subjects participating in all treatment conditions [35,36]. A “completely randomised factorial design” process was employed to avoid participant bias and to ensure that all treatment conditions were randomly assigned for each subject [37,38,39]. The laboratory area was also designed as an experiment room with soft lighting and insulation against external noises.
This study aims to explore through an experimental framework how emotional arousal and various elements of motivation can influence people’s willingness for voluntary blood donation. Six advertisements were created that fell into two categories based on their emotional valence (positive or negative). An additional incorporated element was the message framing, presented in two forms, either altruistic or egoistic textual messages, resulting in a sum of twelve ads. The aim was for all participants to be exposed to each advertising condition as described above and to document their emotions and intentions to donate blood following the termination of the experiment. It is essential to clarify that a pilot online survey ensured the appropriateness of stimuli to elicit the appropriate emotional responses. Our study was mainly concerned with analysing how recent marketing strategies could enhance credibility and engagement with potential volunteers by indicating specific emotional states, whether positive or negative. This strategy is aimed at evoking emotions such as interest, inspiration, and joy while simultaneously exploring how negative emotions—disgust, guilt, and fear—can result in discouragement or mistrust.
It is important to clarify that we conducted a pre-test as an online survey to ensure that the stimuli used in the experiment actually evoked the desired emotions. A convenience sample of 66 individuals evaluated 30 images—15 positive and 15 negative—each designed to elicit one of six emotions: joy, inspiration, interest, guilt, disgust, and fear, with each emotion prevailing in five distinct images. Participants rated each image on a five-point Likert scale according to the degree to which it elicited the respective emotion. Based on the pre-test results, we selected the six images that scored the highest for their emotional impact, successfully evoking three positive and three negative emotions, respectively. Additionally, based on the content of each image, we crafted message framings that communicated either altruistic or egoistic intentions. This pre-test phase ensured that the advertisements chosen for the main experiment were meticulously selected and resonated most strongly with individuals, effectively eliciting the desired emotional arousal.
Regarding message framing, the ads were classified as “altruistic” or “egoistic” depending on the primary motivation they appealed to. Altruistic ones stressed community benefits and social responsibility, contrary to egoistic ones, which focused on personal gain or benefits. To avoid semantic conflicts like negative emotions mixed with altruism, we followed the line of thinking that if negative emotions are presented as overcoming a societal problem, they can serve as powerful drivers for action [40,41,42]. Figure A1 in Appendix A depicts the two versions of the stimulus used to evoke the negative emotion of fear (one with altruistic and one with egoistic message framing). Additionally, Figure A2 and Figure A3 showcase examples of images for positive and negative emotions with their corresponding textual messages (altruistic or egoistic).
The altruistic adaptations of the advertisements encompassed messages such as “Have you considered the possibility that one of your close relatives needs blood urgently?” (Figure A1) and “Is a small and quick pinch so important... that you refuse to save the lives of three people?”. In contrast, the egoistic variants contained statements like “Volunteer blood donors have priority in case they need blood” and “Donating blood can increase the life span of the donor” (Figure A1) [43]. The aim was to augment the efficiency of promotional campaigns while circumventing potential prejudices and partiality towards specific, well-known blood donation services. Table 1 provides a detailed summary.
The participants had an in-depth orientation concerning the experimental protocol and its objectives, plus a brief explanation of the principles of blood donation. They were informed that they could stop participating without any reason and were told what data collection and analysis concern, as well as how eye-tracking equipment works; they were also reassured that it is not harmful to their eyes. Before starting, participants were asked to carefully review the participant consent form before signing it. In addition, all imposed safety measures were strictly observed per COVID-19 protective guidelines. After this introduction, a short preliminary questionnaire was given out for demographic information like age group, gender, and level of education to assist in attaining general opinions concerning blood donation. The eye-tracking examination came after the pre-test. Participants went through calibrations after filling out questionnaires. As mentioned earlier, the test stimuli were a series of static images randomly displayed. Each advertisement was exhibited for ten seconds, with grey screens between them to minimize any lingering visual effects from previous ads. Participation was voluntary and all subjects had perfect or near-perfect vision.

3.2. Eye-Tracking Device, Metrics, and Areas of Interest (AOIs)

Users were recorded by the Tobii Pro Nano [44], a portable eye-tracking device, and collected data were analysed and visualised using the iMotions software (version 9.4) [45]. Infrared illuminators were used in the study’s eye-tracking system to create reflection patterns on the corneas of participants’ eyes, a well-known procedure in the field. The analytical focus was on the spatial and temporal distribution of fixations. These were identified using an innovative I-VT (Identification by Velocity Threshold) algorithm based on the fundamental work of Komogortsev et al. [46,47] and the I-VT framework developed by Tobii [44]. The I-VT filtering mechanism is recognised as the standard for identifying fixations in eye-tracking data analysis. It operates by comparing ocular movement velocities to a specified threshold. Fixations are eye movements that decelerate below this threshold; saccades are those that accelerate over it. The iMotions software suite provided the stimulus display interface while simplifying the extraction of essential metrics from raw eye-tracking data, such as the fixation count, fixation duration, saccade duration, and saccade amplitude.
Parameters were set up with a velocity threshold of 30 degrees per second and a window length of 20 milliseconds to detect saccadic eye movements. For this, interpolation methods were used in the absence of data by not exceeding the maximal gap time of 75 milliseconds. The noise was reduced within the same timeframe using a moving average filter over a 75 millisecond period. To disregard temporary fixations, only those lasting at least sixty milliseconds were considered fixations. Moreover, these sequential fixations separated by more than seventy-five milliseconds and an angle difference of less than half a degree had to be combined for this angular measurement to be assessed within a predefined sample window size. All these parameters were chosen as they ensured accuracy and reliability in tracking eye movements, hence providing a sound basis for analysing visual attention activity patterns [11,48,49,50,51,52].
The Tobii Pro Nano Eye Tracker samples at 60 Hz. By combining dark and bright pupil-tracking techniques, it measures ocular activities with an accuracy of 0.3° under ideal conditions, and root mean square (RMS) precision in optimal situations is about 0.10° on an average basis. Consequently, the system provides output data like timestamps, gaze origin coordinates, gaze coordinates, pupil diameters, and validity codes for each eye, making it applicable to eye-tracking research under different experimental circumstances. A resolution of 1920 × 1080 pixels characterised the visual display utilised for the experiment. The monitor, with a diagonal screen size of 27 inches (aspect ratio 16:9), had dimensions of 33.6 cm in height and 59.8 cm in width. The observational distance maintained by the participants from the screen was set at 70 cm to ensure optimal visibility for the eye-tracking apparatus.
When we utilised the Tobii Pro Nano, we carefully adjusted the operating settings to collect accurate and comprehensive eye movement data. As previously stated, the device has a sampling rate of 60 Hz, which is suitable for monitoring rapid saccades and fixations triggered by dynamic visual inputs. To investigate nuanced gaze behaviours representing emotional and cognitive reactions, the calibration sensitivity was adjusted so that noise was minimised while measurement precision was increased [53,54]. These principles were pilot tested to ensure that they captured all of the necessary features for connecting eye movement measures with personality traits in the context of blood donation campaigns. This fine-tuning preserves natural viewing behaviour among participants, thus maintaining ecological validity in our findings [35,36].
Data from the gaze patterns across all images and specified areas of interest (AOIs) were systematically extracted and subjected to in-depth statistical analysis. The eye-tracking device consistently recorded data reflecting the frequency of visual attention throughout the participants’ engagement in the experiment. AOIs were strategically delineated to succinctly encapsulate and represent the aggregated attention metrics to facilitate a compelling synthesis of the extensive data. These AOIs were categorised into two primary groups reflecting the underlying emotional tone (positive or negative) and the nature of the textual message (altruistic or egoistic). Based on the fixation heatmaps generated by the iMotions software’s visual analysis capabilities, we identified and manually selected these AOIs to evaluate the variance in gaze and fixation patterns across the delineated groups. The generation of these heat maps, permitted the precise boundary of AOIs, thereby enabling more granular analyses of visual attention distributions. Regarding the data collected during the eye-tracking recording, this study focused on the following metrics:
  • Fixation Count: Average fixations/visits detected inside an active area of interest (AOI).
  • Fixation Duration: Average duration of all fixations/visits detected inside an active AOI. A visit is defined as the time interval between the first fixation on the active AOI and the end of the last fixation within the same active AOI, where there have been no fixations outside the AOI.
  • Saccade Duration: The average duration of all the respondents’ saccades detected inside the AOI.
  • Saccade Amplitude: The average amplitude of all the respondent’s saccades detected inside the AOI (i.e., the angular distance that the eyes travelled from the start point to the endpoint).

3.3. Measurements and Research Questions

The methodology involved demographic-based stratification and scaling measurement. Foundational participant pool profiles were created using demographic data, which could be used as covariates in subsequent analytic stages of the data across different cohorts. In the second phase of the research protocol, subjects were presented with a carefully selected range of adverts and given a post-exposure survey. This part of the research sought to understand whether these advertisements produced emotional reactions among respondents. Upon the termination of the eye-tracking experiment, participants answered the post-experiment questionnaire and evaluated the advertisements based on their exposure to the advertising prompts.
For our study’s statistical analysis and predictive modeling, emotional arousal was quantified using the Greek adaptation of Differential Emotion Scale (DES) as stated by Galanakis et al. [55]. The instrument categorizes emotional states into positive and negative ranges, signifying emotions such as joy, inspiration, and interest while representing emotions like guilt, disgust, and fear. In addition, the HEXACO personality framework was used to assess broader psychological traits [56,57]. Eye tracking data integration was twofold: firstly, it was an analytical tool in statistical data analysis demonstrating an association between visual attention patterns and self-reported emotions; secondly, it was a predictor for determining personality traits described in the HEXACO model. The HEXACO model categorizes personality into six domains: honesty–humility, emotionality, extraversion, agreeableness, and conscientiousness–openness to experience. Blood donors may have different personalities that influence their reasons for donating blood. For instance, individuals with high levels of honesty–humility might consider blood donation as a moral obligation or responsibility towards humanity. Furthermore, when it comes to emotionality, one’s feelings may help one feel sympathy for people in need, increasing the chances of donating. On the other hand, extroverts might be more likely to donate during social occasions or community events such as blood drives. It is also worth pointing out that agreeableness relates to one’s cooperativeness and readiness to assist others, making it a good prospect for blood donation. This approach enabled us to examine how different aspects of advertising exposure are linked to each other through emotional responses, personality traits, and eye gaze behaviours.
The idea behind our attempt to predict HEXACO traits through eye-tracking and machine learning is that there could be slight variations in visual attention and scanning behaviours that could reflect underlying dimensions of personality, providing a new way of understanding differences between individuals. Consequently, if eye movement data corresponding to known HEXACO profiles were used for training algorithms, it might be possible to improve personality assessment and gain more profound insights into cognitive and emotional processes underlying these traits. We have to better understand an individual’s behavior from their past actions or by knowing their psychological background to adopt more personalised approaches, thus improving the user experience or tailoring interventions in marketing, education, and health care, among other fields [23,24,26,32,33].
Thus, based on previous investigations, this study aims to explore and answer the following research questions:
RQ1: How do HEXACO personality traits influence eye-tracking metrics in response to different emotional and message-type stimuli in advertising content?
RQ2: How effectively can machine learning algorithms predict HEXACO personality traits from eye-tracking metrics, and which algorithm provides the most accurate and reliable predictions across different personality clusters?
Our attempt aims to provide an in-depth understanding of the main effects of eye-tracking metrics, in our case, the fixation duration, fixation count, saccade duration, and saccade amplitude, on personality traits, along with the interaction effects on different advertising stimuli and the possibility of developing machine learning models to predict personality traits based on eye-tracking data.

3.4. Sample Profile

As illustrated in Table 2, the sample’s descriptive statistics comprising 75 participants reflect an equal gender distribution, with males accounting for 56% of respondents and females accounting for 44%. Regarding age distribution, the “18–25” age group accounts for 85.3% of the sample, and the “26–30” age group accounts for 14.7%. In terms of educational background, the bulk of respondents (81.3%) are bachelor’s students, with graduates accounting for 8%.

4. Statistical Analysis and Machine Learning Results

By implementing streamlined statistical analysis, we can use machine learning to investigate how eye movements are linked to HEXACO personality traits in a blood donation setting. For this purpose, our endeavors focus on eye-tracking data and the metrics of fixation duration, fixation count, saccade duration, and saccade amplitude to predict personality dimensions. A range of machine learning algorithms was employed to identify common visual behaviours associated with different personality traits. The accuracy of our models is ensured by inferential and descriptive statistics combined with other measures since we want to provide patterns that associate visual behaviour with personality traits. This approach aims to holistically validate eye tracking utilisation for psychological and visual assessment. The analysis was conducted using Google Colab, providing a powerful platform for executing our statistical analysis and machine-learning models [58].

4.1. Data Handling and Assumptions

To examine outliers and capping values outside the defined thresholds, Z-scores were computed for each eye-tracking metric. They focused on deviations from the mean to identify data points significantly divergent from the dataset’s central tendency. Further analysis was performed using the inter-quartile range (IQR) method, which defined deviations as values exceeding 1.5 times IQR from lower or upper quartiles. This approach ensured the detection and handling of outlying cases were realised, improving subsequent analysis accuracy.
The purpose of employing Shapiro–Wilk and Kolmogorov–Smirnov tests in this study was to examine the normal distribution of variables [59,60]. The Shapiro–Wilk test revealed insignificant p-values (p < 0.001) for all the variables, indicating a significant departure from normality. Similarly, for the Kolmogorov–Smirnov test, all the p-values were below 0.05 conventional alpha levels, meaning none follow a normal distribution. Consequently, further analyses rely on non-parametric techniques to ensure the robustness and accuracy of findings derived from this study.
Subsequently, we tested multicollinearity, particularly concerning the HEXACO personality traits as predictors, and employed the variance inflation factor (VIF) to assess the degree of correlation among independent variables [61]. For the predictors encompassing emotionality through to honesty–humility, VIF values were recorded as follows: emotionality (VIF = 1.173), extraversion (VIF = 1.081), agreeableness (VIF = 1.233), conscientiousness (VIF = 1.276), openness (VIF = 1.328), and honesty–humility (VIF = 1.222). These values are significantly below the threshold levels (typically cited as 5 or 10), suggesting minimal multicollinearity among these HEXACO personality trait predictors [61]. This indicates that these predictors maintain relative independence from one another regarding the explained variance in the dependent variables, thus mitigating the potential for multicollinearity to obscure the individual contributions of correlated predictors within the regression model.
The results from the Breusch–Pagan and White tests both indicate the presence of heteroscedasticity in our data [62,63,64]. The p-values in both tests are less than the commonly used threshold (p < 0.05), suggesting that the variance in the residuals is not constant across all levels of the independent variables and, therefore, the assumption of homoscedasticity, which is decisive for standard linear regression models, is violated. The Levene test was employed to assess the equality of variances for the eye-tracking metrics and demonstrated significant Levene statistic values (p < 0.001) across all variables, confirming the assumption of unequal variances among the groups and suggesting heterogeneity of variance [65,66].
Based on the tests mentioned above, we employed nonparametric methodologies as alternatives since they do not rely on the assumptions of equations or the normal distribution of residuals [67,68,69]. Another good way of coping with data variability without reducing the degree of accuracy in the analysis is using robust regression models that can withstand usual model assumption violations [70,71,72]. This is important for maintaining statistical reliability while working with visual data, necessitating a more flexible and robust means of obtaining meaningful interpretations in eye-tracking research strategies.

4.2. Non-Parametric Results

4.2.1. Group Comparisons and Differences

Exploratory correlation analysis using the HEXACO personality model revealed significant relationships with eye-tracking metrics, including honesty–humility, emotionality, extraversion, agreeableness, conscientiousness, and openness. Notably, conscientiousness shows a positive correlation with openness (r = 0.23, p < 0.001), depicted in Figure 1. This correlation, although modest, suggests that individuals scoring high in conscientiousness might also exhibit greater open-mindedness in cognitive engagements, consistent with findings in refs. [21,41,73]. Conversely, agreeableness is negatively correlated with fixation duration (r = −0.03, p = 0.031), indicating that more agreeable individuals may have shorter fixation durations. Though statistically significant, the weak nature of this correlation suggests it may have limited impact, underscoring the need for further investigations with statistical modelling.
The Kruskal–Wallis H test was employed to explore any differences in eye-tracking metrics across several independent groups, such as different ad types [67,69,74,75]. The results showed significant differences in how various eye-tracking metrics are distributed across each AOI group (fixation duration (H = 83.593, p < 0.001), saccade duration (H = 1030.702, p < 0.001), saccade amplitude (H = 205.736, p < 0.001), and fixation count (H = 1441.419, p < 0.001)). Based on these findings, it is apparent that visual attention and engagement are influenced by variables under label AOIs as captured using eye-tracking techniques in this study. Moreover, we evaluated the emotion type (positive/negative) and message type (altruistic/egoistic). For the emotion type, none of the eye-tracking metrics showed significant differences between groups, with p-values exceeding the 0.05 threshold: fixation duration (H = 0.705, p = 0.401), saccade duration (H = 1.097, p = 0.295), saccade amplitude (H = 0.297, p = 0.586), and fixation count (H = 0.131, p = 0.718). In contrast, the message type had a significant effect on some of the eye-tracking measures. Saccade duration showed a highly significant difference (H = 41.654, p < 0.001), as did the fixation count (H = 82.156, p < 0.001). The fixation duration approached significance (H = 3.691, p = 0.055), and saccade amplitude was significant (H = 3.929, p = 0.047). We present the significant findings from the Kruskal–Wallis tests in Table 3. The table highlights the metrics where statistically significant differences were observed, indicating substantial variations in eye-tracking measures across different ad types and between message framings.
Since the Kruskal–Wallis test is omnibus, it does not tell us which specific groups are different from each other. To determine that, we performed post hoc tests, such as pairwise comparisons with a correction for multiple testing. One standard method is the Mann–Whitney U test with Bonferroni correction [76].

4.2.2. Mann–Whitney U Test with Bonferroni Correction

Significant results were observed under the ’Type’ category in the analysis of eye-tracking metrics using the Mann–Whitney U test [76]. Specifically, the comparison between the ‘emotion’ and ‘logo’ types for the fixation duration metric yielded a statistically significant result (U = 176,044.5, p < 0.001), indicating a substantial difference in fixation duration between these two types of stimuli. Additionally, significant differences were noted between ‘emotion’ and ‘text’ (U = 390,524.0, p < 0.001). These results suggest that the type of stimulus, whether an emotional expression or a logo versus text, may influence how viewers distribute their visual attention as observed by fixation duration.
The findings of the analysis showed significant differences in saccade duration. For instance, a comparison between ‘emotion_disgust_altr’ and ‘emotion_inter_altr,’ as well as ‘emotion_inter_ego,’ yielded statistically significant results (p < 0.001), indicating a notable dissimilarity in saccade duration among these categories. Comparable differences were noted between ‘emotion_disgust_altr’ and several others like ‘logo_disgust_altr,’ ‘logo_fear_altr,’ and “logo_joy_altr” (p < 0.001). It was discovered that when measuring against the message type, the former had some distinction from the latter ‘altr’ and ‘ego’ (U-value = 660,466.0, p < 0.001), which implies that message framings significantly affect saccade duration during exposure to advertising content. Therefore, these significant results clearly show that both stimulus content and message style can substantially influence human eye movement behaviours when watching visual ads, thereby resulting in some aspects of engagement and information processing within visualising promoting concepts. Moreover, there were also significant discrepancies between saccadic durations in various pairs such as “emotion vs. logo” (U = 270,728.0, p < 0.001), “emotion vs. text” (U = 571,833.0, p < 0.001), and “logo vs. text” (U = 61,391.0, p < 0.001), among others, indicating strong effects of the stimulus type on eye movement patterns across stimulus types (Table 4).
Regarding the saccade amplitude metric, a significant result was observed for the pairwise comparison of the message type between ‘altr’ and ‘ego’ (U = 596,376.5, p-value = 0.047). This shows a substantial difference in saccade amplitude between altruistic and egoistic message framings. Furthermore, significant differences were detected between ‘emotion vs. text2’ (U = 23,383.5, p = 0.001969), indicating that specific textual content plays a notable role in shaping eye movements during perception. These findings suggest that different visual attention processes operate according to various eye movement metrics regarding the message type.
In the pairwise analysis for the fixation Count, the Mann–Whitney U test revealed several significant results, underscoring the effect of different AOIs on fixation counts (Table 5). Remarkably, significant results were observed when comparing ‘emotion_fear_altr’ with ‘emotion_disgust_altr’ (U = 3103.5, p < 0.001), ‘emotion_insp_altr’ (U = 981.0, p < 0.001), ‘emotion_insp_ego’ (U = 1669.5, p < 0.001), and ‘emotion_joy_altr’ (U = 1932.0, p < 0.001); this means that the fixation count differed when respondents watched ads with different emotional appeals. Furthermore, the message type comparison between ‘altr’ and ‘ego’ (U = 438,168.5, p < 0.001) and the ‘Type’ comparison between ‘emotion’ and ‘logo’ (U = 278,041.0, p < 0.001), as well as ‘emotion’ and ‘text’ (U = 190,139.0, p < 0.001), were significant. These findings reflect the critical role of content and message framing in determining the fixation count during visual engagement with stimuli. Similarly, significant differences in fixation counts were observed when comparing ‘emotion_disgust_altr’ with all ‘logo’ types, including ‘logo_disgust_altr,’ ‘logo_fear_altr,’ and ‘logo_joy_altr’ (p < 0.001), suggesting that the visual characteristics of logos versus emotional content significantly influence fixation behaviours.

4.2.3. Friedman Test Analysis for Emotional Stimuli

The Friedman test was utilised to differentiate statistically significant differences in eye-tracking metrics of emotional expressions in the emotion type category [75]. This non-parametric test is appropriate for comparing multiple related groups, and it uncovered important differences between emotions like guilt, fear, joy, and disgust, stressing the sensitivity of certain emotional stimuli to eye movements.
Significant differences among emotional expressions were observed across various eye-tracking metrics, as indicated by the Friedman test results. Substant variability was noted for the fixation duration metric within the emotion category (Friedman test statistic = 21.57, p = 0.00063). Significant differences were also revealed by the saccade duration metric (Friedman test statistic = 68.33, p < 0.001). Additionally, a considerable variability among emotions was identified concerning the saccade amplitude metric (Friedman test statistic = 15.36, p = 0.00894). Finally, the fixation count metric demonstrated marked emotional differences (Friedman test statistic = 69.29, p < 0.001). These eye-tracking metrics demonstrate these outcomes and show how different emotional stimuli influence visual attention and processing significantly.
Based on the Friedman test results, additional post hoc pairwise comparisons were made using Dunn’s test to identify specific differences between pairs of emotion groups. This method solves the multiple comparisons problem and thus ensures that the inferential analysis is robust [68]. Consequently, these findings indicate the crucial need for investigating more minute emotional differentiations within clusters to reveal significant trends in eye-tracking measures as they capture visual attention and processing.
Dunn’s post hoc test found significant differences in eye-tracking metrics across various emotions within the emotion category. This increased the broader understanding of visual attention dynamics. Notably, the fixation duration metric presented a unique case whereby the disgust and joy had a distinctive pathway (p = 0.005113), illustrating different emotion-related images that often evoke diverse patterns of visual engagement. The saccade duration metric also showed important differences, mainly between disgust, fear (p = 0.000129), and guilt (p = 0.011523), as well as within interaction conditions (p = 0.000351), implying that emotional content determines saccadic durations to different extents. Additionally, the saccade amplitude metric analysis demonstrated a significant difference between disgust and fear (p = 0.005214). This shows how amplitudes of saccades change under mentions with different emotional cues throughout this disorder. The fixation count metric illustrated significant differences, particularly between disgust and guilt (p = 0.020664) and interaction conditions (p = 0.002053), indicating how fixations may vary greatly concerning viewer’s engagement in emotionally laden content. The significance of these findings revealed through Dunn’s post hoc analysis is that it would require scrutinising eye-tracking metrics at such minute levels to comprehend intimate associations linking emotional stimuli with visual attention behavior patterns (Table 6).

4.3. Robust Regression Models

The next step was examining the relationships between the eye-tracking metrics and the HECAXO personality traits. To deal with the effect of outliers on the regression model, we used a robust linear model based on Huber’s T norm [77,78,79]. This method reduces the impact of residuals due to outliers by using weights, thus making the regression analysis stable. Consequently, it can deal with non-normal data using Huber’s T norm and remain robust against anomalous observations. This approach allows for a balance between data sensitivity and resistance to outliers, ensuring the reliability of the regression results [70,71,72,80].
It was observed that HEXACO personality traits significantly relate to different eye-tracking measures in the robust linear model regression using Huber’s T norm.
Regarding fixation duration, honesty–humility was the only significant predictor demonstrating a negative relationship (coef = −14.20, z = −2.43, p = 0.015, 95% CI [−25.67, −2.73]). This means that people with higher levels of honesty–humility have shorter fixation durations, which may indicate faster visual tasks and decision-making processes. Also, openness emerged as a significant predictor during the saccade duration capped analysis (coef = 358.98, z = 3.08, p = 0.002, 95% CI [130.60, −587.36]). Hence, it can be concluded that increased openness is associated with an extended scanning pattern in which individuals are open to new experiences. Extraversion significantly affected saccade amplitude scaled with saccade amplitude (coef = 7.37, z = 2.49, p = 0.013, 95% CI [1.57, −13.18]). The results suggest an increasing link between extraversion and larger saccade amplitudes, indicating greater visual exploration ability for extroverted people due to heightened engagement with surroundings. Finally, the fixation count metric identified openness as the most significant predictor (coef = 1.02, z = 2.01, p = 0.044; 95% CI [0.02, −2.02]). This implies that subjects with higher scores on openness tend to have more fixations, possibly suggesting deeper visual processing or broader interests within the field of view. The results highlight how certain personality traits interact with attention patterns, emphasizing how individual differences can affect visual stimuli and engagement. The significant results are presented in Table 7.
We calculated the root mean square error (RMSE) in the analysis to add a quantitative dimension to the robust regression findings and examine how accurately the model predicts various indices of eye-tracking. Specifically, RMSE values for fixation duration (146.69), saccade duration (2064.61), saccade amplitude (51.96), and fixation count (8.67) indicate typical deviations from observed values that can be used to inform subsequent improvements to the machine learning model. They are also helpful for machine learning algorithms that want to optimize further model performance evaluation based on the given RMSE values per metric. Therefore, predictive modelling should minimize RMSE but simultaneously account for these metrics, revealing how eye movements further influence viewing patterns [81]. Not only will this increase the models’ explanatory capability, but it will also enable an understanding of the relationship between the personalities and visual perception of our participants.

4.4. Interaction Effects with Generalised Linear Models (GLMs)

Generalised linear models (GLMs) were employed on the eye-tracking metrics data to examine the HEXACO personality traits and the interaction effects of emotion with message type as independent variables. This method helped us to evaluate how individual personality differences affect individuals’ responses to communicative or emotional stimuli in eye-tracking experiments.
In particular, we employed GLMs with log link functions as a suitable model for this study. Eye-tracking data like the fixation duration or saccade amplitude are not normally distributed and can best be modelled using GLMs to correct the skewness and kurtosis associated with such data [82,83,84]. Additionally, the log link function deals with uneasiness in modelling because of the positiveness and continuity of eye-tracking data, guaranteeing that predictions fall within realistic limits [83,85,86,87]. Furthermore, the inclusion of categorical variables and their interactions into the model is made possible by GLMs, enabling us to study interaction effects and uncover how different factors influence eye movement. This approach aligns with current trends in eye-tracking research where complicated models are employed to unravel the dynamics of visual cognition and behavior [53,54,88,89]. Employing GLMs allows us to estimate personality and stimulus type impacts accurately.
Fixation duration was used as the dependent variable, and a GLM with a log link function was applied to study the influences of the emotional and message type variables on fixation durations. The model had mediocre explanatory power (R2 = 0.008903). It was also found that there was no statistically significant interaction between positive emotions and ego message type (b = 0.0413, SE = 0.057, z = 0.723, p = 0.470, 95% CI [−0.071, 0.153]). Similarly, the main effect of positive emotions alone was insignificant (b = 0.0275, SE = 0.035, z = 0.791, p = 0.429, 95% CI [−0.041, 0.096]). However, the main effect of the ego message type showed a small but significant negative influence on fixation durations (b = −0.0849, SE = 0.042, z = −2.001, p = 0.045, 95% CI [−0.168, −0.002]). Of all personality traits examined, only honesty–humility was significant and indicated that lower levels of honesty–humility are associated with shorter fixation durations (b = −0.0835, SE = 0.029, z = −2.858, p = 0.004, 95% CI [−0.141, −0.026]). Other personality traits like extraversion, agreeableness, conscientiousness, openness, and emotionality showed no statistically significant results.
The saccade duration metric accounted for a small portion of variance (R2 = 0.03505). The interaction between positive emotions and the ego message type was statistically significant, indicating that saccade durations were enhanced by this combination of variables (b = 0.2222, SE = 0.050, z = 4.478, p < 0.001, 95% CI [0.125, 0.319]). However, positive emotions alone also had no considerable impact on saccade durations (b = −0.0285, SE = 0.028, z = −1.016, p = 0.310, 95% CI [−0.084, 0.027]). Saccade duration was negatively affected by the main effect of the ego message type (b = −0.2729, SE = 0.038, z = −7.156, p < 0.001, 95% CI [−0.348, −0.198]). Only openness showed a significant correlation between large saccade durations as per the results, and it was statistically significant (b = 0.0920, SE = 0.031, z = 2.932, p = 0.003, 95% CI [0.031, 0.154]). No statistically significant effect was detected from any other personality factors.
With saccade amplitude as the dependent variable of the model (R2 = 0.009116), the interaction between positive emotions and the ego message type was not statistically significant (b = −0.0312, SE = 0.024, z = −1.300, p = 0.194, 95% CI [−0.078, 0.016]). In addition, the main effect of positive emotions alone had no significant influence on saccade amplitude (b = 0.0211, SE = 0.015, z = 1.406, p = 0.160, 95% CI [−0.008, 0.051]). The main effect of the ego message type had a non-significant impact on saccade amplitude (b = −0.0120, SE = 0.017, z = −0.692, p = 0.489, 95% CI [−0.046, 0.022]). However, only extraversion was statistically significant in that higher levels of extraversion were associated with longer saccade amplitudes (b = 0.0419, SE = 0.016, z = 2.543, p = 0.011, 95% CI [0.010, 0.074]).
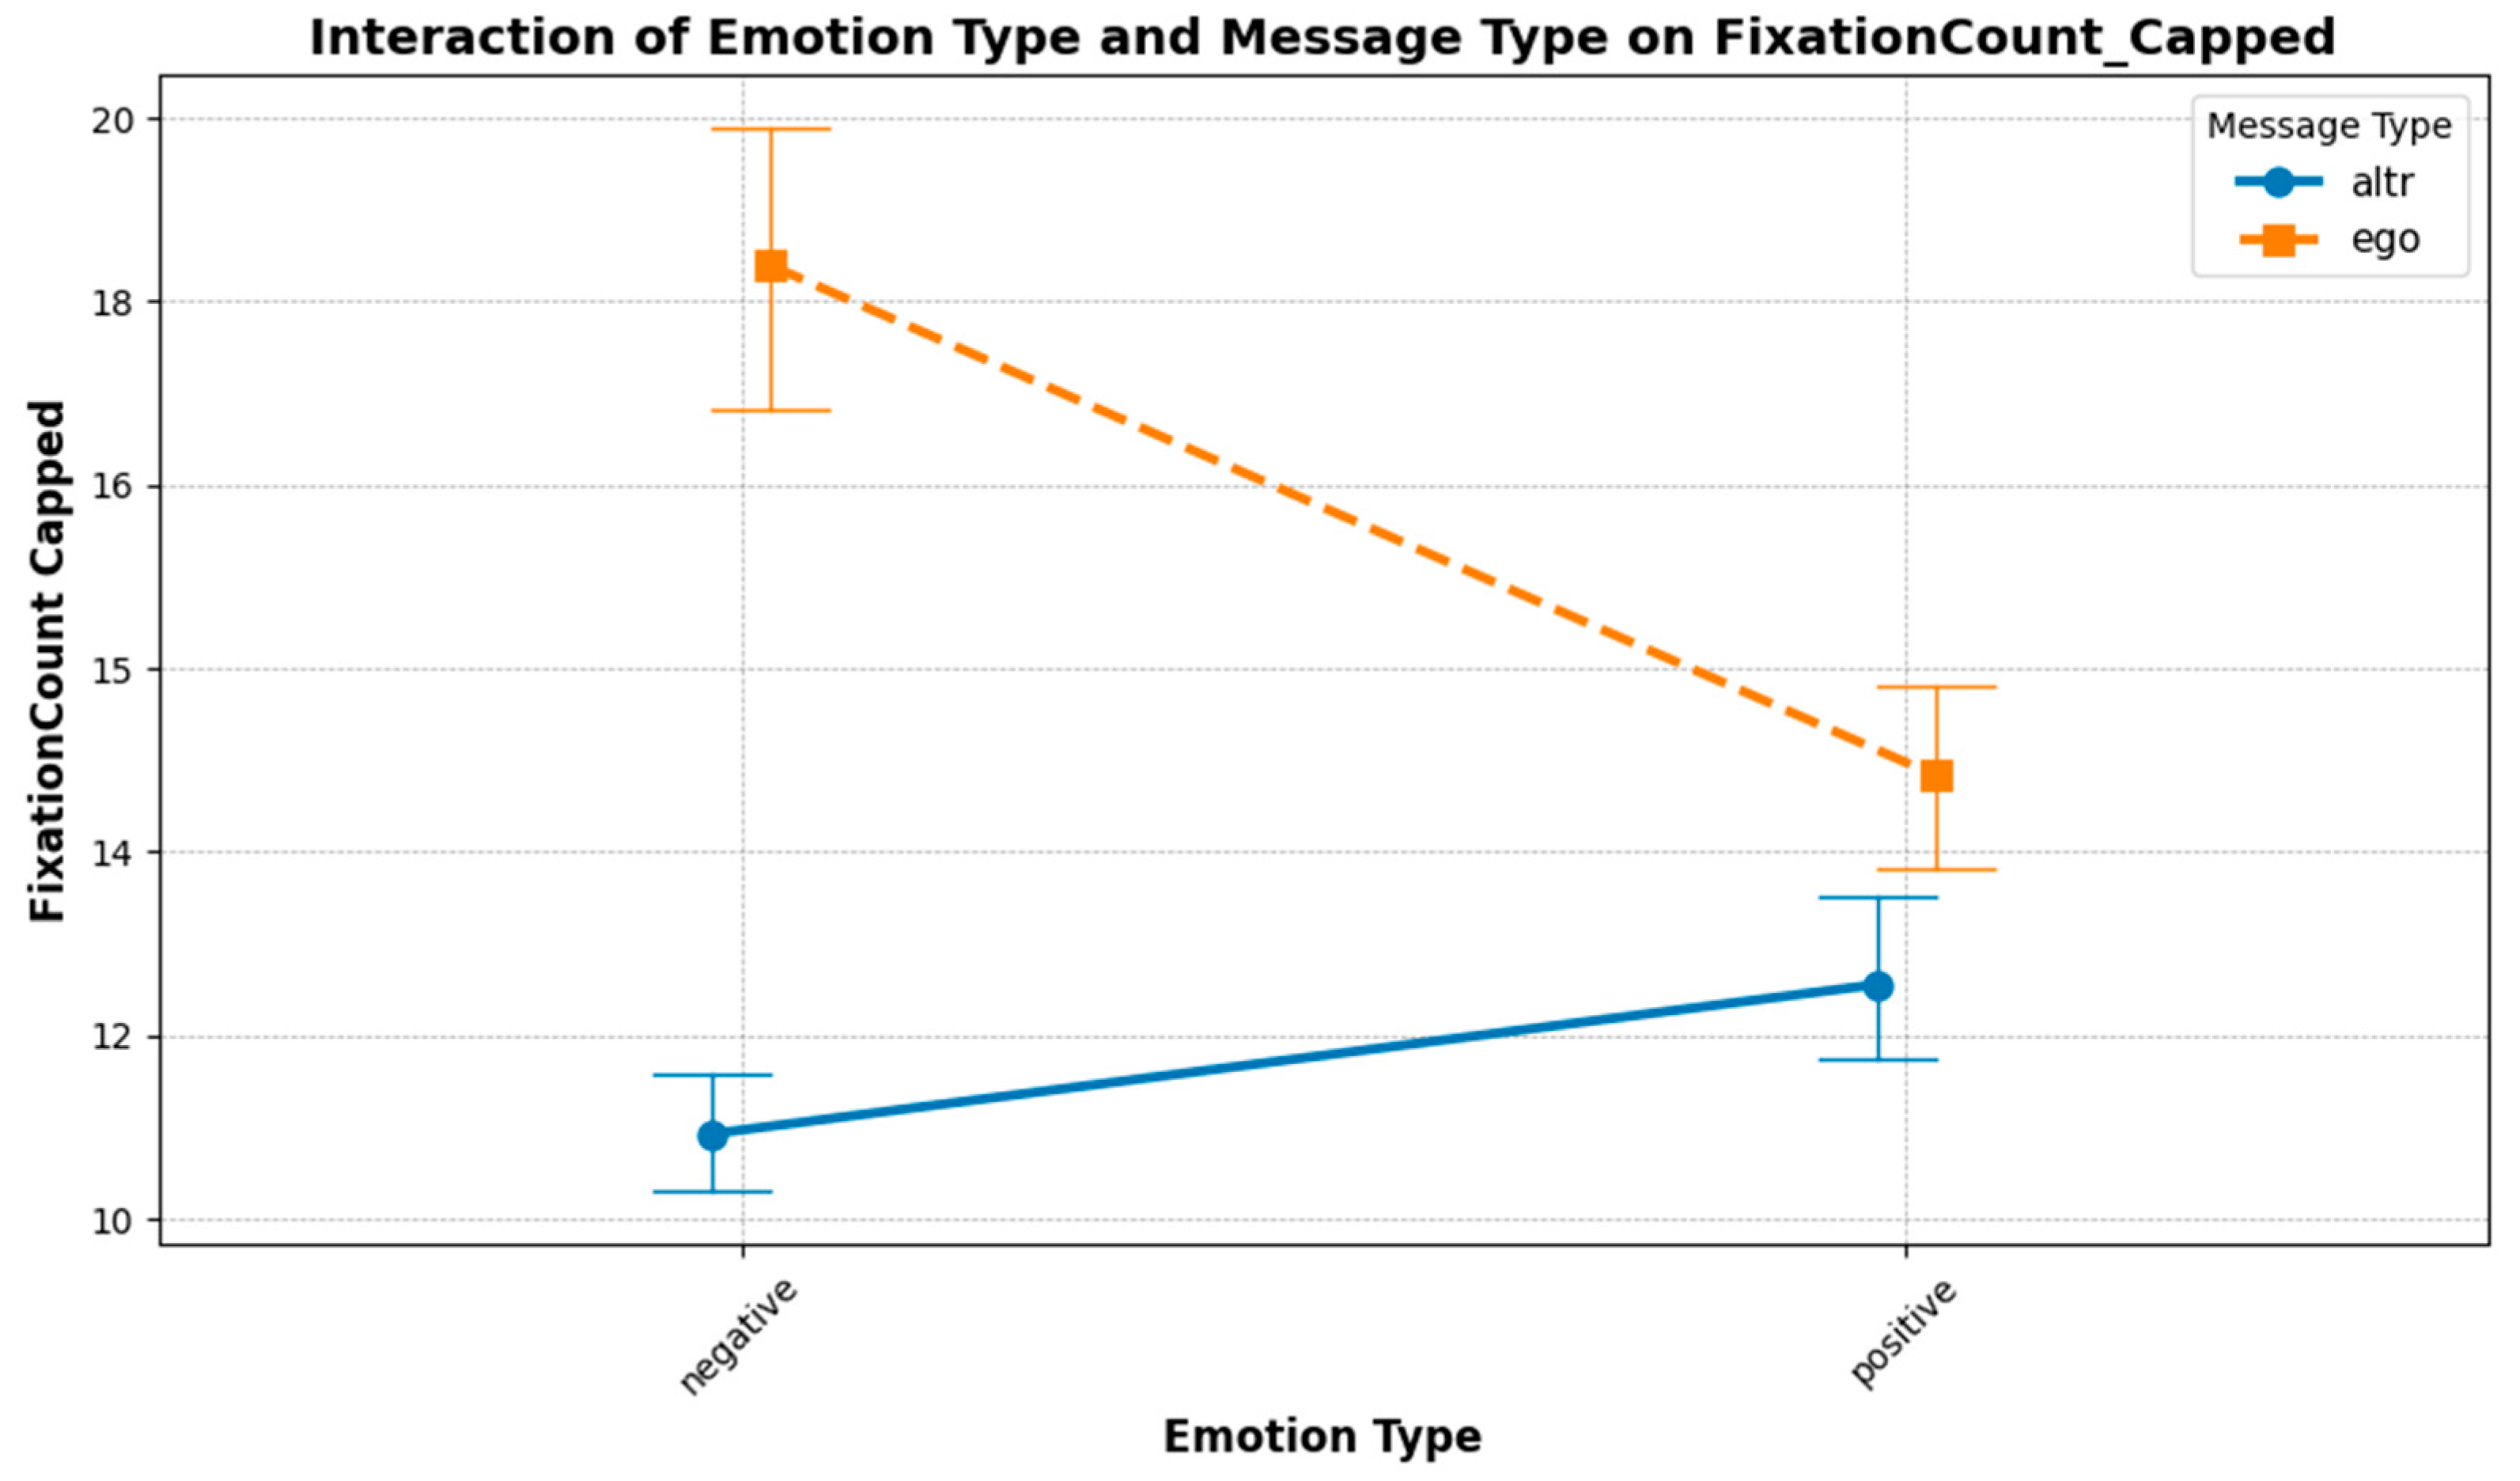
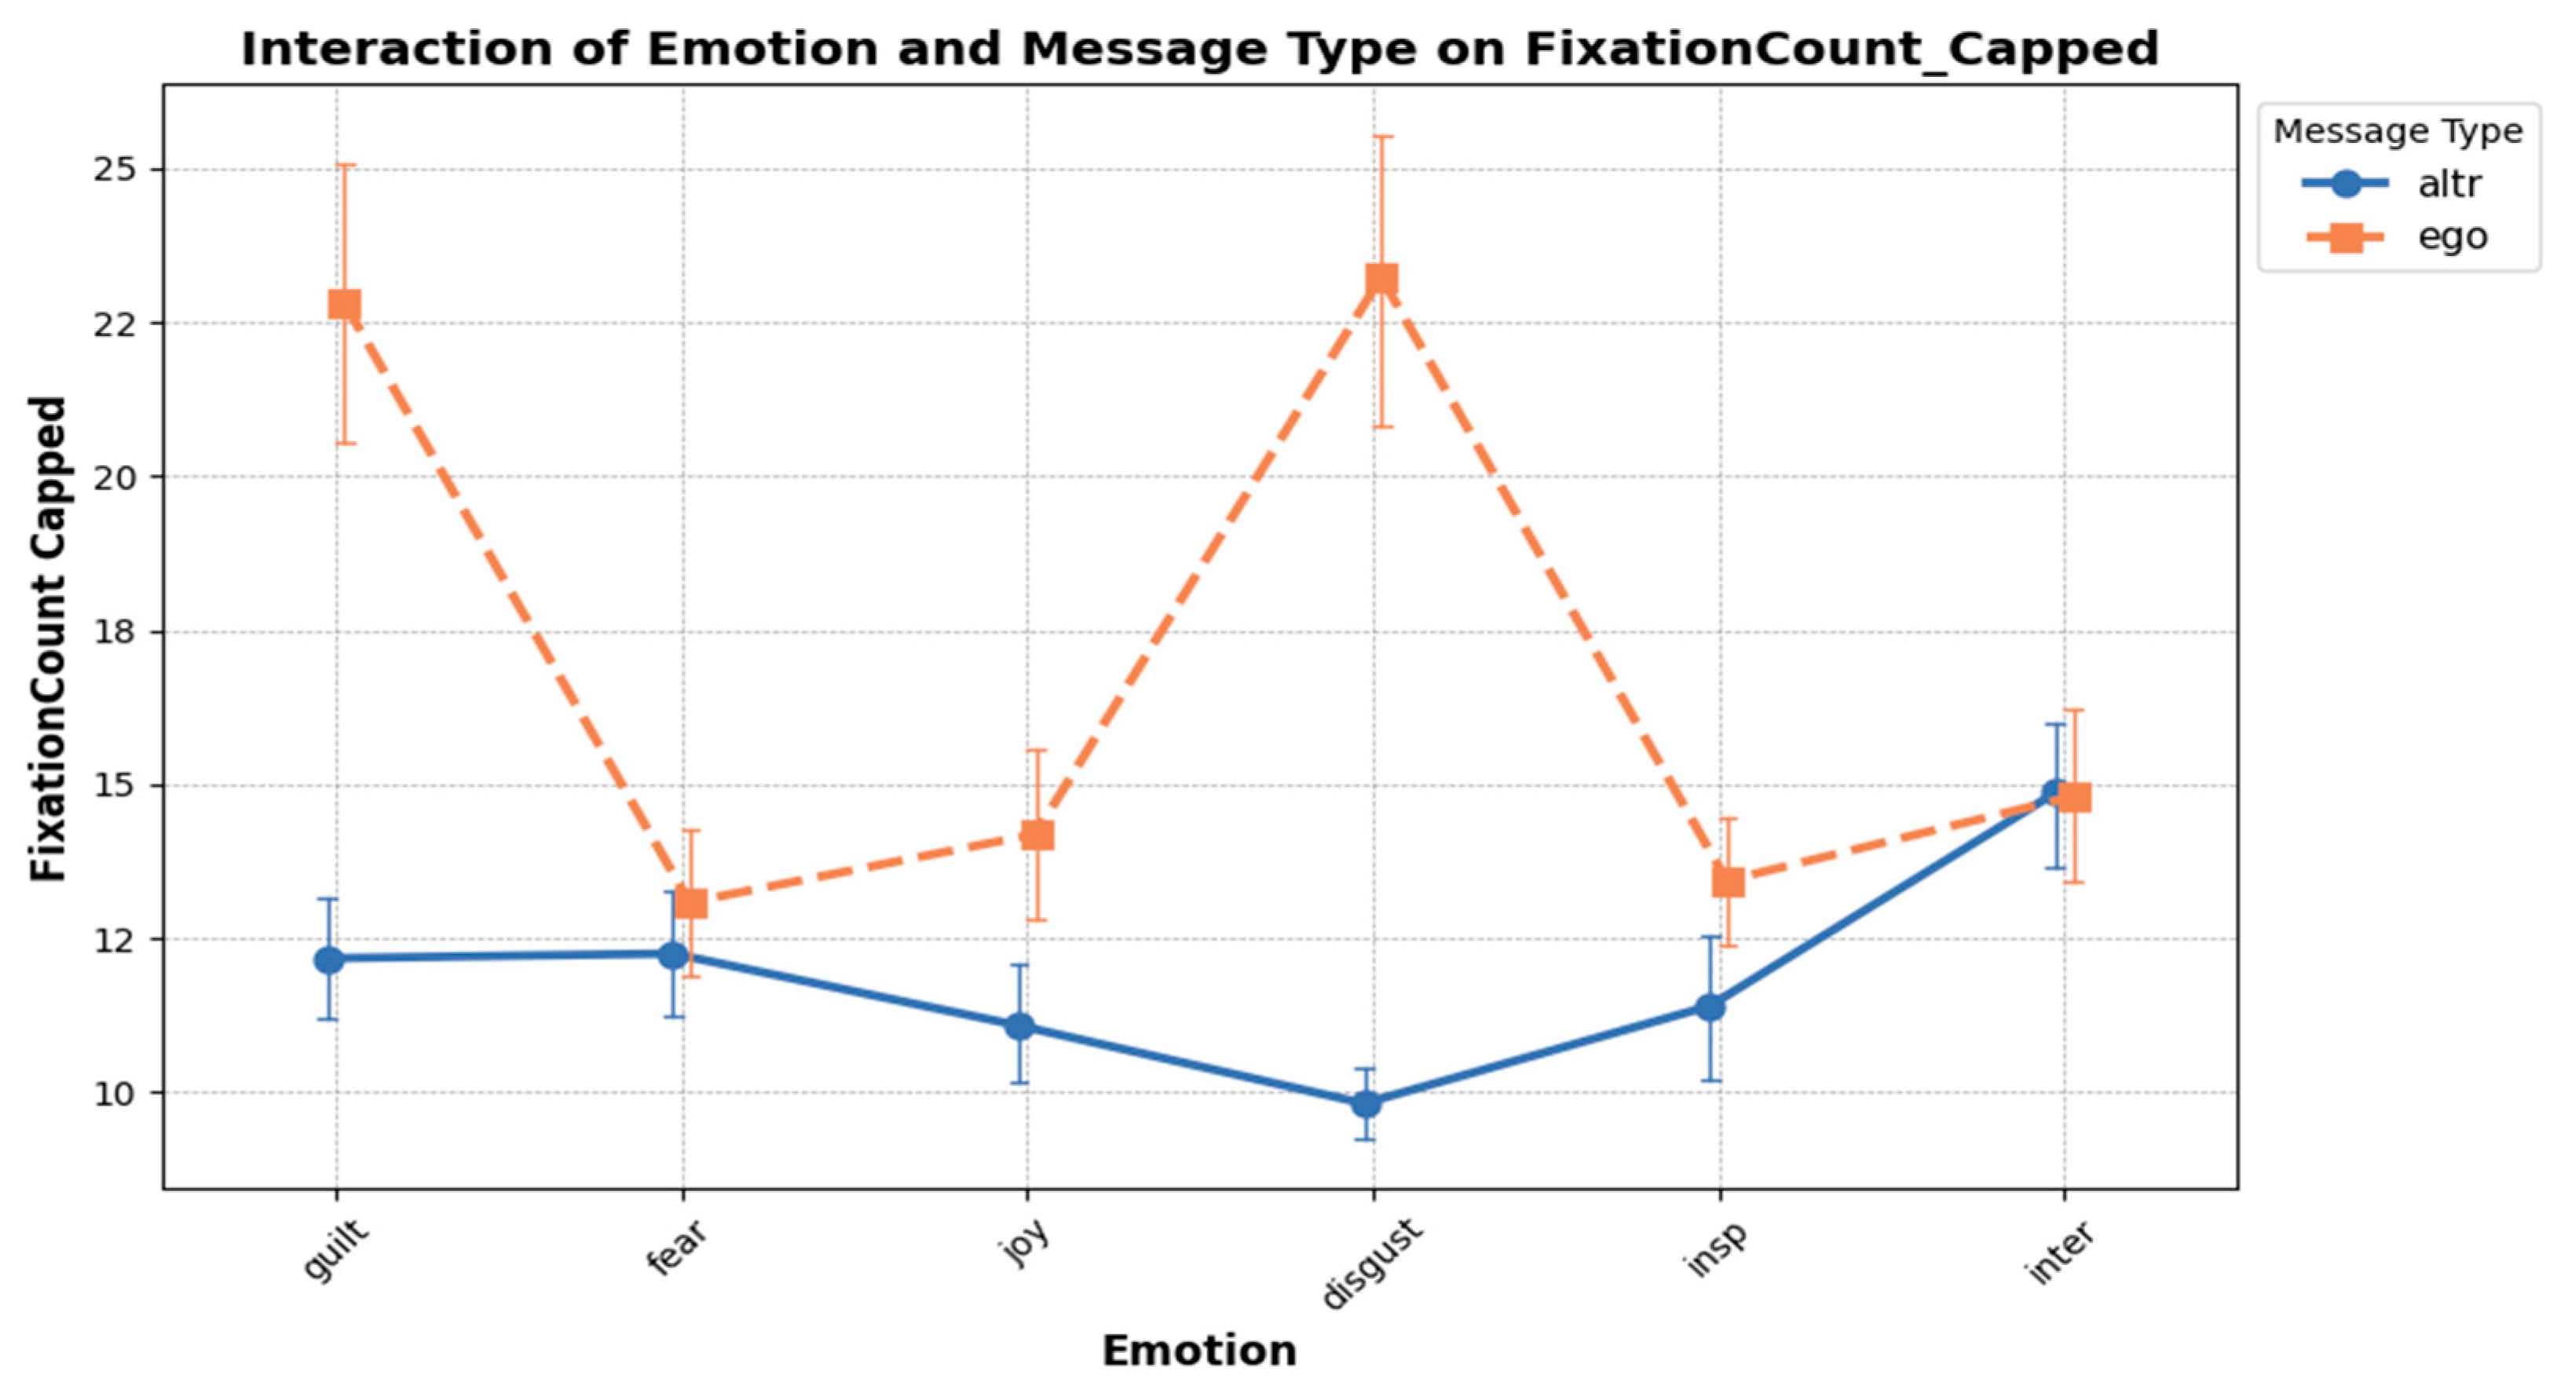
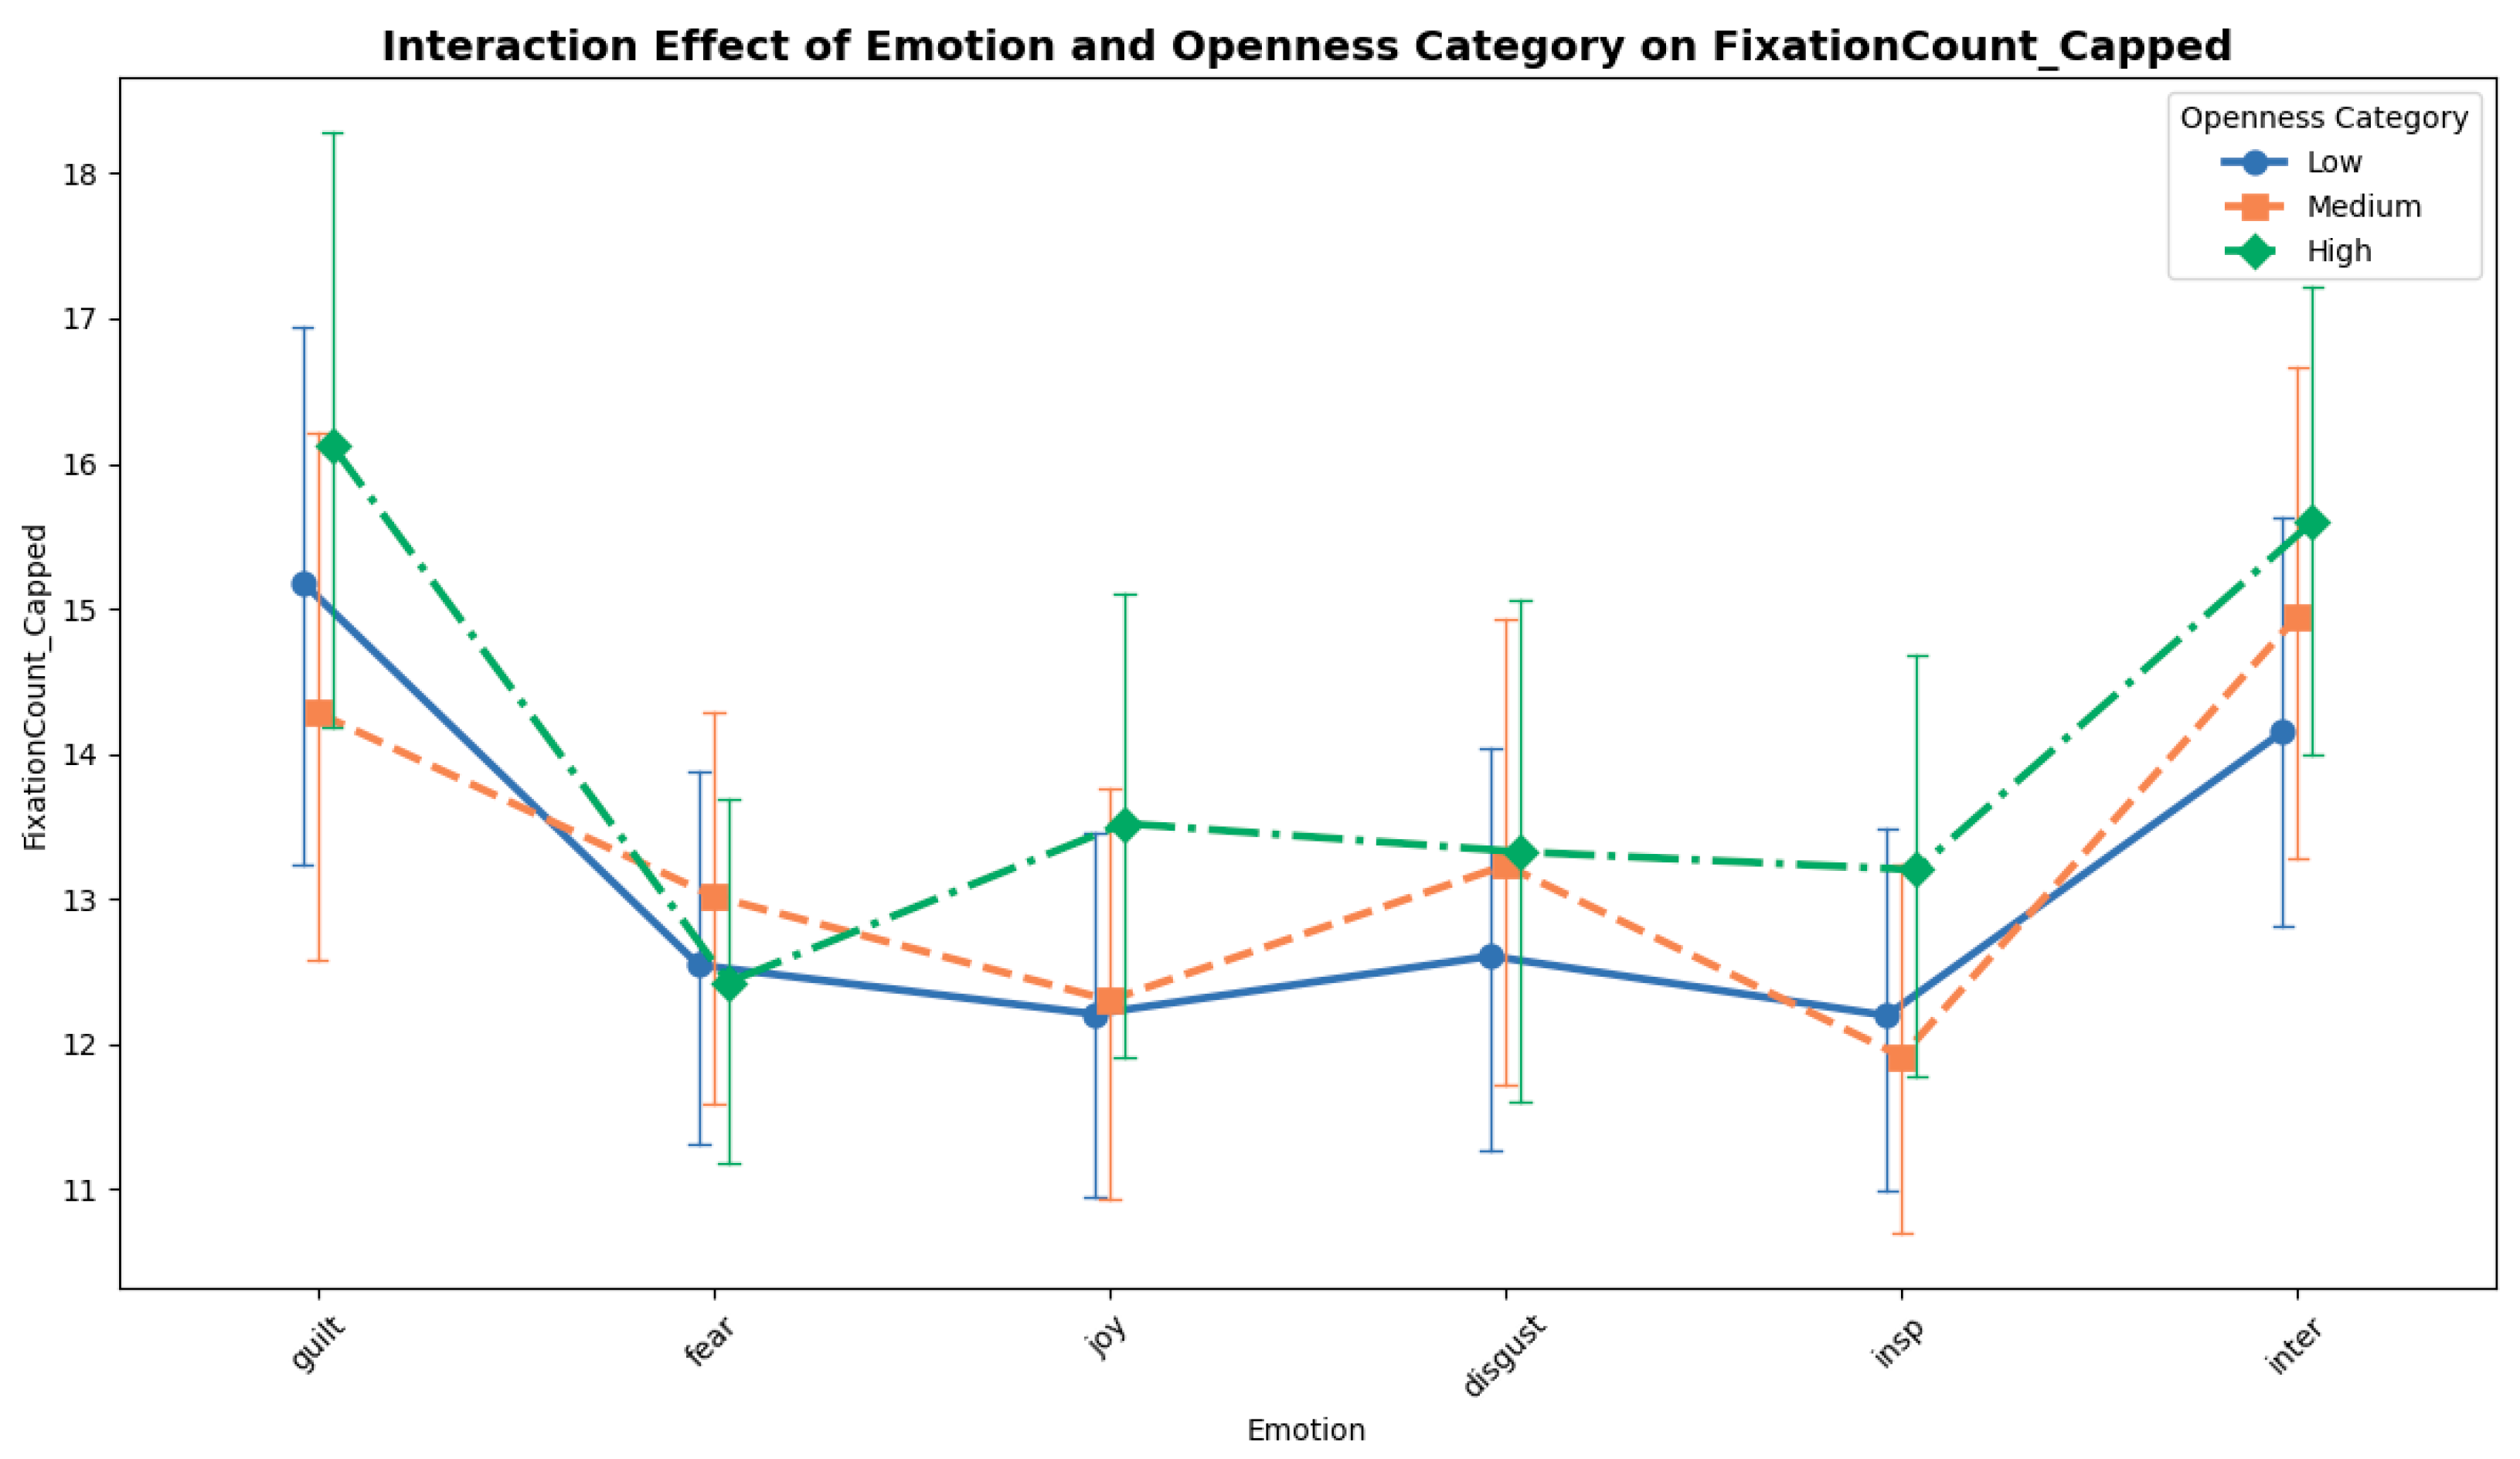
For the fixation count, the model demonstrated moderate explanatory power (pseudo R2 = 0.08631). There was a statistically significant interaction between positive emotions and the ego message type, suggesting that this combination decreases fixation counts (b = −0.3627, SE = 0.053, z = −6.842, p < 0.001, 95% CI [−0.467, −0.259]). Positive emotions alone had the greatest impact on fixation counts (b = 0.1070, SE = 0.040, z = 2.700, p = 0.007, 95% CI [0.029, 0.185]) while the main effect of the ego message type was also positively associated with fixation counts (b = 0.4911, SE = 0.036, z = 13.516, p < 0.001, 95% CI [0.420–0.562]). Only openness showed a statistically significant effect, indicating that higher levels of openness are linked to higher fixation counts (b = 0.0797; SE = 0.037; z = 2.156; p = 0.031; CI = [0.007, 0.152]). In Table 8, we present the significant results from the generalised linear models analysing the effects of the message type, emotional content, and personality traits on various eye-tracking metrics.
Visual examples for the fixation count statistical interactions are provided in Figure 2 and Figure 3. Given that our results identified openness as being statistically significant in interaction terms, in Figure 4, we provide a visual demonstration of how openness interacts with different emotions in terms of fixation counts during various emotions of the respondents.

4.5. Machine Learning Modelling for Predicting Personality Traits from Eye-Movements

In this section, we continue with the machine-learning aspect of our research. We aim to explore how advanced computational models could be applied to predict personality traits based on eye-tracking data to answer RQ2. Figure 5 precedes the discussion in this section, providing an architectural overview of our proposed approach. This schematic representation outlines the sequence and structure of our methodology, beginning with the collection of eye-tracking data, followed by preprocessing steps, and culminating with the application of machine learning models for personality trait prediction. In the later subsections, we delve into the details of the machine-learning process applied to our eye-tracking data. The input features for our models include four standardised eye-tracking metrics: fixation duration, saccade amplitude, fixation count, and saccade duration, representing our feature set. The dataset for model training consists of 5.676 instances. Based on hierarchical clustering, our models output a classification into one of three personality trait classes: emotionality, openness, and honesty–humility. These classes are evenly distributed within our dataset to maintain balance and ensure our models’ performance and class representation.

4.5.1. Procedure and Clustering

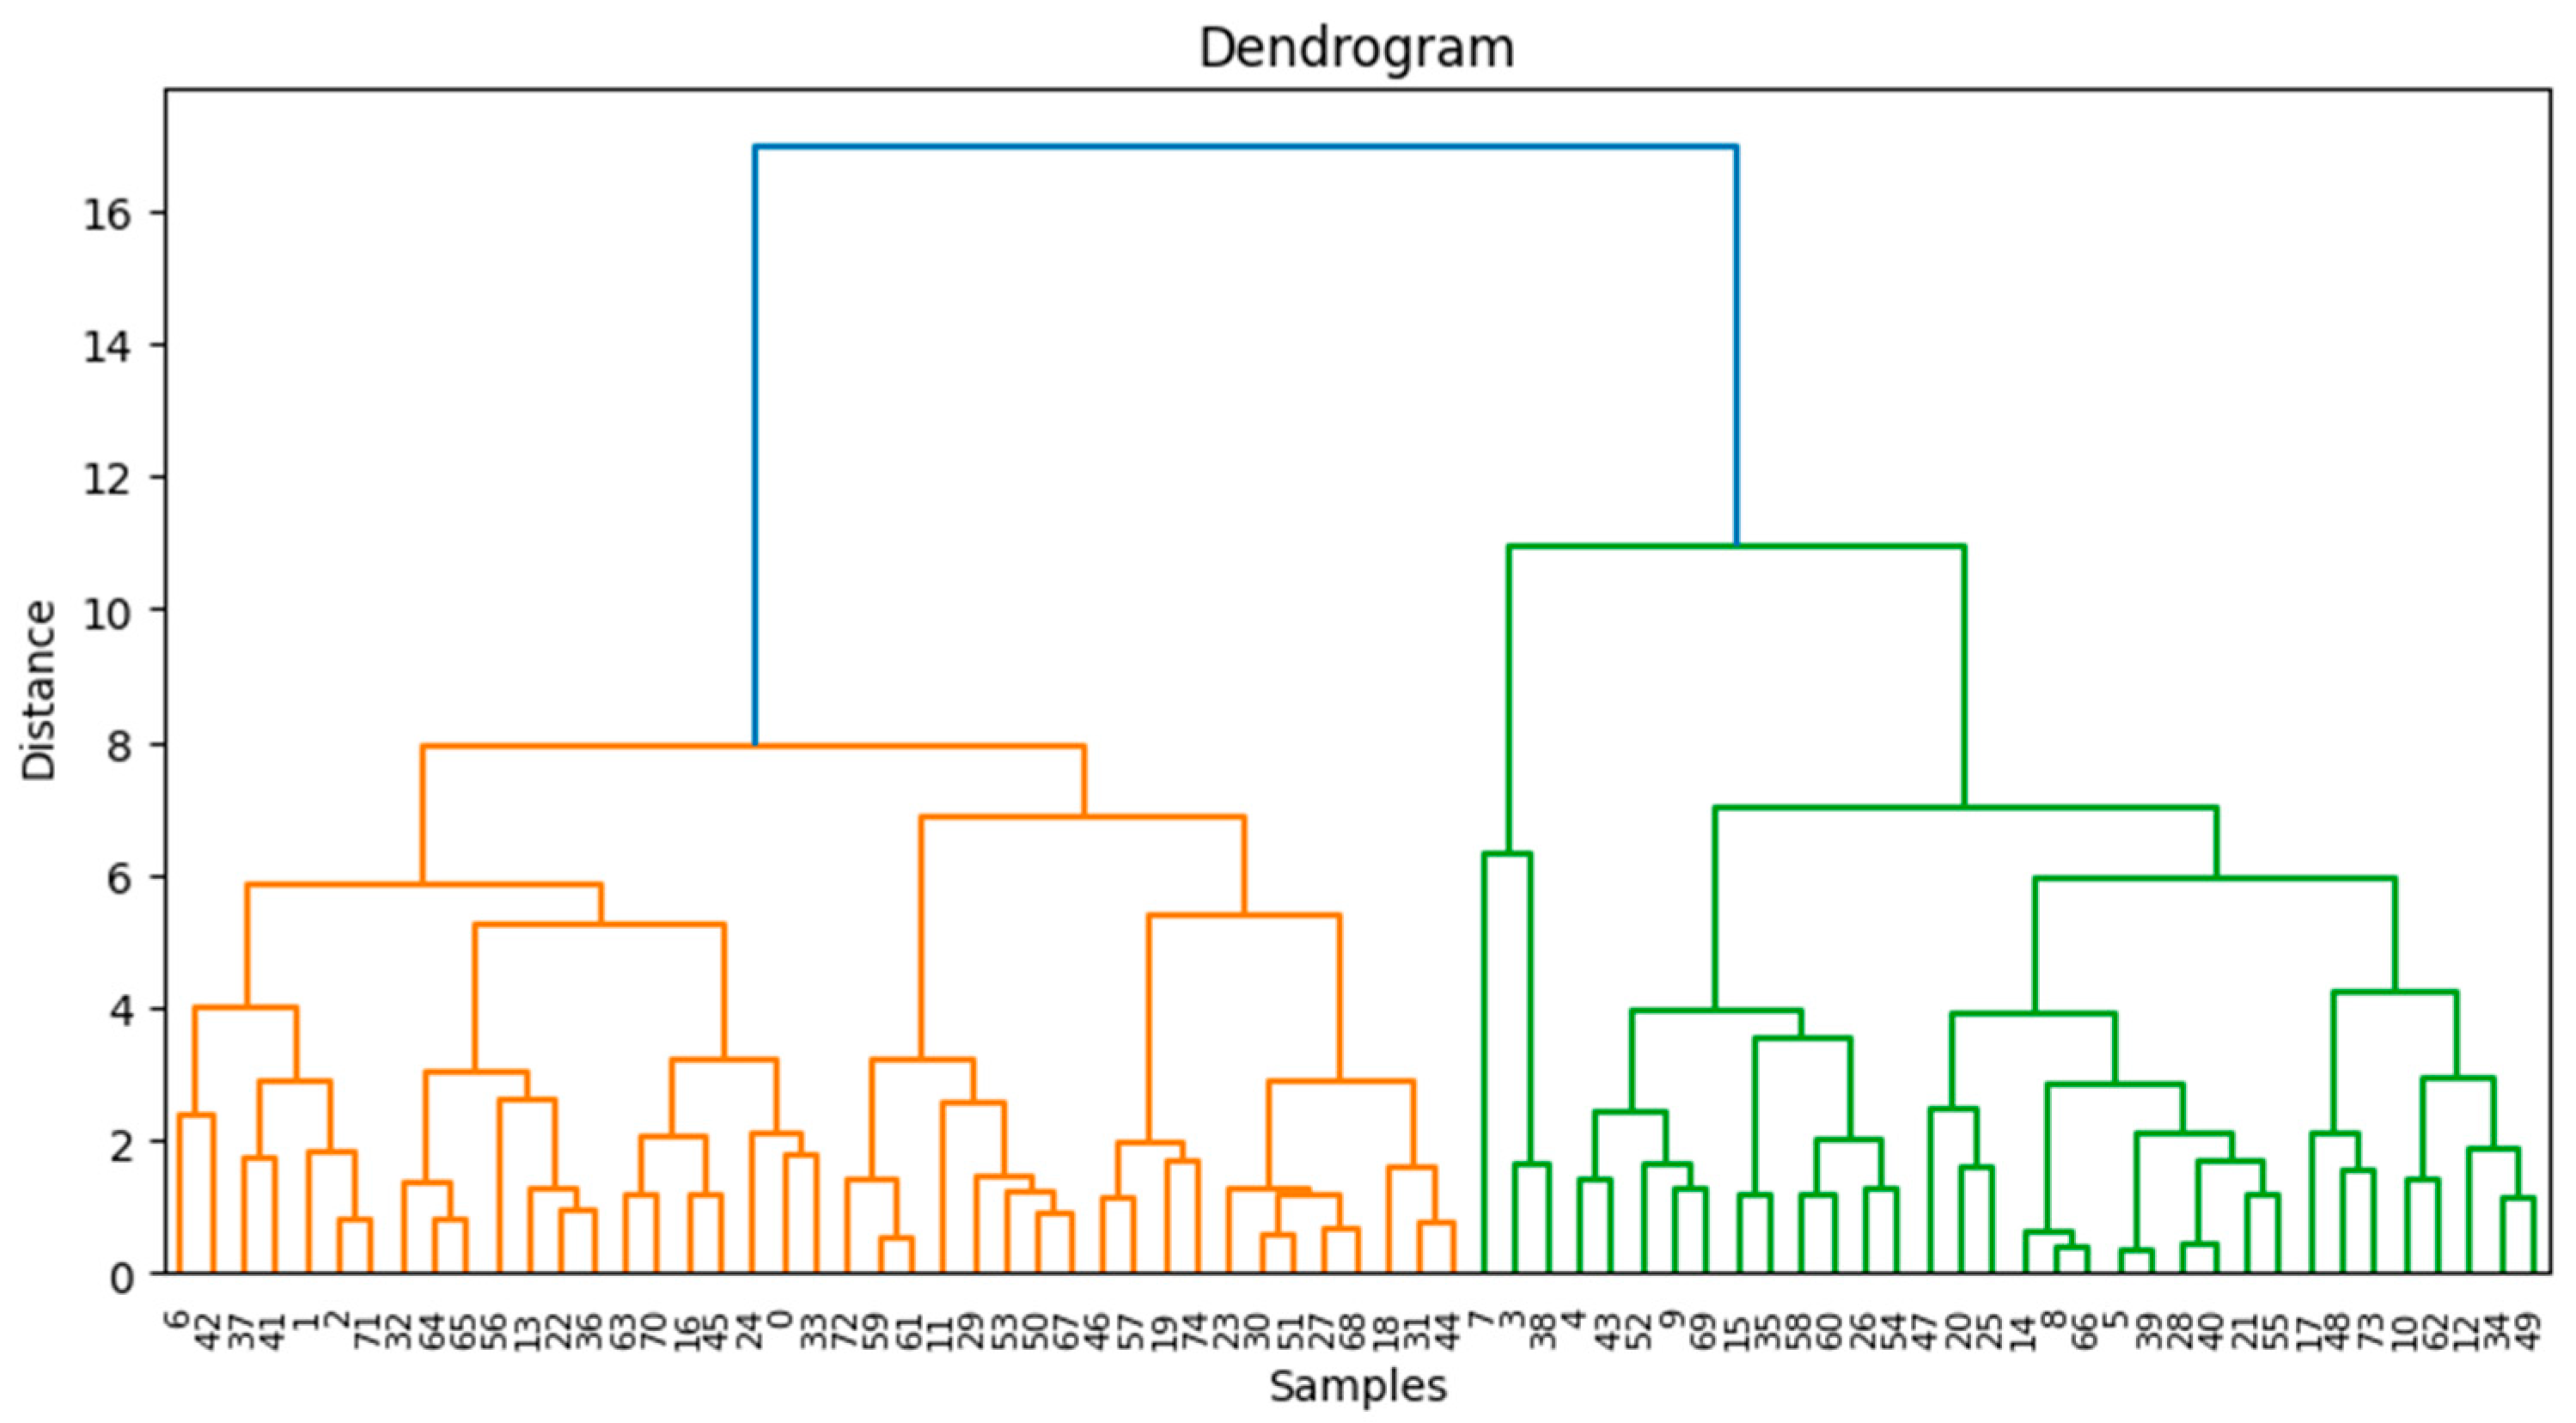
In this study phase, hierarchical clustering was employed to categorize participants according to their predominant personality traits, which were deduced from their eye movement data. To accomplish this, the eye movement metrics were standardised using the StandardScaler [90,91]. This vital normalisation process is necessary to compare subjects and normalize the eye movement scale. Next, these normalised eye movement features were merged with data for each participant’s most dominant personality trait. The participants’ observations were then systematically combined using the agglomerative clustering technique under Ward’s method to decrease within-cluster variance and Euclidean distance as a dissimilarity index. In this case, clusters are progressively combined depending on their proximity regarding eye movement patterns and prevalent personality traits [22,23].
A dendrogram visualised the hierarchical clustering process (Figure 6). This diagrammatic representation shows how organisation is performed hierarchically and visually [92,93]. It explains how individuals with similar tendencies in eye movements and dominant ways of behaving are grouped in a cluster. The inspection of the dendrogram revealed a four-cluster solution. However, the analysis revealed that only three clusters had high numbers of participants and were, therefore, dominant and statistically significant. The first cluster indicated that participants scored higher in emotionality (N = 26), followed by the second cluster of openness (N = 26) and the third cluster of honesty–humility (N = 23).

4.5.2. Data Participation and Model Evaluation

Our approach was adapted from [22,23]. Our dataset used eye movement features, including the fixation duration, saccade amplitude, fixation count, and saccade duration. We divided the data into a training set and a testing set to evaluate the performance of machine learning models. Using stratified sampling, 80% of the samples were allocated to the training set and the remaining 20% to the testing set. This was done to maintain a consistent distribution of target variables (clusters generated through agglomerative clustering with distinct groups) in both sets. Thus, by implementing stratified partitioning, we maintained the original dataset’s statistical properties since it preserved the distribution of the target variable of the agglomeratively clustered groups.
Scikit-learn was employed to determine the personality traits based on participants’ viewing behaviours [91]. We implemented three algorithms in our pipeline: Support Vector Machine (SVM) [94], Random Forest [95], and k-Nearest Neighbours (KNN) [96]. GridSearchCV facilitated this step as each model underwent a rigorous hyperparameter optimisation process [97]. This framework allowed us to test different combinations of parameters to find out which settings work best, most importantly based on accuracy. The hyperparameters considered for SVM were regularisation parameter C and kernel coefficient γ [94,98]. We adjusted the number of estimators and the maximum depth for Random Forest. The KNN model was tuned against various numbers of neighbours [99,100].
This was followed by evaluating the best models across all algorithmic categories on a test set using metrics such as accuracy, Cohen’s kappa, precision, recall, and F1 score to establish the model’s accuracy, sensitivity, and specificity [101,102,103,104,105]. Upon establishing the best model through rigorous testing and validation on the split dataset, we applied this model to the entire dataset. We calculated the same performance measures for predictions made across all datasets, demonstrating a comprehensive analysis of how well this approach works and predicts. The last evaluation underscored both the model’s application readiness and theoretical implications.

4.5.3. Classification Results

Table 6 presents the results of our comparative analysis on three machine learning algorithms for predicting personality traits from eye movement data. It shows the best parameters obtained through GridSearchCV used to fine-tune each model’s configuration to maximize its accuracy and generalisation on our dataset, along with their corresponding performance metrics–accuracy, Cohen’s kappa, precision, recall and F1 score.
For instance, both Support Vector Machine (SVM) and k-Nearest Neighbours (KNN) models had high accuracy, around 86.67%, and SVM outperformed regarding precision, recall, and F1 score measures. This model also had the highest precision (91.67%) and a remarkable Cohen’s kappa value of 0.8125, which indicates strong agreement beyond chance. Hence, it can be concluded that SVM is highly effective at capturing fine details in our data, leading to high classification rates, especially when distinguishing between closely related personality traits. In contrast, the Random Forest model displayed lower overall accuracy and other metrics, indicating a less optimal fit for this dataset. Despite its typically robust nature, the lower Cohen’s kappa score (0.5253), alongside precision and recall rates of 56.25% and 55.00%, respectively, suggests that this model might be less effective at managing the specific complexities or variance present within our eye movement data. With seven neighbours, the KNN model matched the SVM in accuracy at 86.67%, but with notably lower precision and recall rates of 65.83% and 70.00%, respectively. Its Cohen’s kappa score of 0.8065 is comparably high, which reflects substantial agreement and indicates that KNN effectively captures significant trait groupings, albeit with some limitations in distinguishing overlapping categories (Table 9).
To further validate our results, we employed the Kruskal–Wallis H-test to determine whether there were statistically significant differences in performance metrics across the machine learning models used. Our results indicated significant differences in accuracy (H = 7.191, p = 0.027), precision (H = 7.857, p = 0.020), recall (H = 9.518, p = 0.009), and F1 score (H = 9.420, p = 0.009). As a next step in our analysis, we employed Dunn’s post hoc test with Bonferroni correction to assess pairwise differences between the models for each performance metric. The tests revealed a statistically significant difference in the precision, recall, and F1 score between the SVM and Random Forest models (p = 0.028002, p = 0.010410, and p = 0.011763, respectively). For accuracy, a significant difference was also observed between SVM and Random Forest (p = 0.023310), as detailed in Table 10. Such findings underscore SVM’s higher overall performance metrics and robust classification capabilities, particularly when minimising false positives and negatives, which is crucial, highlighting its applicability in environments sensitive to precision.
As mentioned earlier, the best model was applied to the whole dataset; in our case, it was the Support Vector Machine (SVM) model, which significantly outperforms the k-Nearest Neighbours (KNN) and Random Forest across all performance metrics. Specifically, SVM achieved an accuracy of 98.67%, Cohen’s kappa of 0.981, precision of 98%, and recall of 98.81%, with an F1 Score of 98.88%. In comparison, KNN and Random Forest showed substantially lower performance metrics, with KNN recording an accuracy of 92% and F1 score of 70.43%, and Random Forest recording 86.67% accuracy and an F1 score of 66.37%. Henceforth, these results reflect the model’s highly predictive power across diverse data samples (Table 11).
These findings confirm that SVM outperforms all other tools in dealing with the complexities of eye-tracking data pointing to personality traits and should be regarded as the best model for our study. This change in how models are evaluated emphasizes the necessity for several indicators to assess how well a model operates to enhance the precision of our data and the robustness of our conclusions.
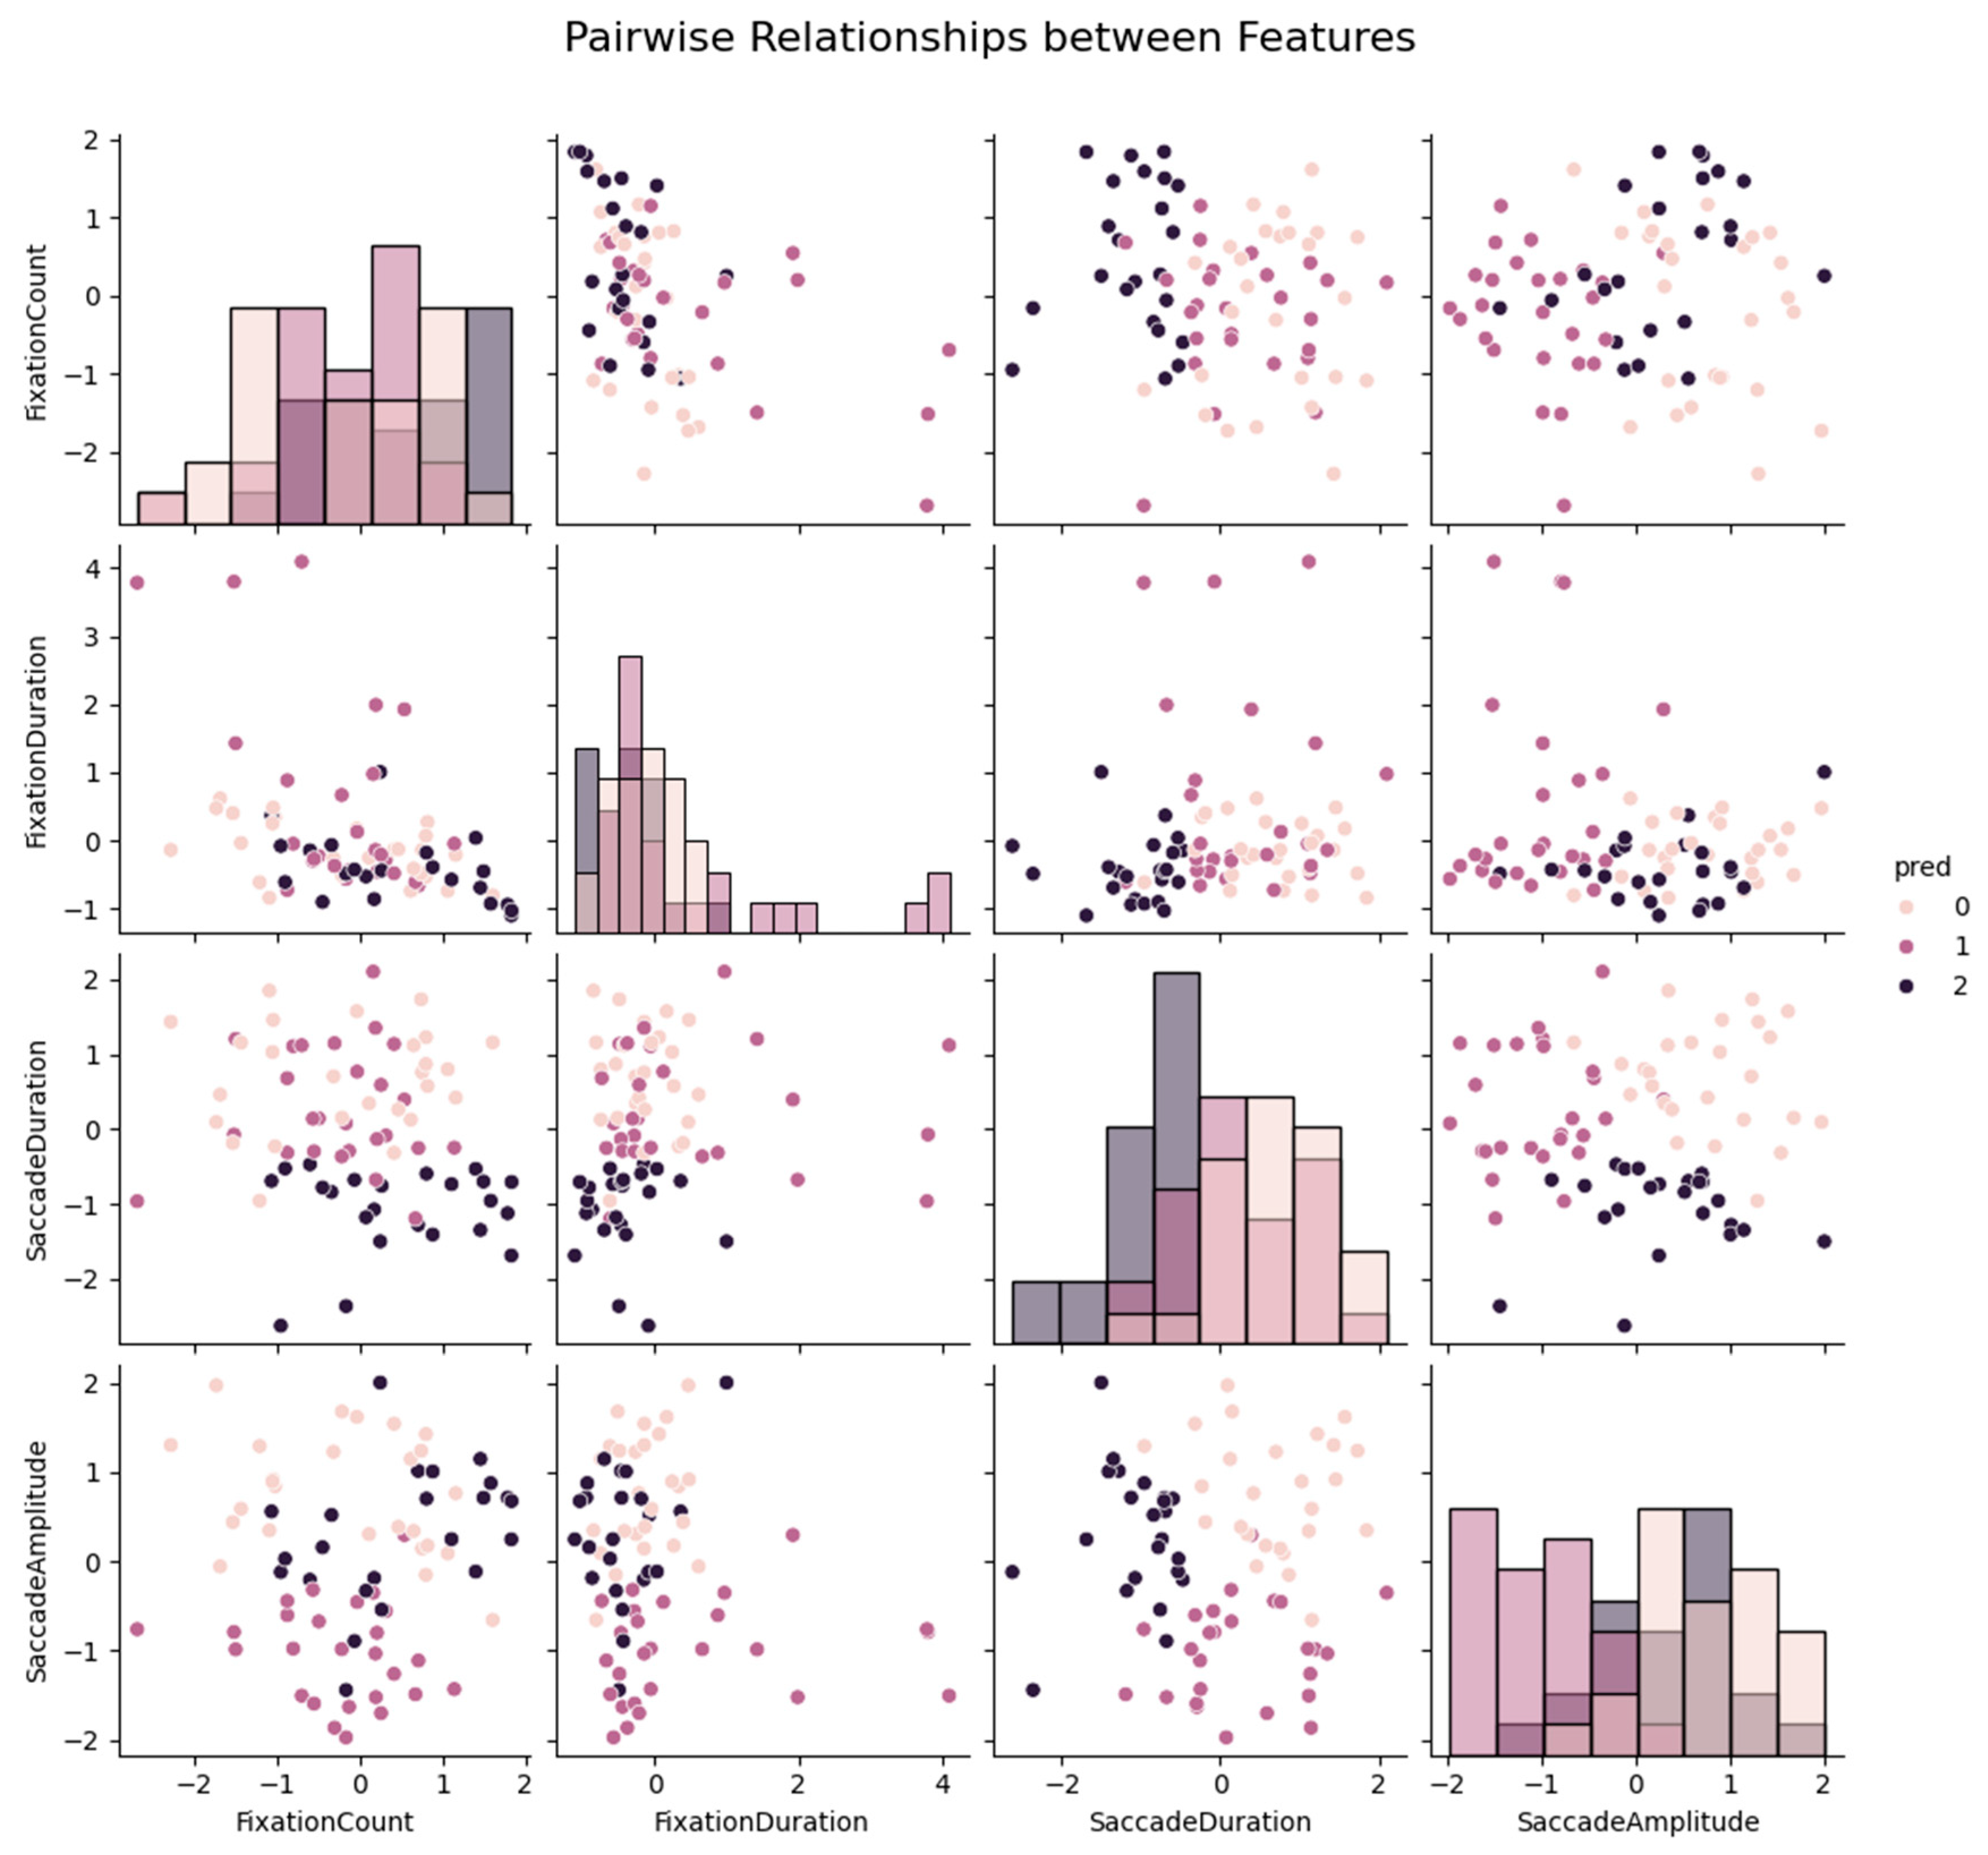
Finally, Figure 7 illustrates the density plot among eye movements and the predicted personality traits. These clusters allow us to discern distinctions in eye movement patterns correlating with each personality trait, offering a visual representation of our predicted personality traits and eye movement metrics. Histograms are used on the main diagonal to represent the distribution of individual traits, while scatter plots show unique interdependence between eye movement features, with denser regions suggesting a stronger association. Under predicted clusters, different colored observations enable us to see differences between clusters designated emotionality (pred 0), openness (pred 1), and honesty–humility (pred 2). Density plots showcase how prevalent certain characteristics might be in our sample size as well as hinting at potential connections between specific eye movement behaviours and traits. The performed statistical analyses confirmed these clusters’ significance, underpinning the eye-tracking data’s predictive validity when mapping to personality traits. These findings highlight the importance of considering the potential of individual differences in studies on relations between eye movement metrics as behavioural indicators of personality, suggesting pathways for applying these insights in areas such as user experience design, adaptive interfaces, and psychological assessment which we elaborate in detail in the discussion section.

5. Discussion

This study aimed to investigate the relationship between HEXACO personality traits and eye-tracking metrics in response to diverse advertising stimuli promoting blood donation with a wide variety of non-parametric, robust regression models, generalised linear models, and machine learning approaches. In particular, our results make a significant contribution to the literature on emotional arousal, visual attention, and personality traits within the setting of blood donation initiatives.
Regarding RQ1, the results demonstrated distinct patterns in how certain personality traits influenced eye movement behavior, with individual differences affecting visual engagement significantly. In our case, robust regression models showed that honesty–humility was negatively associated with fixation duration. This suggests that people who have high levels of honesty–humility may process visual information more swiftly, possibly implying a more efficient decision-making process when faced with emotionally oriented or persuasive content. On the other hand, openness was positively associated with both saccade duration and fixation count, indicating that these individuals engage in deeper and broader visual processing. These findings align with the trait’s conceptualisation, which encompasses an openness towards new experiences and ideas, potentially leading to a more extensive exploration of these visual stimuli [9,14,32,106]. In addition, it was discovered that extraversion had a positive correlation with saccade amplitude, indicating that individuals who are more extroverted exhibit broader visual scanning patterns due to being more reactive to social cues present in advertisement visuals. This is consistent with prior findings, which imply that rewards and positive social stimuli are more salient for extroverts. Additionally, our study investigated the interaction effects of emotions and message framing on visual attention through personality traits. Generalised linear models (GLMs) indicated significant interaction effects concerning positive emotions combined with egoistic message framing and their significant impact on saccade durations and fixation counts. These interactions suggest that how messages are framed, combined with the emotional context of individual advertisements, can significantly influence how individuals with different personality traits approach content, as visualised in Figure 2, Figure 3 and Figure 4. Interestingly, we found no significant effects on eye tracking measures concerning the reaction between negative emotional stimuli and personality traits. This might imply that even though personality traits play a role in processing positive stimuli, negative stimuli could be less suspectable to such variations, probably due to a universally prejudiced response against negative contents across different personality traits [12,14,32,106].
In relation to RQ2, the integration of machine learning models to predict personality traits using eye-tracking metrics signifies an advancement in computational models implemented in psychological research. The identification of three dominant traits in emotionality, openness, and honesty–humility through hierarchical clustering implies that these personality characteristics can be distinctly represented by visual behavior metrics like fixation duration, saccade amplitude, and fixation count. Clustering our data made observing how eye movements conform with personality traits possible. Additionally, it helped in understanding the subtle relationships between an individual’s psychological profile and their visual attention dynamics. The comparative analysis of three machine learning algorithms, SVM, Random Forest, and KNN, revealed substantial differences in their ability to handle the complexity and variability in eye-tracking data linked to personality traits. In terms of accuracy, precision, and recall, both SVM and KNN algorithms outperformed Random Forest by far (66.67%, 66.67%, 0.5253). This suggests that SVM and KNN have more sensitivity to nuances in eye movement data that correlate with the identified personality clusters. Precision and Cohen’s kappa results indicate that SVM has stronger classification power against closely associated personality traits than other classifiers, thus making it ideal for applications requiring high personality assessment granularity during our experiments. The models were reevaluated through intensive hyperparameter tuning for maximal precision and generalisation capacity. This also contributes to the confidence in the predictive model selection and validation methods and could be a baseline for future research to merge psychology data with machine learning techniques. For instance, this would be very useful in psychological research, where distinguishing between subtle behavioural patterns can be important [12,14,23,24,29,30,107].
This study presents novel strategies of machine learning for forecasting human traits by tracking eye movements, employing a controlled experimental design rather than the observational one commonly used in the past [13,18]. This allowed us to manipulate stimuli precisely and establish direct connections between personality features and eye movements, thereby increasing the reliability of findings for personalised advertising campaigns. Machine learning was used to increase predictive accuracy in relation to individual differences in personality traits. Specifically, this method has been shown to improve upon the previous research on blood donation motives, which was considered an innovative but under-researched application [40,73,108,109]. In doing so, we identified various new data-driven findings that can potentially be used both for scholarly debates and practical marketing undertakings, especially those concerning not-for-profit involvement as well as donor retention. Theoretical implications are discussed together with their practical implications so that it is apparent what we did differently from other theories about individuals’ characters or behaviours while still staying within the wider contexts of personality and behavioural research fields.
This study explores several theoretical implications critical for psychology, behavioural sciences, and human–computer interaction that integrate machine learning with eye-tracking metrics in predicting personality traits. Traditionally, personality traits have been predominantly assessed through self-report questionnaires and surveys, which are generally effective but susceptible to biases such as social desirability and self-perception discrepancies [12,31,33,107]. Based on visual attention patterns, eye-tracking technology as a behavioural indicator offers an objective, non-invasive means of evaluating and predicting personality traits. This study supports the claim that eye movements, among other behavioural data, can be used as reliable indicators of personality traits to supplement existing methods [13,22,25,33,34,107]. This is useful for reducing self reporting-associated biases and might be particularly applicable when conventional approaches are inappropriate. Therefore, it enriches our theoretical understanding of cognitive processes involved in personality. For example, the relationship between openness and greater fixation counts, as well as saccade durations, indicates that people with a high level of openness have a broader range of visual curiosity or display more profound processing tendencies. By emphasising implicit preferences that underlie people’s interaction with their visual environment, this knowledge contributes to cognitive theory and has implications for actions beyond vision. In the context of blood donation, understanding how individual differences influence responses to campaign materials can improve the effectiveness of these initiatives. Campaign designers can personalize their messages to become more appealing to donors by investigating how different personality traits affect reactions towards specific visual cues in adverts. For example, targeting people who score highly on emotionality may require creating content that makes them feel empathy strongly, while targeting those high on honesty–humility may involve emphasising all the philanthropic aspects of giving.

6. Conclusions

This study effectively demonstrated how eye-tracking metrics and machine learning can be implemented to predict personality traits, thereby illuminating important aspects of visual content interaction. Consequently, statistical analyses using Kruskal–Wallis, Mann–Whitney U, and Friedman tests confirmed significant variations in eye movement behaviours according to different ad types, emotional contents, and message framing. The predictive models further identified significant relationships between personality traits and visual engagement patterns, demonstrating their potential use for psychological profiling and targeted advertising. Thus, these results indicate the deep influence exerted by personality on viewing behavior and show why eye-tracking integration with machine learning is needed for improved strategies and user engagement in the context of blood donation advertisements. As an answer to the consistent requirement for blood donations in society, policymakers and healthcare professionals must make broader and more effective strategies by amalgamating knowledge from different fields.
In terms of the practical implications, this research provides significant and actionable insights for blood donation campaigns and ways to increase donor engagement and retention. Inferring personality traits from eye-tracking data can assist in the customisation of adverts based on individual viewing styles. For example, ads that require prolonged visual fixation durations may be more effective for individuals with high honesty–humility levels. In addition, the negative relationship between agreeableness and fixational duration indicates that more agreeable persons tend to process visual information faster (which will impact the pacing and complexity of the content shown). Moreover, these behavioural insights can increase the efficiency of directed interventions in public health and educational campaigns and enhance consumer interaction. Moreover, the layout of donor interfaces can be improved by adopting knowledge from different personality traits’ visions, signaling a more functional online system for registering donors. These implications can easily be integrated into educational materials meant for different types of donors to align communication material with the visual preferences of specific personality types, making public awareness campaigns more effective. In addition, our findings illustrated major variations in visual attention based on advert types and message framings. This suggests the possibility of improving the design of campaigns for blood donation by selectively choosing those elements that are more likely to capture and maintain potential donors’ attention. Emotional content, as shown by its effect on fixation duration and saccade patterns, can deliberately invoke stronger emotions, which may promote higher conversion rates concerning actual blood donations. Differentiations in eye movements in relation to message framings (altruistic and egoistic) can also provide important details about the textual information incorporated in blood-related advertisements. On the other hand, altruistic messages can be more effective for certain viewer profiles, which are discernable through their eye movement patterns, leading to better impact targeted outreach to donors. Moreover, such findings have practical implications for designing dynamic, responsive interfaces for donor registration and information dissemination platforms. Understanding how individuals’ personality traits interact with the visual and textual content will enable the development of systems, allowing more personalised interactions to enhance donor engagement and satisfaction. The research highlights the importance of incorporating machine-learning methods with sophisticated eye-tracking analysis for better blood donation campaigns. This study ensures a more detailed comprehension of donors’ behaviours, using eye tracking and its metrics, among other non-invasive techniques. It also provides a roadmap for employing this information to guide the design of campaign materials, leading to higher levels of first-time and return donor engagement. In this study, we examined how eye-tracking metrics could potentially be used to predict specific traits and tailor blood donation advertisements. Although our findings suggest that advertisements can be better tailored to appeal to different personality types, they also pose significant ethical concerns. The use of psychological profiling to influence people’s donation intentions should not violate their personal freedom or need informed consent. Such an endeavor should adhere to ethical norms to approach prospective donors unimpeded. More interactions among stakeholders in the blood-donating community are needed to guarantee the acceptance and success of these marketing tactics. Our work adheres to the ethical norms proposed by refs. [20,21,73,108,109,110,111]. Thus, any practical application must meet similar ethical scrutiny.
This study is not without limitations. We acknowledge that demographic parameters such as age, education level, and gender were not accounted for and investigated in relation to our experimental results. In our future attempts, we intend to employ similar controls to increase the depth and effectiveness of these findings across diverse groups, examining how different advertising incentives affect diverse demographics. The sample size, though adequate for statistical analysis, was relatively modest, which might limit the generalizability of the findings. In addition to that, using static images as stimuli restricts the results’ applicability to dynamic or interactive media, which could be addressed in subsequent studies. The accuracy of personality prediction depends on the quality and representativeness of data obtained from eye-tracking, which may be affected by factors such as experiment configurations and subject differences. Future studies should consider such factors and test the applicability of these models in different situations and populations for the improvement of their validation and robustness. Moreover, additional eye parameters should be investigated and incorporated to examine their influences on model performance. That being said, further investigations can examine the combination of alternative physiological and biological aspects for an in-depth exploration of personality traits. This will result in more complex models incorporating multimodal information that could increase the accuracy and reliability of predictions made by them in terms of personality traits. One important issue is using the Differential Emotion Scale (DES) to evaluate emotional reactions, which can fluctuate significantly in response to everyday life experiences. Padilla, Kavak, Lynch, Gore, and Diallo [19] show that emotional assessments are altered by environmental conditions across time, demonstrating that emotions are dynamic rather than fixed. Our data reflect solely short-term emotional reactions, which may not be generalizable to different circumstances or longer time periods. In the future, researchers must account for changes in prediction models caused by variably sensitive emotional states.

Author Contributions

Conceptualisation, S.B.; methodology, S.B.; validation, S.B.; formal analysis, S.B.; investigation, S.B.; data curation, S.B.; writing—original draft preparation, S.B. and M.K.; writing—review and editing, S.B., M.K. and M.R.; visualisation, S.B.; supervision, S.B., M.R. and S.S.; funding acquisition, S.B. All authors have read and agreed to the published version of the manuscript.

Funding

The present work was financially supported by the “Andreas Mentzelopoulos Foundation”.

Institutional Review Board Statement

The study was conducted in accordance with the Declaration of Helsinki and approved by the Research Ethics Committee (REC) of the University of Patras (application no. 14045, date of approval 26 August 2022) for studies involving humans. The committee reviewed the research protocol and concluded that it does not contravene the applicable legislation and complies with the standard acceptable rules of ethics in research and of research integrity as to the content and mode of conduct of the research.

Informed Consent Statement

Informed consent was obtained from all subjects involved in the study.

Data Availability Statement

The raw data collected by the survey are available upon request to the corresponding author.

Conflicts of Interest

The authors declare no conflicts of interest.

Appendix A

Figure A1. Variants of the fear ad. On the left we showcase the ad with the altruistic message and on the right with the egoistic message.
Ai 05 00034 g0a1
Figure A2. Illustrations of negative appeal ads. On the left we showcase the disgust emotional appeal ad with egoistic message framing (“Each blood collection set is new and sterile, and is destroyed immediately after blood collection. This way there is NO chance of getting infected during the blood donation”) and on the right the guilt ad with altruistic message framing (“Unfortunately, our country is forced to import blood due to the very low rates of voluntary blood donation”).
Ai 05 00034 g0a2
Figure A3. Illustrations of the positive appeal ads. On the left we showcase the positive emotional arousal inspiration with egoistic message framing (“People who volunteer for humanitarian causes usually live longer”) and on the right the interesting positive arousal with altruistic message framing (“There are 8 different blood types that determine whether a donor is compatible with a recipient”).
Ai 05 00034 g0a3

References

  1. Carbonell, J.G.; Michalski, R.S.; Mitchell, T.M. An overview of machine learning. Mach. Learn. 1983, 1, 3–23. [Google Scholar]
  2. Singh, Y.; Bhatia, P.K.; Sangwan, O. A review of studies on machine learning techniques. Int. J. Comput. Sci. Secur. 2007, 1, 70–84. [Google Scholar]
  3. Wlodarczak, P. Machine Learning and Its Applications; CRC Press: Boca Raton, FL, USA, 2019. [Google Scholar]
  4. Badillo, S.; Banfai, B.; Birzele, F.; Davydov, I.I.; Hutchinson, L.; Kam-Thong, T.; Siebourg-Polster, J.; Steiert, B.; Zhang, J.D. An introduction to machine learning. Clin. Pharmacol. Ther. 2020, 107, 871–885. [Google Scholar] [CrossRef]
  5. Mahesh, B. Machine learning algorithms—A review. Int. J. Sci. Res. 2020, 9, 381–386. [Google Scholar]
  6. Skaramagkas, V.; Giannakakis, G.; Ktistakis, E.; Manousos, D.; Karatzanis, I.; Tachos, N.S.; Tripoliti, E.; Marias, K.; Fotiadis, D.I.; Tsiknakis, M. Review of eye tracking metrics involved in emotional and cognitive processes. IEEE Rev. Biomed. Eng. 2021, 16, 260–277. [Google Scholar] [CrossRef] [PubMed]
  7. Sarker, I.H. Machine learning: Algorithms, real-world applications and research directions. SN Comput. Sci. 2021, 2, 160. [Google Scholar] [CrossRef] [PubMed]
  8. Athey, S. The impact of machine learning on economics. In The Economics of Artificial Intelligence: An Agenda; University of Chicago Press: Chicago, IL, USA, 2018; pp. 507–547. [Google Scholar]
  9. Evin, M.; Hidalgo-Munoz, A.; Béquet, A.J.; Moreau, F.; Tattegrain, H.; Berthelon, C.; Fort, A.; Jallais, C. Personality trait prediction by machine learning using physiological data and driving behavior. Mach. Learn. Appl. 2022, 9, 100353. [Google Scholar] [CrossRef]
  10. Seota, S.B.-W.; Klein, R.; Van Zyl, T. Modeling e-behaviour, personality and academic performance with machine learning. Appl. Sci. 2021, 11, 10546. [Google Scholar] [CrossRef]
  11. Cobb, D.P.; Jashami, H.; Hurwitz, D.S. Bicyclists’ behavioral and physiological responses to varying roadway conditions and bicycle infrastructure. Transp. Res. Part F Traffic Psychol. Behav. 2021, 80, 172–188. [Google Scholar] [CrossRef]
  12. Taib, R.; Berkovsky, S.; Koprinska, I.; Wang, E.; Zeng, Y.; Li, J. Personality sensing: Detection of personality traits using physiological responses to image and video stimuli. ACM Trans. Interact. Intell. Syst. 2020, 10, 1–32. [Google Scholar] [CrossRef]
  13. Berkovsky, S.; Taib, R.; Koprinska, I.; Wang, E.; Zeng, Y.; Li, J.; Kleitman, S. Detecting personality traits using eye-tracking data. In Proceedings of the 2019 CHI Conference on Human Factors in Computing Systems, Glasgow, UK, 4–9 May 2019; pp. 1–12. [Google Scholar]
  14. Khatri, J.; Marín-Morales, J.; Moghaddasi, M.; Guixeres, J.; Giglioli, I.A.C.; Alcañiz, M. Recognizing personality traits using consumer behavior patterns in a virtual retail store. Front. Psychol. 2022, 13, 752073. [Google Scholar] [CrossRef] [PubMed]
  15. Allport, F.H.; Allport, G.W. Personality traits: Their classification and measurement. J. Abnorm. Psychol. Soc. Psychol. 1921, 16, 6. [Google Scholar] [CrossRef]
  16. Goldberg, L.R. The structure of phenotypic personality traits. Am. Psychol. 1993, 48, 26. [Google Scholar] [CrossRef] [PubMed]
  17. Matthews, G.; Deary, I.J.; Whiteman, M.C. Personality Traits; Cambridge University Press: Cambridge, UK, 2003. [Google Scholar]
  18. Hoppe, S.; Loetscher, T.; Morey, S.A.; Bulling, A. Eye movements during everyday behavior predict personality traits. Front. Hum. Neurosci. 2018, 12, 328195. [Google Scholar] [CrossRef] [PubMed]
  19. Padilla, J.J.; Kavak, H.; Lynch, C.J.; Gore, R.J.; Diallo, S.Y. Temporal and spatiotemporal investigation of tourist attraction visit sentiment on Twitter. PLoS ONE 2018, 13, e0198857. [Google Scholar] [CrossRef] [PubMed]
  20. Hoogerwerf, M.D.; Veldhuizen, I.J.; De Kort, W.L.; Frings-Dresen, M.H.; Sluiter, J.K. Factors associated with psychological and physiological stress reactions to blood donation: A systematic review of the literature. Blood Transfus. 2015, 13, 354. [Google Scholar]
  21. Chell, K.; Mortimer, G. Investigating online recognition for blood donor retention: An experiential donor value approach. Int. J. Nonprofit Volunt. Sect. Mark. 2014, 19, 143–163. [Google Scholar] [CrossRef]
  22. Al-Samarraie, H.; Eldenfria, A.; Dawoud, H. The impact of personality traits on users’ information-seeking behavior. Inf. Process. Manag. 2017, 53, 237–247. [Google Scholar] [CrossRef]
  23. Sarsam, S.M.; Al-Samarraie, H.; Alzahrani, A.I. Influence of personality traits on users’ viewing behaviour. J. Inf. Sci. 2023, 49, 233–247. [Google Scholar] [CrossRef]
  24. Adeyemi, I.R.; Abd Razak, S.; Salleh, M. Understanding online behavior: Exploring the probability of online personality trait using supervised machine-learning approach. Front. ICT 2016, 3, 8. [Google Scholar] [CrossRef]
  25. Al-Samarraie, H.; Sarsam, S.M.; Alzahrani, A.I.; Alalwan, N.; Masood, M. The role of personality characteristics in informing our preference for visual presentation: An eye movement study. J. Ambient Intell. Smart Environ. 2016, 8, 709–719. [Google Scholar] [CrossRef]
  26. Al-Samarraie, H.; Sarsam, S.M.; Alzahrani, A.I.; Alalwan, N. Personality and individual differences: The potential of using preferences for visual stimuli to predict the Big Five traits. Cogn. Technol. Work 2018, 20, 337–349. [Google Scholar] [CrossRef]
  27. Al-Samarraie, H.; Sarsam, S.M.; Alzahrani, A.I. Emotional intelligence and individuals’ viewing behaviour of human faces: A predictive approach. User Model. User-Adapt. Interact. 2023, 33, 889–909. [Google Scholar] [CrossRef]
  28. Sarsam, S.M.; Al-Samarraie, H. A first look at the effectiveness of personality dimensions in promoting users’ satisfaction with the system. Sage Open 2018, 8, 2158244018769125. [Google Scholar] [CrossRef]
  29. Wu, D.W.-L.; Bischof, W.F.; Anderson, N.C.; Jakobsen, T.; Kingstone, A. The influence of personality on social attention. Personal. Individ. Differ. 2014, 60, 25–29. [Google Scholar] [CrossRef]
  30. Sun, B.; Lai, S.; Xu, C.; Xiao, R.; Wei, Y.; Xiao, Y. Differences of online learning behaviors and eye-movement between students having different personality traits. In Proceedings of the 1st ACM SIGCHI International Workshop on Multimodal Interaction for Education, Glasgow, UK, 13 November 2017; pp. 71–75. [Google Scholar]
  31. Perlman, S.B.; Morris, J.P.; Vander Wyk, B.C.; Green, S.R.; Doyle, J.L.; Pelphrey, K.A. Individual differences in personality predict how people look at faces. PLoS ONE 2009, 4, e5952. [Google Scholar] [CrossRef] [PubMed]
  32. Hilliard, A.; Kazim, E.; Bitsakis, T.; Leutner, F. Measuring personality through images: Validating a forced-choice image-based assessment of the big five personality traits. J. Intell. 2022, 10, 12. [Google Scholar] [CrossRef] [PubMed]
  33. Salima, M.; M‘hammed, S.; Messaadia, M.; Benslimane, S.M. Machine Learning for Predicting Personality Traits from Eye Tracking. In Proceedings of the 2023 International Conference on Decision Aid Sciences and Applications (DASA), Annaba, Algeria, 16–17 September 2023; pp. 126–130. [Google Scholar]
  34. Woods, C.; Luo, Z.; Watling, D.; Durant, S. Twenty seconds of visual behaviour on social media gives insight into personality. Sci. Rep. 2022, 12, 1178. [Google Scholar] [CrossRef] [PubMed]
  35. Duchowski, A.T.; Duchowski, A.T. Eye Tracking Methodology: Theory and Practice; Springer: Berlin/Heidelberg, Germany, 2017. [Google Scholar]
  36. Carter, B.T.; Luke, S.G. Best practices in eye tracking research. Int. J. Psychophysiol. 2020, 155, 49–62. [Google Scholar] [CrossRef]
  37. Suresh, K. An overview of randomization techniques: An unbiased assessment of outcome in clinical research. J. Hum. Reprod. Sci. 2011, 4, 8–11. [Google Scholar] [CrossRef]
  38. Mohr, D.L.; Wilson, W.J.; Freund, R.J. Statistical Methods; Academic Press: Cambridge, MA, USA, 2021. [Google Scholar]
  39. Balaskas, S.; Rigou, M. The effects of emotional appeals on visual behavior in the context of green advertisements: An exploratory eye-tracking study. In Proceedings of the 27th Pan-Hellenic Conference on Progress in Computing and Informatics, Lamia, Greece, 24–26 November 2023; pp. 141–149. [Google Scholar]
  40. Zhang, L.; Yao, M.; Liu, H.; Zheng, S. The effect of functional motivation on future intention to donate blood: Moderating role of the blood donor’s stage. Int. J. Environ. Res. Public Health 2021, 18, 9115. [Google Scholar] [CrossRef] [PubMed]
  41. Ferguson, E.; Edwards, A.R.; Masser, B.M. Simple reciprocal fairness message to enhance non-donor’s willingness to donate blood. Ann. Behav. Med. 2022, 56, 89–99. [Google Scholar] [CrossRef] [PubMed]
  42. Chen, L.; Zhou, Y.; Zhang, S.; Xiao, M. How anxiety relates to blood donation intention of non-donors: The roles of moral disengagement and mindfulness. J. Soc. Psychol. 2024, 164, 43–58. [Google Scholar] [CrossRef] [PubMed]
  43. Balaskas, S.; Koutroumani, M.; Rigou, M. The Mediating Role of Emotional Arousal and Donation Anxiety on Blood Donation Intentions: Expanding on the Theory of Planned Behavior. Behav. Sci. 2024, 14, 242. [Google Scholar] [CrossRef] [PubMed]
  44. Tobii Pro AB. Tobii Pro Nano; Tobii Pro AB: Stockholm, Sweden, 2024. [Google Scholar]
  45. iMotions (Version 9. 4); iMotions A/S: Copenhagen, Denmark, 2022. [Google Scholar]
  46. Komogortsev, O.V.; Gobert, D.V.; Jayarathna, S.; Gowda, S.M. Standardization of automated analyses of oculomotor fixation and saccadic behaviors. IEEE Trans. Biomed. Eng. 2010, 57, 2635–2645. [Google Scholar] [CrossRef]
  47. Olsen, A. The Tobii I-VT fixation filter. Tobii Technol. 2012, 21, 4–19. [Google Scholar]
  48. Salvucci, D.D.; Goldberg, J.H. Identifying fixations and saccades in eye-tracking protocols. In Proceedings of the 2000 Symposium on Eye Tracking Research & Applications, Palm Beach Gardens, FL, USA, 6–8 November 2000; pp. 71–78. [Google Scholar]
  49. Holmqvist, K.; Nyström, M.; Andersson, R.; Dewhurst, R.; Jarodzka, H.; Van de Weijer, J. Eye Tracking: A Comprehensive Guide to Methods and Measures; OUP Oxford: Oxford, UK, 2011. [Google Scholar]
  50. Orquin, J.L.; Ashby, N.J.; Clarke, A.D. Areas of interest as a signal detection problem in behavioral eye-tracking research. J. Behav. Decis. Mak. 2016, 29, 103–115. [Google Scholar] [CrossRef]
  51. Friedrich, M.; Rußwinkel, N.; Möhlenbrink, C. A guideline for integrating dynamic areas of interests in existing set-up for capturing eye movement: Looking at moving aircraft. Behav. Res. Methods 2017, 49, 822–834. [Google Scholar] [CrossRef] [PubMed]
  52. Peng-Li, D.; Mathiesen, S.L.; Chan, R.C.; Byrne, D.V.; Wang, Q.J. Sounds Healthy: Modelling sound-evoked consumer food choice through visual attention. Appetite 2021, 164, 105264. [Google Scholar] [CrossRef]
  53. Silva, B.B.; Orrego-Carmona, D.; Szarkowska, A. Using linear mixed models to analyze data from eye-tracking research on subtitling. Transl. Spaces 2022, 11, 60–88. [Google Scholar] [CrossRef]
  54. Brown-Schmidt, S.; Naveiras, M.; De Boeck, P.; Cho, S.-J. Statistical modeling of intensive categorical time-series eye-tracking data using dynamic generalized linear mixed-effect models with crossed random effects. In Psychology of Learning and Motivation; Elsevier: Amsterdam, The Netherlands, 2020; Volume 73, pp. 1–31. [Google Scholar]
  55. Galanakis, M.; Stalikas, A.; Pezirkianidis, C.; Karakasidou, I. Reliability and validity of the modified differential emotions scale (mDES) in a Greek sample. Psychology 2016, 7, 101. [Google Scholar] [CrossRef]
  56. Ashton, M.C.; Lee, K. The HEXACO–60: A short measure of the major dimensions of personality. J. Personal. Assess. 2009, 91, 340–345. [Google Scholar] [CrossRef] [PubMed]
  57. Bashiri, H.; Barahmand, U.; Akabri, Z.S.; Ghamari, G.H.; Vusugi, A. A study of the psychometric properties and the standardization of hexaco personality inventory. Procedia-Soc. Behav. Sci. 2011, 30, 1173–1176. [Google Scholar] [CrossRef]
  58. Bisong, E. Google Colaboratory. Building Machine Learning and Deep Learning Models on Google Cloud Platform: A Comprehensive Guide for Beginners; Apress: Berkeley, CA, USA, 2019; pp. 59–64. [Google Scholar]
  59. Royston, P. Approximating the Shapiro-Wilk W-test for non-normality. Stat. Comput. 1992, 2, 117–119. [Google Scholar] [CrossRef]
  60. Hanusz, Z.; Tarasińska, J. Normalization of the Kolmogorov–Smirnov and Shapiro–Wilk tests of normality. Biom. Lett. 2015, 52, 85–93. [Google Scholar] [CrossRef]
  61. O’brien, R.M. A caution regarding rules of thumb for variance inflation factors. Qual. Quant. 2007, 41, 673–690. [Google Scholar] [CrossRef]
  62. Breusch, T.S.; Pagan, A.R. A simple test for heteroscedasticity and random coefficient variation. Econom. J. Econom. Soc. 1979, 47, 1287–1294. [Google Scholar] [CrossRef]
  63. Waldman, D.M. A note on algebraic equivalence of White’s test and a variation of the Godfrey/Breusch-Pagan test for heteroscedasticity. Econ. Lett. 1983, 13, 197–200. [Google Scholar] [CrossRef]
  64. Halunga, A.G.; Orme, C.D.; Yamagata, T. A heteroskedasticity robust Breusch–Pagan test for Contemporaneous correlation in dynamic panel data models. J. Econom. 2017, 198, 209–230. [Google Scholar] [CrossRef]
  65. Schultz, B.B. Levene’s test for relative variation. Syst. Zool. 1985, 34, 449–456. [Google Scholar] [CrossRef]
  66. Gastwirth, J.L.; Gel, Y.R.; Miao, W. The impact of Levene’s test of equality of variances on statistical theory and practice. Statist. Sci. 2009, 24, 343–360. [Google Scholar] [CrossRef]
  67. Vargha, A.; Delaney, H.D. The Kruskal-Wallis test and stochastic homogeneity. J. Educ. Behav. Stat. 1998, 23, 170–192. [Google Scholar] [CrossRef]
  68. Dinno, A. Nonparametric pairwise multiple comparisons in independent groups using Dunn’s test. Stata J. 2015, 15, 292–300. [Google Scholar] [CrossRef]
  69. MacFarland, T.W.; Yates, J.M.; MacFarland, T.W.; Yates, J.M. Kruskal–Wallis H-test for oneway analysis of variance (ANOVA) by ranks. In Introduction to Nonparametric Statistics for the Biological Sciences Using R; Springer: Berlin/Heidelberg, Germany, 2016; pp. 177–211. [Google Scholar]
  70. Mays, J.E.; Birch, J.B.; Einsporn, R.L. An overview of model-robust regression. J. Stat. Comput. Simul. 2000, 66, 79–100. [Google Scholar] [CrossRef]
  71. Andersen, R. Modern Methods for Robust Regression; Sage: Newcastle upon Tyne, UK, 2008. [Google Scholar]
  72. Alma, Ö.G. Comparison of robust regression methods in linear regression. Int. J. Contemp. Math. Sci. 2011, 6, 409–421. [Google Scholar]
  73. Baş, S.; Carello, G.; Lanzarone, E.; Ocak, Z.; Yalçındağ, S. Management of blood donation system: Literature review and research perspectives. In Health Care Systems Engineering for Scientists and Practitioners: HCSE, Lyon, France, May 2015; Springer: Berlin/Heidelberg, Germany, 2016; pp. 121–132. [Google Scholar]
  74. Ostertagova, E.; Ostertag, O.; Kováč, J. Methodology and application of the Kruskal-Wallis test. Appl. Mech. Mater. 2014, 611, 115–120. [Google Scholar] [CrossRef]
  75. Cleophas, T.J.; Zwinderman, A.H.; Cleophas, T.J.; Zwinderman, A.H. Non-parametric tests for three or more samples (Friedman and Kruskal-Wallis). In Clinical Data Analysis on a Pocket Calculator: Understanding the Scientific Methods of Statistical Reasoning and Hypothesis Testing; Springer: Berlin/Heidelberg, Germany, 2016; pp. 193–197. [Google Scholar]
  76. Armstrong, R.A. When to use the B onferroni correction. Ophthalmic Physiol. Opt. 2014, 34, 502–508. [Google Scholar] [CrossRef]
  77. Lambert-Lacroix, S.; Zwald, L. Robust regression through the Huber’s criterion and adaptive lasso penalty. Electron. J. Statist. 2011, 5, 1015–1053. [Google Scholar] [CrossRef]
  78. Huang, D.; Cabral, R.; De la Torre, F. Robust regression. IEEE Trans. Pattern Anal. Mach. Intell. 2015, 38, 363–375. [Google Scholar] [CrossRef]
  79. Feng, Y.; Wu, Q. A statistical learning assessment of Huber regression. J. Approx. Theory 2022, 273, 105660. [Google Scholar] [CrossRef]
  80. Barr, D.J.; Levy, R.; Scheepers, C.; Tily, H.J. Random effects structure for confirmatory hypothesis testing: Keep it maximal. J. Mem. Lang. 2013, 68, 255–278. [Google Scholar] [CrossRef] [PubMed]
  81. Chai, T.; Draxler, R.R. Root mean square error (RMSE) or mean absolute error (MAE)?—Arguments against avoiding RMSE in the literature. Geosci. Model Dev. 2014, 7, 1247–1250. [Google Scholar] [CrossRef]
  82. Hastie, T.J.; Pregibon, D. Generalized linear models. In Statistical Models; Routledge: Abingdon, UK, 2017; pp. 195–247. [Google Scholar]
  83. Kiefer, C.; Mayer, A. Average effects based on regressions with a logarithmic link function: A new approach with stochastic covariates. Psychometrika 2019, 84, 422–446. [Google Scholar] [CrossRef]
  84. Ng, V.K.; Cribbie, R.A. The gamma generalized linear model, log transformation, and the robust Yuen-Welch test for analyzing group means with skewed and heteroscedastic data. Commun. Stat. Simul. Comput. 2019, 48, 2269–2286. [Google Scholar] [CrossRef]
  85. Bender, R.; Lange, S. Adjusting for multiple testing—When and how? J. Clin. Epidemiol. 2001, 54, 343–349. [Google Scholar] [CrossRef]
  86. Khuri, A.I.; Mukherjee, B.; Sinha, B.K.; Ghosh, M. Design issues for generalized linear models: A review. Stat. Sci. 2006, 21, 376–399. [Google Scholar] [CrossRef]
  87. Barr, D.J. Analyzing ‘visual world’ eyetracking data using multilevel logistic regression. J. Mem. Lang. 2008, 59, 457–474. [Google Scholar] [CrossRef]
  88. Pauler, D.K.; Escobar, M.D.; Sweeney, J.A.; Greenhouse, J. Mixture models for eye-tracking data: A case study. Stat. Med. 1996, 15, 1365–1376. [Google Scholar] [CrossRef]
  89. Mézière, D.C.; Yu, L.; Reichle, E.D.; Von Der Malsburg, T.; McArthur, G. Using eye-tracking measures to predict reading comprehension. Read. Res. Q. 2023, 58, 425–449. [Google Scholar] [CrossRef]
  90. LaValle, S.M.; Branicky, M.S.; Lindemann, S.R. On the relationship between classical grid search and probabilistic roadmaps. Int. J. Robot. Res. 2004, 23, 673–692. [Google Scholar] [CrossRef]
  91. Pedregosa, F.; Varoquaux, G.; Gramfort, A.; Michel, V.; Thirion, B.; Grisel, O.; Blondel, M.; Prettenhofer, P.; Weiss, R.; Dubourg, V. Scikit-learn: Machine learning in Python. J. Mach. Learn. Res. 2011, 12, 2825–2830. [Google Scholar]
  92. Nielsen, F.; Nielsen, F. Hierarchical clustering. In Introduction to HPC with MPI for Data Science; Springer: Berlin/Heidelberg, Germany, 2016; pp. 195–211. [Google Scholar]
  93. Murtagh, F.; Contreras, P. Algorithms for hierarchical clustering: An overview, II. Wiley Interdiscip. Rev. Data Min. Knowl. Discov. 2017, 7, e1219. [Google Scholar] [CrossRef]
  94. Jakkula, V. Tutorial on support vector machine (svm). Sch. EECS Wash. State Univ. 2006, 37, 3. [Google Scholar]
  95. Rigatti, S.J. Random forest. J. Insur. Med. 2017, 47, 31–39. [Google Scholar] [CrossRef]
  96. Peterson, L.E. K-nearest neighbor. Scholarpedia 2009, 4, 1883. [Google Scholar] [CrossRef]
  97. Kartini, D.; Nugrahadi, D.T.; Farmadi, A. Hyperparameter tuning using GridsearchCV on the comparison of the activation function of the ELM method to the classification of pneumonia in toddlers. In Proceedings of the 2021 4th International Conference of Computer and Informatics Engineering (IC2IE), Jakarta, Indonesia, 14–15 September 2021; pp. 390–395. [Google Scholar]
  98. Thanh Noi, P.; Kappas, M. Comparison of random forest, k-nearest neighbor, and support vector machine classifiers for land cover classification using Sentinel-2 imagery. Sensors 2017, 18, 18. [Google Scholar] [CrossRef] [PubMed]
  99. Ranjan, G.; Verma, A.K.; Radhika, S. K-nearest neighbors and grid search cv based real time fault monitoring system for industries. In Proceedings of the 2019 IEEE 5th International Conference for Convergence in Technology (I2CT), Bombay, India, 29–31 March 2019; pp. 1–5. [Google Scholar]
  100. Boateng, E.Y.; Otoo, J.; Abaye, D.A. Basic tenets of classification algorithms K-nearest-neighbor, support vector machine, random forest and neural network: A review. J. Data Anal. Inf. Process. 2020, 8, 341–357. [Google Scholar] [CrossRef]
  101. Vieira, S.M.; Kaymak, U.; Sousa, J.M. Cohen’s kappa coefficient as a performance measure for feature selection. In Proceedings of the International Conference on Fuzzy Systems, Barcelona, Spain, 18–23 July 2010; pp. 1–8. [Google Scholar]
  102. Lipton, Z.C.; Elkan, C.; Narayanaswamy, B. Thresholding classifiers to maximize F1 score. arXiv 2014, arXiv:1402.1892. [Google Scholar]
  103. Flach, P.; Kull, M. Precision-recall-gain curves: PR analysis done right. Adv. Neural Inf. Process. Syst. 2015, 28, 838–846. [Google Scholar]
  104. Yin, M.; Wortman Vaughan, J.; Wallach, H. Understanding the effect of accuracy on trust in machine learning models. In Proceedings of the 2019 Chi Conference on Human Factors in Computing Systems, Hamburg, Germany, 11–16 May 2019; pp. 1–12. [Google Scholar]
  105. Yacouby, R.; Axman, D. Probabilistic extension of precision, recall, and f1 score for more thorough evaluation of classification models. In Proceedings of the 1st Workshop on Evaluation and Comparison of NLP Systems, Virtual, 20 November 2020; pp. 79–91. [Google Scholar]
  106. Bleidorn, W.; Hopwood, C.J. Using machine learning to advance personality assessment and theory. Personal. Soc. Psychol. Rev. 2019, 23, 190–203. [Google Scholar] [CrossRef]
  107. Shashikala, B.; Pushpalatha, M.; Vijaya, B. Machine learning approaches for potential blood donors prediction. In Emerging Research in Electronics, Computer Science and Technology: Proceedings of International Conference; Lecture Notes in Electrical Engineering; Springer: Singapore, 2019; Volume 545, pp. 483–491. [Google Scholar] [CrossRef]
  108. Evans, R.; Ferguson, E. Defining and measuring blood donor altruism: A theoretical approach from biology, economics and psychology. Vox Sang. 2014, 106, 118–126. [Google Scholar] [CrossRef] [PubMed]
  109. Karacan, E.; Seval, G.C.; Aktan, Z.; Ayli, M.; Palabiyikoglu, R. Blood donors and factors impacting the blood donation decision: Motives for donating blood in Turkish sample. Transfus. Apher. Sci. 2013, 49, 468–473. [Google Scholar] [CrossRef] [PubMed]
  110. Faqah, A.; Moiz, B.; Shahid, F.; Ibrahim, M.; Raheem, A. Assessment of blood donation intention among medical students in Pakistan–An application of theory of planned behavior. Transfus. Apher. Sci. 2015, 53, 353–359. [Google Scholar] [CrossRef]
  111. Ferguson, E.; Murray, C.; O’Carroll, R.E. Blood and organ donation: Health impact, prevalence, correlates, and interventions. Psychol. Health 2019, 34, 1073–1104. [Google Scholar] [CrossRef] [PubMed]
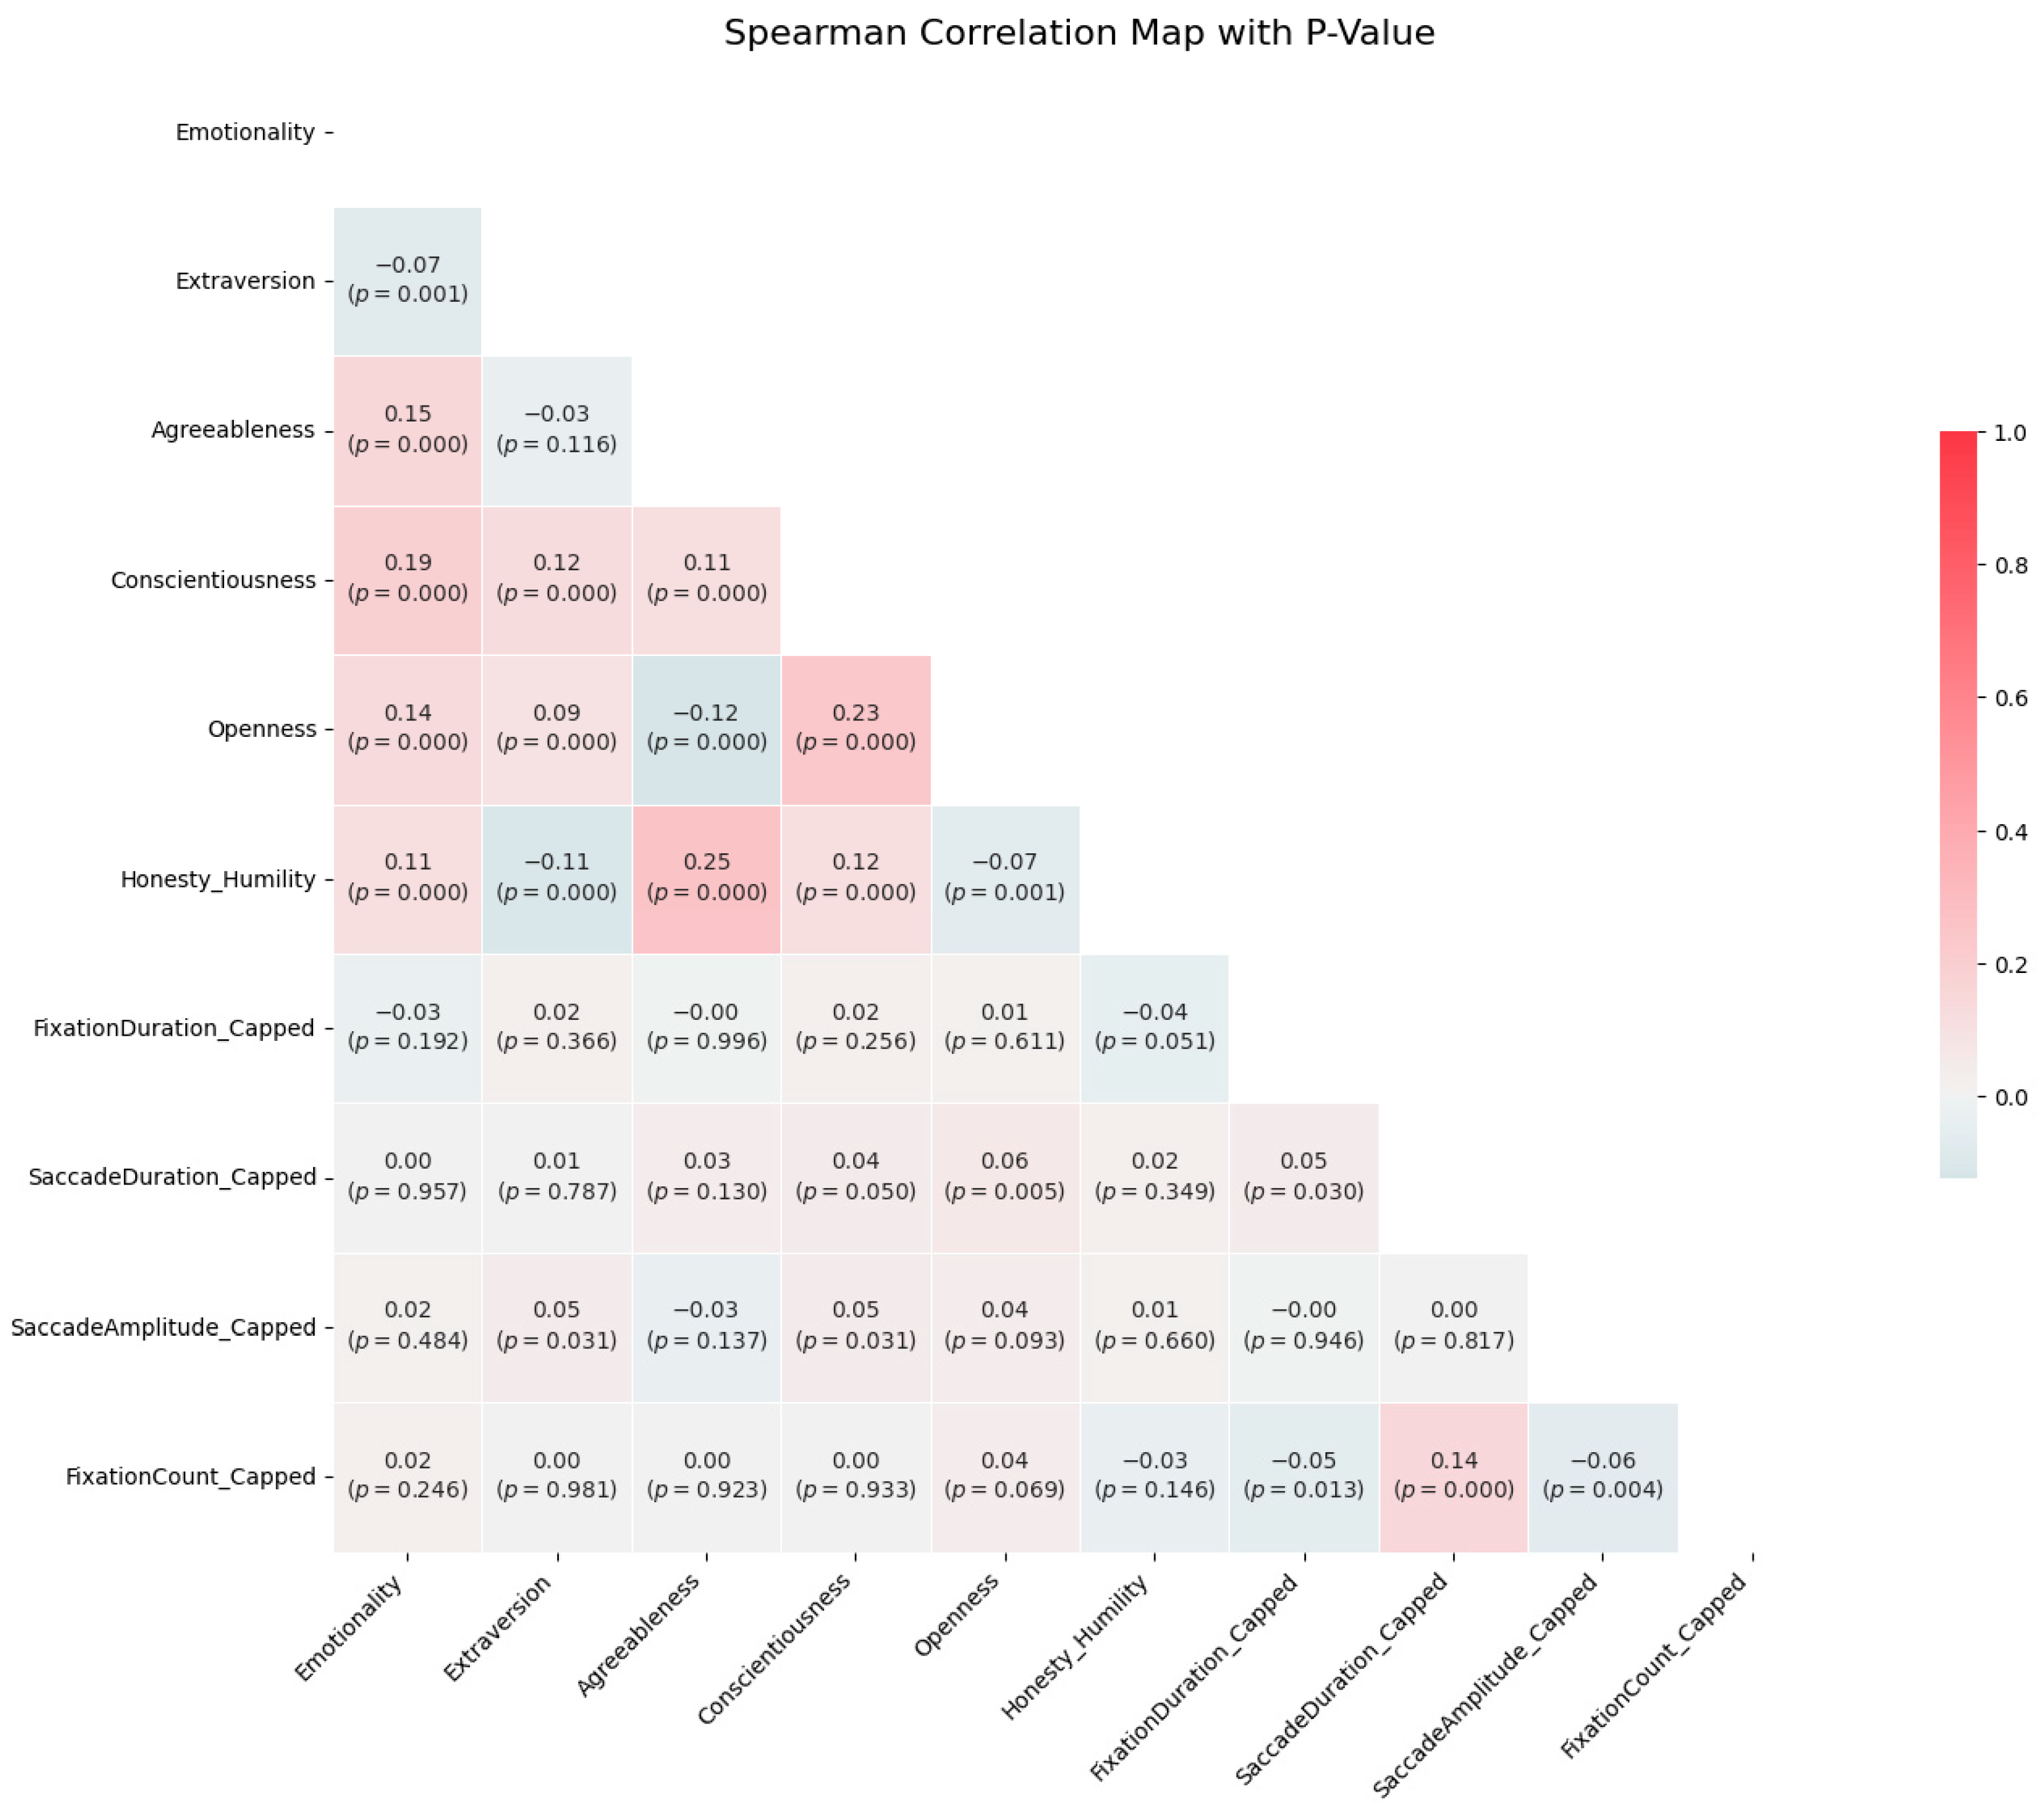
Figure 1. Spearman correlation map.
Ai 05 00034 g001
Figure 2. Interaction between the emotion type and message type on fixation count: This graph illustrates the difference in fixation counts between messages with altruistic (altr) and egoistic (ego) themes across negative and positive emotions. Notably, fixation counts decrease for ego messages when paired with positive emotions.
Ai 05 00034 g002
Figure 3. Interaction effects of specific emotions and message types on fixation count: This graph demonstrates the fixation counts for altruistic (altr) and egoistic (ego) message types across a range of specific emotions. The varying levels of fixation count highlight the complex influence of discrete emotions on the processing of different message themes.
Ai 05 00034 g003
Figure 4. Interaction effect of emotion and openness level on fixation count: The graph delineates how varying levels of openness (low, medium, high) interact with different emotions to influence fixation counts.
Ai 05 00034 g004
Figure 5. Architectural overview.
Ai 05 00034 g005
Figure 6. Hierarchical clustering.
Ai 05 00034 g006
Figure 7. Relationships among eye movement metrics and personality traits. Emotionality (pred 0), openness (pred 1), and honesty–humility (pred 2).
Ai 05 00034 g007
Table 1. Advertisement summary from [43].
Emotional ArousalTextual MessageNumber of AdsSelected Emotions
PositiveAltruistic3Joy, interest, inspiration
PositiveEgocentric3Joy, interest, inspiration
NegativeAltruistic3Disgust, guilt, fear
NegativeEgocentric3Disgust, guilt, fear
Total number of ads: 12
Table 2. Sample profile.
FrequencyPercentage
GenderMale4256%
Female3344%
Age18–256485.3%
26–301114.7%
EducationHigh school graduate34%
Bachelor student6181.3%
Graduate68%
Postgraduate34%
PhD candidate22.7%
Table 3. Significant results of Kruskal–Wallis tests on eye-tracking metrics.
MetricTest Statistic (H)p-ValuesNotes
Fixation duration (AOI)83.593<0.001Across ad types
Saccade duration (AOI)1030.702<0.001Across ad types
Saccade amplitude (AOI)205.736<0.001Across ad types
Fixation count (AOI)1441.419<0.001Across ad types
Saccade duration (message)41.654<0.001Altruistic vs. egoistic
Fixation count (message)82.156<0.001Altruistic vs. egoistic
Saccade amplitude (message)3.9290.047Altruistic vs. egoistic
Table 4. Significant differences in saccade duration.
Comparing GroupsStatistic (U)p-Value
emotion_disgust_altr vs. emotion_inter_altr7433.0<0.001
emotion_disgust_altr vs. logo_disgust_altr4011.0<0.001
emotion_disgust_altr vs. logo_disgust_ego2509.0<0.001
emotion vs. logo270,728.0<0.001
emotion vs. text571,833.0<0.001
message type: altr vs. ego660,466.0<0.001
logo vs. text61,391.0<0.001
Table 5. Significant differences in fixation count.
Comparing GroupsStatistic (U)p-Value
emotion_disgust_altr vs. emotion_fear_altr3103.5<0.001
emotion_disgust_altr vs. emotion_insp_altr981.0<0.001
emotion_disgust_altr vs. emotion_insp_ego1669.5<0.001
emotion_disgust_altr vs. emotion_joy_altr1932.0<0.001
emotion vs. logo278,041.0<0.001
emotion vs. text190,139.0<0.001
message type: altr vs. ego438,168.5<0.001
logo vs. text6178.5<0.001
text vs. text146,054.0<0.001
text vs. text241,720.0<0.001
Table 6. Summary of significant findings from Friedman tests and Dunn’s post hoc comparisons across emotional categories for eye-tracking metrics.
MetricFriedman Test StatisticFriedman p-ValueSig. Pairwise Comparisons (Dunn’s Test)p-Values (Dunn’s Test)
Fixation duration21.57<0.001disgust vs. joy0.005
Saccade duration68.33<0.001disgust vs. fear, disgust vs. insp, disgust vs. interRanges from < 0.001 to 0.801
Saccade amplitude15.360.009disgust vs. fear0.005
Fixation count69.29<0.001disgust vs. inter, insp vs. inter0.002, 0.008
Table 7. Significant relationships between HEXACO traits and eye-tracking metrics.
Personality TraitEye-Tracking MetricCoefficientp-Value95% CI
Honesty–humilityFixation duration−14.200.015[−25.67, −2.73]
OpennessSaccade duration358.980.002[130.60, 587.36]
ExtraversionSaccade amplitude7.370.013[1.57, 13.18]
OpennessFixation count1.020.044[0.02, 2.02]
Table 8. Significant generalised linear model (GLM) results for eye-tracking metrics influenced by personality traits and message types.
Dependent VariableIndependent VariableCoeff.SEp-Value95% CIInterpretation
Fixation durationEgo message type−0.08490.0420.045[−0.168, −0.002]Main effect showing negative influence
Fixation durationHonesty–humility (trait effect)−0.08350.0290.004[−0.141, −0.026]Lower levels associated with shorter durations
Saccade durationPositive emotions and ego message type0.22220.050<0.001[0.125, 0.319]Significant interaction enhancing durations
Saccade durationEgo message type−0.27290.038<0.001[−0.348, −0.198]Negative main effect
Saccade amplitudeExtraversion (trait effect)0.04190.0160.011[0.010, 0.074]Higher levels increase amplitude
Fixation countPositive emotions and ego message type−0.36270.053<0.001[−0.467, −0.259]Significant interaction decreasing counts
Fixation countPositive emotions0.10700.0400.007[0.029, 0.185]Positive main effect
Fixation countEgo message type0.49110.036<0.001[0.420, 0.562]Positive main effect
Fixation countOpenness to experience (trait effect)0.07970.0370.031[0.007, 0.152]Higher levels linked to more fixation counts
Table 9. Summary of classification results.
ModelBest ParametersAccuracy (%)Cohen’s KappaPrecisionRecallF1 Score
SVMC: 10, gamma: 0.186.66%0.812591.67%90.0%89.44%
Random Forestmax depth: None, n_estimators: 5066.67%0.525356.25%55.0%52.08%
KNNn_neighbours: 786.67%0.806565.83%70.0%67.17%
Table 10. Dunn’s post hoc test results for pairwise model comparisons.
ComparisonPrecision p-ValueRecall p-ValueF1 Score p-ValueAccuracy p-Value
KNN vs. Random Forest>0.05>0.05>0.050.881478
KNN vs. SVM0.0817620.0615460.0562750.320794
Random Forest vs. SVM0.0280020.0104100.0117630.023310
Table 11. Comparative performance of machine learning models.
ModelAccuracy (%)Cohen’s KappaPrecision (%)Recall (%)F1 Score (%)
SVM98.67%0.98198%98.81%98.88%
KNN92%0.88269.18%71.84%70.43%
Random Forest86.67%0.80465%68.17%66.37%
Disclaimer/Publisher’s Note: The statements, opinions and data contained in all publications are solely those of the individual author(s) and contributor(s) and not of MDPI and/or the editor(s). MDPI and/or the editor(s) disclaim responsibility for any injury to people or property resulting from any ideas, methods, instructions or products referred to in the content.