Article

Stable Isotopes and Fatty Acids Reveal Diet Plasticity and Trophic Interactions of Small Pelagic Fishes in a Coastal Upwelling System


1
Instituto Español de Oceanografía (IEO-CSIC), Centro Oceanográfico de A Coruña, 15001 A Coruña, Spain
2
Department of Earth Sciences, University of Hawai‘i at Mānoa, 1680 East-West Road, POST 719B, Honolulu, HI 96822, USA
3
Department of Ocean Sciences, Rosenstiel School of Marine, Atmospheric, and Earth Science, University of Miami, 4600 Rickenbacker Causeway, Miami, FL 33149, USA
*
Author to whom correspondence should be addressed.
Oceans 2026, 7(4), 65; https://doi.org/10.3390/oceans7040065
Submission received: 16 June 2026 / Revised: 15 July 2026 / Accepted: 26 July 2026 / Published: 4 August 2026

Abstract

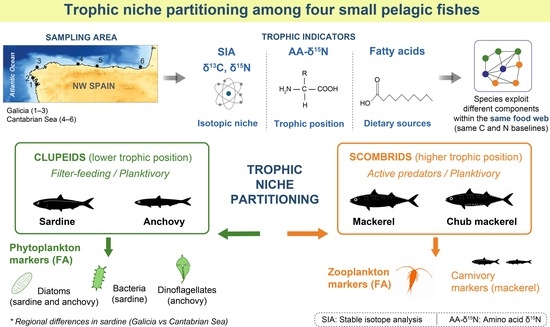
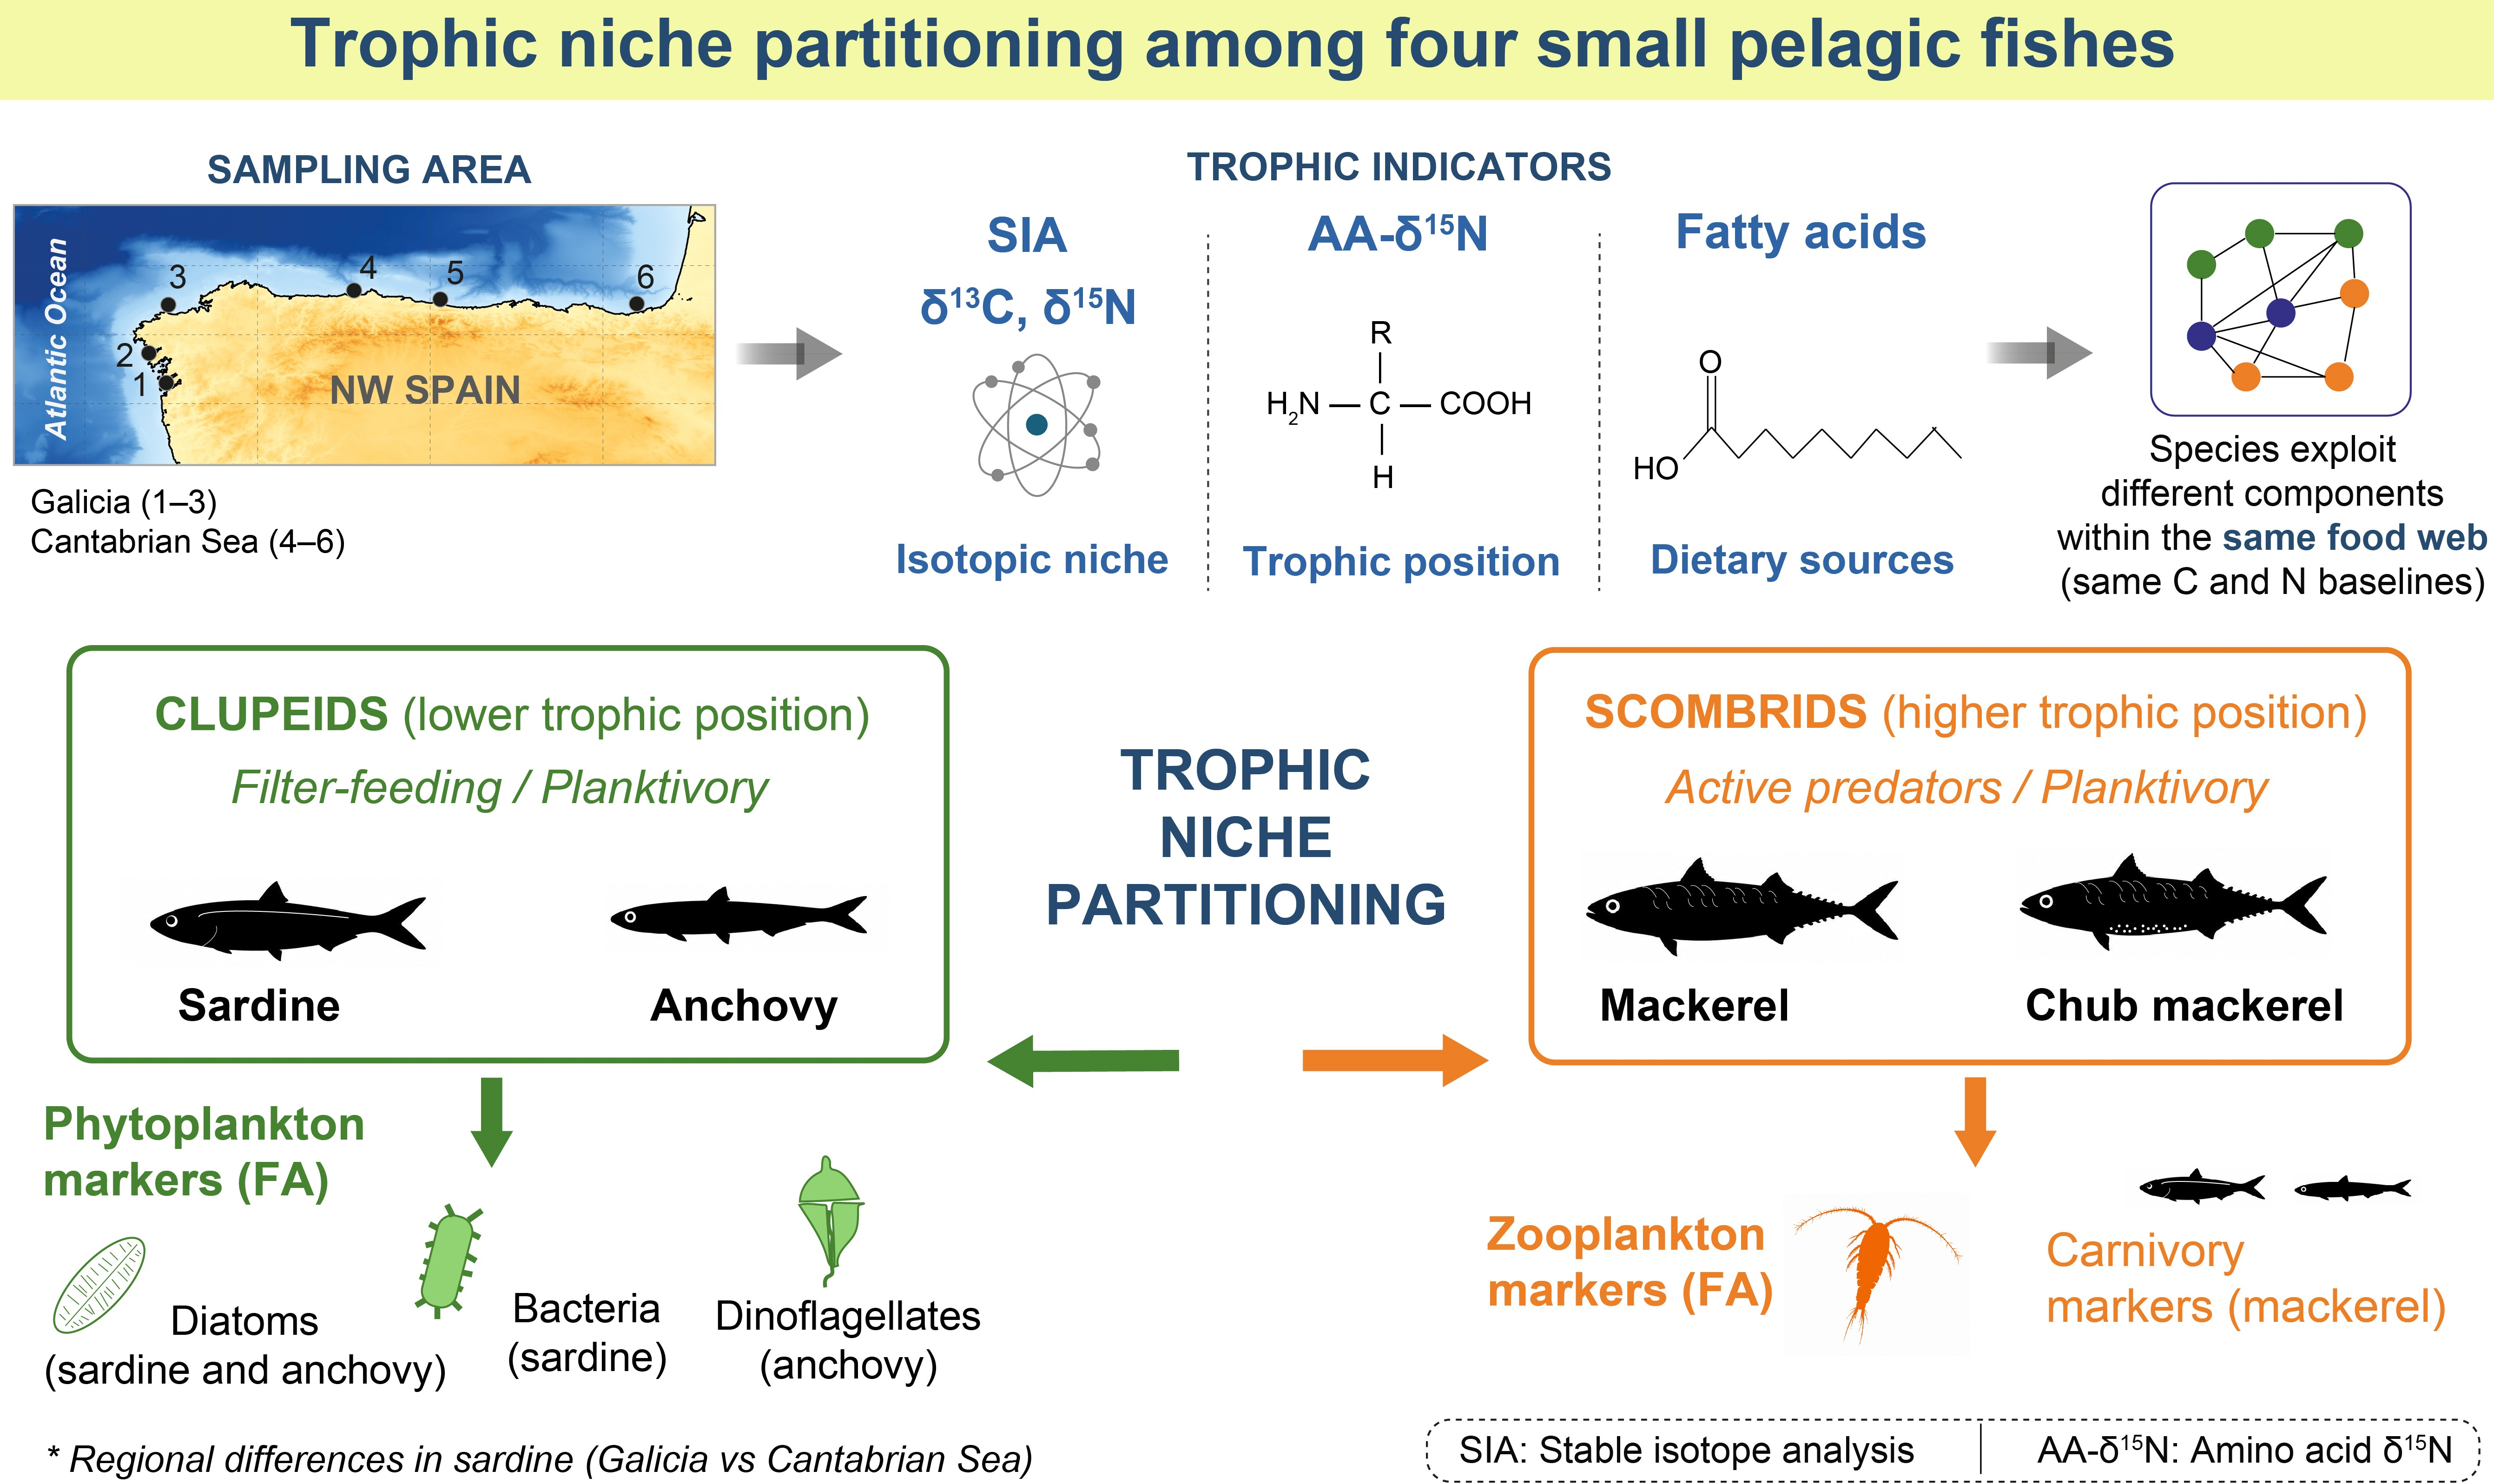
Small pelagic fishes play a crucial role in structuring marine food webs, yet their trophic flexibility and feeding interactions remain poorly understood in highly dynamic, nutrient-rich systems such as upwelling regions. This study combines bulk stable isotope analysis (δ13C and δ15N), compound-specific nitrogen isotope analysis of amino acids (CSIA-AA), and fatty acid (FA) profiles to assess feeding patterns and trophic overlap among four planktivorous species in the North Iberian shelf (Galicia and the Cantabrian Sea). The combined trophic indicators reveal clear niche partitioning between clupeids (sardine and anchovy) and scombrids (mackerel and chub mackerel), with the latter exhibiting higher CSIA-AA-derived trophic positions and distinct FA composition. Our analysis further shows that fatty acid biomarkers are essential for resolving finer-scale differences within each group, driven by variable contributions of phytoplankton and zooplankton to species diets. Although all species shared resources within the same food web, isotopic baselines indicate a decoupling between carbon and nitrogen pathways. For sardine, we compared neutral and polar lipid fractions with the total lipid extract in terms of FA composition and key dietary markers. Our results suggest that separating lipid fractions can improve dietary resolution, especially when lipid content is low. Overall, our findings highlight the value of integrating classical and emerging biochemical tracers to better resolve trophic dynamics in coexisting planktivorous fishes.

Graphical Abstract

1. Introduction

Small pelagic fishes, such as sardines, anchovies, and mackerels, are schooling species that inhabit the open water column and feed primarily on plankton. They play crucial ecological and economic roles by transferring energy through mid-trophic levels in marine food webs and contributing approximately 25% of global fisheries landings [1]. Over the past two decades, populations of these species, particularly clupeids such as sardine (Sardina pilchardus) and anchovy (Engraulis encrasicolus) but also mackerel (Scomber scombrus), have declined significantly in the Northeast Atlantic, including the Bay of Biscay [2], and the northern Mediterranean Sea [3]. These declines in stock biomass and landings have coincided with marked reductions in individual body size and weight [4]. Potential drivers of these declines include climate variability [5], interspecific food competition, and reduced prey diversity [6], all of which may be altering ecosystem dynamics and highlight the need to better understand the feeding behavior and trophic interactions of these species in order to predict their resilience to future environmental changes.
Stomach content analysis is a well-established method for assessing diet composition, offering direct information on recently ingested prey. However, some inherent limitations, such as short temporal integration, can be overcome by stable isotope analysis of carbon (δ13C) and nitrogen (δ15N) in bulk tissues. This method provides an integrative framework for resolving trophic relationships and resource partitioning among organisms feeding within the same food web. Because δ13C and δ15N values predictably change across trophic levels (typically ≤ 1‰ for δ13C and ~3.4‰ for δ15N), δ13C is commonly used as a tracer of carbon sources and foraging habitat (i.e., carbon baselines), while δ15N is used to estimate trophic position [7]. However, bulk δ15N values are also influenced by variability in the isotopic composition of the sources of nitrogen for primary producers (i.e., nitrogen baselines). Compound-specific nitrogen isotope analysis of amino acids (CSIA-AA) enhances this resolution by separating baseline and trophic effects [8]. Source amino acids (e.g., phenylalanine or lysine) show minimal 15N fractionation and thus reflect the δ15N values at the base of the food web, enabling differentiation among food webs characterized by distinct nitrogen sources [9]. In contrast, trophic amino acids (e.g., glutamic acid or alanine) exhibit predictable increases in δ15N values up the food web. Thus, a single tissue sample can provide information on both the origin of assimilated nitrogen and the trophic position of the consumer. This approach can be strengthened by incorporating fatty acid (FA) analysis, a robust indicator of variation in dietary sources (e.g., phytoplankton, zooplankton, and other animal-derived material) that can also be used to infer dietary competition and feeding diversity [10,11].
The North Iberian shelf, located off the northwestern coast of Spain, is influenced by seasonal upwelling and characterized by complex coastal geomorphology, factors that help explain the spatial patterns observed in small pelagic fish populations in the region [12,13]. Upwelling, particularly in the westernmost areas (e.g., Galicia), boosts phytoplankton productivity and zooplankton biomass, modifying prey availability for planktivorous fishes [14]. Sardine and anchovy are among the most exploited small pelagic species in this area [13,15]. Both primarily feed on zooplankton, although sardine generally consumes smaller prey, including phytoplankton, whereas anchovy targets larger zooplankton, particularly copepods [16]. Other important regional planktivores are mackerels (S. scombrus and S. colias), which feed on larger prey such as calanoid copepods, fish eggs, and euphausiids [16,17]. However, stomach content studies reveal substantial dietary plasticity across all these species. Here, dietary plasticity refers to the ability of an organism to adjust its feeding habits and diet composition in response to changes in local prey availability. As a result, diets tend to reflect the prey resources available in the environment rather than strict species-specific preferences, leading to considerable dietary overlap among small pelagic fishes [16]. This trophic flexibility may contribute to discrepancies among dietary biomarkers, as trophic position estimates based on bulk stable isotope analysis often diverge from stomach content data [17]. Moreover, recent δ15N CSIA-AA estimates from this region suggest zonal differences in the contribution of carbon and nitrogen baselines while also indicating large trophic overlap among clupeid and scombrid species [18]. While FA analyses have been applied to small pelagic fishes in the Iberian Peninsula, most studies have focused on sardine alone or sardine–anchovy comparisons [10,19,20,21], with limited consideration of potential competitors such as mackerels. Therefore, the pronounced spatial variability in basal resources, together with the potential for high trophic overlap among small pelagic species, makes the North Iberian shelf an ideal system for evaluating the complementary value of dietary biomarkers to characterize diet plasticity and trophic dynamics.
This study investigates trophic dynamics in two clupeid (S. pilchardus and E. encrasicolus) and two scombrid (S. scombrus and S. colias) species across the North Iberian shelf using an integrated approach combining the analysis of stable isotopes in bulk muscle and in amino acids, along with FA characterization. The objective is to identify the baseline resources supporting these species and to enhance understanding of their trophic niche partitioning and dietary plasticity. In addition, we assess the influence of lipid class separation (neutral vs. total lipids) on dietary interpretation in sardine using the stable isotope composition of lipids and FA markers. The observed differences in isotopic composition and FA profiles among these species point to distinct feeding strategies between clupeids and scombrids. Furthermore, flexible feeding behavior in these species, particularly in sardine, which shows a greater capacity to switch between phytoplankton- and zooplankton-based diets depending on resource availability, results in increased within-species variability in both isotopic composition and FA profiles. Finally, a detailed analysis of lipid fractions in sardine underscores the need to examine both neutral and polar lipids, particularly when total lipid content is low, to more accurately distinguish the relative contributions of different primary sources based on FA profiles and biomarkers.

2. Material and Methods

2.1. Sample Collection and Processing

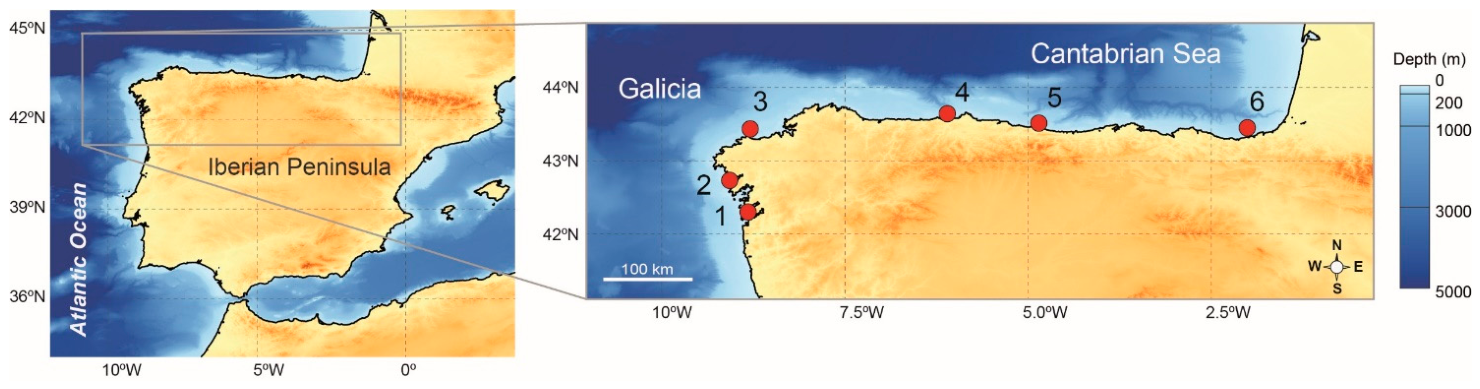
Four species of small pelagic fishes were sampled on the North Iberian shelf during the PELACUS0322 survey in April 2022 (Figure 1). Fishes were collected at multiple shelf sites across Galicia and the southern Bay of Biscay (Cantabrian Sea). Adult specimens of European sardine (Sardina pilchardus, hereafter ‘sardine’), European anchovy (Engraulis encrasicolus, ‘anchovy’), Atlantic mackerel (Scomber scombrus, ‘mackerel’), and Atlantic chub mackerel (S. colias, ‘chub mackerel’) were sampled during daylight hours at depths of 30–80 m using a midwater trawl with a 30 m2 opening and graded-mesh netting (30 to 4 mm). These species commonly form mixed shoals and are present year-round in the surveyed areas.
Fishes were identified, measured (total length, mm), weighed (wet weight, g), sexed, and assigned a maturity stage based on visual gonadal inspection (Supplementary Information Table S1). Individuals were randomly selected from each catch for analysis, with the number of females and males balanced to minimize potential sex-related effects on the results. All specimens were non-spawning (partial or full post-spawning stages). Portions of white dorsal muscle tissue were dissected onboard, frozen in liquid nitrogen for up to two weeks, and subsequently stored at −80 °C.

2.2. Stable Isotope Analysis

Fish samples were freeze-dried for 48 h and powdered prior to analysis. Carbon and nitrogen stable isotope abundances were measured in 1 mg (dry weight) of fish muscle tissue using a Thermo Scientific Flash Smart elemental analyzer coupled to a Thermo MAT 253 isotope ratio mass spectrometer via a Conflo IV interface (Thermo Fisher Scientific, Bremen, Germany). Carbon isotope ratios were expressed as δ13C (‰) relative to the Vienna PeeDee Belemnite standard, and nitrogen isotope ratios as δ15N (‰) relative to atmospheric N2. Isotope ratios and elemental content were determined using acetanilide and glycine standards calibrated to international reference materials.
Because lipids are typically depleted in 13C compared to proteins [22], bulk tissue δ13C values were corrected using a mass-balance approach (Equation (1)) that incorporates total carbon content of the bulk tissue (μg mg−1) and of the total lipid extract (TLE; μg mg−1), measured in separate aliquots (see Section 2.4, Fatty acid analysis), together with bulk δ13C and δ13CTLE values (Table S2):
c o r r e c t e d   δ 13 C = b u l k   δ 13 C       δ 13 C T L E   ×   T L E   C   c o n t e n t     T o t a l   C   c o n t e n t T o t a l   C   c o n t e n t     T L E   C   c o n t e n t   T o t a l   C   c o n t e n t
In addition to bulk tissue δ13C analysis, δ13C was analyzed in aliquots (10%) of total lipid extracts (δ13CTLE), as well as in neutral (δ13Cneutral) and polar (δ13Cpolar) lipid fractions from selected sardine samples (see Section 2.4), to evaluate the potential influence of lipid class on trophic interpretations. Neutral (storage) and polar (structural) lipids have been shown to differ in FA composition in other pelagic species [23] and may also exhibit distinct isotopic ratios. δ15N analysis of lipid extracts was not feasible due to low nitrogen content.
Analytical precision (SE) of replicate determinations for samples was 0.1‰ for δ13C and 0.4‰ for δ15N. These analyses were conducted at the Department of Ocean Sciences, University of Miami.
The δ15N values of individual amino acids (AAs) were determined following a modified version of McCarthy et al. [24]. Freeze-dried muscle tissue (10 mg) was hydrolyzed with 6 N HCl at 110 °C for 20 h. L-norleucine, an internal standard with known isotopic composition, was added to each sample prior to hydrolysis. The hydrolyzed extracts were filtered through 0.20 µm hydrophilic filters and dried under a gentle N2 stream at 60 °C. Esterification of the AAs was performed using 2.5 mL of 1:5 acetyl chloride:2-propanol at 110 °C for 60 min. After drying at room temperature under N2, the acylation step was carried out by adding 0.9 mL of 3:1 dichloromethane:trifluoroacetic anhydride (DCM:TFAA) at 110 °C for 15 min. Amino acids were then purified by solvent extraction using 3 mL of a 1:2 chloroform:phosphate buffer mixture (Na2HPO2 + NaH2PO2, pH 7.4). After centrifugation at 17,000× g for 10 min, the acyl derivatives in the chloroform phase were collected and evaporated under a N2 stream at room temperature. Purified samples were stored at −20 °C in 3:1 DCM:TFAA until analysis. Derivatized AAs were analyzed using gas chromatography-isotope ratio mass spectrometry (GC-IRMS) with a Thermo Scientific Trace 1310 gas chromatograph coupled, via a GC IsoLink II combustion interface, to a Thermo Scientific Delta V Advantage isotope ratio mass spectrometer (Thermo Fisher Scientific, Bremen, Germany). Individual AAs were separated on a TraceGOLD TG-5MS column (60 m × 0.32 mm ID × 1.0 μm film; Thermo Fisher Scientific, Waltham, MA, USA). δ15N values of individual AAs were calibrated against certified underivatized AA standards of known isotopic composition obtained from Shoko Science Co., Ltd. (Yokohama, Japan) and Sigma-Aldrich (St. Louis, MO, USA), which were analyzed by combustion following the same procedure used for bulk analysis.
Analyzed AAs included the trophic AAs alanine (Ala), aspartic acid + asparagine (Asx), glutamic acid + glutamine (Glx), isoleucine (Ile), leucine (Leu), proline (Pro), and valine (Val); source AAs glycine (Gly), lysine (Lys), phenylalanine (Phe), serine (Ser), and methionine (Met); and the metabolic AA threonine (Thr) [25]. Analytical precision (SE), based on two injections of each sample, was <1‰ for individual AAs. The weighted mean values for groups of trophic and source AAs were calculated using the analytical error associated with the determination of each AA [26]. Because some samples lacked data for Ser and Ile, these AAs were not included in the calculation of the weighted means. These analyses were conducted at the Servicio de Análisis Instrumental, Universidade da Coruña (Spain).

2.3. Estimation of Trophic Positions and Baseline Nutrient Sources

Trophic position (TP) for each species was estimated using the canonical approach [27] from δ15N values in Glx (δ15NGlx) and Phe (δ15NPhe) following Equation (2):
T P =   1 +   δ 15 N G l x     δ 15 N P h e     β   T D F
where β represents the isotopic offset between Glx and Phe at the base of the food web, and TDF is the trophic discrimination factor, accounting for the differential trophic enrichment between Glx and Phe. We used β = 3.6 ± 0.5‰ and TDF = 5.7 ± 0.3‰, values determined for marine teleosts [26].
Carbon and nitrogen sources utilized by primary producers of the food web were inferred from isotopic baselines in the fish samples. Corrected δ13C values were used to represent the carbon baseline, while the nitrogen baseline was estimated from δ15NPhe. Because there is a 0.4‰ increase in δ15NPhe with TP [27], the baseline was corrected using Equation (3) [9]:
δ 15 N P h e - b a s e l i n e =   δ 15 N P h e 0.4   T P 1

2.4. Fatty Acid Analysis

2.4.1. Total Lipid Extraction and Lipid Class Separation

Lipids were extracted from 30 mg dry muscle subsamples from each of the 33 fish using a modified Bligh and Dyer method [28]. Samples were stored overnight at −80 °C in dichloromethane (1 mL) to enhance extraction efficiency, then mixed with methanol (2 mL) and MilliQ water (0.8 mL), sonicated (10 min), vortexed, and subjected to phase separation with dichloromethane (1 mL) and saline solution (1 M NaCl in 3xDCM extracted-MilliQ water, 0.8 mL). The organic layer (lipid extract) was collected by pipetting after washing the aqueous phase three times with dichloromethane (1 mL), followed by shaking, vortexing, and centrifugation (2000× g, 5 min) to recover the remaining lipids. The TLE was dried under N2 and redissolved in dichloromethane (1 mL). The C content of the TLE was determined on a quantitative aliquot of each TLE via elemental analysis, as described above. Total lipid content in the fish muscle was then calculated as the proportion of lipid-extract carbon (TLE C content) relative to total sample carbon (bulk C content), with both measurements normalized to the dry weight analyzed.
Neutral and polar lipid fractions were further separated from aliquots of the TLE in a subset of seven sardine samples selected from across the study region. This approach allowed us to assess the effects of tissue total lipid content and the neutral-to-polar lipid ratio on dietary interpretation, and to identify a lipid content threshold above which lipid class separation may be unnecessary in trophodynamic studies of sardine. Lipid class separation was limited to sardine because it has the best-documented diet and FA composition among those studied, and because analytical constraints prevented its application to all species. Briefly, aliquots (50%, 0.5 mL) of the TLE were dried under N2 and fractionated into neutral and polar lipids using glass Pasteur pipette mini-columns packed in-house with 1 g of pre-combusted silica gel (100–200 mesh, 60 Å; Sigma-Aldrich, St. Louis, MO, USA) and solvents of varying polarity [29,30]. Columns were preconditioned with 1 mL hexane, neutral lipids eluted with 75% hexane/25% ethyl acetate (v/v) (2 × 0.9 mL), and polar lipids, including phospholipids and glycolipids, with 100% methanol (3 × 0.9 mL). Fractions were dried under N2 and redissolved in 0.5 mL of dichloromethane. Separation was validated with triacylglycerol (1,3-dipentadecanoyl-2-oleoyl-glycerol) and phospholipid (1,2-dinonadecanoyl-sn-glycero-3-phosphocholine) standards (Avanti Polar Lipids, Alabaster, AL, USA) and confirmed by GC-MS. Total recovery from the TLE after silica gel separation was 83 ± 0.1%, estimated by comparing the carbon quantities obtained from the lipid fractions and the TLE determined via elemental analysis.

2.4.2. Fatty Acid Transesterification

An internal standard (tridecanoic acid, 50 µL) was added to an aliquot of the TLE (0.4 mL), which was dried under N2 at room temperature, and FAs were transesterified to FA methyl esters (FAMEs) in a mixture of methanol (3.8 mL) and HCl (0.2 mL, i.e., 5% v/v) at 70 °C for 4 h. After cooling, hexane (6 mL) and saline water (1 M NaCl in 3xDCM extracted-MilliQ water, 6 mL) were added, the vial was shaken, vortexed, and chlorine gas was released. The organic layer containing FAMEs was recovered by pipetting, and the aqueous phase was re-extracted two times with hexane (6 mL) followed by shaking and vortexing, to collect remaining FAMEs. The extract was evaporated under N2 (40 °C) in a Turbovap (Biotage, LLC, Uppsala, Sweden) to a volume of ~0.5 mL, then transferred to a new vial, dried again, and finally redissolved in hexane (0.5 mL).
Individual FAMEs were analyzed using GC-MS (Agilent 6890N GC coupled to a 5973 MS; Agilent Technologies, Santa Clara, CA, USA) equipped with a DB-23 column (60 m × 250 µm × 0.15 µm; Agilent J&W, Santa Clara, CA, USA). An aliquot (1 μL), representing the extract from ~24 µg dry weight of sample on average, was injected at 230 °C in splitless mode (oven at 50 °C) with helium as the carrier gas. The temperature was raised to 185 °C at 35 °C min−1, then to 230 °C at 3 °C min−1, and held for 5 min. Quantification of FAMEs was based on comparison with known quantities of a commercial standard mix (Supelco 37-Component FAME Mix; Supelco, Bellefonte, PA, USA). FAME identification was confirmed by comparison with the NIST 2008 mass spectral library. Neutral and polar lipid fractions were also transesterified to FAMEs and quantified by GC-MS following the same methods. FA composition was expressed as relative proportions (mol %) or absolute concentrations (nmol mg−1 dry weight). The three major classes of FAs were considered: saturated (SFAs), monounsaturated (MUFAs), and polyunsaturated (PUFAs). All lipid extractions and FA analyses were performed at the Department of Ocean Sciences, University of Miami.

2.4.3. Fatty Acid Biomarkers

Fatty acid biomarkers, including individual FAs, FA ratios, or sums of selected FAs, expressed as relative proportions (mol %), were used to identify the primary dietary sources of the fishes. We focused on the FAs of importance in trophic studies for the interpretation of the variability observed in the fish diets [10,31,32,33]. We retained those biomarkers for three prey groups: diatoms, dinoflagellates, and zooplankton (mainly for copepods). We did not consider the contribution of macrozooplankton (e.g., euphausiids, decapods, etc.) to the diet of these species due to the lack of specific biomarkers for this prey range [21]. Diatom markers included 14:0, 16:1n−7, eicosapentaenoic acid (EPA, 20:5n−3), and the ratios 16:1n−7/16:0 and ΣC16/ΣC18 (ratio of C16 to C18 FAs), dinoflagellate markers included 18:1n−7, docosahexaenoic acid (DHA, 22:6n−3), Σn−3 PUFAs, and DHA/EPA, and zooplankton (lipid-rich calanoid copepods) indicators were the long-chain MUFAs 20:1 and 22:1, and the ratio 22:1n−11/20:1n−9. In addition, we evaluated the contribution of bacteria (15:0, 17:0, but also 14:0, 16:1n−7, and 18:1n−7) [32,34,35], and used 18:1n−9, the ratios 18:1n−9/18:1n−7, and DHA as indicators of carnivory (zooplanktivorous diet) in fishes [10,19,36].

2.5. Statistical Analysis

Normality and homoscedasticity of isotopic variables (including TP estimates) and FA concentrations (absolute and relative values) were assessed using Shapiro–Wilk and Levene’s tests, respectively. Since normality assumptions were not met, Kruskal–Wallis tests followed by Dunn’s post hoc comparisons were used to evaluate differences among species.
Spearman correlations were used to examine associations between isotopic variables and fish size and weight. Non-metric multidimensional scaling (nMDS) was applied to visualize differences across species based on the AA-δ15N patterns and FA relative abundances. The same analysis was also applied to compare the FA composition of neutral and polar lipid fractions with that of the TLE in sardine. Analyses of AA data were based on Euclidean distances, whereas FA data were analyzed using Bray–Curtis dissimilarity matrices calculated from Wisconsin-standardized proportional data [37]. Only FAs present at >1% relative abundance in more than one sample were included in the analysis. One-way permutational multivariate analyses of variance (PERMANOVA) tested interspecific differences, followed by multilevel pairwise comparisons when significant. Paired Wilcoxon signed-rank tests were used to evaluate differences in FA proportions and δ13C values among lipid fractions of sardine.
All analyses were conducted in R (v 4.4.1; [38]). Normality and homoscedasticity were checked using the R functions “shapiro.test( )” (package stats) [38] and “leveneTest( )” (car) [39], respectively. Kruskal–Wallis and Dunn’s post hoc tests were run with “kruskal.test( )” (stats) [38] and “dunn.test( )” (dunn.test) [40], respectively. Spearman correlations were calculated with “cor.test( )” (stats) [38]. nMDS analyses were carried out using the “metaMDS( )” function (vegan) [41] and visualized with ggplot2 [42]. PERMANOVA and pairwise tests were conducted using the “adonis2( )” and “pairwise.adonis( )” functions [41]. Wilcoxon tests were performed with the function “wilcox.test( )” (stats) [38]. p-values were adjusted using the Bonferroni correction for multiple comparisons.

3. Results

3.1. Bulk Stable Isotopes

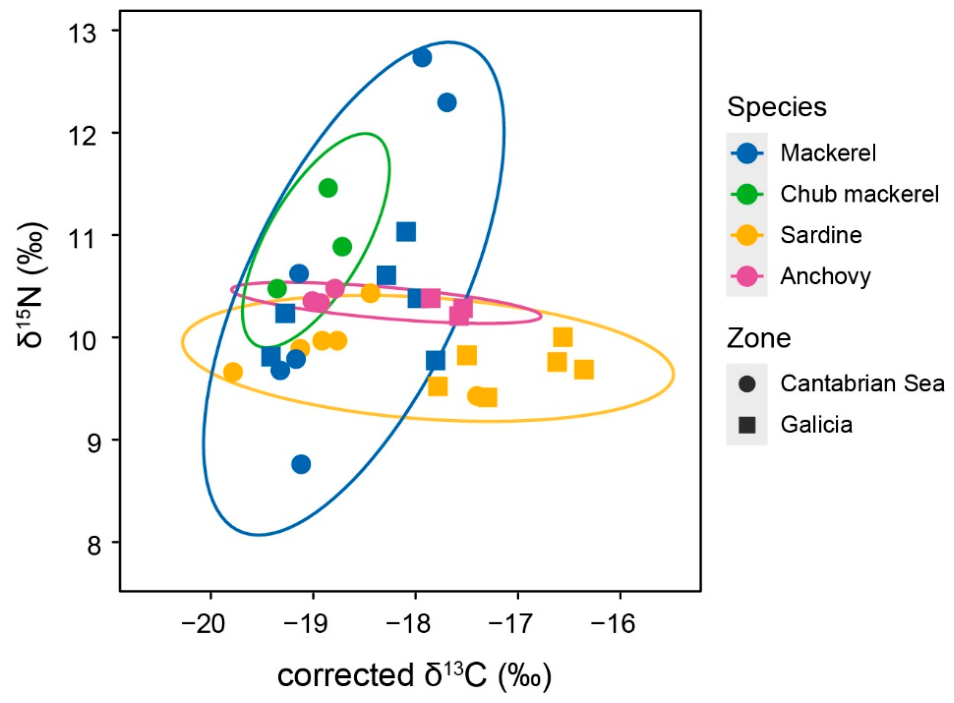
Corrected δ13C values showed no significant relationship with fish size, as they were not correlated with either length (Spearman’s rank correlation, ρ = −0.074, p = 0.684) or weight (ρ = −0.092, p = 0.612). Similarly, bulk δ15N values were not significantly correlated with length (ρ = 0.027, p = 0.881) or weight (ρ = 0.052, p = 0.773). Overall, corrected δ13C values ranged from −19.7‰ to −16.3‰, whereas bulk δ15N values ranged from 8.7‰ to 12.7‰ (Figure 2).
A biplot of bulk δ15N and δ13C values indicated a clear separation between clupeids (sardine and anchovy) and scombrids (mackerel and chub mackerel), despite a substantial degree of overlap (Figure 2). In particular, the isotopic ellipse of anchovy fully overlapped with that of sardine, while chub mackerel was largely nested within the mackerel ellipse. Clupeids showed more variability along the δ13C axis, while scombrids varied more along the δ15N axis. Mackerel displayed the highest bulk δ15N values (and the greatest variability), whereas sardine showed the lowest values. However, mean bulk δ15N values only differed significantly between sardine and each of the other species, while no significant differences were detected between species in corrected δ13C values (Table 1).

3.2. Amino Acid δ15N Values and Trophic Positions

There were no significant differences among species in mean δ15N values for source or trophic amino acids or δ15NPhe-baseline (Table 1). However, differences in mean TP were significant, particularly between mackerel (3.5) and sardine (2.8), with intermediate values for anchovy and chub mackerel. TP showed moderate but significant positive correlations with fish length (ρ = 0.461, p = 0.006) and weight (ρ = 0.466, p = 0.006), while δ15NPhe-baseline was correlated with neither length (ρ = −0.053, p = 0.770) nor weight (ρ = −0.037, p = 0.836).
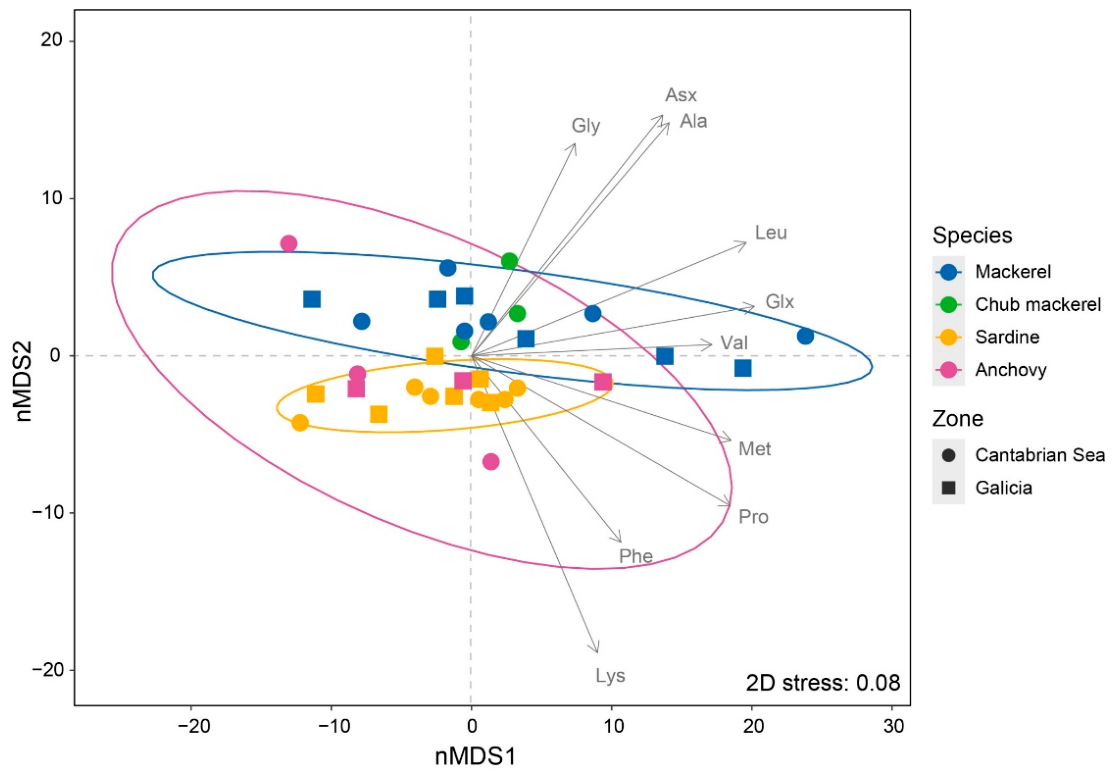
The nMDS analysis of AA-δ15N values revealed a clear separation between clupeids and scombrids (Figure 3). Within these groups, however, the ellipses for species largely overlapped (sardine with anchovy, and mackerel with chub mackerel). Group differences were significant (PERMANOVA; F3,29 = 2.872, p = 0.023), with pairwise tests indicating a significant difference only between sardine and mackerel (F1,22 = 6.315, p = 0.036). Vector overlays indicate that this separation is primarily driven by higher δ15N values of the trophic AAs Ala, Asx, Leu, Glx, and Val (as well as the source AA Gly) in scombrids, whereas clupeids exhibited higher δ15N values of the source AAs Phe and Lys and the trophic AAs Met and Pro.

3.3. Fatty Acid Profiles and Fatty Acid Biomarkers

The estimated total lipid content in fish ranged from 3 to 31% and was generally low (≤10% of dry weight), except in some sardine samples; however, no significant differences among species were detected (Table S3). Sardines also had the highest total FA content, with more variability than other species, but the species differences were not statistically significant (Table 1). Significant differences among species were observed for the relative contributions of SFAs and PUFAs, but not for MUFAs (Table 1, Table S3). However, the absolute concentrations of all three FA fractions did not differ among species (Table S3). SFA represented approximately 40% of total FAs in clupeids, while lower contributions (~30%) were observed in scombrids. Across all species, 16:0 was the dominant SFA, accounting for 21–30% of total FAs. MUFAs ranged from ~15% in anchovy to ~28% in mackerel, with 18:1n−9 being the most abundant MUFA (8–13%). PUFAs contributed roughly 35–50% of total FAs, largely driven by DHA (21–37%) and EPA (5–8%). Overall, Σn−3 PUFA abundances were 10 to 30 times higher than Σn−6 PUFAs.
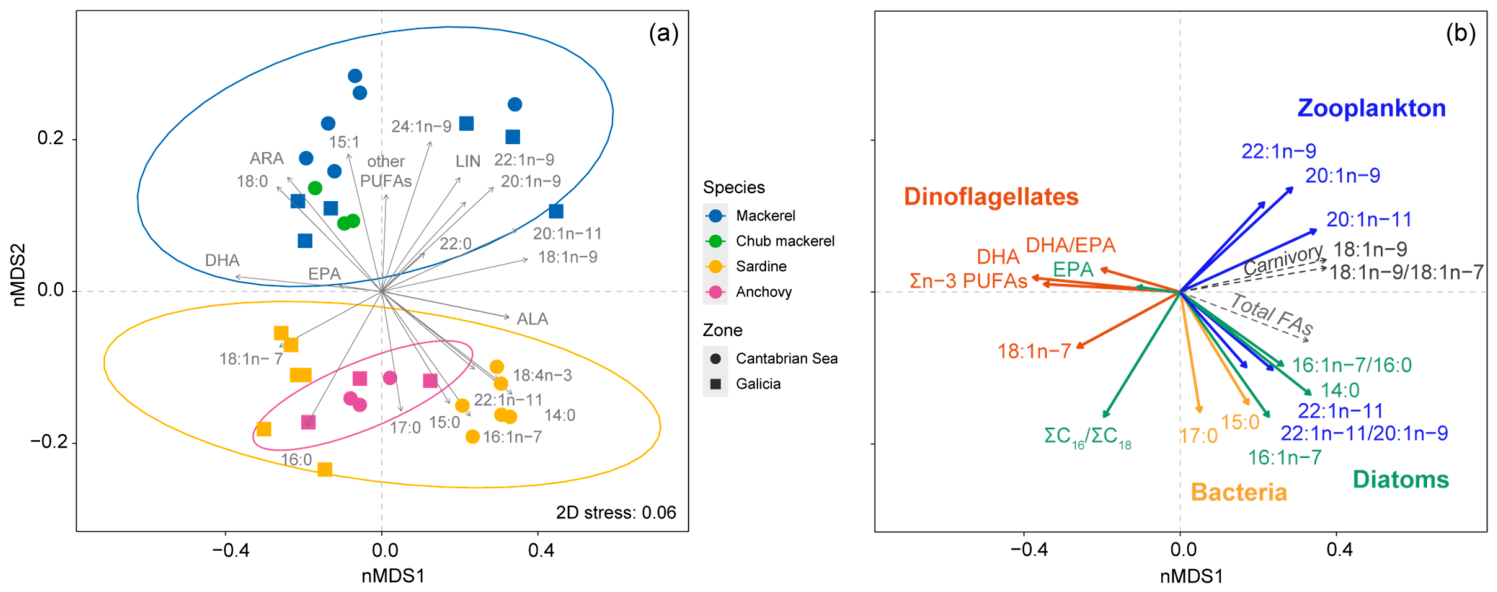
Non-metric multidimensional scaling revealed clear interspecific differences in FA composition (PERMANOVA: F3,32 = 1.865, p < 0.001), primarily separating clupeids and scombrids (Figure 4a). All pairwise comparisons between species were significant except between sardine and anchovy (F1,17 = 2.551, p > 0.05) and between mackerel and chub mackerel (F1,14 = 1.768, p > 0.05). Clupeids were more strongly associated with phytoplankton FA indicators, whereas scombrids showed stronger associations with zooplankton markers (Figure 4b; Table S3). Diatom indicators (e.g., 14:0, 16:1n−7, 16:1n−7/16:0, and ΣC16/ΣC18) were most abundant in sardine and, to a lesser extent, in anchovy (e.g., 14:0 and ΣC16/ΣC18). In contrast, dinoflagellate-related FAs (e.g., DHA and DHA/EPA) were relatively higher in chub mackerel and anchovy. Bacterial markers (15:0 and 17:0) reached their highest levels in sardine, particularly in samples from the Cantabrian Sea. Mackerel exhibited the highest contribution from zooplankton indicators (20:1 and 22:1) and elevated contributions from carnivory indicators (18:1n−9 and the 18:1n−9/18:1n−7 ratio); however, differences among species were not statistically significant. Among essential FAs, in addition to DHA, ARA differed between groups, with higher concentrations in scombrids than in clupeids.
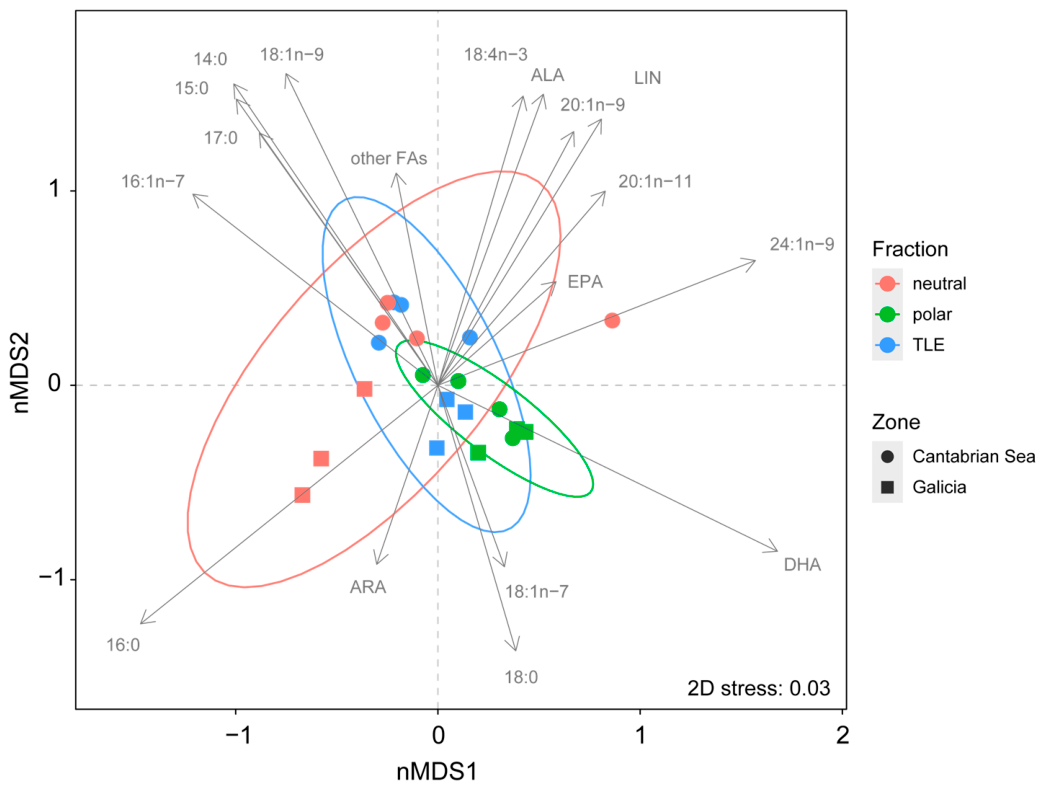
The lipid class analysis in sardine samples revealed a significant positive correlation between total lipid C and the neutral-to-polar lipid C ratio (r2adj. = 0.969, p < 0.001), indicating a predominance of neutral over polar lipids with increasing total lipid content. Comparison of FA profiles between the TLE and lipid fractions of sardine revealed a greater dispersion of neutral lipid samples, with this fraction better capturing the spatial variability associated with differences in total lipid content (Figure 5). In samples with more than 10% lipid content (e.g., those from the Cantabrian Sea), FA profiles were similar between the TLE and the lipid fractions, with particularly strong overlap between the TLE and the neutral lipids. In samples with lower lipid content (e.g., those from Galicia), the neutral lipid fraction was more distinct from both the TLE and the polar fraction. Overall, the FA profiles of sardine differed between neutral and polar lipid fractions (Figure 5, Figure S1). The most abundant FAs (~80% of total FAs) in both neutral and polar fractions were 16:0, DHA, 18:1n−9, and EPA. In the neutral fraction, 16:0 was dominant (~40%), whereas DHA was the most abundant FA (~37%) in the polar fraction. The neutral fraction contained significantly higher proportions of the diatom FA indicators 14:0 and 16:1n−7, as well as 15:0, than the polar fraction. Conversely, the polar fraction had significantly higher proportions of the dinoflagellate FA indicators 18:1n−7 and DHA, as well as 18:0, 24:1n−9, and ARA (Figure S1).
The comparative analysis of δ13C values across sardine lipid fractions showed that δ13CTLE values (−26.2 ± 1.2) were slightly higher than δ13Cneutral values (−26.9 ± 1.0), a difference that was statistically significant (paired Wilcoxon signed-rank exact test, V = 28, p = 0.016). δ13CTLE values were similar to δ13Cpolar values (−26.0 ± 1.3), with no significant difference observed (V = 3, p = 0.078). In turn, δ13Cneutral values were on average lower than δ13Cpolar values, a difference that was also statistically significant (V = 1, p = 0.031).

3.4. Relationships Between Isotopic and Fatty Acid Variables

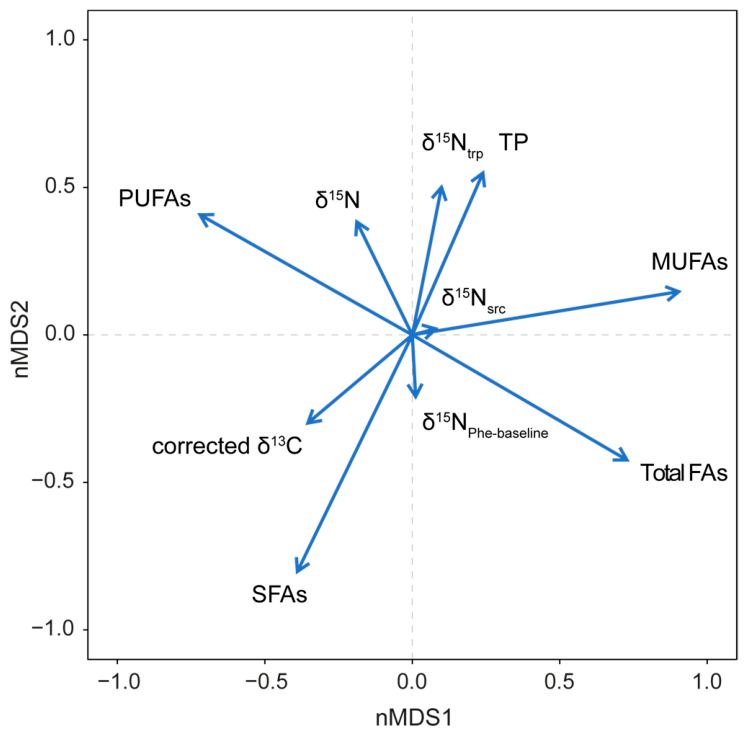
Corrected bulk δ13C values were correlated with FA composition, showing positive correlations with the mol % of SFAs and PUFAs and negative correlations with total FA content and mol % of MUFAs (Table S4). Interestingly, corrected δ13C values were not correlated with bulk δ15N or with indicators of nitrogen baseline sources (δ15Nsrc, δ15NPhe-baseline), and the latter were also not correlated with FA variables. However, isotopic variables related to trophic enrichment (TP, δ15Ntrp) were correlated with the mol % of SFAs (negatively). The projection of these variables on the first two axes of the nMDS on FA composition highlights the positive relationship between TP and the FA indicators of carnivory (e.g., 18:1n−9, 18:1n−9/18:1n−7), and conversely, the negative correlation with SFAs and diatom indicators (e.g., 14:0, 16:1n−7, and ΣC16/ΣC18) (Figure 6).

4. Discussion

Our results, comparing bulk and CSIA-AA isotopic variables with FA profiles, provide strong evidence of trophic niche partitioning among clupeid and scombrid species. This differentiation likely facilitates their ecological coexistence by reducing interspecific competition. Although these species often form mixed shoals, share feeding modes, and exploit similar habitats, dietary segregation remains a key mechanism enabling their co-occurrence, as widely documented among other sympatric fish species across trophic levels [35,43,44]. Previous studies using bulk stable isotopes and FA analyses have reported trophic differentiation among clupeids [11,36] or scombrids [45]. In contrast, our results reveal substantial overlap in isotopic and FA profiles among species within each group, with sardine and anchovy showing similar trophic signatures, as did mackerel and chub mackerel. These patterns suggest that species within each group share similar dietary strategies, whereas the two groups occupy distinct trophic niches. The absence of differences in carbon and nitrogen isotopic baselines indicates that all species likely rely on a common food web; however, differences in TP and FA composition suggest that clupeids and scombrids exploit different components within this food web.

4.1. Trophic Position and Nutrient Baselines

All four species studied belong to the general guild of opportunistic planktonic feeders [44], yet clear differences in TP emerged between taxonomic groups (Table 1). Scombrids exhibited higher TP values than clupeids, reflecting a larger proportion of animal prey in the former. This result is consistent with studies of gut contents for these species in the NE Atlantic. The diet of scombrids includes a variety of relatively large zooplankton prey (e.g., calanoid copepods, euphausiids, mysids, salps) and even small fish [16]. In contrast, clupeids primarily feed on small-sized zooplankton (e.g., calanoid copepods, cladocerans, appendicularians) and phytoplankton [16,46,47]. A higher TP of scombrids compared to clupeids is related to their individual size, as reflected in the significant correlations between TP or δ15Ntrp with individual length and weight found here. This is a consequence of the general size-structure of pelagic food webs, where there is a predictable increase in size between predators and prey [48,49]. In turn, the range of sizes considered in this study precludes any ontogenetic effect on TP within species as found when a large range of sizes was considered [14]. Otherwise, the ranking of species TP found in this study agrees with previous estimates with stable isotopes in the region, either using bulk values [14,50] or more recent estimates from CSIA-AA [18].
Fatty acid profiles also suggested the higher trophic-level feeding in scombrids compared to clupeids. Clupeids contained higher proportions of SFAs and FAs commonly associated with phytoplankton, particularly diatoms, but also with bacterial sources (e.g., 14:0, 16:1n−7, 18:1n−7), reflecting a direct or indirect contribution of lower trophic-level production. In contrast, mackerel exhibited greater proportions of long-chain MUFAs (i.e., 20:1, 22:1, 24:1), generally linked to zooplankton consumption, in particular the wax-ester-rich copepods of the genus Calanus [31,51], and carnivory indicators [10,19]. However, the high proportions of these long-chain MUFAs in mackerel could also reflect the consumption of prey such as euphausiids or small fish [16,17], which may have previously obtained these biomarkers by feeding on lipid-rich calanoid copepods. Even when we only analyzed a small number of chub mackerel individuals, they exhibited higher associations with dinoflagellate markers (e.g., DHA and Σn−3 PUFAs) and lower copepod and carnivory FA proportions than mackerel, suggesting lower trophic-level feeding and a greater reliance on alternative prey like mysids, as reported for this region [16].
Differences among species in isotopic indicators of the carbon and nitrogen baselines supporting the food web, including corrected δ13C, δ15Nsrc, and δ15NPhe-baseline values, were small, suggesting that all species shared the same food web across the study region. Although spatial variability was not a primary focus of our study due to limited sample sizes, lipid-corrected δ13C values in sardine suggested a potential difference in carbon baselines between Galicia and the Cantabrian Sea (Figure 2). Comparable intra-regional differences in isotopic baselines sustaining pelagic food webs have also been reported in studies conducted across broader spatial and temporal scales. For instance, Mondéjar et al. [18] found higher δ13C and lower δ15Nsrc values in sardines from Galicia compared with those from the Cantabrian Sea. Similarly, López-López et al. [52] identified a west–east gradient of decreasing δ13C values in demersal fishes, although no clear spatial pattern was observed for nitrogen isotopes in these organisms. These spatial differences have been mainly attributed to variability in nutrient inputs associated with the upwelling gradient along the northern Spanish coast [18,52], as well as to river discharges [50]. In Galicia, where upwelling conditions are more prevalent, phytoplankton communities are characterized by the dominance of rapidly growing taxa [53]. During rapid growth, larger phytoplankton cells such as diatoms show reduced isotopic fractionation between 12C and 13C, resulting in higher δ13C values of phytoplankton [54,55]. Conversely, low baseline δ15N values may arise from the preferential uptake of isotopically lighter nitrogen by rapidly growing phytoplankton, leading to lower phytoplankton δ15N values [56].

4.2. Isotopic vs. Fatty Acid Trophic Niche Characterization

The segregation between clupeid and scombrid trophic niches was evident across all three approaches used (bulk SIA, CSIA-AA, and FAs), with FA profiles providing the clearest distinction (Figure 4). Nevertheless, there was large overlap among the niches, particularly between species of the same order. This overlap has been widely reported in other studies and attributed to the similar trophic habits of these mainly planktivorous species [11,44]. Isotopic niches defined by bulk isotope analysis revealed differential patterns of trophic niche variability, with clupeids showing high δ13C variability but limited δ15N variation, whereas scombrids exhibited the opposite pattern. In addition, AA-δ15N provided a better separation of trophic vs. source (baseline) components. In our samples, there was not a clear nitrogen baseline differentiation among species or groups, but the trophic AAs separated mackerel (high TP) from sardine (low TP) (Table 1, Figure 3). An extended study incorporating samples from the survey in 2021 [18] allowed for the identification of different carbon and nitrogen baselines for Galicia and Cantabrian Sea zones, affecting sardine and chub mackerel but not anchovy or mackerel, and niche width computed from δ15Nsrc and δ15Ntrp revealed marked differences among species and between zones. The authors indicated that the isotopic variables would allow for a better definition of the species’ trophic niche width than those provided by considering only properties derived from prey analysis, as diversity [16] or bulk stable isotopes, as observed in the Bay of Biscay [57].
Even when most individuals sampled were in partial or post-spawning stages with low lipid content (3.4–18.5%), coinciding with their reproductive period [19,58], our results align with those of recent studies in planktivorous fish in other systems showing an improved niche separation using FA analyses [11]. While isotopic niches revealed large overlap in carbon resources among species, FA profiles not only clearly separated clupeids from scombrids but also identified finer-scale differences between species within each group. For instance, anchovy showed a narrower isotopic niche and lower FA variability than sardine (Figure 2 and Figure 4), although this difference may partly reflect the more limited spatial coverage of anchovy samples rather than intrinsic differences in dietary niche width. Sardines are more efficient filter feeders of small zooplankton and phytoplankton, while anchovies can capture prey (e.g., euphausiids or decapod larvae) of relatively large size [59]. These feeding differences likely facilitate resource partitioning by prey type and size. Our findings support such specialization, with sardine showing a large range of diatom and dinoflagellate FA indicators while anchovy was mainly associated with dinoflagellate FAs (Figure 4, Table S4). Similar differentiation was also noted for mackerel and chub mackerel (see Section 4.1). Our results further point to some spatial variability between sampling zones (Galicia vs. Cantabrian Sea), particularly regarding sardine fatty acid profiles (Figure 4), although the limited sample size prevented a clear distinction. This pattern highlights the need for additional research to better understand the trophic ecology of these species in the region, for instance, by examining whether the observed dietary plasticity is linked to spatial differences in nutrient availability or sources of organic matter.

4.3. Relevance of Using Different FA Fractions

In this study, FA profiles of TLE were used as dietary indicators for all species, and we further explored the methodological relevance of analyzing different lipid fractions in sardine. Neutral lipids, with limited metabolic modifications, are expected to reflect dietary variability more accurately than polar lipids, which are more tightly physiologically regulated and therefore less responsive to dietary change [20,21]. The FA composition of both neutral and polar lipid fractions found in our study was consistent with profiles reported for sardines from other areas, including the western Bay of Biscay [21], western and southern Portugal [19,20], and the Gulf of Lions in the Mediterranean [10]. Interestingly, we found that, when total lipid content exceeded 10% dry weight, neutral FAs dominated the TLE, indicating that total lipids can be reliably used for trophic studies without prior lipid class fractionation. In contrast, when lipid content was low (<10% dry weight), substantial differences emerged between FA profiles of the TLE and those of the neutral fraction, due to the increased relative contribution of polar lipids to the TLE. As neutral and polar fractions differ markedly in key dietary FA biomarkers, lipid class separation becomes advisable under low-lipid conditions. For example, the diatom biomarker 16:1n−7 showed higher relative proportions in the neutral fraction than in the polar fraction, with intermediate values in the TLE. Relying solely on neutral 16:1n−7 would therefore overestimate diatom consumption in sardine. Conversely, some long-chain PUFAs, such as DHA, are selectively incorporated into structural polar lipids in sardines [20]. In our study, DHA proportions were two to four times higher in the polar fraction than in the neutral fraction, while the TLE again showed intermediate values. This highlights the role of DHA as a major component of membrane phospholipids [31] and explains why using neutral DHA alone would underestimate the contribution of dinoflagellate-based diets.
We also detected marked δ13C differences among TLE, neutral, and polar lipids. This pattern arises from the distinctly lower δ13C values of neutral lipids compared with polar lipids, consistent with their physiological roles. In fish, neutral lipids act as energy reserves and are mobilized faster than polar lipids, especially post-spawning, leading to quicker integration of dietary isotopic signals [20]. These turnover differences may cause temporary δ13C mismatches between lipid fractions, as reflected in our results. An additional factor contributing to these isotopic differences is the distinct FA composition of neutral and polar lipid fractions. As explained above, the polar fraction was significantly enriched in DHA relative to the neutral fraction. Because DHA is the second most abundant FA in these lipid fractions after 16:0 (Figure S1) and has been shown to be relatively 13C-enriched compared with many other FA in aquatic organisms [60,61], its greater representation in polar lipids may partly explain their higher δ13C values. Such differences in the isotopic composition of individual FAs has been attributed, at least in part, to kinetic isotope effects associated with FA desaturation and chain elongation during biosynthesis. Moreover, polar lipids contain sugar- or amine-based headgroups, usually enriched in 13C relative to neutral lipid triacylglycerols [62], further explaining isotopic divergences between lipid classes when analyzed as intact molecules. Although more research is needed to assess whether these patterns hold across small pelagic fishes more generally, our findings emphasize the importance of analyzing the carbon isotope ratios of separate lipid fractions, particularly during periods of rapid dietary shifts such as growth, starvation, or enhanced food availability, to refine trophic assessments. Overall, the choice between using TLE or specific lipid fractions for trophic analyses should be guided by the research question and the FAs of interest. The lipid-content threshold above which lipid fractionation becomes unnecessary should be determined for each species and tissue type [23]. While TLE may be appropriate under high lipid conditions, the consideration of FA lipid fractions enables the separation of short vs. long-lasting effects of diet variability [20,21].

5. Conclusions

Despite the substantial trophic overlap typically expected among planktivorous fish, the combined use of bulk stable isotopes, amino acid-specific isotopic analyses, and fatty acid composition enabled a clear trophic differentiation between clupeids and scombrids on the North Iberian shelf. Bulk isotope data suggested a decoupling of carbon and nitrogen baselines among species exploiting the same food web. Compound-specific nitrogen isotopes further indicated differences in trophic position, particularly between mackerel and sardine. In addition, fatty acid profiles proved especially informative in resolving variations in prey composition not only between clupeids and scombrids but also within each group, revealing notable intraspecific variability, particularly in sardine. These patterns appear to reflect differing contributions of phytoplankton- and zooplankton-derived resources to the diets of each species and would also explain regional variability in sardine. Finally, the analysis of lipid fractions in sardine highlights the value of separating neutral and polar lipids in future studies, especially when total lipid content is low (<10% dry weight), as reliance on total lipid extracts alone may underestimate the contribution of certain primary production sources to the sardine diet.

Supplementary Materials

The following supporting information can be downloaded at https://www.mdpi.com/article/10.3390/oceans7040065/s1, Figure S1: Variation in the relative proportion (%, mean ± SD, n = 7) of the fatty acids most abundant in neutral and polar lipid fractions of sardine; Table S1: Descriptors of fish samples; Table S2: Mean (±SD) values of total carbon and nitrogen contents and C:N ratio in the bulk tissue, and carbon content and δ13C in the total lipid extract (δ13CTLE); Table S3: Fatty acid composition in fish total lipid extracts presented as relative (molar) percentages; Table S4: Spearman’s rank correlations (ρ) between isotopic and fatty acid variables for all pooled fish samples.

Author Contributions

R.G.-S.: Conceptualization, Methodology, Investigation, Formal analysis, Funding Acquisition, Visualization, Writing—Original Draft. I.G.V.: Investigation, Writing—Review and Editing. A.B.: Conceptualization, Methodology, Investigation, Formal analysis, Funding Acquisition, Resources, Writing—Review and Editing. H.G.C.: Methodology, Investigation, Formal analysis, Resources, Writing—Review and Editing. All authors have read and agreed to the published version of the manuscript.

Funding

This research was supported by MCIN/AEI/10.13039/501100011033 (Spain) through the QLOCKS (PID2020-115620RB-100) and MTL-FISH (PID2023-147149NB100) projects. R. García-Seoane received funding from a Juan de la Cierva-Formación postdoctoral grant (FJC2019-040921-I) from MCIN/AEI and the EU NextGeneration/PRTR programs, as well as from the Spanish Ministry of Science, Innovation and Universities through the José Castillejo mobility program (CAS21/00543). She is currently supported by the European Union’s Horizon Europe research and innovation program under a Marie Skłodowska-Curie Postdoctoral Fellowship 2023 (No 101150001-PelCon). I.G. Viana was supported by a Juan de la Cierva-Incorporación postdoctoral grant (IJC2019-040554-I) from MCIN/AEI.

Institutional Review Board Statement

Fish specimens used in this study were collected during the PELACUS0322 multidisciplinary survey, conducted by the Spanish Institute of Oceanography (IEO-CSIC) as part of the Spanish National Programme for the collection, management and use of fisheries data under the European Union Data Collection Framework (Regulation (EU) 2017/1004), supporting scientific advice for the Common Fisheries Policy. Fish sampling and handling followed the standardized protocols established for official fisheries monitoring surveys. Detailed fish sampling requirements and procedures are described in the Spain Work Plan for Data Collection in the Fisheries and Aquaculture Sectors (2022–2027) (Spanish Secretary-General for Fisheries). No animals were collected or handled specifically for the purposes of this study, and no additional experimental procedures involving live animals were performed.

Data Availability Statement

All data and metadata reported in this study are accessible via the PANGAEA repository: https://doi.pangaea.de/10.1594/PANGAEA.972845 and https://doi.pangaea.de/10.1594/PANGAEA.985234 (accessed on 15 June 2026).

Acknowledgments

We would like to thank the captain and crew of the R/V ‘Vizconde de Eza’ for their support during the PELACUS survey, which enabled the collection of samples for this study. PELACUS surveys (Spanish Institute of Oceanography, Spain) are co-funded by the European Union through the Data Collection Framework.

Conflicts of Interest

The authors declare no conflicts of interest.

References

  1. Hilborn, R.; Buratti, C.C.; Díaz Acuña, E.; Hively, D.; Kolding, J.; Kurota, H.; Baker, N.; Mace, P.M.; de Moor, C.L.; Muko, S.; et al. Recent trends in abundance and fishing pressure of agency-assessed small pelagic fish stocks. Fish Fish. 2022, 23, 1313–1331. [Google Scholar] [CrossRef] [Scilit]
  2. ICES. Joint ICES-PICES Working Group on Small Pelagic Fish (WGSPF). ICES Sci. Rep. 2024, 6, 40. [Google Scholar] [CrossRef]
  3. Biton-Porsmoguer, S.; Bou, R.; Lloret, E.; Alcaide, M.; Lloret, J. Fatty acid composition and parasitism of European sardine (Sardina pilchardus) and anchovy (Engraulis encrasicolus) populations in the northern Catalan Sea in the context of changing environmental conditions. Conserv. Physiol. 2020, 8, coaa121. [Google Scholar] [CrossRef] [Scilit] [PubMed]
  4. Gernez, M.; Savina-Rolland, M.; Gascuel, D.; Travers-Trolet, M. Body condition decline in Western European fishes. Mar. Environ. Res. 2025, 211, 107428. [Google Scholar] [CrossRef] [Scilit] [PubMed]
  5. Cabrero, Á.; González-Nuevo, G.; Gago, J.; Cabanas, J.M. Study of sardine (Sardina pilchardus) regime shifts in the Iberian Atlantic shelf waters. Fish. Oceanogr. 2019, 28, 305–316. [Google Scholar] [CrossRef] [Scilit]
  6. Brosset, P.; Le Bourg, B.; Costalago, D.; Banaru, D.; Van Beveren, E.; Bourdeix, J.H.; Fromentin, J.M.; Ménard, F.; Saraux, C. Linking small pelagic dietary shifts with ecosystem changes in the Gulf of Lions. Mar. Ecol. Prog. Ser. 2016, 554, 157–171. [Google Scholar] [CrossRef] [Scilit]
  7. Post, D.M. Using stable isotopes to estimate trophic position: Models, methods, and assumptions. Ecology 2002, 83, 703–718. [Google Scholar] [CrossRef]
  8. McMahon, K.W.; McCarthy, M.D. Embracing variability in amino acid δ15N fractionation: Mechanisms, implications, and applications for trophic ecology. Ecosphere 2016, 7, e01511. [Google Scholar] [CrossRef] [Scilit]
  9. Xing, D.; Choi, B.; Takizawa, Y.; Fan, R.; Sugaya, S.; Tuchiya, M.; Ohkouchi, N.; Chikaraishi, Y. Trophic hierarchy of coastal marine fish communities viewed via compound-specific isotopic analysis of amino acids. Mar. Ecol. Prog. Ser. 2020, 652, 137–144. [Google Scholar] [CrossRef] [Scilit]
  10. Pethybridge, H.; Bodin, N.; Arsenault-Pernet, E.J.; Bourdeix, J.H.; Brisset, B.; Bigot, J.L.; Roos, D.; Peter, M. Temporal and inter-specific variations in forage fish feeding conditions in the NW Mediterranean: Lipid content and fatty acid compositional changes. Mar. Ecol. Prog. Ser. 2014, 512, 39–54. [Google Scholar] [CrossRef] [Scilit]
  11. Sardenne, F.; van der Lingen, C.D.; Vagner, M.; Geja, Y.; Puccinelli, E.; Mathieu-Resuge, M.; Le Grand, F.; Munaron, J.M.; Buscaglia, M.; Serre, S.; et al. Resource partitioning among small pelagic fish remains stable regardless of food availability in a seasonally pulsed upwelling system. Prog. Oceanogr. 2026, 242, 103678. [Google Scholar] [CrossRef] [Scilit]
  12. Solari, A.P.; Santamaría, M.T.G.; Borges, M.F.; Santos, A.M.P.; Mendes, H.; Balguerías, E.; Díaz Cordero, J.A.; Castro, J.J.; Bas, C. On the dynamics of Sardina pilchardus: Orbits of stability and environmental forcing. ICES J. Mar. Sci. 2010, 67, 1565–1573. [Google Scholar] [CrossRef] [Scilit]
  13. Santos, M.B.; González-Quirós, R.; Riveiro, I.; Iglesias, M.; Louzao, M.; Pierce, G.J. Characterization of the pelagic fish community of the north-western and northern Spanish shelf waters. J. Fish Biol. 2013, 83, 716–738. [Google Scholar] [CrossRef] [Scilit] [PubMed]
  14. Bode, A.; Alvarez-Ossorio, M.T.; Cunha, M.E.; Garrido, S.; Peleteiro, J.B.; Porteiro, C.; Valdés, L.; Varela, M. Stable nitrogen isotope studies of the pelagic food web on the Atlantic shelf of the Iberian Peninsula. Prog. Oceanogr. 2007, 74, 115–131. [Google Scholar] [CrossRef] [Scilit]
  15. Carrera, P.; Porteiro, C. Stock dynamic of the Iberian sardine (Sardina pilchardus, W.) and its implication on the fishery off Galicia (NW Spain). Sci. Mar. 2003, 67, 245–258. [Google Scholar] [CrossRef] [Scilit]
  16. Bachiller, E.; Irigoien, X. Trophodynamics and diet overlap of small pelagic fish species in the Bay of Biscay. Mar. Ecol. Prog. Ser. 2015, 534, 179–198. [Google Scholar] [CrossRef] [Scilit]
  17. Iglesias, B.; Louzao, M.; Bachiller, E.; López-López, L.; Santos, M.; Boyra, G.; Andonegi, E.; Cotano, U.; Preciado, I. Influence of seasonal variability on the trophic structure of pelagic communities. Front. Mar. Sci. 2023, 10, 1185376. [Google Scholar] [CrossRef] [Scilit]
  18. Mondéjar, N.; Viana, I.G.; García Seoane, R.; Otero, J.; Bode, A. Trophic niche characterization of zooplankton and planktivorous fish: A comparative approach using stable isotopes in bulk and amino acid samples. Front. Mar. Sci. 2026, 12, 1718402, Correction in Front. Mar. Sci. 2026, 13, 1799156. https://doi.org/10.3389/fmars.2026.1799156. [Google Scholar] [CrossRef] [Scilit]
  19. Garrido, S.; Rosa, R.; Ben-Hamadou, R.; Cunha, M.E.; Chícharo, M.A.; van der Lingen, C.D. Spatio-temporal variability in fatty acid trophic biomarkers in stomach contents and muscle of Iberian sardine (Sardina pilchardus) and its relationship with spawning. Mar. Biol. 2008, 154, 1053–1065. [Google Scholar] [CrossRef] [Scilit]
  20. Bandarra, N.M.; Marçalo, A.; Cordeiro, A.R.; Pousao-Ferreira, P. Sardine (Sardina pilchardus) lipid composition: Does it change after one year in captivity? Food Chem. 2018, 244, 408–413. [Google Scholar] [CrossRef] [Scilit] [PubMed]
  21. Bertrand, M.; Brosset, P.; Soudant, P.; Lebigre, C. Spatial and ontogenetic variations in sardine feeding conditions in the Bay of Biscay through fatty acid composition. Mar. Environ. Res. 2022, 173, 105514. [Google Scholar] [CrossRef] [Scilit] [PubMed]
  22. Sweeting, C.J.; Polunin, N.V.C.; Jennings, S. Effects of chemical lipid extraction and arithmetic lipid correction on stable isotope ratios of fish tissues. Rapid Commun. Mass Spectrom. 2006, 20, 595–601. [Google Scholar] [CrossRef] [Scilit] [PubMed]
  23. Sardenne, F.; Bodin, N.; Latour, J.C.T.; McKindsey, C.W. Influence of lipid separation on the trophic interpretation of fatty acids. Food Webs 2020, 24, e00146. [Google Scholar] [CrossRef] [Scilit]
  24. McCarthy, M.D.; Benner, R.; Lee, C.; Fogel, M.L. Amino acid nitrogen isotopic fractionation patterns as indicators of heterotrophy in plankton, particulate, and dissolved organic matter. Geochim. Cosmochim. Acta 2007, 71, 4727–4744. [Google Scholar] [CrossRef] [Scilit]
  25. Ohkouchi, N.; Chikaraishi, Y.; Close, H.G.; Fry, B.; Larsen, T.; Madigan, D.J.; McCarthy, M.D.; McMahon, K.W.; Nagata, T.; Naito, Y.I.; et al. Advances in the application of amino acid nitrogen isotopic analysis in ecological and biogeochemical studies. Org. Geochem. 2017, 113, 150–174. [Google Scholar] [CrossRef] [Scilit]
  26. Bradley, C.J.; Wallsgrove, N.J.; Choy, C.A.; Drazen, J.C.; Hetherington, E.D.; Hoen, D.K.; Popp, B.N. Trophic position estimates of marine teleosts using amino acid compound-specific isotopic analysis. Limnol. Oceanogr. Methods 2015, 13, 476–493. [Google Scholar] [CrossRef] [Scilit]
  27. Chikaraishi, Y.; Ogawa, N.O.; Kashiyama, Y.; Takano, Y.; Suga, H.; Tomitani, A.; Miyashita, H.; Kitazato, H.; Ohkouchi, N. Determination of aquatic food-web structure based on compound-specific nitrogen isotopic composition of amino acids. Limnol. Oceanogr. Methods 2009, 7, 740–750. [Google Scholar] [CrossRef] [Scilit]
  28. Bligh, E.G.; Dyer, W.J. A rapid method of total lipid extraction and purification. Can. J. Biochem. Physiol. 1959, 37, 911–917. [Google Scholar] [CrossRef] [Scilit] [PubMed]
  29. Bastow, T.P.; van Aarssen, B.G.K.; Lang, D. Rapid small-scale separation of saturate, aromatic and polar components in petroleum. Org. Geochem. 2007, 38, 1235–1250. [Google Scholar] [CrossRef] [Scilit]
  30. Close, H.G.; Wakeham, S.G.; Pearson, A. Lipid and 13C signatures of submicron and suspended particulate organic matter in the Eastern Tropical North Pacific: Implications for the contribution of Bacteria. Deep Sea Res. Part I Oceanogr. Res. Pap. 2014, 85, 15–34. [Google Scholar] [CrossRef] [Scilit]
  31. Dalsgaard, J.; St. John, M.; Kattner, G.; Müller-Navarra, D.; Hagen, W. Fatty acid trophic markers in the pelagic marine environment. Adv. Mar. Biol. 2003, 46, 225–340. [Google Scholar] [CrossRef] [Scilit] [PubMed]
  32. Kelly, J.R.; Scheibling, R.E. Fatty acids as dietary tracers in benthic food webs. Mar. Ecol. Prog. Ser. 2012, 446, 1–22. [Google Scholar] [CrossRef] [Scilit]
  33. Maar, K.; Papadimitraki, M.; Ruiz, L.H.; Broughton, R.; Jónasdóttir, S.H. Lipids in meso- and bathypelagic fishes from the North Atlantic Ocean: Dietary inputs suggested from fatty acid trophic markers. Mar. Ecol. Prog. Ser. 2023, 717, 127–141. [Google Scholar] [CrossRef] [Scilit]
  34. Perry, G.J.; Volkman, J.K.; Johns, R.B.; Bavor, H.J. Fatty acids of bacterial origin in contemporary marine sediments. Geochim. Cosmochim. Acta 1979, 43, 1715–1725. [Google Scholar] [CrossRef] [Scilit]
  35. García-Seoane, R.; White, W.L.; Taylor, B.M.; Clements, K.D. Characterizing the trophic ecology of herbivorous coral reef fishes using stable isotope and fatty acid biomarkers. PLoS ONE 2025, 20, e0327594. [Google Scholar] [CrossRef] [Scilit] [PubMed]
  36. Wan, R.; Wu, Y.; Huang, L.; Zhang, J.; Gao, L.; Wang, N. Fatty acids and stable isotopes of a marine ecosystem: Study on the Japanese anchovy (Engraulis japonicus) food web in the Yellow Sea. Deep Sea Res. Part II Top. Stud. Oceanogr. 2010, 57, 1047–1057. [Google Scholar] [CrossRef] [Scilit]
  37. Couturier, L.I.E.; Michel, L.N.; Amaro, T.; Budge, S.M.; da Costa, E.; De Troch, M.; Di Dato, V.; Fink, P.; Giraldo, C.; Le Grand, F.; et al. State of art and best practices for fatty acid analysis in aquatic sciences. ICES J. Mar. Sci. 2020, 77, 2375–2395. [Google Scholar] [CrossRef] [Scilit]
  38. R Core Team. R: A Language and Environment for Statistical Computing; R Foundation for Statistical Computing: Vienna, Austria, 2024; Available online: https://www.R-project.org/ (accessed on 2 April 2026).
  39. Fox, J.; Weisberg, S. An R Companion to Applied Regression, 3rd ed.; Sage: Thousand Oaks, CA, USA, 2019. [Google Scholar]
  40. Dinno, A. dunn.test: Dunn’s Test of Multiple Comparisons Using Rank Sums, Version 1.3.6; CRAN: Vienna, Austria, 2024. [CrossRef] [Scilit]
  41. Oksanen, J.; Simpson, G.L.; Blanchet, F.G.; Kindt, R.; Legendre, P.; Minchin, P.R.; O’Hara, R.B.; Solymos, P.; Stevens, M.H.H.; Szoecs, E.; et al. vegan: Community Ecology Package, Version 2.7-1; CRAN: Vienna, Austria, 2025. Available online: https://CRAN.R-project.org/package=vegan (accessed on 22 May 2026).
  42. Wickham, H. ggplot2: Elegant Graphics for Data Analysis; Springer: New York, NY, USA, 2016; Available online: https://ggplot2.tidyverse.org (accessed on 26 February 2026).
  43. Ross, S.T. Resource partitioning in fish assemblages: A review of field studies. Copeia 1986, 1986, 352–388. [Google Scholar] [CrossRef] [Scilit] [PubMed]
  44. Ceia, F.R.; Cherel, Y.; Silva, A.V.; Garrido, S.; Angelico, M.M.; da Silva, J.M.; Laranjeiro, M.I.; Ramos, J.A. Drivers of niche partitioning in a community of mid-trophic level epipelagic species in the North Atlantic. Hydrobiologia 2023, 850, 1583–1599. [Google Scholar] [CrossRef] [Scilit]
  45. Chen, Y.; Hu, G.; Zhao, Z.; Chen, X.; Liu, B. Feeding habits of Scomber japonicus inferred by stable isotope and fatty acid analyses. J. Mar. Sci. Eng. 2024, 12, 1335. [Google Scholar] [CrossRef] [Scilit]
  46. Garrido, S.; Ben-Hamadou, R.; Oliveira, P.B.; Cunha, M.E.; Chícharo, M.A.; van der Lingen, C.D. Diet and feeding intensity of sardine Sardina pilchardus: Correlation with satellite-derived chlorophyll data. Mar. Ecol. Prog. Ser. 2008, 354, 245–256. [Google Scholar] [CrossRef] [Scilit]
  47. Costalago, D.; Garrido, S.; Palomera, I. Comparison of the feeding apparatus and diet of European sardines Sardina pilchardus of Atlantic and Mediterranean waters: Ecological implications. J. Fish Biol. 2015, 86, 1348–1362. [Google Scholar] [CrossRef] [Scilit] [PubMed]
  48. Jennings, S.; Pinnegar, J.K.; Polunin, N.V.C.; Boon, T.W. Weak cross-species relationships between body size and trophic level belie powerful size-based trophic structuring in fish communities. J. Anim. Ecol. 2001, 70, 934–944. [Google Scholar] [CrossRef] [Scilit]
  49. Reum, J.C.P.; Jennings, S.; Hunsicker, M.E. Implications of scaled δ15N fractionation for community predator-prey body mass ratio estimates in size-structured food webs. J. Anim. Ecol. 2015, 84, 1618–1627. [Google Scholar] [CrossRef] [Scilit] [PubMed]
  50. Chouvelon, T.; Spitz, J.; Caurant, F.; Mèndez-Fernandez, P.; Chappuis, A.; Laugier, F.; Le Goff, E.; Bustamante, P. Re-visiting the use of δ15N in meso-scale studies of marine food webs by considering spatio-temporal variations in stable isotopic signatures—The case of an open ecosystem: The Bay of Biscay (North-East Atlantic). Prog. Oceanogr. 2012, 101, 92–105. [Google Scholar] [CrossRef] [Scilit]
  51. Stowasser, G.; Pond, D.W.; Collins, M.A. Fatty acid trophic markers elucidate resource partitioning within the demersal fish community of South Georgia and Shag Rocks (Southern Ocean). Mar. Biol. 2012, 159, 2299–2310. [Google Scholar] [CrossRef] [Scilit]
  52. López-López, L.; Preciado, I.; Muñoz, I.; Décima, M.; Molinero, J.C.; Tel, E. Does upwelling intensity influence feeding habits and trophic position of planktivorous fish? Deep Sea Res. Part I Oceanogr. Res. Pap. 2017, 122, 29–40. [Google Scholar] [CrossRef] [Scilit]
  53. Casas, B.; Varela, M.; Bode, A. Seasonal succession of phytoplankton species on the coast of A Coruña (Galicia, northwest Spain). Bol. Inst. Esp. Oceanogr. 1999, 15, 413–429. [Google Scholar]
  54. Fry, B.; Wainright, S.C. Diatom sources of 13C-rich carbon in marine food webs. Mar. Ecol. Prog. Ser. 1991, 76, 149–157. [Google Scholar] [CrossRef] [Scilit]
  55. Popp, B.N.; Laws, E.A.; Bidigare, R.R.; Dore, J.E.; Hanson, K.L.; Wakeham, S.G. Effect of phytoplankton cell geometry on carbon isotopic fractionation. Geochim. Cosmochim. Acta 1998, 62, 69–77. [Google Scholar] [CrossRef] [Scilit]
  56. Puccinelli, E.; Fawcett, S.E.; Flynn, R.F.; Burger, J.M.; Delebecq, G.; Duquesne, N.; Lambert, C.; Little, H.; Pecquerie, L.; Sardenne, F.; et al. Are upwelling systems an underestimated source of long chain Omega-3 in the ocean? The case of the Southern Benguela Upwelling System. J. Geophys. Res. Biogeosci. 2023, 128, e2023JG007528. [Google Scholar] [CrossRef] [Scilit]
  57. Chouvelon, T.; Chappuis, A.; Bustamante, P.; Lefebvre, S.; Mornet, F.; Guillou, G.; Violamer, L.; Dupuy, C. Trophic ecology of European sardine Sardina pilchardus and European anchovy Engraulis encrasicolus in the Bay of Biscay (North-East Atlantic) inferred from δ13C and δ15N values of fishes and identified mesozooplanktonic organisms. J. Sea Res. 2014, 85, 277–291. [Google Scholar] [CrossRef] [Scilit]
  58. Ibaibarriaga, L.; Irigoien, X.; Santos, M.; Motos, L.; Fives, J.M.; Franco, C.; Lago de Lanzós, A.; Acevedo, S.; Bernal, M.; Bez, N.; et al. Egg and larval distributions of seven fish species in north-east Atlantic waters. Fish. Oceanogr. 2007, 16, 284–293. [Google Scholar] [CrossRef] [Scilit]
  59. Garrido, S.; van der Lingen, C.D. Feeding biology and ecology. In Ecology of Sardines and Anchovies; Ganias, K., Ed.; CRC Press: Boca Raton, FL, USA, 2014; pp. 122–189. [Google Scholar]
  60. Bec, A.; Perga, M.E.; Koussoroplis, A.; Bardoux, G.; Desvilettes, C.; Bourdier, G.; Mariotti, A. Assessing the reliability of fatty acid-specific stable isotope analysis for trophic studies. Methods Ecol. Evol. 2011, 2, 651–659. [Google Scholar] [CrossRef] [Scilit]
  61. Gladyshev, M.I.; Sushchik, N.N.; Kalachova, G.S.; Makhutova, O.N. Stable isotope composition of fatty acids in organisms of different trophic levels in the Yenisei River. PLoS ONE 2012, 7, e34059. [Google Scholar] [CrossRef] [Scilit] [PubMed]
  62. Hayes, J.M. Fractionation of carbon and hydrogen isotopes in biosynthetic processes. Rev. Mineral. Geochem. 2001, 43, 225–278. [Google Scholar] [CrossRef] [Scilit]
Figure 1. Bathymetry map illustrating the fish sampling sites in the North Iberian shelf. Bathymetry (depth, m) is represented by a blue–tan color scale. Sites 1–3 correspond to Galicia, the western sector of the study area characterized by the strongest influence of coastal upwelling, whereas sites 4–6 correspond to the Cantabrian Sea. Detailed information on the capture locations and species descriptors is provided in Supplementary Information Table S1. Map source: General Bathymetric Chart of the Oceans (https://www.gebco.net/).
Oceans 07 00065 g001
Figure 2. Biplot of corrected bulk δ13C and δ15N values (‰). Ellipses represent the 95% confidence intervals.
Oceans 07 00065 g002
Figure 3. Non-metric multidimensional scaling (nMDS) of amino acid δ15N values (‰). Vectors represent the direction of increase and the magnitude (vector length) of variables in the nMDS ordination. Ser and Ile were excluded from this analysis because data for these amino acids were missing in some samples. Amino acid abbreviations are provided in Section 2.2. Ellipses represent the 95% confidence intervals.
Oceans 07 00065 g003
Figure 4. (a) Non-metric multidimensional scaling (nMDS) of fatty acid (FA) composition. (b) Vector plot of FA biomarkers, including additional biomarkers (i.e., FA ratios and sums), associated with diatoms (green): 14:0, 16:1n−7, EPA, 16:1n−7/16:0 and ΣC16/ΣC18; dinoflagellates (red): 18:1n−7, DHA, Σn−3 PUFAs, and DHA/EPA; zooplankton (blue): 20:1n−9, 20:1n−11, 22:1n−9, 22:1n−11, and 22:1n−11/20:1n−9; bacteria (orange): 15:0 and 17:0; and carnivory (black): 18:1n−9, the ratios 18:1n−9/18:1n−7. In a, vectors represent the direction of increase and the magnitude (vector length) of variables in the nMDS ordination. Ellipses show 95% confidence intervals. In b, note that DHA can also serve as an indicator of carnivory, and 14:0, 16:1n−7, and 18:1n−7 as indicators of bacterial contribution. Correlation with total FA content is also shown. ΣC16/ΣC18 = ratio of C16 to C18 FA; Σn−3 PUFAs = sum of n−3 polyunsaturated FAs. Other FA abbreviations are included in Supplementary Information Table S3.
Oceans 07 00065 g004
Figure 5. Non-metric multidimensional scaling (nMDS) ordination of fatty acid (FA) composition in neutral, polar, and total lipid fractions of sardine. The ellipses represent the 95% confidence intervals for each group. Vectors indicate the direction (increase) and magnitude (length) of the variables. FA abbreviations are listed in Supplementary Information Table S3. Only FAs common to all lipid fractions were included in this analysis. TLE: total lipid extract.
Oceans 07 00065 g005
Figure 6. Correlations of isotopic and fatty acid (FA) variables with the first two axes of the nMDS ordination (Figure 4) based on the FA composition for all pooled fish samples. Variable abbreviations are listed in Table 1.
Oceans 07 00065 g006
Table 1. Mean (±SD) values of isotopic and fatty acid variables by fish species: corrected δ13C: lipid-corrected bulk δ13C; δ15N: bulk δ15N; δ15Nsrc: weighted mean δ15N in source amino acids; δ15Ntrp: weighted mean δ15N in trophic amino acids; TP: trophic position; δ15NPhe-baseline: nitrogen baseline; Total FAs, SFAs, MUFAs, PUFAs: total, saturated, monounsaturated, and polyunsaturated fatty acids, respectively. Percentage of SFAs, MUFAs, and PUFAs refers to molar contribution to summed fatty acids (mol %). n: number of samples. p: significance of differences among species (Kruskal–Wallis test). Different letters indicate significant differences between species (Dunn’s post hoc test, p ≤ 0.05).
SardineAnchovyMackerelChub Mackerelp
n126123
corrected δ13C (‰)−18.7 ± 1.5−18.7 ± 0.7 −19.1 ± 0.7 −19.3 ± 0.3 0.770
δ15N (‰)9.8 ± 0.3 b10.3 ± 0.1 a10.5 ± 1.1 a10.9 ± 0.5 a0.009
δ15Nsrc (‰)2.1 ± 0.71.8 ± 0.42.2 ± 0.73.0 ± 0.40.070
δ15Ntrp (‰)14.1 ± 1.214.7 ± 2.615.8 ± 2.915.0 ± 0.40.315
TP2.8 ± 0.4 b2.9 ± 0.5 a,b3.5 ± 0.5 a3.3 ± 0.7 a,b0.021
δ15NPhe-baseline (‰)8.8 ± 1.97.9 ± 3.57.0 ± 2.89.4 ± 2.00.225
Total FAs (nmol mg−1)124.56 ± 91.8382.09 ± 40.6681.58 ± 38.3459.06 ± 10.920.841
SFAs (%)41.54 ± 5.68 a38.34 ± 1.89 a31.01 ± 3.15 b33.00 ± 0.72 b0.000
MUFAs (%)22.22 ± 11.2115.07 ± 6.7927.90 ± 13.8616.86 ± 2.380.113
PUFAs (%)36.25 ± 9.71 b46.59 ± 5.83 a41.09 ± 11.41 a50.15 ± 1.68 a0.037
Disclaimer/Publisher’s Note: The statements, opinions and data contained in all publications are solely those of the individual author(s) and contributor(s) and not of MDPI and/or the editor(s). MDPI and/or the editor(s) disclaim responsibility for any injury to people or property resulting from any ideas, methods, instructions or products referred to in the content.