Article

The Condition of Four Coral Reefs in Timor-Leste before and after the 2016–2017 Marine Heatwave

1
ARC Centre of Excellence for Coral Reef Studies, School of Biological Sciences, The University of Queensland, Brisbane, QLD 4072, Australia
2
Remote Sensing Research Center, The University of Queensland, Brisbane, QLD 4072, Australia
*
Author to whom correspondence should be addressed.
Oceans 2022, 3(2), 147-171; https://doi.org/10.3390/oceans3020012
Submission received: 30 October 2020 / Revised: 23 February 2022 / Accepted: 7 March 2022 / Published: 8 April 2022

Abstract

:
El Niño Southern Oscillation global coral bleaching events are increasing in frequency, yet the severity of mass coral bleaching is not geographically uniform. Based in Timor-Leste, the present project had two major objectives: (1) assess the baseline of reefs and coral health at four sites and (2) explore water quality and climate-related changes in ocean temperatures on these understudied reef systems. The impacts of climate change were surveyed on coral reefs before and after the 2016–2017 global underwater heatwave, (principally by following coral mortality). Temperature loggers were also deployed between surveys, which were compared to Coral Reef Watch (CRW) experimental virtual station sea surface temperature (SST). CRW is an important and widely used tool; however, we found that the remotely sensed SST was significantly warmer (>1 °C) than in situ temperature during the austral summer accruing 5.79-degree heating weeks. In situ temperature showed no accumulation. There were significant differences in coral cover, coral diversity, and nutrient concentrations between sites and depths, as well as a low prevalence of disease recorded in both years. Change in coral cover between surveys was attributed to reef heterogeneity from natural sources and localized anthropogenic impacts. Timor-Leste has both pristine and impacted reefs where coral cover and community composition varied significantly by site. Degradation was indicative of impacts from fishing and gleaning. The comparison of in situ temperature and remotely sensed SST indicated that bleaching stress in Timor-Leste is potentially mitigated by seasonal coastal upwelling during the Northwest monsoon season. As a climate refugium, the immediate conservation priority lies in the mitigation of localized anthropogenic impacts on coral reefs through increasing the management of expanding human-related sedimentation and fishing.

1. Introduction

Timor-Leste is a developing country with limited infrastructure following decades of war. It is one of six member states of the Coral Triangle (CT), the global center of marine biodiversity (numbers of species), housing 29% of the world’s coral reefs [1,2]. Much of this diversity, however, is under threat due to a range of growing local and global stresses [1,3,4,5]. Globally, climate change-induced coral bleaching via ocean warming and coral disease are among the main threats facing coral reefs [3,6]. Mass coral bleaching events driven by anomalous increases in sea surface temperature (SST) maintained over time, or marine heatwaves, have been occurring with increasing frequency [7]. The El Niño Southern Oscillation (ENSO) associated marine heatwave in 2016–2017 was the longest and most intense in history with global, but patchy, impacts on coral reefs [8,9]. Comparatively few reports of the bleaching event exist in the CT, with one report from Sulawesi, Indonesia attributing coral mortality in shallow reef flat zones to ENSO-related sea level fall [10]. The CT arguably has the most to lose in terms of loss of biodiversity and resources associated with reefs that support the 360 million people who live in the region [11,12].
Coral reefs within the CT are highly threatened by local impacts. In Timor-Leste, 92% of reefs are at high or very high risk due to fishing pressure, watershed-based pollution, coastal development, and pollution from marine activities (shipping, oil, and gas extraction) [11]. While dynamite fishing has decreased since the Indonesian occupation [13], subsistence fishing is important to livelihoods and food security. There are an estimated 5000 fishers on the narrow, productive shelf that supports coral reefs [14,15]. Additionally, gleaning, or harvesting invertebrates from intertidal flats for consumption, known locally as meti, is commonly practiced by women and children and has its own significant impact [16,17,18]. Agricultural practices consist of small-scale, subsistence farming without the use of non-organic fertilizers and pesticides [19]; nevertheless, watershed-based pollution is widespread due to an estimated 24% decrease in forest cover from 1972 to 1999 caused by slash and burn agriculture, logging, and consumption for fuel [20,21,22]. With planned development in these sectors [11,20,21,22], further understanding of natural and anthropogenic pressures affecting reefs is crucial in order to properly manage coral reefs for nature and people alike.

1.1. Disease in the Context of Coral Reef Health

Coral disease has been a major contributor to the decline in corals in the Caribbean [23], as well as reefs in the Indo-Pacific [3,24,25,26]. By contrast, there have been few studies of coral disease in the CT (Table S1). In this study, diseases were defined as syndromes caused by pathogens. It is important to document lesions, or morphologic abnormalities, predation, physical breakages (storms, anchors), and aggressive interactions that may result in tears or breaks in the tissue, partial mortality, stress to the coral host, and abiotic diseases which we collectively refer to as compromised health. Abiotic diseases, such as coral bleaching, are not caused by microbial agents [27]. These are some of the many indicators of coral reef condition (loosely defined as coral health). Disease can be endemic and highly visible [23], or present in low frequency in any given population [26]. Tracking disease and other signs of compromised health through time can be paired with other datasets (such as herbivore biomass, hurricane incidence, environmental parameters, etc.) and key physiological parameters such as growth rates, fecundity, and community composition of reefs [28]. Many coral diseases have been linked to increasing ocean temperatures, nutrient pollution, sedimentation, and fishing [29,30,31,32]. At most sites in Timor-Leste, these types of measurements are absent, highlighting the importance of the present study as a crucial baseline on the conditions of important marine resources.

1.2. Water Quality and Coral Reefs along the North Coast of Timor-Leste

Pollution arising from disturbed coastal regions and watersheds poses a serious threat to coral reefs globally. This type of pollution includes a wide range of compounds such as agrochemicals (pesticides), inorganic nutrients (nitrate, ammonia, and phosphate), soils and sediments, and fossil fuel residues that flow from disturbed landscapes. Many of these compounds negatively affect coral physiology by reducing calcification rates, fecundity, fertilization success, and larval development [33]. This can degrade reef communities reducing coral cover, community composition, diversity, and structural complexity [34,35]. High levels of marine pollution can increase the prevalence and severity of disease and susceptibility to bleaching [36,37,38,39,40]. Dissolved inorganic nitrogen (DIN = ammonium + nitrate + nitrite) measurements on reefs are generally <1.5 µM (individual species ammonium, nitrate, nitrite < 1 µM) with even lower phosphate concentrations (<0.3 µM; Table S2) [37,41,42,43,44,45,46,47]. A greater prevalence of disease has been associated with elevated concentrations of DIN from anthropogenic sources (fertilizer, sewage pollution, etc.) and phosphate ranging from 3.6 µM to 25.6 µM and 0.3 µM to 0.4 µM, respectively [41,42,45,46,47].
The isotopic signature of nutrients such as nitrogen can often serve as a tracer for different sources of coastal pollution, with different forms of input having different impacts (sewage can increase pathogen concentrations) and solutions [32,48,49,50,51,52,53,54,55,56,57]. Stable isotope analyses of nitrogen stored in macroalgae can provide a nutrient signal integrated over time versus water sampling, which is highly variable over space and time [58]. Generally, δ15N signatures in algae associated with urban wastewater are >10‰ [59,60,61,62]. Natural and synthetic fertilizers display a large range from −4‰ to +4‰ of δ15N values while nitrogen fixation typically has a negative δ15N signature between −2 and 0‰ [63]. Upwelling can have variable δ15N values ranging from 5 to12‰ [50,64,65,66,67,68,69,70]. Both fertilizer use and waste infrastructure are expected to be developed as described in the national strategic development plan [19].

1.3. Global Impacts—Ocean Warming, Mass Coral Bleaching, and Mortality

The US National Oceanic and Atmospheric Administration (NOAA) Coral Reef Watch virtual station in Timor-Leste (CRWTL) reported anomalous warming between the two survey periods of November 2015 and July 2017. Between January and May 2016, and again in January and February 2017, the water temperature of the region attained degree heating weeks (DHWs) between 4 and 8 °C-weeks [71]. This DHW range has been associated with 30–80% bleaching [72,73], suggesting that corals may have bleached twice within the 20 months between sampling intervals. Surviving corals, however, would have had four to five months to recover before resurveying in July 2017. Typically, mortality is not expected below DHW of 8 °C-weeks [74], although this is variable between species [75,76]. Corals that have experienced a recent thermal event that is sufficiently warm to cause temporary bleaching in some corals, may nonetheless be vulnerable to disease or other signs of compromised health [3,77,78,79]. Additionally, corals may endure sublethal effects for months after the event as they attempt to rebuild energy reserves [4,80].

1.4. Aims

The aims of the present study were two-fold. The first aim was to investigate the state and health of coral reefs along the north coast of Timor-Leste, as measured by the presence of coral disease and other signs of compromised health. The second aim was to explore the global and local impacts on Timorese reefs through water quality measurements, temperature data, and surveys before and after the 2016–2017 global bleaching event. This was achieved through repeated coral health surveys, seawater nutrient and nitrogen stable isotope analyses of macroalgae to assess nutrients, and in situ and remotely sensed temperature data.

2. Materials and Methods
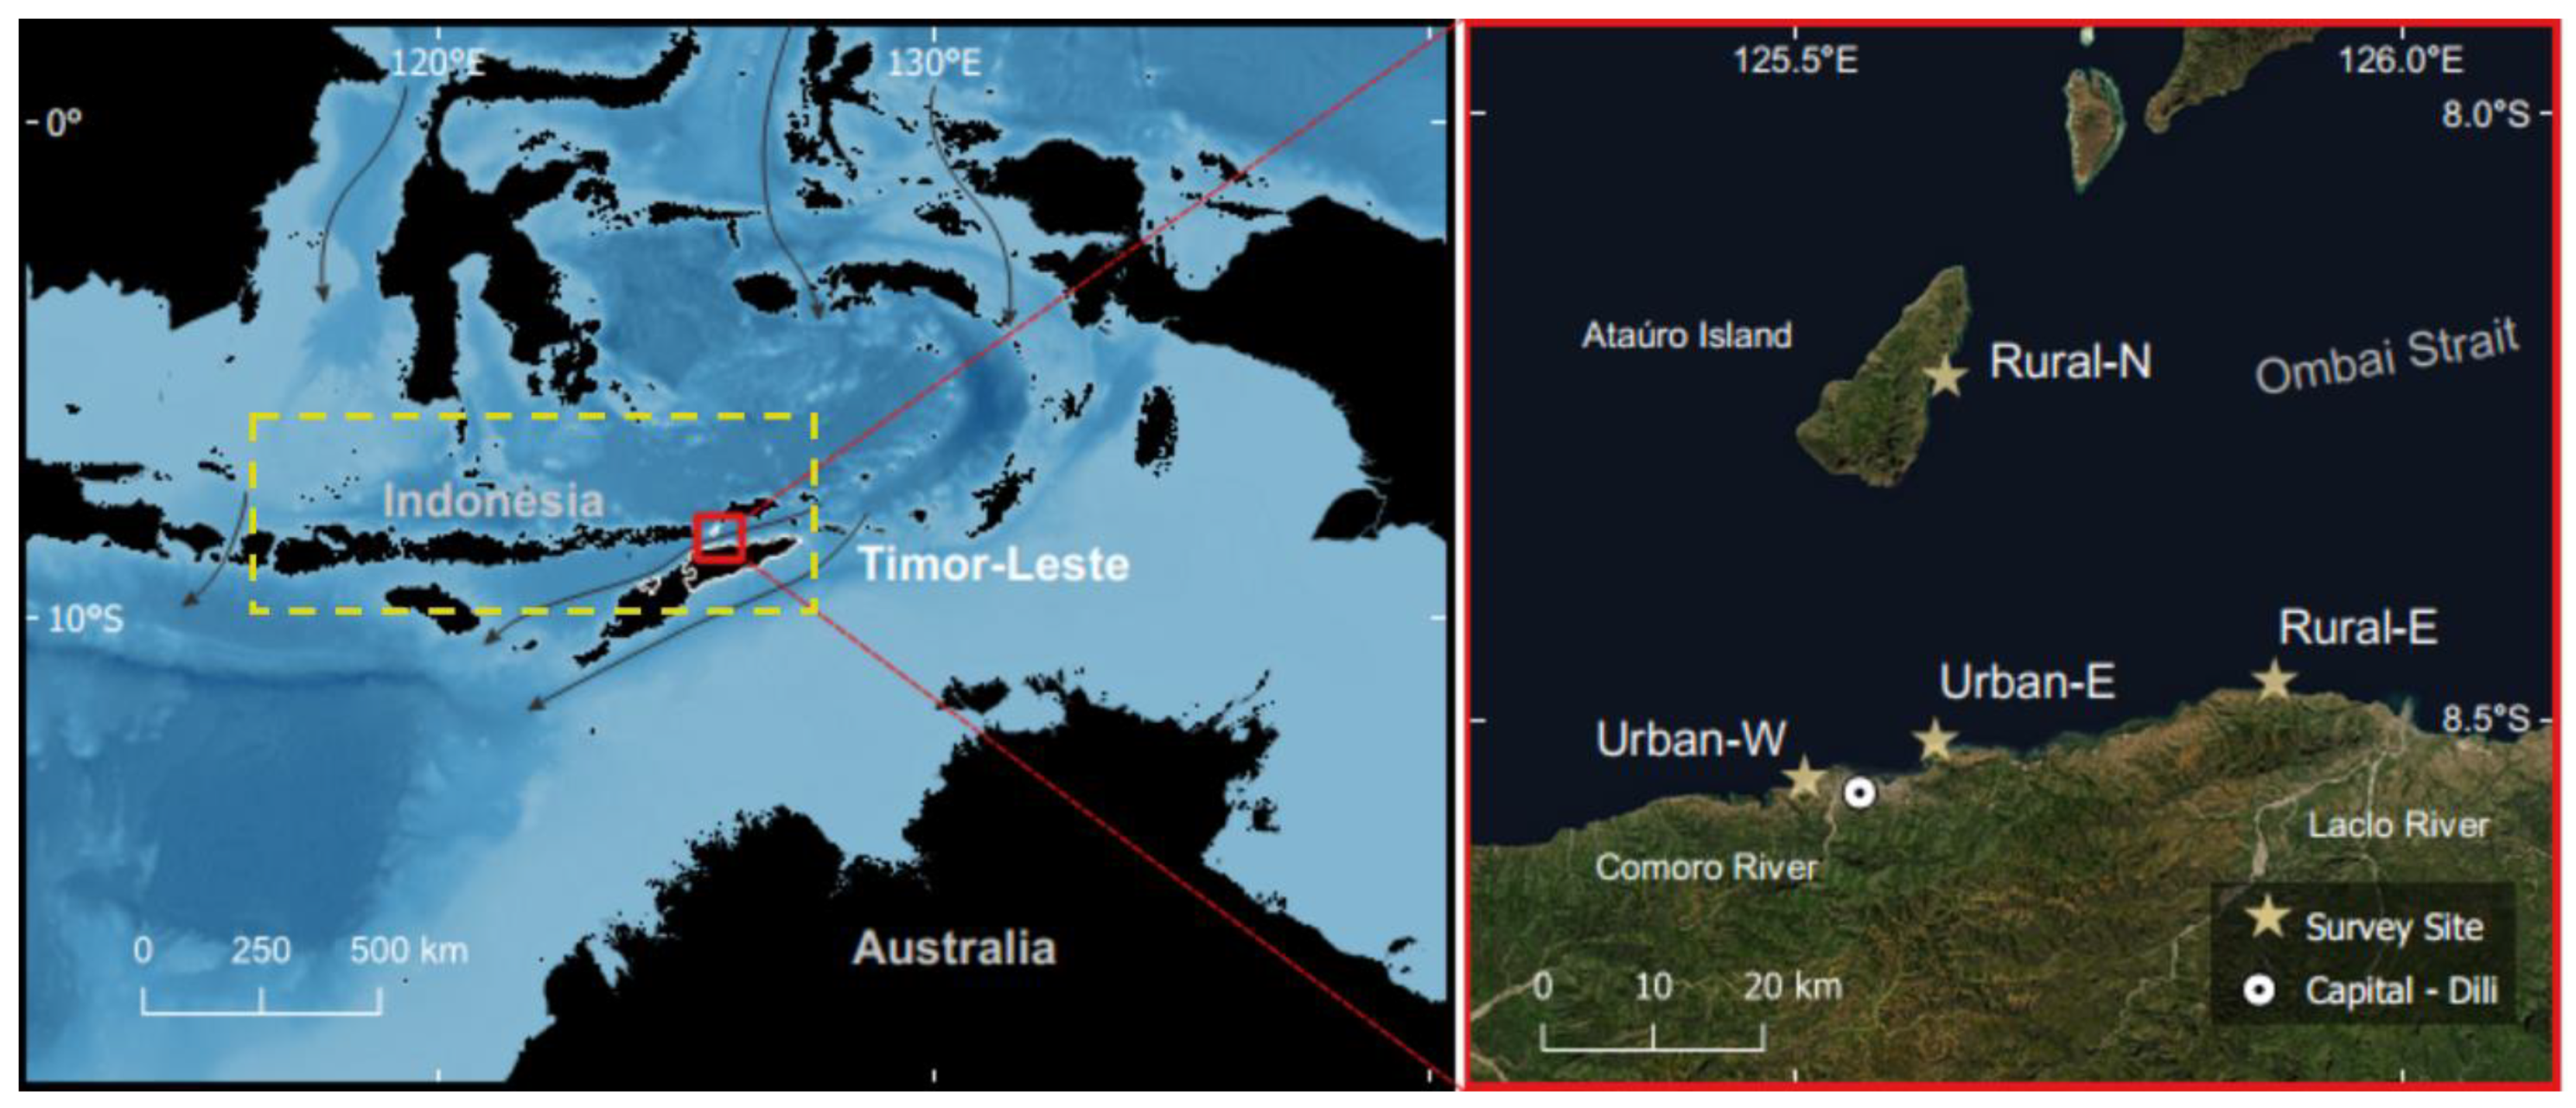
2.1. Study Site

Timor-Leste is a small island country located inside the southern edge of the CT and between Australia and Indonesia (Figure 1). The country gained its independence in 2002 following nearly 25 years of Indonesian occupation. It lies within the Indonesian ThroughFlow (ITF), a major oceanographic feature connecting the Pacific and Indian Oceans. The ITF transports an estimated 4.9 Sverdrups (106 m3/s) of water through the Ombai Strait along the north coast (Figure 1) [81,82,83,84,85].
This study was undertaken along the coast of Dili, Timor-Leste to complement a growing body of coral reef science undertaken in the area. Previous indications of reef health in this area have typically been anecdotes from surveys with other objectives. Dili, the capital (8°33′ S and 125°34′ E), houses a quarter of the country’s population, with 252,884 people recorded in the 2015 Census [86]. The Northwest monsoon season extends from December to May, when there is more rain and greater runoff to the coast [87]. The seasonal Comoro River runs through Dili, with flows ranging from less than 0.5 m3/s from July to November, to 12.3 m3/s in March [20]. Timorese waters are affected by semi-diurnal tides with a range of 1–2 m along the north coast [88]. The present study was conducted in two, three-week field trips that occurred in the dry season in 15–27 November 2015 and 15–29 June 2017. The dry, Northwest monsoon season offers safer surveying conditions but would also limit terrestrial run-off inputs such as nutrients.
Figure 1. Timor-Leste lies between Indonesia and Australia within the Indonesian ThroughFlow (ITF). Arrows indicate inflows and outflows of the ITF adapted from [81,82]. The yellow dashed box indicates the Lesser Sunda Islands (adapted from [85]). Enlarged map on the right shows the location of the survey sites in Timor-Leste near the capital of Dili. Survey sites are Rural-N on Ataúro Island in the Ombai Strait, Rural-E 40 km east of Dili, and Urban-W and Urban-E flanking Dili. The highly seasonal Comoro River can be seen just east of Urban-W (in Dili) and the Laclo River east of Rural-E. The four sites were sampled on two occasions in November 2015 and June 2017. Jaco Island lies at the easternmost point of the country.
Oceans 03 00012 g001
Surveys were conducted at four sites; two sites flanking Dili were representative of reefs under urban influences (“Urban-W” with 4993.0 people/km2; “Urban-E” with 449.8 people/km2) and two sites were representative of reefs under rural influences (“Rural-N” 30.7 people/km2, and “Rural-E” with 34.9 people/km2 [86]; Figure 1). Sites were chosen for logistics and to complement NOAA data collected between 2012 and 2016 [89].

2.2. Coral Community Composition and Coral Health Surveys

To assess benthic cover and coral health, we deployed 15 m line intercept transects (LIT) [90] and 15 m × 2 m belt transects, respectively [28]. At each of the four sites, three transects were laid at both 5 m (reef flat) and 10 m (reef slope) depths, for a total of 24 transects across all sites. The first of three transects at each site and depth was chosen haphazardly, with the subsequent transects at least 5 m away from the start/end of other transects on the appropriate depth contour. For the LIT surveys, all benthos under the 15 m tape was categorized into a major benthic category (hard coral, soft coral, substrate/sand, macroalgae, turf algae, cyanobacteria, and crustose coralline algae [CCA]). LIT transects were conducted by two volunteers per survey trip who were at least ReefCheck certified. On the coral health belt transects performed by the first author, every coral colony within the 15 × 2 m transect area was identified to genus and assessed visually for coral disease and signs of potentially compromised coral health, such as overgrowth by macroalgae, turf and cyanobacteria overgrowth, encrusting invertebrates (sponges, tunicates, flatworm infestation), burrowing invertebrates (gastropods, bivalves, crustaceans, etc.), signs of predation (fish and Drupella spp. snails), signs of bleaching (partial or total loss of algal symbionts appearing white), signs of coral response (pigmentation, mucus), and physical damage (sedimentation, breakage) as per protocols developed by the Global Environment Facility and World Bank Coral Disease Working Group (Figure 2 and Figure S1; Table S3) [28]. High prevalence or increasing numbers of burrowing invertebrates or overgrowth of corals by turf algae and invertebrates could be indicative of reef degradation due to anthropogenic disturbances [91]. No Acanthaster spp. sea stars or feeding scars were observed during surveys. Any uncertain diagnoses were photographed for later consultation. The prevalence of disease and compromised health was calculated as the number of corals affected by the disease/compromised health category divided by the total number of coral colonies in the transect [28]. The GPS coordinates at the start of each transect were recorded and used for the second survey in July 2017 (Table S4).

2.3. Measurement of Nutrient Concentrations and Stable Isotope Ratios

Seawater samples were collected for measuring the concentration of inorganic nutrients as an indicator of nutrient pollution. Three replicate 100 mL seawater samples were collected on each transect at a depth of 0.5 m above the benthos, after benthic surveys were completed (Table S4), kept on ice until filtered through a 0.22 μm pore membrane filter, and stored frozen. Seawater samples were analyzed within four months for ammonium, nitrite, nitrate, and phosphate using flow injection analysis at the Advanced Water Management Center (The University of Queensland). Nitrite had mostly zero values and was combined with nitrate for analyses.
Macroalgal samples were collected for stable isotope analysis to explore the origin of inorganic nitrogen. Three replicates of Halimeda spp. and of Chlorodesmis spp. macroalgae (approximately 5 g dry weight) were collected when available on each transect, rinsed, and air-dried for transport. In the laboratory, the samples were re-dried at 60 °C for a minimum of 24 h before homogenization using a mortar and pestle and subsequently analyzed at the Cornell University Stable Isotope Laboratory (Finnigan MAT Delta Plus isotope ratio mass spectrometer) for δ15N.

2.4. In Situ and Satellite Temperature Data

Calibrated HOBO pendant temperature loggers (Onset Computer Corporation, Bourne, MA, USA) were deployed at each site and depth in November 2015. Temperature was recorded every 30 min. All were collected in June 2017 except those from Rural-E which could not be retrieved. Remotely sensed satellite SST data from the NOAA’s CRWTL were downloaded from August 2015 through August 2017. This product uses 5 km2 resolution to predict bleaching stress across an entire jurisdiction such as Timor-Leste instead of producing values at every pixel [71].

2.5. Statistical Analyses

All analyses were conducted in R version 4.0.4 [92] and PRIMER7 [93,94]. Three-way repeated measures permutational multivariate analysis of variance (PERMANOVA) with 9999 permutations were conducted to test for significant effects between sites (Rural-N, Rural-E, Urban-W, Urban-E), depths (5 m, 10 m), and years (2015, 2017) on a Bray–Curtis similarity matrix of benthic cover categories, prevalence of disease and compromised health, and a Bray–Curtis similarity matrix of the number of colonies per coral genera (the count of coral genera per belt transect), all square root transformed [93,94]. All PERMANOVAs were also tested for homogeneity of dispersion akin to the homogeneity of variance in univariate tests [93]. Principal Coordinates Analysis (PCoA) was run on the same similarity matrix of coral genera to visualize coral community structure. Repeated measures analysis of variance (ANOVA; Anova in the car, emmeans, and nlme R packages) [95,96,97] was used to test the transformed hard coral abundance, the categories of disease and compromised health (only the bleached category was transformed), and the transformed Shannon diversity index of coral genera for significant effects between sites, depths, and years. All transformations were square root. A repeated measures ANOVA was also conducted on the log-transformed number of acroporids per transect between site, depth, and year. Normality was visually inspected (hist, qqplot, qqnorm, and leveneTest in the car package).
Nutrient data were only collected in 2015, with which a two-way ANOVA with factors site, and depth was performed on the seawater nutrient data, including DIN (transformations: log—NH4+ and DIN; square root—NO3 + NO2). A two-way ANOVA was used to test for significant differences in δ15N for each of the two genera of algae, Halimeda spp. and Chlorodesmis spp., with the factors site and depth. Only three samples of Chlorodesmis spp. were collected on a single transect at Rural-E and these were removed from the analysis. Variables were visually inspected for normality and tested for homogeneity of variance using Levene’s test (leveneTest). Percent nitrogen was log-transformed for Halimeda spp. Post hoc tests were conducted (multcomp and emmeans R packages) for Halimeda spp. and Chlorodesmis spp.
The monthly mean temperature was calculated from the 24 h daily maximum temperature obtained from both datasets (in situ temperature logger data and remotely sensed CRWTL data). A one-way repeated measures ANOVA was used to test temperature logger data (pooled by site) to test for differences in the monthly means between sites. A two-way repeated ANOVA assessed seasonal (summer January–March, fall April–June, winter July–September, spring October–December) and methodological (in situ loggers, remotely sensed SST from CRWTL) differences between the monthly temperature means. Both analyses employed random intercept models with residual autocorrelation structures to account for temporal autocorrelation of individual temperature loggers and CRWTL measurements (nlme R package). Post hoc tests were conducted using the emmeans R package. To assess levels of thermal stress, remotely sensed DHWs were retrieved from CRWTL online [71].

3. Results

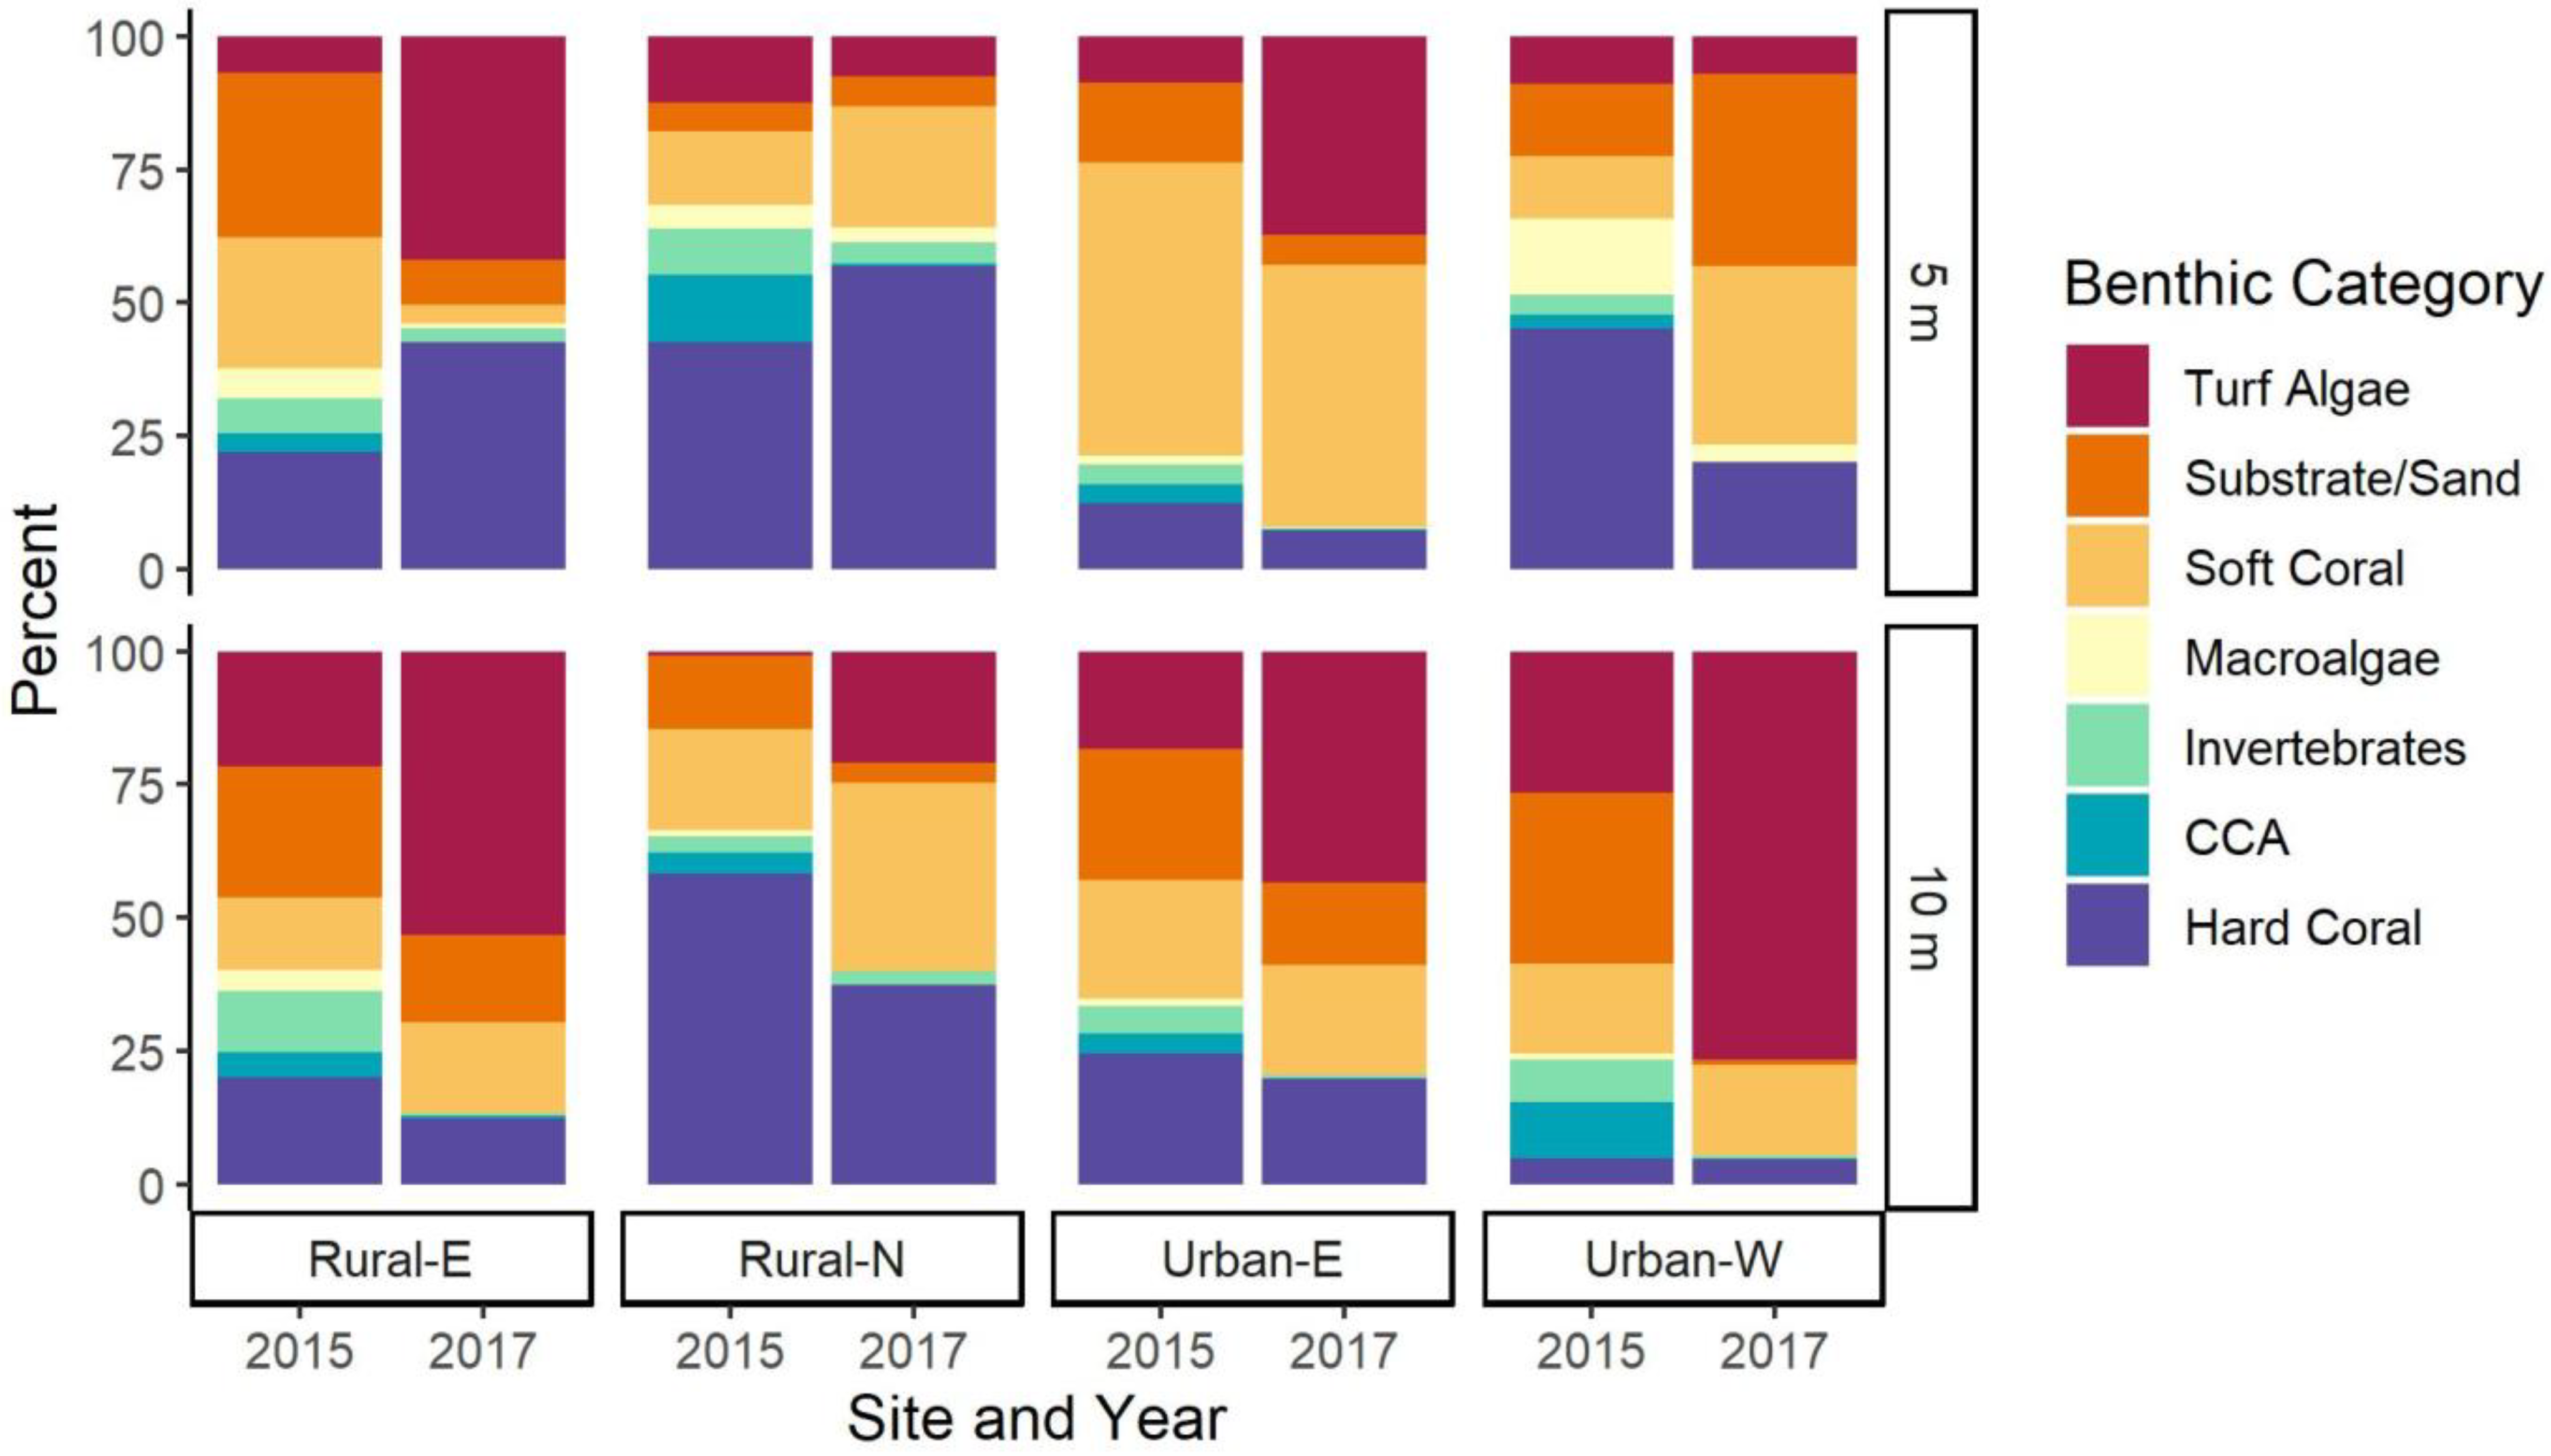
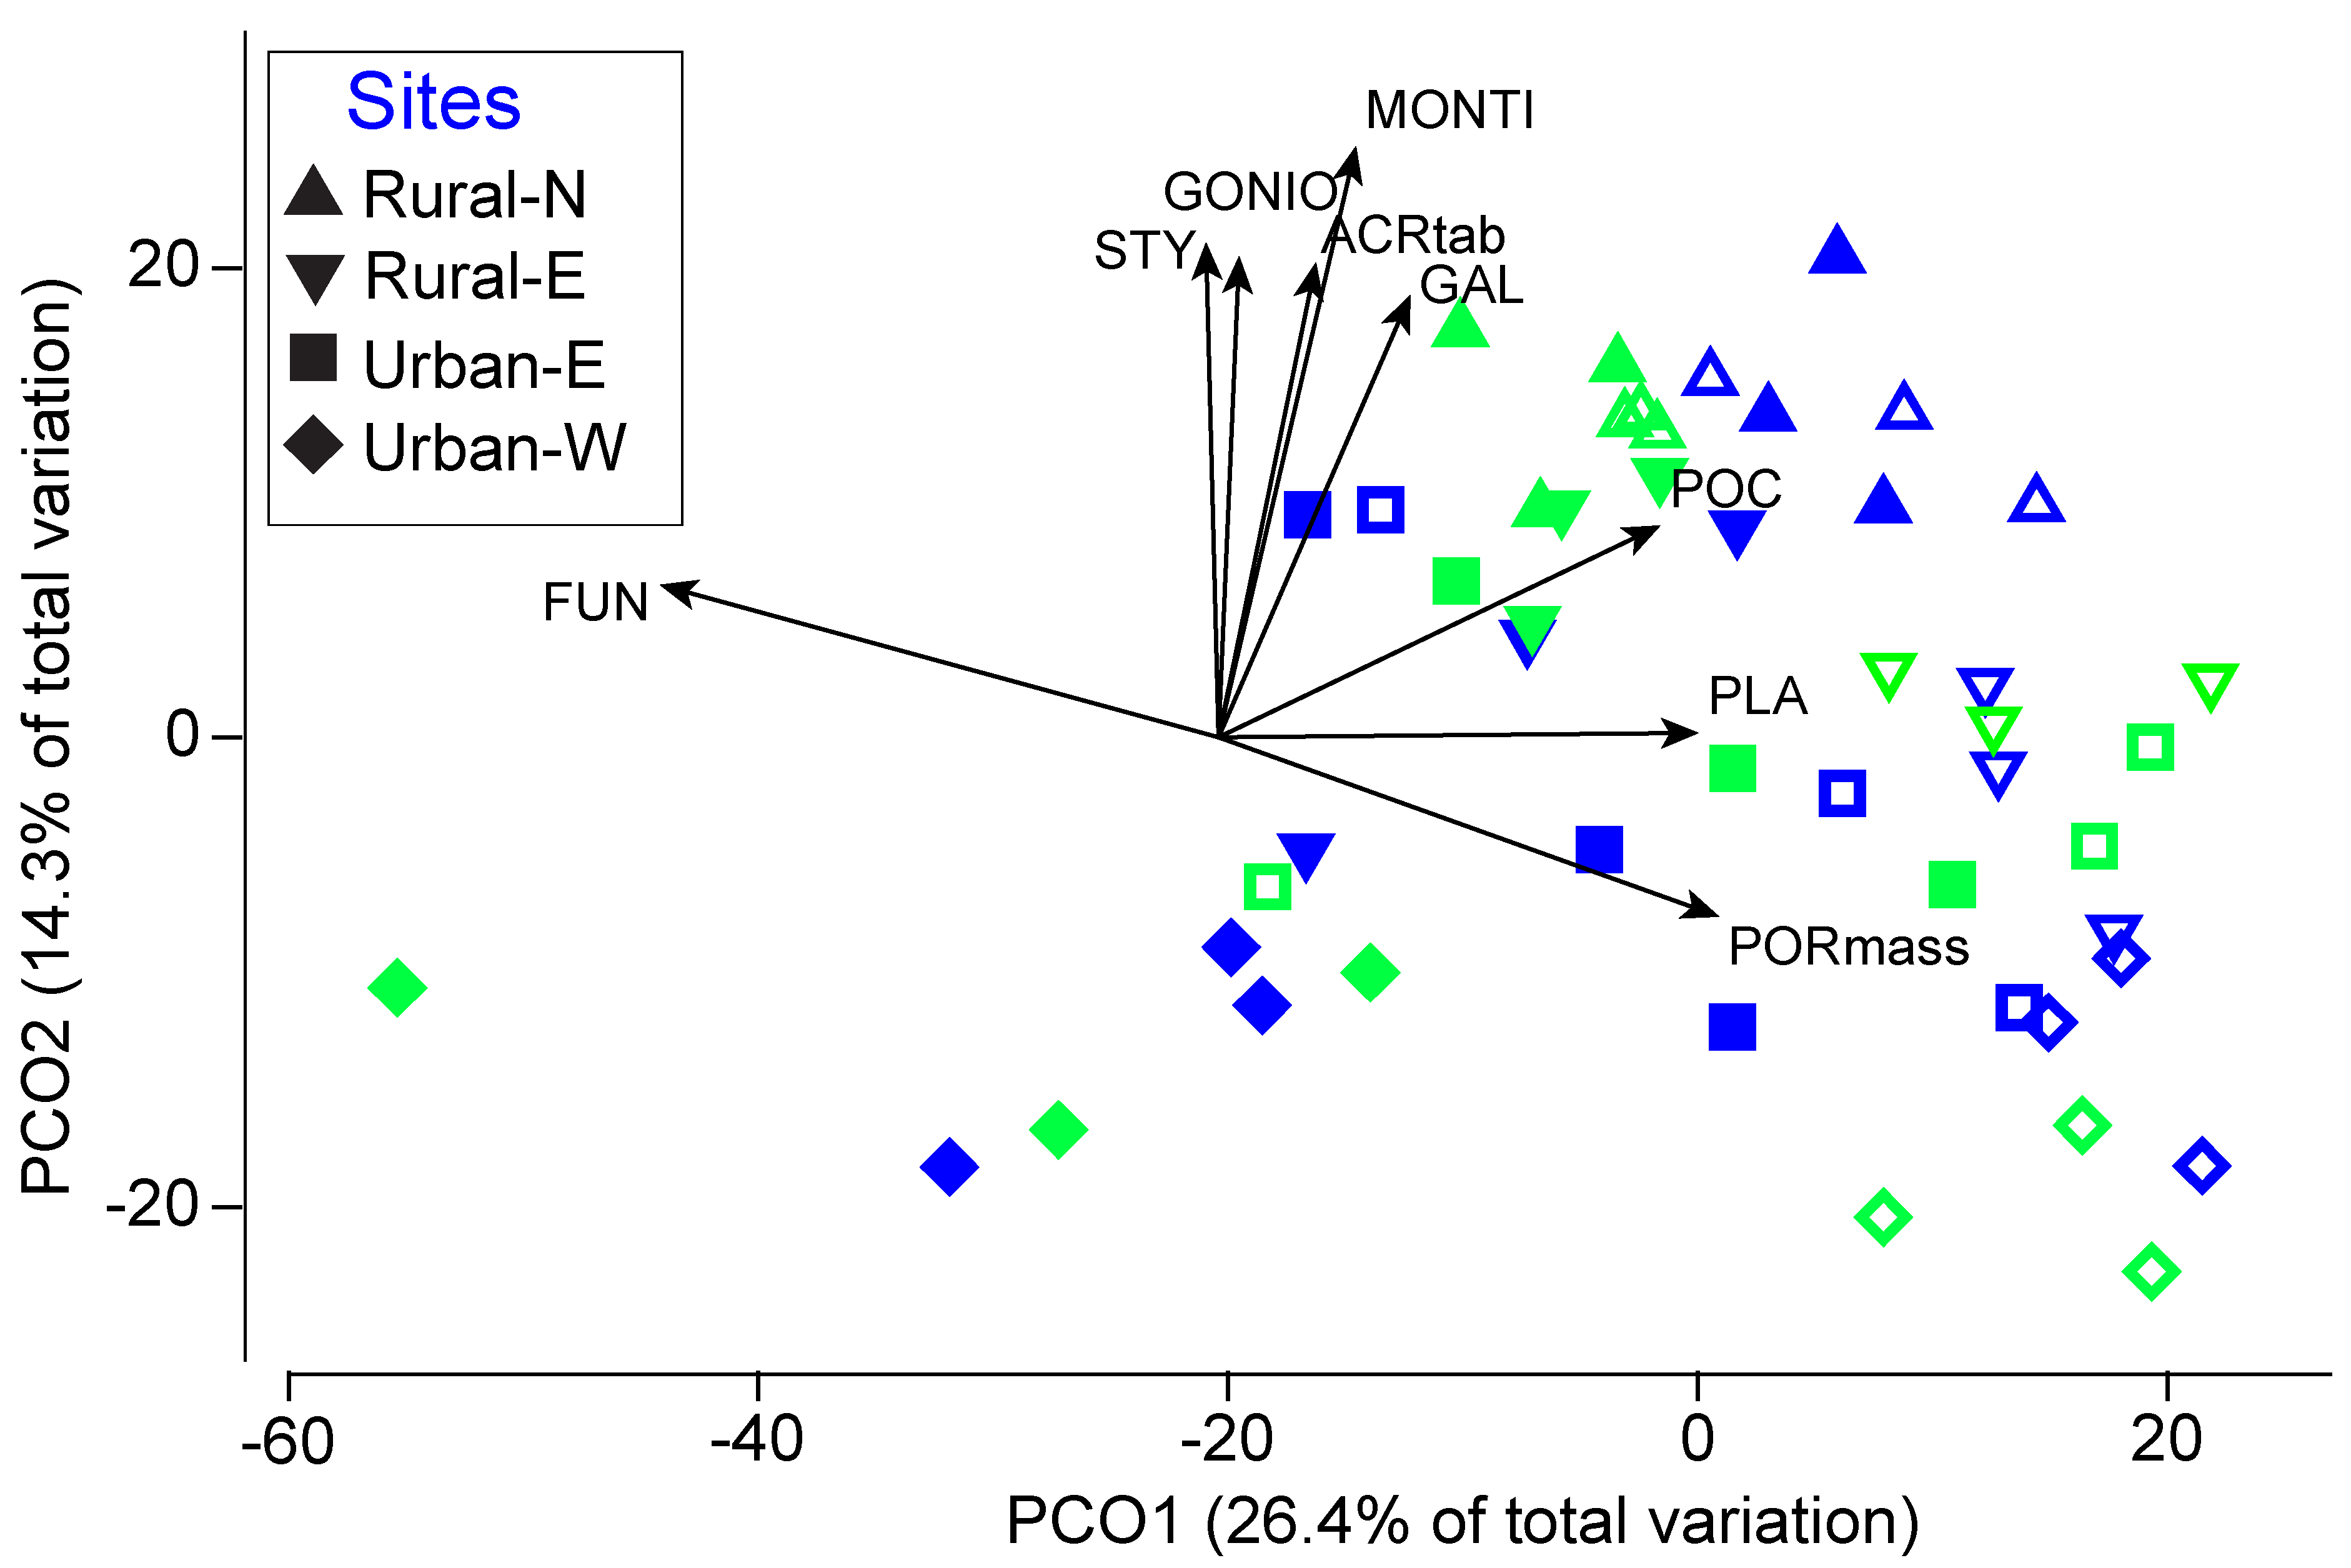
3.1. Coral Cover and Community Composition at Four Sites

A total of 9521 corals from 51 genera were counted within the 1440 m2 of the 15 m × 2 m belt transects in 2015 and 2017. LIT surveys indicated that benthic composition was significantly different between a three-way interaction, where variables affect benthic composition in conjunction with each other, between year, site, and depth [three-way repeated measures PERMANOVA, pseudo-F(3,47) = 2.6888, p(perm) = 0.0109]. All sites, except Urban-W, were significantly different between survey years at 10 m while only Urban-W and Rural-N changed at 5 m [p(perm) < 0.05]. Dispersion, or variability, was also significant for year [F(1,46) = 5.9165, p(perm) = 0.0205], and site [F(1,44) = 6.7038, p(perm) = 0.0012]. Urban-W was significantly more variable in benthic composition than all sites [p(perm) < 0.05]. Live hard coral cover (henceforth coral cover) was significantly different with a three-way interaction between year, site, and depth [three-way repeated measures ANOVA χ2(3) = 18.6751, p = 0.0003]. In both years, Urban-W at 5 m had the lowest coral cover (mean ± SE; 4.8 ± 1.8% in 2015 and 4.5 ± 1.5% in 2017) and Rural-N 5 m (58.2 ± 1.7%) and Rural-N 10 m (56.9 ± 3.3%) had the highest coral cover, respectively, in 2015 and 2017 (Figure 3). Overall, coral cover was ~25% higher at the rural sites (37.3 ± 5.3%) than at the urban sites (12.9 ± 3.8%).
Coral community composition, as measured by the abundance of individual coral genera from belt transects, also differed significantly by a site and depth interaction [three-way repeated measures PERMANOVA pseudo-F(3,47) = 3.2546, p(perm) = 0.0001]. Hard coral diversity, calculated using the Shannon diversity index of hard coral genera counted on belt transects, showed significant site and depth differences [three-way repeated-measures ANOVA χ2(3) = 16.1668, p = 0.0010]. Urban-W had the lowest coral diversity of all sites at 10 m but had comparable diversity at 5 m depth (Shannon index 1.7 ± 0.2; 18 ± 2 genera) (Figure S2). The maximum genus richness of 33 ± 2 was present at Rural-N with consistently high (>40%) coral cover in both survey years. This site also had significantly more tabulate [three-way repeated measures ANOVA χ2(3) = 31.5895, p < 0.0001] at both depths than all other sites with 21.1 ± 0.7 colonies per transect (p < 0.05). Remaining sites averaged less than five acroporid colonies per transect. There was a significant three-way interaction between site, depth, and year for branching acroporids [three-way repeated measures ANOVA χ2(1) = 7.8254, p = 0.0498]. Branching Acroporids decreased at all sites and depths between survey years except for Rural-N and Urban-W at 10 m (Figure S3). Although 51 genera were found across the belt transects over all four sites, only a few genera dominated the reef, namely Porites (2015 = 17.4%, 2017 = 13.0%), Fungia (2015 = 13.7%, 2017 = 19.0%), and Montipora (2015 = 12.9%, 2017 = 13.4%).
Community composition measured from belt transects was also significantly different with a year and site interaction [pseudo-F(3,47) = 2.1713, p(perm) = 0.0002]. Urban-E was the only site with comparable coral community between years, and all sites were significantly different within years [p(perm) < 0.05]. In Figure 4, sites were generally distributed along axis two of the PCoA with Rural-N most positively associated with tabulate acroporids, Galaxea, Goniopora, Montipora, and Stylophora, while differences between depth were aligned along axis one with more Pocillopora, Platygyra, and massive Porites corals on the 5 m transects. Dispersion, or variability in community composition was also significantly different by site [F(3,44) = 15.7770, p(perm) = 0.0001] and depth [F(1,46) = 5.6388, p(perm) = 0.0433]. Specifically, the dispersion (spread of points) was significantly greater at 10 m and highest at Urban-W and lowest at Rural-N (Figure 4).

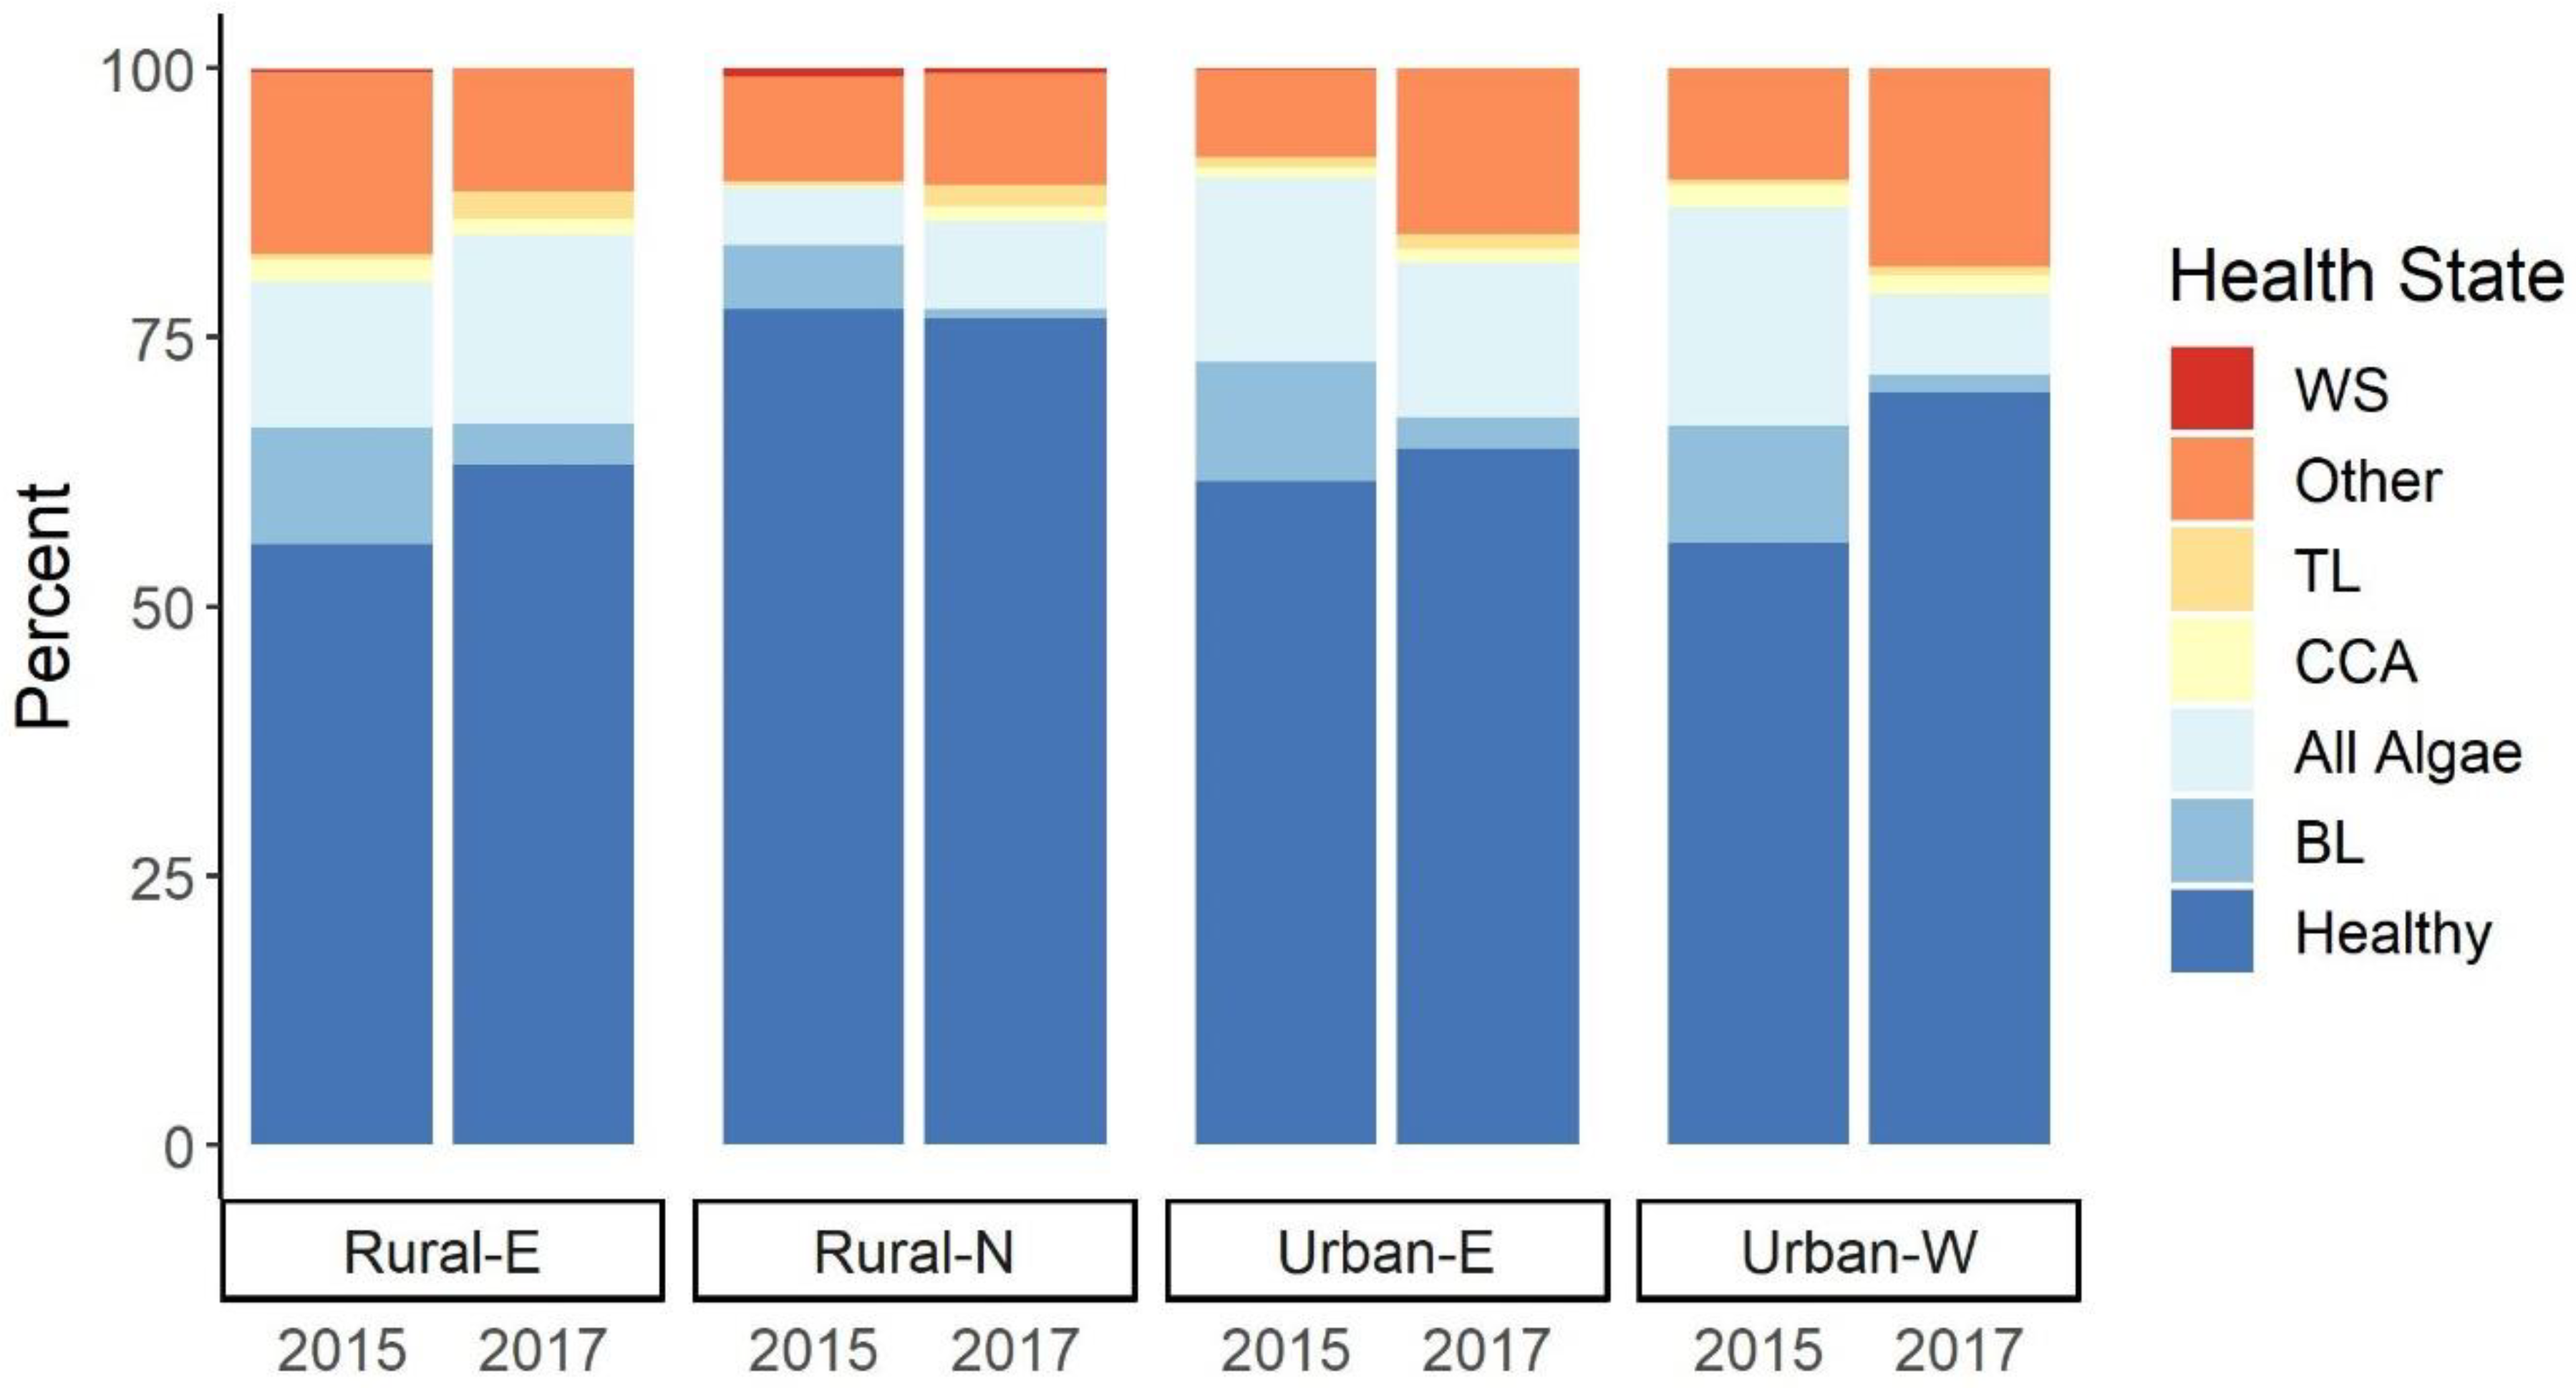
3.2. Prevalence of Coral Disease and Indicators of Compromised Health
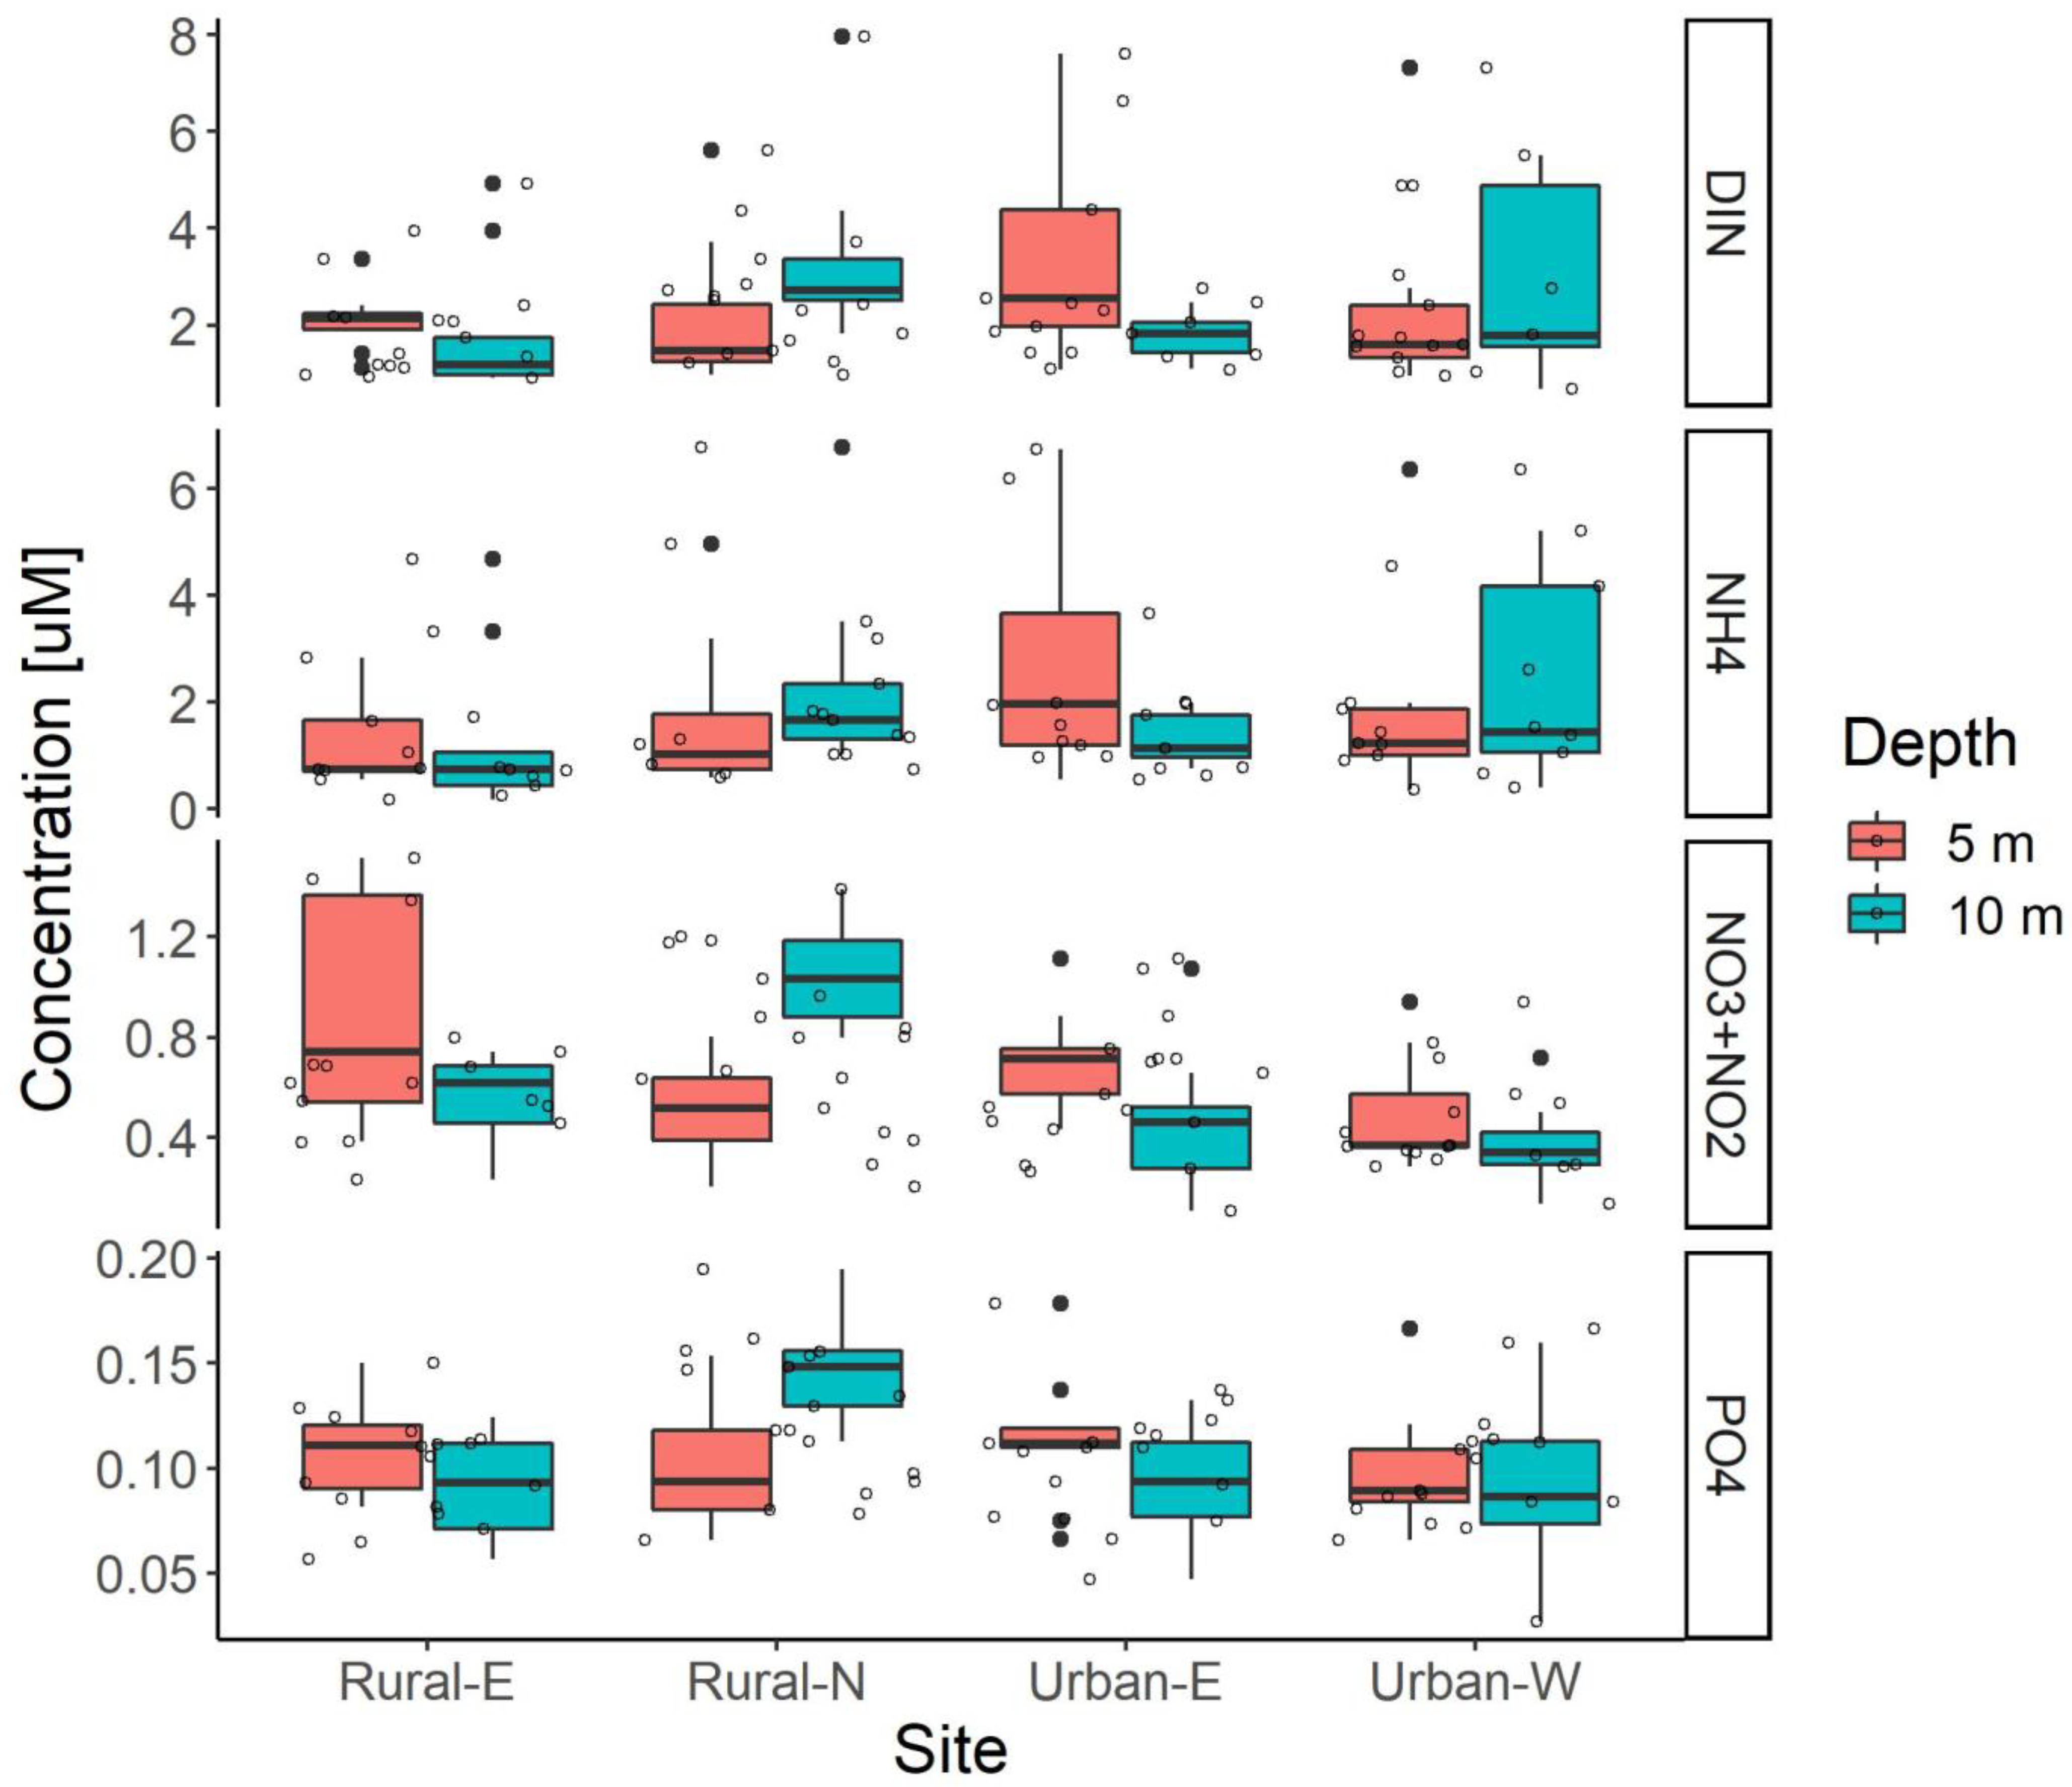
Overall, most hard corals at the sites surveyed appeared healthy as recorded on the belt transects. Those categorized as “healthy” made up 65.7 ± 2.9% of corals surveyed averaged over both years, with a low (<1%) prevalence of diseases and a 33.7 ± 1.7% prevalence of other compromised states. In 2015, there was 0.9 ± 0.2% prevalence of WS at Rural-N on Acropora spp., which made up 44.9% of all diseases recorded (Figure 5). In the same year, Rural-N also had the highest prevalence of Growth Anomalies (GAs; 0.6 ± 0.2%). There was one case of unconfirmed Trematodiasis, which requires microscopic confirmation of the larval trematode. In 2017, disease prevalence was lower with the highest prevalence of WS (0.5 ± 0.1%) at Rural-N again but Urban-W recording the most GAs (0.6 ± 0.3%). All cases of WS were documented on acroporids in 2017, while GAs were less host-specific and found on nine genera across the two years. In 2015, the number of branching acroporids was comparable between depths at each site while in 2017 the overall number of this coral morphology decreased, more branching acroporids were found at 10 m (Figure S3).
Prevalence of disease and compromised health categories from belt transects varied significantly by two interactions: year and site [three-way repeated measures PERMANOVA, pseudo-F(1,47) = 3.8234; p = 0.0005] and site and depth [pseudo-F(3,47) = 2.3313; p = 0.0150]. Rural-N had the lowest prevalence of disease and compromised health among all sites in both 2015 (22.4 ± 0.8%) and 2017 (23.2 ± 2.1%). However, Rural-N was the only site where the prevalence of compromised health and disease increased between survey years. Despite this, Rural-N was also characterized by the highest percentage of healthy corals (77.2 ± 1.1%) [three-way ANOVA χ2(3) = 30.7576, p < 0.0001}, significantly higher than all other sites (p < 0.05). This site also had the lowest prevalence of algal overgrowth on corals in 2015 (5.3 ± 1.2%) and the lowest amount of coral bleaching in both years (6.0 ± 0.9% in 2015, 0.8 ± 0.2% in 2017; Figure 5).

3.3. Water Quality

Nutrients and Stable Isotopes

Seawater nutrient levels and N stable isotopes of macroalgae were assessed simultaneously to obtain an indication of land-based pollution. Nutrients were not elevated (>10 µM DIN) at the urban sites compared to the rural sites, though there were significant site and depth interactions [two-way MANOVA F(3,63) = 3.208, Pillai = 0.398, p = 0.0012]. Combined nitrate and nitrite, and phosphate were responsible for these interactions [two-way ANOVA NO3 + NO2: F(3,63) = 10.8991, p < 0.0001; PO43−: F(3,63) = 4.5597, p = 0.0059]. Rural-N 10 m had significantly higher combined nitrate and nitrite (NO3 + NO2: 1.05 ± 0.07 μM) and phosphate (PO43− 0.15 ± 0.01 μM; Table S6) than all other sites at 10 m, but similar levels of both nutrients at 5 m compared to remaining sites (Figure 6). Variation in DIN was marginally significant with a site and depth interaction [two-way ANOVA F(3,63) = 2.7769, p = 0.0484], but there were no significant differences in the pairwise test (p < 0.05; Figure 6).
Stable isotope values were consistent across sites, with no elevated values at the urban sites compared to the rural sites. Delta 15N stable isotopes had a significant site difference for both algae species. Urban-E had significantly lower δ15N in both algae species (Table 1).

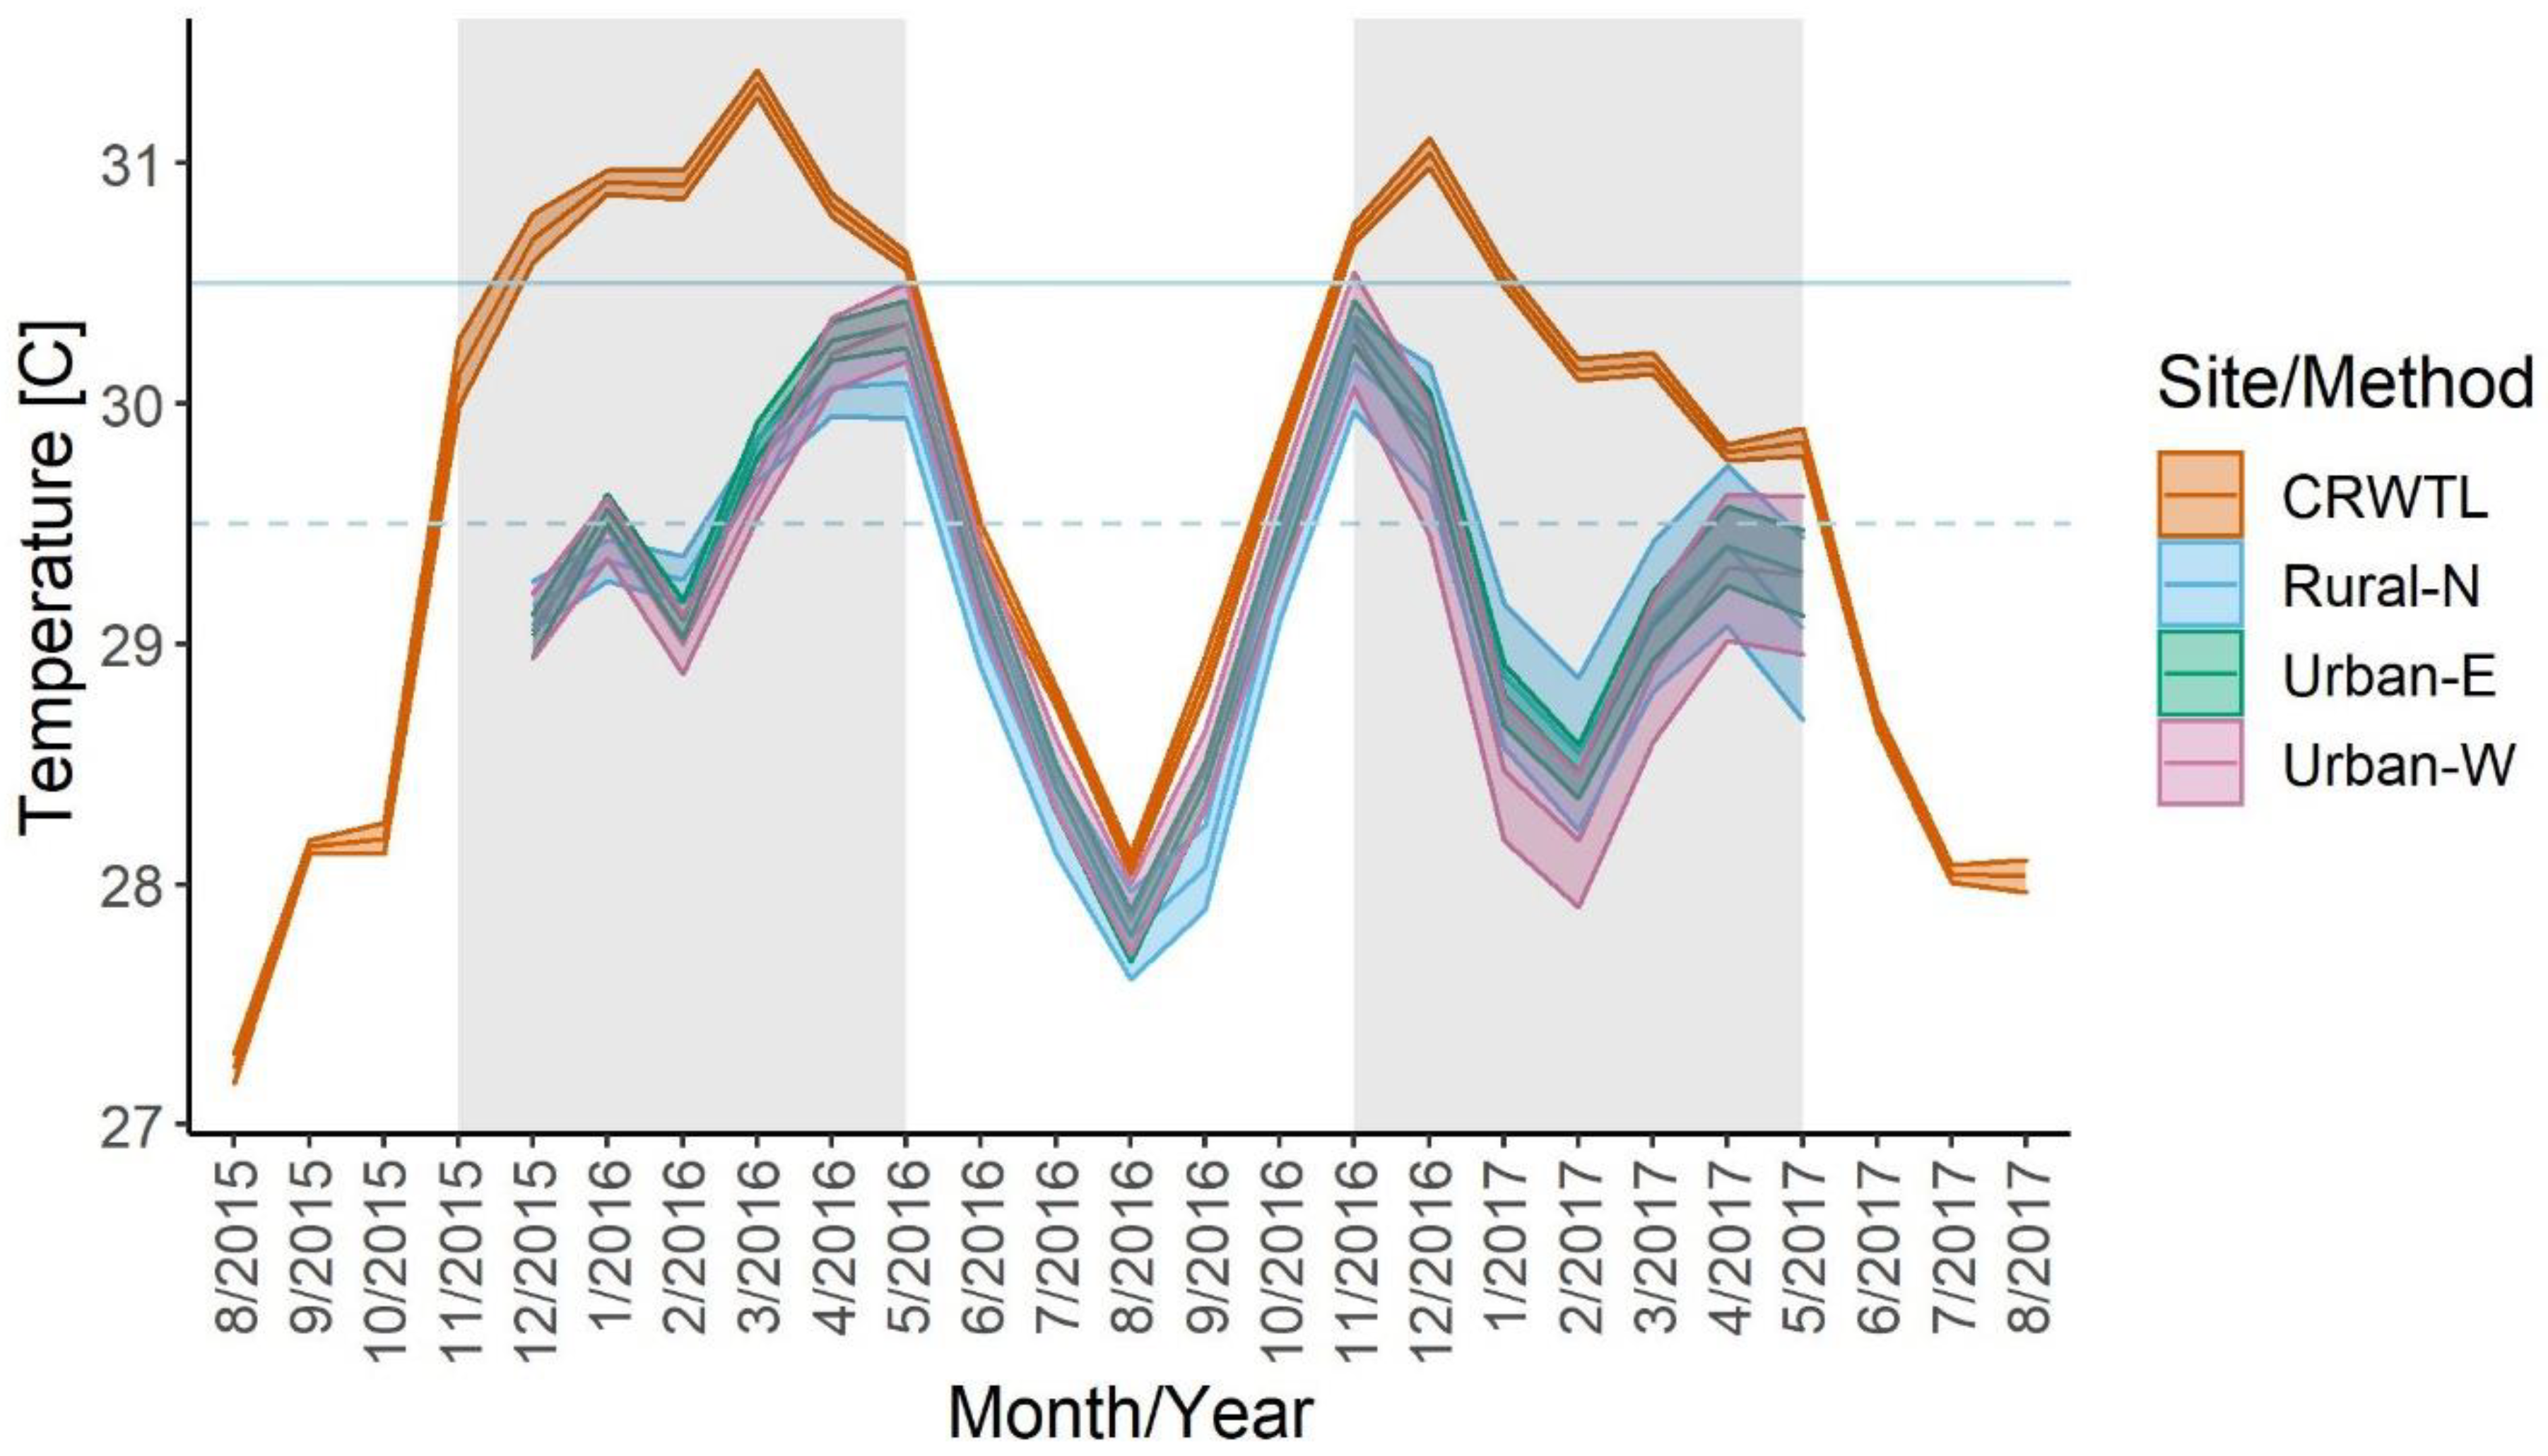
3.4. Temperature and the Prevalence of Bleaching

The average temperature difference between the 5 and 10 m temperature loggers across the three sites was 0.3 °C (±0.1 °C) and thus the loggers were pooled by site for further testing of site differences. The monthly means of the temperature recorded by the in situ loggers were not significantly different by site [one-way ANOVA: χ2(2) = 0.1277, p = 0.9382] (Figure 7).
Comparison of the monthly means of all in situ temperature loggers with the monthly means of the CRWTL SSTs showed they were significantly different by a season and method interaction [two-way ANOVA: χ2(3) = 8.2054, p = 0.0420]. Pairwise tests for this interaction revealed that the CRWTL satellite-derived SST values were not significantly higher than the in situ logger temperatures within the same season (Summer CRWTL:Summer in situ, p = 0.4991; Fall CRWTL:Fall in situ, p = 0.5562; Spring CRWTL:Spring in situ, p = 0.2291; Winter CRWTL:Winter in situ, p = 0.0712). However, the elevated CRTWL temperatures during the austral summer (Jan–Mar, CRWTL = 30.7 ± 0.2 °C and in situ = 29.1 ± 0.1 °C) and austral spring (Oct–Dec, CRWTL = 30.5 °C and in situ = 29.7 °C) were ecologically significant, 1.6 °C and 0.8 °C warmer, respectively, than in situ temperatures for the same seasons. During the summer, the 1.6 °C difference between methods meant that CRWTL SSTs were above the MMM + 1 °C bleaching threshold while in situ temperatures were below the MMM. Thus, according the CRWTL, DHWs were accumulated over this period while in situ temperature remained below the bleaching threshold with no DHW accumulation (Figure 8).
During the 639 days between surveys, major heat stress events occurred. CRWTL indicated there were 190 days (30.2%) of bleaching warning (0 < DHW < 4) and 161 days (25.2%) of bleaching alert 1 (4 <= DHW < 8). The accumulation of DHWs was limited to November 2015 through July 2016 (224 days) and November 2016 through March 2017 (119 days). This corresponded to the months where the CRWTL monthly averaged temperatures were greater than the maximum monthly mean (MMM; Figure 7), the warmest month of the twelve-monthly mean SST climatology values from the CRWTL data. The accumulation of DHWs during 2015–2016 was almost 8 months, nearly twice as long as the DHW accumulation during 2016–2017. The in situ temperature data, however, never reached the MMM + 1 °C threshold for bleaching, and based on these data there would be no accumulation of DHWs.
There was a three-way interaction between site, depth, and year on bleaching prevalence [three-way repeated-measures ANOVA, χ2(3) = 19.662, p = 0.0002] (Figure 5). All sites at each depth showed a decrease in the prevalence of coral bleaching from one survey to the next (p < 0.05; Figure 5), which is expected as the second survey was conducted at the onset of austral winter. However, only Rural-E at 10 m (13.4 ± 0.7% and 2.7 ± 1.2% in 2015 and 2017, respectively) and Urban-W at 5 m (17.4 ± 1.6% and 1.8 ± 1.3%) had significant decreases in the prevalence of bleaching.

4. Discussion

This study provides a baseline for the condition of four outer reef slope communities that are located within ~40 km of the capital Dili, in Timor-Leste. Insights are provided for two key questions posed at the outset of this study. Firstly, coral cover and health was variable and we infer that small-scale fishing and gleaning are influencing reef health at one of the urban sites, and, second, local impacts are a greater immediate threat to Timorese reefs compared to ocean warming for the time being.

4.1. Coral Community Composition and Human Impacts

The underlying coral community composition was variable across the four surveyed sites. There is some evidence that increased human population density correlates with damaged reefs [98,99,100,101] and the rural sites did have greater percent coral cover compared to the urban sites, a difference which could be an indication of better reef condition. Site-level differences, however, seemed to play a greater role than rural versus urban classifications. Rural-N was distinct in having the highest coral cover and a diversity dominated by acroporids, a finding comparable to the biodiversity assessment of the same site in the 2012 Rapid Marine Assessment [102]. This site was also the only barrier reef surveyed, barrier reef formations being uncommon along the steep bathymetry of the north coast and harder to access. Anecdotally, it was observed that site-specific factors, such as ease of access to the reef, appear to be associated with indications of reduced reef health, such as reduced coral cover and coral diversity, and with an increase in compromised health states.
In addition to accessibility, geography, seasonal changes in precipitation, land-use, accumulated wave exposure, and storm exposure are likely to affect the reef community. Although these factors are important in shaping coral reefs, they were outside the scope of the study. Rural-N may be less subject to sedimentation than the other three sites as Ataúro Island does not have any significant rivers on it. Although Rural-N was the only barrier reef, all sites had steep reef slopes which is characteristic of Timorese reefs [103]. Despite the distance from large rivers for the remaining sites, coastal construction and the addition of culverts under roads could provide inputs of sediments especially at Rural-E. Large storms and waves that would have destructive effects on reefs are uncommon along the north coast [87]. The regions comprising Rural-N and Urban-E have similar wave exposure regimes of 0.5 m maximum wave height which is likely not responsible for the low coral cover compared to Rural-N (Figure 3) [104]. Temperature differences likely have a negligible influence on community composition as the temperature logger data were consistent between the three sites (Figure 7). This is with the caveat only three sites were measured; however, two years of NOAA temperature logger data measured from October 2012 to October 2014 at sites corresponding to Rural-N, Rural-E, and Urban-E were also very consistent [104]. More extreme differences in temperature are likely to shape coral reefs. This leads to the conclusion that localized human impacts play an important role in the site differences observed on these coral reefs.
Fishing is playing an increasingly significant role in Timor-Leste. Observations of extensive rubble slopes at Urban-W suggest this damage may be due to blast fishing, although the damage did not appear to be recent [102]. Gleaning is largely overlooked and an important means of food security in Timor-Leste with most (>80%) of Timor-Leste households in coastal communities gleaning [17,105,106]. Increased gleaning could also be a sign of diminishing fishing returns [107] or economic crises [108] and could result in degraded coral reef flats [109,110,111].
Urban-W site had the most fishing activity and showed the greatest signs of blast fishing impacts observed during the fieldwork. The subdistrict of Dom Alexio encompassing this site has the highest human population density adjacent to any of the four sites, with 4993.0 people/km2 compared to 449.8 people/km2 at Urban-E and 79.3 people/km2 nationally. Both rural sites had less than half (<35 people/km2) of the national population density. At Urban-W, the low coral cover at 5 m and the low diversity at 10 m could be attributed to the high subsistence and recreational (swimming) usage at the site. During surveys, women were observed gleaning for invertebrates on the low tide, small children were playing in the surf and on the reef flat, and men were net-fishing from small boats (Figure S4). While distance to the nearest river may be a sensible explanation for community-level differences between Rural-N and Rural-E, relative ease of access in a densely populated area differentiated Urban-W from Urban-E.

4.2. The Health of Coral Reefs along the North Coast of Timor-Leste

The prevalence of disease and compromised coral health was expected to be greater at urban sites with larger nutrient input and greater δ15N values at the shallow 5 m transects. Contrary to expectations, disease was highest at Rural-N at 5 m, with levels of WS at ~1% in both survey years. The low levels of disease detected in the current study agree with previous surveys [102,112], although no previous studies were specifically quantifying disease and compromised health. WS was the main pathology consistently observed during surveys. The WS documented at Rural-N was likely an infectious disease [26] and in the Indo-Pacific, WS is known to target acroporids [26,29,113]. Signs of WS spreading between acroporid corals were observed in the field. The pathogen causing WS at Rural-N is unknown but was likely Vibrio spp. a genus of bacteria that have been associated with diseases of multiple organisms including corals and humans [114,115,116,117,118,119,120]. Additionally, there was a positive association between host abundance and disease prevalence. This follows the classic density-dependent host–pathogen relationship [90,91,92]. In this study, all but one case of WS were found on acroporids. Rural-N had the highest density of Acroporids and 13 of the 17 recorded WS cases in 2015 and all 10 cases in 2017 were documented at this site [24,29,121,122]. The few cases of coral tissue mortality at other sites could have been from other causes such as unidentified predation; however, the pattern of distribution of corals affected by WS at Rural-N indicated that it was caused by an infectious pathogen.
There was likely coral mortality caused by the WS, inferred from the proportion of dead coral on some colonies (Figure 2a) [123,124], but this was likely not responsible for the decrease in coral cover in Rural-N. WS has the capacity to significantly decrease coral cover through mortality, which is associated with a much higher disease prevalence (>30%) [79]. Additionally, prevalence of WS did not differ between depths (Figure 5) and there was an increase in coral cover at Rural-N 10 m; thus, the changes in coral cover could be attributed to spatial heterogeneity recorded on non-permanent transects. WS recorded here is likely typical background levels of disease comparable to other CT locations, not an outbreak. The prevalence of WS, however, should continue to be monitored [122,125,126,127,128]. The low prevalence of coral disease in the CT supports the disease-diversity hypothesis which predicts that higher host species diversity will decrease the severity of outbreaks of a specialist pathogen [129,130,131]. The majority (>50%) of cases of WS were on tabulate acroporids, which are known to be the most susceptible to this syndrome. Four different acroporid morphologies were documented with WS during surveys likely encompassing different acroporid species with variable resistance to WS.
WS is a dynamic disease and can occur in outbreaks devastating acroporid populations [26,132] and thus altering overall coral community structure [132]. WS outbreaks have been linked to sediment plumes from dredging, terrestrial runoff, and elevated ocean temperature [29,30,133,134]. This is especially relevant given the recent global bleaching event and expected increase in the prevalence and severity of marine diseases given continued ocean warming [135]. A significant relationship between WS and coral bleaching co-infection was found on the GBR during the 2016–2017 global bleaching event. Acropora colonies that exhibited both WS and bleaching had seven times more tissue loss than solely bleached colonies [79]. Cooler temperatures could have been a protective factor against outbreaks of WS in Timor-Leste given the cooler subsurface temperatures on reefs compared to SST during the wet season. This phenomenon also coincides with the yearly ocean temperature maximum which is when corals would be most prone to bleaching. Increased sedimentation from catchments, however, is a continued threat as watersheds in Timor-Leste are degraded [20,136]. Future work assessing the downstream impacts of sedimentation on reefs and coral health is warranted.
The number of indicators of compromised health exceeded the prevalence of disease at surveyed sites. Rural-N at 5 m had the highest prevalence of non-coral invertebrate overgrowth (Figure 5); this could be explained by greater coral cover eliciting more coral-invertebrate interactions, as the cover of invertebrates was comparable between all sites. The infestation of flatworms was found at all sites, except Urban-W 10 m, with a prevalence similar to that reported from Indonesia [122] including some severe cases (Figure 2c). Although their role in coral reef environments is not well understood, flatworms consume coral mucus, reduce heterotrophic feeding, and at high densities inhibit photosynthesis [137,138,139]. There was also a notable absence of turf overgrowth at Rural-N, while the remaining sites had high levels which could be indicative of depauperate herbivore communities or elevated nutrients at these locations [140,141]. Competitive interactions between corals and other organisms such as boring barnacles, CCA overgrowth, and turf overgrowth were more commonly found on genera with massive morphologies such as Platygyra, Montastrea, and massive Porites.

4.3. Water Quality and Sources of Nutrients in Timor-Leste

The nutrient concentrations plus stable isotope ratios were more indicative of oceanic processes (upwelling, internal waves, etc.) than of terrestrially derived nutrient pollution. The levels of inorganic nutrients found in this study were not indicative of nutrient pollution. These values were comparable to nutrients measured in the Laclo river (~12 km east of Rural-E) in 2006 (See Supplementary Materials) [22]. Overall, nutrients were not found to be significantly elevated at surveyed sites. The sampling was also undertaken during the dry season (Mar to Nov) which would limit nutrient inputs from land and capturing elevated signals from point source pollution can be difficult.
Contrary to what was expected, combined nitrate and nitrite and phosphate averages were highest at Rural-N at 10 m; this could be a sign of upwelling nutrient-rich water [66,68,102,103,142]. Another source of nutrients at this depth could derive from submarine groundwater discharge [143]. An ephemeral bloom of cyanobacteria overgrowth was found at Urban-W 10 m in 2015 (6.1% prevalence), which can be a sign of elevated nutrients or other disturbances (ship strikes, etc.) [144,145,146]; however, seawater nutrients and stable isotope values were not elevated at this site suggesting the cause was not nutrient related. Although NH4+ was not significantly different between survey sites with the exception Rural-E 5 m, the range of 1.32 to 2.69 μM was greater than values between 0.3 μM and 2.2 μM [43,44,53] previously recorded for reefs in the Indo-Pacific.
The stable isotope data were consistent across sites and depths (range 2.5–5.5‰ excluding outliers) falling within the range of pristine oceanic (2–3‰) [48,147] and upwelling areas (5–6‰) [50,64,65,66,67,68,69,70]. The data were not indicative of δ15N sewage enrichment typically ranging from 8 to 22‰ [49,52,61,148,149]. The mean δ15N was significantly higher for the Chlorodesmis spp. at Urban-W as compared to Urban-E (Table 1). However, no Chlorodesmis spp. was found at Rural-N. Halimeda spp. were more abundant at sites and calcareous algae are good integrators of nitrogen over weeks to months versus days with fleshy macroalgae [60]. Similar values were recorded for both algae collected across sites and depths which indicates that the influx of nitrogen had been stable across several months. This is likely due to sampling being undertaken at the end of the dry season when there is little terrestrial runoff. There were a few outlier data points with much higher (12.17‰, 15.12‰) and lower (−6.79‰) δ15N values recorded in Halimeda samples, and these could be indicative of localized inputs on a scale of tens of meters of nutrients such as fish waste or groundwater discharge. Previous studies have demonstrated that macroalgal δ15N signatures decrease with depth where there is land-based pollution [50,52,57,150]. The influence of upwelling is less clear as both δ15N depletion and enrichment have been reported with upwelling [50,64,68,151].
In summary, assigning direct links between the condition of coral reefs and the source of nutrients is difficult. The mean δ15N values of algae sampled were higher than those reported from the open ocean. However, given the timing of collection, it is unlikely our sampling captured the effects of terrestrial run-off or of potential sewage pollution. Additionally, nutrients can be absorbed rapidly by biota and thus differences between pristine and polluted sites may not be readily apparent. Significant seasonal differences have been demonstrated for stable isotope values in macroalgae [51] so that further seasonal investigations are needed to elucidate the source of nutrients in nearshore waters.

4.4. Elevated Temperature and the Prevalence of Bleaching from Thermal Stress

The surveys in the present study were conducted immediately before the austral summer during the 2015 ENSO event which triggered mass bleaching globally [9]. The CRWTL virtual monitoring station indicated that the temperature began rising above the maximum monthly mean (MMM) in November 2015; however, care must be taken in interpreting such data given that the satellite only measures the temperature of the first 10–20 μm of the ocean [152] compared to loggers placed at 5 and 10 m. Satellite temperature products can be misleading in nearshore waters where pixels encompassing mostly land would be omitted. Timorese reefs are very steep and close to the coast and likely not to be included in satellite temperature products [103].
Timor-Leste appears to have experienced lower levels of bleaching compared to some other reef regions such as the Northern Great Barrier Reef (NGBR), one of the most severely affected by bleaching in 2016. The CRWTL accumulated DHWs on 55% of the days between survey periods compared 49% of days during the same time in the NGBR according to Coral Reef Watch data. However, the magnitude of DHWs in the NGBR reached 13.59 °C-weeks, more than double the 5.79 °C-weeks maximum in Timor-Leste. Comparison of in situ bleaching surveys and DHWs on the GBR indicated that 2–3 °C-weeks are associated with low levels of bleaching, >4 °C-weeks with 30–40% corals bleached, and >8 °C-weeks with a mean of 70–90% of corals bleached [72,73]. The bleaching severity of the NGBR was greater than 60% for all surveyed reefs in 2016. Although there are no data on the extent or severity of bleaching on reefs in Timor-Leste, DHW data would project mass coral bleaching in Timor-Leste of around 30–40%.
Local dive operators in Timor-Leste reported mass coral bleaching at Jaco Island, the easternmost point of the country, at the end of March. By the end of May, bleaching was affecting the majority (estimated 90%) of Goniopora spp. on Ataúro Island (Figure S5a), massive Porites spp. from 5–18 m at Jaco Island (Figure S5b), and staghorn acroporids at shallower depths in the same area. Bleaching reportedly began at shallow depths and progressively affected corals at greater depths (T. Crean, personal communication, 31 May 2016). The timing of the observed bleaching matched the in situ temperature logger timeline in which the mean monthly temperatures exceeded the MMM in March 2016. The in situ temperatures never exceeded the MMM + 1 °C threshold for DHW accumulation and mass bleaching (Figure 7). The range of temperature recorded by the loggers during December 2015 was from 27 °C to almost 31 °C, indicating reefs did experience elevated temperatures, but not for prolonged periods. The in situ mean temperature began to creep over the MMM and close the gap with the CRWTL data in March and April 2016. The in situ temperature approached MMM + 1 °C in May of 2016 five months after the CRWTL temperatures had been above the bleaching threshold (Figure 7). The in situ data are limited to the Dili and Ataúro Island areas and may not be representative of temperature regimes in the Jaco Island region. Even so, anecdotal reports that most bleaching occurred in May 2016 on both Ataúro and Jaco Islands matches the temperature timeline of the in situ temperature.
Based on the comparison of in situ temperature logger data in Timor-Leste and the satellite-derived SST, CRWTL overestimates the bleaching stress in-country. This is likely due to upwelling at the study sites during the Northwest monsoon (NWM) [85]. The north coast of the Lesser Sunda Islands is a NWM upwelling zone with intensity increasing eastward. Timor-Leste is one of the easternmost islands in the Lesser Sundas (Figure 1) and strong westerly winds (>4 m/s) promote offshore Ekman Mass Transport (3–5 m2/s) on the north coast facilitating coastal upwelling. There were inconsistencies identified between SST and other oceanographic metrics analyzed in the region which was attributed to local oceanographic context and the influence of the Indonesian ThroughFlow (ITF) [85]. The ITF is strongest in the eastern Lesser Sundas [83,84,85,153] with the strongest currents during the austral summer/NWM which may promote mixing of the water column [154]. Vertical profiles also show upwelled less dense water masses approaching the surface around February for a short time period (~1 month) [85] which could be too short to influence remotely sensed SST measurements such as CRWTL. Additionally, ENSO was found to play a dominant role in interannual variability of NWM upwelling with decreased wind speeds and upwelling during El Niño [85,155,156].
The confluence of coastal upwelling during the season of the annual ocean temperature maximum indicates Timor-Leste could serve as a climate refugium for coral reefs against climate change-induced ocean warming as identified in other reef regions [157,158]. However, as discussed, coral bleaching did occur in Timor-Leste during the 2016–2017 marine heatwave, only not to the same extent as other reef regions. As such, cooling from upwelling would provide temporary respite as predicted warming of 2 °C from climate change would push Timorese reefs over the bleaching threshold [157]. There are negative impacts associated with upwelling such as hypercapnic (CO2-rich) upwelled waters impeding the calcification and growth of corals [89,157,159]. This lower calcification rate could affect the ability of Timorese reefs to cope with sea-level rise and recovery from disturbances. There is, however, evidence that calcifying organisms can withstand seasonal increase in acidity through increased heterotrophic feeding [160,161]. Additionally, a study in the Eastern Tropical Pacific found that increased resilience to coral bleaching will potentially outweigh negative impacts to coral physiological from upwelling [157] especially as oceans warm and ENSO events become more frequent and extreme [162,163]. Further research on the complex oceanography of the region, variability of ENSO in a changing climate, and interactions between environmental (light, temperature, CO2, salinity, etc.) and biological (disease, heterotrophy, calcification, etc.) parameters are required to understand and manage the country’s marine resources.

5. Conclusions

The present study set out to understand the nature of both local and global threats to the relatively understudied coral reefs of Timor-Leste. Baseline information on these systems is limited despite the current and future importance of these marine resources to Timor-Leste. Coral reefs on the north coast of Timor-Leste are characterized by high coral cover, as much as 58.2 ± 6.4%. There is concern, however, that sites close to the urban areas of the capital city, Dili, are showing signs of degradation, since there is <5% hard coral cover at 5 m depth at one of the two urban sites. Coral disease and excess nutrients were not identified as significant causes of reef degradation at the sites surveyed in this work, although these aspects of reef health should continue to be monitored. Sites were affected by coral bleaching during a marine heatwave between the two surveys. However, in situ water temperatures were significantly lower than the CRWTL measurements, in line with previous oceanographic work identifying seasonal coastal upwelling in the region [155]. If this is so, healthy shallow reefs in such locations may serve as a climate refugia against ocean warming [157,158] which is corroborated by a global analysis including Timor-Leste as one of the 50 reef regions that are less vulnerable to climate change relative to other reefs [164]. As such, both community and national level coral reef management such as customary law (tara bandu) and climate mitigation policies, respectively, are necessary to ensure biodiversity is maintained while supporting coastal communities in a changing climate [165]. Although tackling climate change at an international level is still important for Timorese coral reefs, coral reef conservation efforts in-country should focus on mitigation of localized anthropogenic impacts such as sedimentation and fishing.

Supplementary Materials

The following supporting information can be downloaded at: https://www.mdpi.com/article/10.3390/oceans3020012/s1, Tables S1–S8; Figures S1–S5. Supplemental materials includes supporting tables, figures, discussion on relevant nutrient data, and images. References [166,167,168,169,170,171,172,173,174,175,176,177,178,179,180,181,182,183,184,185,186,187,188,189,190,191,192,193,194,195,196,197,198,199,200] are cited in the Supplementary Materials.

Author Contributions

Conceptualization, C.J.S.K. and S.D.; methodology, C.J.S.K. and S.D.; formal analysis, C.J.S.K. and S.D.; investigation, C.J.S.K.; resources, C.J.S.K.; data curation, C.J.S.K.; writing—original draft preparation, C.J.S.K.; writing—review and editing, C.J.S.K., S.D. and O.H.-G.; visualization, C.J.S.K.; supervision, S.D., C.R. and O.H.-G.; project administration, C.J.S.K.; funding acquisition, C.J.S.K. and O.H.-G. All authors have read and agreed to the published version of the manuscript.

Funding

This research was funded by the ARC Laureate FL 120100066 to O.H.-G.; the Society of Conservation Biology Small Grant Award to C.J.S.K.; and the Winifred Violet Scott Trust to C.J.S.K.

Institutional Review Board Statement

Not applicable.

Informed Consent Statement

Not applicable.

Data Availability Statement

The data presented in this study are openly available in The University of Queensland eSpace data repository at doi: 10.48610/7278446, record number UQ:7278446. The R code and associated data used for analysis can also be found in a publicly accessible GitHub repository here: https://github.com/seaCatKim/Timor_surveys20152017.

Acknowledgments

We gratefully acknowledge the following sources of funding in support of this research: the Australian Research Council, the Society of Conservation Biology, and the Winifred Violet Scott Trust. We thank the Ministry of Agriculture and Fisheries in Timor-Leste; Conservation International Timor-Leste; volunteers during fieldwork; and the XL CSS project logistical team. We also thank the Compass Boating & Diving and Aquatica crews. Samples were exported from Timor-Leste under export permit No. 455 and imported to Australia under AQIS import permit IP15000663. Finally, we thank those who contributed to the discussions and feedback on drafts.

Conflicts of Interest

The authors declare no conflict of interest. The funders had no role in the design of the study; in the collection, analyses, or interpretation of data; in the writing of the manuscript, or in the decision to publish the results.

References

  1. Burke, L.; Reytar, K.; Spalding, M.; Perry, A. Reefs at Risk Revisited; World Resources Institute: Washington, DC, USA, 2011; p. e0116200. [Google Scholar]
  2. Veron, J.E.N.; DeVantier, L.M.; Turak, E.; Green, A.L.; Kininmonth, S.; Stafford-Smith, M.; Peterson, N. Delineating the Coral Triangle. Galaxea J. Coral Reef Stud. 2009, 11, 91–100. [Google Scholar] [CrossRef] [Green Version]
  3. Harvell, D.; Jordán-Dahlgren, E.; Merkel, S.; Rosenberg, E.; Raymundo, L.; Smith, G.; Weil, E.; Willis, B. Coral Disease, Environmental Drivers, and the Balance Between Coral and Microbial Associates. Oceanography 2007, 20, 172–195. [Google Scholar] [CrossRef] [Green Version]
  4. Hoegh-Guldberg, O.; Mumby, P.J.; Hooten, A.J.; Steneck, R.S.; Greenfield, P.; Gomez, E.; Harvell, C.D.; Sale, P.F.; Edwards, A.J.; Caldeira, K.; et al. Coral Reefs Under Rapid Climate Change and Ocean Acidification. Science 2007, 318, 1737–1742. [Google Scholar] [CrossRef] [PubMed] [Green Version]
  5. Jackson, J.B.C.; Kirby, M.X.; Berger, W.H.; Bjorndal, K.A.; Botsford, L.W.; Bourque, B.J.; Bradbury, R.H.; Cooke, R.; Erlandson, J.; Estes, J.A.; et al. Historical Overfishing and the Recent Collapse of Coastal Ecosystems. Science 2001, 293, 629–637. [Google Scholar] [CrossRef] [Green Version]
  6. Hoegh-Guldberg, O. Climate change, coral bleaching and the future of the world’s coral reefs. Mar. Freshw. Res. 1999, 50, 839–866. [Google Scholar] [CrossRef] [Green Version]
  7. Heron, S.F.; Maynard, J.A.; Van Hooidonk, R.; Eakin, C.M. Warming Trends and Bleaching Stress of the World’s Coral Reefs 1985–2012. Sci. Rep. 2016, 6, 38402. [Google Scholar] [CrossRef] [Green Version]
  8. Eakin, C.M.; Liu, G.; Gomez, A.M.; De La Cour, J.L.; Heron, S.F.; Skirving, W.J.; Geiger, E.F.; Marsh, B.L.; Tirak, K.V.; Strong, A.E.; et al. The Witch Is Dead (?)—Three Years of Global Coral Bleaching 2014–2017. Reef Encount. 2017, 32, 33–38. [Google Scholar]
  9. Hughes, T.P.; Anderson, K.D.; Connolly, S.R.; Heron, S.F.; Kerry, J.T.; Lough, J.M.; Baird, A.H.; Baum, J.K.; Berumen, M.L.; Bridge, T.C.; et al. Spatial and temporal patterns of mass bleaching of corals in the Anthropocene. Science 2018, 359, 80–83. [Google Scholar] [CrossRef] [Green Version]
  10. Ampou, E.E.; Johan, O.; Menkes, C.E.; Niño, F.; Birol, F.; Ouillon, S.; Andréfouët, S. Coral mortality induced by the 2015–2016 El-Niño in Indonesia: The effect of rapid sea level fall. Biogeosciences 2017, 14, 817–826. [Google Scholar] [CrossRef] [Green Version]
  11. Burke, L.; Reytar, K.; Spalding, M.; Perry, A. Reefs at Risk Revisited in the Coral Triangle; World Resources Institute: Washington, DC, USA, 2012; pp. 1–72. [Google Scholar]
  12. ADB. State of the Coral Triangle: Timor-Leste; Asian Development Bank: Mandaluyong City, Philippines, 2014; p. 57. [Google Scholar]
  13. Macaulay, J. Timor Leste: Newest and Poorest of Asian Nations. Geography 2003, 88, 40–46. [Google Scholar]
  14. Barbosa, M.; Booth, S. Timor-Leste’s Fisheries Catches (1950–2009): Fisheries under Different Regimes. In Fisheries Catch Reconstructions: Islands, Part I; Zeller, D., Harper, S., Eds.; Fisheries Centre, University of British Columbia: Vancouver, BC, Canada, 2009; Volume 17, pp. 39–52. [Google Scholar]
  15. Kingsbury, D.; Soares, D.B.; Harris, V.; Fox, J.J.; Bateman, S.; Bergin, A. A Reliable Partner: Strengthening Australia—Timor-Leste Relations. Aust. Strateg. Policy Inst. Ltd. 2011, 39, 68. [Google Scholar]
  16. McWilliam, A. Perspectives on Customary Marine Tenures in East Timor. Asia Pac. J. Anthropol. 2002, 3, 6–32. [Google Scholar] [CrossRef]
  17. Tilley, A.; Burgos, A.; Duarte, A.; Lopes, J.D.R.; Eriksson, H.; Mills, D. Contribution of women’s fisheries substantial, but overlooked, in Timor-Leste. AMBIO 2021, 50, 113–124. [Google Scholar] [CrossRef] [PubMed]
  18. Grantham, R.; Álvarez-Romero, J.G.; Mills, D.J.; Rojas, C.; Cumming, G.S. Spatiotemporal determinants of seasonal gleaning. People Nat. 2021, 3, 376–390. [Google Scholar] [CrossRef]
  19. RDTL. Timor-Leste Strategic Development Plan 2011–2030; Republica Democratica de Timor-Leste: Dili, Timor-Leste, 2011; pp. 1–215.
  20. JICA. The Study on Community-Based Integrated Watershed Management in Laclo and Comoro River Basins in the Democratic Republic of Timor-Leste; Japan International Cooperation Agency: Tokyo, Japan, 2010; pp. 1–43.
  21. Sandlund, O.T.; Bryceson, I.; de Carvalho, D.; Rio, N.; da Silva, J.; Silva, M.I. Assessing Environmental Needs and Priorities in Timor-Leste; United Nations Development Programme (UNDP) Commissioned Paper; UNDP: New York, NY, USA, 2001. [Google Scholar]
  22. Alongi, D.M.; Amaral, A.; de Carvalho, N.; McWilliam, A.; Rouwenhorst, J.; Tirendi, F.; Trott, L.; Wasson, R.J. River Catchments and Marine Productivity in Timor Leste: Caraulun and Laclo Catchments; South and North Coasts—Final Report; Ministry of Agriculture & Fisheries, Government of Timor Leste: Dili, Timor-Leste, 2012.
  23. Aronson, R.; Precht, W.F. White-band disease and the changing face of Caribbean coral reefs. Hydrobiologia 2001, 460, 25–38. [Google Scholar] [CrossRef]
  24. Myers, R.; Raymundo, L. Coral disease in Micronesian reefs: A link between disease prevalence and host abundance. Dis. Aquat. Org. 2009, 87, 97–104. [Google Scholar] [CrossRef] [Green Version]
  25. Weil, E.; Irikawa, A.; Casareto, B.; Suzuki, Y. Extended geographic distribution of several Indo-Pacific coral reef diseases. Dis. Aquat. Org. 2012, 98, 163–170. [Google Scholar] [CrossRef] [Green Version]
  26. Willis, B.L.; Page, C.A.; Dinsdale, E.A. Coral Disease on the Great Barrier Reef. In Coral Health and Disease; Springer: Berlin/Heidelberg, Germnay, 2004; pp. 69–104. [Google Scholar] [CrossRef]
  27. Beeden, R.; Willis, B.L.; Page, C.A.; Weil, E. Underwater Cards for Assessing Coral Health on Indo-Pacific Reefs; Coral Reef Targeted Research and Capacity Building for Management Program, Currie Communications: Melbourne, Australia, 2008. [Google Scholar]
  28. Raymundo, L.J.; Couch, C.S.; Bruckner, A.W.; Harvell, C.D. Coral Disease Handbook Guidelines for Assessment: Guidelines for Assessment Monitoring and Management; Currie Communications: Melbourne, Australia, 2008; ISBN 978-1-921317-01-9. [Google Scholar]
  29. Bruno, J.F.; Selig, E.R.; Casey, K.; Page, C.A.; Willis, B.L.; Harvell, C.D.; Sweatman, H.; Melendy, A.M. Thermal Stress and Coral Cover as Drivers of Coral Disease Outbreaks. PLoS Biol. 2007, 5, e124. [Google Scholar] [CrossRef]
  30. Pollock, F.J.; Lamb, J.; Field, S.N.; Heron, S.; Schaffelke, B.; Shedrawi, G.; Bourne, D.G.; Willis, B.L. Sediment and Turbidity Associated with Offshore Dredging Increase Coral Disease Prevalence on Nearby Reefs. PLoS ONE 2014, 9, e102498. [Google Scholar] [CrossRef] [Green Version]
  31. Raymundo, L.J.; Halford, A.R.; Maypa, A.P.; Kerr, A.M. Functionally diverse reef-fish communities ameliorate coral disease. Proc. Natl. Acad. Sci. USA 2009, 106, 17067–17070. [Google Scholar] [CrossRef] [Green Version]
  32. Yoshioka, R.M.; Kim, C.J.; Tracy, A.M.; Most, R.; Harvell, C.D. Linking sewage pollution and water quality to spatial patterns of Porites lobata growth anomalies in Puako, Hawaii. Mar. Pollut. Bull. 2016, 104, 313–321. [Google Scholar] [CrossRef] [PubMed] [Green Version]
  33. Fabricius, K.E. Effects of terrestrial runoff on the ecology of corals and coral reefs: Review and synthesis. Mar. Pollut. Bull. 2005, 50, 125–146. [Google Scholar] [CrossRef] [PubMed]
  34. Aronson, R.B.; Macintyre, I.G.; Wapnick, C.M.; O’Neill, M.W. Phase Shifts, Alternative States, and the Unprecedented Convergence of Two Reef Systems. Ecology 2004, 85, 1876–1891. [Google Scholar] [CrossRef]
  35. Cleary, D.F.R.; Suharsono; Hoeksema, B.W. Coral diversity across a disturbance gradient in the Pulau Seribu reef complex off Jakarta, Indonesia. In Marine, Freshwater, and Wetlands Biodiversity Conservation; Hawksworth, D.L., Bull, A.T., Eds.; Springer: Dordrecht, The Netherlands, 2007; pp. 285–306. [Google Scholar]
  36. Baker, D.; MacAvoy, S.; Kim, K. Relationship between water quality, Δ15N, and aspergillosis of Caribbean sea fan corals. Mar. Ecol. Prog. Ser. 2007, 343, 123–130. [Google Scholar] [CrossRef] [Green Version]
  37. Thurber, R.L.V.; Burkepile, D.E.; Fuchs, C.; Shantz, A.; McMinds, R.; Zaneveld, J.R. Chronic nutrient enrichment increases prevalence and severity of coral disease and bleaching. Glob. Change Biol. 2013, 20, 544–554. [Google Scholar] [CrossRef] [PubMed]
  38. Voss, J.D.; Richardson, L.L. Nutrient enrichment enhances black band disease progression in corals. Coral Reefs 2006, 25, 569–576. [Google Scholar] [CrossRef]
  39. Wagner, D.; Kramer, P.; Van Woesik, R. Species composition, habitat, and water quality influence coral bleaching in southern Florida. Mar. Ecol. Prog. Ser. 2010, 408, 65–78. [Google Scholar] [CrossRef] [Green Version]
  40. Wooldridge, S.A.; Done, T.J. Improved water quality can ameliorate effects of climate change on corals. Ecol. Appl. 2009, 19, 1492–1499. [Google Scholar] [CrossRef]
  41. Amato, D.W.; Bishop, J.M.; Glenn, C.R.; Dulai, H.; Smith, C.M. Impact of Submarine Groundwater Discharge on Marine Water Quality and Reef Biota of Maui. PLoS ONE 2016, 11, e0165825. [Google Scholar] [CrossRef] [Green Version]
  42. Dinsdale, E.A.; Pantos, O.; Smriga, S.; Edwards, R.; Angly, F.; Wegley, L.; Hatay, M.; Hall, D.; Brown, E.; Haynes, M.; et al. Microbial Ecology of Four Coral Atolls in the Northern Line Islands. PLoS ONE 2008, 3, e1584. [Google Scholar] [CrossRef] [Green Version]
  43. Osawa, Y.; Fujita, K.; Umezawa, Y.; Kayanne, H.; Ide, Y.; Nagaoka, T.; Miyajima, T.; Yamano, H. Human impacts on large benthic foraminifers near a densely populated area of Majuro Atoll, Marshall Islands. Mar. Pollut. Bull. 2010, 60, 1279–1287. [Google Scholar] [CrossRef]
  44. Smith, J.; Smith, C.; Hunter, C. An experimental analysis of the effects of herbivory and nutrient enrichment on benthic community dynamics on a Hawaiian reef. Coral Reefs 2001, 19, 332–342. [Google Scholar] [CrossRef]
  45. Aeby, G.S.; Williams, G.J.; Franklin, E.C.; Kenyon, J.; Cox, E.F.; Coles, S.; Work, T.M. Patterns of Coral Disease across the Hawaiian Archipelago: Relating Disease to Environment. PLoS ONE 2011, 6, e20370. [Google Scholar] [CrossRef] [PubMed]
  46. Bruno, J.F.; Petes, L.E.; Harvell, C.D.; Hettinger, A. Nutrient enrichment can increase the severity of coral diseases. Ecol. Lett. 2003, 6, 1056–1061. [Google Scholar] [CrossRef]
  47. Kaczmarsky, L.; Richardson, L.L. Do elevated nutrients and organic carbon on Philippine reefs increase the prevalence of coral disease? Coral Reefs 2011, 30, 253–257. [Google Scholar] [CrossRef]
  48. Costanzo, S.; O’Donohue, M.; Dennison, W.; Loneragan, N.; Thomas, M. A New Approach for Detecting and Mapping Sewage Impacts. Mar. Pollut. Bull. 2001, 42, 149–156. [Google Scholar] [CrossRef]
  49. Dailer, M.L.; Ramey, H.L.; Saephan, S.; Smith, C.M. Algal Δ15N values detect a wastewater effluent plume in nearshore and offshore surface waters and three-dimensionally model the plume across a coral reef on Maui, Hawai‘i, USA. Mar. Pollut. Bull. 2012, 64, 207–213. [Google Scholar] [CrossRef]
  50. Lapointe, B.E.; Barile, P.J.; Littler, M.M.; Littler, D.S. Macroalgal blooms on southeast Florida coral reefs: II. Cross-shelf discrimination of nitrogen sources indicates widespread assimilation of sewage nitrogen. Harmful Algae 2005, 4, 1106–1122. [Google Scholar] [CrossRef]
  51. Lapointe, B.E.; Barile, P.J.; Matzie, W.R. Anthropogenic Nutrient Enrichment of Seagrass and Coral Reef Communities in the Lower Florida Keys: Discrimination of Local versus Regional Nitrogen Sources. J. Exp. Mar. Biol. Ecol. 2004, 308, 23–58. [Google Scholar] [CrossRef]
  52. Lin, H.-J.; Wu, C.; Kao, S.; Kao, W.; Meng, P. Mapping anthropogenic nitrogen through point sources in coral reefs using Δ15N in macroalgae. Mar. Ecol. Prog. Ser. 2007, 335, 95–109. [Google Scholar] [CrossRef]
  53. Moynihan, M.; Baker, D.M.; Mmochi, A.J. Isotopic and microbial indicators of sewage pollution from Stone Town, Zanzibar, Tanzania. Mar. Pollut. Bull. 2012, 64, 1348–1355. [Google Scholar] [CrossRef] [PubMed]
  54. Redding, J.E.; Myers-Miller, R.L.; Baker, D.M.; Fogel, M.; Raymundo, L.J.; Kim, K. Link between sewage-derived nitrogen pollution and coral disease severity in Guam. Mar. Pollut. Bull. 2013, 73, 57–63. [Google Scholar] [CrossRef] [PubMed]
  55. Savage, C.; Elmgren, R. Macroalgal (fucus vesiculosus) Δ15n values trace decrease in sewage influence. Ecol. Appl. 2004, 14, 517–526. [Google Scholar] [CrossRef]
  56. Sutherland, K.P.; Porter, J.W.; Turner, J.W.; Thomas, B.J.; Looney, E.E.; Luna, T.P.; Meyers, M.K.; Futch, J.C.; Lipp, E.K. Human sewage identified as likely source of white pox disease of the threatened Caribbean elkhorn coral, Acropora palmata. Environ. Microbiol. 2010, 12, 1122–1131. [Google Scholar] [CrossRef]
  57. Umezawa, Y.; Miyajima, T.; Kayanne, H.; Koike, I. Significance of groundwater nitrogen discharge into coral reefs at Ishigaki Island, southwest of Japan. Coral Reefs 2002, 21, 346–356. [Google Scholar] [CrossRef]
  58. Fry, B.; Baltz, D.M.; Benfield, M.C.; Fleeger, J.W.; Gace, A.; Haas, H.L.; Quiñones-Rivera, Z.J. Stable isotope indicators of movement and residency for brown shrimp (Farfantepenaeus aztecus) in coastal Louisiana marshscapes. Estuaries 2003, 26, 82–97. [Google Scholar] [CrossRef]
  59. Dailer, M.L.; Knox, R.S.; Smith, J.E.; Napier, M.; Smith, C.M. Using Δ15N values in algal tissue to map locations and potential sources of anthropogenic nutrient inputs on the island of Maui, Hawai‘i, USA. Mar. Pollut. Bull. 2010, 60, 655–671. [Google Scholar] [CrossRef] [PubMed]
  60. Gartner, A.; Lavery, P.; Smit, A. Use of d15N signatures of different functional forms of macroalgae and filter-feeders to reveal temporal and spatial patterns in sewage dispersal. Mar. Ecol. Prog. Ser. 2002, 235, 63–73. [Google Scholar] [CrossRef]
  61. Heaton, T. Isotopic studies of nitrogen pollution in the hydrosphere and atmosphere: A review. Chem. Geol. Isot. Geosci. Sect. 1986, 59, 87–102. [Google Scholar] [CrossRef]
  62. Tucker, J.; Sheats, N.; Giblin, A.; Hopkinson, C.; Montoya, J. Using stable isotopes to trace sewage-derived material through Boston Harbor and Massachusetts Bay. Mar. Environ. Res. 1999, 48, 353–375. [Google Scholar] [CrossRef]
  63. Montoya, J.P.; Carpenter, E.J.; Capone, D.G. Nitrogen fixation and nitrogen isotope abundances in zooplankton of the oligotrophic North Atlantic. Limnol. Oceanogr. 2002, 47, 1617–1628. [Google Scholar] [CrossRef] [Green Version]
  64. Huang, H.; Li, X.B.; Titlyanov, E.A.; Ye, C.; Titlyanova, T.V.; Guo, Y.P.; Zhang, J. Linking macroalgal Δ15N-values to nitrogen sources and effects of nutrient stress on coral condition in an upwelling region. Bot. Mar. 2013, 56, 471–480. [Google Scholar] [CrossRef]
  65. Lamb, K.; Swart, P.; Altabet, M. Nitrogen and Carbon Isotopic Systematics of the Florida Reef Tract. Bull. Mar. Sci. 2012, 88, 119–146. [Google Scholar] [CrossRef] [Green Version]
  66. Leichter, J.J.; Wankel, S.; Paytan, A.; Hanson, K.; Miller, S.; Altabet, M.A. Nitrogen and oxygen isotopic signatures of subsurface nitrate seaward of the Florida Keys reef tract. Limnol. Oceanogr. 2007, 52, 1258–1267. [Google Scholar] [CrossRef] [Green Version]
  67. Sigman, D.M.; Altabet, M.A.; McCorkle, D.C.; Francois, R.; Fischer, G.E. The Δ15N of nitrate in the Southern Ocean: Nitrogen cycling and circulation in the ocean interior. J. Geophys. Res. Earth Surf. 2000, 105, 19599–19614. [Google Scholar] [CrossRef]
  68. Firstater, F.N.; Hidalgo, F.J.; Lomovasky, B.; Tarazona, J.; Flores, G.; Iribarne, O.O. Coastal upwelling may overwhelm the effect of sewage discharges in rocky intertidal communities of the Peruvian coast. Mar. Freshw. Res. 2010, 61, 309–319. [Google Scholar] [CrossRef]
  69. Radice, V.Z.; Hoegh-Guldberg, O.; Fry, B.; Fox, M.D.; Dove, S.G. Upwelling as the major source of nitrogen for shallow and deep reef-building corals across an oceanic atoll system. Funct. Ecol. 2019, 33, 1120–1134. [Google Scholar] [CrossRef]
  70. Radice, V.Z.; Fry, B.; Dove, S.G.; Hoegh-Guldberg, O. Biogeochemical variability and trophic status of reef water column following a coral bleaching event. Coral Reefs 2021, 40, 1–7. [Google Scholar] [CrossRef]
  71. NOAA Coral Reef Watch NOAA Coral Reef Watch Version 3.0 Daily Gobal 50km Satellite Virtual Station Time Series Data for Timor-Leste, 1 August 2015–31 August 2017. Available online: https://coralreefwatch.noaa.gov/product/vs/timeseries/coral_triangle.php#timor_leste (accessed on 15 September 2017).
  72. Hughes, T.P.; Kerry, J.T.; Álvarez-Noriega, M.; Álvarez-Romero, J.G.; Anderson, K.D.; Baird, A.H.; Babcock, R.C.; Beger, M.; Bellwood, D.R.; Berkelmans, R.; et al. Global warming and recurrent mass bleaching of corals. Nature 2017, 543, 373–377. [Google Scholar] [CrossRef]
  73. Strong, A.E.; Liu, G.; Skirving, W.; Eakin, C.M. NOAA’s Coral Reef Watch program from satellite observations. Ann. GIS 2011, 17, 83–92. [Google Scholar] [CrossRef]
  74. Liu, G.; Strong, A.E.; Skirving, W.; Arzayus, L.F. Overview of NOAA Coral Reef Watch Program’s Near-Real-Time Satellite Global Coral Bleaching Monitoring Activities. In Proceedings of the 10th International Coral Reef Symposium, Okinawa, Japan; 2006; pp. 1783–1793. [Google Scholar]
  75. Baird, A.H.; Marshall, P.A. Mortality, growth and reproduction in scleractinian corals following bleaching on the Great Barrier Reef. Mar. Ecol. Prog. Ser. 2002, 237, 133–141. [Google Scholar] [CrossRef]
  76. Marshall, P.A.; Baird, A.H. Bleaching of corals on the Great Barrier Reef: Differential susceptibilities among taxa. Coral Reefs 2000, 19, 155–163. [Google Scholar] [CrossRef]
  77. Harvell, C.D.; Kim, K.; Burkholder, J.M.; Colwell, R.R.; Epstein, P.R.; Grimes, D.J.; Hofmann, E.E.; Lipp, E.K.; Osterhaus, A.D.M.E.; Overstreet, R.M.; et al. Emerging Marine Diseases--Climate Links and Anthropogenic Factors. Science 1999, 285, 1505–1510. [Google Scholar] [CrossRef] [PubMed] [Green Version]
  78. Harvell, C.D.; Mitchell, C.E.; Ward, J.R.; Altizer, S.; Dobson, A.P.; Ostfeld, R.S.; Samuel, M.D. Climate Warming and Disease Risks for Terrestrial and Marine Biota. Science 2002, 296, 2158–2162. [Google Scholar] [CrossRef] [PubMed] [Green Version]
  79. Brodnicke, O.B.; Bourne, D.G.; Heron, S.F.; Pears, R.J.; Stella, J.S.; Smith, H.A.; Willis, B.L. Unravelling the links between heat stress, bleaching and disease: Fate of tabular corals following a combined disease and bleaching event. Coral Reefs 2019, 38, 591–603. [Google Scholar] [CrossRef]
  80. van der Zande, R.M.; Achlatis, M.; Bender-Champ, D.; Kubicek, A.; Dove, S.; Hoegh-Guldberg, O. Paradise lost: End-of-century warming and acidification under business-as-usual emissions have severe consequences for symbiotic corals. Glob. Change Biol. 2020, 26, 2203–2219. [Google Scholar] [CrossRef]
  81. Gordon, A.; Sprintall, J.; Van Aken, H.; Susanto, R.D.; Wijffels, S.; Molcard, R.; Ffield, A.; Pranowo, W.; Wirasantosa, S. The Indonesian throughflow during 2004–2006 as observed by the INSTANT program. Dyn. Atmos. Oceans 2010, 50, 115–128. [Google Scholar] [CrossRef]
  82. Taufiqurrahman, E.; Wahyudi, A.J.; Masumoto, Y. The Indonesian Throughflow and its Impact on Biogeochemistry in the Indonesian Seas. ASEAN J. Sci. Technol. Dev. 2020, 37, 29–35. [Google Scholar] [CrossRef]
  83. Sprintall, J.; Wijffels, S.; Molcard, R.; Jaya, I. Direct estimates of the Indonesian Throughflow entering the Indian Ocean: 2004–2006. J. Geophys. Res. Earth Surf. 2009, 114, 114. [Google Scholar] [CrossRef]
  84. Susanto, D.; Wei, Z.; Adi, R.; Zhang, Q.; Fang, G.; Fan, B.; Supangat, A.; Agustiadi, T.; Li, S.; Trenggono, M.; et al. Oceanography Surrounding Krakatau Volcano in the Sunda Strait, Indonesia. Oceanography 2016, 29, 264–272. [Google Scholar] [CrossRef] [Green Version]
  85. Wirasatriya, A.; Susanto, R.D.; Kunarso, K.; Jalil, A.R.; Ramdani, F.; Puryajati, A.D. Northwest monsoon upwelling within the Indonesian seas. Int. J. Remote Sens. 2021, 42, 5433–5454. [Google Scholar] [CrossRef]
  86. RDTL. Population and Housing Census 2015 Preliminary Results; Democratic Republic of Timor-Leste (RDTL): Dili, Timor-Leste, 2015; p. 39.
  87. DNMG; BOM; CSIRO. Current and Future Climate of Timor-Leste; Timor-Leste National Directorate of Meteorology and Geophysics: Dili, Timor-Leste, 2015; pp. 1–8.
  88. United Nations Development Program; Democratic Republic of Timor-Leste. National Coastal Vulnerability Assessment and Designing of Integrated Coastal Management and Adaptation Strategic Plan for Timor-Leste; United Nations Development Programme: Dili, Timor-Leste, 2018; p. 73.
  89. PIFSC. Interdisciplinary Baseline Ecosystem Assessment Surveys to Inform Ecosystem-Based Management Planning in Timor-Leste: Final Report; NOAA Pacific Islands Fisheries Science Center: Honolulu, HI, USA, 2017; p. 234.
  90. English, S.; Wilkinson, C.; Baker, V. Survey Manual for Tropical Marine Resources; Australian Institute of Marine Science: Townsville, Australia, 1997.
  91. Zvuloni, A.; Armoza-Zvuloni, R.; Loya, Y. Structural deformation of branching corals associated with the vermetid gastropod Dendropoma maxima. Mar. Ecol. Prog. Ser. 2008, 363, 103–108. [Google Scholar] [CrossRef]
  92. The R Core Team. R: A Language and Environment for Statistical Computing; R Foundation for Statistical Computing: Vienna, Austria, 2020. [Google Scholar]
  93. Anderson, M.; Gorley, R.N.; Clarke, K. PERMANOVA+ for PRIMER: Guide to Software and Statistical Methods; PRIMER-E Ltd.: Plymouth, UK, 2008. [Google Scholar]
  94. Clarke, K.R.; Gorley, R.N. Getting Started with PRIMER V7; PRIMER-E: Plymouth, UK, 2015. [Google Scholar]
  95. Fox, J.; Weisberg, S. An {R} Companion to Applied Regression; Sage: Thousand Oaks, CA, USA, 2019. [Google Scholar]
  96. Lenth, R. Emmeans: Estimated Marginal Means, Aka Least-Squares Means. 2020. Available online: https://cran.r-project.org/web/packages/emmeans/index.html (accessed on 6 March 2022).
  97. Pinheiro, J.; Bates, D.; Debroy, S.; Sarkar, D.; R Core Team. Nlme: Linear and Nonlinear Mixed Effects Models; R Core Team: Vienna, Austria, 2020. [Google Scholar]
  98. Brown, K.; Bender-Champ, D.; Bryant, D.E.; Dove, S.; Hoegh-Guldberg, O. Human activities influence benthic community structure and the composition of the coral-algal interactions in the central Maldives. J. Exp. Mar. Biol. Ecol. 2017, 497, 33–40. [Google Scholar] [CrossRef]
  99. Bruno, J.F.; Valdivia, A. Coral reef degradation is not correlated with local human population density. Sci. Rep. 2016, 6, 29778. [Google Scholar] [CrossRef] [Green Version]
  100. Smith, J.E.; Brainard, R.; Carter, A.; Grillo, S.; Edwards, C.; Harris, J.; Lewis, L.; Obura, D.; Rohwer, F.; Sala, E.; et al. Re-evaluating the health of coral reef communities: Baselines and evidence for human impacts across the central Pacific. Proc. R. Soc. B Boil. Sci. 2016, 283, 20151985. [Google Scholar] [CrossRef]
  101. Wedding, L.M.; Lecky, J.; Gove, J.M.; Walecka, H.R.; Donovan, M.K.; Williams, G.J.; Jouffray, J.-B.; Crowder, L.B.; Erickson, A.; Falinski, K.; et al. Advancing the integration of spatial data to map human and natural drivers on coral reefs. PLoS ONE 2018, 13, e0189792. [Google Scholar] [CrossRef] [Green Version]
  102. Erdmann, M.V.; Mohan, C. (Eds.) A Rapid Marine Biological Assessment of Timor-Leste, RAP Bulletin of Biological Assessment 66; Coral Triangle Support Partnership, Conservation International: Dili, Timor-Leste, 2013; ISBN 978-1-934151-56-3. [Google Scholar]
  103. Boggs, G.; Edyvane, K.; de Carvalho, N.; Penny, S.; Rouwenhorst, J.; Brocklehurst, P.; Cowie, I.; Barreto, C.; Amaral, A.; Monteiro, J.; et al. Marine and Coastal Habitat Mapping in Timor Leste (North Coast)—Final Report; Ministry of Agriculture & Fisheries, Government of Timor Leste: Dili, Timor-Leste, 2012.
  104. Kim, C.J.S. Drivers of Coral Reef Composition, Cryptic Marine Biodiversity, and Coral Health along the North Coast of Timor-Leste. Ph.D. Thesis, The University of Queensland, St. Lucia, Australia, 2021. [Google Scholar]
  105. Teh, L.S.L.; Teh, L.C.L.; Sumaila, U.R. A Global Estimate of the Number of Coral Reef Fishers. PLoS ONE 2013, 8, e65397. [Google Scholar] [CrossRef]
  106. Da Costa, M.D.; Lopes, M.; Ximenes, A.; Ferreira, A.D.R.; Spyckerelle, L.; Williams, R.; Nesbitt, H.; Erskine, W. Household food insecurity in Timor-Leste. Food Secur. 2013, 5, 83–94. [Google Scholar] [CrossRef]
  107. Cesar, H.; Burke, L.; Pet-Soede, L. The Economics of Worldwide Coral Reef Degradation; Cesar Environmental Economics Consulting, Arnhem, and WWF-Netherlands: Arnhem, The Netherlands, 2003; p. 23. [Google Scholar]
  108. Gillett, R. Fisheries in the Economies of the Pacific Island Countries and Territories; Asia Development Bank: Mandaluyong, Philippines, 2009. [Google Scholar]
  109. Andréfouët, S.; Guillaume, M.M.M.; Delval, A.; Rasoamanendrika, F.M.A.; Blanchot, J.; Bruggemann, J.H. Fifty years of changes in reef flat habitats of the Grand Récif of Toliara (SW Madagascar) and the impact of gleaning. Coral Reefs 2013, 32, 757–768. [Google Scholar] [CrossRef]
  110. Ashworth, J.S.; Ormond, R.F.; Sturrock, H.T. Effects of reef-top gathering and fishing on invertebrate abundance across take and no-take zones. J. Exp. Mar. Biol. Ecol. 2004, 303, 221–242. [Google Scholar] [CrossRef]
  111. Woodland, D.; Hooper, J. The effect of human trampling on coral reefs. Biol. Conserv. 1977, 11, 1–4. [Google Scholar] [CrossRef]
  112. Ayling, A.M.; Ayling, A.L.; Edyvane, K.S.; Penny, S.; de Carvalho, N.; Fernandes, A.; Amaral, A.L. Preliminary Biological Resource Survey of Fringing Reefs in the Proposed Nino Konis Santana Marine Park, Timor-Leste. Rep. North. Territ. Dep. Nat. Resour. Environ. Arts. Palmerst. North. Territ. 2009, 830. [Google Scholar]
  113. Maynard, J.A.; Van Hooidonk, R.; Eakin, C.M.; Puotinen, M.; Garren, M.; Williams, G.J.; Heron, S.; Lamb, J.; Weil, E.; Willis, B.L.; et al. Projections of climate conditions that increase coral disease susceptibility and pathogen abundance and virulence. Nat. Clim. Change 2015, 5, 688–694. [Google Scholar] [CrossRef]
  114. Amaro, C.; Biosca, E.G. Vibrio vulnificus biotype 2, pathogenic for eels, is also an opportunistic pathogen for humans. Appl. Environ. Microbiol. 1996, 62, 1454–1457. [Google Scholar] [CrossRef] [PubMed] [Green Version]
  115. Cervino, J.M.; Hayes, R.L.; Polson, S.W.; Polson, S.C.; Goreau, T.J.; Martinez, R.J.; Smith, G.W. Relationship of Vibrio Species Infection and Elevated Temperatures to Yellow Blotch/Band Disease in Caribbean Corals. Appl. Environ. Microbiol. 2004, 70, 6855–6864. [Google Scholar] [CrossRef] [Green Version]
  116. Linkous, D.A.; Oliver, J.D. Pathogenesis ofVibrio vulnificus. FEMS Microbiol. Lett. 1999, 174, 207–214. [Google Scholar] [CrossRef]
  117. Milton, D.L.; Norqvist, A.; Wolf-Watz, H. Cloning of a metalloprotease gene involved in the virulence mechanism of Vibrio anguillarum. J. Bacteriol. 1992, 174, 7235–7244. [Google Scholar] [CrossRef] [Green Version]
  118. Sussman, M.; Willis, B.L.; Victor, S.; Bourne, D.G. Coral Pathogens Identified for White Syndrome (WS) Epizootics in the Indo-Pacific. PLoS ONE 2008, 3, e2393. [Google Scholar] [CrossRef] [Green Version]
  119. Ushijima, B.; Videau, P.; Burger, A.H.; Shore, A.; Runyon, C.M.; Sudek, M.; Aeby, G.S.; Callahan, S.M. Vibrio coralliilyticus Strain OCN008 Is an Etiological Agent of Acute Montipora White Syndrome. Appl. Environ. Microbiol. 2014, 80, 2102–2109. [Google Scholar] [CrossRef] [Green Version]
  120. Ushijima, B.; Smith, A.; Aeby, G.S.; Callahan, S.M. Vibrio owensii Induces the Tissue Loss Disease Montipora White Syndrome in the Hawaiian Reef Coral Montipora capitata. PLoS ONE 2012, 7, e46717. [Google Scholar] [CrossRef] [Green Version]
  121. Aeby, G.S.; Ross, M.; Williams, G.J.; Lewis, T.D.; Work, T.M. Disease dynamics of Montipora white syndrome within Kaneohe Bay, Oahu, Hawaii: Distribution, seasonality, virulence, and transmissibility. Dis. Aquat. Org. 2010, 91, 1–8. [Google Scholar] [CrossRef] [PubMed] [Green Version]
  122. Haapkylä, J.; Unsworth, R.; Seymour, A.; Melbourne-Thomas, J.; Flavell, M.; Willis, B.; Smith, D. Spatio-temporal coral disease dynamics in the Wakatobi Marine National Park, South-East Sulawesi, Indonesia. Dis. Aquat. Org. 2009, 87, 105–115. [Google Scholar] [CrossRef] [PubMed] [Green Version]
  123. Aeby, G.S. Outbreak of coral disease in the Northwestern Hawaiian Islands. Coral Reefs 2005, 24, 481. [Google Scholar] [CrossRef]
  124. Roff, G.; Hoegh-Guldberg, O.; Fine, M. Intra-colonial response to Acroporid “white syndrome” lesions in tabular Acropora spp. (Scleractinia). Coral Reefs 2006, 25, 255–264. [Google Scholar] [CrossRef]
  125. Haapkylä, J.; Seymour, A.; Trebilco, J.; Smith, D. Coral disease prevalence and coral health in the Wakatobi Marine Park, south-east Sulawesi, Indonesia. J. Mar. Biol. Assoc. UK 2007, 87, 403–414. [Google Scholar] [CrossRef]
  126. Johan, O.; Bengen, D.G.; Zamani, N.P.; Suharsono; Sweet, M. The Distribution and Abundance of Black Band Disease and White Syndrome in Kepulauan Seribu, Indonesia. HAYATI J. Biosci. 2015, 22, 105–112. [Google Scholar] [CrossRef] [Green Version]
  127. Muller, E.M.; Raymundo, L.J.; Willis, B.L.; Haapkylä, J.; Yusuf, S.; Wilson, J.R.; Harvell, D.C. Coral Health and Disease in the Spermonde Archipelago and Wakatobi, Sulawesi. J. Indones. Coral Reefs 2012, 1, 147–159. [Google Scholar]
  128. Muller, E.M.; Van Woesik, R. Caribbean coral diseases: Primary transmission or secondary infection? Glob. Chang. Biol. 2012, 18, 3529–3535. [Google Scholar] [CrossRef]
  129. Aeby, G.S.; Bourne, D.G.; Wilson, B.; Work, T. Coral Diversity and the Severity of Disease Outbreaks: A Cross-Regional Comparison ofAcroporaWhite Syndrome in a Species-Rich Region (American Samoa) with a Species-Poor Region (Northwestern Hawaiian Islands). J. Mar. Biol. 2011, 2011, 490198. [Google Scholar] [CrossRef] [Green Version]
  130. Elton, C.S. The Biology of Invasions by Animals and Plants; John Wiley and Sons: New York, NY, USA, 1958. [Google Scholar]
  131. Plank, J.E. Plant Diseases-Epidemics and Control; Academic Press: New York, NY, USA, 1963. [Google Scholar]
  132. Hobbs, J.-P.A.; Frisch, A.J.; Newman, S.; Wakefield, C.B. Selective Impact of Disease on Coral Communities: Outbreak of White Syndrome Causes Significant Total Mortality of Acropora Plate Corals. PLoS ONE 2015, 10, e0132528. [Google Scholar] [CrossRef] [Green Version]
  133. Sheridan, C.; Grosjean, P.; Leblud, J.; Palmer, C.V.; Kushmaro, A.; Eeckhaut, I. Sedimentation rapidly induces an immune response and depletes energy stores in a hard coral. Coral Reefs 2014, 33, 1067–1076. [Google Scholar] [CrossRef]
  134. Heron, S.F.; Willis, B.L.; Skirving, W.J.; Eakin, C.M.; Page, C.A.; Miller, I.R. Summer Hot Snaps and Winter Conditions: Modelling White Syndrome Outbreaks on Great Barrier Reef Corals. PLoS ONE 2010, 5, e12210. [Google Scholar] [CrossRef] [Green Version]
  135. Altizer, S.; Ostfeld, R.S.; Johnson, P.T.J.; Kutz, S.; Harvell, C.D. Climate Change and Infectious Diseases: From Evidence to a Predictive Framework. Science 2013, 341, 514–519. [Google Scholar] [CrossRef] [PubMed] [Green Version]
  136. Alongi, D.M.; da Silva, M.; Wasson, R.J.; Wirasantosa, S. Sediment discharge and export of fluvial carbon and nutrients into the Arafura and Timor Seas: A regional synthesis. Mar. Geol. 2013, 343, 146–158. [Google Scholar] [CrossRef]
  137. Barneah, O.; Brickner, I.; Hooge, M.; Weis, V.; LaJeunesse, T.; Benayahu, Y. Three party symbiosis: Acoelomorph worms, corals and unicellular algal symbionts in Eilat (Red Sea). Mar. Biol. 2007, 151, 1215–1223. [Google Scholar] [CrossRef]
  138. Naumann, M.S.; Mayr, C.; Struck, U.; Wild, C. Coral mucus stable isotope composition and labeling: Experimental evidence for mucus uptake by epizoic acoelomorph worms. Mar. Biol. 2010, 157, 2521–2531. [Google Scholar] [CrossRef]
  139. Wijgerde, T.; Schots, P.; Van Onselen, E.; Janse, M.; Karruppannan, E.; Verreth, J.; Osinga, R. Epizoic acoelomorph flatworms impair zooplankton feeding by the scleractinian coral Galaxea fascicularis. Biol. Open 2013, 2, 10–17. [Google Scholar] [CrossRef] [Green Version]
  140. McClanahan, T. Primary succession of coral-reef algae: Differing patterns on fished versus unfished reefs. J. Exp. Mar. Biol. Ecol. 1997, 218, 77–102. [Google Scholar] [CrossRef]
  141. Vermeij, M.J.A.; Van Moorselaar, I.; Engelhard, S.; Hörnlein, C.; Vonk, S.M.; Visser, P.M. The Effects of Nutrient Enrichment and Herbivore Abundance on the Ability of Turf Algae to Overgrow Coral in the Caribbean. PLoS ONE 2010, 5, e14312. [Google Scholar] [CrossRef] [Green Version]
  142. Leichter, J.J.; Stewart, H.L.; Miller, S.L. Episodic nutrient transport to Florida coral reefs. Limnol. Oceanogr. 2003, 48, 1394–1407. [Google Scholar] [CrossRef] [Green Version]
  143. Risk, M.J.; Lapointe, B.; Sherwood, O.A.; Bedford, B.J. The use of Δ15N in assessing sewage stress on coral reefs. Mar. Pollut. Bull. 2009, 58, 793–802. [Google Scholar] [CrossRef] [PubMed]
  144. Burgett, J. Summary of Algal Community Changes Observed on the Southwest Arm of Rose Atoll from 1995–2002; USFWS: Honolulu, HI, USA, 2012.
  145. Thacker, R.; Ginsburg, D.; Paul, V. Effects of herbivore exclusion and nutrient enrichment on coral reef macroalgae and cyanobacteria. Coral Reefs 2001, 19, 318–329. [Google Scholar] [CrossRef]
  146. Littler, M.M.; Littler, D.S.; Brooks, B. Harmful algae on tropical coral reefs: Bottom-up eutrophication and top-down herbivory. Harmful Algae 2006, 5, 565–585. [Google Scholar] [CrossRef]
  147. Titlyanov, E.A.; Kiyashko, S.I.; Titlyanova, T.V.; Van Huyen, P.; Yakovleva, I.M. Identifying nitrogen sources for macroalgal growth in variously polluted coastal areas of southern Vietnam. Bot. Mar. 2011, 54, 367–376. [Google Scholar] [CrossRef]
  148. Costanzo, S.D.; Udy, J.; Longstaff, B.; Jones, A. Using nitrogen stable isotope ratios (Δ15N) of macroalgae to determine the effectiveness of sewage upgrades: Changes in the extent of sewage plumes over four years in Moreton Bay, Australia. Mar. Pollut. Bull. 2005, 51, 212–217. [Google Scholar] [CrossRef]
  149. Thornber, C.S.; Kinlan, B.; Graham, M.H.; Stachowicz, J.J. Population ecology of the invasive kelp Undaria pinnatifida in California: Environmental and biological controls on demography. Mar. Ecol. Prog. Ser. 2004, 268, 69–80. [Google Scholar] [CrossRef]
  150. Smith, J.; Runcie, J.; Smith, C. Characterization of a large-scale ephemeral bloom of the green alga Cladophora sericea on the coral reefs of West Maui, Hawai’i. Mar. Ecol. Prog. Ser. 2005, 302, 77–91. [Google Scholar] [CrossRef]
  151. Fourqurean, J.W.; Moore, T.O.; Fry, B.; Hollibaugh, J.T. Spatial and Temporal Variation in C:N:P Ratios, Δ15N, and Δ13C of Eelgrass Zostera Marina as Indicators of Ecosystem Processes, Tomales Bay, California, USA. Mar. Ecol. Prog. Ser. 1997, 157, 147–157. [Google Scholar] [CrossRef] [Green Version]
  152. Liu, G.; Rauenzahn, J.L.; Heron, S.; Eakin, C.M.; Skirving, W.J.; Christensen, T.R.L.; Strong, A.E.; Li, J. NOAA Coral Reef Watch 50 Km Satellite Sea Surface Temperature-Based Decision Support System for Coral Bleaching Management; NOAA/NERDIS: College Park, MD, USA, 2013.
  153. Sprintall, J.; Gordon, A.L.; Wijffels, S.; Feng, M.; Hu, S.; Koch-Larrouy, A.; Phillips, H.; Nugroho, D.; Napitu, A.; Pujiana, K.; et al. Detecting Change in the Indonesian Seas. Front. Mar. Sci. 2019, 6, 257. [Google Scholar] [CrossRef]
  154. Shinoda, T.; Han, W.; Metzger, E.J.; Hurlburt, H.E. Seasonal Variation of the Indonesian Throughflow in Makassar Strait. J. Phys. Oceanogr. 2012, 42, 1099–1123. [Google Scholar] [CrossRef]
  155. Wirasatriya, A.; Prasetyawan, I.B.; Triyono, C.D.; Muslim; Maslukah, L. Effect of ENSO on the variability of SST and Chlorophyll-a in Java Sea. IOP Conf. Ser. Earth Environ. Sci. 2018, 116, 012063. [Google Scholar] [CrossRef] [Green Version]
  156. Dewi, Y.W.; Wirasatriya, A.; Sugianto, D.N.; Helmi, M.; Marwoto, J.; Maslukah, L. Effect of ENSO and IOD on the Variability of Sea Surface Temperature (SST) in Java Sea. In IOP Conference Series: Earth and Environmental Science; IOP Publishing: Bristol, UK, 2020; Volume 530, p. 012007. [Google Scholar]
  157. Randall, C.J.; Toth, L.T.; Leichter, J.J.; Maté, J.L.; Aronson, R.B. Upwelling buffers climate change impacts on coral reefs of the eastern tropical Pacific. Ecology 2020, 101, e02918. [Google Scholar] [CrossRef] [PubMed]
  158. Glynn, P.W.; Maté, J.L.; Baker, A.C.; Calderón, M.O. Coral Bleaching and Mortality in Panama and Ecuador during the 1997–1998 El Niño–Southern Oscillation Event: Spatial/Temporal Patterns and Comparisons with the 1982–1983 Event. Bull. Mar. Sci. 2001, 69, 79–109. [Google Scholar]
  159. Feely, R.A.; Sabine, C.L.; Hernandez-Ayon, J.M.; Ianson, D.; Hales, B. Evidence for Upwelling of Corrosive "Acidified" Water onto the Continental Shelf. Science 2008, 320, 1490–1492. [Google Scholar] [CrossRef] [PubMed] [Green Version]
  160. Leichter, J.; Genovese, S. Intermittent upwelling and subsidized growth of the scleractinian coral Madracis mirabilis on the deep fore-reef slope of Discovery Bay, Jamaica. Mar. Ecol. Prog. Ser. 2006, 316, 95–103. [Google Scholar] [CrossRef]
  161. Rixen, T.; Jiménez, C.; Cortés, J. Impact of upwelling events on the sea water carbonate chemistry and dissolved oxygen concentration in the Gulf of Papagayo (Culebra Bay), Costa Rica: Implications for coral reefs. RBT 2015, 60, 187–195. [Google Scholar] [CrossRef] [Green Version]
  162. Kim, S.T.; Cai, W.; Jin, F.-F.; Santoso, A.; Wu, L.; Guilyardi, E.; An, S.-I. Response of El Niño sea surface temperature variability to greenhouse warming. Nat. Clim. Change 2014, 4, 786–790. [Google Scholar] [CrossRef]
  163. Cai, W.; Wang, G.; Dewitte, B.; Wu, L.; Santoso, A.; Takahashi, K.; Yang, Y.; Carréric, A.; McPhaden, M.J. Increased variability of eastern Pacific El Niño under greenhouse warming. Nature 2018, 564, 201–206. [Google Scholar] [CrossRef]
  164. Beyer, H.L.; Kennedy, E.V.; Beger, M.; Chen, C.A.; Cinner, J.E.; Darling, E.S.; Eakin, C.M.; Gates, R.D.; Heron, S.F.; Knowlton, N.; et al. Risk-sensitive planning for conserving coral reefs under rapid climate change. Conserv. Lett. 2018, 11, e12587. [Google Scholar] [CrossRef]
  165. Kim, C.J. Coral Reef Management and Tara Bandu on Ataúro Island: An Ecologist’s Perspective. In Proceedings of the 2020 Timor-Leste Studies Association-Portugal Conference, TLSA-PT, Dili, Timor-Leste, 8 April 2021. [Google Scholar]
  166. Lamb, J.B.; Willis, B.L.; Fiorenza, E.A.; Couch, C.S.; Howard, R.; Rader, D.N.; True, J.D.; Kelly, L.A.; Ahmad, A.; Jompa, J.; et al. Plastic waste associated with disease on coral reefs. Science 2018, 359, 460–462. [Google Scholar] [CrossRef]
  167. Lamb, J.B.; van de Water, J.A.J.M.; Bourne, D.G.; Altier, C.; Hein, M.Y.; Fiorenza, E.A.; Abu, N.; Jompa, J.; Harvell, C.D. Seagrass ecosystems reduce exposure to bacterial pathogens of humans, fishes, and invertebrates. Science 2017, 355, 731–733. [Google Scholar] [CrossRef] [PubMed]
  168. Sabdono, A.; Radjasa, O.K.; Trianto, A.; Sarjito; Munasik; Wijayanti, D.P. Preliminary study of the effect of nutrient enrichment, released by marine floating cages, on the coral disease outbreak in Ka-rimunjawa, Indonesia. Reg. Stud. Mar. Sci. 2019, 30, 100704. [Google Scholar] [CrossRef] [Green Version]
  169. Raymundo, L.J.; Licuanan, W.L.; Kerr, A.M. Adding insult to injury: Ship groundings are associated with coral disease in a pristine reef. PLoS ONE 2018, 13, e0202939. [Google Scholar] [CrossRef] [Green Version]
  170. Raymundo, L.J.; Diaz, R.; Miller, A.; Reynolds, T. Baseline Surveys of Proposed and Established Marine Sanctuaries on Bantayan Island, Northern Cebu; University of Guam: Mangilao, Guam, 2011; p. 64. [Google Scholar]
  171. Kaczmarsky, L. Coral disease dynamics in the central Philippines. Dis. Aquat. Org. 2006, 69, 9–21. [Google Scholar] [CrossRef] [PubMed] [Green Version]
  172. Raymundo, L.J.; Rosell, K.B.; Reboton, C.T.; Kaczmarsky, L. Coral diseases on Philippine reefs: Genus Porites is a dominant host. Dis. Aquat. Org. 2005, 64, 181–191. [Google Scholar] [CrossRef] [PubMed] [Green Version]
  173. Raymundo, L. Porites ulcerative white spot disease: Description, prevalence, and host range of a new coral disease affecting Indo-Pacific reefs. Dis. Aquat. Org. 2003, 56, 95–104. [Google Scholar] [CrossRef] [PubMed] [Green Version]
  174. Miller, J.; Sweet, M.; Wood, E.; Bythell, J. Baseline coral disease surveys within three marine parks in Sabah, Borneo. PeerJ 2015, 3, 1391. [Google Scholar] [CrossRef] [Green Version]
  175. Green, E.P.; Bruckner, A.W. The significance of coral disease epizootiology for coral reef conservation. Biol. Conserv. 2000, 96, 347–361. [Google Scholar] [CrossRef]
  176. Williams, G.J.; Work, T.M.; Aeby, G.S.; Knapp, I.S.; Davy, S.K. Gross and microscopic morphology of lesions in Cnidaria from Palmyra Atoll, Central Pacific. J. Invertebr. Pathol. 2011, 106, 165–173. [Google Scholar] [CrossRef]
  177. Yasuda, N.; Nakano, Y.; Yamashiro, H.; Hidaka, M. Skeletal structure and progression of growth anomalies in Porites australiensis in Okinawa, Japan. Dis. Aquat. Org. 2012, 97, 237–247. [Google Scholar] [CrossRef] [Green Version]
  178. Aeby, G.S. The Potential Effect on the Ability of a Coral Intermediate Host to Regenerate Has Had on the Evolution of Its Association with a Marine Parasite. In Proceedings of the 7th International Coral Reef Symposium, Guam, FSM, USA, 22–27 June 1992; pp. 809–815. [Google Scholar]
  179. Aeby, G.S. Corals in the genus Porites are susceptible to infection by a larval trematode. Coral Reefs 2003, 22, 216. [Google Scholar] [CrossRef]
  180. Bergsma, G.S. Tube-dwelling coral symbionts induce significant morphological change in Montipora. Symbiosis 2009, 49, 143–150. [Google Scholar] [CrossRef]
  181. Floros, C.; Samways, M.; Armstrong, B. Polychaete (Spirobranchus giganteus) loading on South African corals. Aquat. Conserv. Mar. Freshw. Ecosyst. 2005, 15, 289–298. [Google Scholar] [CrossRef]
  182. Scott, P.J.B.; Risk, M.J. The effect of Lithophaga (Bivalvia: Mytilidae) boreholes on the strength of the coral Porites lobata. Coral Reefs 1988, 7, 145–151. [Google Scholar] [CrossRef]
  183. Hoeksema, B.W.; Farenzena, Z.T. Tissue loss in corals infested by acoelomorph flatworms (Waminoa sp.). Coral Reefs 2012, 31, 869. [Google Scholar] [CrossRef] [Green Version]
  184. Haapkylä, J.; Seymour, A.S.; Barneah, O.; Brickner, I.; Hennige, S.; Suggett, D.; Smith, D. Association of Waminoa sp. (Acoela) with corals in the Wakatobi Marine Park, South-East Sulawesi, Indonesia. Mar. Biol. 2009, 156, 1021–1027. [Google Scholar] [CrossRef]
  185. Rodríguez-Villalobos, J.; Work, T.; Calderón-Aguilera, L.; Reyes-Bonilla, H.; Hernández, L. Explained and unexplained tissue loss in corals from the Tropical Eastern Pacific. Dis. Aquat. Org. 2015, 116, 121–131. [Google Scholar] [CrossRef] [Green Version]
  186. Keats, D.W.; Chamberlain, Y.M.; Baba, M. Pneophyllum conicum (Dawson) comb. nov. (Rhodophyta, Corallinaceae), a Widespread Indo-Pacific Non-Geniculate Coralline Alga that Overgrows and Kills Live Coral. Bot. Mar. 1997, 40, 263–280. [Google Scholar] [CrossRef]
  187. Finckh, A.E. Biology of the Reef-Forming Organisms at Funafuti Atoll. In The Atoll of Funafuti; Royal Society: London, UK, 1904; pp. 125–150. [Google Scholar]
  188. Smith, T.; Nemeth, R.; Blondeau, J.; Calnan, J.; Kadison, E.; Herzlieb, S. Assessing coral reef health across onshore to offshore stress gradients in the US Virgin Islands. Mar. Pollut. Bull. 2008, 56, 1983–1991. [Google Scholar] [CrossRef]
  189. Kuffner, I.B.; Walters, L.J.; Becerro, M.A.; Paul, V.J.; Ritson-Williams, R.; Beach, K.S. Inhibition of coral recruitment by macroalgae and cyanobacteria. Mar. Ecol. Prog. Ser. 2006, 323, 107–117. [Google Scholar] [CrossRef] [Green Version]
  190. Cetz-Navarro, N.P.; Espinoza-Avalos, J.; Hernández-Arana, H.A.; Carricart-Ganivet, J.P. Biological Responses of the Coral Montastraea annularis to the Removal of Filamentous Turf Algae. PLoS ONE 2013, 8, e54810. [Google Scholar] [CrossRef] [Green Version]
  191. Loh, T.-L.; Pawlik, J. Friend or foe? No evidence that association with the sponge Mycale laevis provides a benefit to corals of the genus Montastraea. Mar. Ecol. Prog. Ser. 2012, 465, 111–117. [Google Scholar] [CrossRef] [Green Version]
  192. Rützler, K.; Muzik, K. Terpios Hoshinota, a New Cyanobacteriosponge Threatening Pacific Reefs. Sci. Mar. 1993, 57, 395–403. [Google Scholar]
  193. Bak, R.; Lambrechts, D.; Joenje, M.; Nieuwland, G.; Van Veghel, M. Long-term changes on coral reefs in booming populations of a competitive colonial ascidian. Mar. Ecol. Prog. Ser. 1996, 133, 303–306. [Google Scholar] [CrossRef]
  194. Littler, M.M.; Littler, D.S. A Colonial Tunicate Smothers Corals and Corraline Algae on the Great Astrolabe Reef, Fiji. Coral Reefs 1995, 14, 148–149. [Google Scholar] [CrossRef] [Green Version]
  195. Vargas-Ángel, B.; Godwin, L.S.; Asher, J.; Brainard, R.E. Invasive didemnid tunicate spreading across coral reefs at remote Swains Island, American Sāmoa. Coral Reefs 2009, 28, 53. [Google Scholar] [CrossRef] [Green Version]
  196. Ravindran, J.; Raghukumar, C. Pink-line syndrome, a physiological crisis in the scleractinian coral Porites lutea. Mar. Biol. 2006, 149, 347–356. [Google Scholar] [CrossRef]
  197. Eyre, B. Nutrient Biogeochemistry in the Tropical Moresby River Estuary System North Queensland, Australia. Estuar. Coast. Shelf Sci. 1994, 39, 15–31. [Google Scholar] [CrossRef]
  198. Mitchell, A.W.; Bramley, R.; Johnson, A.K.L. Export of nutrients and suspended sediment during a cyclone-mediated flood event in the Herbert River catchment, Australia. Mar. Freshw. Res. 1997, 48, 79–88. [Google Scholar] [CrossRef]
  199. Robertson, A.I.; Dixon, P.; Alongi, D.M. The Influence of Fluvial Discharge on Pelagic Production in the Gulf of Papua, Northern Coral Sea. Estuar. Coast. Shelf Sci. 1998, 46, 319–331. [Google Scholar] [CrossRef]
  200. Alongi, D.M.; Boto, K.G.; Robertson, A.I. Nitrogen and phosphorus cycles. In Ecosystems at the Land-Sea Margin: Drainage Basin to Coastal Sea; Robertson, A.I., Alongi, D.M., Eds.; American Geophysical Union: Washington, DC, USA, 1992; Volume 41, pp. 251–292. [Google Scholar]
Figure 2. Examples of disease and compromised health recorded on surveys undertaken in Timor-Leste between 15–27 November 2015. Photos outlined in red represent close-ups of adjacent photos (b1,c1). (a) WS–White Syndrome band of distinct tissue loss on tabulate acroporids with white skeleton abutting live tissue with exposed skeleton gradually colonized by turf algae, (a1) exposed coral skeleton caused by coral tissue loss from WS, (b) bleached tissue displaying white, living tissue lacking symbionts, (c) flatworm infestation on a Fungia coral, (d) turf algae overgrowth on a massive Porites coral, and (e) cyanobacterial (purple) overgrowth on a reef affecting more than one genus (i.e., Fungia and branching montiporids). See Figure S1 for other compromised states and Table S3 for more information.
Oceans 03 00012 g002
Figure 3. Benthic composition cover from 15 m line intercept transects by site (Rural-N, Rural-E, Urban-W, Urban-E) and depth (5 and 10 m) for November 2015 and June 2017 surveys in Timor-Leste. Major categories include: Hard Coral; CCA—crustose coralline algae; Invertebrates—mobile invertebrates; Macroalgae; Soft Coral; Substrate/Sand; and Turf algae.
Oceans 03 00012 g003
Figure 4. Principal Coordinates Analysis biplot of square root transformed Bray–Curtis similarity matrix of the hard coral genera counted on belt transects. Empty and solid markers indicating 5 and 10 m depths, respectively. Color indicates survey year: blue-2015 and green-2017. Vectors represent top nine coral genera/morphology correlated to axes as calculated by Person’s correlation. Abbreviations are coral genera/morphology as follows: ACRtab—Acropora tabulate; FUN—Fungiids; GAL—Galaxea; MONTI—Montipora; GONIO—Goniopora; PLA—Platygyra; POC—Pocillopora; PORmass—Porites massive; and STY—Stylophora.
Oceans 03 00012 g004
Figure 5. Prevalence of disease and states of compromised health on corals recorded in 15 × 2 m belt transect surveys at four sites (Rural-N, Rural-E, Urban-W, Urban-E), pooled by depth in Timor-Leste from November 2015 and June 2017. Abbreviations as follows: All Algae—combined macroalgae, turf, and cyanobacteria overgrowth; BL—Bleaching; CCA—Crustose coralline algae overgrowth; Other: combined pigmentation, predation, invertebrate infestation/overgrowth, burrowing invertebrates; TL—Unexplained tissue loss; WS—White Syndrome.
Oceans 03 00012 g005
Figure 6. Seawater nutrient concentrations (top to bottom: dissolved inorganic nitrogen [DIN], NH4+, NO3 + NO2, PO43−) sampled in triplicate on each transect at the four sites (Urban-W, Urban-E, Rural-N, Rural-E), two depths (5 m and 10 m), and three transects per depth in Timor-Leste in November 2015. Bold line is the median, box ends are the first and third quartile, lines are 95% confidence interval of the median, and points are Tukey’s outliers. Gray points indicate samples. Note differences in scales.
Oceans 03 00012 g006
Figure 7. Mean temperature by month ± 2 standard error of the daily maximum temperature for remotely sensed sea surface temperature (5 km2 pixels) from Coral Reef Watch Timor-Leste (CRWTL) and in situ temperature loggers pooled by depth (n = 6). Loggers sampled every 30 min between November 2015 and July 2017, the period between benthic surveys. The gray shading indicates the annual monsoon season from November to May. The dashed blue line is the maximum monthly mean (MMM, 29.5 °C) from the CRWTL data and the solid blue line is MMM + 1 °C (30.5 °C), the bleaching threshold for accumulation of degree heating weeks.
Oceans 03 00012 g007
Figure 8. Plot of the significant season × method interaction between the Coral Reef Watch Timor-Leste virtual station (CRWTL) remotely sensed sea surface temperature and in situ temperature logger data collected between November 2015 and July 2017. Divergence in temperature data between the two methods was greatest during the austral summer. The dashed blue line indicates the maximum monthly mean (MMM, 29.5 °C) and the solid blue line is MMM + 1 °C (30.5 °C), the bleaching threshold for the accumulation of degree heating weeks. CRWTL was above the MMM + 1 °C in both the austral summer and spring seasons while the in situ temperature remained below this threshold. Error bars represent 95% confidence intervals.
Oceans 03 00012 g008
Table 1. Delta 15N stable isotope ANOVA results of algae sampled at the four sites (Urban-W, Urban-E, Rural-N, Rural-E), two depths (5 m and 10 m), and three transects per depth in Timor-Leste in 2015. Starred values are significant results with mean, standard error, and post hoc groupings (a, b, or ab) presented per site with “-” indicating no samples collected.
AlgaeEffectdfF-Valuep-ValueRural-ERural-NUrban-EUrban-W
Halimeda spp.Site33.81990.0121 *4.26‰4.31‰4.03‰4.26‰
Depth10.54420.4624±0.06±0.07±0.06±0.07
Site x Depth31.38010.2531abbab
Chlorodesmis spp.Site110.00280.0064 *4.57‰-4.11‰4.47‰
Depth10.17470.6819±0.15 ±0.08±0.10
Site x Depth12.41270.1412ab ab
Publisher’s Note: MDPI stays neutral with regard to jurisdictional claims in published maps and institutional affiliations.

