
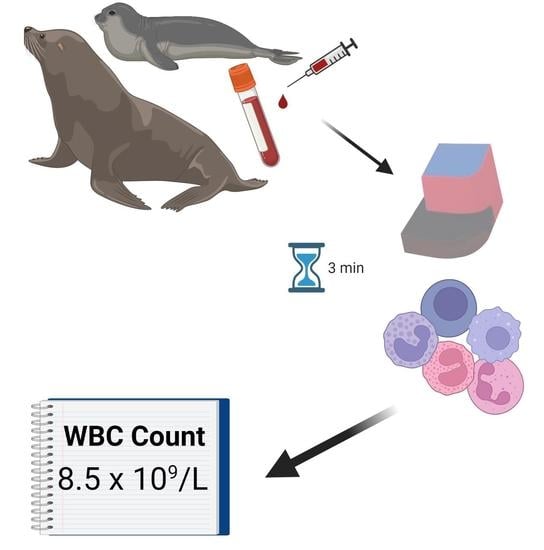
Evaluation of the HemoCue® WBC System as a Point of Care Diagnostic Tool for White Blood Cell Quantification in Pinnipeds

 , and
, and 
Abstract
1. Introduction
2. Materials and Methods
2.1. Animals
2.1.1. U.S. Navy Marine Mammal Program
2.1.2. The Marine Mammal Center
2.2. Sample Collection, Transport, and Storage
2.2.1. U.S. Navy Marine Mammal Program
2.2.2. The Marine Mammal Center
2.3. Instrumentation and Analysis
2.3.1. U.S. Navy Marine Mammal Program
2.3.2. The Marine Mammal Center
2.4. Reporting and Statistical Analysis
3. Results
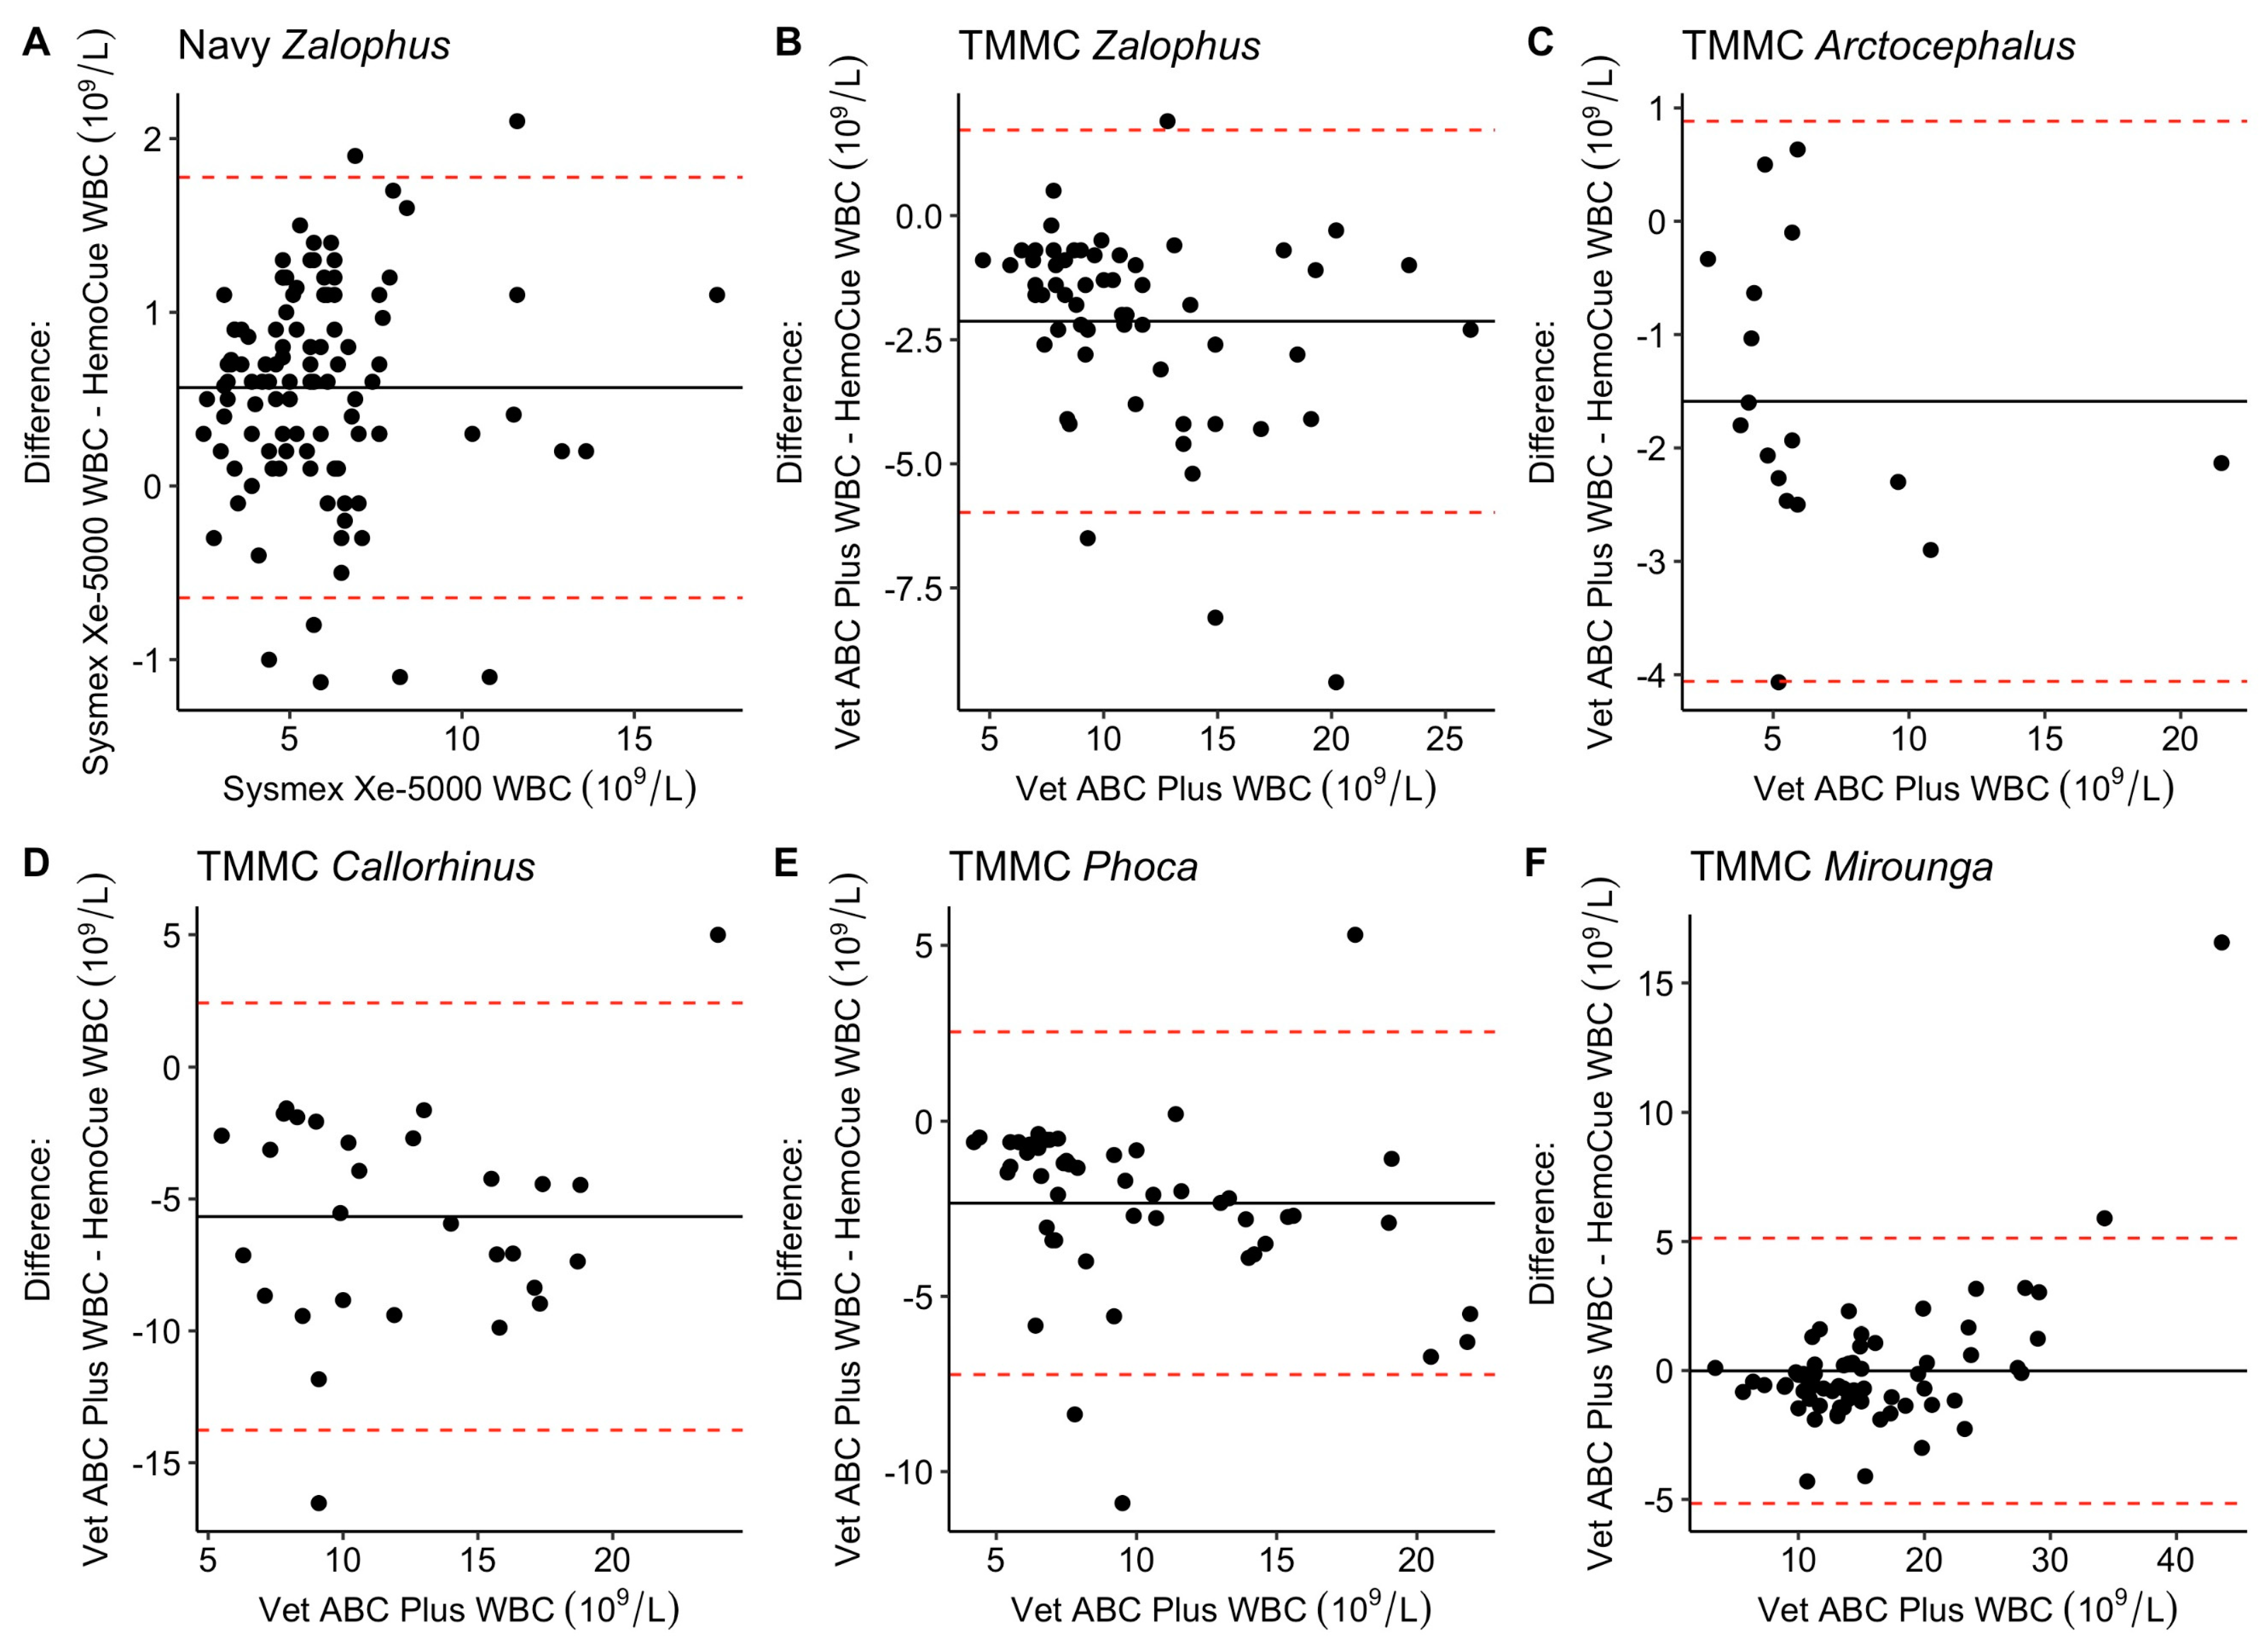
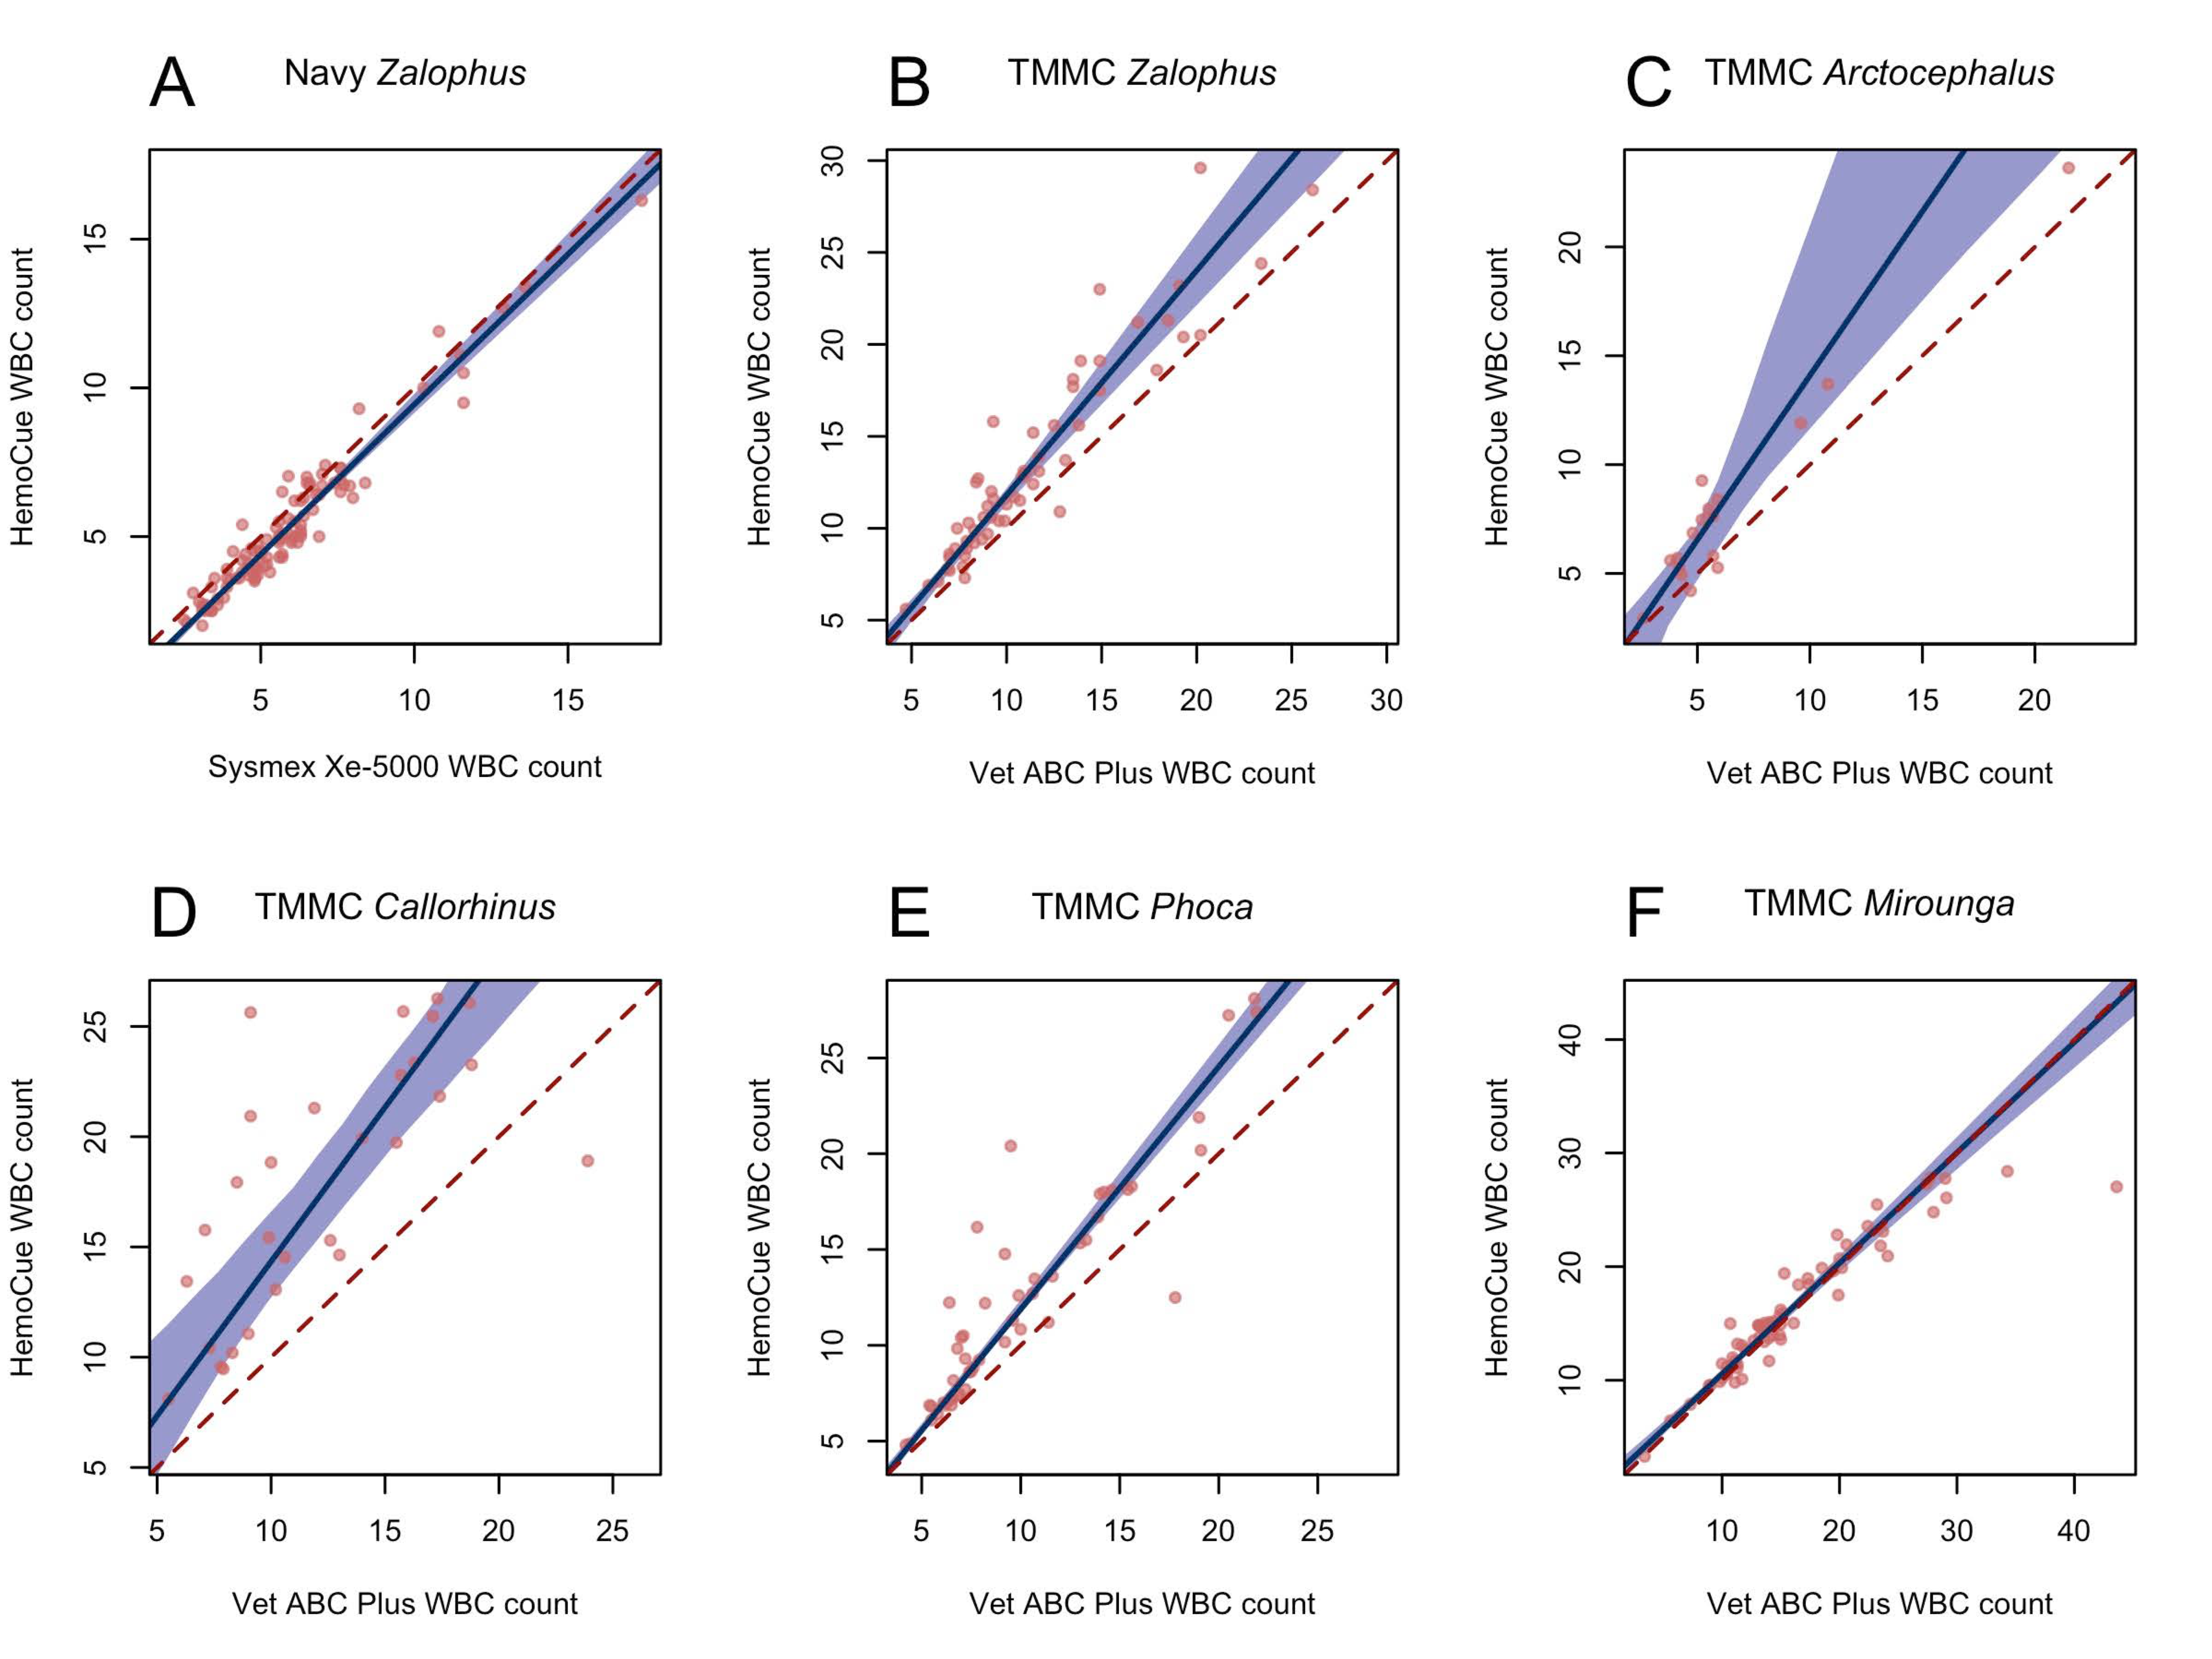
3.1. Zalophus—Navy
3.2. Zalophus—The Marine Mammal Center
3.3. Arctocephalus—The Marine Mammal Center
3.4. Callorhinus—The Marine Mammal Center
3.5. Phoca—The Marine Mammal Center
3.6. Mirounga—The Marine Mammal Center
4. Discussion
Author Contributions
Funding
Acknowledgments
Conflicts of Interest
References
- Ivaska, L.; Niemelä, J.; Leino, P.; Mertsola, J.; Peltola, V. Accuracy and Feasibility of Point-of-Care White Blood Cell Count and c-Reactive Protein Measurements at the Pediatric Emergency Department. PLoS ONE 2015, 10, e0129920. [Google Scholar] [CrossRef]
- Van Den Bruel, A.; Thompson, M.J.; Haj-Hassan, T.; Stevens, R.; Moll, H.; Lakhanpaul, M.; Mant, D. Diagnostic Value of Laboratory Tests in Identifying Serious Infections in Febrile Children: Systematic Review. BMJ 2011, 342, 1–11. [Google Scholar] [CrossRef] [PubMed]
- Osei-Bimpong, A.; Jury, C.; Mclean, R.; Lewis, S.M. Point-of-Care Method for Total White Cell Count: An Evaluation of the HemoCue WBC Device. Int. J. Lab. Hematol. 2009, 31, 657–664. [Google Scholar] [CrossRef]
- Thorneloe, C.; Bédard, C.; Boysen, S. Evaluation of a Hand-Held Lactate Analyzer in Dogs. Can. Vet. J. 2007, 48, 283–288. [Google Scholar] [PubMed]
- Marinkovich, M.; Wack, R.F.; Field, C.L.; Whoriskey, S.T.; Kass, P.H.; Gjeltema, J. Evaluation of Serial Blood Lactate and the Use of a Point-of-Care Lactate Meter in Live-Stranded Pinnipeds. J. Zoo Wildl. Med. 2019, 50, 137–146. [Google Scholar] [CrossRef] [PubMed]
- Marcus, A.D.; Higgins, D.P.; Gray, R. Health Assessment of Free-Ranging Endangered Australian Sea Lion (Neophoca cinerea) Pups: Effect of Haematophagous Parasites on Haematological Parameters. Comp. Biochem. Physiol.-Part A Mol. Integr. Physiol. 2015, 184, 132–143. [Google Scholar] [CrossRef] [PubMed]
- Lander, M.E.; Harvey, J.T.; Gulland, F.M.D. Hematology and Serum Chemistry Comparisons between Free-Ranging and Rehabilitated Harbor Seal (Phoca Vitulina Richardsi) Pups. J. Wildl. Dis. 2003, 39, 600–609. [Google Scholar] [CrossRef] [PubMed][Green Version]
- Quest Diagnostics. HemoCue WBC Operating Manual. Ängelholm.
- Russcher, H.; Van Deursen, N.; Ermens, T.; De Jonge, R. Evaluation of the HemoCue WBC DIFF System for Point-of-Care Counting of Total and Differential White Cells in Pediatric Samples. Ned. Tijdschr. Voor Klin. Chem. Lab. 2013, 38, 140–141. [Google Scholar]
- Bui, H.N.; Bogers, J.P.A.M.; Cohen, D.; Njo, T.; Herruer, M.H. Evaluation of the Performance of a Point-of-Care Method for Total and Differential White Blood Cell Count in Clozapine Users. Int. J. Lab. Hematol. 2016, 38, 703–709. [Google Scholar] [CrossRef] [PubMed]
- Riond, B.; Hofmann-Lehmann, R.; Lutz, H. Evaluation of the Veterinary Application of a Point-of-Care Device Measuring White Blood Cell Counts. Vet. J. 2012, 194, 124–127. [Google Scholar] [CrossRef] [PubMed]
- Greig, D.J.; Gulland, F.M.D.; Kreuder, C. A Decade of Live California Sea Lion (Zalophus californianus) Strandings Along the Central California Coast: Causes and Trends, 1991–2000. Aquat. Mamm. 2005, 31, 11–22. [Google Scholar] [CrossRef]
- Dierauf, L.A.; Dougherty, S.A.; Lowenstine, L.J. Survival versus Nonsurvival Determinants for Neonatal Harbor Seals. J. Am. Vet. Med. Assoc. 1986, 189, 1024–1028. [Google Scholar] [PubMed]
- Colegrove, K.M.; Greig, D.J.; Gulland, F.M.D. Causes of Live Strandings of Northern Elephant Seals (Mirounga angustirostris) and Pacific Harbor Seals (Phoca vitulina) Along the Central California Coast, 1992–2001. Aquat. Mamm. 2005, 31, 1–10. [Google Scholar] [CrossRef]
- Greig, D.J.; Gulland, F.M.D.; Rios, C.A.; Hall, A.J. Hematology and Serum Chemistry in Stranded and Wildcaught Harbor Seals in Central California: Reference Intervals, Predictors of Survival, and Parameters Affecting Blood Variables. J. Wildl. Dis. 2010, 46, 1172–1184. [Google Scholar] [CrossRef] [PubMed]
- Williams, K. Clinical Values of Blood Variables in Wild and Stranded California sea lions (Zalophus californianus) and Blood Sample Storage and Stability. Master’s Thesis, California State University Monterey Bay, Seaside, CA, USA, 2013. [Google Scholar]
- R Core Team. R: A Language and Environment for Statistical Computing; R Foundation for Statistical Computing: Vienna, Austria, 2019. [Google Scholar]
- Team, R.S. RStudio: Integrated Development Environment for R; RStudio, Inc.: Boston, MA, USA, 2019. [Google Scholar]
- Bland, J.M.; Altman, D.G. Statistical Methods for Assessing Agreement between Two Methods of Clinical Measurement. Int. J. Nurs. Stud. 2010, 47, 931–936. [Google Scholar] [CrossRef]
- Passing, H.; Bablok, W. A New Biometrical Procedure for Testing the Equality of Measurements from Two Different Analytical Methods. Application of Linear Regression Procedures for Method Comparison Studies in Clinical Chemistry, Part I. Clin. Chem. Lab. Med. 2009, 21, 709–720. [Google Scholar] [CrossRef] [PubMed]
- Manuilova, E.; Schuetzenmeister, A.; Model, F. R Package Mcr: Method Comparison Regression, Version 1.2.2, Maintainer: Potapov, S. License: GPL. Repository: CRAN. 2014.
- Krouwer, J.S.; Cembrowski, G.S. A Review of Standards and Statistics Used to Describe Blood Glucose Monitor Performance. J. Diabetes Sci. Technol. 2010, 4, 75–83. [Google Scholar] [CrossRef] [PubMed]
- Akoglu, H. User’s Guide to Correlation Coefficients. Turk. J. Emerg. Med. 2018, 18, 91–93. [Google Scholar] [CrossRef] [PubMed]
- Jonsson, K.; Buckwalter, K.; Helvie, M.; Niklason, L.; Martel, W. Precision of Hyaline Cartilage Thickness Measurements. Acta Radiol. 1992, 33, 234–239. [Google Scholar] [CrossRef] [PubMed]
- Nabity, M.B.; Harr, K.E.; Camus, M.S.; Flatland, B.; Vap, L.M. ASVCP Guidelines: Allowable Total Error Hematology. Vet. Clin. Pathol. 2018, 47, 9–21. [Google Scholar] [CrossRef] [PubMed]


| Bland–Altman | Passing–Bablok | Precision | nRBC | ||||||
|---|---|---|---|---|---|---|---|---|---|
| Species (Location) | Number of Samples (Individual Animals) | Bias (SD) a | Upper LOA c | Lower LOA c | Slope (CI) b | Intercept (CI) b | Pearson’s r | Coefficient of Variation (SD) a | Range of nRBC/100 WBC (n) |
| Zalophus (Navy) | 106 (28) | 0.56 (0.62) | 1.77 | −0.64 | 1.00 (0.96, 1.08) | −0.65 (−1.04, −0.44) | 0.969 | NA | 1–3 (9) |
| Zalophus (TMMC) d | 58 (38) | −2.13 (1.96) | 1.72 | −5.98 | 1.22 (1.08, 1.40) | −0.42 (−2.00, 0.65) | 0.941 | 2.50 (1.63) | NA |
| Arctocephalus (TMMC) d | 17 (10) | −1.59 (1.26) | 0.88 | −4.06 | 1.51 (1.12, 2.72) | −0.99 (−6.69, 1.06) | 0.968 | 3.09 (2.14) | NA |
| Callorhinus (TMMC) d | 29 (16) | −5.67 (4.13) | 2.43 | −13.76 | 1.40 (1.07, 1.72) | 0.35 (−3.71, 5.28) | 0.702 | 2.47 (1.35) | 5–37 (4) |
| Phoca (TMMC) d | 50 (25) | −2.34 (2.49) | 2.55 | −7.23 | 1.27 (1.19, 1.35) | −0.77 (−1.42, −0.10) | 0.912 | 2.88 (1.75) | 8–28 (2) |
| Mirounga (TMMC) d | 67 (40) | −0.01 (2.62) | 5.13 | −5.16 | 0.97 (0.89, 1.05) | 0.82 (0.03, 1.81) | 0.936 | 3.44 (2.53) | NA |
Publisher’s Note: MDPI stays neutral with regard to jurisdictional claims in published maps and institutional affiliations. |
© 2022 by the authors. Licensee MDPI, Basel, Switzerland. This article is an open access article distributed under the terms and conditions of the Creative Commons Attribution (CC BY) license (https://creativecommons.org/licenses/by/4.0/).
Share and Cite
McClain, A.M.; Whitmer, E.R.; Rios, C.; Jensen, E.D.; Stacy, N.I.; Johnson, S.P. Evaluation of the HemoCue® WBC System as a Point of Care Diagnostic Tool for White Blood Cell Quantification in Pinnipeds. Oceans 2022, 3, 72-83. https://doi.org/10.3390/oceans3010007
McClain AM, Whitmer ER, Rios C, Jensen ED, Stacy NI, Johnson SP. Evaluation of the HemoCue® WBC System as a Point of Care Diagnostic Tool for White Blood Cell Quantification in Pinnipeds. Oceans. 2022; 3(1):72-83. https://doi.org/10.3390/oceans3010007
Chicago/Turabian StyleMcClain, Abby M., Emily R. Whitmer, Carlos Rios, Eric D. Jensen, Nicole I. Stacy, and Shawn P. Johnson. 2022. "Evaluation of the HemoCue® WBC System as a Point of Care Diagnostic Tool for White Blood Cell Quantification in Pinnipeds" Oceans 3, no. 1: 72-83. https://doi.org/10.3390/oceans3010007
APA StyleMcClain, A. M., Whitmer, E. R., Rios, C., Jensen, E. D., Stacy, N. I., & Johnson, S. P. (2022). Evaluation of the HemoCue® WBC System as a Point of Care Diagnostic Tool for White Blood Cell Quantification in Pinnipeds. Oceans, 3(1), 72-83. https://doi.org/10.3390/oceans3010007