Article

Effect of Temperature on the Daily Increment Deposition in the Otoliths of European Sardine Sardina pilchardus (Walbaum, 1792) Larvae

1
Centro de Ciências do Mar (CCMar), Campus de Gambelas, Universidade do Algarve, 8005-139 Faro, Portugal
2
MARE—Marine and Environmental Sciences Centre, Faculdade de Ciências, Campo Grande, Universidade de Lisboa, 1749-016 Lisbon, Portugal
3
Instituto Português do Mar e da Atmosfera–IPMA, 1449-006 Lisboa, Portugal
4
Oceanário de Lisboa, Esplanada Dom Carlos I, 1900-005 Lisbon, Portugal
*
Author to whom correspondence should be addressed.
Oceans 2021, 2(4), 723-737; https://doi.org/10.3390/oceans2040041
Submission received: 17 May 2021 / Revised: 26 October 2021 / Accepted: 3 November 2021 / Published: 8 November 2021
(This article belongs to the Special Issue Fish Larval Biology and Ecology)

Abstract

:
Otolith microstructure analysis is a valuable tool to evaluate the relationship between larval age and growth and how it relates to environmental variability. Otolith growth and daily increment deposition were analyzed in sardine (Sardina pilchardus) larvae reared in the laboratory under different temperatures (13, 15, and 17 °C), with a diet rich in microalgae, rotifers, and copepods Acartia grani. The number and width of growth increments, first-check and otolith diameter were determined in the otoliths and then related to larval age and total length. At hatching, the sagittal otoliths consisted of a lenticular core with a diameter of 10.56 μm (±1.07 μm SD). Somatic growth increased with the increasing temperature and the growth rate of larvae reared at 13 and 15 °C was significantly lower than for larvae reared at 17 °C. At 17 °C, otoliths exhibited a higher diameter with wider increments than at 13 °C. There was a high variability of increment counts-at-age for larvae reared within the same temperature treatment. The increase of growth increments with larval size was higher for larvae reared at 17 °C until 35 days post-hatching than those growing at 15 °C. Scanning electronic microscopy confirmed that increments are deposited daily, with an average width smaller than 1 µm and as low as 0.33 μm, therefore impossible to distinguish using light microscopy. At colder temperatures, larval otoliths had thinner and less marked increments and lower growth rates, which can lead to incorrect age determinations. The effect of temperature on the otolith microstructure can help in identifying strong temperature gradients experienced by wild sardine larvae.

1. Introduction

Fish otoliths are known to store valuable information of fish age and growth history, which represents important information for fisheries management and the development of conservation strategies [1]. Otolith microstructure analysis has become a valuable tool not only to estimate age and growth rate, but also to reconstruct the individual growth history of fish [2,3,4,5]. This method relies on the assumption that increment rates are in the order of one per day, representing counts as larval age, allowing for the determination of daily growth rate variability both at individual and population levels [6,7,8]. However, fish larvae growth and otolith microstructure including increment width and deposition rate can be influenced by several factors such as temperature, food availability, salinity, oxygen, and photoperiod, the first two likely being the most important [9,10,11,12,13,14,15]. Consequently, variations in the environmental conditions may result in flawed age estimation [10]. Therefore, the otolith microstructure is strongly influenced by the environmental conditions experienced during the larval phase in a way that the individual larval otolith microstructure can be used as a proxy for the general growth conditions. Hydrographic backtracking models can complement the otolith analysis by reconstructing the environmental history and spawning origin of larvae, gaining insights into the relationship between larval growth and environmental variability [16]. Validation of the relation between otolith growth increment deposition and larval age is essential to study growth and to reconstruct early life history events such as hatching, first feeding, notochord flexion, and metamorphosis [17,18,19]. Not only is it necessary to know the increment deposition rate and what variables might influence it, but it is also crucial to know the first increment formation age to obtain reliable age estimations [8].
Small pelagic fish, as sardines or anchovies, are key intermediate trophic level species of the most productive regions of the world’s oceans [20]. These fish have a short lifespan with an average of 3–7 years, high number of eggs per spawn, some with extended spawning seasons, vast distribution, and mobility, with a plankton-based diet, and are highly dependent of primary production areas such as coastal upwelling systems [21]. Due to their biological characteristics, the population dynamics of small pelagic fish tend to undergo cyclic and high fluctuations on their productivity and distribution as a sensitive response to long-term environmental changes. These fluctuations are primarily addressed as variations in recruitment success due to survival rates during early life stages [22,23,24] and can have a tremendous effect in the ecosystem’s structure.
The European sardine Sardina pilchardus (Walbaum, 1792) has a wide distribution from the southern Celtic Sea and North Sea to Mauritania and Senegal, including the Azores, Madeira, and Canary Archipelagos and also the Mediterranean Sea [25,26]. In the Atlantic Iberian waters, the European sardine is the main target of Portuguese and Spanish purse-seine fisheries [27], with sardine larvae often dominating the ichthyoplankton community [28,29]. Since 2004, there has been a decline in Atlanto-Iberian sardine abundance and catches [30], coinciding with a period of poor recruitment years. As with other small pelagic fishes, high inter-annual fluctuations of abundance are related to the high variability of recruitment strength. These fluctuations seem to be directly influenced by very high and extremely variable mortality during early life [31,32], including other sub-lethal factors, such as predation, food availability, and transport drift [33]. While predation pressure continues to be difficult to estimate, it is essential to understand how environmental changes can affect larval growth and survival as a proxy of larval recruitment success [9,34]. Ocean temperature has a great influence on sardine larvae survival, but also on growth rates and ontogenetic development. Larvae reared with higher temperatures had higher growth rates and ontogenetic development happened sooner and at smaller sizes when compared to low temperatures [35]. On the other hand, larvae feeding endogenously had higher survival rates at colder temperatures. Small growth rate variations during early ontogeny can lead to considerable fluctuations of the recruitment strength, and it is vital to accurately determine the age and growth of field-caught larvae to understand the population structure and its relationship with environmental change [36].
Given that ocean temperature variability has a significant weight on sardine larvae growth and ontogeny [35,36,37], we hypothesize that the temperature modulates otolith microstructure and potentially influences the accuracy of age determinations. Field studies on sardine larvae confirmed that food availability [38,39] and temperature [40] limit their survival and can, in fact, explain the inter-annual fluctuations of recruitment strength for Atlanto-Iberian populations [41]. To date, no study was done to validate the daily increment deposition throughout larval ontogeny at different temperature conditions for this species. Therefore, this work aims at determining the impact of temperature in the formation of sardine larvae otoliths. The specific goals are to determine the influence of the variation of water temperature experienced by sardine larvae during the peak spawning season (13 to 17 °C) on the otolith microstructure; particular growth increment formation and increment width; and to evaluate the accuracy of age determinations in sardine larvae using optical microscopic analysis.

2. Materials and Methods

2.1. Laboratory Rearing Experiment

Sardine adults were captured off the Portuguese coast during 2009 and 2010 and were maintained in captivity at Oceanário de Lisboa in a 15,000 L tank. Spawning was induced by temperature and photoperiod manipulation. The water temperature was kept at 15 °C and salinity at 35 throughout the experimental period.
Fertilized eggs were collected from the broodstock using 500 µm mesh egg collector bags placed in the tank skimmers. The eggs were then counted and transferred to 30 L cylindrical tanks with a concentration of 50 eggs L−1 and a constant salinity of 35. Experiments were performed at three different temperatures (13, 15, and 17 °C), which comprehend the effect of optimal and extreme temperatures experienced by sardine larvae during the peak of the spawning season in nature [42,43]. The light regime was 16L:8D and gentle aeration was used to maintain steady water circulation and suitable oxygen concentration. After fertilization, egg development usually takes around 84 h at 15 °C [44,45]. As observed for sardines in the wild [46], sardines tend to spawn near the bottom. Then, due to the positive buoyancy of sardine eggs throughout their development, it takes hours for the eggs to ascend to the upper part of the column and attain vertical stability [47]. Since egg collectors were placed in the skimmers of the adult tank, we collected eggs at the surface, half-way through development. Therefore, all of the eggs were incubated at 15 °C until hydration. Then, water temperatures in the different experiments were increased to 17 °C or decreased to 13 °C in the larval tanks, at a rate of 0.5 °C per hour. Larvae were reared with no limitation of food, with a feeding regime which included Gymnodinum sp. (1500 cell mL−1), rotifers Brachionus sp. (50 ind mL−1), nauplii, copepodites, and adult stages of the calanoid copepod Acartia grani (>3 ind mL−1). The concentration of prey remaining in the larval tanks was monitored daily and new prey were added to maintain constant concentrations throughout the experimental period. The microalgae Nannochloropsis sp. was added daily to the cylindrical experimental 30 L tanks (green-water method) [48]. Stock cultures of live prey for sardine larvae (Acartia grani and rotifers) were fed ad libitum with Rhodomonas sp. and Nannochloropsis sp., respectively.
Larvae were sampled regularly from each tank during the experimental period of 35 days post-hatching (dph). From each tank, 10 larvae (0–5 dph) were sampled at hatching day 3 and 5 dph. For older larvae (10–35 dph), five individuals were sampled with 5 days’ interval. These larvae were measured alive (total length-TL) and then preserved in ethanol (99%) at hatching day, while older larvae were preserved in formaldehyde (4%) for posterior otolith extraction. Ethanol was used for younger larvae to ensure that their small and fragile otoliths would not dissolve before extraction and analysis [49].

2.2. Otoliths Extraction, Preparation, and Analysis

One or both sagittal otoliths were extracted from the saccular chamber under a stereoscopic microscope (±0.05 mm, micrometer on a Zeiss Stemi 2000 dissecting scope, Carl Zeiss NTS Ltd., Oberkochen, Germany) of sardine larvae and placed on a glass slide with a drop of water. We only used the sagittal otoliths since the microstructure of the lapillus otoliths was not as clear as the one observed for sagittal. After careful extraction and drying, the otoliths were covered with a thin layer of Depex resin and were left to dry for at least 24 h. The microstructure analysis was carried out using a high-resolution inverted microscope (Leica DMi8, Leica Mycrosystems, Wetzlar, Germany) with brilliant LED illumination, at a 1000x magnification (63x objective lens coupled with 1.6x Optovar magnification system, Leica Mycrosystems, Wetzlar, Germany). Images were taken with a high-resolution Leica DFC550 camera (12 Megapixel resolution, Leica Mycrosystems, Wetzlar, Germany) with improved quality under a white balance mode and a contrast method of bright field. Using the software Leica Application Suite (LAX, 2015 version, Leica Mycrosystems, Wetzlar, Germany), otoliths were measured, growth increments were counted, and their width measured. Otolith measurements included total diameter and first-check diameter from the center of the core along the longest radius. Otolith readings were made blindly by two trained readers and each otolith was read at least three times. Growth increment counts and measurements were made starting at the hatch-check ring of both otoliths (right and left) and the mean of those counts was used as the number of growth increments (GI) [50]. A random selected sub-sample of otoliths was carefully prepared, polished, etched with EDTA 4%, and observed in a low pressure Scanning Electron Microscope (SEM, Hitachi tabletop microscope, TM3030Plus, Hitachi, Ibaraki, Japan). Observations were done using different magnifications from 2500× to 10,000×. With SEM, increments were counted and increment widths were measured.

2.3. Data Analysis

ANOVA was used to test for the effect of temperature on larval size-at-hatch and hatch-check diameter, after checking for the normality by the Shapiro-Wilk normality test and homogeneity of variance using Levene’s test. Generalized linear models (GLMs) were used to analyze the relationship between total length (mm) and age of larvae (days post-hatching, dph) reared at different temperatures. Moreover, GLMs were used to investigate the relationship between the number of growth increments and the otolith diameter with age and total length of larvae reared at different temperatures. Two time periods were selected to make the comparisons. One comparison consisted of rearing larvae from hatch to 25 dph to compare the three temperatures (13, 15, and 17 °C). The other comparison consisted of rearing larvae from hatch to 35 dph. However, in this case, we only considered treatments with water at 15 and 17 °C since the survival of larvae in the experimental tank with water at 13 °C was low, and we end up with no larvae after 25 dph. The best model fit was selected based on the Akaike Information Criteria in the case of the continuous response variables (length, diameter), while for growth increment counts, a Poisson distribution was selected.
Linear mixed models were used to assess the effect of temperature on increment width with respect to their order from the nucleus. The potential variability of increment width from different larvae was considered as a random effect. All of the statistical analysis and graphs were made using the open-source software R version 4.0.2 of R Development Core Team, Vienna, Austria. URL https://www.R-project.org/ (accessed on 12 September 2021) [51]. The packages used for plotting included ggplot2 [52] and interactions [53]. In addition, package lm4 was used for linear mixed modelling [54]. The standard deviation was used as a measure of data dispersion when describing the mean.

3. Results

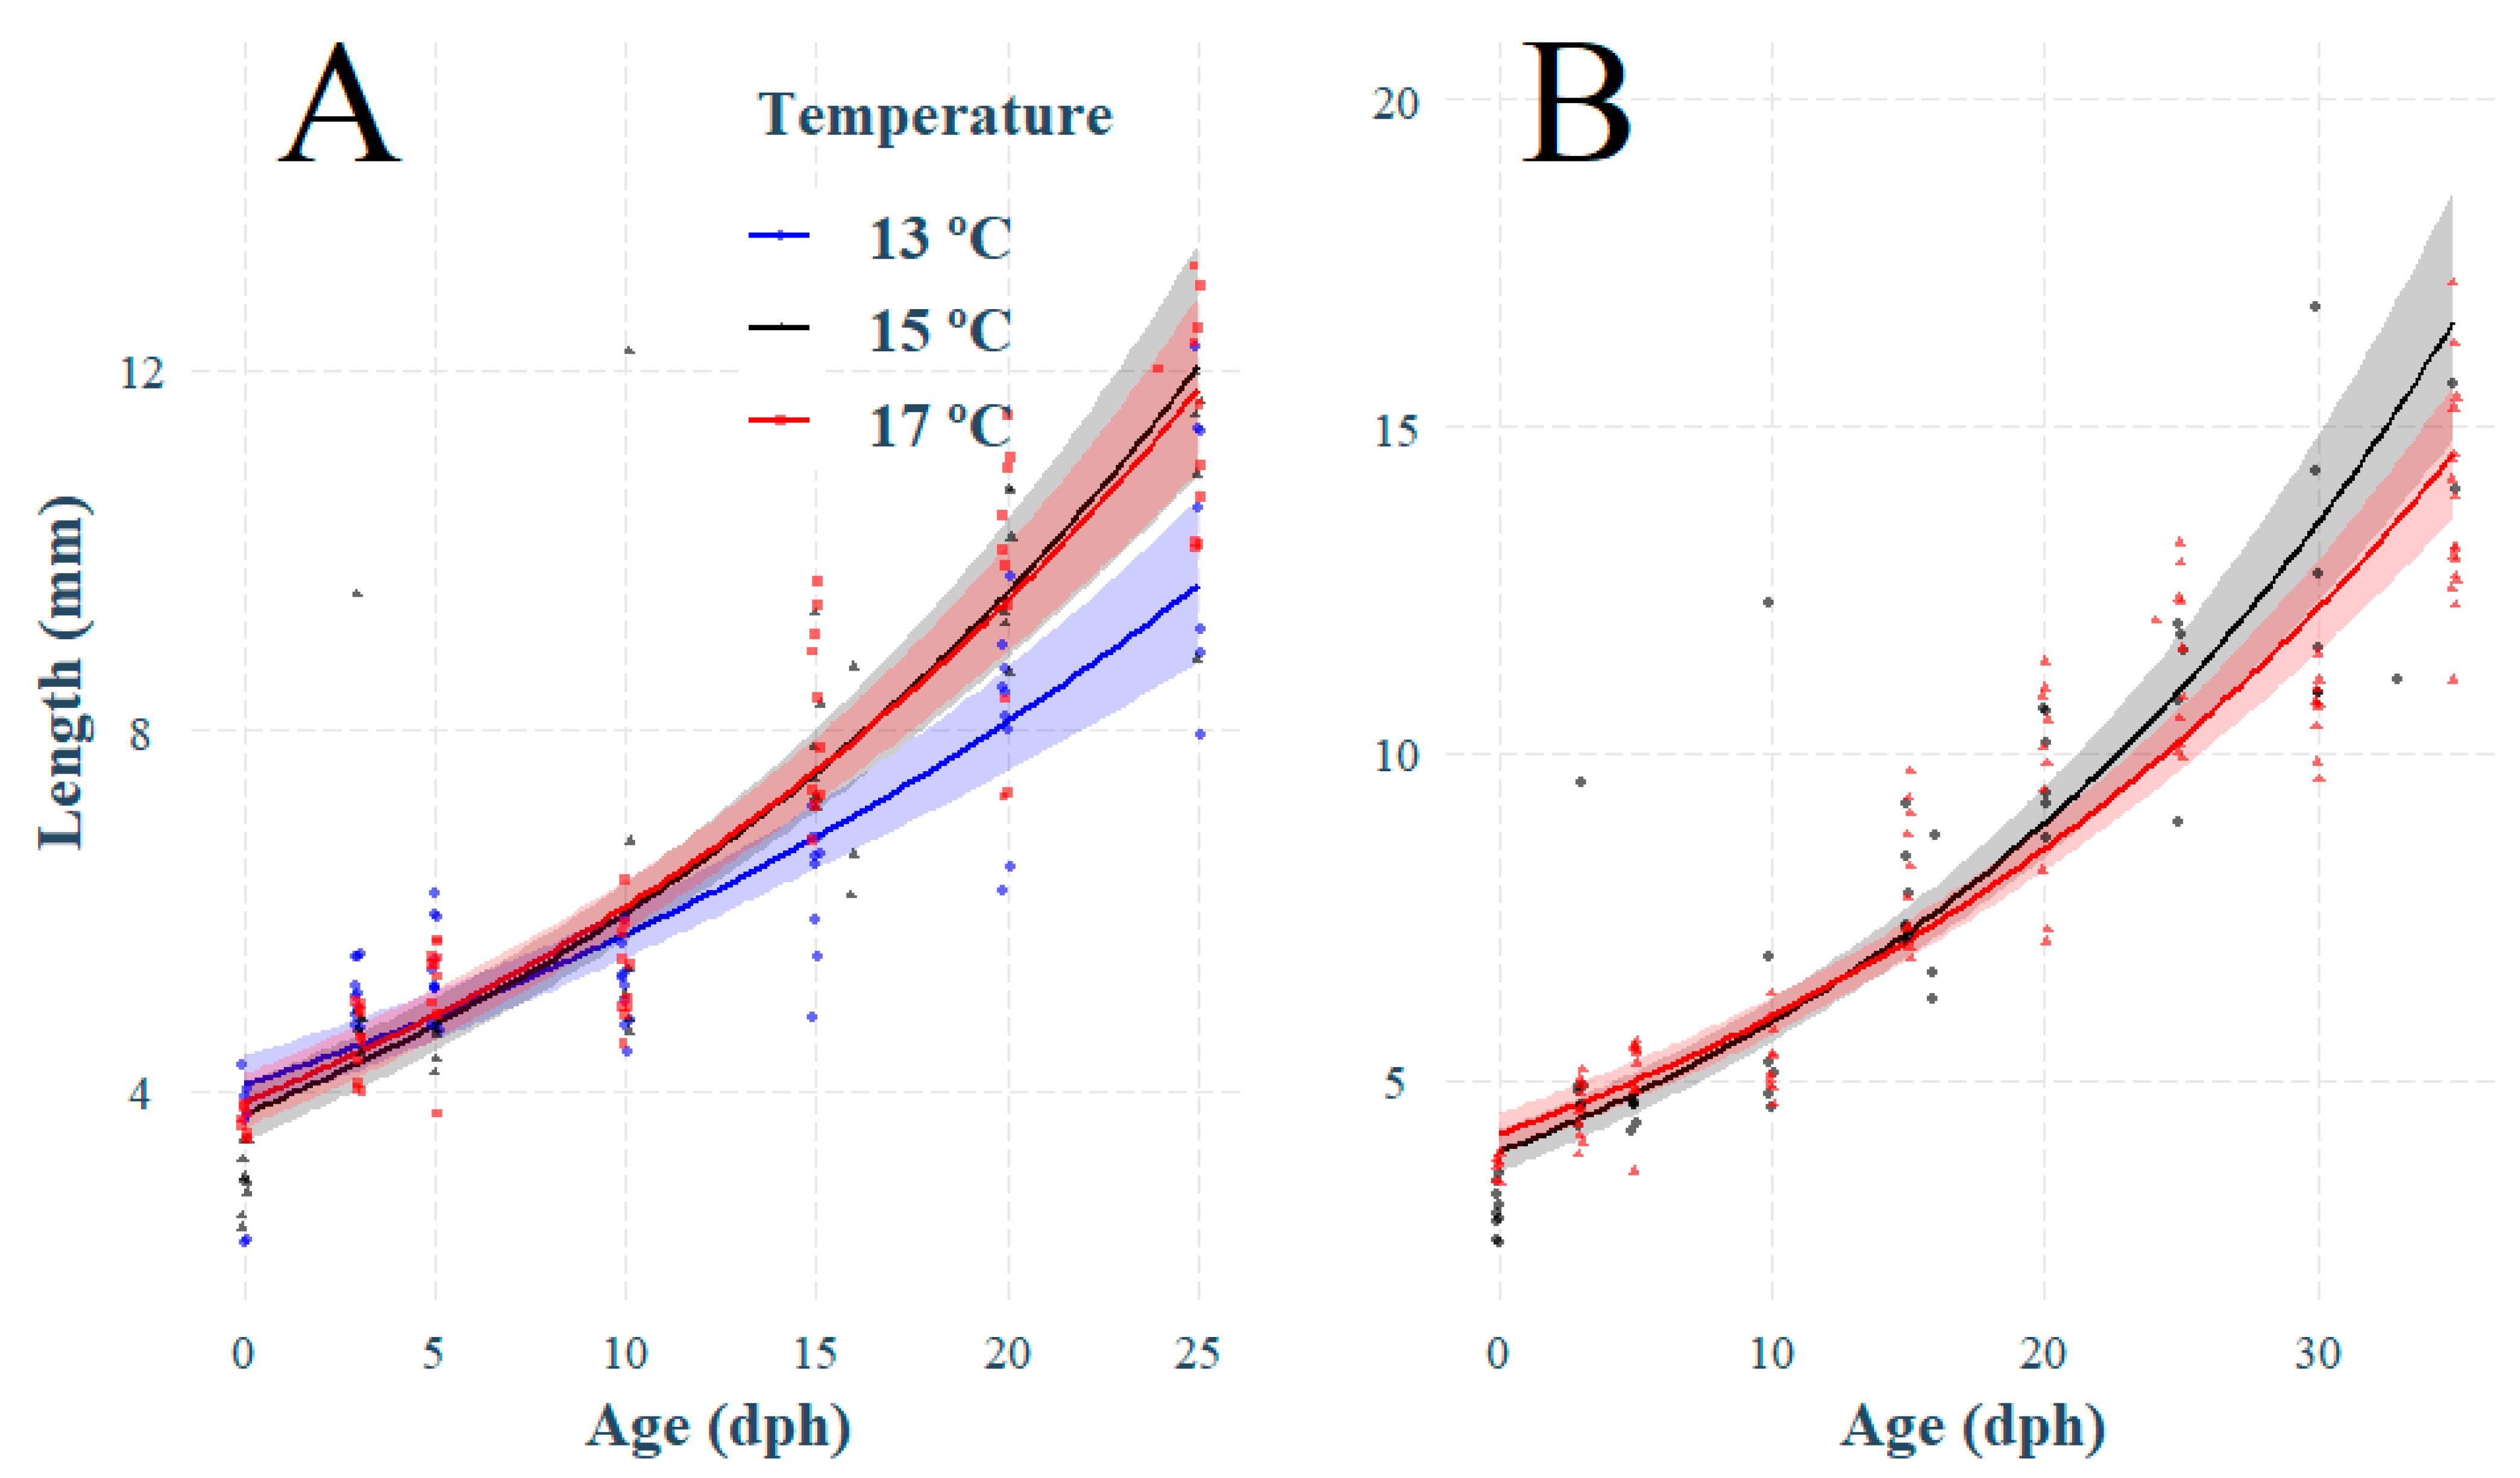
3.1. Effect of Temperature on Larval Growth

A total of 448 otoliths of 251 sardine larvae were analyzed, with 112, 171, and 165 otoliths corresponding to larvae reared at 13, 15, and 17 °C. All of the otoliths analyzed from larvae reared at 13 °C were of larvae younger than 25 days post-hatching (dph) (n = 112). The number of otoliths analyzed from larvae reared at 15 and 17 °C until 25 dph was 116 and 131, while between 26 and 35 dph, the number of otoliths analyzed was 55 and 34. It was possible to excise and analyze both sagittal otoliths from 83% of the larvae analyzed in this work. The remaining 40 larvae for which it was only possible to extract one of the otoliths were analyzed by at least two readers.
Size-at-hatching was not significantly different for larvae reared at different temperatures (p = 0.06), while the hatch-check diameter increased significantly with temperature, being significantly different for all the temperatures tested (p < 0.001). The larval growth rate increased with the increasing temperature for the period 0–25 days post-hatching (dph) and was significantly higher for larvae reared at 17 °C when compared to those reared at 15 and 13 °C (Figure 1, Table 1). The growth rate was not significantly different for larvae reared at 15 and 17 °C for the period 0–35 dph (Figure 1, Table 1).

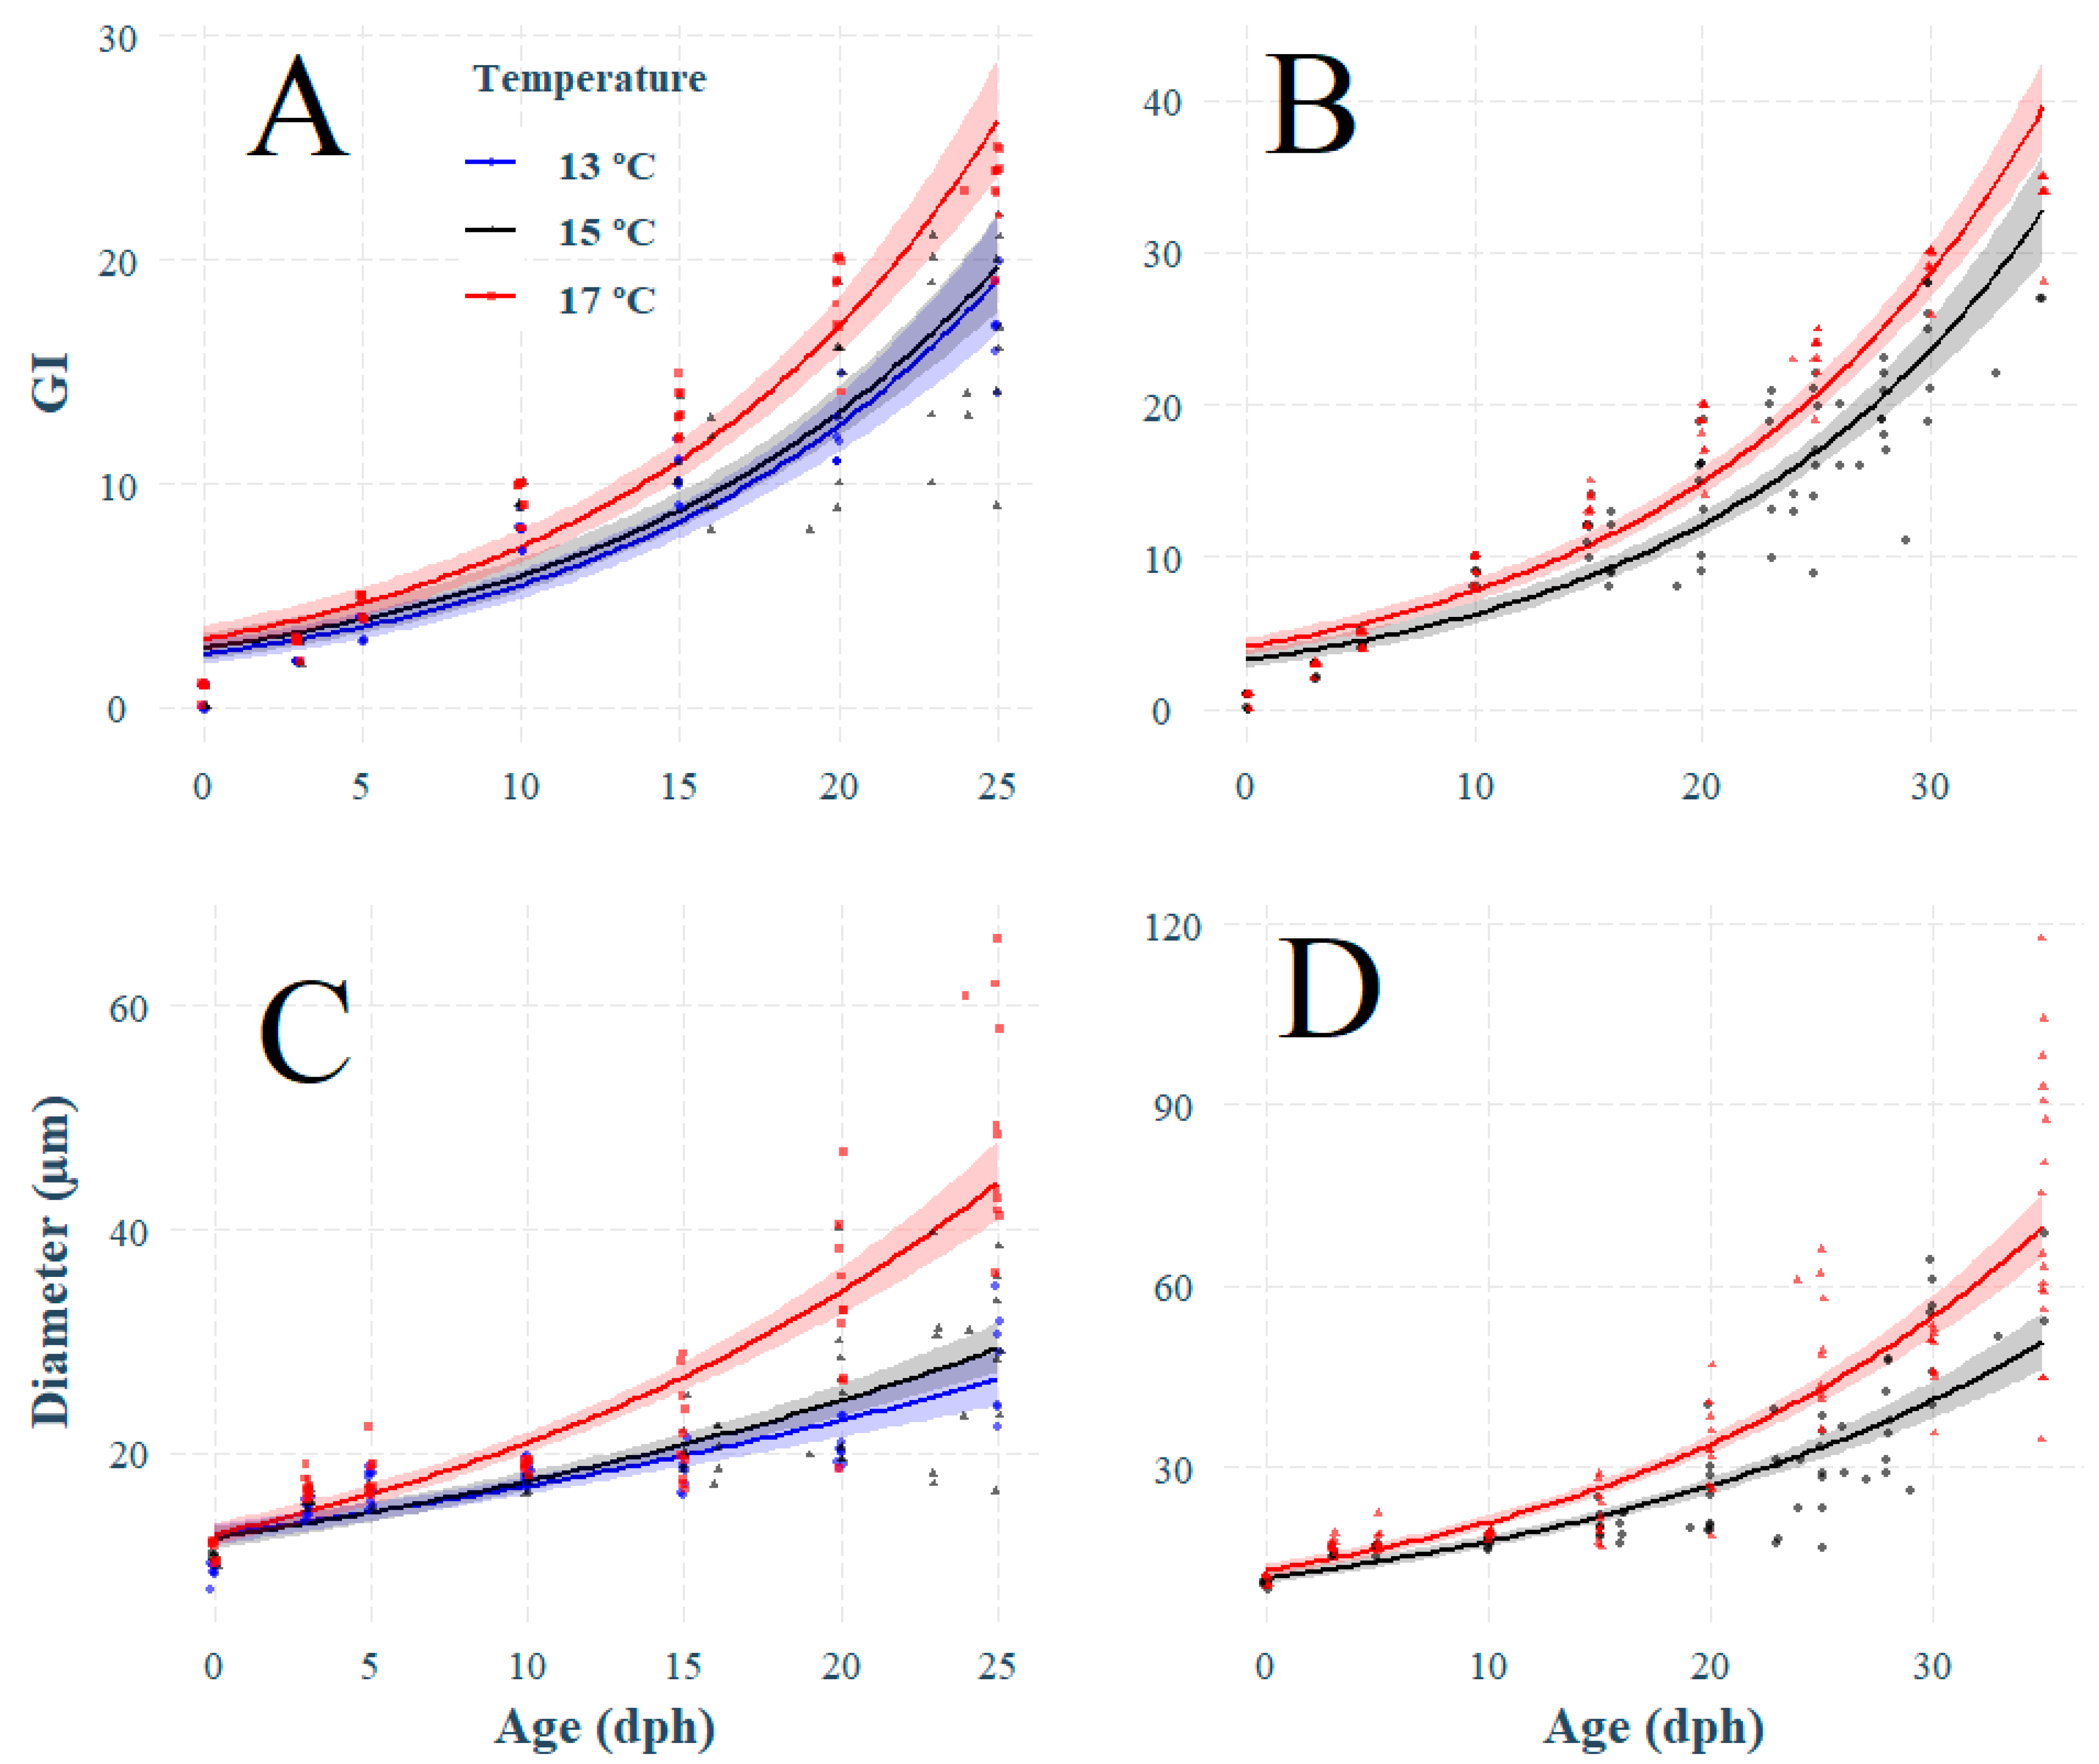
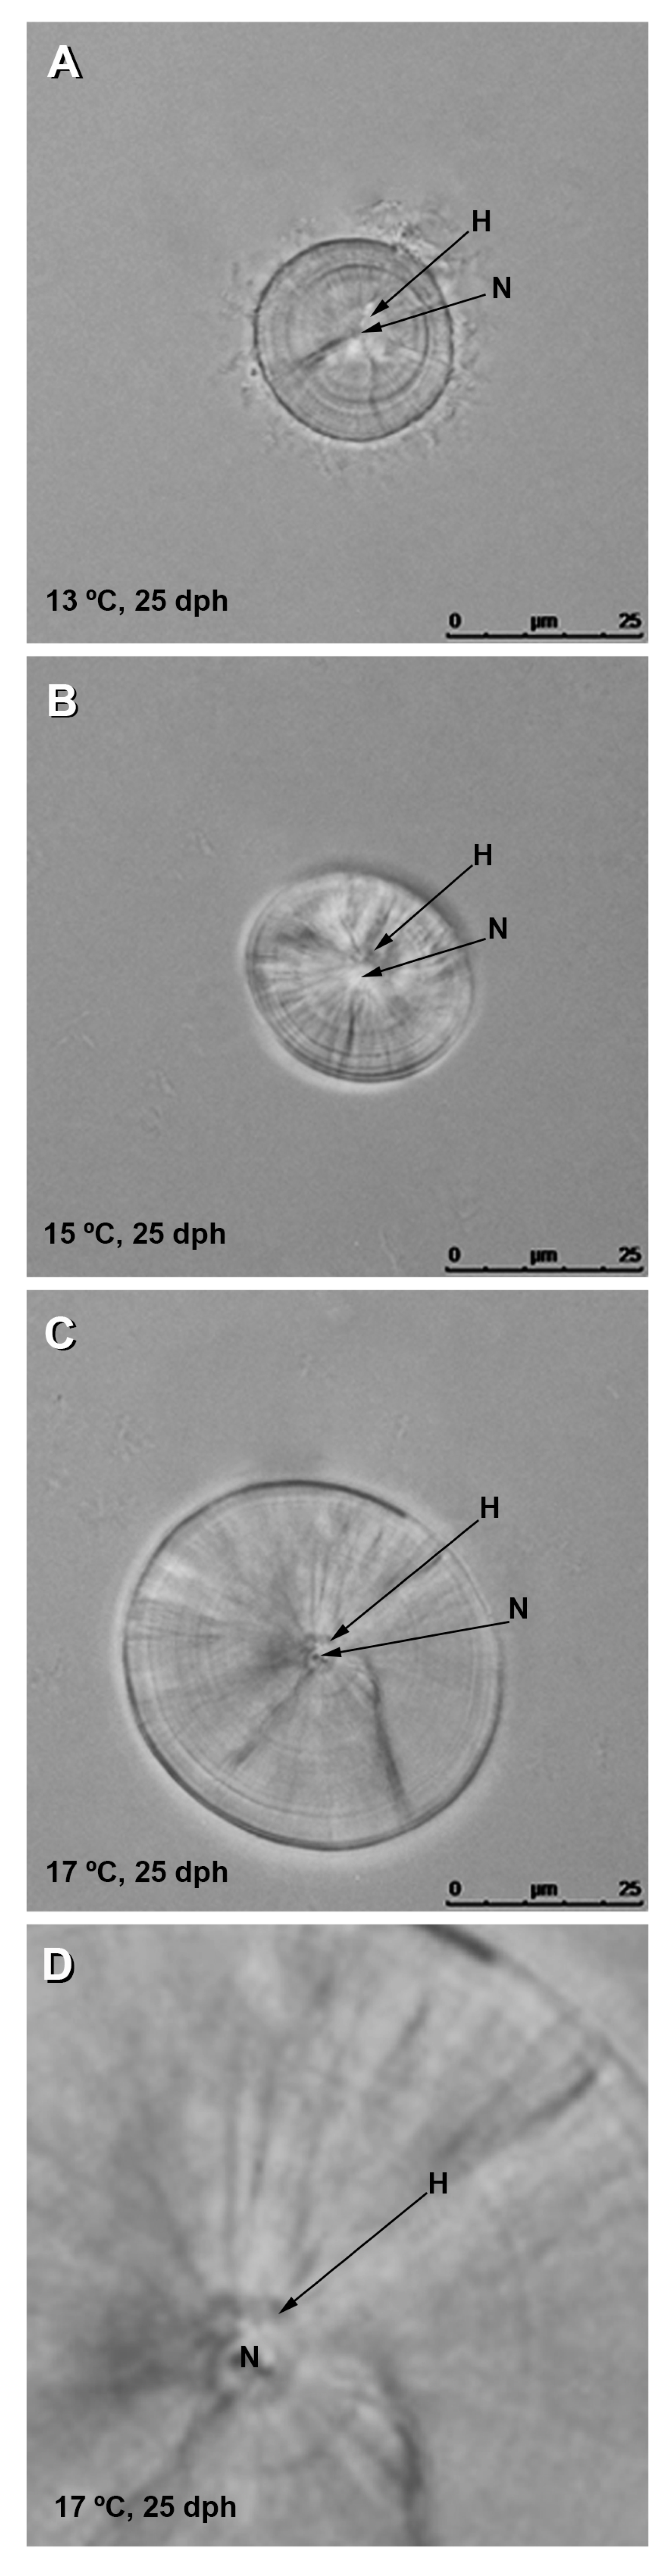
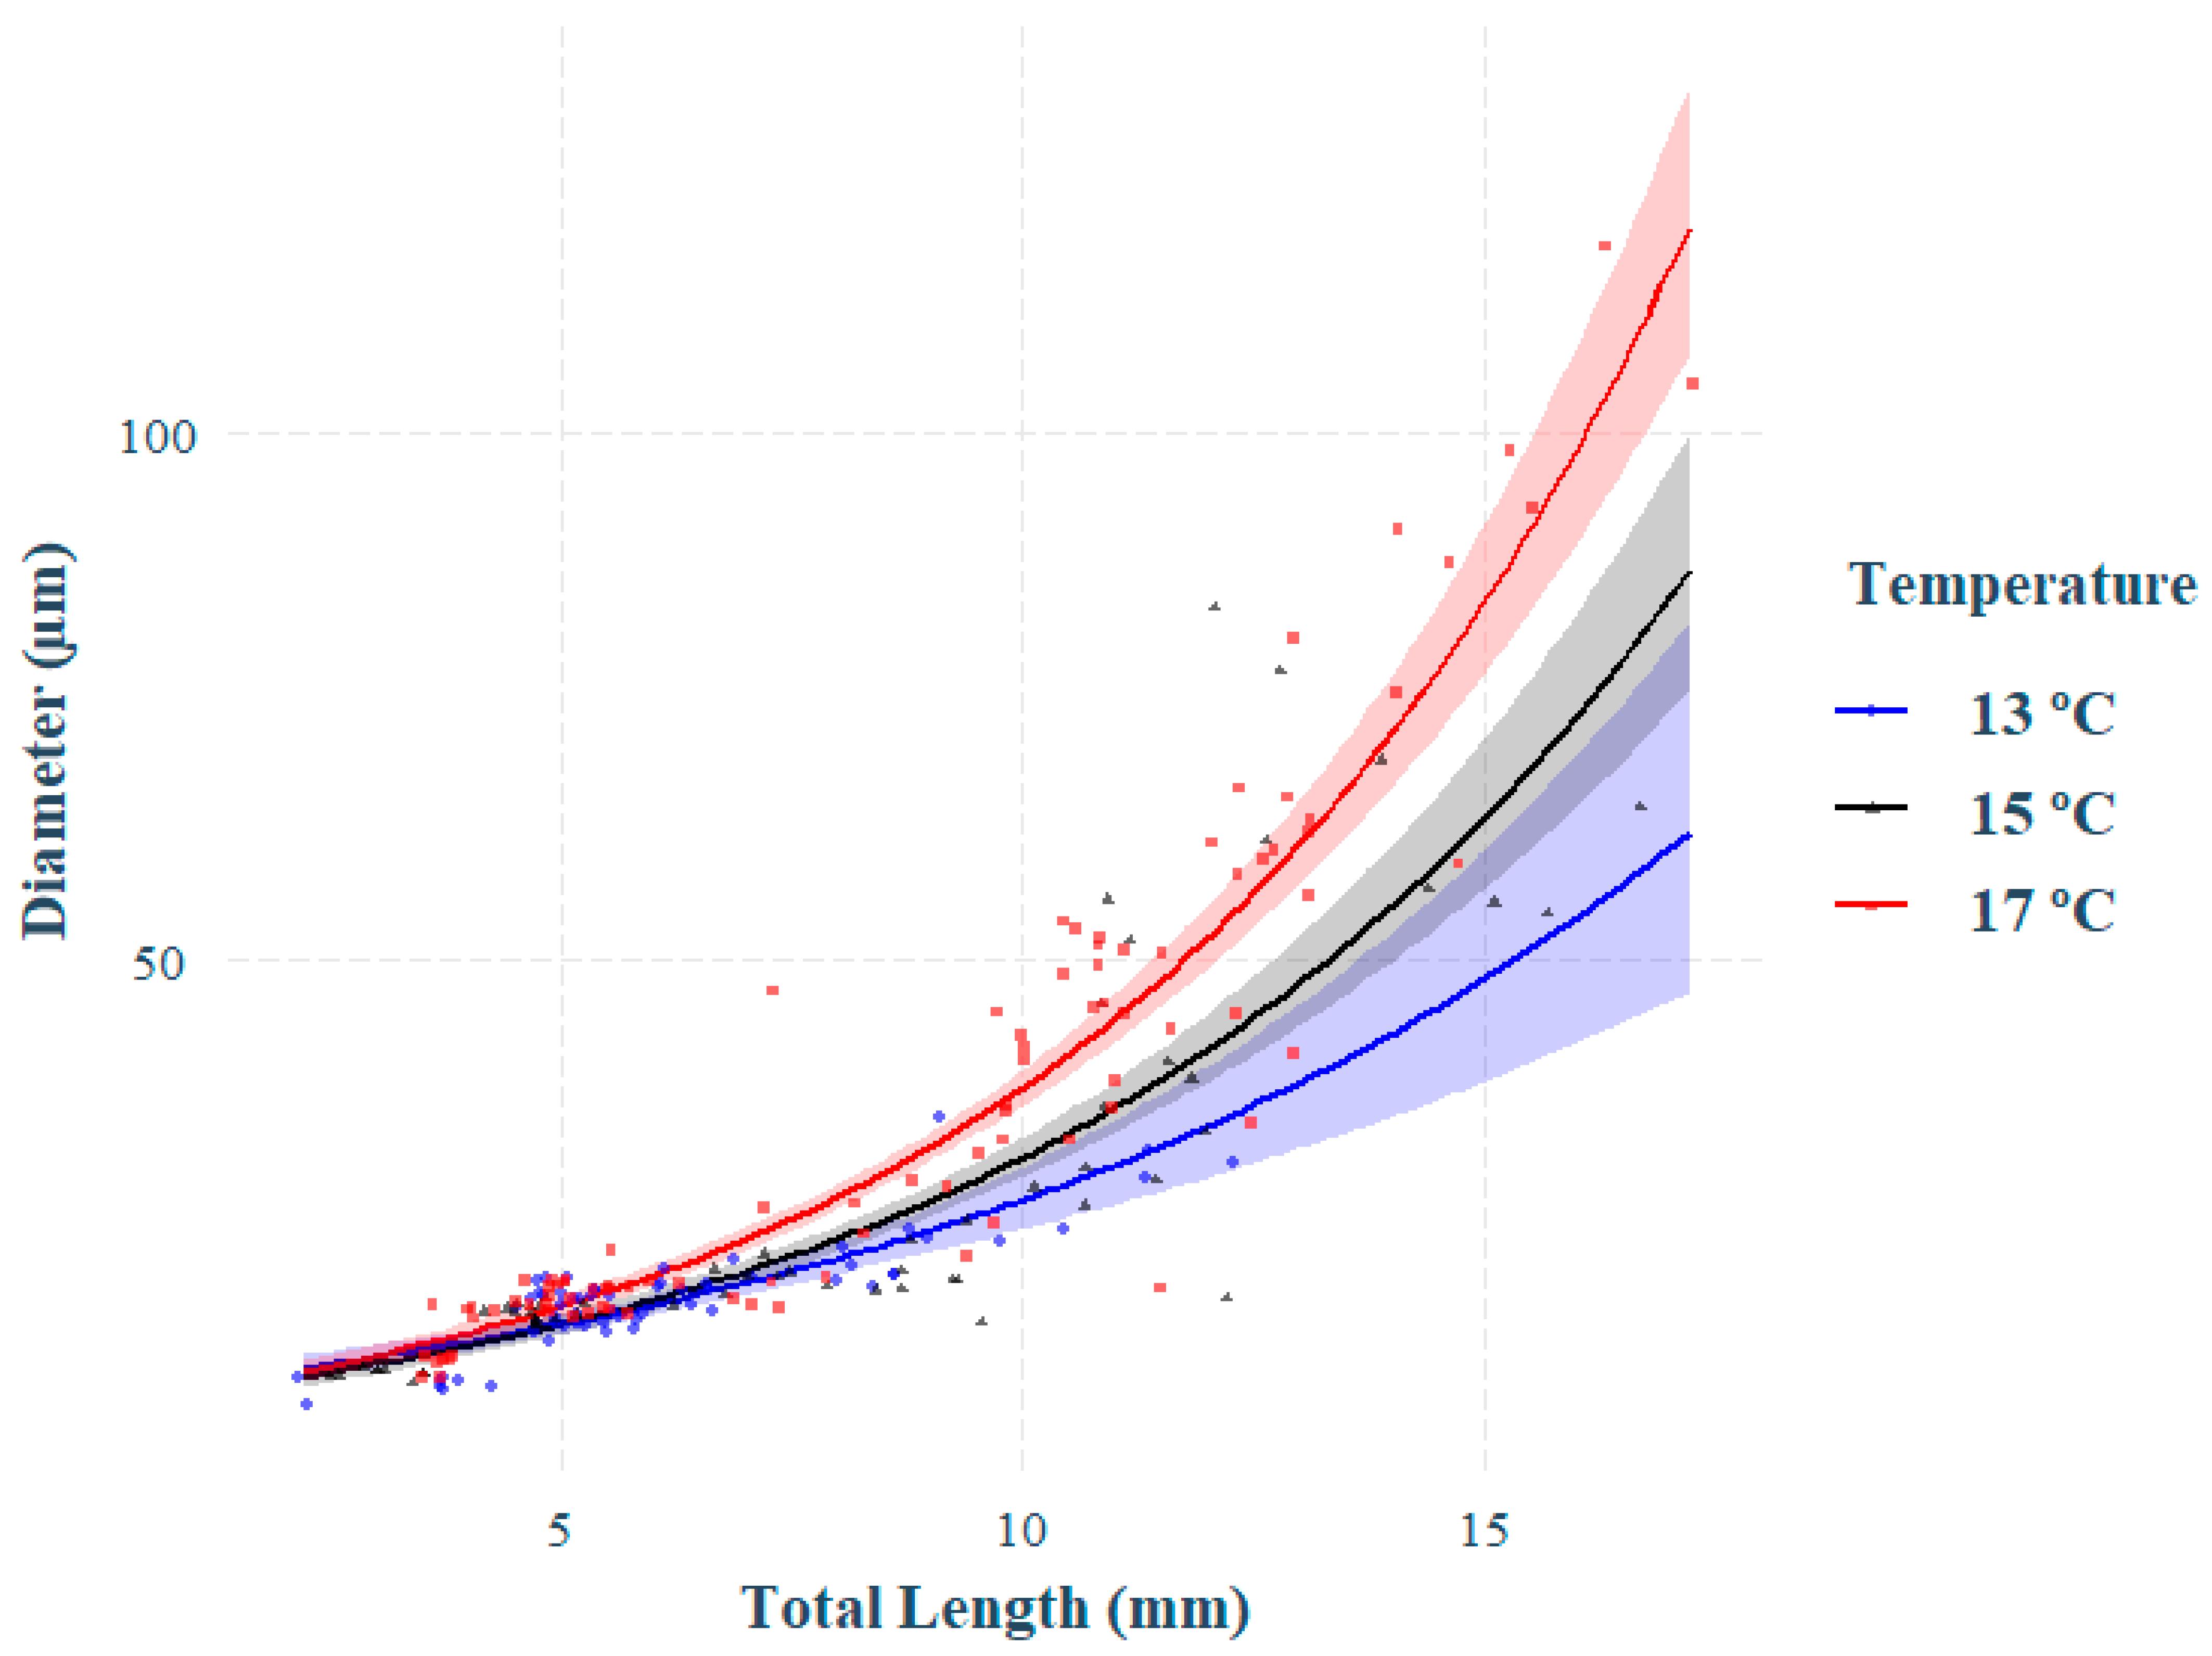
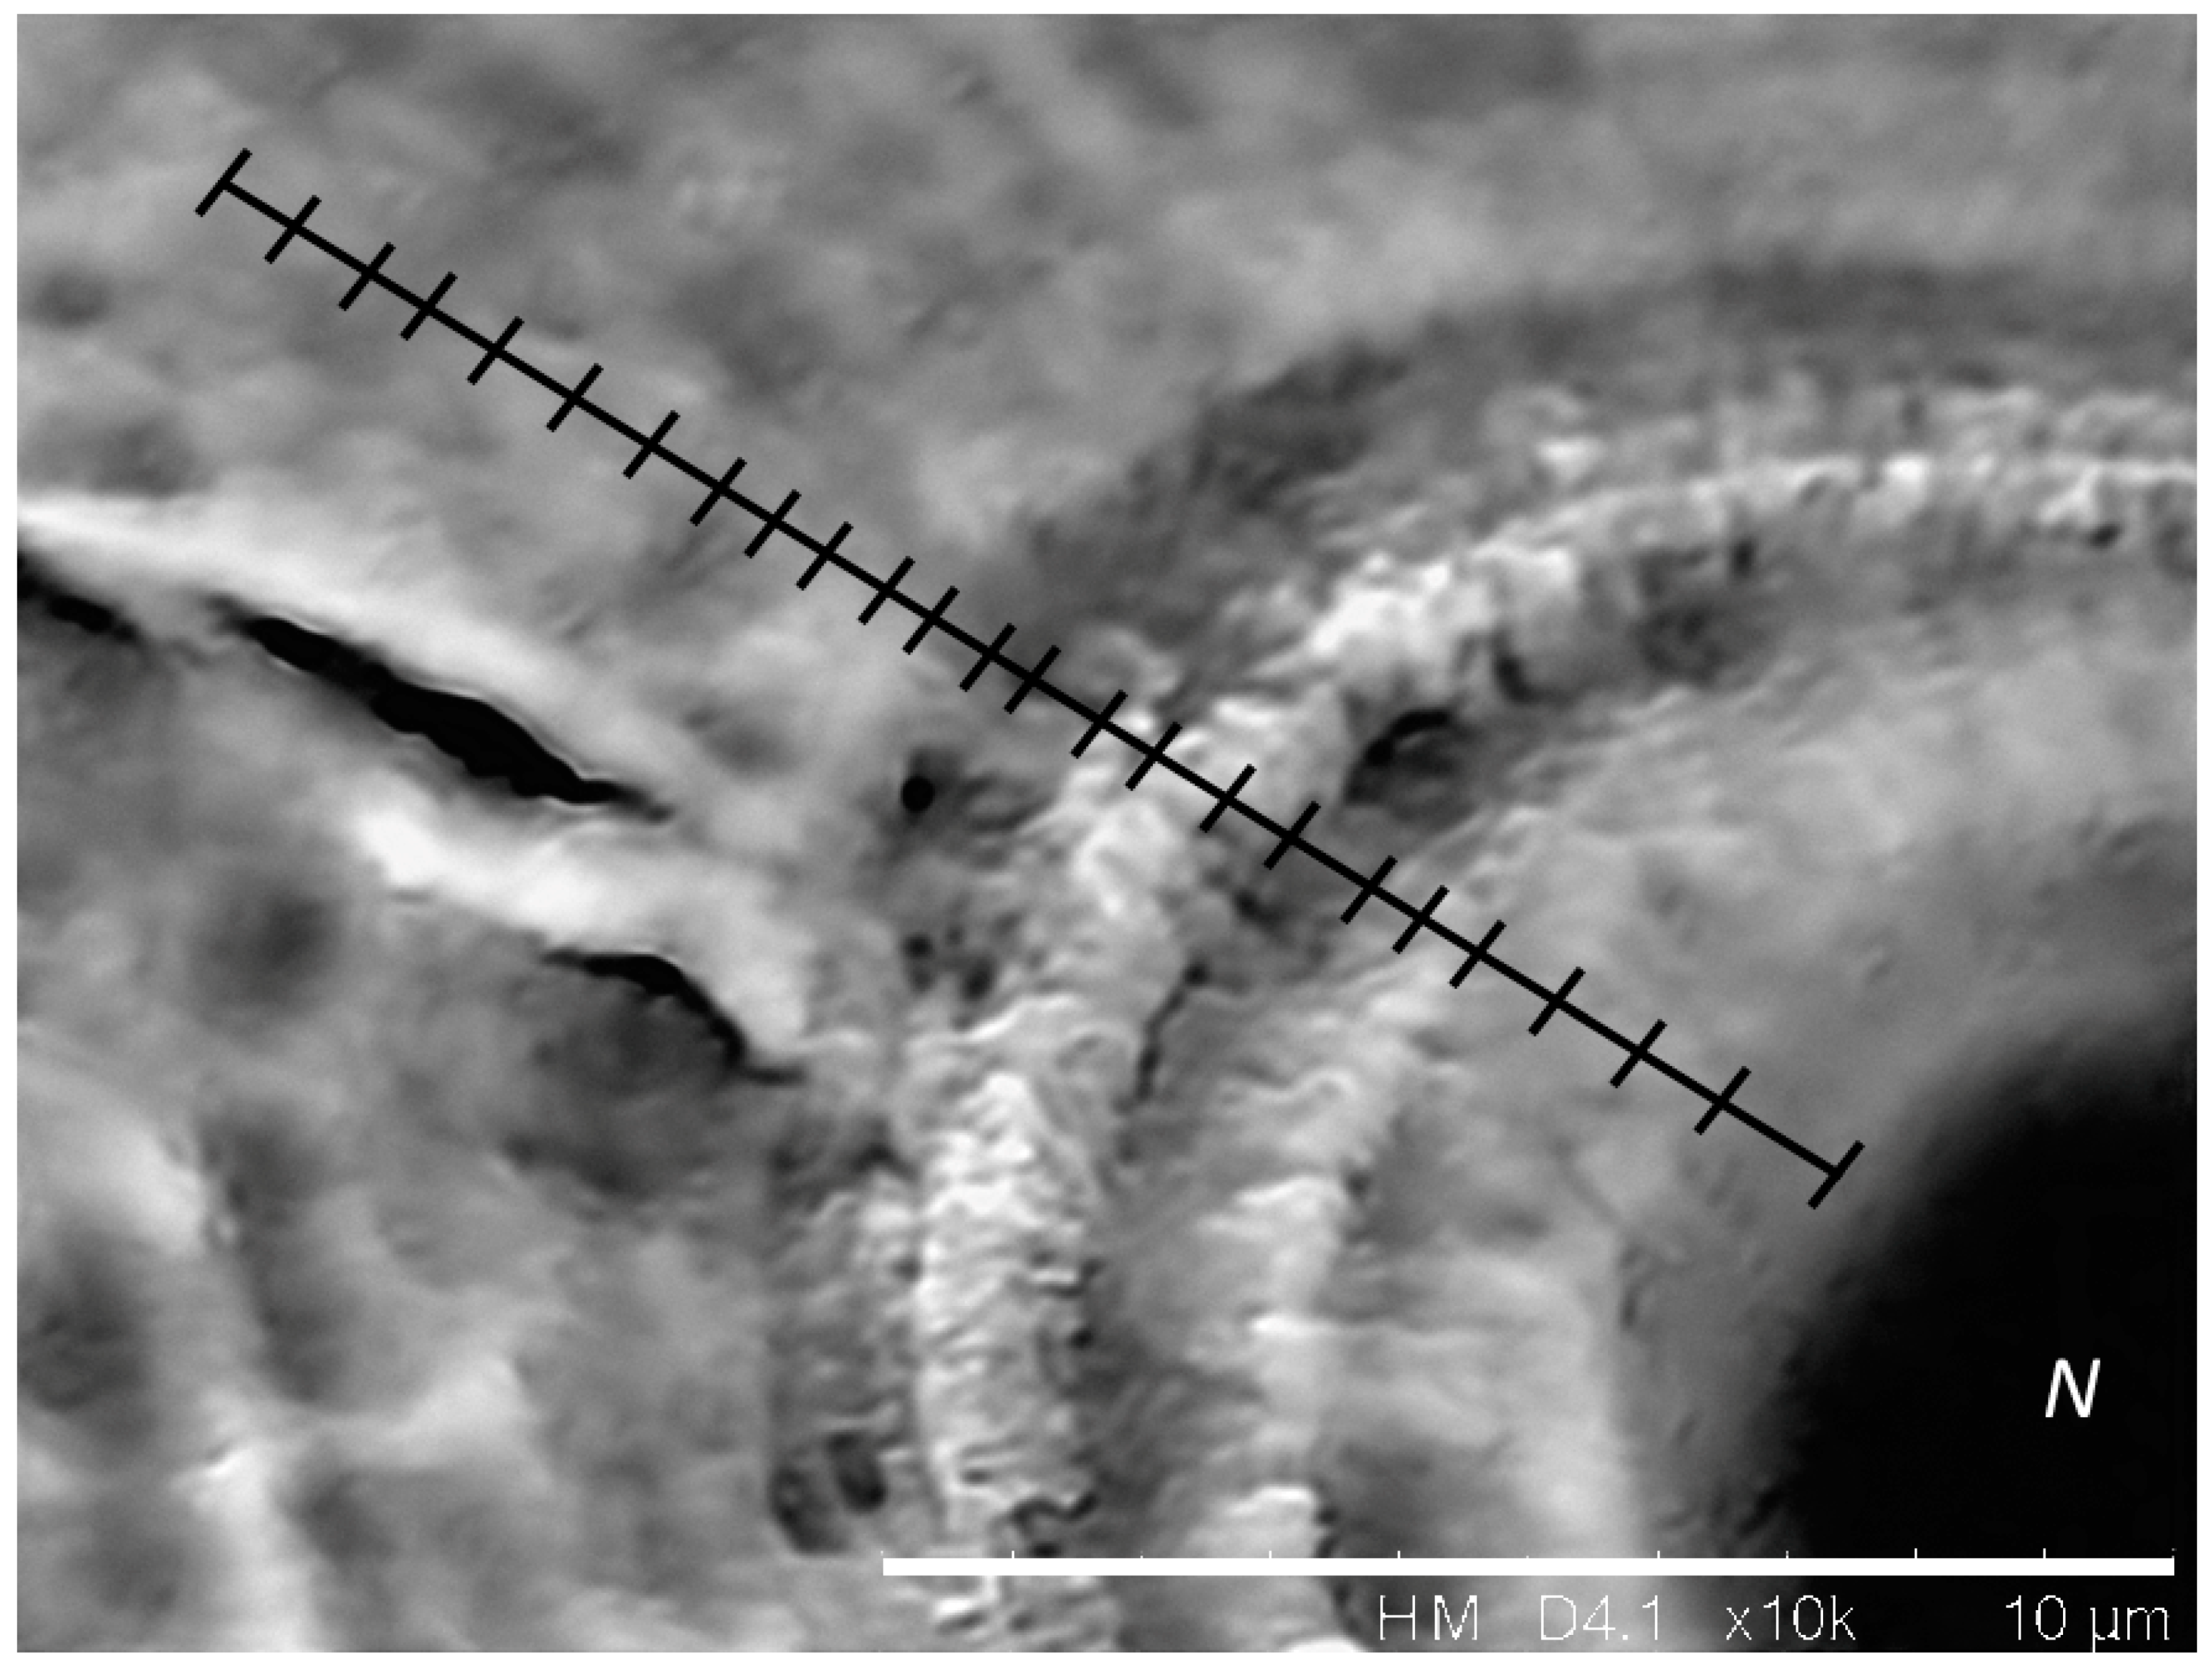
3.2. Effect of Temperature on Otolith Growth and Microstructure

At hatching, the sagittal of each larva consisted of a lenticular core with an average diameter of 10.56 µm (±1.07 SD). The number of increments increased significantly with age for all the temperatures (Figure 2, Table 1).
The variability of increment counts at age within each treatment was very high and no significant differences of GI count were found between larvae reared at 13, 15, and 17 °C (Table 1), although mean GI counts at 17 °C at 25 days post-hatching (dph) were higher than for larvae reared with the other two temperatures. The mean number of GI counted at 25 dph was 19.2, 19.8, and 26.0 GI.day−1 for larvae reared at 13, 15, and 17 °C, respectively. Between 0 to 35 dph, larvae reared at 15 °C had similar GI counts to those reared at 17 °C, 0.9 and 1.0 GI.day−1, respectively.
Growth increment counts increased significantly with larvae size, and the increase was similar for larvae reared with all the temperatures tested in the 0–25 days post-hatching (dph) interval (Table 1). On the other hand, larvae reared at 17 °C showed significantly higher increase of GI formation with larval size than larvae reared at 15 °C for the 0–35 dph period (Table 1). No differences were found in the nucleus diameter (mean 4.42 µm ± 0.75 SD) of larvae in the three treatments. Otolith diameter increased significantly with age, and the increase was higher for larvae reared at 17 °C (Figure 2, Figure 3 and Figure 4; Table 1).

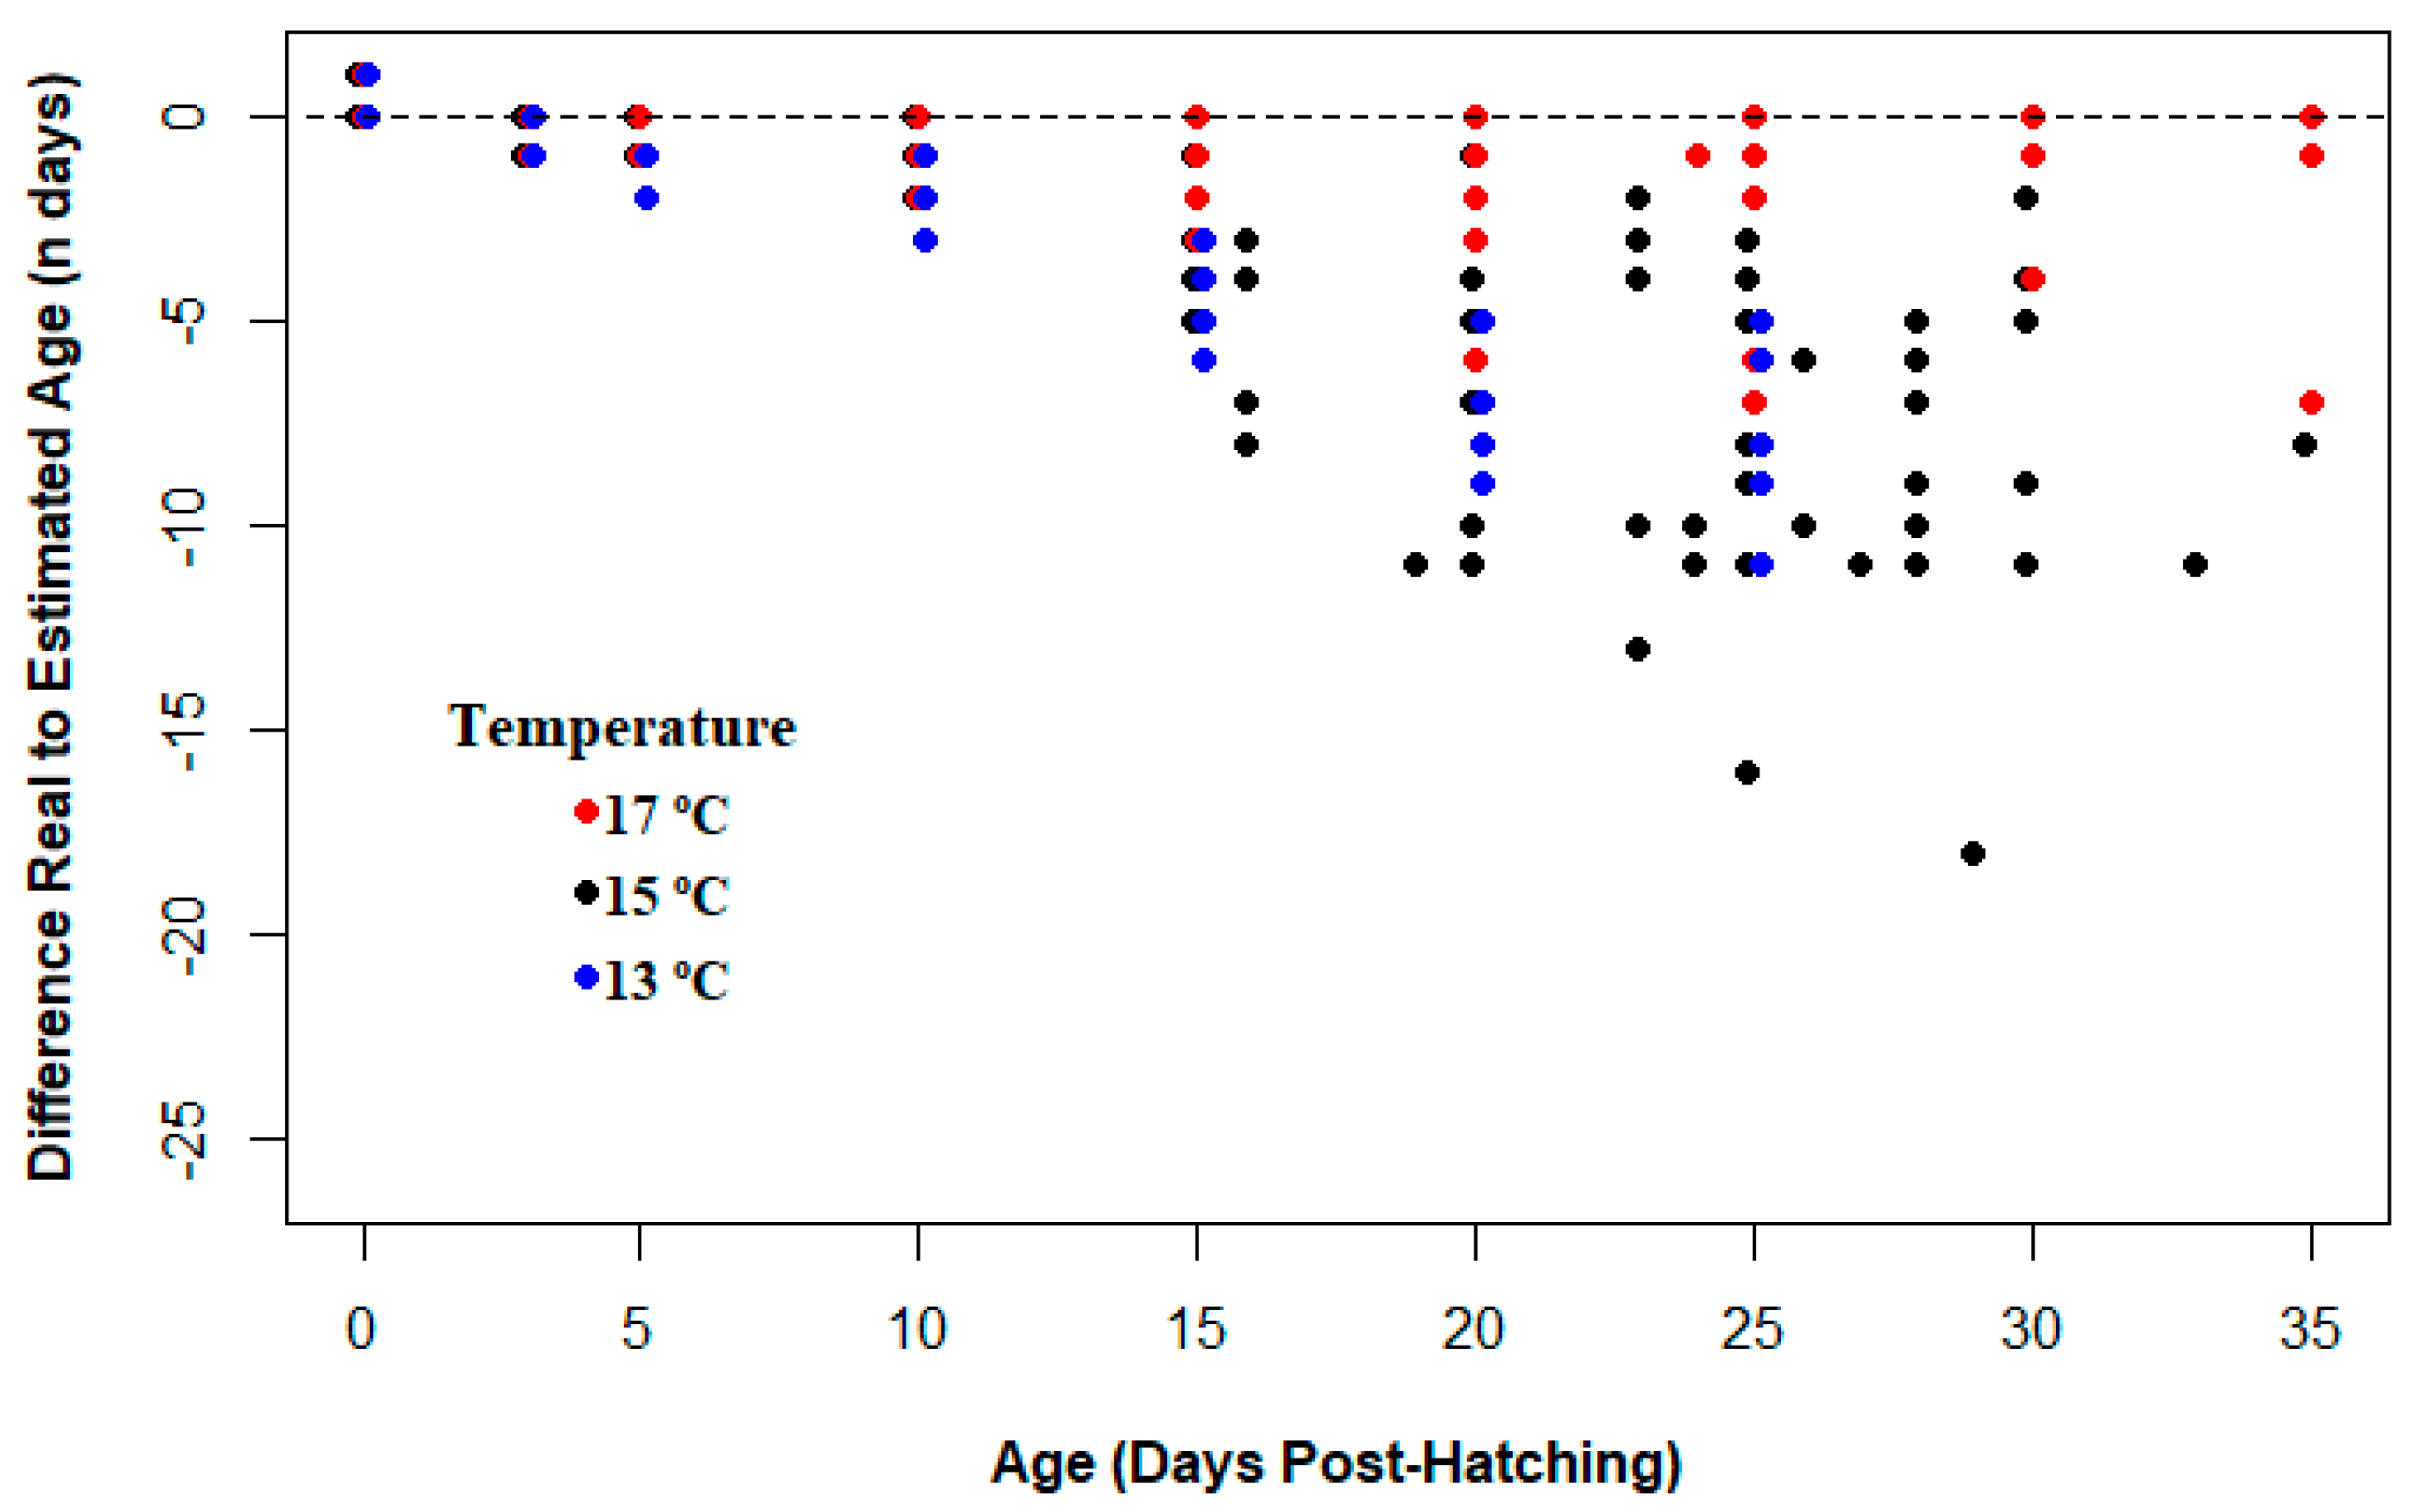
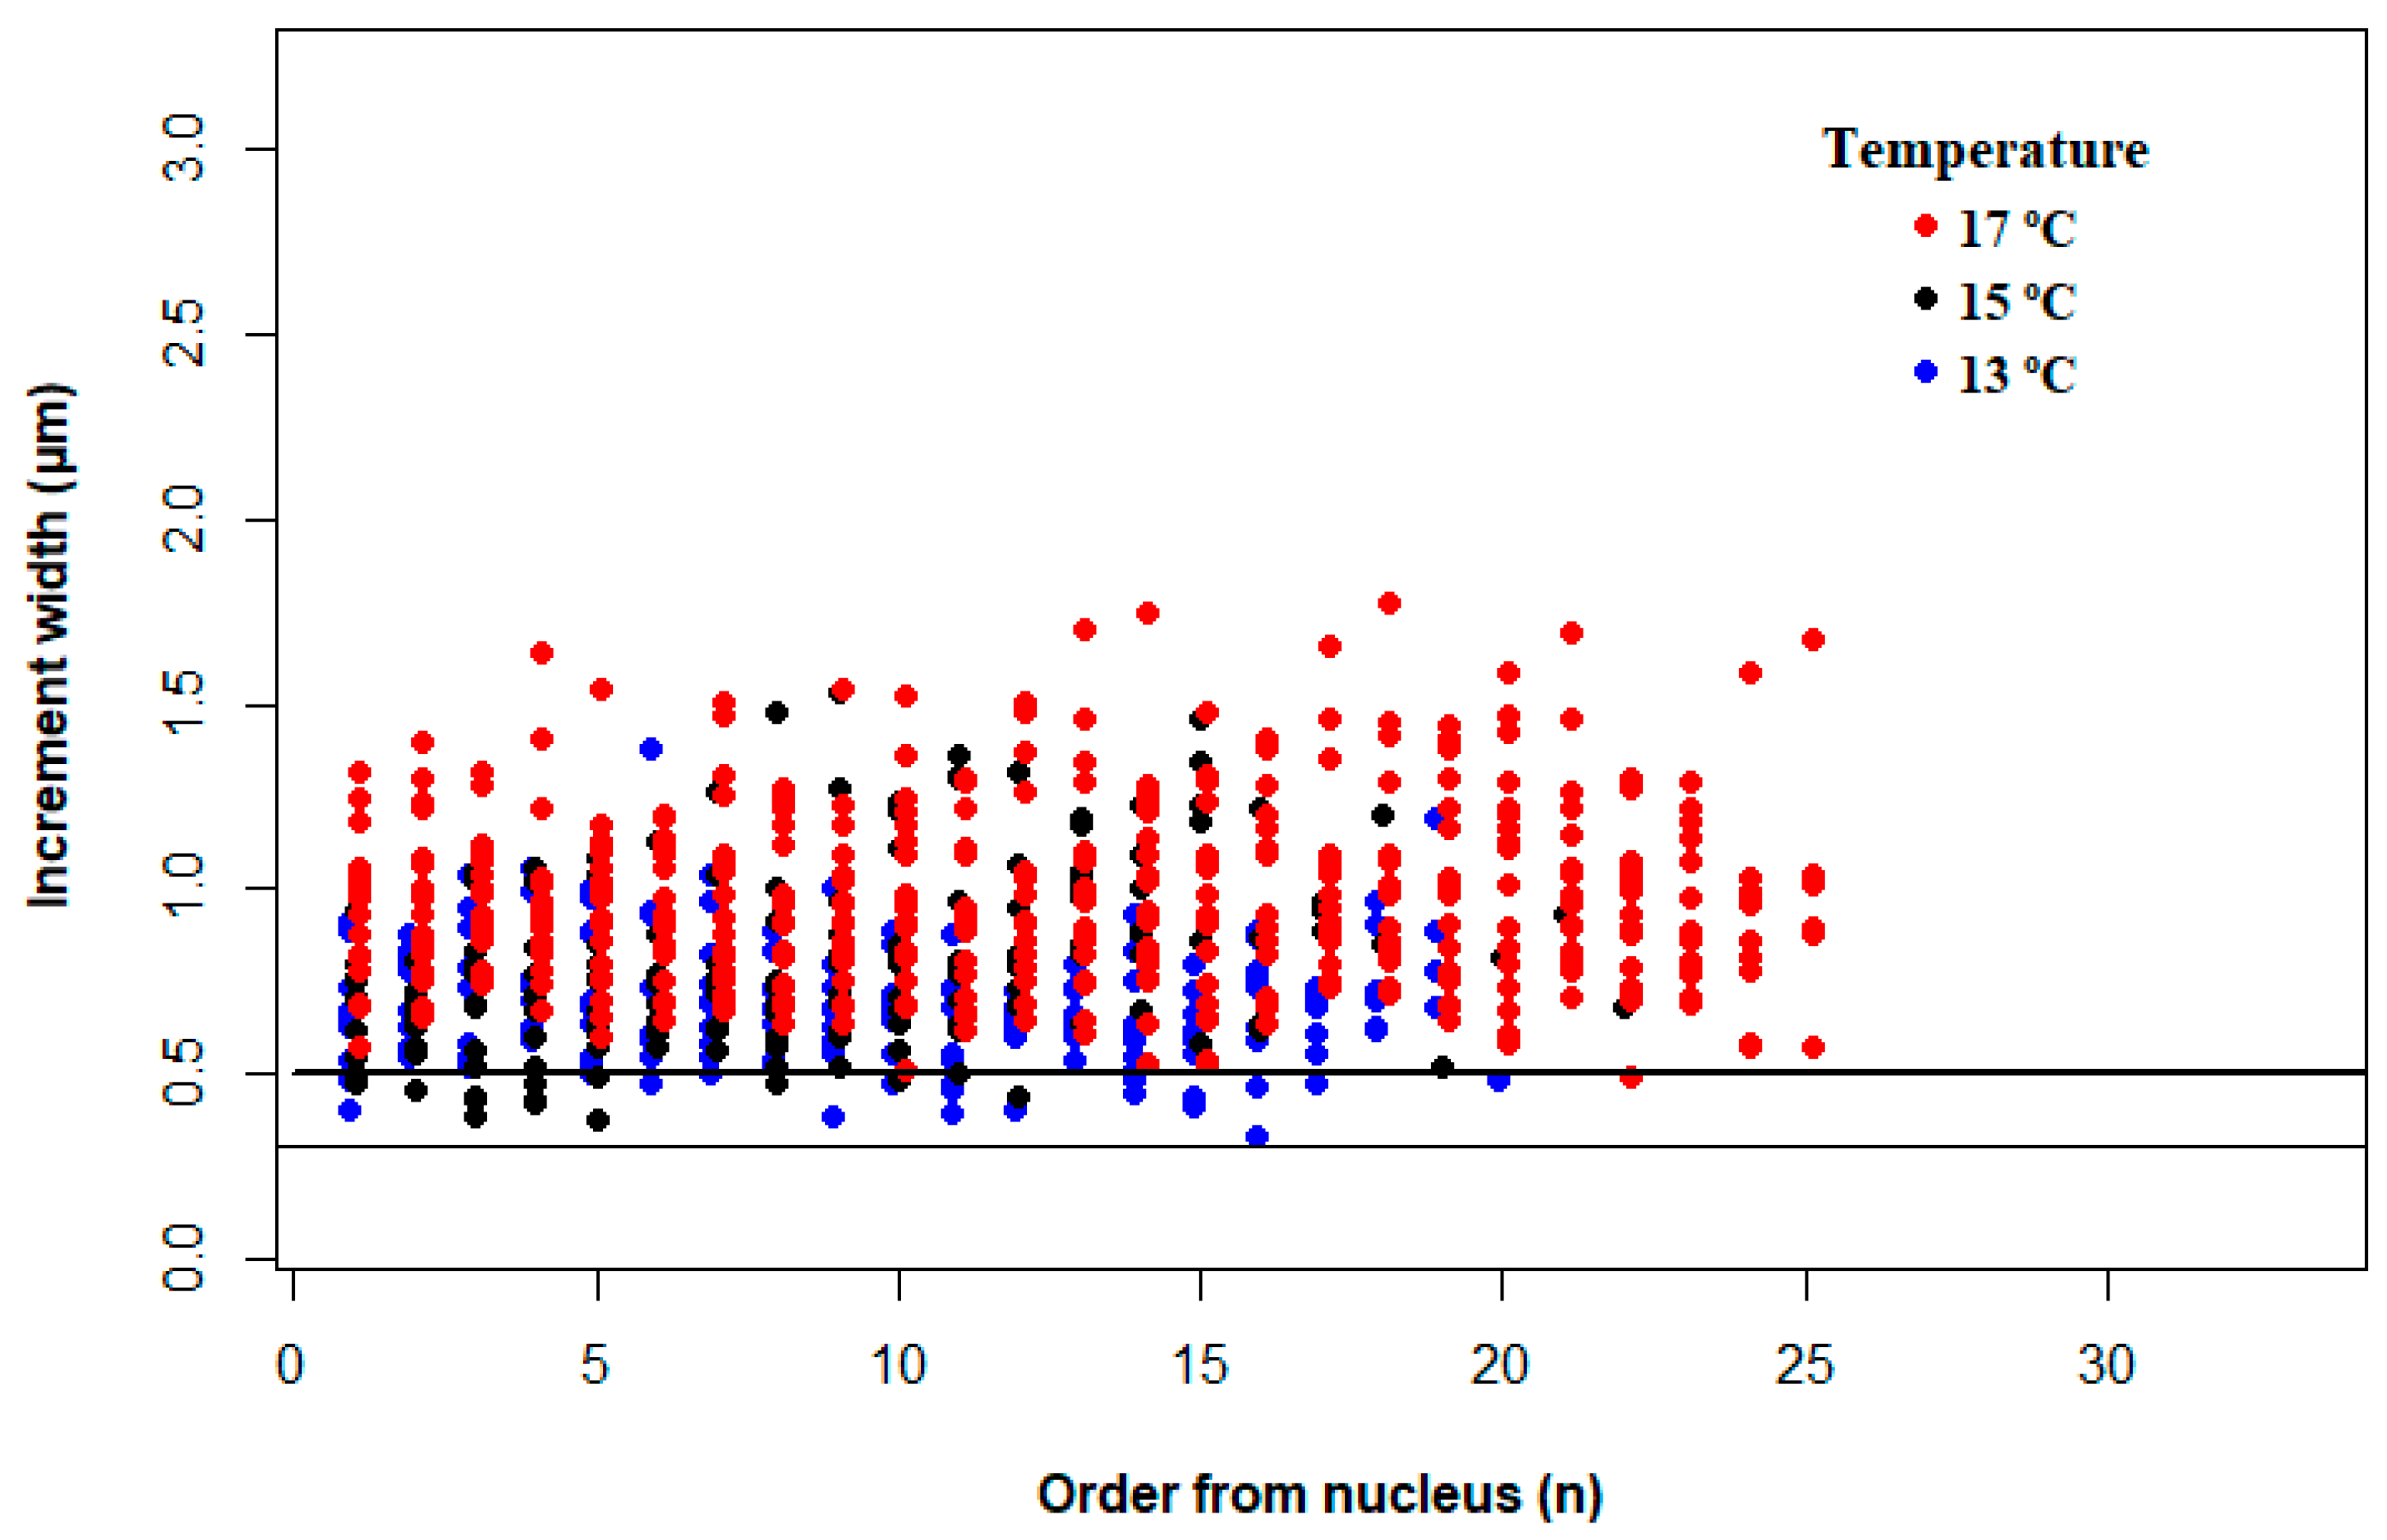
3.3. Effect of Temperature on Otolith Increment Deposition

There was an overestimation of age for newly hatched larvae based on the difference between the real age of sardine larvae and the age estimated by otolith increment counts (Figure 5). For larvae older than 3 days post-hatching (dph), an increase in the discrepancy between estimations and real age was observed, especially for larvae reared at 13 and 15 °C. For larvae reared at 13 °C with a real age of 25 dph, the estimated age varied between 14 and 20 dph (17.1 ± 1.95, mean ± SD), while for larvae reared at 17 °C, the estimated age varied between 19 and 25 dph (23.3 ± 1.76, mean ± SD) (Figure 5).
Increment widths increased significantly with larval age (p = 0.001) and were significantly different for larvae reared with different temperatures (p < 0.0001). Otoliths of larvae reared at 13 °C had smaller increment widths of 0.68 ±0.16 µm, in contrast with those of larvae at 15 °C (0.90 ± 0.33 µm) and 17 °C (0.97 ± 0.24 µm). The otolith increment widths of larvae with 0–25 days post-hatching (dph) reared at 13 and 15 °C exhibited 11–12% of increment widths narrower than 0.5 µm, while at 17 °C increment widths were mostly wider than 0.5 µm for 99.8% of the cases (Figure 6). Generally, there was a high variability of increment widths measured from the nucleus to the otolith outer region (AIC = −309.3), where there were significant variations between temperatures (χ2(1, n = 1159) = 10.181, p = 0.001. Moreover, an increase of 0.116 µm (±0.061 SD) and 0.275 µm (±0.055 SD) was observed for 15 and 17 °C, respectively, while 13 °C did not show any significant difference between increments (F1,3 = 2.295, p = 0.132).
The SEM analysis confirmed the daily deposition of increments and showed a range of increment widths between 0.28 and 0.89 µm (0.56 µm ± 0.18 SD) for larvae under 20 days post-hatching (dph) (Figure 7).

4. Discussion

4.1. Effect of Temperature on Growth, Survival, and Otolith Development

Temperature had a significant effect on larval growth and otolith microstructure, including deposition rate and the relationship between somatic and otolith growth. This has practical consequences for the application of otolith analysis for the age determination of sardine larvae, for back-calculating length or estimating the growth rate at earlier ages, and for understanding the influence of the environment in these processes. The experimental period for larvae in tanks at 13 °C was shorter than the other experimental units since larval survival was reduced at this colder temperature. It has been found that larvae experiencing lower temperatures during the exogenous feeding period had higher daily mortality rates, probably due to the decreased foraging and growth rates at sub-optimal temperatures [35]. On the other hand, within the 13–17 °C range, larvae growth rates increase directly with the increasing temperature [35,55,56]. Higher temperatures, by accelerating the metabolic rates, can influence not only growth rates but especially accelerate ontogeny development [57]. Therefore, larvae experiencing higher temperatures are more active swimmers and begin searching for food earlier than larvae experiencing lower temperatures [36,37].
At hatching, larval size did not differ significantly between temperatures, while hatch-check diameter increased significantly with temperature, although the eggs in these experiments only experienced different temperatures from the hydration stage onwards. Otolith growth is directly related to the metabolic rates that depend on temperature, while larvae size-at-hatch is the result not only of metabolic factors but also maternal effects [58,59,60]. For older larvae, the same tendency of wider otoliths as well as broader increment widths at higher temperatures was observed. Moreover, the influence of temperature on the otolith’s microstructure was observed by Stenevik et al. [10] for wild herring larvae growing at different temperatures. Furthermore, Fitzhugh et al. [13] compared the otolith microstructure of juveniles of menhaden Brevoortia tyrannus reared in controlled laboratory conditions and from the wild at different temperatures. Strong temperature gradients experienced by larvae affect otolith increment spacing and increment patterns, in which prolonged low-temperature periods decrease growth and consequently produce narrower otolith increments, in contrast to optimal temperature conditions [14,61,62]. Comparing the otolith size from similar-sized larvae reared at different temperatures, it was also clear that otolith growth is more visibly affected by temperature as a short-term effect than somatic growth [12,63], since differences of otolith growth for larvae reared at 15 and 17 °C until 35 days post-hatching were significant, while somatic growth was similar.

4.2. Effect of Temperature on Increment Growth Formation

Otolith microstructure analysis seems to be a powerful tool for studying sardine larval ecology. This technique has been extensively used to determine fish larvae age based on the assumption of daily increments deposition [64]. Environmental conditions can influence the number of unreadable increments in the area after the hatch check. This indicates that it is not a question of non-existent daily increments, but a difficulty to identify them with an optical microscope. Therefore, validation in SEM was essential to address the limitation on the optical microscope resolution [10]. Otoliths of larvae reared at 15 °C analyzed with SEM revealed increments that are too narrow (below 0.5 µm) to be detected with an optical microscope, as previously acknowledged [65]. Therefore, larval age estimations by otolith increment counts can have errors due to the limited resolution of the microscope and to an inexperienced observer [34,66,67,68]. SEM seems to be the only technique that can detect these thin increments. However, it is not only an expensive technique, but also preparing these small otoliths for analysis is a very hard and time-consuming procedure, where many otoliths get lost making it impracticable to be done as a routine [50].
Different environmental conditions can affect the accuracy of age estimations [7,10]. In small otoliths, it is common to find clearly visible embryonic increments which can lead to age overestimation, as observed for sardine [66,67] and European anchovy Engraulis encrasicolus (Linnaeus, 1758) larvae [34]. Moreover, age underestimation in wild larvae is possible [62], as we found in this study. The increment count was smaller than one per day, for all larvae reared at 13 °C. In fact, it has been found that non-daily increment formation is related to food conditions, photoperiod, and temperature not only when the larvae experienced sub-optimal conditions, but also when they experienced optimal feeding conditions [9,61,66]. Non-daily otoliths increments have been found on Atlantic salmon Salmo salar (Linnaeus, 1758) larvae, and increment deposition was affected by the photoperiod and temperature [69]. Moreover, for Northern Atlantic mackerel Scomber scombrus (Linnaeus 1758) larvae reared in laboratory controlled conditions, daily otolith increments were only validated for temperatures higher than 13 °C [70], the same for European anchovy larvae reared at temperatures higher than 17 °C [34], and for the Japanese anchovy Engraulis japonicus (Temminck and Schlegel 1846) when reared at temperatures higher than X, even if under unfavorable feeding conditions [71].
For anchovies, age underestimation is less critical since anchovies spawn in spring and summer, when temperatures are often above 18 °C [34]. However, the spawning peak of Iberian sardines occurs when the water temperature is around 15 °C [42]. Therefore, the age and growth rate of wild larvae are likely to be an underestimated rate. Indeed, the first 8–10 growth increments of wild sardine larvae otoliths are relatively narrower and lighter near the nucleus, than the ones after the estimated age of 13 days post-hatching (dph). Previous studies showed that sardine larvae even facing optimal conditions are poor swimmers before approximately 20 dph and are not able to forage efficiently [36,37]. The increase in swimming abilities corresponds to the timing of the notochord flexion, the beginning of the caudal fin formation, and development of the swim bladder, which occurs sooner at 17 °C than at 15 and 13 °C [36,72]. For sardine, daily increment formation starts at hatching but are increasingly marked around the time of the notochord flexion. The effect of the increasing swimming ability on growth increment deposition was increasingly marked for tilapia larvae, suggesting that daily increments only form after the moment larvae starts swimming [73].

4.3. Implications for Stock Management

Obtaining accurate larval age estimations is crucial to back-calculate hatch dates and increment width may also disclose relevant life-history events [10,13]. When analyzing wild larvae whose true age is unknown, an incorrect age estimation can falsely lead to assume the absence of any growth effects dictated by environmental conditions [74]. For example, age underestimation in slow growing fish at higher latitudes can lead to wrong assumptions of larvae growing faster than they really are [12]. The inclusion of uncertainty parameters in age estimation should be considered and adopted to reflect the discrepancies in age estimation according to water temperature. Many studies have used the different patterns of larval growth to distinguish populations and cohorts, but most could not be assigned to any specific environmental variable [10,19,75]. More accurate back-calculations could be possible in fish populations with relatively stable environmental conditions [12]. Understanding the dynamics between environmental factors and otolith microstructure should have clear management implications for vital fishery resources, as discussed for herring Clupea harengus (Linnaeus, 1758) populations of Celtic and Irish Sea [76]. In the case of the Iberian sardine, management is particularly confounded by the uncertainty associated to the high inter annual variability of the recruitment strength. Recruitment strength for the Atlanto-Iberian sardine was shown to be related to variations of the water temperature experienced by the larvae during the spawning season [40]. With ocean temperature rising as a scenario predicted by climate change models [77], it becomes of high importance to understand the effect of temperature on larvae growth and survival and the interplay of temperature with other variables, such as food availability [40]. Understanding how environmental conditions affect larval growth and survival can help us understand their natural fluctuations, and may lead to the development of more reliable recruitment estimates. Therefore, this helps in establishing more appropriate and specific measures of conservation and resource management [78,79].

5. Conclusions

This study showed that temperature variations observed during the peak of the European sardine spawning season (from 13 to 17 °C) have a marked effect on larval growth and otolith microstructure, including the relationship between somatic and otolith growth. Daily increment deposition can be underestimated when using light microscopy and particularly when larvae experience cold temperatures lower than 15 °C. This fact has critical consequences for age determination of wild sardine larvae and for understanding the environmental influence on their growth and survival. Our data demonstrate that age underestimation has to be taken into account when assessing the growth of wild sardine larvae.

Author Contributions

The contributions to the manuscript were as follows: Conceptualization, S.G., P.R., C.S., M.A.T., A.M.S., H.B. and N.B.; methodology, S.G., P.R., C.S., S.F., H.B. and N.B., formal analysis, S.G. and C.S.; writing—original draft preparation and editing, all authors. All authors have read and agreed to the published version of the manuscript.

Funding

This work was supported by Fundação para a Ciência e Tecnologia (FCT) as part of the projects VITAL (Vital rates of pelagic fish larvae PTDC/MAR/111304/2009) and MAR2020 (Project SARDINHA2020, MAR-01.04.02-FEAMP-0009). This study received Portuguese national funds from FCT—Foundation for Science and Technology through project UIDB/04326/2020, and from the operational programmes CRESC Algarve 2020 and COMPETE 2020 through project EMBRC.PT ALG-01-0145-FEDER-022121.

Institutional Review Board Statement

The experimental procedures used in this study were approved by the Animal Welfare and Protection of the General Direction of Veterinary (DGV) of the Ministry of Agriculture, Rural Development and Fisheries, approval number 0420/000/000/2011, Lisbon, Portugal, and were in accordance with the guidelines of the European Directive 2010/63/EU of 22 September and the Portuguese legislation that implements this directive nationally.

Data Availability Statement

Data supporting these results can be found at the University of Algarve repository (Sapienta, http://hdl.handle.net/10400.1/17291 accessed on 12 September 2021).

Acknowledgments

This study was supported by Fundação para a Ciência e Tecnologia (FCT) through the research projects VITAL (FCT-PTDC/MAR/111304/2009), MODELA (PTDC/MAR/098643/2008), and SARDINHA2020 (Mar2020). Thanks are due to Oceanário de Lisboa for experiment support. Moreover, thanks to FCT for contributing a PhD grant (SFRH/BD/82339/2011) to the first author. The authors thank Mestre P. Leitão and his crew (‘Mestre Comboio’) and H. Delgado and S. Farinha (ANOPCERCO). The authors thank E. Saiz for help with prey culturing and to A.D. Silva for help with SEM analysis.

Conflicts of Interest

The authors declare no conflict of interest.

References

  1. Carlson, A.K.; Phelps, Q.E.; Graeb, D.S. Chemistry to conservation: Using otoliths to advance recreational and commercial fisheries management. J. Fish Biol. 2016, 90, 505–527. [Google Scholar] [CrossRef] [PubMed]
  2. Campana, S.E. Measurement and interpretation of the microstructure of fish otoliths. In Otolith Microstructure Examination and Analysis; Stevenson, D.K., Campana, S.E., Eds.; Canadian Special Publication of Fisheries and Aquatic Sciences: Ottawa, ON, Canada, 1992; pp. 59–71. [Google Scholar]
  3. Baumann, H.; Hinrichsen, H.-H.; Voss, R.; Stepputtis, D.; Grygiel, W.; Clausen, L.W.; Temming, A. Linking growth to environmental histories in central Baltic young-of-the-year sprat, Sprattus sprattus: An approach based on otolith microstructure analysis and hydrodynamic modelling. Fish. Oceanogr. 2006, 15, 465–476. [Google Scholar] [CrossRef]
  4. Folkvord, A.; Mosegaard, H.V. Some uses of individual age data. A. Age and growth analysis. In Manual of Fish Sclerochronology; Panfili, J., Troadec, H., de Pontual, H., Wright, P.J., Eds.; Ifremer–IRD co-edition: Brest, France, 2002; pp. 146–166. [Google Scholar]
  5. Mosegaard, H.; Folkvord, A.; Wright, P.J.V. Some uses of individual age data. B. Ecological applications. In Manual of Fish Sclerochronology; Panfili, J., Troadec, H., de Pontual, H., Wright, P.J., Eds.; Ifremer–IRD co-edition: Brest, France, 2002; pp. 167–178. [Google Scholar]
  6. Álvarez, F.; Alemany, F. Regional growth differences in sardine (Sardina pilchardus Walb.) larvae from Catabrian and Galician coasts. ICES. CM 1992, H:9, 10p. [Google Scholar]
  7. Geffen, A.J.; Otolith Microstructure Examination and Analysis. CHAPTER 6: Validation of Otolith Increment Deposition Rate. In Otolith Microstructure Examination and Analysis; Stevenson, D.K., Campana, S.E., Eds.; Canadian Special Publication of Fisheries and Aquatic Sciences: Ottawa, Canada, 1992; Volume 117, pp. 101–113. [Google Scholar]
  8. Ré, P.; Gonçalves, E. Growth of sprat Sprattus sprattus larvae in the German Bight (North Sea) as inferred by otolith microstructure. Mar. Ecol. Prog. Ser. 1993, 96, 139–145. [Google Scholar] [CrossRef]
  9. Feet, P.Ø.; Ugland, K.I.; Moksness, E. Accuracy of age estimates in spring spawning herring (Clupea harengus L.) reared under different prey densities. Fish. Res. 2002, 56, 59–67. [Google Scholar] [CrossRef]
  10. Stenevik, E.K.; Fossum, P.; Johannessen, A.; Folkvord, A. Identification of Norwegian spring spawning herring (Clupea harengus L.) larvae from spawning grounds off western Norway applying otolith microstructure analysis. Sarsia 1996, 80, 285–292. [Google Scholar] [CrossRef]
  11. Allain, G.; Petitgas, P.; Lazure, P.; Grellier, P. Biophysical modelling of larval drift, growth and survival for the prediction of anchovy (Engraulis encrasicolus) recruitment in the Bay of Biscay (NE Atlantic). Fish. Oceanogr. 2007, 16, 489–505. [Google Scholar] [CrossRef]
  12. Folkvord, A.; Johannessen, A.; Moksness, E. Temperature-dependent otolith growth in Norwegian spring-spawning herring (Clupea harengus L.) larvae. Sarsia 2004, 89, 297–310. [Google Scholar] [CrossRef]
  13. Fitzhugh, G.R.; Nixon, S.W.; Ahrenholz, D.W.; Rice, J.A. Temperature Effects on Otolith Microstructure and Birth Month Estimation from Otolith Increment Patterns in Atlantic Menhaden. Trans. Am. Fish. Soc. 1997, 126, 579–593. [Google Scholar] [CrossRef]
  14. Folkvord, A.; Blom, G.; Johannessen, A.; Moksness, E. Growth-dependent age estimation in herring (Clupea harengus L.) larvae. Fish. Res. 2000, 46, 91–103. [Google Scholar] [CrossRef]
  15. Fey, D.P. The effect of temperature and somatic growth on otolith growth: The discrepancy between two clupeid species from a similar environment. J. Fish Biol. 2006, 69, 794–806. [Google Scholar] [CrossRef]
  16. Payne, M.R.; Ross, S.D.; Chausen, L.W.; Munk, P.; Mosegaard, H.; Nash, R.D.M. Recruitment decline in North Sea herring is accompanied by reduced larval growth rates. Mar. Ecol. Prog. Ser. 2013, 489, 197–211. [Google Scholar] [CrossRef] [Green Version]
  17. Moksness, E. Validation of daily increments in the otolith microstructure of Norwegian spring-spawning herring (Clupea harengus L.). ICES J. Mar. Sci. J. Du Cons. 1992, 49, 231–235. [Google Scholar] [CrossRef]
  18. Cieri, M.D.; McCleave, J.D. Validation of daily otolith increments in glass-phase American eels Anguilla rostrate (Lesueur) during estuarine residency. J. Exp. Mar. Biol. Ecol. 2001, 257, 219–227. [Google Scholar] [CrossRef]
  19. Kano, Y.; Takatsu, T.; Hashimoto, Y.; Inagaki, Y.; Nakatani, T. Annual variation in otolith increment widths of walleye pollock (Gadus chalcogrammus) larvae in Funka Bay, Hokkaido, Japan. Fish. Oceanogr. 2015, 24, 325–334. [Google Scholar] [CrossRef]
  20. Bakun, A. Wasp-waist populations and marine ecosystem dynamics: Navigating the ‘‘predator pit’’ topographies. Progr. Oceanogr. 2006, 68, 271–288. [Google Scholar] [CrossRef]
  21. Peck, M.A.; Reglero, P.; Takahashi, M.; Catalán, I.A. Life cycle ecophysiology of small pelagic fish and climate-driven changes in populations. Prog. Oceanogr. 2013, 116, 220–245. [Google Scholar] [CrossRef] [Green Version]
  22. Kawasaki, T. Long term variability of pelagic fish populations. In Long-Term Variability of Pelagic Fish Populations and Their Enviroment. Proceedings of the International Symposium, Sendai, Japan, 14–18 November 1989; Kawasaki, T., Tanaka, S., Toba, Y., Taniguchi, A., Eds.; Pergamon Press: Oxford, UK, 1991; pp. 47–60. [Google Scholar]
  23. Petigas, P.; Secor, D.H.; McQuinn, I.; Huse, G.; Lo, N. Stock collapses and their recovery: Mechanisms that establish and maintain life-cycle closure in space and time. ICES J. Mar. Sci. 2010, 67, 1841–1848. [Google Scholar] [CrossRef] [Green Version]
  24. Alheit, J.; Bakun, A. Population synchronies within and between ocean basins: Apparent teleconnections and implications as to physical–biological linkage mechanisms. J. Mar. Syst. 2010, 79, 267–285. [Google Scholar] [CrossRef]
  25. Alemany, F.; Álvarez, F. Growth differences among sardine (Sardina pilchardus Walb.) population in Western Mediterranean. Sci. Mar. 1993, 57, 229–239. [Google Scholar]
  26. Garrido, S.; Santos, A.M.P.; Santos, A.; Ré, P. Spatial distribution and vertical migrations of fish larvae communities off Northwestern Iberia sampled with LHPR and Bongo nets. Estuar. Coast. Shelf Sci. 2009, 84, 463–475. [Google Scholar] [CrossRef]
  27. Correia, A.T.; Hamer, P.; Carocinho, B.; Silva, A. Evidence for meta-population structure of Sardina pilchardus in the Atlantic Iberian waters from otolith elemental signatures of a strong cohort. Fish. Res. 2014, 149, 76–85. [Google Scholar] [CrossRef]
  28. Feijó, D.; Marçalo, A.; Wise, L.; Bento, T.; Barra, J.; Correia, M.; Pinto, D.; Lechuga, R.; Felício, M.; Dinis, D.; et al. The Portuguese purse seine fishery (2006–2016): What has changed in 10 years? FiSHMED 2018, 11. [Google Scholar]
  29. ICES. Management plan evaluation for sardine in Divisions VIIIc and IXa. In Report of the ICES Advisory Committee; Book 7, Section 7.3.5.1; ICES Advice: Copenhagen, Denmark, 2013; pp. 8–15. [Google Scholar]
  30. Bode, A.; Álvarez-Ossorio, M.T.; Carrera, P.; Lorenzo, J. Reconstrution of trophic pathways between plankton and the North Iberian sardina (Sardina pilchardus) using stable isotopes. Sci. Mar. 2004, 68, 165–178. [Google Scholar] [CrossRef] [Green Version]
  31. Alemany, F.; Álvarez, I.; García, A.; Cortés, D.; Ramírez, T.; Quintanilla, J.; Álvarez, F.; Rodríguez, J.M. Postflexion larvae and juvenile daily growth patterns of the Alborán Sea sardine (Sardina pilchardus Walb.): Influence of wind. Sci. Mar. 2006, 70, 93–104. [Google Scholar] [CrossRef] [Green Version]
  32. Sponaugle, S.; Boulay, J.N.; Rankin, T.L. Growth- and size-selective mortality in pelagic larvae of a common reef fish. Aquat. Biol. 2011, 13, 263–273. [Google Scholar] [CrossRef] [Green Version]
  33. Takasuka, A.; Aoki, I.; Mitani, I. Evidence of growth-selective predation on larval Japanese anchovy Engraulis japonicus in Sagami Bay. Mar. Ecol. Prog. Ser. 2003, 252, 223–238. [Google Scholar] [CrossRef]
  34. Aldanondo, N.; Cotano, U.; Etxebeste, E.; Irigoien, X.; Alvarez, P.; Martínez de Murguía, A.; Herrero, D.L. Validation of daily increments deposition in the otoliths of European anchovy larvae (Engraulis encrasicolus L.) reared under different temperature conditions. Fish. Res. 2008, 93, 257–264. [Google Scholar] [CrossRef]
  35. Garrido, S.; Cristóvão, A.; Caldeira, C.; Ben-Hamadou, R.; Baylina, N.; Batista, H.; Saiz, E.; Peck, M.A.; Ré, P.; Santos, A.M.P. Effect of temperature on the growth, survival, development and foraging behaviour of Sardina pilchardus larvae. Mar. Ecol. Prog. Ser. 2016, 559, 131–145. [Google Scholar] [CrossRef] [Green Version]
  36. Silva, L.; Faria, A.M.; Teodósio, M.A.; Garrido, S. Ontogeny of swimming behaviour in sardine Sardina pilchardus larvae and effect of larval nutritional condition on critical speed. Mar. Ecol. Prog. Ser. 2014, 504, 287–300. [Google Scholar] [CrossRef]
  37. Caldeira, C.; Santos, A.M.P.; Ré, P.; Peck, M.A.; Saiz, E.; Garrido, S. Effects of prey concentration on ingestion rates of European sardine (Sardina pilchardus) larvae in the laboratory. Mar. Ecol. Prog. Ser. 2014, 517, 217–228. [Google Scholar] [CrossRef] [Green Version]
  38. Ré, P. Otolith microstructure and detection of life history events in sardine and anchovy larvae. Ciênc. Biol. Ecol. Syst. 1986, 6, 9–17. [Google Scholar]
  39. Chícharo, M.A.; Chícharo, L.; Valdés, L.; Lopez-Jamar, E.; Ré, P. Does the nutritional condition limit survival potential of sardine Sardina pilchardus (Walbaum, 1792) larvae off the north coast of Spain? RNA/DNA ratios and their variability. Fish. Res. 1998, 39, 43–54. [Google Scholar] [CrossRef]
  40. Garrido, S.; Silva, A.; Marques, V.; Figueiredo, I.; Bryère, P.; Mangin, A.; Santos, A.M.P. Temperature and food-mediated variability of European Atlantic sardine recruitment. Prog. Oceanogr. 2017, 159, 267–275. [Google Scholar] [CrossRef]
  41. Ottersen, G.; Stige, L.C.; Durant, J.M.; Chan, K.-S.; Rouyer, T.A.; Drinkwater, K.F.; Stenseth, N.C. Temporal Shifts in recruitment dynamics of North Atlantic fish stocks: Effects of spawning stock and temperature. Mar. Ecol. Progr. Ser. 2013, 480, 205–225. [Google Scholar] [CrossRef] [Green Version]
  42. Ré, P.; Cabral e Silva, R.; Cunha, E.; Farinha, A.; Meneses, I.; Moita, T. Sardine spawning off Portugal. Boletim do Instituto Nacional de Investigação das Pescas 1990, 15, 31–44. [Google Scholar]
  43. Stratoudakis, Y.; Coombs, S.; de Lanzós, A.L.; Halliday, N.; Costas, G.; Caneco, B.; Franco, C.; Conway, D.; Santos, M.B.; Silva, A.; et al. Sardine (Sardina pilchardus) spawning seasonality in European waters of the northeast Atlantic. Mar. Biol. 2007, 152, 201–212. [Google Scholar] [CrossRef]
  44. Bernal, M.; Ibaibarriaga, L.; Lago de Lanzós, A.; Lonergan, M.E.; Hernández, C.; Franco, C.; Rasines, I.; Valdés, L.; Borchers, D.L. Using multinomial models to analyse data from Iberian sardine egg incubation experiments: A comparison with traditional techniques. ICES J. Mar. Sci. 2008, 65, 51–59. [Google Scholar] [CrossRef]
  45. Miranda, A.; Cal, R.M.; Iglesias, J. Effect of temperature on the development of eggs and larvae of Sardina pilchardus Walbaum in captivity. J. Exp. Mar. Biol. Ecol. 1990, 140, 69–77. [Google Scholar] [CrossRef]
  46. Zwolinski, J.; Mason, E.; Oliveira, P.B.; Stratoudakis, Y. Fine-scale distribution of sardine (Sardina pilchardus) eggs and adults during a spawning event. J. Sea Res. 2006, 56, 294–304. [Google Scholar] [CrossRef]
  47. Coombs, S.H.; Boyra, G.; Rueda, L.D.; Uriarte, A. Buoyancy measurements and vertical distribution of eggs of sardine (Sardina pilchardus) and anchovy (Engraulis encrasicolus). Mar. Biol. 2004, 145, 959–970. [Google Scholar] [CrossRef]
  48. Palmer, P.; Burke, M.J.; Palmer, C.J.; Burke, J.B. Deveolpments in controlled green-water larval culture technologies for estuarine fishes in Queensland, Australia and elsewhere. Aquaculture 2007, 272, 1–21. [Google Scholar] [CrossRef]
  49. Hedges, K.J.; Ludsin, S.A.; Fryer, B.J. Effects of ethanol preservation on otolith microchemistry. J. Fish. Biol. 2004, 64, 923–937. [Google Scholar] [CrossRef] [Green Version]
  50. Campana, S.; Cagne, J.; Munro, J. Otolith microstructure of larval herring (Clupea harengus): Image or reality? Can. J. Fish. Aquat. Sci. 1987, 44, 1922–1929. [Google Scholar] [CrossRef]
  51. R Development Core Team. R: A Language and Environment for Statistical Computing; Version 4.0.2.; R Foundation for Statistical Computing: Vienna, Austria, 2020. [Google Scholar]
  52. Wickham, H. Ggplot2: Elegant Graphics for Data Analysis; Springer-Verlag: New York, NY, USA, 2016; ISBN 978-3-319-24277-4. Available online: https://ggplot2.tidyverse.org (accessed on 12 September 2021).
  53. Long, J.A. Interactions: Comprehensive, User-Friendly Toolkit for Probing Interactions, R Package Version 1.1.0. 2019. Available online: https://cran.r-project.org/package=interactions (accessed on 12 September 2021).
  54. Bates, D.; Mächler, M.; Bolker, B.; Walker, S. Fitting Linear Mixed-Effects Models Using lme4. J. Stat. Softw. 2015, 67, 1–48. [Google Scholar] [CrossRef]
  55. Pepin, P. Effect of temperature and size on development, mortality, and survival rates of the pelagic early life history stages of marine fish. Can. J. Fish. Aquat. Sci. 1991, 48, 503–518. [Google Scholar] [CrossRef]
  56. Takasuka, A.; Oozeki, Y.; Aoki, I. Optimal growth temperature hypothesis: Why do anchovy flourish and sardine collapse or vice versa under the same ocean regime? Can. J. Fish. Aquat. Sci. 2007, 64, 768–776. [Google Scholar] [CrossRef]
  57. Fuiman, L.A.; Batty, R.S. What a drag it is getting cold: Partitioning the physical and physiological effects of temperature on fish swimming. J. Exp. Biol. 1997, 200, 1745–1755. [Google Scholar] [CrossRef]
  58. Garrido, S.; Ben-Hamadou, R.; Santos, A.M.P.; Ferreira, S.; Teodósio, M.A.; Cotano, U.; Irigoien, X.; Peck, M.A.; Saiz, E.; Ré, P. Born small, die young: Intrinsic, size-selective mortality in marine larval fish. Sci. Rep. 2015, 5, 17065. [Google Scholar] [CrossRef] [PubMed]
  59. Yamamoto, T.; Ueda, H.; Higashi, S. Correlation among dominance status, metabolic rate and otolith size in masu salmon. J. Fish Biol. 1998, 52, 281–290. [Google Scholar] [CrossRef]
  60. Bochdansky, A.B.; Grønkjær, P.; Herra, T.P.; Leggett, W.C. Experimental evidence for selection against larvae with high metabolic rates in a food limited environment. Mar. Biol. 2005, 147, 1413–1417. [Google Scholar] [CrossRef]
  61. Geffen, A.J. Otolith ring deposition in relation to growth rate in herring (Clupea harengus) and turbot (Scophthalmus maximus) larvae. Mar. Biol. 1982, 71, 317–326. [Google Scholar] [CrossRef]
  62. Fox, C.J.; Folkvord, A.; Geffen, A.J. Otolith microincrement formation in herring Clupea harengus larvae in relation to growth rate. Mar. Ecol. Prog. Ser. 2003, 264, 83–94. [Google Scholar] [CrossRef] [Green Version]
  63. Wright, P.J. The influence of metabolic rate on otolith increment width in Atlantic salmon parr, Salmo salar L. J. Fish Biol. 1991, 38, 929–933. [Google Scholar] [CrossRef]
  64. Morales-Nin, B. Review of the growth regulation processes of otolith daily increment formation. Fish. Res. 2000, 46, 53–67. [Google Scholar] [CrossRef]
  65. Garrido, S.; Ferreira, S.; Soares, C.; Meneses, I.; Baylina, N.; Teodósio, M.A.; Santos, A.M.P.; Ré, P. Validation of daily increments in the otoliths European sardine larvae (Sardina pilchardus Walbaum, 1972) reared with different diets. J. Biol. Assoc. UK 2021, 101, 609–619. [Google Scholar] [CrossRef]
  66. Alemany, F.; Álvarez, F. Formation of initial daily increments in sagittal otoliths of reared and wild Sardina pilchardus yolk-sac larvae. Mar. Biol. 1994, 121, 35–39. [Google Scholar] [CrossRef]
  67. Dulčić, J. Estimation of age and growth of sardine, Sardina pilchardus (Walbaum, 1792), larvae by reading daily otolith increments. Fish. Res. 1995, 22, 265–277. [Google Scholar] [CrossRef]
  68. Ré, P. Evidence of daily and hourly growth in pilchard larvae based on otolith growth increments Sardina pilchardus (Walbaum, 1792). Cybium 1984, 8, 33–38. [Google Scholar]
  69. Geffen, A.J. The deposition of otolith rings in Atlantic salmon, Salmo salar L., embryos. J. Fish Biol. 1983, 23, 467–474. [Google Scholar] [CrossRef]
  70. Mendiola, D.; Álvares, P. Validation of daily increments in the otolith microstructure of Northeast Atlantic mackerel fish larvae. Fish. Res. 2008, 89, 300–304. [Google Scholar] [CrossRef]
  71. Namiki, S.; Tanaka, H.; Katayama, S.; Funaki, O.; Aoki, I.; Oozeki, Y. Validation of daily increment formation in otoliths of immature and adult Japanese anchovy Engraulis Japonicus. Fish. Sci. 2010, 76, 951–959. [Google Scholar] [CrossRef]
  72. Santos, A.M.P.; Chícharo, A.; Dos Santos, A.; Moita, T.; Oliveira, P.O.; Peliz, A.; Ré, P. Physical–biological interactions in the life history of small pelagic fish in the Western Iberia Upwelling Ecosystem. Prog. Oceanogr. 2007, 74, 192–209. [Google Scholar] [CrossRef]
  73. Rosa, H.C.; Ré, P. Incfluence of exogenous factors on the formation of Daily microgrowth increments in otoliths of Tilapia mariae (Boulenger, 1899) juveniles. Cybium 1985, 9, 341–357. [Google Scholar]
  74. Jones, C.M. Determining age of larval fish with the otolith increment technique. Fish. Bull. 1986, 84, 91–103. [Google Scholar]
  75. Álvarez, F.; Alemany, F. Birthdate analysis and its application to the study of recruitment of the Atlanto-Iberian sardine Sardina Pilchardus. Fish. Bull. 1997, 95, 187–194. [Google Scholar]
  76. Brophy, D.; Danilowicz, B.S. Tracing populations of Atlantic herring (Clupea harengus L.) in the Irish and Celtic Seas using otolith microstructure. ICES J. Mar. Sci. 2002, 59, 1305–1313. [Google Scholar] [CrossRef] [Green Version]
  77. IPCC. Climate Change 2014: Synthesis Report. In Contribution of Working Groups I, II and III to the Fifth Assessment Report of the Intergovernmental Panel on Climate Change; Core Writing Team, Pachauri, R.K., Meyer, L.A., Eds.; IPCC: Geneva, Switzerland, 2014; p. 151. [Google Scholar]
  78. ICES. Report of the Working Group on Southern Horse Mackerel, Anchovy and Sardine (WGHANSA). 24–29 June 2015, Lisbon, Portugal; ICES CM 2015/ACOM 16; ICES/CIEM: Copenhagen, Denmark, 2015; 612p. [Google Scholar]
  79. Checkley, D.M., Jr.; Ayón, P.; Baumgartner, T.R.; Bernal, M.; Coetzee, J.C.; Emmett, R.; Guevara-Carrasco, R.; Hutchings, L.; Ibaibarriaga, L.; Nakata, H.; et al. Habitats. In Climate Changers and Small Pelagic Fish; Checkley, D., Alheit, J., Oozeki, Y., Roy, C., Eds.; Cambridge University Press: Cambridge, UK, 2009; pp. 12–44. [Google Scholar]
Figure 1. Total length (TL, mm) vs. age (days post-hatching, dph) of European sardine Sardina pilchardus (Walbaum, 1792) larvae reared under three different temperatures (13, 15, 17 °C) from 0 to 25 dph (A) and from 0 to 35 dph (B). Results of the GLMs are presented in Table 1.
Oceans 02 00041 g001
Figure 2. Relationship between age (days post-hatching, dph) and number of growth increments (GI, (A) and (B)), and between age (dph) and otolith diameter (µm, (C) and (D)) of European sardine Sardina pilchardus (Walbaum, 1792) larvae reared from 0 to 25 dph under 13, 15, and 17 °C (left panels, (A) and (C)) and from 0 to 35 dph for 15 and 17 °C (right panels, (B) and (D)). Results of the GLMs are presented in Table 1.
Oceans 02 00041 g002
Figure 3. Sagittal otoliths of European sardine Sardina pilchardus (Walbaum, 1792) larvae reared under 13 °C (A), 15 °C (B) and 17 °C (C) and (D) for more detail of the nucleus and hatch check at 25 days post-hatching (dph). Legend: H–hatch check. N–Nucleus.
Oceans 02 00041 g003
Figure 4. Relationship between otolith diameter (µm) and total length (mm) of European sardine Sardina pilchardus (Walbaum, 1792) larvae reared from 0 to 25 days post-hatching (dph) at 13, 15, and 17 °C. Results of the GLMs are presented in Table 1.
Oceans 02 00041 g004
Figure 5. Relationship between European sardine Sardina pilchardus (Walbaum, 1792) larvae age (days post-hatching, dph) and the difference in the number of days between the estimated by growth increment counts and the real age of the larvae reared at 13, 15, and 17 °C. The figure shows data from all the sardine larvae used in the experiment from 0 to 35 dph.
Oceans 02 00041 g005
Figure 6. Relationship between otolith increment width and the order of the growth increment counted from the nucleus in otoliths of European sardine Sardina pilchardus (Walbaum, 1792) larvae reared at 13, 15, (black) and 17 °C (red). The horizontal lines represent the increments below 0.5 µm width, which are hard to detect on most optical microscopes and the 0.3 µm width, that represents the limit of the microscope used in this study.
Oceans 02 00041 g006
Figure 7. Increment width (µm) measured in the otoliths European sardine Sardina pilchardus (Walbaum, 1792) larvae observed under scanning electron microscope. The bar on top of the image represents the otolith reading counts from the nucleus (N) to the outer increment, where the small lines are the daily increments.
Oceans 02 00041 g007
Table 1. Results of the generalized linear models (GLMs) of (a) total length (TL, mm) vs. age (days post-hatching, dph) and temperature (Temp), (Gamma, log-link); (b) number of growth increments (GI) vs. age or length and temperature (Poisson); otolith diameter (Diam, μm) vs. age or length and temperature, (Gamma, log-link) of European sardine Sardina pilchardus (Walbaum, 1792) larvae reared at three different temperatures (13, 15, 17 °C). Two time periods were tested, from hatch to 25 dph to compare the three temperatures and from hatch to 35 dph for treatments 15 and 17 °C since no larvae survived in the 13 °C treatment after 25 dph.
ModelAge Range
(dph)
ParametersEstimateStd. Errort ValuePr(>t)AIC
TL~AGE × TEMP0–25Intercept131.4030.03936.28<0.0001540.9
Slope130.0340.00311.94<0.0001
Intercept15−0.0800.058−1.390.165
Slope15−0.0460.055−0.850.392
Intercept170.0120.0042.820.0053
Slope170.0100.0042.550.011
0–35Intercept151.3620.04231.99<0.0001529.4
Slope150.0410.00217.09<0.0001
Intercept170.0680.0561.220.224
Slope17−0.0050.003−1.910.057
GI~AGE × TEMP0–25Intercept130.8640.1068.11<0.0001885.3
Slope130.0830.00614.24<0.0001
Intercept150.1040.1560.660.504
Slope15−0.0020.008−0.350.072
Intercept170.2500.1411.770.075
Slope170.0020.0070.280.778
0–35Intercept151.1700.09112.80<0.0001880.3
Slope150.0660.00417.81<0.0001
Intercept170.2290.1151.990.043
Slope17−0.0010.004−0.280.778
GI~TL × TEMP0–25Intercept130.4540.143.190.001980.3
Slope130.2290.01812.59<0.0001
Intercept15−0.0460.214−0.210.826
Slope15−0.0060.025−0.260.790
Intercept170.2510.1831.360.172
Slope17−0.0170.022−0.800.421
0–35Intercept150.7490.1156.48<0.0001858.6
Slope150.1810.01017.24<0.0001
Intercept17−0.0000.152−0.000.997
Slope170.0340.0142.480.013
DIAM~AGE × TEMP0–25Intercept132.5380.03767.65<0.00011056.3
Slope130.0290.00310.61<0.0001
Intercept15−0.0240.056−0.430.665
Slope150.0030.0530.070.944
Intercept170.0040.0041.280.199
Slope170.0200.0045.29<0.0001
0–35Intercept152.4470.04653.18<0.00011140.8
Slope150.0420.00218.33<0.0001
Intercept170.1030.0611.690.092
Slope170.0060.0032.110.036
DIAM~TL × TEMP0–25Intercept132.1550.07030.37<0.0001967.4
Slope130.1140.01010.41<0.0001
Intercept150.0500.0960.520.601
Slope15−0.0110.014−0.810.419
Intercept17−0.0610.092−0.660.507
Slope170.0330.0132.450.014
0–35Intercept152.4470.04653.18<0.00011140.8
Slope150.0420.00218.33<0.0001
Intercept170.1030.0611.690.092
Slope170.0060.0022.110.036
Publisher’s Note: MDPI stays neutral with regard to jurisdictional claims in published maps and institutional affiliations.

