Article

Use of Polyphosphates and Soluble Pyrophosphatase Activity in the Seaweed Ulva pseudorotundata

by
Juan J. Vergara
*,
Patricia Herrera-Pérez
,
Fernando G. Brun
and
José Lucas Pérez-Lloréns
Departamento de Biología, Facultad de Ciencias del Mar y Ambientales, Universidad de Cádiz, E-11510 Puerto Real, Cádiz, Spain
*
Author to whom correspondence should be addressed.
Oceans 2020, 1(4), 343-354; https://doi.org/10.3390/oceans1040023
Submission received: 1 October 2020 / Revised: 4 December 2020 / Accepted: 14 December 2020 / Published: 16 December 2020

Abstract

:
The hydrolytic activity of different types of polyphosphates, and the induction of soluble pyrophosphatase (sPPase; EC 3.6.1.1) activity have been assessed in cell extracts of nutrient limited green seaweed Ulva pseudorotundata Cormaci, Furnari & Alongi subjected to different phosphorus regimes. Following a long period of nutrient limitation, the addition of different types of (poly)phosphates to artificial seawater enhanced growth rates on fresh weight and area, but not on dry weight bases. Chlorophyll and internal P content were affected by P supply. In contrast, internal soluble reactive P was kept low and was little affected by P additions. Soluble protein content increased in all treatments, as ammonium was added to prevent N limitation. The C:N:P atomic ratio revealed great changes depending on the nutrient regime along the experiment. Cell extracts of U. pseudorotundata were capable of hydrolyzing polyphosphates of different chain lengths (pyro, tripoly, trimeta, and polyphosphates) at high rates. The sPPase activity was kept very low in P limited plants. Following N and different kind of P additions, sPPase activity was kept low in the control, but slightly stimulated after 3 days when expressed on a protein basis. The highest activities were found at the end of the experiment under pyro and polyphosphate additions (7 days). The importance of alternative P sources to phosphate and the potential role of internal soluble pyrophosphatases in macroalgae are discussed.

1. Introduction

Although nitrogen (N) is considered to be the main limiting nutrient in the ocean [1], phosphorus (P) can also limit primary production of algae in some coastal areas [2]. The major P form for algae is inorganic ortho-phosphate (Pi), whose uptake in seaweeds occurs through specific transport systems [3,4,5]. Besides the main Pi source (i.e., from the water column and sediments), the hydrolysis of organic P monoesters by the periplasmic enzyme alkaline phosphatase also renders Pi [6]. However, although Pi is the main form of P used by algae, their growth can also be supported by more complex inorganic P compounds [7]. Accordingly, pyrophosphates (PPi) and polyphosphates (polyP) could be important sources of P [8]. However, these compounds are not molybdenum sensitive, not being quantified in standard analytical measurements of soluble reactive phosphorus (SRP) [9,10]. These Pi polymers, which can contribute to the P pool in the coastal ocean, are mostly derived from anthropogenic activities [9]. However, since P is taken up as Pi, enzyme cleavage of Pi polymers at the cell surface is needed. Data on the role of these alternative sources of P in seaweeds are scarce.
In contrast to P uptake kinetics and transmembrane transport mechanisms, little is known about P internal cellular metabolism. Marine algae, as opposed to most terrestrial plants, are able to store Pi polymers as polyP [2,8]. Studies of 31P-NMR on the chlorophyte Ulva lactuca, identified polyP as the main intracellular storage for P [11]. This polyP pool was accumulated under external Pi availability, while it was mobilized under P limitation. The PolyP polymers have also been reported in other Ulva spp., in the Rhodophyta Ceramium sp. [11] and in Porphyra purpurea [12], among other species.
Soluble pyrophosphatase (sPPase) (EC 3.6.1.1) is a ubiquitous enzyme essential for cell anabolism [13]. It is located in cellular organelles (plastids and mitochondria) of a variety of photosynthetic autotrophs [14], where many anabolic and biosynthetic reactions occur [15]. This enzyme is responsible for PPi cleavage and Pi regeneration in vivo, thus allowing biosynthetic reactions to proceed [16]. Its function is also essential to replenish Pi for phosphorylation [17]. Despite the importance of this enzyme, the few data available are mostly from photosynthetic prokaryotes and some microalgal groups [14], whereas studies in seaweeds are much scarcer, e.g., [7].
Under this framework, the aim of this work was double: (1) to assess the capacity of cell extracts of the green macroalgae U. pseudorotundata to hydrolyze Pi polymers, and (2) to study the effect of different P sources (i.e., Pi, PPi and PolyP) on the response of nutrient-limited algae (growth, internal C:N:P composition, chlorophyll, protein content and internal sPPase activity). Results indicate the capacity of U. pseudorotundata to exploit alternative sources of P for growth, as well as the induction of internal sPPase activity in cell extracts of nutrient-limited specimens following P additions.

2. Materials and Methods

2.1. Plant Material and Preculture Conditions

Seaweed specimens, identified as Ulva pseudorotundata Cormaci, Furnari & Alongi, according to [18], were collected from earthern pools at an intensive fish farm (Acuinova S. L., San Fernando, Cádiz, southern Spain). Once in the laboratory, thalli were rinsed with seawater and cleaned of mud and epiphytes. Some of these field-collected specimens were used both, to optimize sPPase assays and to determine the hydrolytic activities of different kinds of polyphosphates in cell extracts (see below). Pretreatment: the remaining biomass was grown in aquaria with constant aeration and seawater pumped from a natural underground well (pH 7.3, salinity 39.6, 35 µM NH4+, 0.8 µM PO43−, and negligible NO3 levels, mean values) for 70 days before starting the experiments (see below). Lighting (145 µmol photons m−2 s−1, which is saturating for this species [19]) was provided with two fluorescent lamps (Phillips cool white) in a 12 h:12 h light-dark photoperiod. Mean pH and temperature were 8.4 and 25.1 °C, respectively, along this pre-treatment phase. Culture was kept at a high biomass density (16 g FW L−1) in a total volume of 20 L, and seawater was renewed weekly. The aquarium was cleaned at every seawater change with distilled deionised water plus sodium hypochlorite. Germanium dioxide (2 mg L−1, final concentration) was added to inhibit diatom growth [20]. The objective of this long preculture period at a high biomass density was to obtain nutrient-depleted thalli (i.e., with very low N and P quota), despite there not being a complete absence of PO43− and NH4+ in seawater. In fact, the growth rate was very low along this period (data not shown) and N and P quotas approached the subsistence ones for this species (see initial conditions in results), with a N:P atomic ratio of about 15, close to the Redfield ratio, indicating an incipient N and P co-limitation for Ulva species [21].

2.2. Experimental Design

The N and P-limited thalli were grown under four different P treatments: (1) without P (control), (2) with orthophosphate (Pi, 5 µM final concentration), (3) with pyrophosphate (PPi, 5 µM final concentration) and (4) with polyphosphate (PolyP, 5 µM final concentration). Inorganic N (as NH4+, 5 µM final concentration) was also added to all treatments (including the control) to avoid a parallel N co-limitation. All chemical reagents for P analytics were from Sigma, and polyphosphate used is referred to as “phosphate glass”, with a mean length chain of 13–18 Pi molecules. Thallus discs (2 cm diameter) were punched with a cork borer and grown in 1 L flasks (see below) within an incubation chamber (Koxka model EC−540-F) at 20 °C and at a photon flux of 200 µmol m−2 s−1 in a 12 h:12 h light-dark photoperiod provided by fluorescent tubes (cool white, Phillips). Each of the four treatments (n = 3 per treatment) were run for seven days in 1 L-aerated flasks (12 in total) at a biomass density about 1 g FW L−1 (c.a. 20 discs per flask) with synthetic seawater [22], which allowed us to control nutrient availability. During the experiment, seawater and Ulva samples were taken at days 0, 2, 4 and 7. Seawater was renewed at days 2 and 4.

2.3. Analyses

Three discs were randomly sampled in each of the 12 flasks, measured and weighted (fresh and dry, after drying in an oven at 60 °C for 48 h) to estimate growth rates assuming an exponential growth model. Fresh weight/area (g FW m−2) and DW/FW ratios were also estimated. Total chlorophyll (a + b) concentration was determined according to [23], after extracting liposoluble pigments in N, N, dimethyl formamide for 24 h at 4 °C in darkness. Internal C and N concentrations were determined from dried biomass at the beginning and at the end of the experiment in a Perkin-Elmer 240-C elemental analyser. The time course for the C:N ratio was not monitored since there was not enough algae material to be collected. The SRP was determined according to [24]. Total internal P was also determined according to [24], after acid digestion in an autoclave (121 °C, one hour, Raypa Sterilmatic AE-150). In both cases, absorbance was measured at 885 nm (Hitachi, U-1100 spectrophotometer, Tokyo, Japan).
Cell extracts were prepared by grinding Ulva discs with liquid N2 with a mortar and a pestle. Cell extract was resuspended in 50 mM Tris buffer pH 7.5 at an approximate ratio of 100 mg FW in 1.5 mL buffer. Tris buffer was supplemented with 1 mM DTT and 1 mM PMSF to protect active enzyme groups from oxidation and to inhibit proteases. Cell extracts were centrifuged at 15,000× g for 15 min at 4 °C. Cell debris and membrane fractions were discarded and soluble components were recovered, frozen in liquid N2, and stored at −80 °C for enzyme assays. An aliquot of cell extracts was taken for soluble protein determination, to scale enzyme activities. Soluble protein content of cell extracts was determined according to [25].
The sPPase activity was measured in cell extracts according to [26], monitoring the Pi production at 25 °C for 10 min. Assay medium contained Tris buffer 50 mM pH 8.0, 20 mM of substrate (either PPi, tripolyP, trimetaP or polyP depending on the treatment), 20 mM Mg2+, and an appropriate quantity of cell extract. The ion Mg2+ is an essential cofactor for sPPase activity for most of the assayed organisms [14]. In preliminary tests, a 200 µL extract was assayed in a total volume of 1 mL, and 500 µL of the assay medium was assayed for Pi production. Given the high activity of the enzyme, 50 µL cell extract was used instead of 200 µL, and 100 µL of the assay medium was diluted with 400 µL Tris buffer pH 8.0 before measuring Pi, to reduce the sensibility of the assay, yielding a dilution factor of 20× in comparison to preliminary assays. Immediately, an aliquot was taken and mixed with ammonium molybdate and ascorbic acid to measure Pi production.
A unit of sPPase activity was defined as the quantity of enzyme activity that yields 1 µmol Pi per minute in the assay conditions stated above. This activity was scaled either to proteins or DW. In all enzyme assays two blanks were run in parallel: (1) in absence of the substrate (PPi), which indicates the amount of internal SRP in the sample, and (2) in the absence of cell extract, to determine spontaneous PPi hydrolysis and/or SRP contamination of the substrate. These assays were done with 200 µL extract, and no further dilutions were performed for the measurements. Internal SRP values were quite low compared to the rate of Pi production by the enzyme activity, and the spontaneous hydrolysis was almost undetectable (data not shown).

2.4. Statistics

The effect of P source and time on thallus area, fresh weight:area, dry weight:fresh weight ratio, internal SRP, internal total phosphorus, soluble protein and sPPase activity were analyzed by a 2-way ANOVA (Table A1). Prior to any statistical analysis, data were checked for normality (Shapiro–Wilk normality test) and homocedasticity (Bartlett test of homogeneity of variances test). The effects of different P sources on enzymatic activity and different P sources on C:N:P tissue composition were analyzed by means of 1 way ANOVA (significant Tukey’s test differences indicated in Table 1 and Table 2). Post hoc comparisons among means were tested by the Tukey test [27]. In all cases, the null hypothesis was rejected at the 5% significance level and data were presented as mean ± SE.

3. Results

The hydrolytic capacity of several polyphosphate compounds assayed with soluble cell extracts from Ulva pseudorotundata, as a first approach, is shown in Table 1. Hydrolytic activities were recorded for all the substrates tested. Both sPPase and tripolyphosphatase activities showed similar values, whereas the cyclic trimetaphosphate was hydrolysed at a lower rate. In contrast, polyphosphatase activity was 3–4 times higher than that of the sPPase.
Ulva pseudorotundata was maintained for a long period under nutrient limitation (preculture) and, subsequently, grown under different P sources, but with NH4+ addition to avoid N-limitation. Seaweed growth rates were affected by P treatments, but their values depended largely on the plant attributes used in the calculations (Figure 1a). Thus, normalization by fresh weight (FW) resulted in higher values, with those obtained under different P additions being higher than the controls. In contrast, growth rates were minimal when normalized by dry weight (DW), being unaffected by P treatments. On area basis, the growth rates were also lower than those estimated on a FW basis, but were affected by P additions. The time-course of U. pseudorotundata disc area grown under different P treatments is shown in Figure 1b. A positive thallus expansion was observed regardless of P treatment, with the highest values under PPi and polyP enrichment, and the lowest in the control. As a consequence of the different water gain and area expansion, the FW/area ratio increased along time in all treatments (Figure 2a). In contrast, the DW/FW ratio showed the opposite trend, decreasing along time in all the treatments (Figure 2b).
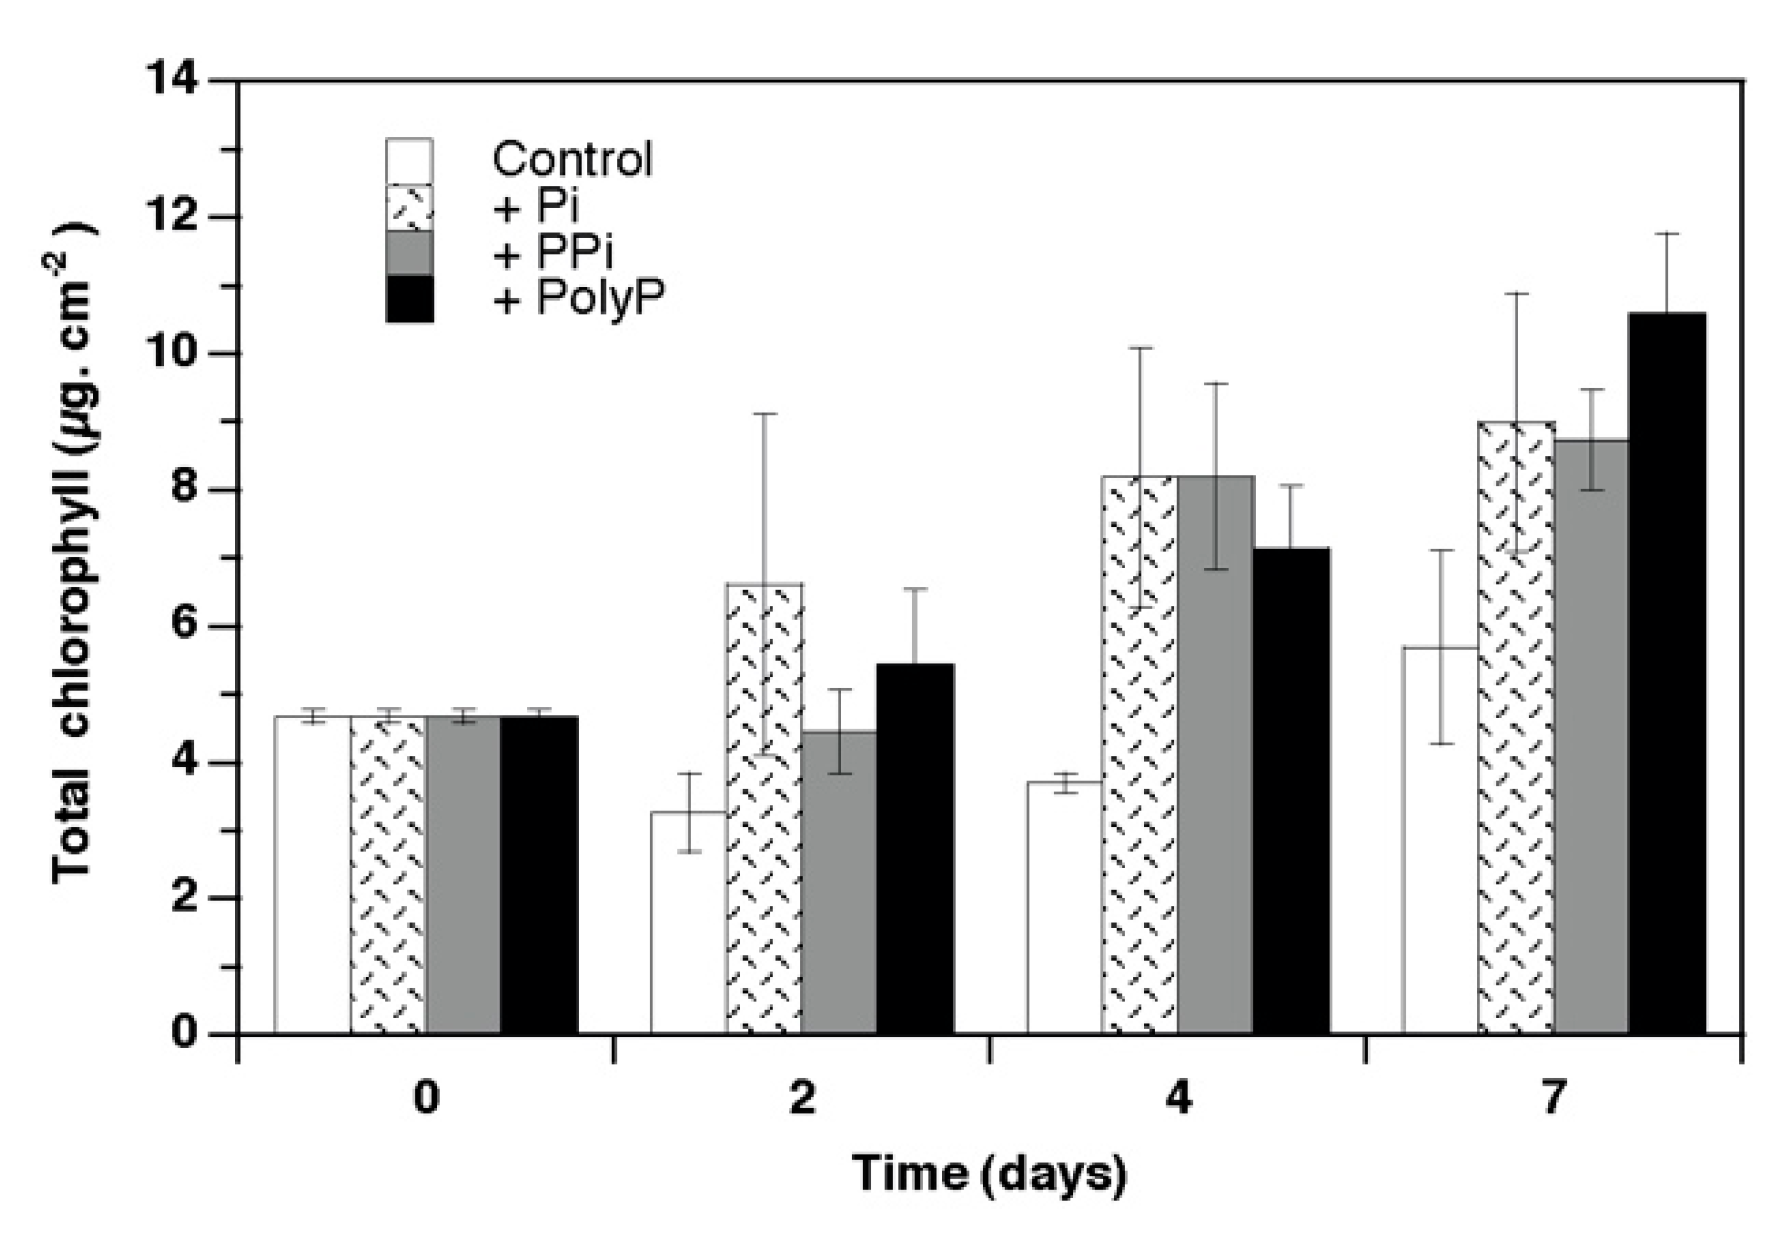
Total chlorophyll content was also affected by P sources (Figure 3), with the lowest values recorded in the controls. Chlorophylls a and b displayed the same trend, as the chlorophyll a/b ratio was constant along the experiment (data not shown).
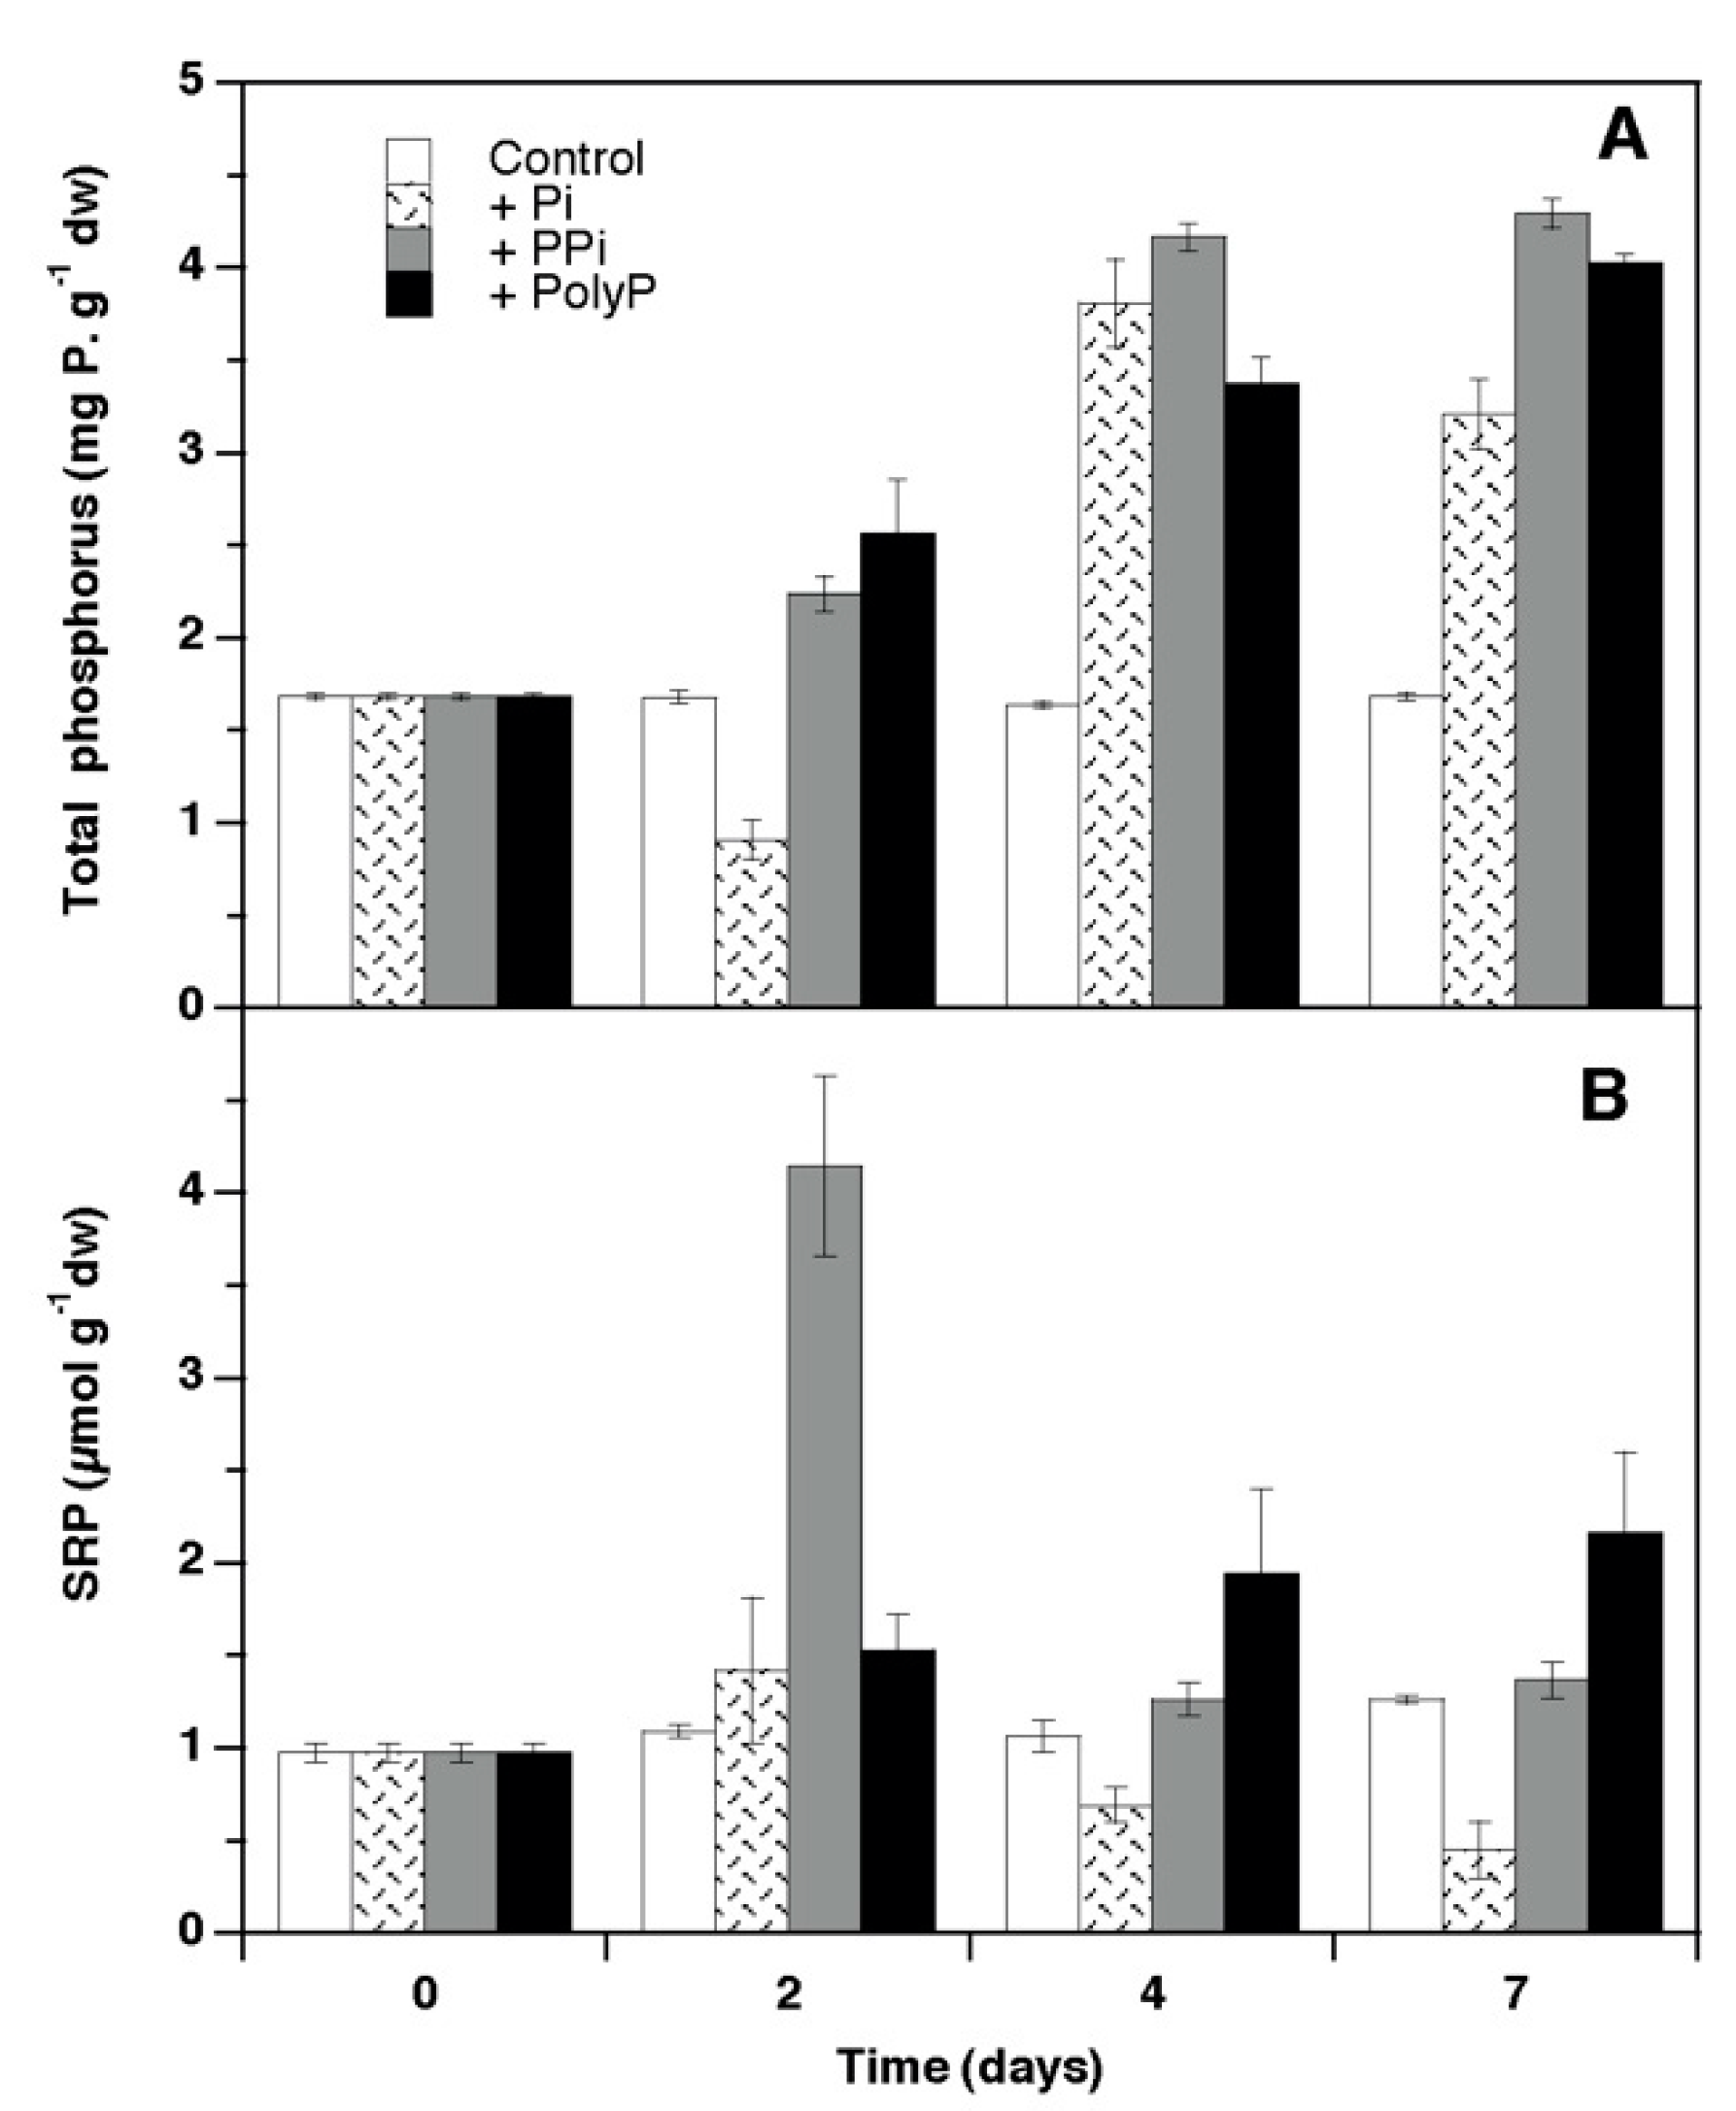
Whereas total internal P content was unaffected in the controls along time, it doubled the initial values under different P sources, especially for PPi and PolyP (Figure 4a). In contrast, internal SRP content was kept at quite low levels, (1–4 µmol Pi g−1 DW). Although a transient increase after 2 days was recorded for the PPi treatment, all values were fairly constant along the experiment in all treatments (Figure 4b).
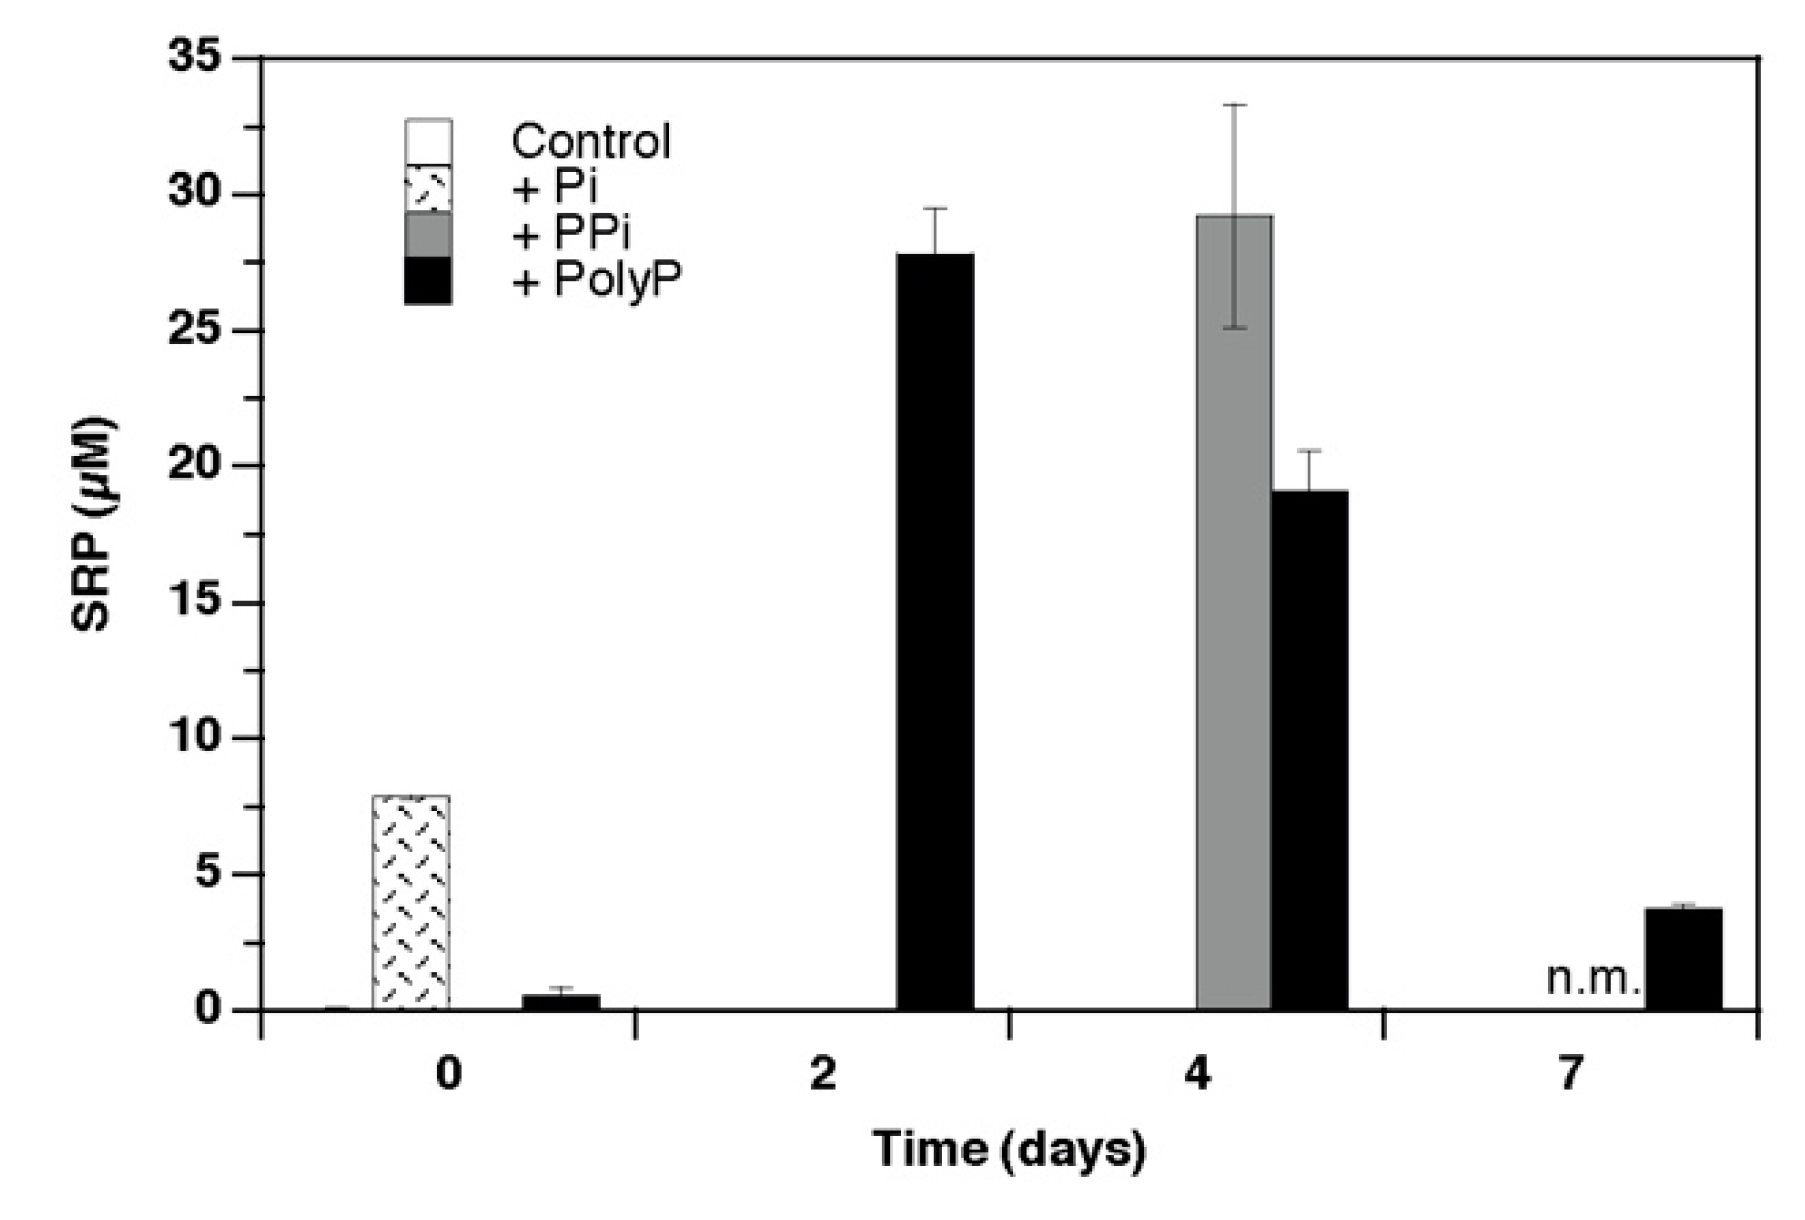
Seawater SRP was also monitored along the experiment (Figure 5). At the beginning, it was undetectable in both the control and the PPi treatment, but values of 7.5 µM and 0.5 µM were recorded for Pi treatment and PolyP treatments, respectively, indicating, in the latter case, the possibility of a certain degree of Pi contamination in the added substrate (added PolyP was about 5 µM). Significant Pi levels were detected in PolyP-enriched cultures, probably as a consequence of the partial hydrolysis of long chain Pi molecules. In contrast, Pi was not detected in either Pi or PPi treatments, except for a high value in the PPi treatment on the fourth day. To check for the spontaneous hydrolysis of PPi and PolyP in seawater, 1 L aerated flasks were maintained without algae for 3 days, and SRP from PPi and polyP hydrolysis was measured. Values ranged from 0.06 to 0.16 µM Pi (almost undetectable) for PPi and from 0.50 µM to 0.66 µM for polyP, indicating the lack of a significant polyP hydrolysis and suggesting Pi contamination in the polyP substrate used for enrichment.
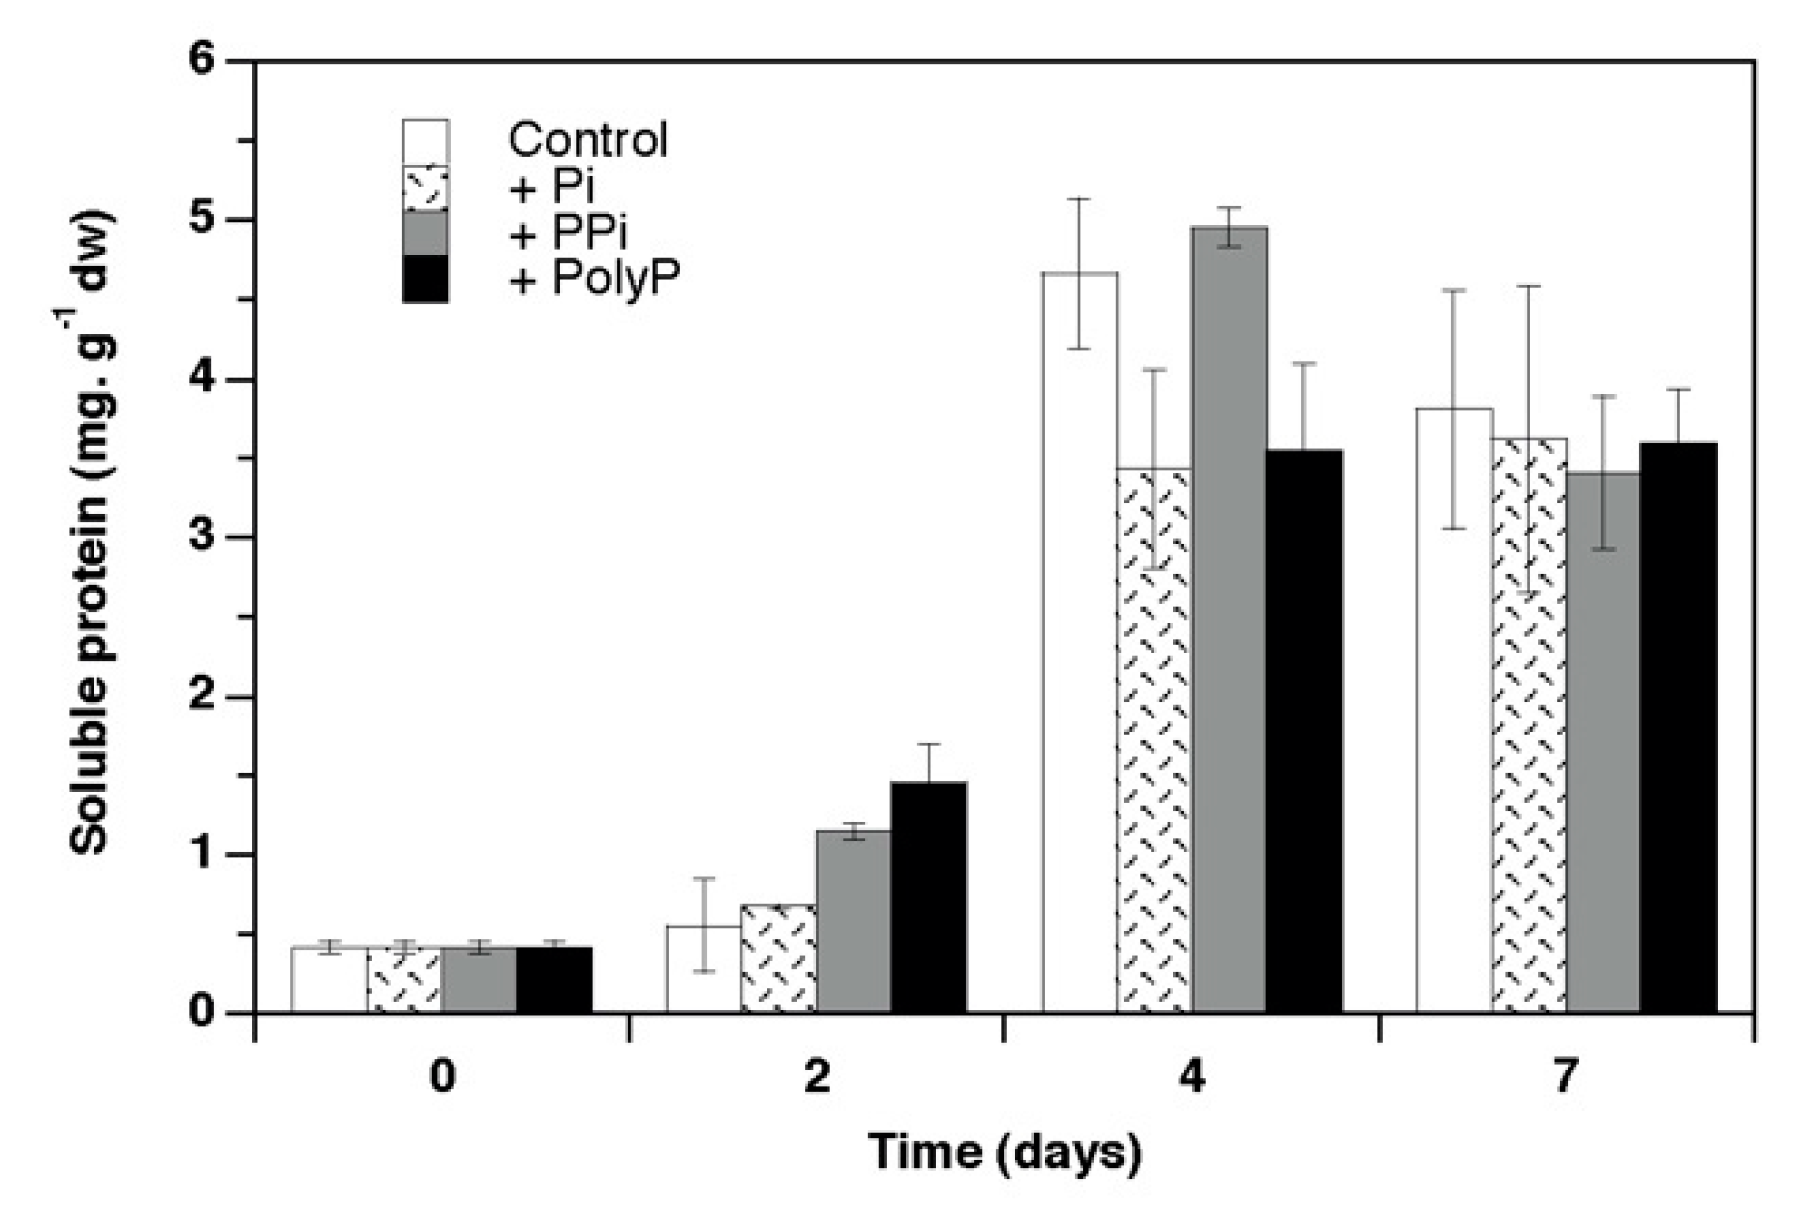
In contrast to total internal P content, the soluble protein content increased along the experiment regardless of the P treatment as expected, since all cultures were supplemented with N (Figure 6). This enhancement was especially noticeable after 4 days.
Tissue C, N and P composition, as well as the C:N, C:P and N:P atomic ratios are shown in Table 2. These data showed great variations caused by different P supplies. In parallel with thallus expansion and growth, internal C content increased at the end of the incubations. Tissue N content increased by 3–4 times at the end of the experiment, with slightly higher values in the P enriched treatments than in the control. Tissue P content almost doubled the initial values in all P treatments, whereas no changes were observed in the control. As a consequence of the noticeable changes in N and P composition, and, to a lesser extent in C, C:N:P atomic ratios displayed great variations along the experiment. Thus, the C:N atomic ratio dropped from 22.8 down to about 8 in the control, and even more in the P enriched treatments. The C:P values were driven by P changes, being higher in the control than in P enriched treatments. As expected, the largest increase in the N:P atomic ratios was recorded for the control, since no P source was added. However, the N:P ratio also showed higher values following N and P additions than initial thalli, denoting a greater N enrichment than P in the cell composition.
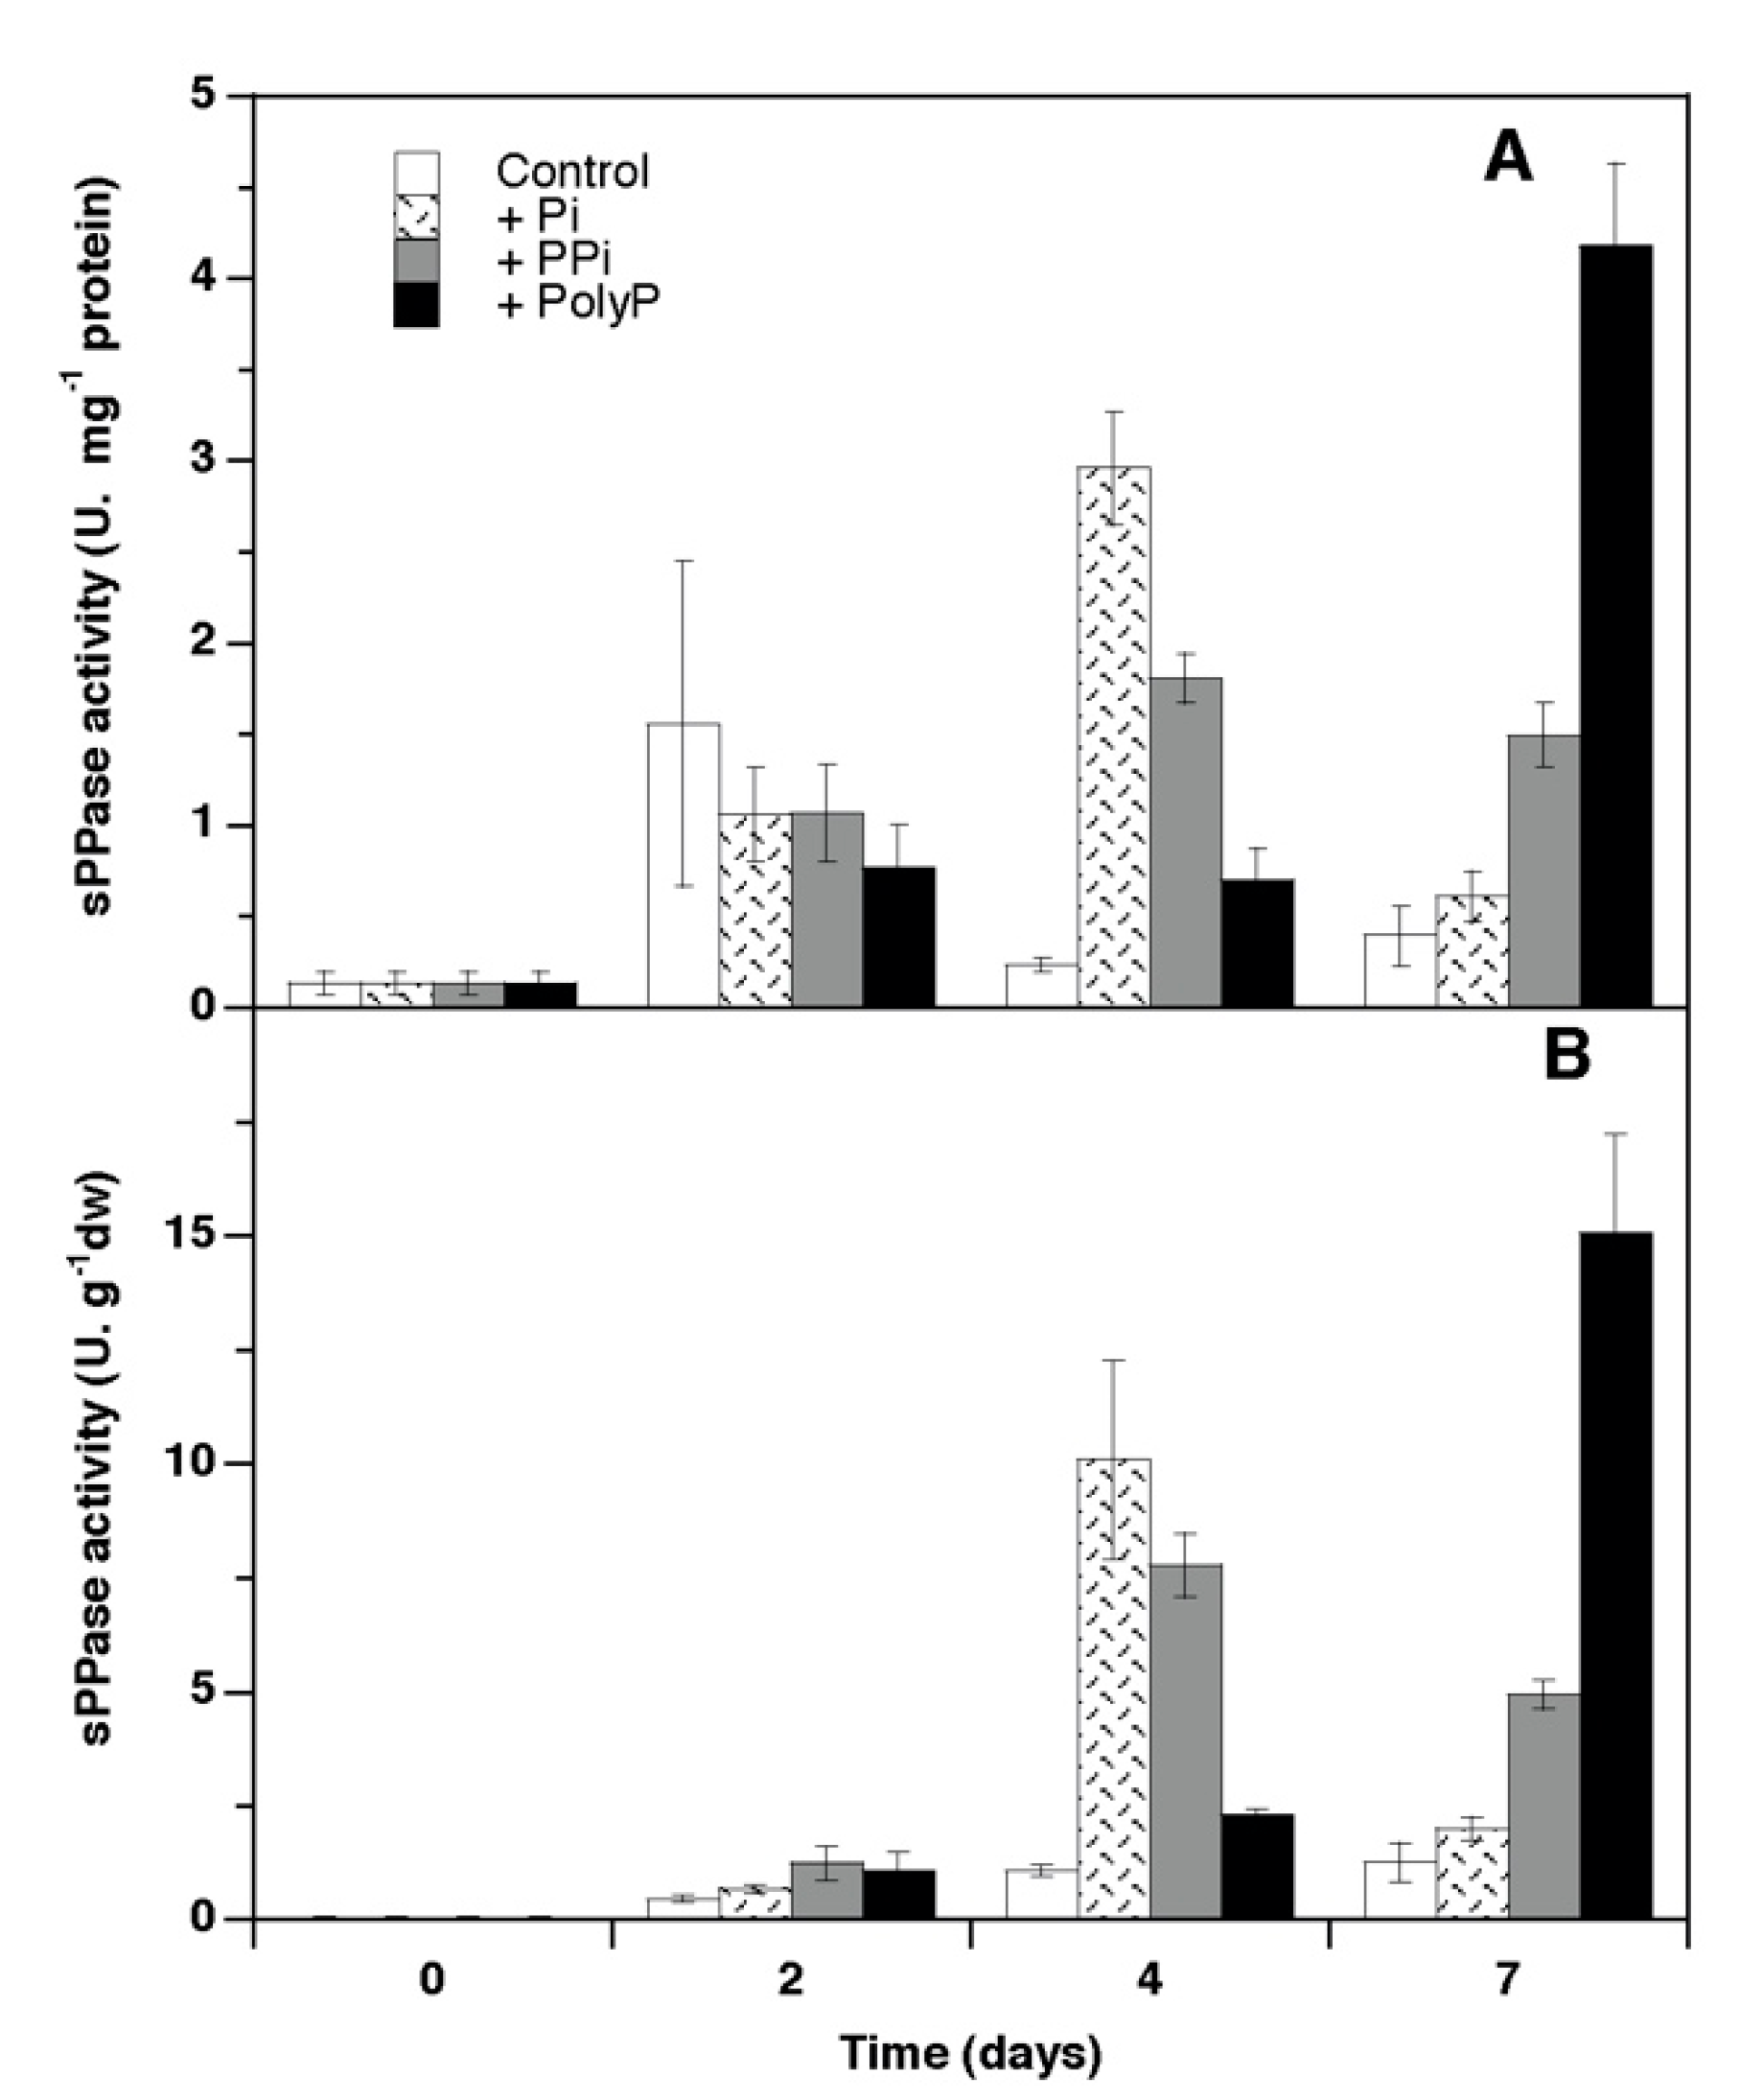
The sPPase activity in cell extracts was assayed along the experiment and scaled on both a protein and DW basis (Figure 7). Remarkable low activities were recorded in the control at the beginning of the experiment (almost undetectable on a DW basis, Figure 7B). There was a transient increase of activity in the control after 2 days when expressed on a protein basis, then this activity was maintained at low levels. The maximum level for Pi treatment was recorded after 4 days, and the highest levels were recorded for PPi and specially polyP enrichment at the end of the experiment (7 days). These values for sPPase activity were at the same order of magnitude as those recorded in field-collected plants (Table 1).

4. Discussion

4.1. Growth and Phosphorus Use

Ulva pseudorotundata grew and accumulated P regardless of the P source supplied in the incubations. The long preculture period resulted in nutrient limited thalli, with internal N and P cell quotas close to subsistence values for Ulva species [28] and a N:P ratio close to the Redfield ratio. Nutrients (N, P) resupply at the onset of the experimental phase (culture), resulted in thallus growth and cell C and N gain regardless of the P form supplied (treatment) even in the control without P supply, as N was also added. The highest growth rates were achieved under PPi and PolyP additions, which could be explained by the higher content of Pi per mol of substrate of both substrates (i.e., PPi and PolyP, 2 and 13–18 Pi molecules, respectively). The metabolic stimulation driven by N and/or P additions was also reflected by the increase of the FW/area and the drop of the DW/FW ratios. This could be a result of the increase in cell turgor (increased water content) and cell division. Therefore, in the short term, there was a stimulation of growth (on fresh weight and area basis), which can be indicative of cell division in this bi-stromatic sheet like species [19]. Initial tissue C content was lower than mean values for Ulva species (about 27 %DW, [29]), but increased in all treatments as a result of the metabolic stimulation caused by N and/or P supply. The growth rates recorded in this study were much lower than maximum ones measured in this species both in the laboratory and in the field (0.2 to 0.3 d−1) [19,29]. These low values were probably because thalli were nutrient limited, and the immediate response was, once nutrients were supplied, to replenish cell nutrient quotas before achieving maximum growth rates [30]. In this way, cell N and P increased in all treatments (excepting P for the control, as expected).
Growth supported by different P sources has been previously reported in macroalgae [7]. Phosphorus is taken up through specific Pi transporters. Pi usually comes from SRP or from dissolved organic P molecules broken by alkaline phosphatase enzymes. But if the available P sources are pyro or polyposphates, an external hydrolytic activity is needed. This activity can be mediated through plasma membrane specific pyro or polyphosphatases, and/or from non-specific alkaline phosphatases located in the periplasmic space [31]. These non-specific phosphatases can even be released to culture medium, as shown by [7] in the green seaweed Cladophora glomerata. Although we used synthetic seawater, epiphytic bacteria occurring on Ulva thalli surfaces, can account for some of the PPi and polyP hydrolysis, also leaving some free Pi available for the macroalgae.

4.2. Soluble Pyrophosphatase Activity

Soluble cell extracts of field-collected U. pseudorotundata showed hydrolytic capacity for a variety of polyphosphates of different chain lengths. The activities measured in this study correspond to the enzymes located in the soluble fraction, as cell extracts were centrifuged and, thus, cell wall and membrane components were eliminated in the pellet. The high catalytic activity values, typical for this enzyme, were on the same order of magnitude or even higher than those recorded in several photosynthetic microorganisms [14]. Hydrolysis of PPi and tripolyposphate yielded similar rates. In contrast, lower values were obtained for trimetaphosphate, probably because of its cyclic structure. Polyphosphatase activity was higher than sPPase as a result of the breakdown of a polymeric substrate, causing a cascade of hydrolytic reactions, as it was observed in the cyanobacterium Synechocystis sp. strain PCC6803 [14].
As far as we are aware, there are few data on sPPase activity in marine macroalgae [7]. This sPPase activity has been successfully measured, displaying large changes depending on nutrient status and growth state. Thus, sPPase activity was almost undetectable in long-term nutrient-limited macroalgae. The transient increase in the control, at least on a protein basis, indicated that the response is not only dependent on P supply, but a more general response to metabolic stimulation caused by N addition. The sPPase induction has been observed in Synechocystis sp. strain PCC6803. This cyanobacterium showed a biphasic curve: a first sPPase maximum during the exponential growth period, and a second one, of lower magnitude, in the stationary phase [32]. As stated in the introduction, this is a key enzyme to maintain the biosynthetic reactions, and therefore, it was stimulated in response to nutrient supply in U. pseudorotundata. In contrast, quite low levels of sPPase activities were recorded in nutrient limited algae (initial values). It should be taken into account that preculture lasted 70 days, leaving sPPase activities at basal levels. After this long period of nutrient limitation, the maximum levels of sPPase activity registered for the Pi, PPi treatments after 4 days and polyP after 7 days showed the stimulation of sPPase activities in parallel to the stimulation of protein synthesis and growth after several days of supply of N and different P sources.

4.3. Ecological Implications

Some studies have revealed the importance of polyP molecules in contributing to the total available P pool of aquatic sediments [9,10]. However, the measurement of SRP misses these important Pi polymers than are non-molybdenum sensitive. The green macroalga Ulva pseudorotundata occurs in dense mats in the intertidal mudflats of the Palmones river estuary (Southern Spain) [29], reducing not only underneath light availability [33], but also (more than 40 times) the net phosphorus flux from sediment to the water column [34]. As cited above, this sediment may contain not only Pi, but also inorganic polymeric forms, that, as evidenced in our study, can support U. pseudorotundata growth. In fact, U. pseudorotundata eventually exhibits huge biomass accumulations, with canopies that can reach a thallus area index of 17 layers [29]. This is a great barrier for the flux of P between sediment and water. Therefore, it can be concluded that this overlooked P pool must be analysed and considered when studying biogeochemical cycles in coastal ecosystems and nutrient-mass balances, especially when green tides of macroalgae develop. Methods such as 31P-NMR and/or PPi-dependent enzymatic assays to measure Pi polymers should be adopted in current protocols to understand the phosphorus cycle, especially in human impacted coastal areas.

Author Contributions

Conceptualization, J.J.V., F.G.B. and J.L.P.-L.; methodology, J.J.V., F.G.B. and P.H.-P.; lab research, J.J.V., F.G.B. and P.H.-P.; data curation, P.H.-P., J.J.V. and F.G.B.; writing—original draft preparation, J.J.V., F.G.B. and J.L.P.-L.; writing—review and editing J.J.V.; supervision, J.J.V.; funding acquisition, J.L.P.-L. and F.G.B. All authors have read and agreed to the published version of the manuscript.

Funding

This research has been supported by the project CTM2017-85365-R from the Spanish Ministry of Economy, Industry and Competitiveness.

Conflicts of Interest

The authors declare no conflict of interest.

Appendix A

Table A1. Ulva pseudorotundata. Statistic results of 2-way ANOVAs analyzing the effects of Pi treatments and time on the different variables analyzed. * = p < 0.05; ** = p < 0.01; *** = p < 0.001. n.s. Non-significant. df. Degrees of freedom.
VariableEffectdf Treatment/ df ErrorF Value, p
Disc area (cm2)Time3/32123.6 ***
Pi treatment3/3218.4 ***
Interaction9/324.8 ***
Fresh weight: area (g FW m−2)Time3/3260.9 ***
Pi treatment3/323.6 *
Interaction9/322.6 *
Dry weight: fresh weight ratioTime3/3260.2 ***
Pi treatment3/322.6 n.s.
Interaction9/322.2 n.s.
Total Chlorophyll (µg cm−2)Time3/3210.9 ***
Pi treatment3/327.0 ***
Interaction9/321.1 ns
Total cell P (mg g−1DW)Time3/32177.8 ***
Pi treatment3/3296.8 ***
Interaction9/3239.7 ***
Cell Phosphate (µmol g−1DW)Time3/3210.2 ***
Pi treatment3/3219.9 ***
Interaction9/327.4 ***
Soluble protein (mg g−1DW)Time3/321223 ***
Pi treatment3/321.8 n.s.
Interaction9/322.4 *
sPPase activity (U g−1DW)Time3/3253.1 ***
Pi treatment3/3216.3 ***
Interaction9/3224.1 ***
sPPase activity (U mg−1protein)Time3/3221.0 ***
Pi treatment3/325.0 **
Interaction9/3214.6 ***

References

  1. Falkowski, P.G.; Raven, J.A. Aquatic Photosynthesis; Blackwell Science: Maiden, MA, USA, 1997; 375p. [Google Scholar]
  2. Lobban, C.S.; Harrison, P.G. Seaweed Ecology and Physiology; Cambridge University Press: New York, NY, USA, 1994; 366p. [Google Scholar] [CrossRef]
  3. Hurd, C.L.; Dring, M.J. Phosphate uptake by intertidal fucoid algae in relation to zonation and season. Mar. Biol. 1990, 107, 281–290. [Google Scholar] [CrossRef]
  4. Lavery, P.S.; McComb, A.J. The nutritional eco-physiology of Chaetomorpha linum and Ulva rigida in Peel Inlet, Western Australia. Bot. Mar. 1991, 34, 251–260. [Google Scholar] [CrossRef] [Green Version]
  5. Schachtman, D.P.; Reid, R.J.; Ayling, S.M. Phosphorus uptake by plants: From soil to cell. Plant Physiol. 1998, 116, 447–453. [Google Scholar] [CrossRef] [PubMed] [Green Version]
  6. Hernández, I.; Niell, F.X.; Whitton, B.A. Phosphatase activity of benthic marine algae. An overview. J. Appl. Phycol. 2002, 14, 475–487. [Google Scholar] [CrossRef]
  7. Lin, C.K. Accumulation of water soluble phosphorus and hydrolysis of polyphosphates by Cladophora glomerata (Chlorophyceae). J. Phycol. 1977, 13, 46–51. [Google Scholar] [CrossRef]
  8. Sanz-Luque, E.; Bhaya, D.; Grossman, A.R. Polyphosphate: A Multifunctional Metabolite in Cyanobacteria and Algae. Front. Plant Sci. 2020, 11, 938. [Google Scholar] [CrossRef]
  9. Sundareshwar, P.V.; Morris, J.T.; Pellechia, P.J.; Cohen, H.J.; Porter, D.E.; Jones, B.C. Occurrence and ecological implications of pyrophosphate in estuaries. Limnol. Oceanogr. 2001, 46, 1570–1577. [Google Scholar] [CrossRef]
  10. Ahlgreen, J.; Tranvik, L.; Gogoll, A.; Waldebäck, M.; Markides, K.; Rydin, E. Sediment depth attenuation of biogenic phosphorus compounds measured by 31P NMR. Environ. Sci. Technol. 2005, 39, 867–872. [Google Scholar] [CrossRef]
  11. Lundberg, P.I.; Weich, R.G.; Jensén, P.; Vogel, H.J. Phosphorus-31 and nitrogen-14 NMR studies of the uptake of phosphorus and nitrogen compounds in the marine macroalgae Ulva lactuca. Plant Physiol. 1989, 89, 1380–1387. [Google Scholar] [CrossRef] [Green Version]
  12. Chopin, T.; Morais, T.; Belyea, E.; Belfry, S. Polyphosphate and siliceous granules in the macroscopic gametophyte of the red alga Porphyra purpurea (Bangiophyceae, Rhodophyta). Bot. Mar. 2004, 47, 272–280. [Google Scholar] [CrossRef]
  13. Gómez-García, M.R.; Serrano, A. Expression studies of two paralogous ppa genes encoding distinct Family I pyrophosphatases in marine unicellular cyanobacteria reveal inactivation of the typical cyanobacterial gene. Biochem. Biophys. Res. Commun. 2002, 295, 890–897. [Google Scholar] [CrossRef]
  14. Gómez-García, M.R. Caracterización Molecular de la Pirofosfatasa Inorgánica Soluble de Microorganismos Fotosintéticos y Plástidos. Ph.D. Thesis, University of Seville, Sevilla, Spain, 2001; p. 266. [Google Scholar]
  15. Pérez-Castiñeira, J.R.; Gómez-García, R.; López-Marqués, L.; Losada, M.; Serrano, A. Enzymatic systems of inorganic pyrophosphate bioenergetics in photosynthetic and heterotrophic protists: Remnants or metabolic cornerstones? Int. Microbiol. 2001, 4, 135–142. [Google Scholar] [CrossRef] [Green Version]
  16. Lathi, R.; Pitkäranta, T.; Valve, E.; Ilta, I.; Kukko-Kalse, E.; Heinonen, J. Cloning and characterization of the gene encoding inorganic pyrophosphatase of Escherichia coli K-12. J. Bacteriol. 1988, 170, 5901–5907. [Google Scholar] [CrossRef] [Green Version]
  17. Baltscheffsky, M.; Nyrén, P. The Synthesis and Utilization of Inorganic Pyrophosphate. In Molecular Mechanisms in Bioenergetics; Ernster, L., Ed.; Elsevier: Amsterdam, The Netherlands, 1984; pp. 187–206. [Google Scholar]
  18. Cormaci, M.; Furnari, G.; Alongi, G. Flora marina bentonica del Mediterraneo: Chlorophyta. Boll. dell’Accademia Gioenia Sci. Nat. Catania 2014, 47, 11–436. [Google Scholar]
  19. Pérez-Lloréns, J.L.; Vergara, J.J.; Pino, R.R.; Hernández, I.; Peralta, G.; Niell, F.X. The effect of photoacclimation on the photosynthetic physiology of Ulva curvata and U. rotundata (Ulvales, Chlorophyta). Eur. J. Phycol. 1996, 31, 349–359. [Google Scholar] [CrossRef]
  20. Lewin, J. Silicon metabolism in diatoms. V. Germanium dioxide, a specific inhibitor of diatom growth. Phycologia 1966, 6, 1–12. [Google Scholar] [CrossRef]
  21. Wheeler, P.A.; Björnsater, R. Seasonal fluctuations in tissue nitrogen, phosphorus, and N:P for five macroalgal species common to the Pacific Northwest coast. J. Phycol. 1992, 28, 1–6. [Google Scholar] [CrossRef]
  22. Woelkerling, W.J.; Spencer, K.G.; West, J.A. Studies on selected Corallinaceae (Rhodophyta) and other algae in a defined marine culture medium. J. Exp. Mar. Biol. Ecol. 1983, 67, 61–77. [Google Scholar] [CrossRef]
  23. Porra, R.J.; Thompson, W.A.; Kriedemann, P.E. Determination of accurate extinction coefficients and simultaneous equations for assaying chlorophylls a and b extracted with four different solvents: Verification of the concentration of chlorophyll standards by atomic absorption spectroscopy. Biochim. Biophys. Acta 1989, 975, 384–394. [Google Scholar] [CrossRef]
  24. Murphy, J.; Riley, J.P. A modified single solution method for the determination of phosphate in natural waters. Anal. Chim. Acta 1962, 26, 31–36. [Google Scholar] [CrossRef]
  25. Bradford, M.M. A rapid and sensitive method for the quantification of microgram quantities of protein utilizing the principle of protein-dye binding. Anal. Biochem. 1976, 72, 248–254. [Google Scholar] [CrossRef]
  26. Ames, B.N. Assay of inorganic phosphate, total phosphate and phosphatases. Methods Enzymol. 1966, 8, 115–118. [Google Scholar] [CrossRef]
  27. Zar, J.H. Biostatistical Analysis, 2nd ed.; Prentice-Hall, Inc.: Upper Saddle River, NJ, USA, 1984; 718p. [Google Scholar]
  28. Lyngby, J.E.; Mortensen, S.; Ahrensberg, N. Bioassessment techniques for monitoring of eutrophication and nutrient limitation in coastal ecosystems. Mar. Poll. Bull. 1999, 39, 212–223. [Google Scholar] [CrossRef]
  29. Hernández, I.; Peralta, G.; Pérez-Lloréns, J.L.; Vergara, J.J.; Niell, F.X. Biomass and dynamic of growth of Ulva species in Palmones River estuary. J. Phycol. 1997, 33, 764–772. [Google Scholar] [CrossRef]
  30. Droop, M.R. 25 years of algal growth kinetics. A personal view. Bot. Mar. 1983, 26, 99–112. [Google Scholar] [CrossRef]
  31. McComb, R.B.; Bowers, G.N., Jr.; Posen, S. Alkaline Phosphatase; Plenum Press: New York, NY, USA, 1979; 986p. [Google Scholar]
  32. Gómez-García, M.R.; Losada, M.; Serrano, A. Concurrent transcriptional activation of ppa and ppx genes by phosphate deprivation in the cyanobacterium Synechocystis sp. strain PCC 6803. Biochem. Biophys. Res. Commun. 2003, 302, 601–609. [Google Scholar] [CrossRef]
  33. Vergara, J.J.; Pérez-Lloréns, H.J.L.; Peralta, G.; Hernández, I.; Niell, F.X. Photosynthetic performance and light attenuation in Ulva canopies from Palmones river estuary. J. Phycol. 1997, 33, 773–779. [Google Scholar] [CrossRef]
  34. Palomo, L.; Clavero, V.; Izquierdo, J.J.; Avilés, A.; Becerra, J.; Niell, F.X. Influence of macrophytes on sediment phosphorus accumulation in a eutrophic estuary (Palmones river, Southern Spain). Aquat. Bot. 2004, 80, 103–113. [Google Scholar] [CrossRef]
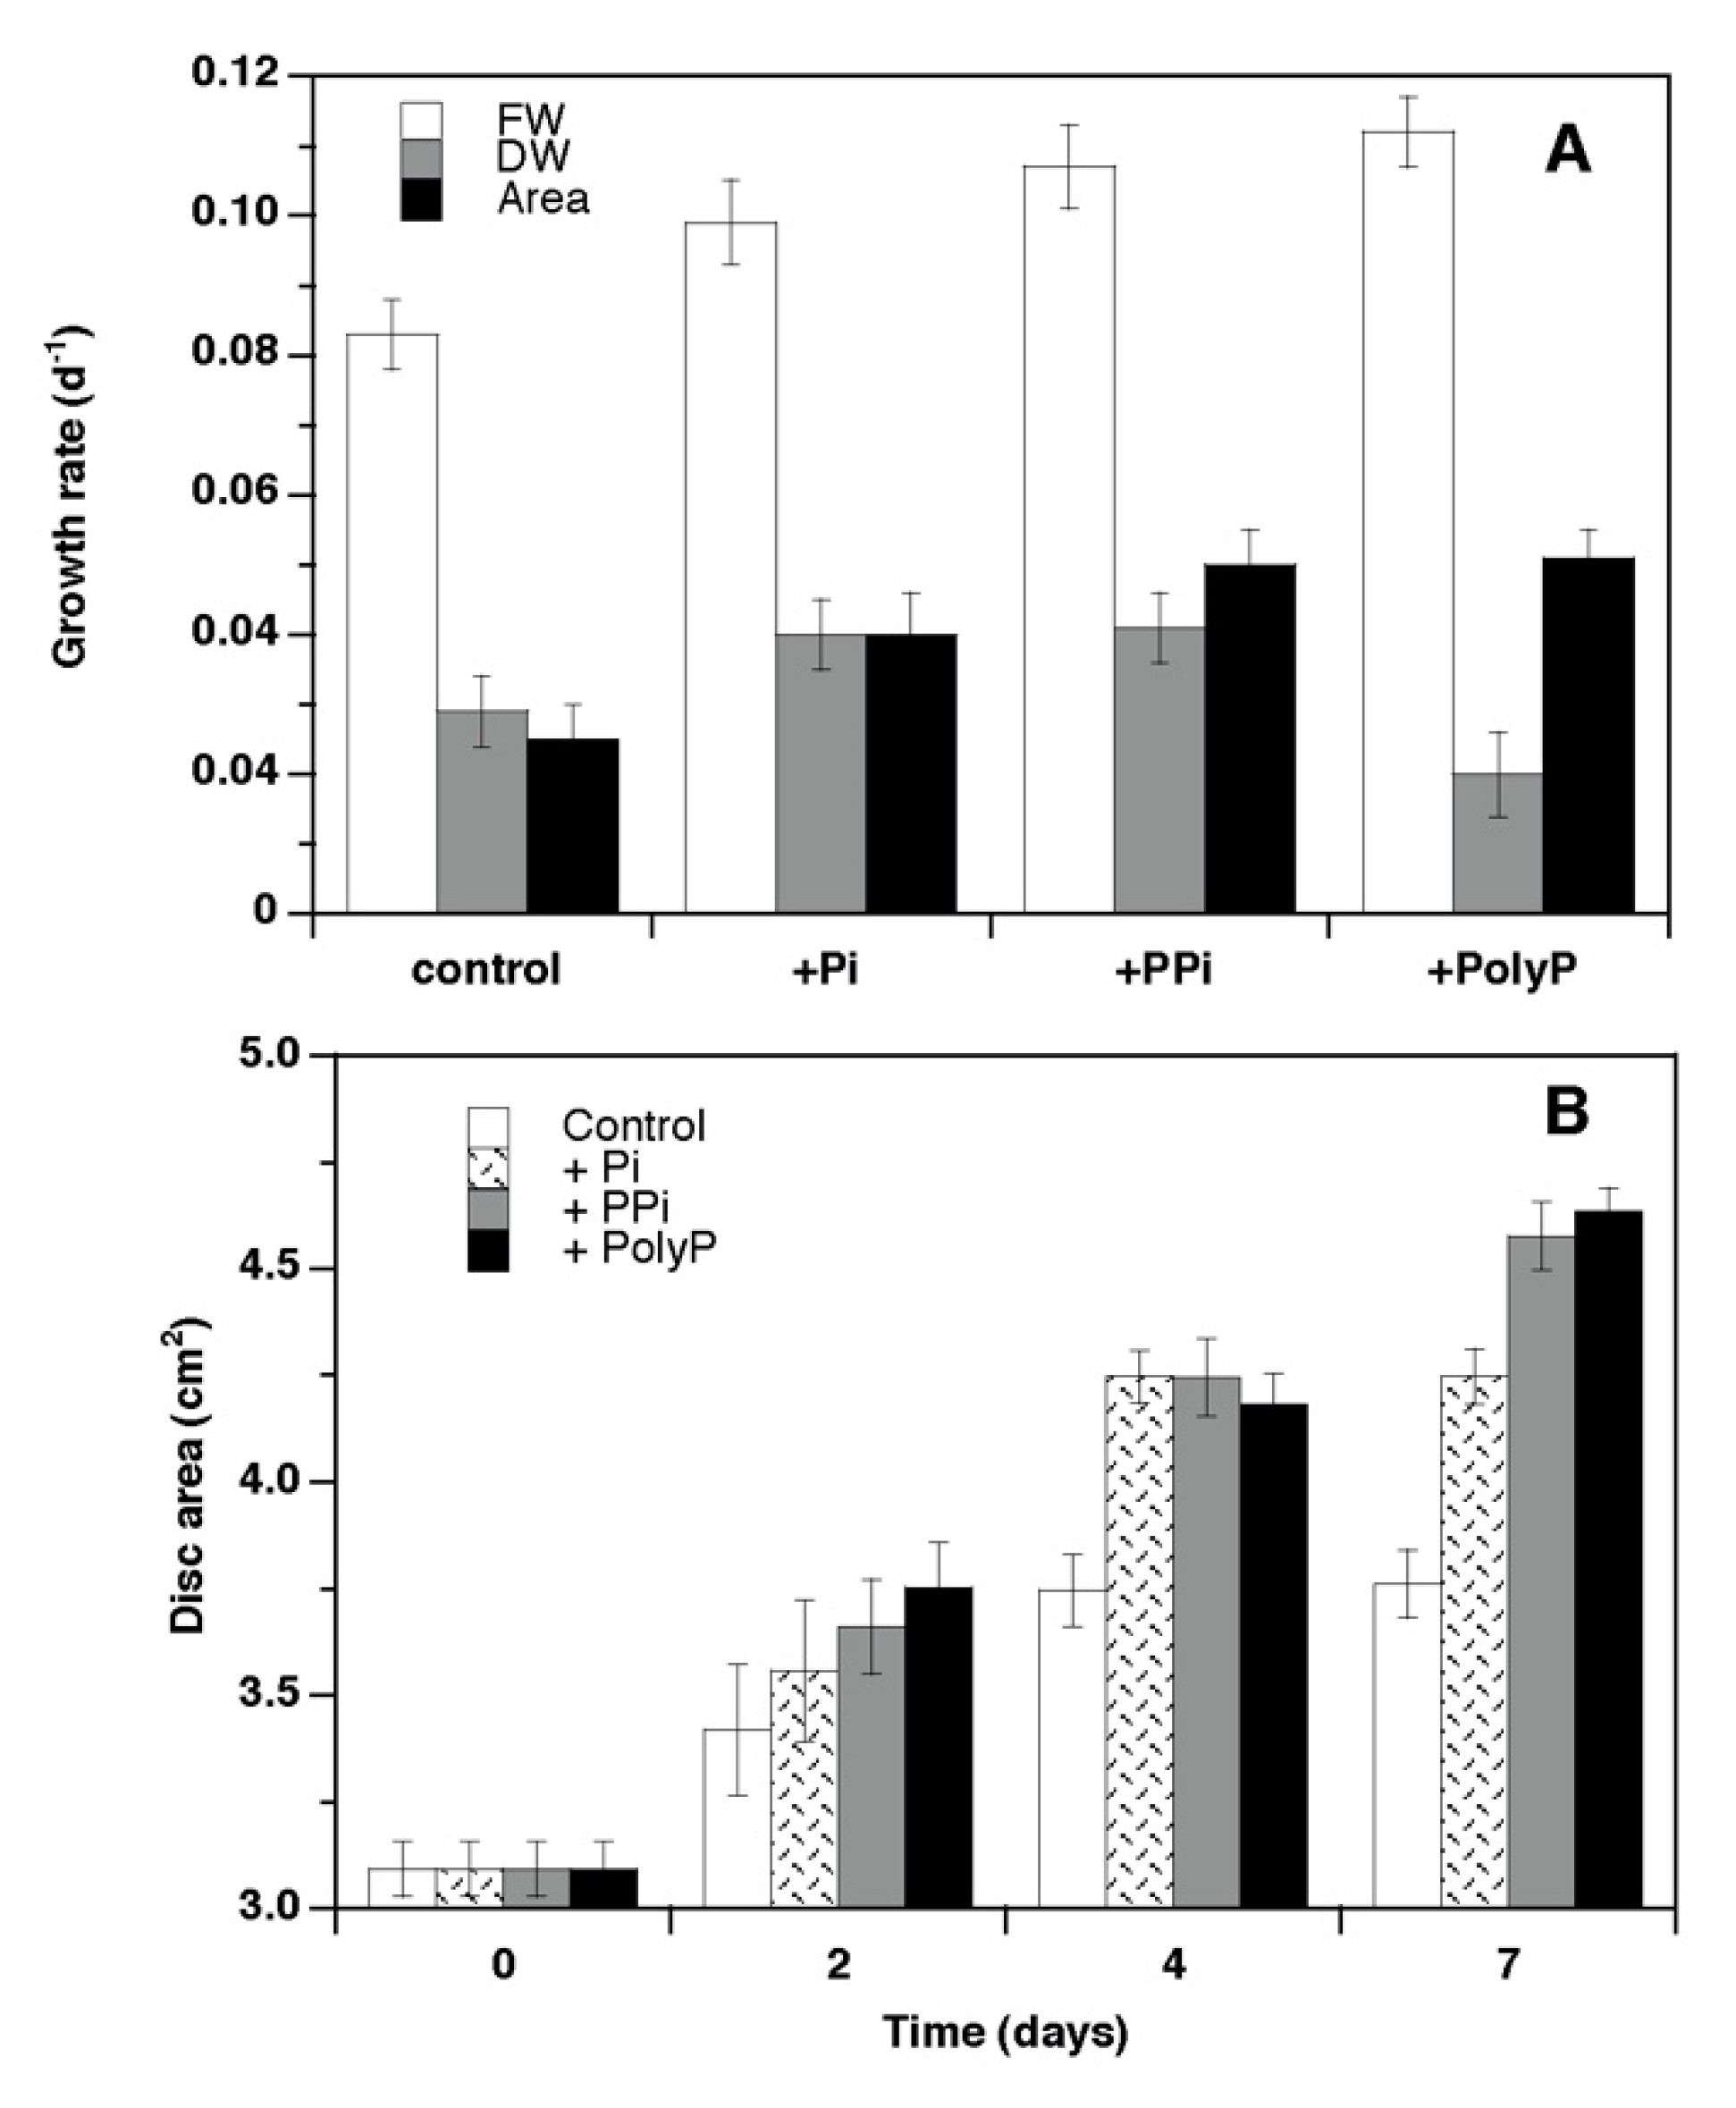
Figure 1. Ulva pseudorotundata. (A) Specific growth rates on fresh weight (FW), dry weight (DW) and area basis of seaweed discs cultured under different P regimes (control without P, Pi, PPi, and PolyP) for 7 days. Data are means ± SE (n = 3 independent cultures). (B) Disc area of seaweed discs along the experiment as a function of the different P regimes. Data are means ± SE (n = 6–9 discs).
Oceans 01 00023 g001
Figure 2. Ulva pseudorotundata. (A) Time course of fresh weight/area ratio and (B) dry weight/fresh weight ratio, as a function of different P regimes. Data are means ± SE (n = 6–9 discs).
Oceans 01 00023 g002
Figure 3. Ulva pseudorotundata. Time course of total (a + b) chlorophyll content as a function of different P regimes. Data are means ± SE (n = 3).
Oceans 01 00023 g003
Figure 4. Ulva pseudorotundata. (A) Time course of total internal P and (B) internal soluble reactive P (SRP), as a function of different P regimes. Data are means ± SE (n = 3).
Oceans 01 00023 g004
Figure 5. Ulva pseudorotundata. Time course of SRP in seawater, as a function of different P regimes. Data are means ± SE (n = 3).
Oceans 01 00023 g005
Figure 6. Ulva pseudorotundata. Time course of soluble protein content as a function of different P regimes. Data are means ± SE (n = 3).
Oceans 01 00023 g006
Figure 7. Ulva pseudorotundata. (A) Time course of sPPase activity on a protein basis and (B) on a dry weight, DW basis, as a function of different P regimes. Data are means ± SE (n = 3).
Oceans 01 00023 g007
Table 1. Ulva pseudorotundata. Enzyme soluble hydrolytic activities for different polyphosphate substrates in cell extracts of field collected samples. Data are expressed as mean (n = 3–4) ± SE. Different letters indicate significant differences among treatments at α = 0.05 following Tukey’s test and 1 way ANOVA.
SubstrateEnzyme Activity (U·mg prot−1)
Pyrophosphate4.71 ± 0.10 a
Tripoliphosphate4.87 ± 0.10 a
Trimetaphosphate2.12 ± 0.01 b
Polyphosphate 16.94 ± 0.11 c
Table 2. Ulva pseudorotundata. Internal C:N:P composition at the beginning of the experiment and after 7 days under different phosphorus treatments. Data are expressed as mean (n = 3) ± SE. Different letters indicate significant differences among treatments at α = 0.05 following Tukey’s test and 1 way ANOVA.
InitialControlPhosphatePyrophosphatePolyphosphate
Carbon (%DW)22.7 ± 0.9 a25.2 ± 0.4 b27.1 ± 0.1 b27.6 ± 0.3 b27.3 ± 0.3 b
Nitrogen (%DW)1.16 ± 0.03 a3.65 ± 0.09 b4.57 ± 0.10 c4.81 ± 0.13 c4.04 ± 0.12 b
Phosphorus (%DW)0.17 ± 0.01 a0.17 ± 0.01 a0.32 ± 0.02 b0.43 ± 0.01 c0.40 ± 0.01 c
C:N (by atoms)22.8 ± 0.5 a8.08 ± 0.32 b6.94 ± 0.13 b6.68 ± 0.12 b7.91 ± 0.13 b
C:P (by atoms)349 ± 13 a387 ± 9 a220 ± 14 b166 ± 7 b176 ± 4 b
N:P (by atoms)15.3 ± 0.5 a48.0 ± 1.3 b31.8 ± 2.2 b25.0 ± 1.5 bc22.2 ± 0.8 c
Publisher’s Note: MDPI stays neutral with regard to jurisdictional claims in published maps and institutional affiliations.