Article

Application of Photo-Identification and Lengthened Deployment Periods to Baited Remote Underwater Video Stations (BRUVS) Abundance Estimates of Coral Reef Sharks

1
Marine Conservation International, South Queensferry, Edinburgh EH30 9WN, UK
2
Centre for Marine Biology and Biodiversity, Heriot-Watt University, Edinburgh EH14 4AS, UK
3
Faculty of Marine Science, King Abdulaziz University, Jeddah 21589, Saudi Arabia
4
Marine Research Facility, North Obhur, Jeddah 23817-4981, Saudi Arabia
5
Cayman Islands Department of Environment, P.O. Box 10202, Georgetown, Grand Cayman KY1-1002, Cayman Islands
6
Cape Eleuthera Island School, PO Box EL-26029, Rock Sound, Eleuthera, Bahamas
*
Author to whom correspondence should be addressed.
Oceans 2020, 1(4), 274-299; https://doi.org/10.3390/oceans1040019
Submission received: 18 June 2020 / Revised: 16 October 2020 / Accepted: 23 October 2020 / Published: 3 November 2020

Abstract

:
Baited Remote Underwater Video Stations (BRUVS) are widely used for monitoring relative abundances of fishes, especially sharks, but only the maximum number of individuals seen at any one time (MaxN) is usually recorded. In both the Cayman Islands and the Amirante Islands, Seychelles, we used photo-ID to recognise individual sharks recorded on BRUVS videos. This revealed that for most species the actual numbers of separate individuals (IndN) visiting the BRUVS were significantly higher than MaxN, with, for example, ratios of IndN to MaxN being 1.17 and 1.24 for Caribbean reef, Carcharhinus perezi, and nurse, Ginglymostoma cirratum, sharks in the Cayman Islands, and 2.46 and 1.37 for blacktip reef, C. melanopterus, and grey reef, C. amblyrhynchos, sharks, respectively, in the Amirantes. Further, for most species, increasing the BRUVS deployment period beyond the 60 min normally used increased the observed IndN, with more than twice as many individuals in the Cayman Islands and >1.4 times as many individuals in the Amirantes being recorded after 120 min as after 60 min. For most species, MaxN and IndN rose exponentially with time, so data from different deployment periods cannot reliably be compared using catch-per-unit-effort (CPUE) calculated as catch-per-unit-time. In both study areas, the time of first arrival of individuals varied with species from <1 min to >2 h. Individually identifiable sharks were re-sighted after up to 429 days over 10 km away in the Cayman Islands and 814 days over 23 km away in the Amirantes, demonstrating that many individuals range over considerable distances. Analysis of Cayman re-sightings data yielded mean population estimates of 76 ± 23 (SE) and 199 ± 42 (SE) for C. perezi and G. cirratum, respectively. The results demonstrate that, for sharks, the application of both photo-identification and longer deployment periods to BRUVS can improve the precision of abundance estimates and provide knowledge of population size and ranging behaviour.

Graphical Abstract

1. Introduction

Globally, many species of shark have suffered a dramatic decline in abundance over the past 30 years [1,2,3], principally as a result of by-catch and finning in response to the demand for shark fin by the Far-East restaurant trade [4,5]. As a consequence, 11 shark species are now considered Critically Endangered, 15 Endangered and 48 Vulnerable [6]. Most large-bodied sharks are threatened or endangered [2,7], while even once common reef species have become scarce in many areas with, for example, the long-established shark fishery in the Seychelles recording a significant decrease in catch per effort from 16 to 6 kg day−1 between 1992 and 2016 [8].
As a result, monitoring the population abundance of sharks is much needed [9]. Baited Remote Underwater Video Stations (BRUVS), underwater video cameras set to record the fishes attracted to bait, is now the method most frequently used for surveying and monitoring sharks in particular [10,11,12]. Stereo-BRUVS, in which two cameras are focused towards the bait, can provide further data by enabling both the distance to a fish and its length to be determined [13], although the associated equipment costs are necessarily higher if similar numbers of units are to be deployed. Cappo et al. [14] have reviewed BRUVS techniques for camera, bait, and orientation of bait and camera, as well as potential auditory, olfactory and behavioural cues, while Harvey et al. [15] concluded that BRUVS provide a statistically robust and cost-effective method of monitoring diverse assemblages of fishes in a number of habitat types.
BRUVS are not the only visually-based method regularly employed for monitoring fishes. Several forms of Underwater Visual Census (UVC) are widely used by divers [16,17,18]. However, remote video has the advantage of being practical in conditions where divers cannot easily operate, as in very deep water or rough conditions, and of being able to detect species, such as large sharks, which are often too scarce or too wary to be regularly sighted by divers [13]. Video methods are only fully effective in reasonably clear water, and baited video will only detect species that either are resident close to the BRUVS, or passing through, such as roaming schools of carangids, or like sharks have a well-developed olfactory sense enabling them to home-in on the bait [19].
To date, the most commonly used measure of the numbers of fishes coming to the BRUVS has been the maximum number of fishes recorded in a single frame during the viewing period (referred to as MaxN or Nmax). While simple for an observer to record, this measure suffers a number of limitations, most obviously that the observed MaxN may be much lower than the total number of separate individual fish attracted to the bait. Harvey et al. [15] discussed alternative approaches, including the use of cumulative MaxN (recorded each time MaxN is updated for each species). Campbell et al. [20] compared MaxN with MeanCount (the mean number of fishes observed in a series of frames or stills). They concluded that these two measures were comparable for abundance estimation, although MeanCount resulted in less precision for all species analysed. Similarly, Schobernd et al. [21] compared the advantages of using MaxN and MeanCount in both simulations and laboratory experiments, as well as in empirical data. They concluded that an advantage of MeanCount is that it is linearly related to actual abundance, whereas MaxN is not.
Understanding the accuracy and precision of monitoring and surveying methods is important for interpreting any apparent change or lack of change in species number or relative abundance. A weakness of the above counting methods is that they do not record whether different individuals are visiting a BRUVS at different times, as opposed to a single individual making repeat visits. Nor do they detect when the same individual visits two or more different BRUVS. This limitation is most obvious with less abundant but not uncommon species, such as many reef sharks and rays, in which different individuals may visit the same BRUVS, but at different times.
To address this issue, studies on other taxa have experimented with photo-identification as a tool for distinguishing different individuals. Stobart et al. [22] used BRUVS to record spiny lobster, Palinurus elephas, and compared three measures of abundance: MaxN, mean MaxN (using 5 min sampling periods) and the true number of individuals per recording based on individual identification (referred to in the present study as IndN). The authors concluded that while all three measures could distinguish areas of contrasting population density, MaxN and MeanN were not appropriate for documenting changes in population abundance because they were liable to sample saturation. That is, an increase in population abundance may not result in any increase in the MaxN. More recently, Irigoyen et al. [23] used three relative abundance indices in a survey of broadnose sevengill shark, Notorynchus cepedianus: Nmax, NmaxIND (cumulative number of different sharks and similar to IndN) and Nocc (total number of occurrences in a BRUVS session). The index NmaxIND appeared to show a greater abundance of sharks than Nmax. Sherman et al. [24] used photo-identification to determine the true numbers of two species of ray visiting BRUVS and found that the actual abundances were for Neotrygon orientalis 2.4, and for Taeniura lymma 1.1, times greater than the recorded MaxN values. However, to date this approach has not been generally applied to BRUVS-based monitoring of sharks, in part because the earlier cameras used were of lower resolution, so that it was not feasible to distinguish between most individuals of the same species.
Photo-identification has been found to be practical in some other studies of sharks. Population estimates of basking shark, Cetorhinus maximus [25], and great white shark, Carcharhinus carcharius [26], have been made based on individual recognition through quality images of dorsal fins. Photo-identification based on images captured by divers or fishers has also been used in ecological studies of blacktip reef shark, C. melanopterus [27], Greenland shark, Somniosus microcephalus [28], nurse shark, Ginglymostoma cirratum [29], sicklefin sharks, Negaprion acutidens [30], broadnose sevengill shark, Notorynchus cepedianus [23], and whale shark [31,32], as well as flapper skate, Dipturus intermedius [33]. In addition, BRUVS have been used to monitor the presence and size [34], as well as site fidelity [11], of individually identified sharks. Here, the feasibility of applying photo-identification methodology to the video footage recorded by BRUVS is assessed to monitor more effectively the abundance of coral reef shark species and test whether the data can also be used to generate additional information on population size or ranging behaviour.
The deployment period used to record individuals visiting a BRUVS (i.e., the effective length of deployment) has also varied between studies. The majority of previous studies have used deployment periods of 60 min (for example [24,35,36]), often because this was the maximum recording time that could be guaranteed by the batteries in older cameras. Some studies used shorter times, such as 30 min ([19] fish species), while Brooks et al. ([10] shark species) used 90 min, Harasti et al. ([34] white shark) 5 h and Stobart et al. ([22] lobster) 7 h. After using BRUVS to record coral reef fishes in the Hawaiian Islands, Asher [37] concluded that while a short deployment of 20 min was sufficient to capture fast-reacting species and residents, longer periods of 60 min were required to capture macropiscivores, including sharks. Our experience suggested that additional individual and species of shark could arrive at a BRUVS even after this time. A study by Torres et al. [38] exceeded other deployment times in using a duration of 24 h for sharks in the western Mediterranean. As a result of the wide range of deployment times used in different studies, the effect of deployment period on the numbers of individuals and species of shark recorded at a site was also tested in the present study.
In the present study, the BRUVS video recordings obtained during two shark conservation projects, one in the Cayman Islands (western Caribbean) and the other in the Amirante Islands (south-western Seychelles) were reviewed. Photo-identification methodology was applied to distinguish the separate individuals visiting BRUVS over different periods. The aims of the study were to assess whether (a) the use of photo-identification can provide better estimates of the numbers of sharks being recorded, (b) the approach can be used to generate estimates of population size by applying mark–recapture analyses to the data, and (c) the method can also be used to provide information about the movements of individuals. In addition, (d) it was investigated whether for reef sharks the numbers of species and individuals recorded varied significantly with BRUVS deployment period. We found that photo-identification could enhance the value of data obtained in relation to all three questions. However, the present study is not intended to compare abundances between areas or habitats, or across years (hence locations of individual stations are not included); those analyses are being reported on separately.

2. Materials and Methods

2.1. Study Areas

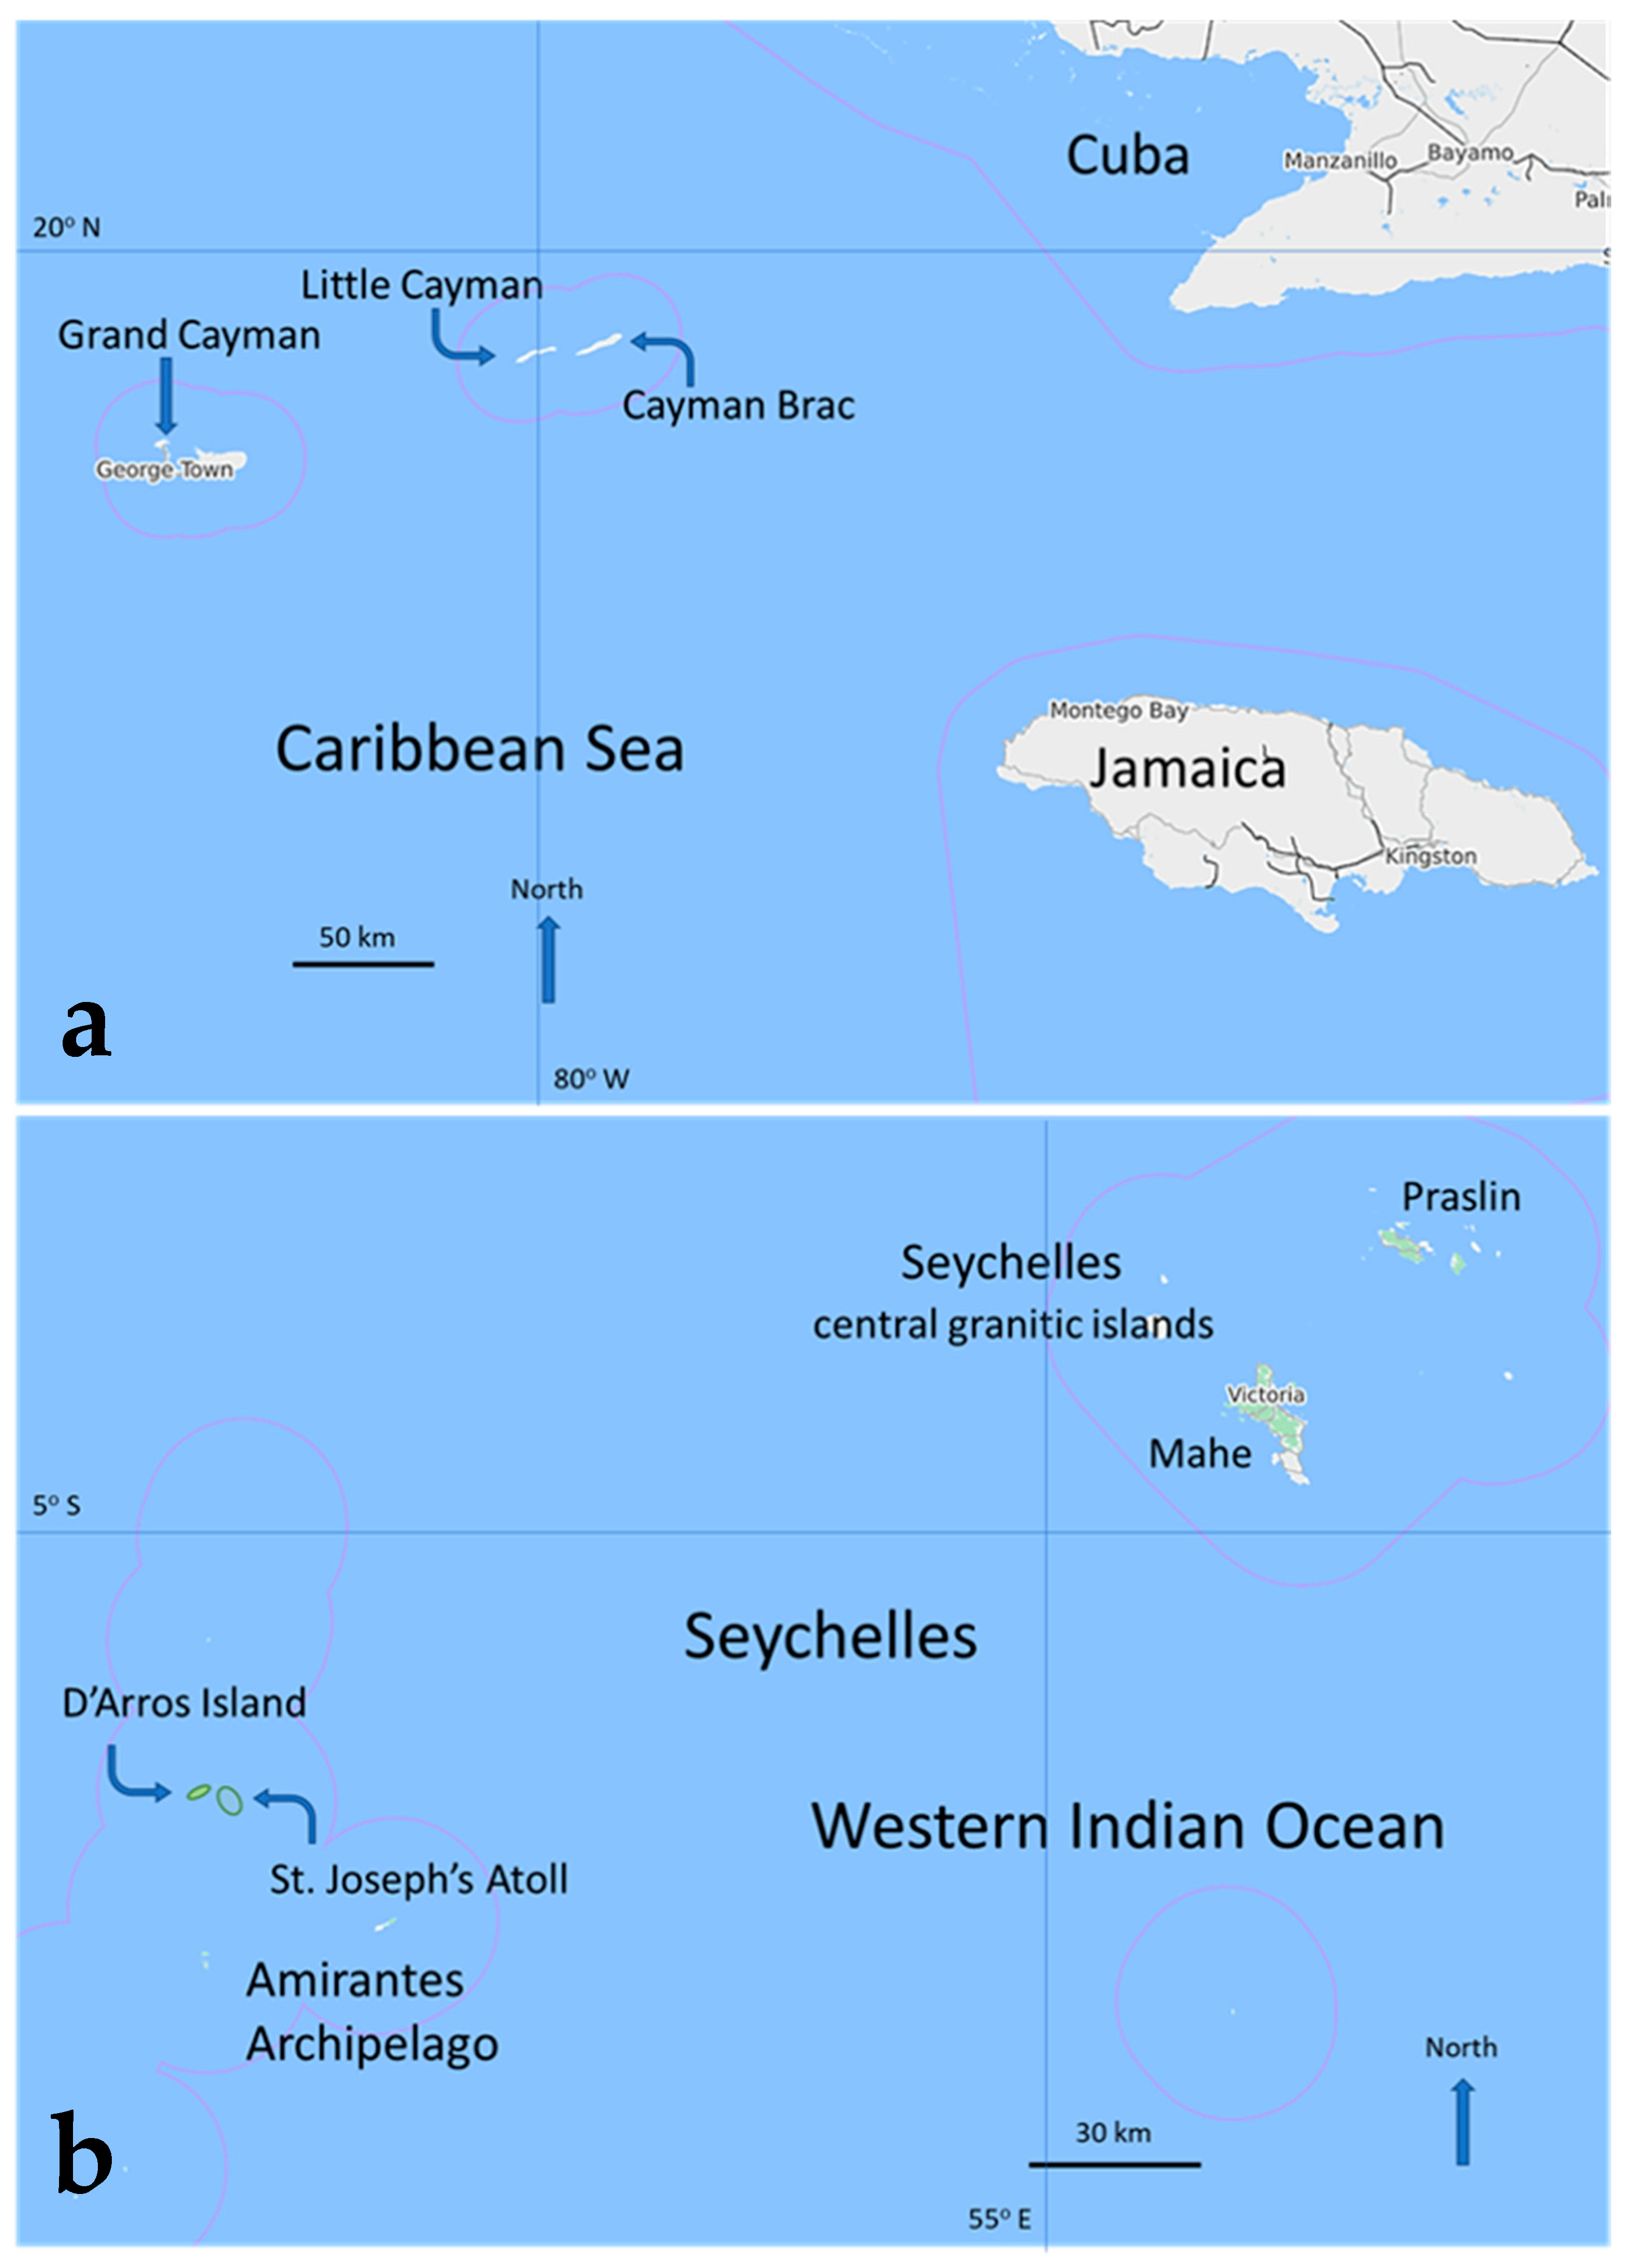
The study was based on data collected from two widely separated island groups, one in the western Atlantic and the other in the Indian Ocean. The Cayman Islands are located in the North-West Caribbean Sea (Figure 1a) and include three islands, Grand Cayman, Little Cayman and Cayman Brac. These islands are emergent sections of the Cayman Ridge which runs adjacent to the 7 km deep Cayman Trench. Sampling was conducted around the largest island, Grand Cayman (in a study area bounded by Latitudes 19.25° N and 19.42° N and Longitudes 81.05° W and 81.44° W), and also around Little Cayman (in a study area bounded by Latitudes 19.64 and 19.73° N and Longitudes 79.95 and 80.13° W), 130 km to the northeast. Both islands have well-developed fringing coral reefs beyond which a narrow coastal shelf drops steeply to very deep water. A series of marine parks and conservation/replenishment areas, occupying about 25% of the 160 km long coastline, were designated over 30 years ago. Shark abundance, although a little higher than on many other Caribbean Islands, was still considered low in relation to relatively pristine reef areas [39]. In consequence sharks were given full protection throughout Cayman waters in 2015 [40].
The Amirante Islands in the south-western part of the Seychelles, in the western Indian Ocean (Figure 1b), are a series of widely separated small islands and coral reefs sitting on the 180 km by 40 km Amirante Bank, beyond which the plateau gives way to very deep water. The islands include D’Arros Island (53.29° E, 5.41° S) and the adjacent St. Joseph Atoll (53.33° E, 5.43° S), around both of which the data used here were collected (the combined study area being bounded by Latitudes 5.27° S and 5.47° S and Longitudes 53.17° E and 53.38° E). D’Arros and the outer faces of St. Joseph Atoll are surrounded by well-developed fringing reefs that slope down from a reef crest to the seabed at 15 to 20 m, while the atoll itself encloses a 3.5 km wide sandy lagoon, 1–6 m deep. Adjacent bank areas (5–35 m deep) that were also surveyed have a mainly sandy seabed, which in its shallower parts are colonised by dense seagrass beds (mostly Thalassodendron ciliatum) and occasional coral patches. D’Arros and St. Joseph Atoll are more remote from significant human populations than the Cayman Islands, and the adjacent reefs have been protected from fishing for almost three decades; in contrast, however, more distant bank areas are regularly fished, including by targeted long-lining for sharks. Nevertheless, sharks are more abundant in the Amirante Islands than in the Cayman Islands, and a comparison between the two areas provided an indication of how different levels of abundance influence the value of applying photo-identification to BRUVS recordings. The precise locations of sampling points are not relevant to the analysis, and for both ethical and legal reasons are not included in this report.

2.2. BRUVS

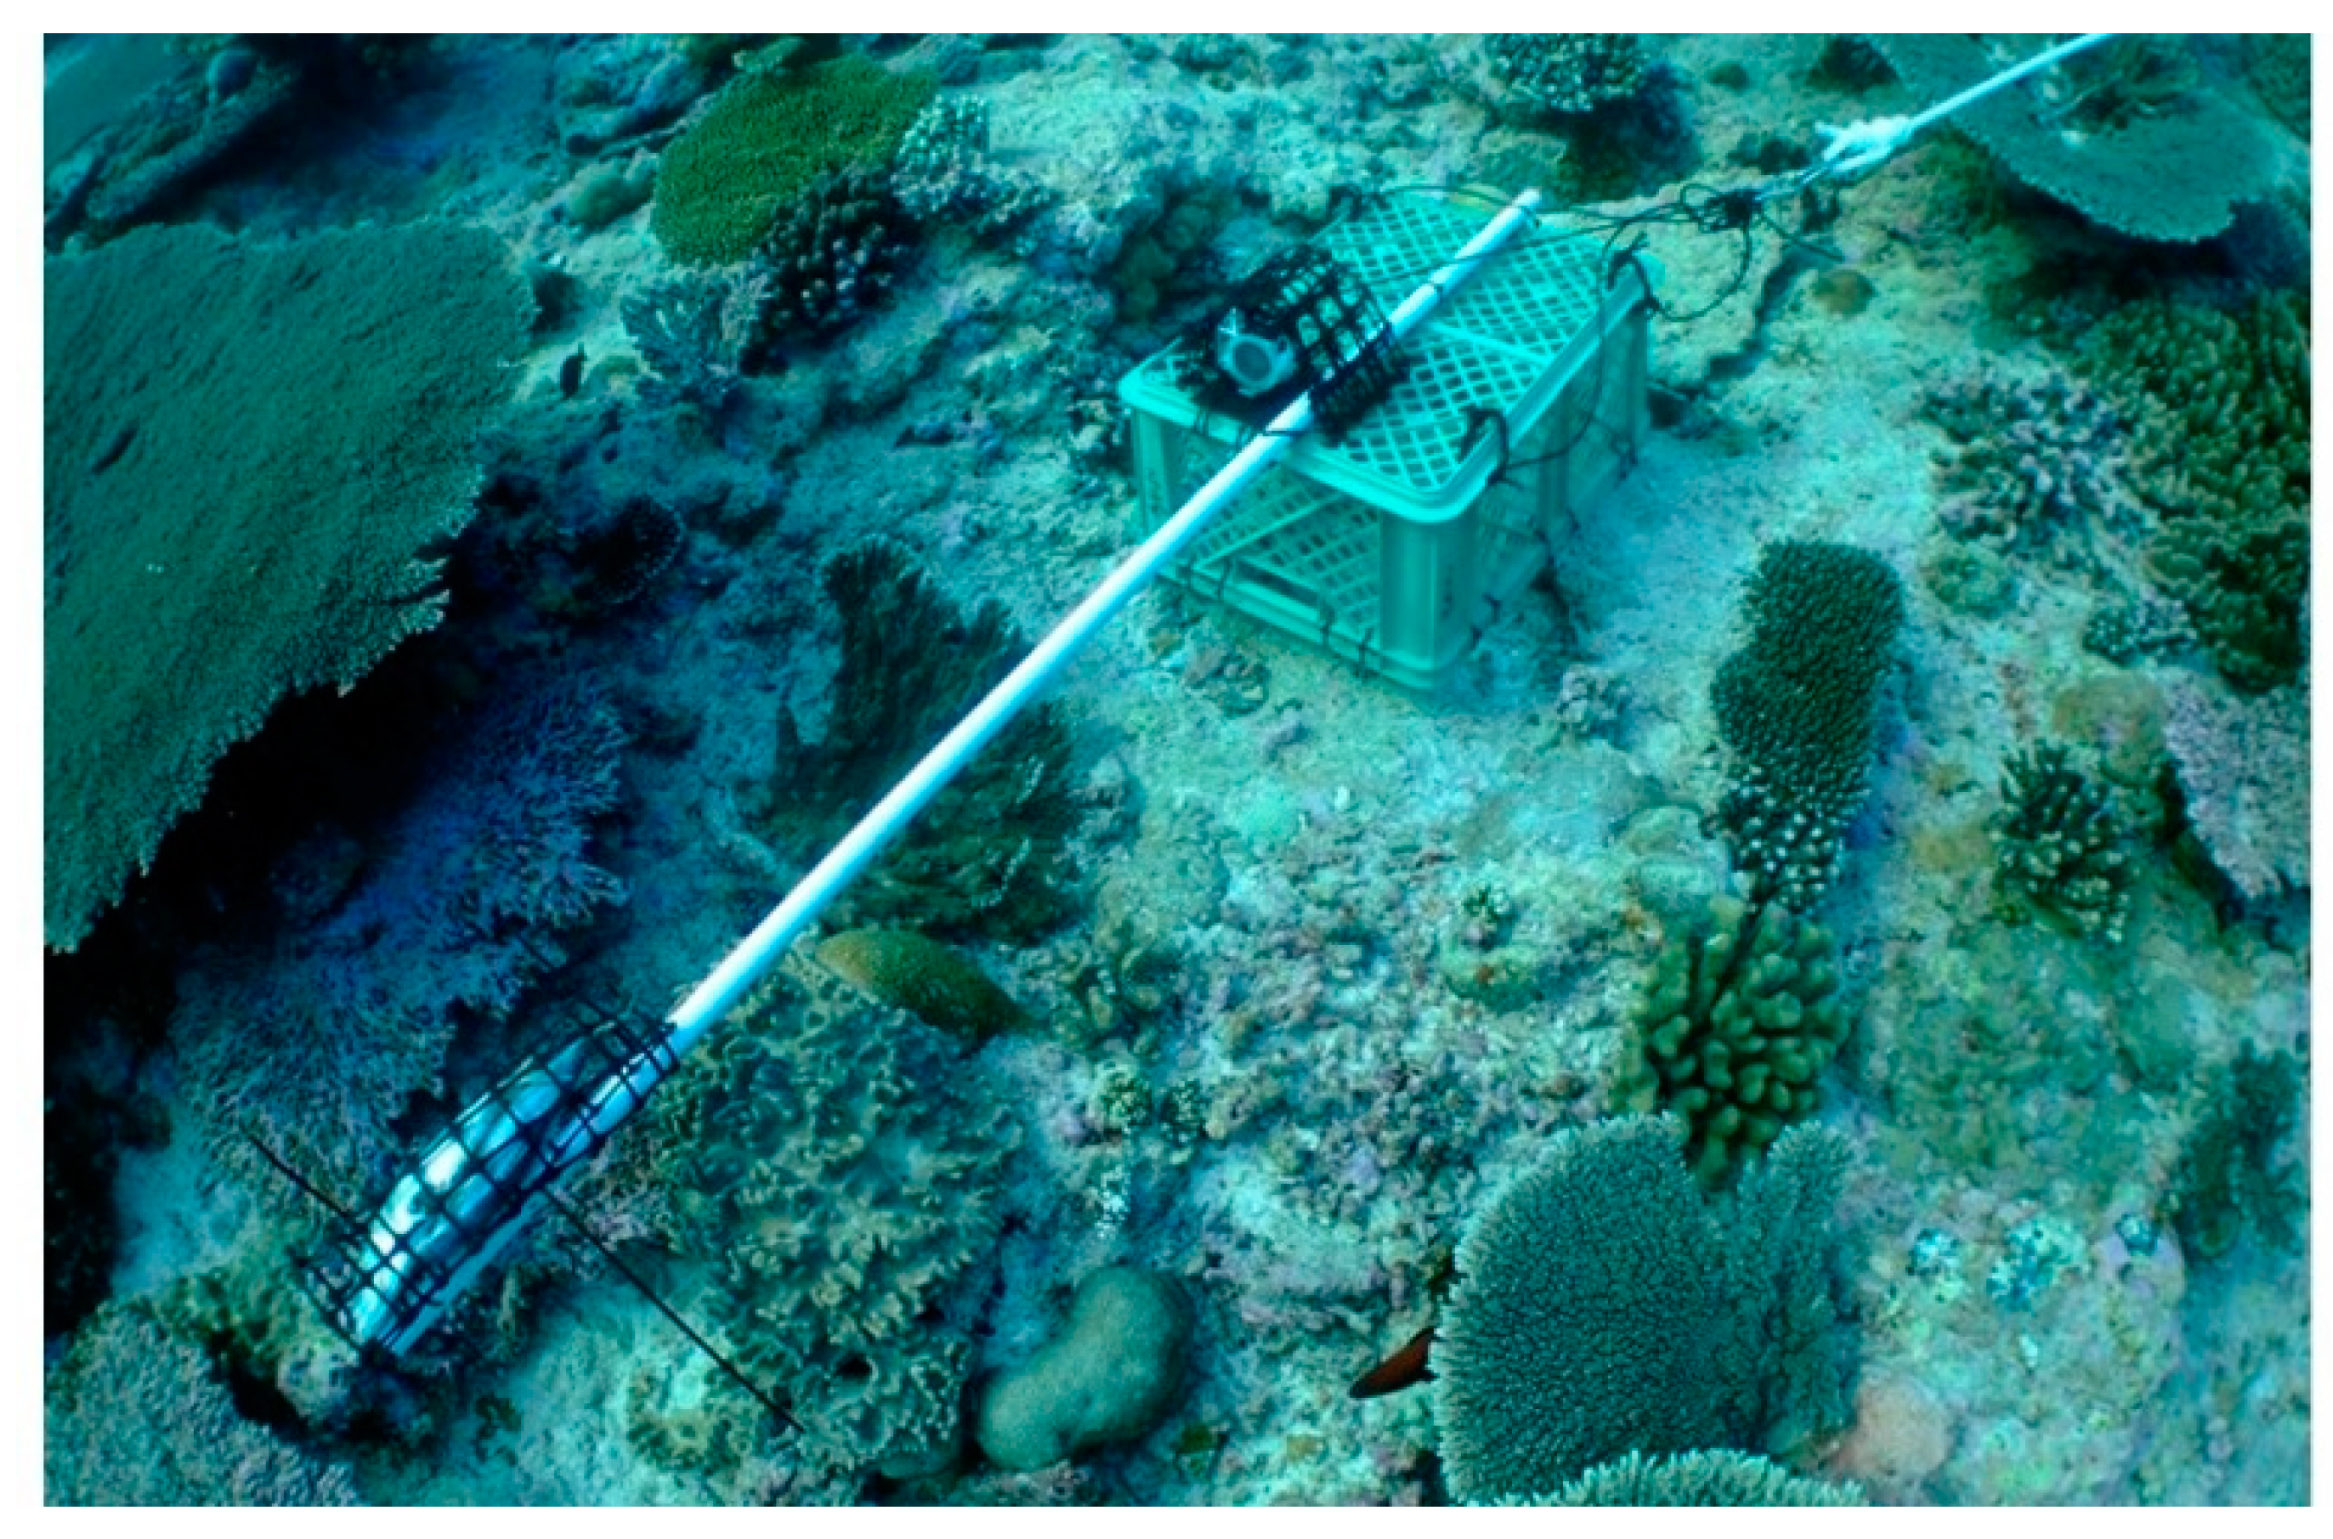
In both study areas the BRUVS body was built from an open weave plastic crate, upturned and weighted down by a series of dive weights attached close to the rim (now the lower side). The bait arm was a 1.5 m long PVC tube fixed to the top of the crate, with the bait enclosed in a double-layered plastic mesh bag placed at the far end of the bait arm (Figure 2). The amount of bait used was standardised at 300 g of mackerel, Scomber scombrus, in the Cayman Islands and bonito, Euthynnus affinis, in the Amirante Islands. A camera was fixed on the crate next to the base of the bait arm and pointed towards the bait bag. The cameras used were models 3 and 4 Silver GoPros, which recorded in high definition (HD) and could be fitted with double battery packs, allowing recording periods of 2+ h. The availability of HD cameras was key to the present work, as the high quality of images extracted from video permitted the detection of fine detail on the individual sharks.
BRUVS were normally deployed in both study areas on the fore-reef at depths of 10–18 m, but at 2–4 m deep in the lagoon of St. Joseph Atoll and in the Cayman Islands’ Sounds (equivalent to lagoons). Deployment by boat took place between 07:35 and 15:34 h in the Amirante Islands and 08:26 and 15:04 in the Cayman Islands. BRUVS were positioned on the seabed in open spaces among corals on reefs, or in gaps within seagrass beds. Appropriate placement of the BRUVS was achieved with the aid of either a viewing scope or of a snorkeler who signalled when the BRUVS was over a suitable area. In both locations BRUVS were deployed in sets of four, one at each of four stations that were located at variable intervals of 500 m to 2 km in a line along each section of coast (i.e., coasts orientated in a particular direction); the arrangement thus approximated a stratified random sampling design. In repeat deployments over successive years BRUVS were placed at the same stations at the same sites. Survey work was undertaken when the Douglas sea scale was ≤ 4 and wave or swell height ≤ 1.5 m. Following retrieval of the BRUVS, memory cards were removed from the cameras and the files copied to computers on which the videos could be viewed. Visual analysis was carried out for the full length of each video, with a minimum of 25% of each video being checked by a second researcher to ensure that comparable standards were being observed. For each shark that was detected, the time(s) of arrival in view and loss from view were recorded on each occasion, along with species, sex, maturity and size, as estimated by comparison with the size of the bait bag and graduated marks on the bait arm [42].
In the Cayman Islands BRUVS were deployed once or twice a year, in or around June and December, and for present purposes data from 2015 to 2017 have been analysed. In the Amirante Islands BRUVS were deployed once per year, in or around February or March, and for this study data from 2015 to 2017 were similarly selected.

2.3. Photo-Identification

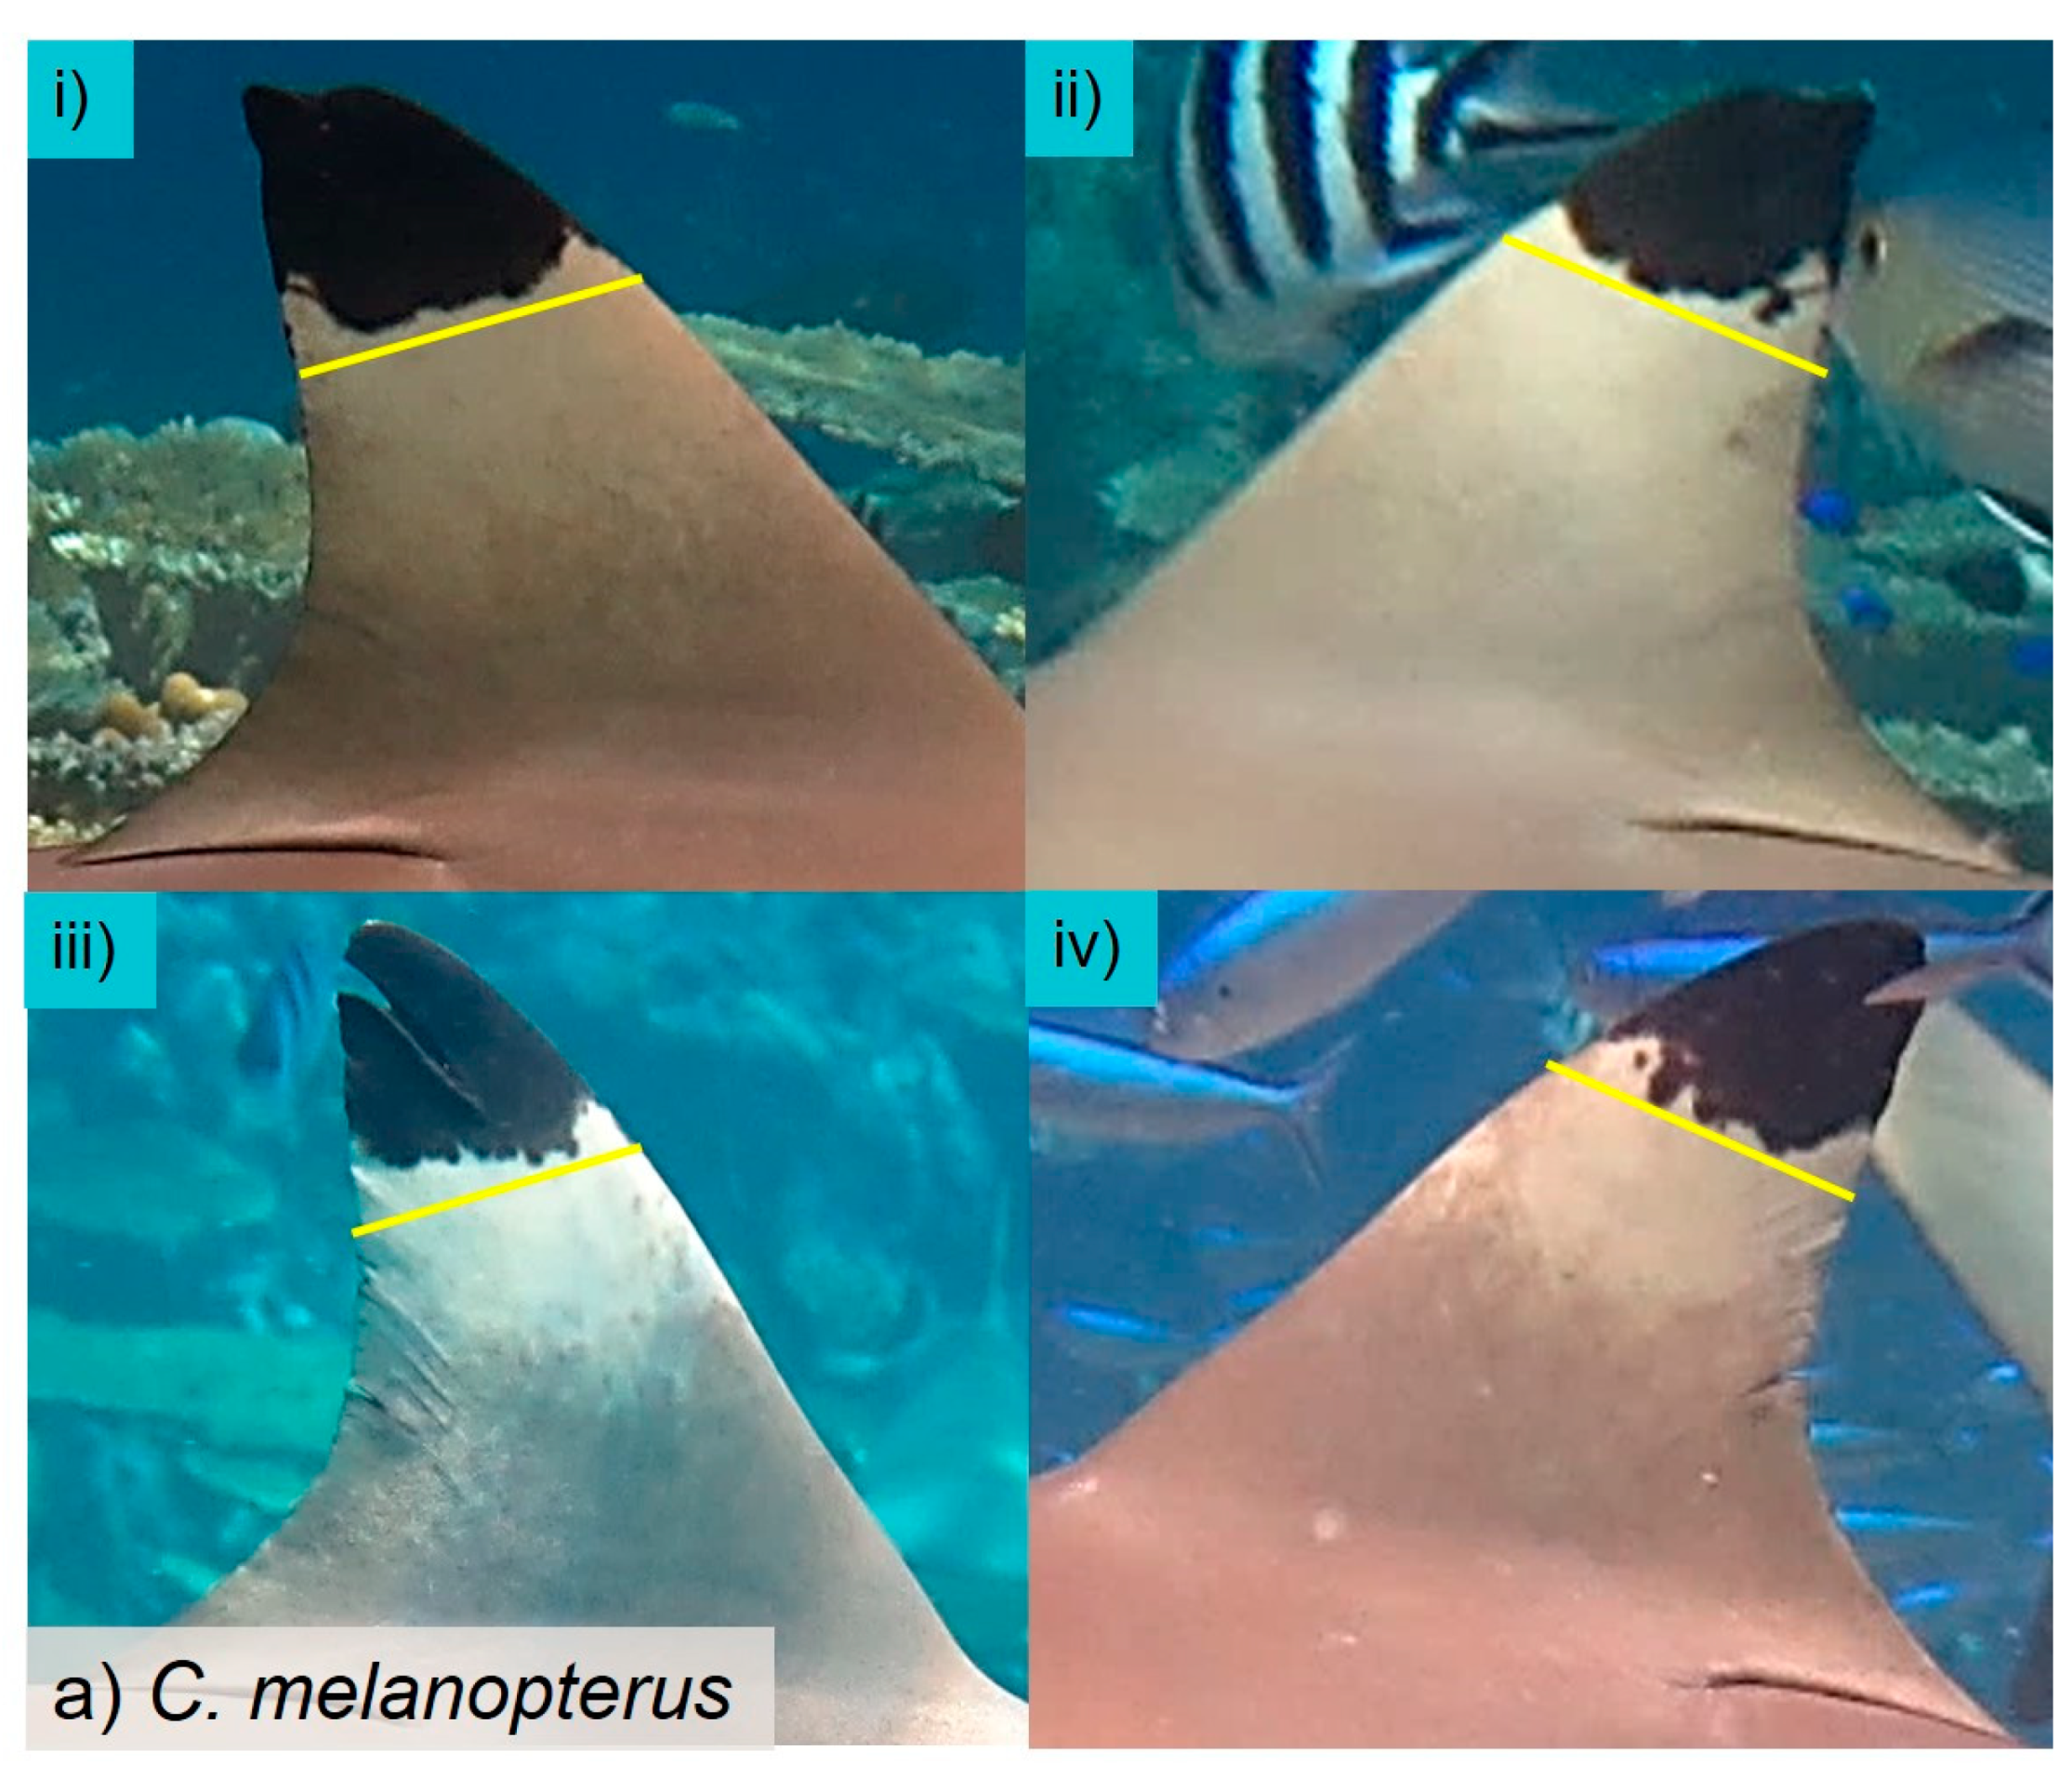
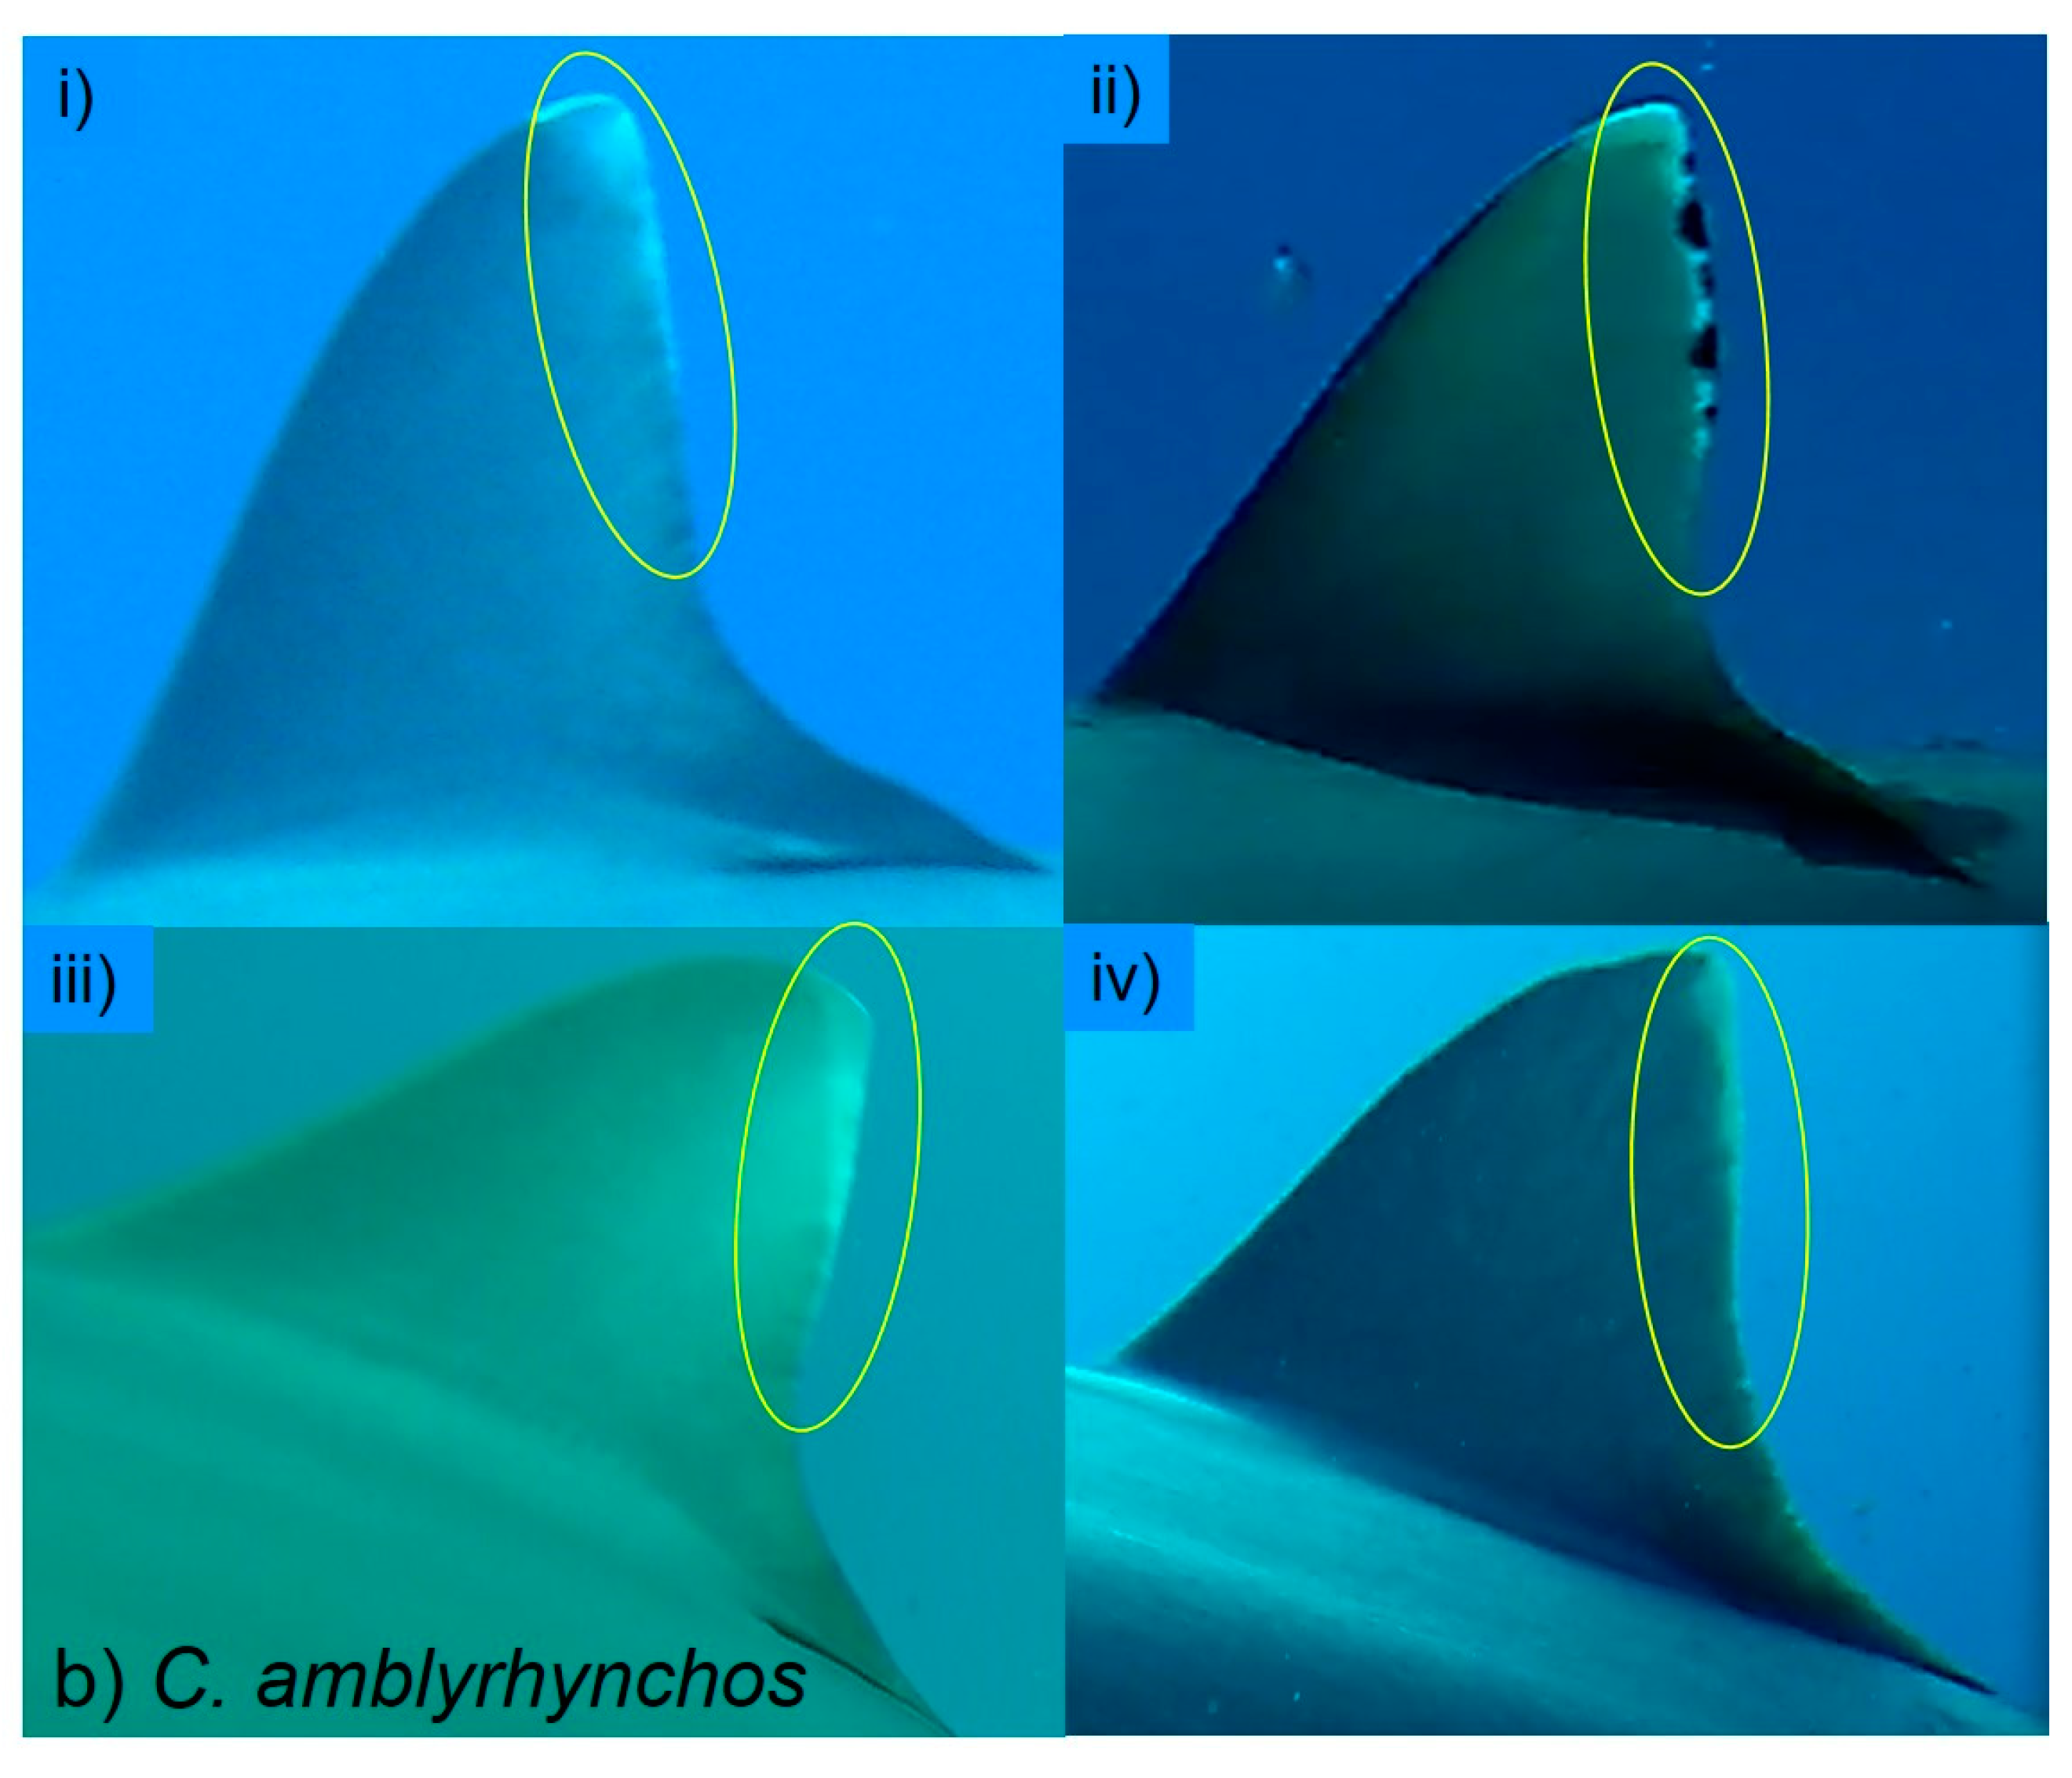
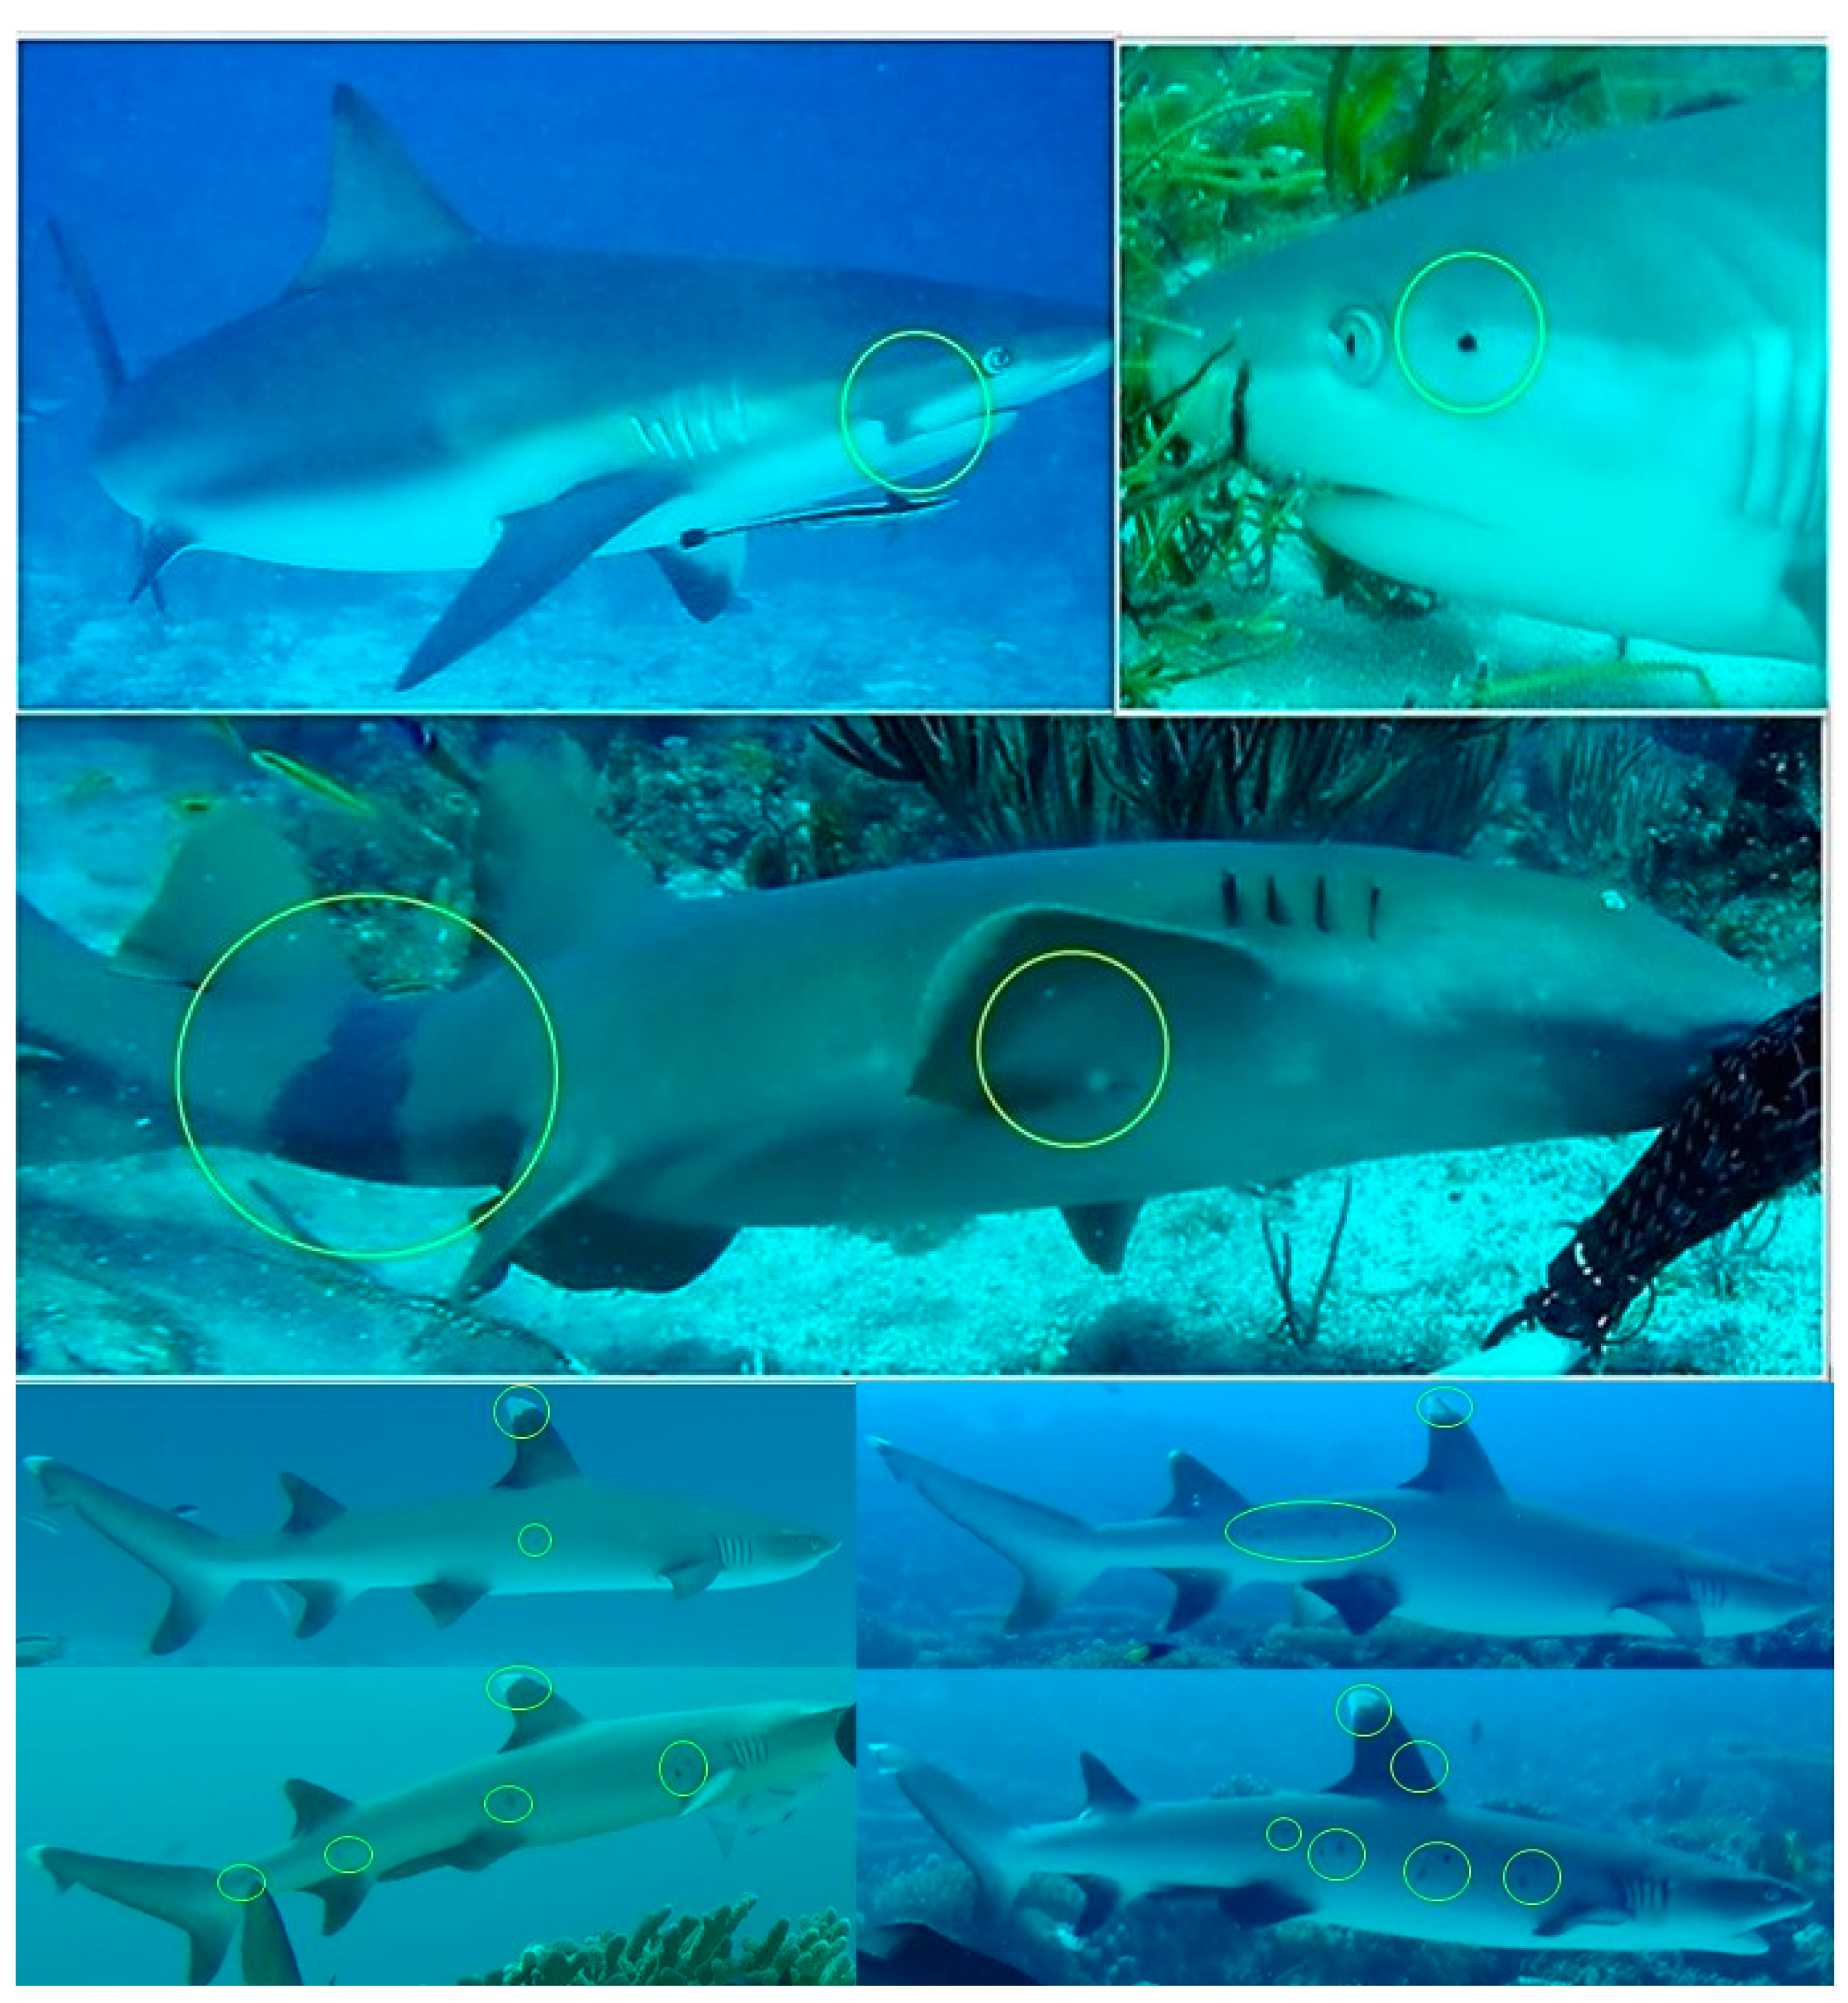
To facilitate individual recognition, so far as possible detailed information was recorded on the appearance of each newly observed shark. The characteristics recorded included the shapes of fins and other body parts (if these appeared in anyway atypical), and any variation in natural patterning or colouration, as well as the shape and location of any naturally acquired markings, such as wounds, injuries or scars (Figure 3 and Figure 4). Details were recorded of distinguishing features on both sides of the body, so that with few exceptions individuals could be recognised on viewing from either side. Acquired marks could be temporary, as with minor abrasions or injuries, but most used in individual identification were more permanent, as when part of a fin was missing or torn. Evidence from longer-term studies suggested that while many non-fatal injuries heal, scars and serious fin injuries in sharks can remain evident for many years [25,26].
Features observed on individual sharks were marked on a standardised cartoon (sketch-like drawing) for each shark (see [25] for further discussion of the method and for examples). Characteristics recorded on each cartoon were then entered into a computer database, along with the details of each deployment and selected images showing the individual’s distinctive features. The cartoons and database could be interrogated for individual characteristics to facilitate matching with any other recorded individual. Potential matches were then either confirmed or rejected by comparison of the images or video clips of each shark. Potential matches were independently verified by a second researcher.

2.4. IndN and MaxN

Data on the numbers of sharks were used to compare the results of using two different methods for recording the numbers of sharks of each species attracted to each BRUVS. First, MaxN, the greatest number of sharks of a given species observed in a single frame during a set period, was determined. Second, photo-identification was used to determine so far as possible IndN, the total number of different individuals of each species visible at any time in the field of view. In practice, not all the sharks detected on screen approached the BRUVS close enough for the individual to be identified. Individuals that lacked distinguishing features enabling them to be recognised in the long term, but that could still be separated from other sharks seen on the same recording (for example, if the shark was a different size), were added to the tally. Nevertheless, on some occasions two or more similar individuals may not have been seen clearly enough to distinguish, and on others not every shark attracted may have entered the field of view. Thus, in some instances, the IndN recorded will have been less than the actual number of individuals visiting.
Catch per unit effort (CPUE) has been used to compare the numbers of sharks visiting different BRUVS [10], but this metric can be misleading because, as evident from our results, the numbers of new sharks arriving at a BRUVS tends to decline with time. That is, the plot of the accumulative number of individuals against time is asymptotic. Therefore, longer deployments may generate lower CPUEs, even if more sharks are recorded. For this reason, the values of MaxN and IndN were compared with respect to three different deployment periods commencing from the time when the BRUVS arrived at the seabed; these were 60, 120 and 150 min. This comparison was undertaken to investigate the effects of using longer deployment periods by determining if these result in the detection of more individuals and/or more species. Deployment period was the term used to describe the recording time on the seabed.

2.5. Statistical Analysis and Mark–Recapture Population Estimates

A series of tests were applied to the data to determine statistical significance as detailed in the relevant parts of the Results section; these include Friedman ANOVA, Wilcoxon matched pairs test, ANOVA, paired t and post-hoc LSD tests. The statistical package used in the study for parametric and non-parametric tests (described in Results) was Statistica 64 V. 12.
Although large numbers of BRUVS videos were analysed (>500) and a large number of individually identifiable sharks recorded, the numbers of individuals re-sighted on successive campaigns were too low for open population mark–recapture models to be employed, such as the Schnabel and Jolly–Seber methods which we have applied to basking shark in Scotland [25]. However, the numbers of re-sightings in the Cayman Islands for six surveys over three years were high enough for successive population estimates of two species to be made using the Chapman derivative of the basic Lincoln–Peterson estimator [43,44], which is more robust for small sample sizes [45]. For each “re-capture” occasion t, the population size Nt was calculated where nt = the number of sharks sighted on sample occasion t, rt = the number of marked sharks re-sighted in sample nt, and mt = the number of marked sharks at the beginning of sample occasion t:
Nt = [(mt + 1) ∗ (nt + 1)/(rt + 1)] − 1
Assuming that k1 number of sharks were initially marked (i.e., identified) at sample occasion 1 and that k2 = n2 − r2 was the number of unmarked (previously unknown) sharks sighted by the end of sample occasion 2, then mt, the number of effectively marked sharks at the next sample occasion t, equals k t . The total population size ( N ¯ ) was estimated as the mean across sample occasions s [41,42] according to:
N ¯   =   N t / ( s     1 )

3. Results

A total of 661 BRUVS were deployed, 451 in the Cayman Islands (at 92 locations) and 210 BRUVS in the Amirante Islands (at 60 locations). These BRUVS recorded a total of six species in the Cayman Islands and eight in the Amirante Islands (Table 1), representing two orders (Carcharhiniformes and Orectoloboformes) and three families (Carcharhinidae, Ginglymostomatidae and Sphyrnidae) of sharks.

3.1. Recognisability of Individual Sharks

In most species the majority of sharks observed could be recognised as individuals (Table 1), although the proportions of sharks observed for which sufficient features were evident to permit this varied from 100% for tiger shark, Galeocerdo cuvier, to 9.1% for bull shark, Carcharhinus leucas. In some species, individuals were relatively easy to distinguish. For example, the dorsal fins of C. melanopterus (85.3% individually identifiable) are capped by an area of black pigmentation, the exact shape of which varies markedly both between individuals and between opposite sides of the same individual (Figure 3). Similarly, whitetip reef sharks, Triaenodon obesus, (63.9% individually identifiable) have spot patterns on the body that are unique to individuals (Figure 4). Other species, such as C. amblyrhynchos, (77.9% individually identifiable) and G. cirratum (82.8% individually identifiable) (Figure 4), required more careful examination of the video footage to discern individually distinctive markings. C. leucas and silvertip, C. albimarginatus, sharks were the most difficult to identify as individuals on recordings since they tended not to approach the camera, making detection of individual features often impracticable. The mean percentage of distinguishable sharks across species was 60% and the overall percentage of recognisable individuals (irrespective of species) was 66%.

3.2. Comparison of IndN with MaxN

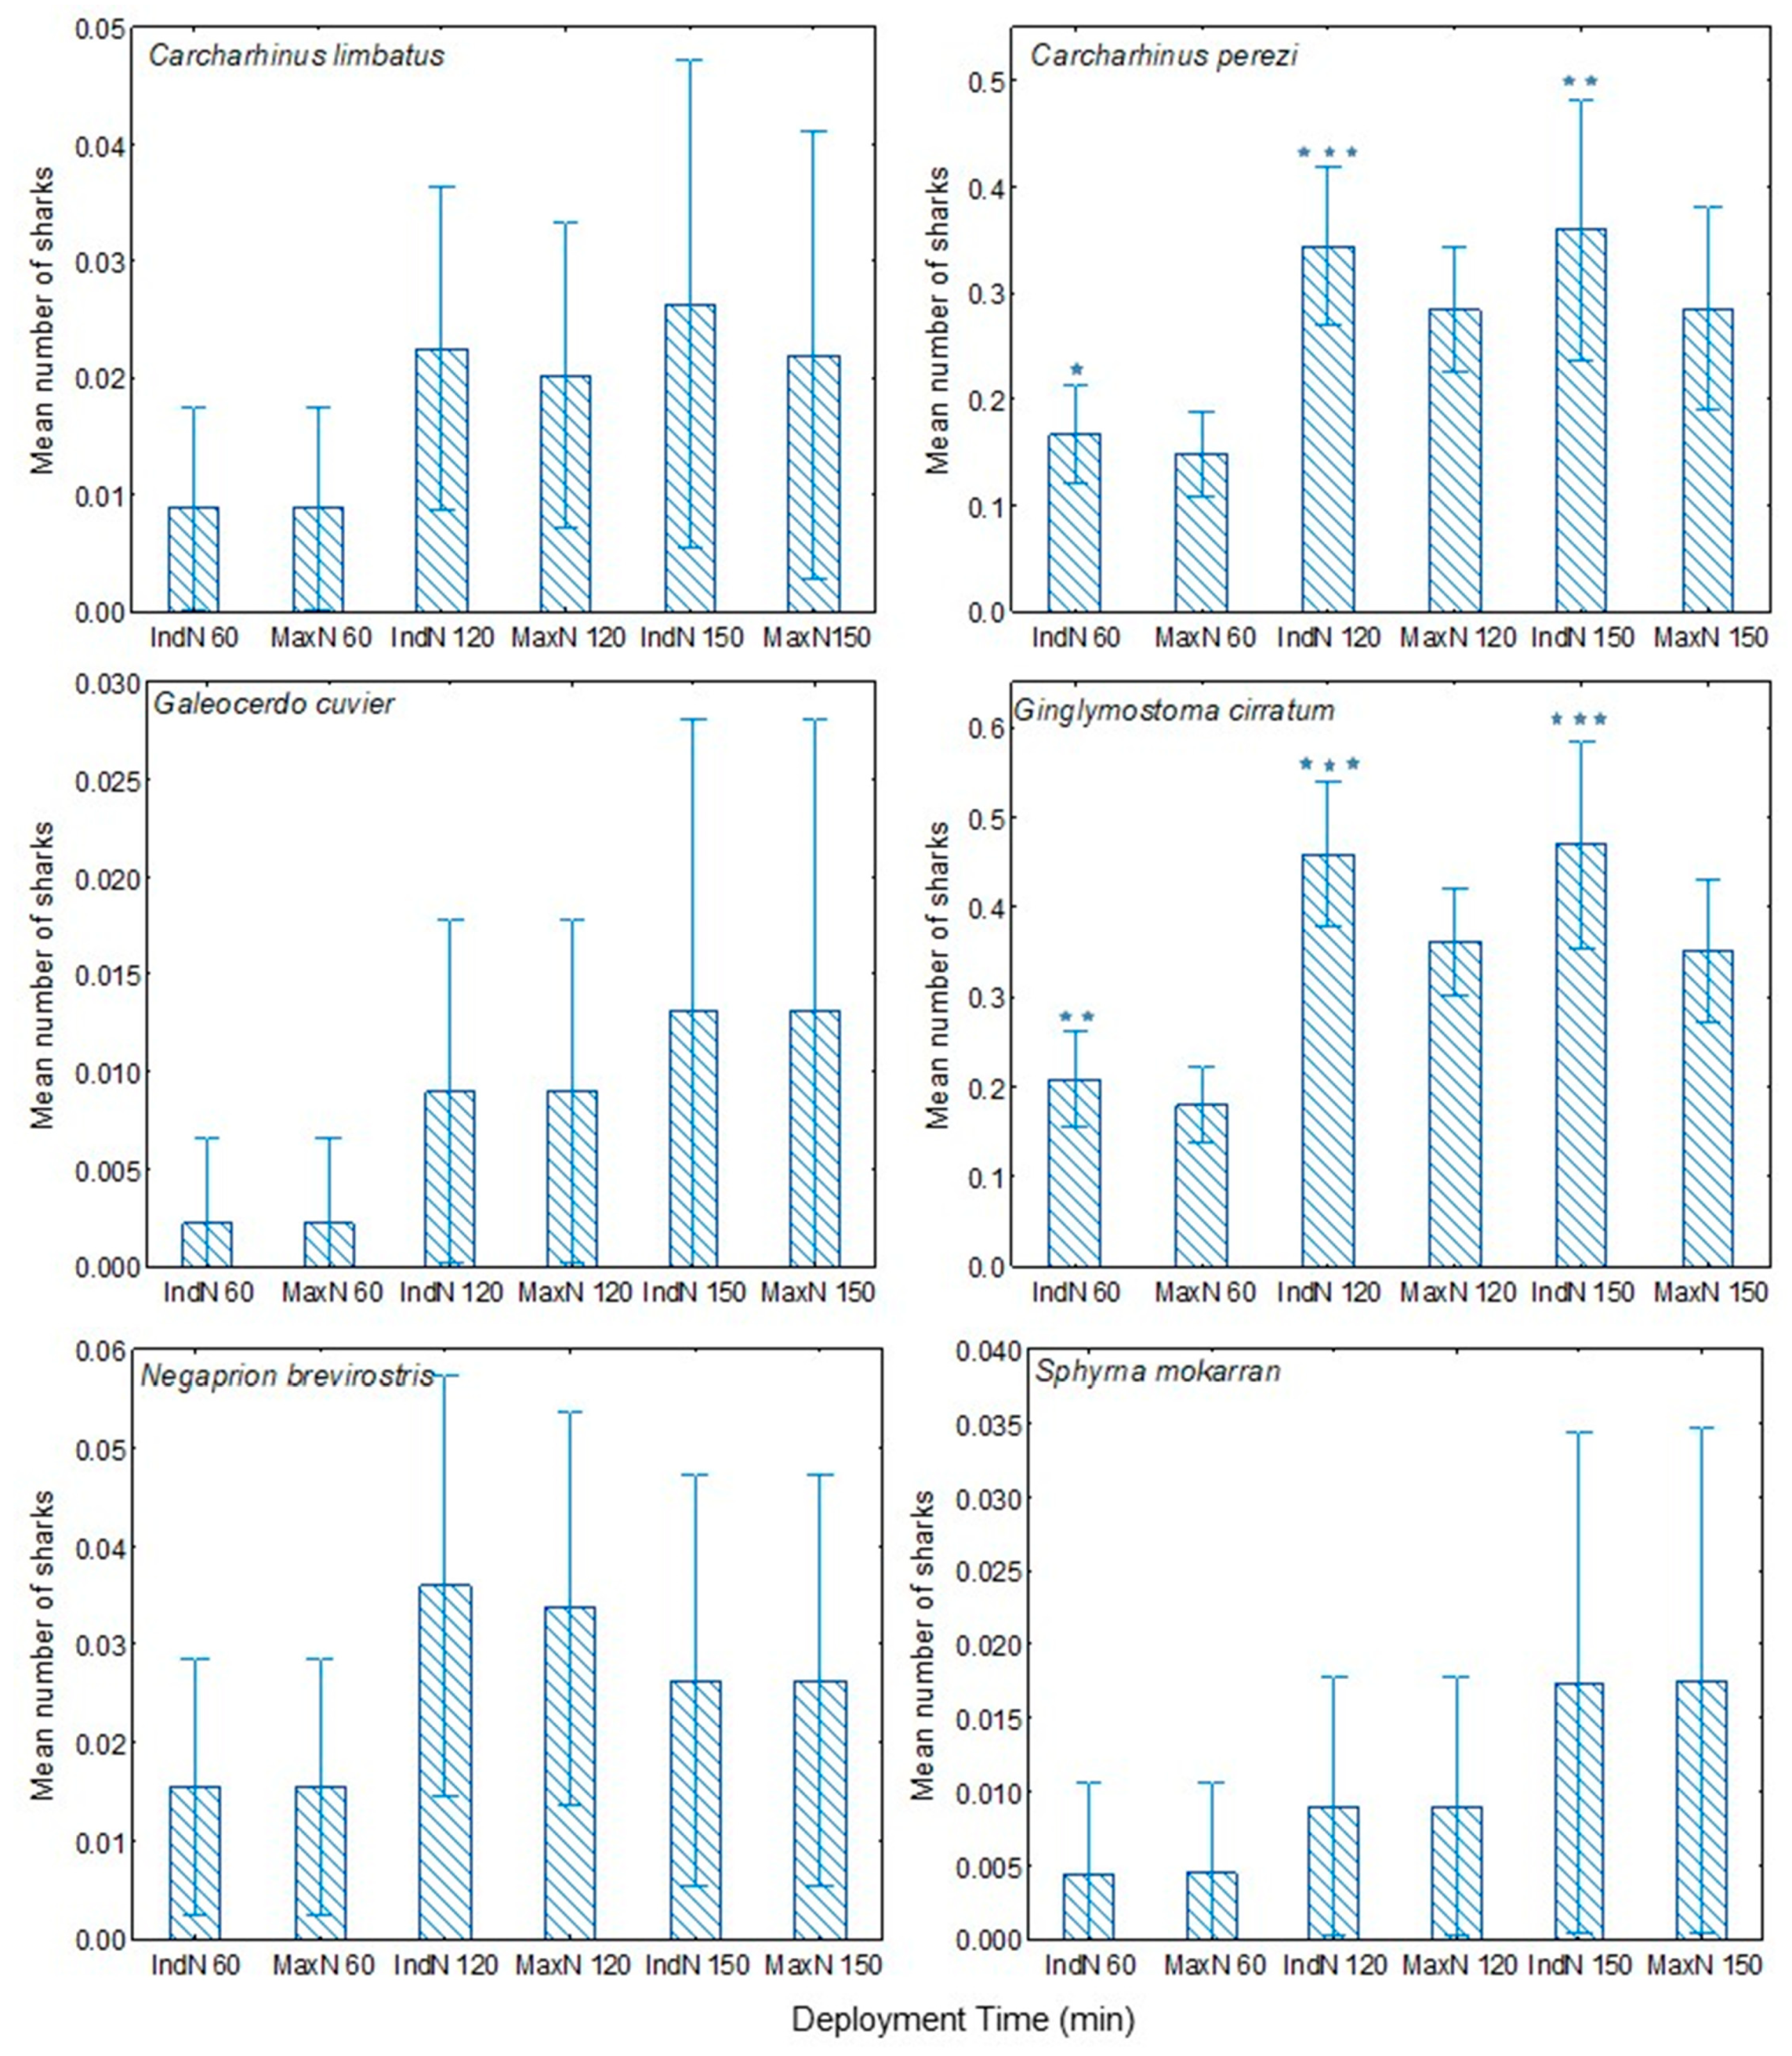
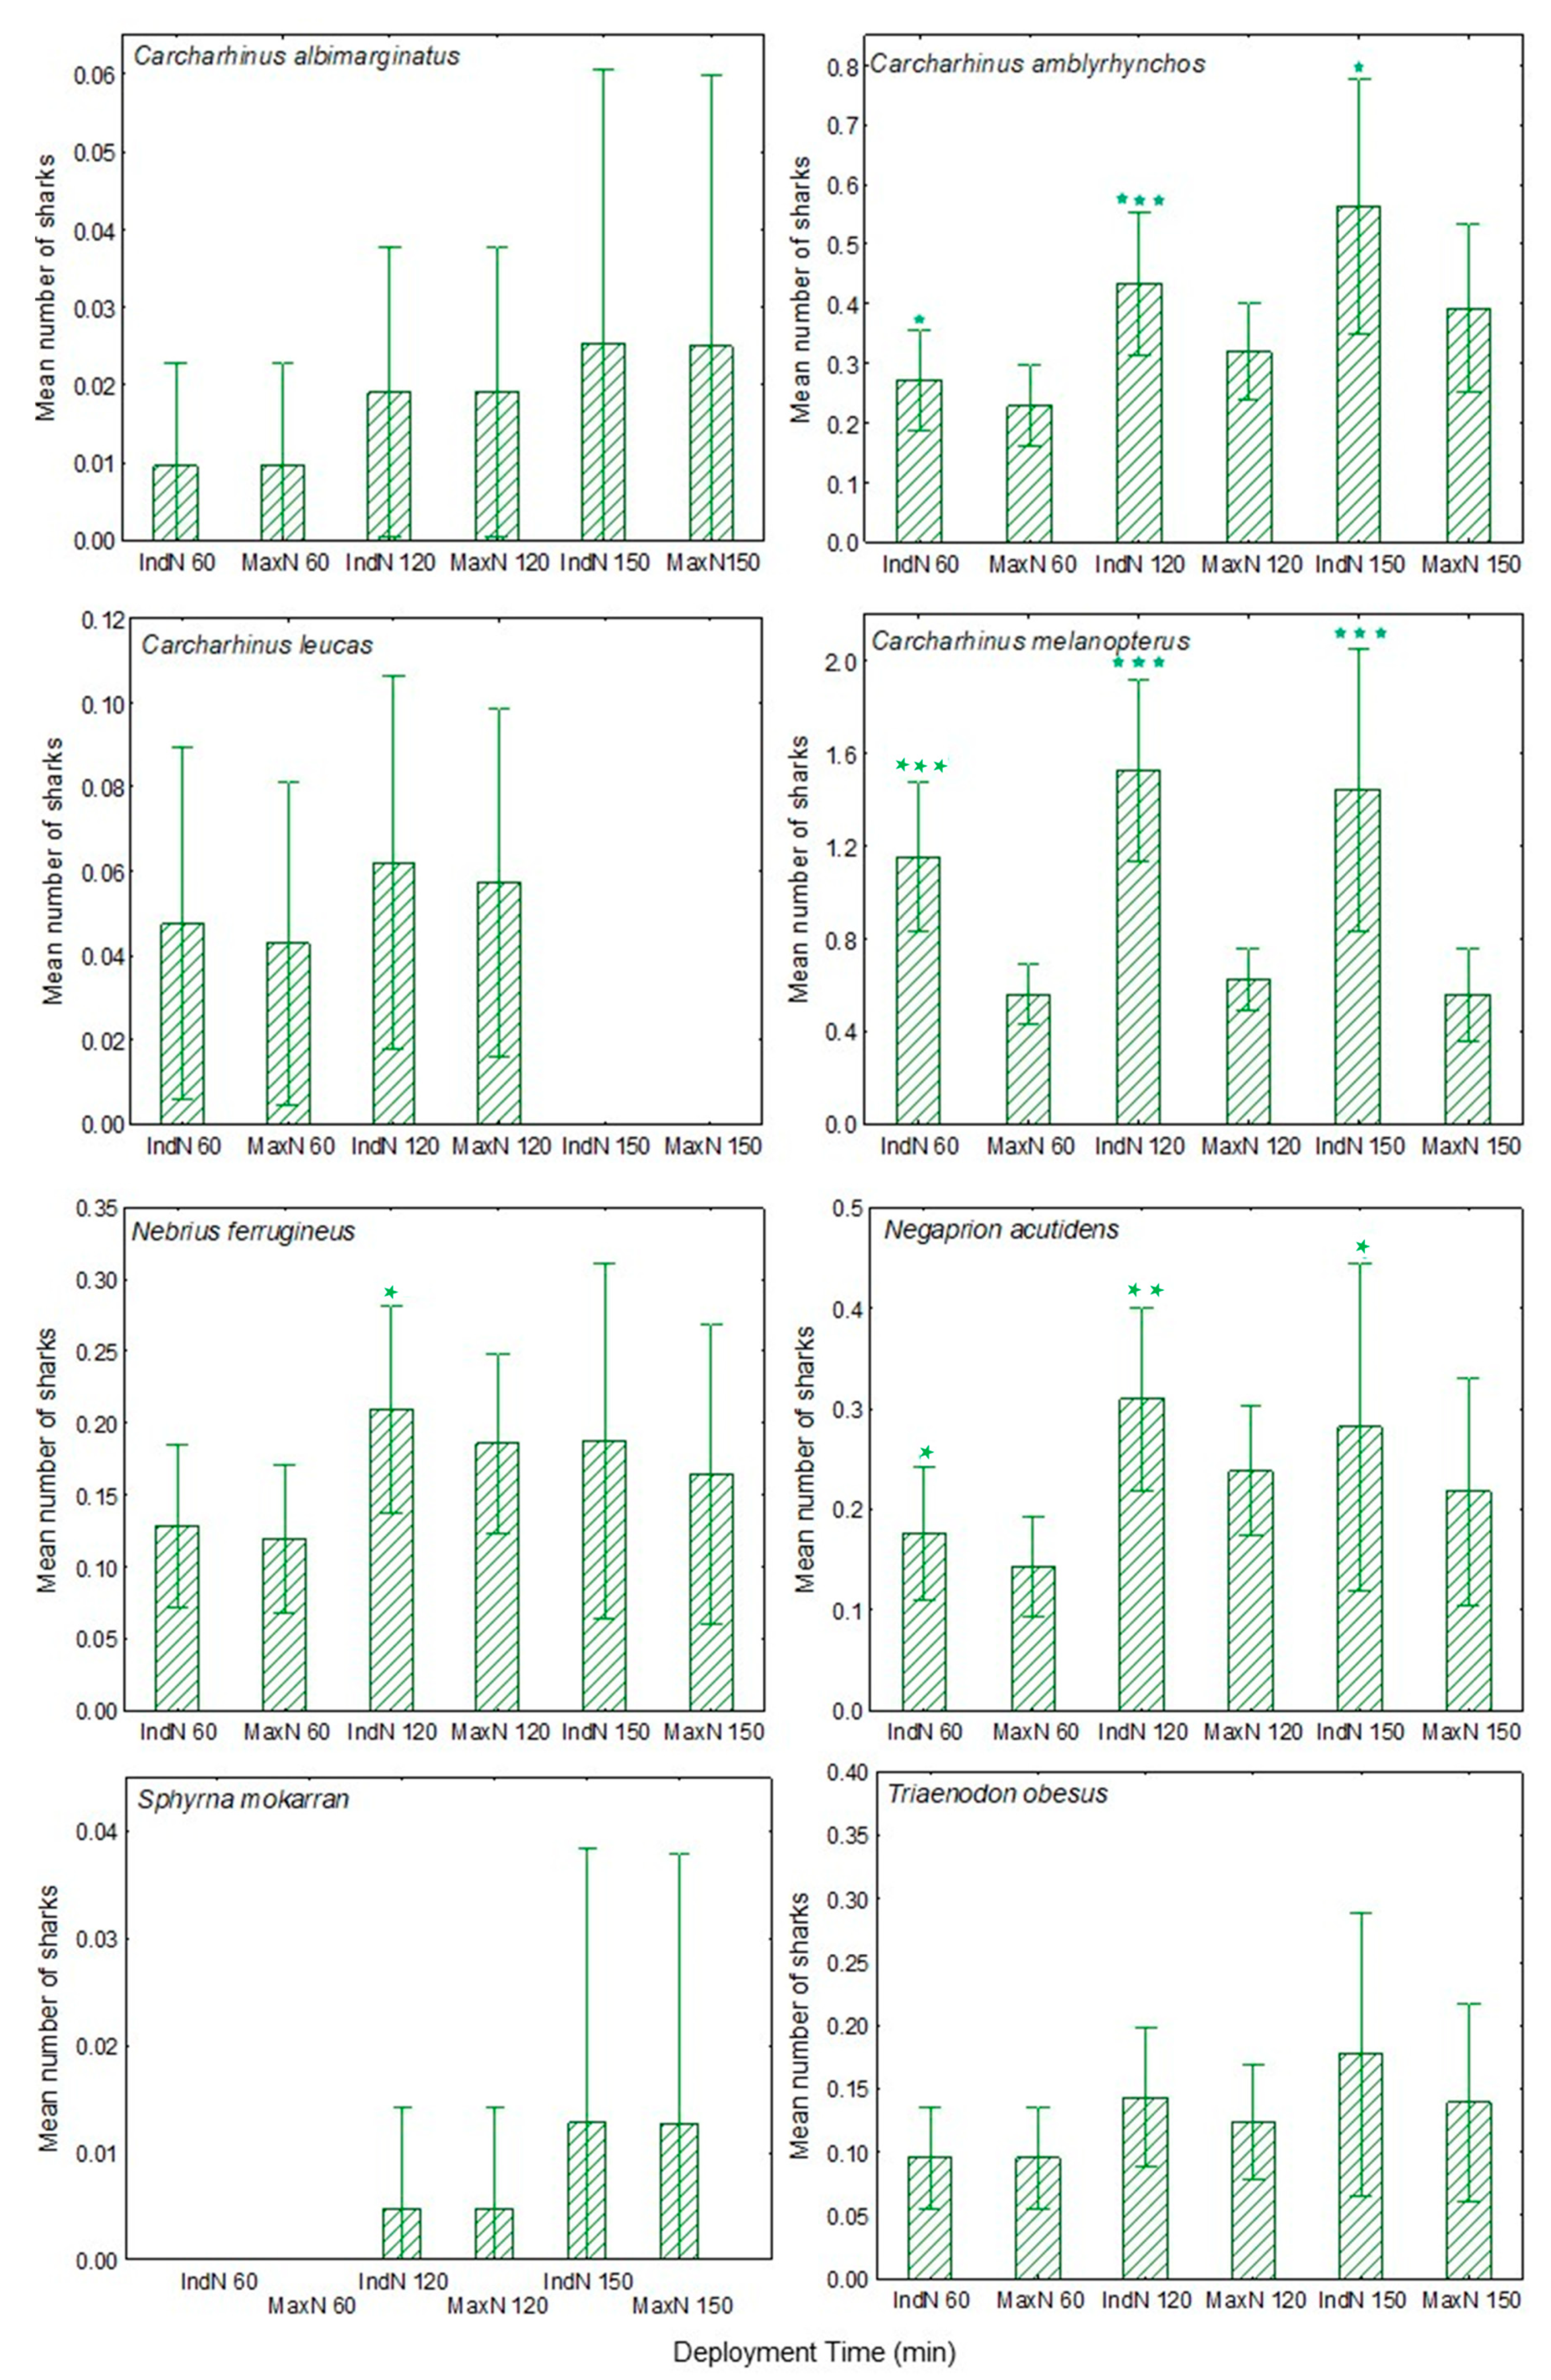
For all shark species combined in both the Cayman Islands and the Amirante Islands, the mean IndN (1.88, 2.71, 2.67) was significantly greater than mean MaxN (1.20, 1.57, 1.51) for each of the three deployment periods (60, 120 and 150 min, respectively) (Table A1). Considering the species separately, in the Cayman Islands for both C. perezi and G. cirratum, mean IndN was significantly greater than mean MaxN for each deployment period (60, 120 and 150 min) (Figure 5, Table A1), the overall ratio of IndN to MaxN being 1.17 for C. perezi, and 1.24 for G. cirratum. Similarly, in the Amirante Islands, mean IndN was significantly greater than mean MaxN for all three deployment periods for C. amblyrhynchos, C. melanopterus and N. acutidens, but only for 120 min for tawny nurse shark, Nebrius ferrugineus, (Figure 6, Table A1). The overall ratios of IndN to MaxN were 2.46 for C. melanopterus, and 1.37 for C. amblyrhynchos. For other species, the sample sizes were too low for significant differences to be detected (Figure 5 and Figure 6). For all species in which there were significant differences between IndN and MaxN, the ratio of IndN to MaxN increased with time, as it did also for C. limbatus and T. obesus, in which differences were not significant (Table A2).
The number of BRUVS deployments in which the application of individual identification revealed the presence of more sharks than would otherwise have been evident (i.e., where IndN > MaxN) is shown in Table 2. While the use of photo-identification revealed the presence of additional sharks in the more abundant species (three in the Cayman Island and six in the Amirante Islands), this was not the case for the less common species.

3.3. Effect of Deployment Period for All Species Combined

The mean IndN and MaxN of all species combined after different recording times in each of the two study areas are significantly different in each case (Table 3). In both the Cayman Islands and the Amirante Islands there was a significant increase in IndN and in MaxN both from 60 to 120 min, and from 120 to 150 min in the Amirante Islands (Table A3).
Overall, using IndN there were 2.1 times as many sharks recorded after 120 min as after 60 min in the Cayman Islands, and 1.4 times as many recorded in the Amirante Islands after 120 min than after 60 min. Similarly, there were 1.6 and 1.4 as many individual sharks recorded after 150 min as after 120 min in the two areas, respectively.

3.4. Effect of Deployment Period for Separate Shark Species

The mean IndN (i.e., the mean number of separate individuals visiting a BRUVS) was significantly different over the periods 60, 120 and 150 min for C. limbatus, C. perezi, G. cirratum and lemon shark, Negaprion brevirostris, in the Cayman Islands, and for C. amblyrhynchos, C. melanopterus, N. ferrugineus, N. acutidens and T. obesus in the Amirante Islands (Table 4). Among these species, C. perezi, G. cirratum, C. amblyrhynchos, C. melanopterus and N. acutidens showed a significant increase in mean number from 60 to 120 min, while C. perezi and G. cirratum also showed an increase from 120 to 150 min (Table A4).
The mean MaxN was significantly different across different deployment periods for C. perezi, G. cirratum and N. brevirostris in the Cayman Islands and for C. amblyrhynchos, C. melanopterus, N. ferrugineus, N. acutidens and T. obesus in the Amirante Islands (Table 4). Post-hoc tests indicated that in the Amirante Islands, C. amblyrhynchos, C. melanopterus and N. acutidens all showed a significant increase in mean MaxN from 60 to 120 min, as well as G. cirratum in the Cayman Islands, while C. perezi showed significant increases in mean MaxN both from 60 to 120 and from 120 to 150 min (Table A4).

3.5. Arrival Times at BRUVS

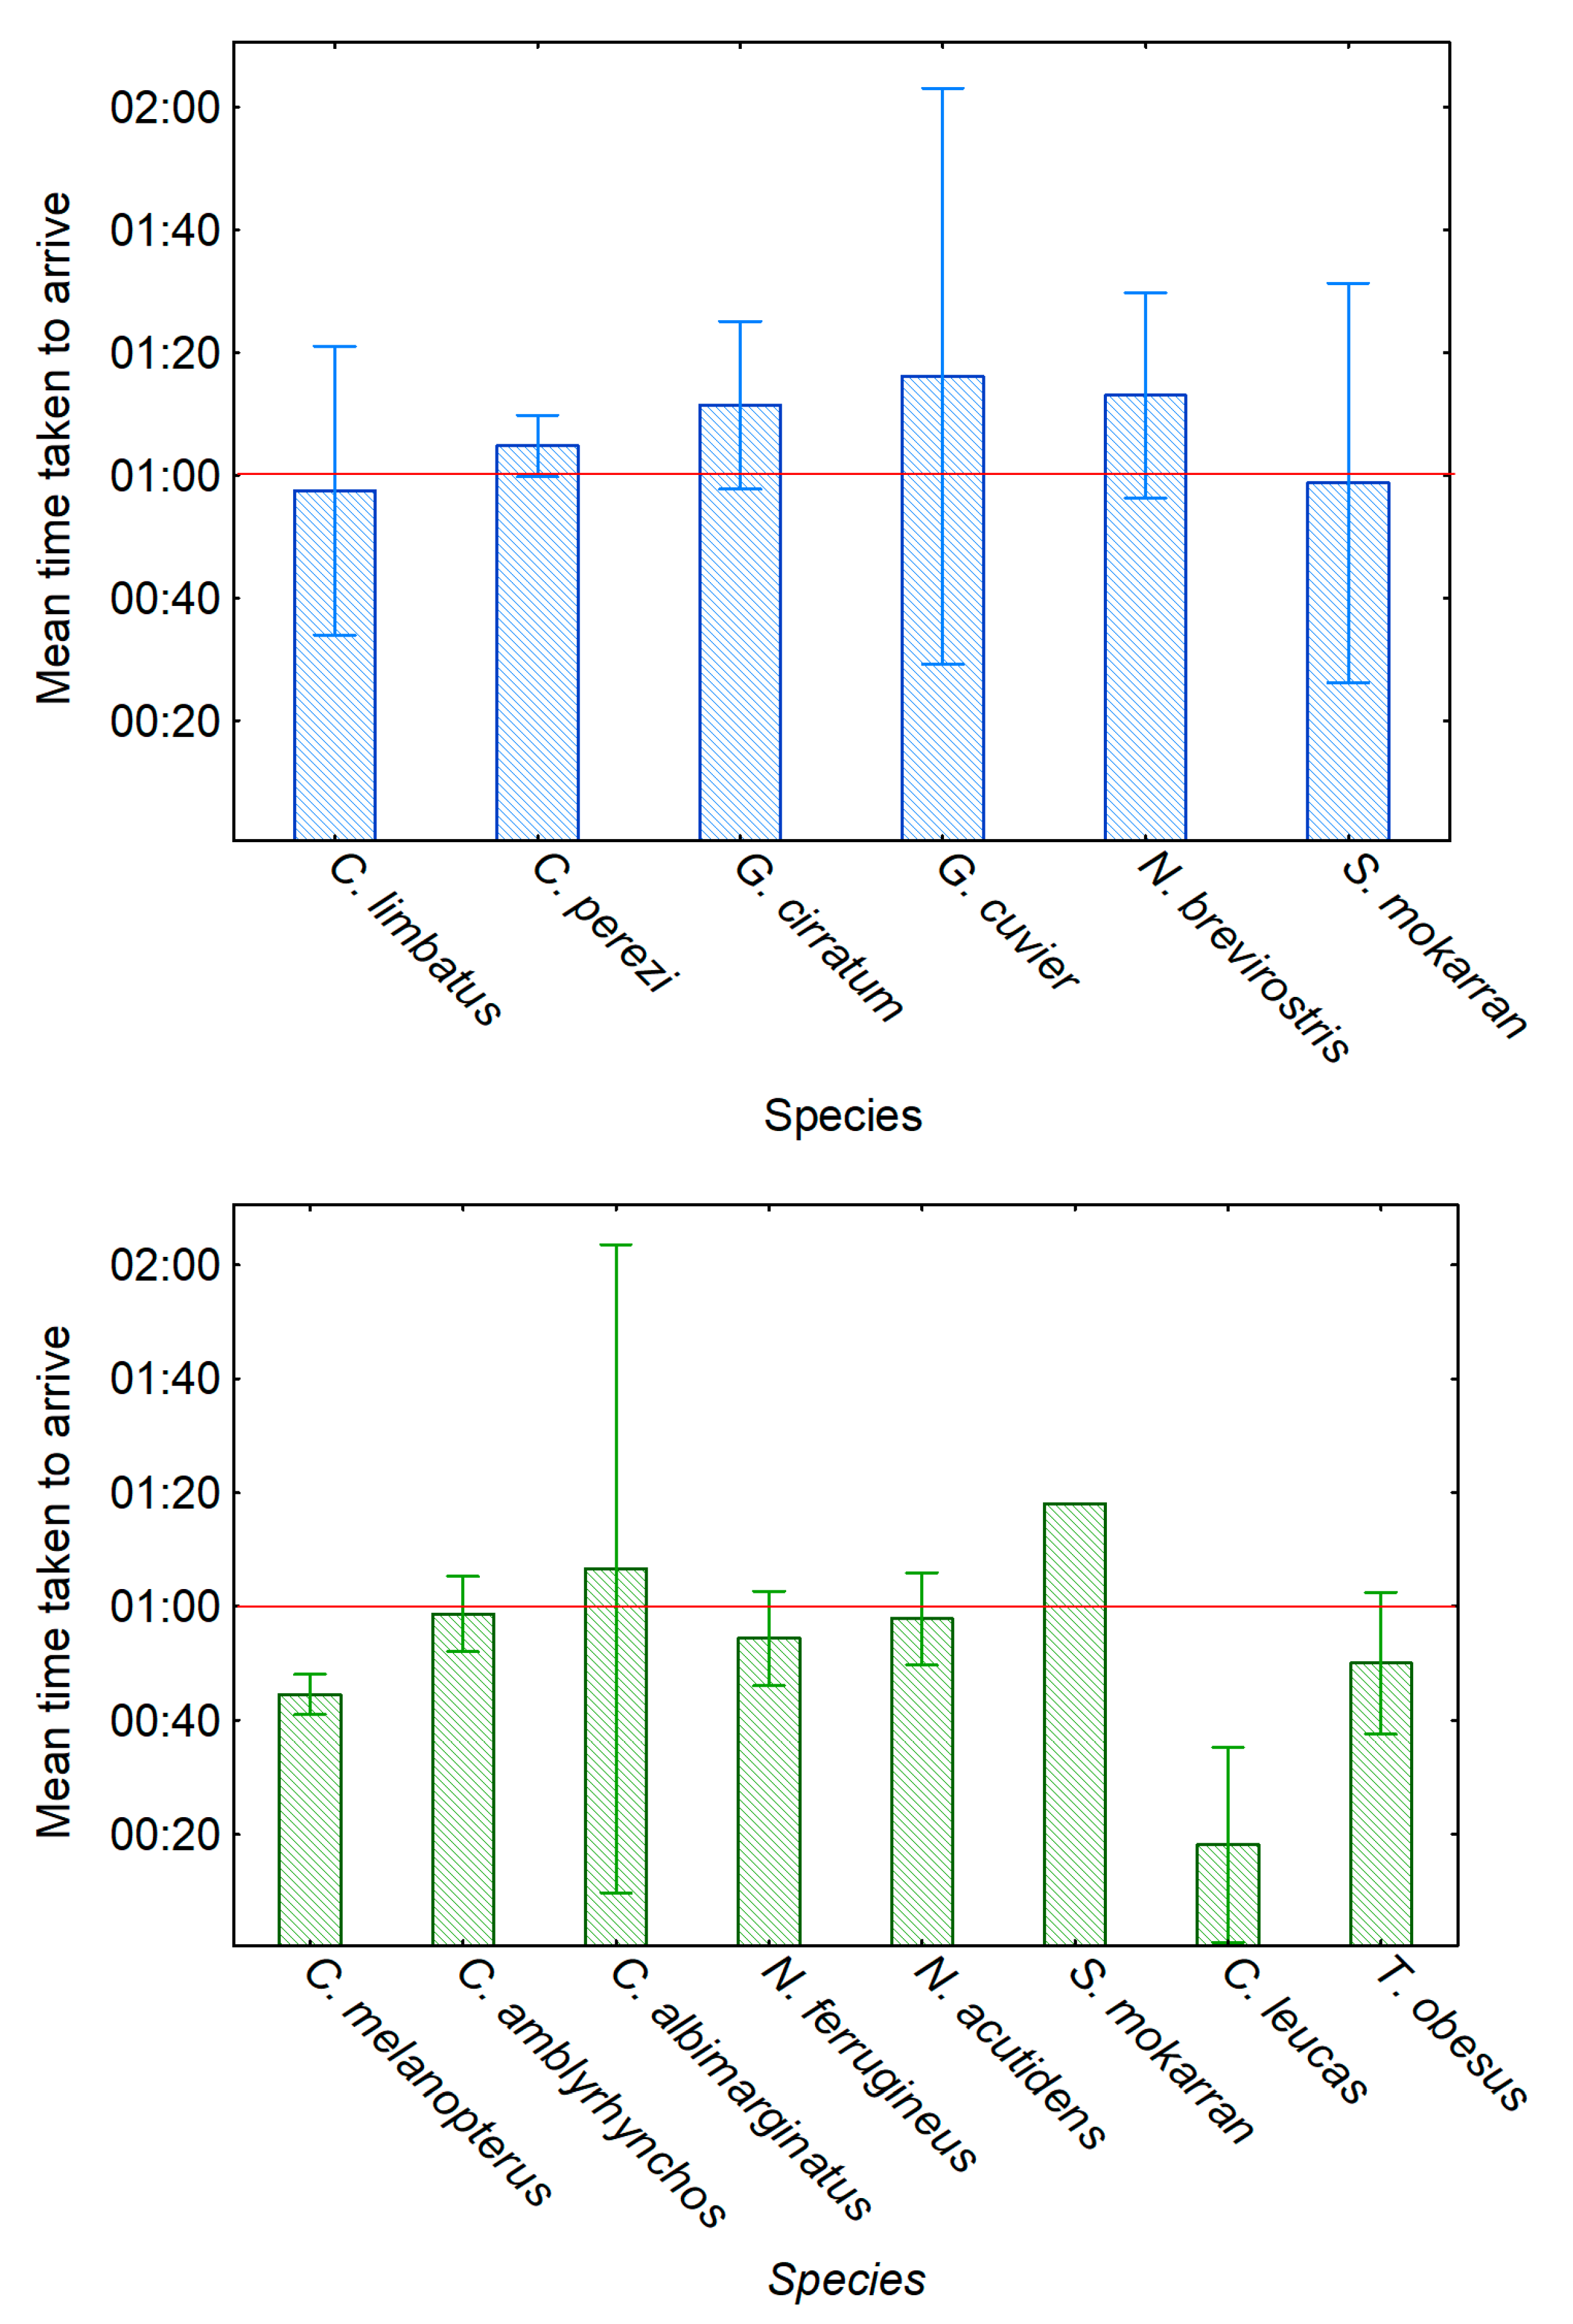
As a further means of assessing effective BRUVS deployment periods, the mean times of first arrival (at those BRUVS on which the species were recorded) were determined for each species in the Cayman Islands and the Amirante Islands (Figure 7). For two species in the Cayman Islands, the mean first arrival time was close to 60 min, while the remaining four species took longer (mean of 71–76 min). In the Amirante Islands, the mean first arrival time was less than 60 min for four species and was about an hour for two other species, but in two species, C. albimarginatus and great hammerhead (Sphyrna mokarran) shark, the mean arrival time was greater than an hour. It was notable that some individual C. amblyrhynchos and C. melanopterus (in the Amirante Islands), and G. cirratum and C. perezi (in the Cayman Islands), took more than 2 h to arrive.
In the Amirante Islands, the variation in first arrival time across species was statistically significant (ANOVA: F(7,533) = 5.05, p = 0.00001), with C. leucas when present arriving significantly earlier than C. albimarginatus, C. amblyrhynchos, C. melanopterus, N. ferrugineus, N. acutidens and T. obesus (Post hoc LSD tests: p < 0.006, respectively). C. melanopterus’s first arrival time was significantly shorter than those for C. amblyrhynchos, N. ferrugineus and N. acutidens (Post hoc LSD tests: p <0.04, respectively). There was no significant variation in first arrival time across species in the Cayman Islands (ANOVA: F(5,411) = 0.19, p = 0.9).

3.6. Re-Sighting Rates

The application of photo-identification methodology allowed many individuals to be recognised again if they were re-sighted. The proportions of the more commonly recorded species that were re-sighted during the study periods on a different BRUVS deployment ranged from 0% for C. limbatus to 10.1% for G. cirratum in the Cayman Islands, and from 4.5% for N. ferrugineus to 9.8% for C. melanopterus in the Amirante Islands (Table 5). In the Cayman Islands, a third of individual G. cuvier and S. mokarran were re-sighted, but only three individuals of either species were recorded in total. The mean of the re-sighting rates for each species across both locations was 12%; the combined re-sighting rate (from pooling all individuals irrespective of species) was 10.9%.

3.7. Movements of Individual Sharks

Re-sightings of individuals on a BRUVS different from those on which they were originally recorded provided information about shark movement patterns. In the Cayman Islands, individuals were re-sighted at distances of up to 10 km for C. perezi and 15 km for G. cirratum from the location of the original sighting (Table A5). In the Amirante Islands, individuals were re-sighted at distances of up to about 25 km for C. melanopterus shark, 33 km for C. amblyrhynchos shark, and about 27 km for N. acutidens, N. ferrugineus and T. obesus (Table A5), although both these last two species were also often re-sighted on BRUVS close to the stations at which they were originally recorded. While a majority of re-sights occurred within the same season, in the Amirante Islands some re-sights of C. amblyrhynchos, C. melanopterus and N. acutidens occurred after longer periods of time, the longest being of an individual C. melanopterus re-sighted after 814 days. In the Cayman Islands, some individuals were also detected after long periods of time, the longest being 429 days for C. perezi and 184 days for G. cirratum.

3.8. Population Estimates

For most species, the numbers of re-sightings were too low to permit the reliable estimation of population size, but using the Chapman derivative of the basic Lincoln–Peterson estimator successive estimates were possible for the numbers of C. perezi and G. cirratum present in the Cayman Islands study area. The mean estimated number of individually recognisable C. perezi over 2015–2017 was 76 ± 23 (S.E.), and of individually recognisable G. cirratum over the same period was 199 ± 42 (S.E.). Comparable estimates for C. melanopterus and C. amblyrhynchos in the Amirante Islands study area are in hand.

4. Discussion

Comparison of the present data with those obtained by other researchers in the same ocean regions is possible (Table 6 [10,11,12,42,46,47,48]), but confounded by differences in method, such as the time and depth ranges at which the BRUVS were deployed. In particular, while most researchers report MaxN for a deployment period of 60 min, relevant studies have used deployment periods ranging from 54 to 90 min, with one using 6 h [48]. Some authors (Brooks et al. [10]) have corrected for differences in deployment period by reporting numbers as catch per unit effort (CPUE) of one hour, on the assumption that MaxN increases linearly with time. However, in the present study, the values of both MaxN and IndN rise exponentially with time, hence longer deployment periods will appear to yield lower values of CPUE if presented this way. Nevertheless, some comment is possible. In the Cayman Islands, the abundance of two species of sharks was greater and of four species less than that reported in Eleuthera, the Bahamas. The abundances of N. acutidens appear markedly greater in the Amirante Islands than in the eastern Indian Ocean. Abundances of C. melanopterus and N. ferrugineus appear broadly comparable. More detailed analysis of the spatial and temporal patterns of abundance for the different species recorded in our study areas will be reported separately.
It is also important to note that when fish visible on BRUVS videos are counted (e.g., to determine MaxN), normally the results provide information only on relative abundance (that is, differences in abundance between locations or between occasions), but not on overall population size or density. Even though such population indices are widely used for wildlife monitoring and are generally assumed to be directly proportional to population density, in many field studies this assumption has been found to be invalid [49]. It is a weakness of BRUVS methodology as generally employed that the most commonly used measure, MaxN, does not increase linearly with actual abundance, but tends to saturate [22]. While this would be less of an issue for schooling or non-territorial species, it becomes more of a concern in species which are territorial or keep their distance from each other.
In the present study, we sought to address this issue by identifying sharks as individuals and determining the actual number of sharks visiting each BRUVS. As this study confirmed, most individual sharks carry distinctive marks or features allowing them to be identified as individuals. Some marks are natural while others are acquired, with older individuals tending to have more characteristics through injuries and scars than neonates and juveniles. In 12 of the 14 species recorded, at least two-thirds of the observed sharks could be recognised as individuals through such features. In most cases where it was not possible to discern any distinguishing features, this was because the shark’s appearance on camera was too brief or too distant. Some species, notably C. albimarginatus and C. leucas, in which the percentages of distinguishable individuals were the lowest (9.1% and 16.7%, respectively), never closely approached the bait even though they may have been attracted to the vicinity of the BRUVS by olfactory cues. With other species the proportion of individually identified sharks was lower than it might otherwise have been because of high turbidity and poor visibility at some stations. This was especially the case in the sandy lagoon in St. Joseph Atoll, where only a minority of individuals could be identified. In particular, this affected the percentage of individually identifiable C. melanopterus (85.3%), which otherwise are readily identified as individuals because of the very variable shape of the black patches on their dorsal fins (see also [50]). In summary, while many sharks can be recognised as individuals with certainty, a proportion of them viewed on BRUVS cannot be distinguished. Thus, in many cases the difference between the true number of visiting sharks and MaxN will be even greater than between MaxN and IndN.
The species for which for most BRUVS IndN was greater than MaxN are those that are largely coastal by habitat. In contrast, more open-water species C. albimarginatus, C. limbatus, G. cuvier and S. mokarran, appeared rarely and only as single individuals. Mean IndN was significantly greater than MaxN for each deployment period overall (60, 120, 150 min). Further, in most species, including C. limbatus, C. perezi and G. cirratum in the Cayman Islands and C. amblyrhynchos, C. melanopterus, N. ferrugineus and T. obesus in the Amirante Islands, the mean ratio of IndN/MaxN increased with recording period. These findings indicate that in at least these two study areas, for most species an increased deployment period resulted in visits by significantly more individuals, not simply in return visits by the same individuals. Thus, IndN may at times be a more useful index than MaxN, especially for assessing ongoing population trends in the least abundant species, such as S. mokarran.
A comparison of the data obtained after different BRUVS deployment periods also showed that while most shark species present might be recorded during the course of survey work using 60 min deployments, nevertheless both the number of species recorded and the numbers of individuals of most species increased with longer BRUVS deployment periods. Interestingly, in a very recent study by Torres et al. [38], a deployment time of 24 h showed that while no additional species were observed after 60 min deployment, additional individuals continued to arrive for a long time. In the present study, the 120 and 150 min deployment periods showed a greater number of both individuals and species, with some individuals of four species taking over 2 h to arrive. An example of a non-shark elasmobranch arriving late during a recording session was a bowmouth guitarfish, Rhina ancylostoma, which arrived at a BRUVS only 2 h 17 min 7 s after deployment. Thus we concluded that extended recording periods may be advantageous, provided the fieldwork schedule permits this.
Besides deployment period, the number of sharks attracted to a BRUVS, and hence the precision of monitoring, is also influenced by other factors. Our experience over 10 years suggests that the quality, as well as the quantity, of bait can be important. The oil in bait appears to be a component particularly attractive to sharks, but the oil content can vary greatly not only between bait species, but with the season in which it is caught (relative to fish maturity and reproductive state) for fat content, where they are fished, and with catch storage conditions. For example, the fat content of fished tuna has been reported to vary from 0.4 to 13.5%, and of sardine from 1.2 to 18% [51,52,53,54]. The quantity of bait may in our experience be less critical. We used less bait than many researchers, but in a pilot study we found that using over five times the amount of bait used here (1550 g as opposed to 300 g) resulted in only a small, non-significant increase in the numbers of sharks arriving at the BRUVS.
The method of containment of bait on the BRUVS is also important. When, during earlier work, bait was enclosed only in a large mesh-size bag, most or all of it could be quickly removed by sharks, but also by scavenging fishes such as species of snapper (Lutjanus), emperor (Lethrinus), durgon (Melichthys) and octopus. In such circumstances, all of the bait could be consumed in well under an hour, in which case extended deployment would not result in further sharks being recorded. In both studies described here, double bags of fine mesh inside larger mesh were employed, so that the scent of the bait could still disperse readily, while the bait itself was difficult for fishes to extract. Other workers have used perforated cans as bait containers [23,32]. As in any monitoring program, the data obtained from BRUVS-based shark monitoring programs will be more reliable if such considerations are taken into account and all aspects of the method standardised as far as possible.
As well as providing more precise estimates of abundance, the application of photo-identification to BRUVS can provide information on the behaviour of individuals. Re-sightings showed that some individuals of most species moved distances of up to 33 km across the study area. C. melanopterus, G. cirratum and N. ferrugineus, however, were also often re-sighted close to the stations where they were originally recorded. Data from acoustic tagging work undertaken in both study areas and elsewhere have provided evidence that some of the species studied can move over even greater distances than evident from the BRUVS data. For example, one C. perezi was recorded moving 125 km from Grand Cayman to Little Cayman and the same distance back again to Grand Cayman [39]. Similarly, in the present study individual C. amblyrhynchos in the Amirante Islands were observed on different BRUVS up to 20 km apart. Both long- and short-range movements of this species have also been documented in New Caledonian waters by Bonnin et al. [55], who suggested that the long-range movement of adults was motivated by mating opportunity. In contrast, only a few of the >50 tagged C. melanopterus in the Amirante Islands have been recorded crossing the <1 km wide channel between D’Arros and St. Joseph Atoll [56], even though in Polynesia this species has been recorded crossing open water between islands up to 50 km apart [57].
If the low rates of re-sighting that were observed in the present study are typical of such photo-identification work, then the movement data generated will be more limited than can be obtained using acoustic tagging, which frequently records the locations of individuals if they are present within a study area, provided that a dense network of receivers is installed over the area of interest. Information derived from photo-identification work may nevertheless be of value where the considerable funding required to mount an effective acoustic tagging study is unavailable. Furthermore, where BRUVS are deployed on a regular basis within a specific area, photo-identification data can reveal whether individual sharks make frequent use of an area or are resident within it.
It was also anticipated that re-sightings data might allow the application of mark–recapture modelling to estimate the population of different species within the study areas. In practice, the numbers of individuals of even the more frequently recorded species re-sighted on a different BRUVS during the same sampling campaign were low (ranging from 2 to 9%), and the numbers re-sighted in the following year even lower (0.4–2.7%). Encouragingly, however, low rates of re-sighting suggest that known individuals must be mixing with a larger population of other individuals. Thus the model used indicated for the Cayman Islands a mean effective population sizes of 76 ± 23 (S.E.) C. perezi and 199 ± 42 (S.E.) G. cirratum. These estimates are of interest in light of shark conservation efforts in Cayman, where all shark species have been protected since April 2015 [39,40]. It will be important to determine whether estimated population sizes of these species increase with time. Local opinion surveys indicated that the shark protection legislation had overwhelming public support [39], being opposed by only a small minority of boat-based fishers who may be tempted to ignore it.
There are also two factors which confound the interpretation of the population estimates. Firstly, the calculated population sizes are only of individually identifiable sharks. Following Gore et al. [25], these numbers need to be corrected upwards to allow for the proportions of sharks (of the species concerned) that lacked distinguishing marks. However, a simple proportional correction based on the proportions of individually identifiable sharks may result in an over-estimate, because some of the sightings of non-identifiable sharks will also have been re-sightings. Furthermore, while some sharks could not be identified as individuals because they lacked distinguishing features, others could not be identified as individuals since they did not approach the BRUVS closely enough or because the water was too turbid, and so could in fact have been known individuals.
A second uncertainty relates to the size of area to which these population estimates apply. The three Cayman Islands have a combined terrestrial area of only 264 km2 and an estimated length of coast of 160 km, most of which is fringed by coral reef. These reefs drop steeply into water >500 m deep within 2 km of the shore. However, C. perezi, for example, have been recorded at depths of 150 m or more [58,59,60], and in the Cayman Islands were recorded moving between Grand Cayman and Little Cayman, islands 125 km apart separated by water > 1000 m deep [39]. Further, it seems from the results of conventional and acoustic tagging studies of sharks on reefs that, while some individuals may be resident or semi-resident in an area, many are only occasionally present in the area or may never be recorded again [39,58,61,62]. Thus, some of the individuals observed in the present study may be foraging and mixing over a much larger region than the 160–320 km2 shelf area immediately surrounding the individual Cayman Islands. Comparable analysis is underway of the Amirante Islands data, but is confounded by the facts that the study area covers only a third of the archipelago and that the area did not achieve marine protected area status until 2019.
5. Conclusions

The results of the present study demonstrate that the photo-identification of individual sharks can be applied to BRUVS videos and that in most species this approach can result in a greater ability to distinguish between different abundances. This was most evident for species in which there were usually too few sharks for more than one individual to appear on screen at a time. Extended recording periods enhanced this benefit, increasing both the number of shark species and the numbers of individual sharks detected per BRUVS, at least up to 150 min. The application of photo-identification to BRUVS can also provide information about the movement ecology of a species; this is helpful since it indicates for management the appropriate size of the protected area or the foraging range of specific individuals of interest or concern. Importantly, the method clarifies whether within a study area the sharks recorded on BRUVS are frequently the same individuals or usually different ones. Additionally, the method can generate indicative estimates of population size, which can be of value in provoking either concern or reassurance (depending on the numbers) in relation to local shark conservation programs. However, the process of matching images is very time consuming (in the present study the videos from 661 BRUVS were analysed, an undertaking which required about 1500 h of desk time), and the reliable detection of distinguishing features on BRUVS videos requires patience and experience. Sherman et al. [24] similarly noted that identifying individuals does provide better accuracy and additional information, but the determination of actual numbers takes time. MaxN is a simpler and quicker method, and is particularly appropriate for large-scale surveys or routine monitoring. On the other hand, the more sensitive estimates attained by determining IndN are valuable if attempting to monitor population trends of a scarce species or in a smaller area, such as an island or an MPA. IndN is sensitive to differences in abundance that MaxN would not detect. The balance of costs and benefits in applying this approach will depend on the aims and circumstances of any particular project.

6. Research Ethics

The work on endangered shark species was carried out in the Cayman Islands with permission from and on behalf of the Cayman Islands Department of Environment, and, in the Amirantes, under a letter of approval from the Republic of Seychelles Ministry of Environment, Energy and Climate Change.

Author Contributions

Conceptualisation, M.G. and R.O.; Data curation, M.G., J.K. and C.M.; Formal analysis, M.G., R.O., J.K. and C.M.; Funding acquisition, M.G., R.O. and C.C.; Investigation, M.G., R.O., C.C., J.K., C.M. and E.B.; Methodology, M.G., R.O. and E.B.; Project administration, M.G.; Resources, C.C.; Supervision, M.G. and R.O.; Validation, R.O.; Writing—original draft, M.G., R.O. and J.K.; Writing—review and editing, M.G., R.O., C.C., J.K., C.M. and E.B. All authors have read and agreed to the published version of the manuscript.

Funding

The work in the Cayman Islands was supported by a Darwin Initiative grant (DPLUS036) from the UK Department of Environment, Food & Rural Affairs, by the Department of Environment, Cayman Islands, and by the CayBrew Whitetip Shark Fund. Work in the Seychelles was supported by the Marine Research Facility, North Obhur, Jeddah, Saudi Arabia. RO was part-supported through a research chair at King Abdulaziz University, Jeddah, funded by HRH Prince Khalid bin Sultan.

Acknowledgments

We thank the Cayman Islands Department of Environment and all the staff on D’Arros Island, Seychelles, for their support and assistance. We also thank Peter Davies, Martin Eaton, Frida Lara and Robert Nestler for assistance with fieldwork and Tim Austin and James Lea for advice.

Conflicts of Interest

The authors declare no conflict of interest.

Appendix A

Table A1. Comparison between mean IndN and mean MaxN for shark species in (a) the Cayman Islands and (b) the Amirante Islands for 60, 120 and 150 min deployment periods, with differences tested using post hoc Wilcoxon matched pairs test (statistic Z), n = number of cases and p = probability values for Figure 5 and Figure 6.
AreaSpeciesDeployment Periodntp
(a) Cayman IslandsAll species604513.96<0.0001
1204476.78<0.0001
1502284.89<0.0001
Carcharhinus limbatus60368
120364
150168
Carcharhinus perezi603682.010.05
1203643.910.0001
1501682.900.004
Galeocerdo cuvier60368
1203631.000.32
150168
Ginglymostoma cirratum603682.860.005
1203644.86<0.00001
1501683.750.0002
Negaprion brevirostris60368
1203641.000.32
150168
Sphyrna mokarran60368
120364
1501681.000.32
(b) Amirante IslandsAll species602105.95<0.0001
1202107.48<0.0001
150794.99<0.0001
Carcharhinus albimarginatus60210
120210
15094
Carcharhinus amblyrhynchos602102.350.02
1202103.730.0002
150943.320.001
Carcharhinus leucas602101.000.32
1202101.000.32
15094
Carcharhinus melanopterus602105.31<0.00001
1202106.20<0.00001
150944.94<0.00001
Nebrius ferrugineus602101.420.16
1202102.260.02
150941.420.16
Negaprion acutidens602102.680.01
1202103.530.001
150942.160.03
Sphyrna mokarran60210
120210
15094
Triaeonodon obesus60210
1202101.640.10
150941.650.10
Table A2. The ratio of IndN to MaxN for shark species for deployment periods of increasing length (60, 120 and 150 min) in the Cayman Islands and Amirante Islands. n = number of BRUVS included in analyses. IndN = number of individuals identified. MaxN = maximum number of individuals observed on screen at any one time. n decreases with increasing time periods, because not all recordings ran for 120 min, and a minority for 150 min.
Cayman IslandsAmirante Islands
SpeciesPeriodnRatio IndN/MaxNSpeciesPeriodnRatio IndN/MaxN
Carcharhinus limbatus604511Carcharhinus albimarginatus602101
1204451.111202101
1502281.2150781
Carcharhinus perezi604511.12Carcharhinus amblyrhynchos602101.19
1204451.211202101.36
1502281.26150781.45
Galeocerdo cuvier604511Carcharhinus leucas602101.11
12044511202101.08
150228115078-
Ginglymostoma cirratum604511.16Carcharhinus melanopterus602102.07
1204451.271202102.45
1502281.34150782.59
Negaprion brevirostris604511Nebrius ferrugineus602101.08
1204451.071202101.13
1502281150781.15
Sphyrna mokarran604511Negaprion acutidens602101.23
12044511202101.3
1502281150781.29
Sphyrna mokarran60210-
1202101
150781
Triaenodon obesus602101
1202101.15
150781.27
Table A3. Statistical comparison of pairs of deployment periods of IndN and MaxN for all shark species combined in (a) Cayman Islands and (b) Amirante Islands, using post hoc Wilcoxon matched pairs tests (statistic Z), n = number of cases and p = probability values for Table 3.
IndNMaxN
AreaPeriodnZpnZp
(a) Cayman Islands60 vs. 120 min707.30.00001646.6<0.00001
120 vs. 150 min143.30.001142.90.004
(b) Amirante Islands60 vs. 120 min375.3<0.00001274.5<0.00001
120 vs. 150 min52.00.0421.30.2
Table A4. Statistical comparison for pairs of BRUVS deployment periods (60, 120, 150 min) of IndN and of MaxN for each shark species separately in (a) Cayman Islands and (b) Amirante Islands, using post hoc Wilcoxon matched pairs tests (statistic Z), n = number of cases and p = probability values for Table 4.
AreaShark SpeciesPeriodIndNMaxN
nZpnZp
(a) Cayman IslandsCarcharhinus limbatus60 vs. 12031.60.1
Carcharhinus perezi60 vs. 120274.5<0.0001254.40.00001
120 vs. 15062.20.02862.20.03
Ginglymostoma cirratum60 vs. 120395.4<0.00013350.00001
120 vs. 15082.50.01181.90.06
Negaprion brevirostris60 vs. 12041.830.0741.80.07
(b) Amirante IslandsCarcharhinus amblyrhynchos60 vs. 12092.70.00892.70.008
120 vs. 15021.30.221.30.2
Carcharhinus melanopterus60 vs. 12072.40.01872.40.018
Nebrius ferrugineus60 vs. 12041.80.0741.80.07
Negaprion acutidens60 vs. 12072.40.01872.40.018
Triaenodon obesus60 vs. 12041.80.0741.80.07
Table A5. The range of distances and the respective time periods taken for each shark species.
SpeciesDistance (km)Time (d)
C. amblyrhynchos2.9–33.0<1–405
C. melanopterus0.3–24.5<1–814
C. perezi1.2–9.7181–429
G. cirratum0.02–15.3<1–185
G. cuvier0.38<1
N. accutidens0.7–27.5<1–111
N. brevirostris1.03<1
N. ferrugineus0.5–27.0<1–2
S. mokarran2.23<1
T. obesus26.91374
Data availability: 10.6084/m9.figshare.13061546.

References

  1. Baum, J.K.; Myers, R.A.; Kehler, D.G.; Worm, B.; Harley, S.J.; Doherty, P.A. Collapse and conservation of shark populations in the Northwest Atlantic. Science 2003, 299, 389–392. [Google Scholar] [CrossRef] [PubMed]
  2. Robbins, W.D.; Hisano, M.; Connolly, S.R.; Choat, J.H. Ongoing collapse of coral-reef shark populations. Curr. Biol. 2006, 16, 2314–2319. [Google Scholar] [CrossRef] [PubMed] [Green Version]
  3. Ward-Paige, C.A.; Mora, C.; Lotze, H.K.; Pattengill-Semmens, C.; McClenachan, L.; Arias-Castro, E.; Myers, R.A. Large-scale absence of sharks on reefs in the greater-Caribbean: A footprint of human pressures. PLoS ONE 2010, 5, e11968. [Google Scholar] [CrossRef] [PubMed] [Green Version]
  4. Clarke, S.C.; McAllister, M.K.; Milner-Gulland, E.J.; Kirkwood, G.P.; Michielsens, C.G.J.; Agnew, D.J.; Pikitch, E.K.; Nakano, H.; Shivji, M.S. Global estimates of shark catches using trade records from commercial markets. Ecol. Lett. 2006, 9, 1115–1126. [Google Scholar] [CrossRef] [PubMed]
  5. Clarke, S.; Milner-Gulland, E.J.; Bjørndal, T. Social, economic and regulatory drivers of the shark fin trade. Mar. Resour. Econ. 2007, 22, 305–327. [Google Scholar] [CrossRef]
  6. Dulvy, N.K.; Fowler, S.L.; Musick, J.A.; Cavanagh, R.D.; Kyne, P.M.; Harrison, L.R.; Carlson, J.K.; Davidson, L.N.K.; Fordham, S.V.; Francis, M.P.; et al. Extinction risk and conservation of the world’s sharks and rays. elife 2014, 3, e00590. [Google Scholar] [CrossRef] [Green Version]
  7. Dulvy, N.K.; Baum, J.K.; Clarke, S.; Compagno, L.J.V.; Cortés, E.; Domingo, A.; Fordham, S.; Fowler, S.; Francis, M.P.; Gibson, C.; et al. You can swim but you can’t hide: The global status and conservation of oceanic pelagic sharks and rays. Aquat. Cons. 2008, 18, 459–482. [Google Scholar] [CrossRef]
  8. Robinson, J.P.W.; Robinson, J.; Gerry, C.; Govinden, R.; Freshwater, C.; Graham, N.A.J. Diversification insulates fisher catch and revenue in heavily exploited tropical fisheries. Sci. Adv. 2020, 6, eaaz0587. [Google Scholar] [CrossRef] [Green Version]
  9. Heupel, M.R.; Papastamatiou, Y.P.; Espinoza, M.; Green, M.E.; Simpfendorfer, C.A. Reef Shark Science—Key Questions and Future Directions. Front. Mar. Sci. 2019, 6, 12. [Google Scholar] [CrossRef]
  10. Brooks, E.J.; Sloman, K.A.; Sims, D.W.; Danylchuk, A.J. Validating the use of baited remote underwater video surveys for assessing the diversity, distribution and abundance of sharks in the Bahamas. End. Species Res. 2011, 13, 231–243. [Google Scholar] [CrossRef]
  11. Bond, M.E.; Babcock, E.A.; Pikitch, E.K.; Abercrombie, D.L.; Lamb, N.F.; Chapman, D.D. Abundance in Marine Reserves on the Mesoamerican Barrier Reef. PLoS ONE 2012, 7, e32983. [Google Scholar] [CrossRef] [Green Version]
  12. Tickler, D.M.; Letessier, T.B.; Koldewey, H.J.; Meeuwig, J.J. Drivers of abundance and spatial distribution of reef-associated sharks in an isolated atoll reef system. PLoS ONE 2017, 12, e0177374. [Google Scholar]
  13. Langlois, T.; Williams, J.; Monk, J.; Bouchet, P.; Currey, L.; Goetze, J.; Harasti, D.; Huveneers, C.; Ierodiaconou, D.; Malcolm, H.; et al. Marine sampling field manual for benthic stereo BRUVS (Baited Remote Underwater Videos). In Field Manuals for Marine Sampling to Monitor Australian Waters; Przeslawski, R., Foster, S., Eds.; National Environmental Science Programme (NESP): Hobart, Australia, 2018; pp. 82–104. [Google Scholar]
  14. Cappo, M.; Stowar, M.; Syms, C.; Johansson, C.; Cooper, T. Fish-habitat associations in the region offshore from James price point—A rapid assessment using baited remote underwater video stations (BRUVS). J. R. Soc. West. Aust. 2011, 94, 303–321. [Google Scholar]
  15. Harvey, E.S.; McLean, D.L.; Frusher, S.; Haywood, M.D.E.; Newman, S.J.; Williams, A. The Use of Bruvs as a Tool for Assessing Marine Fisheries and Ecosystems: A Review of the Hurdles and Potential; Fisheries Research and Development Corporation, and the University of Western Australia: Crawley, Australia, 2013; ISBN 978-1-74052-265-6. [Google Scholar]
  16. Ashworth, J.S.; Ormond, R.F.G. Effects of fishing pressure and trophic group on abundance and spillover across boundaries of a no-take zone. Biol. Conserv. 2005, 121, 333–344. [Google Scholar] [CrossRef]
  17. Hill, J.; Wilkinson, C. Methods for Ecological Monitoring of Coral Reefs; Australian Institute of Marine Science: Townsville, Australia, 2004; p. 117. [Google Scholar]
  18. McCauley, D.J.; McLean, K.A.; Bauer, J.; Young, H.S.; Micheli, F. Evaluating the performance of methods for estimating the abundance of rapidly declining coastal shark populations. Ecol. Appl. 2012, 22, 385–392. [Google Scholar] [CrossRef]
  19. Bassett, D.K.; Montgomery, J.C. Investigating nocturnal fish populations in situ using baited underwater video: With special reference to their olfactory capabilities. J. Exp. Mar. Biol. Ecol. 2011, 409, 194–199. [Google Scholar] [CrossRef]
  20. Campbell, M.D.; Pollack, A.G.; Gledhill, C.T.; Switzer, T.S.; DeVries, D.A. Comparison of relative abundance indices calculated from two methods of generating video count data. Fish. Res. 2015, 170, 125–133. [Google Scholar] [CrossRef]
  21. Schobernd, Z.H.; Bachele, N.M.; Conn, P.B. Examining the utility of alternative video monitoring metrics for indexing reef fish abundance. Can. J. Fish. Aquat. Sci. 2014, 71, 464–471. [Google Scholar] [CrossRef]
  22. Stobart, B.; Diaz, D.; Alvarez, F.; Alonso, C.; Mallol, S.; Goni, R. Performance of Baited Underwater Video: Does It Underestimate Abundance at High Population Densities? PLoS ONE 2015, 10, e0127559. [Google Scholar] [CrossRef] [PubMed]
  23. Irigoyen, A.J.; De Wysiecki, A.M.; Trobbiani, G.; Bovcon, N.; Awruch, C.A.; Argemi, F.; Jaureguizar, A.J. Habitat use, seasonality and demography of an apex predator: Sevengill shark Notorynchus cepedianus in northern Patagonia. Mar. Ecol. Prog. Ser. 2018, 603, 147–160. [Google Scholar] [CrossRef]
  24. Sherman, C.S.; Chin, A.; Heupel, M.R.; Simpfendorfer, C.A. Are we underestimating elasmobranch abundances on baiter remote underwater video systems (BRUVS) using traditional metrics? J. Exp. Mar. Biol. Ecol. 2018, 503, 80–85. [Google Scholar] [CrossRef]
  25. Gore, M.A.; Frey, P.H.; Ormond, R.F.; Allan, H.; Gilkes, G. Use of Photo-Identification and Mark-Recapture methodology to assess basking shark (Cetorhinus maximus) populations. PLoS ONE 2016, 11, e0150160. [Google Scholar] [CrossRef] [Green Version]
  26. Anderson, S.D.; Goldman, K.J. Photographic evidence of white shark movements in California waters. Calif. Fish Game 1996, 82, 182–186. [Google Scholar]
  27. Mourier, J.; Vercelloni, J.; Planes, S. Evidence of social communities in a spatially structured network of a free-ranging shark species. Anim. Behav. 2012, 83, 389–401. [Google Scholar] [CrossRef]
  28. Devine, B.M.; Wheeland, L.J.; Fisher, J.A.D. First estimates of Greenland shark (Somniosus microcephalus) local abundances in Arctic waters. Sci. Rep. 2018, 8, 974. [Google Scholar] [CrossRef] [Green Version]
  29. Castro, A.L.F.; Rosa, R.S. Use of natural marks on population estimates of the nurse shark, Ginglymostoma cirratum, at Atol das Rocas Biological Reserve, Brazil. Environ. Biol. Fishes 2005, 72, 213–221. [Google Scholar] [CrossRef]
  30. Buray, N.; Mourier, J.; Planes, S.; Clua, E. Underwater photo-identification of sicklefin lemon sharks, Negaprion acutidens, at Moorea (French Polynesia). Cybium 2009, 33, 21–27. [Google Scholar]
  31. Meekan, M.G.; Bradshaw, C.J.; Press, M.; McLean, C.; Richards, A.; Quasnichka, S.; Taylor, J.G. Population size and structure of whale sharks Rhincodon typus at Ningaloo Reef, Western Australia. Mar. Ecol. Prog. Ser. 2006, 319, 275–285. [Google Scholar] [CrossRef] [Green Version]
  32. Rowat, D.; Speed, C.W.; Meekan, M.G.; Gore, M.A.; Bradshaw, C.J. Population abundance and apparent survival of the vulnerable whale shark Rhincodon typus in the Seychelles aggregation. Oryx 2009, 43, 591–598. [Google Scholar] [CrossRef] [Green Version]
  33. Benjamins, S.; Dodd, J.; Thorburn, J.; Milway, V.A.; Campbell, R.; Bailey, D.M. Evaluating the potential of photo-identification as a monitoring tool for flapper skate (Dipturus intermedius). Aquat. Cons. 2018, 28, 1360–1373. [Google Scholar] [CrossRef] [Green Version]
  34. Harasti, D.; Lee, K.A.; Laird, R.; Bradford, R.; Bruce, B. Use of stereo baited remote underwater video systems to estimate the presence and size of white sharks (Carcharodon carcharias). Mar. Fresh. Res. 2016, 68, 1391–1396. [Google Scholar] [CrossRef]
  35. Langlois, T.J.; Harvey, E.S.; Fitzpatrick, B.; Meeuwig, J.J.; Shedrawi, G.; Watson, D.L. Cost-efficient sampling of fish assemblages: Comparison of baited video stations and diver video transects. Aquat. Biol. 2010, 9, 155–168. [Google Scholar] [CrossRef] [Green Version]
  36. Boussarie, G.; Bakker, J.; Wangensteen, O.S.; Mariani, S.; Bonnin, L.; Juhel, J.-B.; Kiszka, J.J.; Kulbicki, M.; Manel, S.; Robbins, W.D.; et al. Environmental DNA illuminates the dark diversity of sharks. Sci. Adv. 2018, 4, eaap9661. [Google Scholar] [CrossRef] [Green Version]
  37. Asher, J. A Deeper Look at Hawaiian Coral Reef Fish Assemblages: A Comparison of Survey Approaches and Assessments of Shallow to Mesophotic Communities. Ph.D. Thesis, Curtin University, Perth, Australia, April 2017. [Google Scholar]
  38. Torres, A.; Abril, A.-M.; Clue, E. A time-extended (24 h) Baited Remote Underwater Video (BRUV) for monitoring pelagic and nocturnal marine species. J. Mar. Sci. Eng. 2020, 8, 208. [Google Scholar] [CrossRef] [Green Version]
  39. Ormond, R.; Gore, M.; Bladon, A.; Dubock, O.; Kohler, J.; Millar, C. Protecting Cayman Island Sharks: Monitoring, Movement and Motive. In Proceedings of the 69th Gulf and Caribbean Fisheries Institute, Grand Cayman, Cayman Islands, 7–11 November 2016. [Google Scholar]
  40. Cayman Islands Government. The National Conservation Law, 2013 (Law 24 of 2013). Supplement No. 1 published with Extraordinary Gazette No. 9, 5 February 2014. Available online: https://legislation.gov.ky/cms/images/LEGISLATION/PRINCIPAL/2013/2013-0024/NationalConservationLaw_Law%2024%20of%202013.pdf (accessed on 6 October 2020).
  41. OpenStreetMap Foundation. OpenStreetMap. Available online: https://www.openstreetmap.org/copyright (accessed on 6 October 2020).
  42. Meekan, M.; Cappo, M.; Carleton, J.; Marriott, R. Surveys of Shark and Fin-Fish Abundance on Reefs within the Mou74 Box and Rowley Shoals Using Baited Remote Underwater Video Systems; Australian Institute of Marine Science: Townsville QLD, Australia, 2006; Dewey Number 333.956311.
  43. Seber, G.A.F. The Estimation of Animal Abundance and Related Parameters, 2nd ed.; Griffin: London, UK, 1982. [Google Scholar]
  44. Cliff, G.; van der Elst, R.P.; Govender, A.; Witthuhn, T.K.; Bullen, E.M. First Estimates of Mortality and Population Size of White Sharks on the South African Coast. In Great White Sharks: The Biology of Carcharodon Carcharias; Klimley, A.P., Ainley, D.G., Eds.; Academic Press: San Diego, CA, USA, 1996; pp. 393–400. [Google Scholar]
  45. Chapman, D.G. Some Properties of the Hypergeometric Distribution with Applications to Zoological Censuses; University of California Publications in Statistics: Dordrecht, The Netherlands, 1951. [Google Scholar]
  46. Jaiteh, V.F.; Lindfield, S.J.; Mangubhai, S.; Warren, C.; Fitzpatrick, B.; Loneragan, N.R. Higher Abundance of Marine Predators and Changes in Fishers’ Behavior Following Spatial Protection within the World’s Biggest Shark Fishery. Front. Mar. Sci. 2016, 3, 43. [Google Scholar] [CrossRef] [Green Version]
  47. Beer, A.J.E. Diversity and Abundance of Sharks in no-Take and Fished Sites in the Marine Protected aRea Network of Raja Ampat, West Papua, Indonesia, using Baited Remote Underwater Video (BRUVs). Master’s Thesis, Royal Roads University, Victoria, BC, Canada, February 2015. [Google Scholar]
  48. Santana-Garcon, J.; Braccini, M.; Langlois, T.J.; Newman, S.J.; McAuley, R.B.; Harvey, E.S. Calibration of pelagic stereo-BRUVs and scientific longline surveys for sampling sharks. Methods Ecol. Evol. 2014, 5, 824–833. [Google Scholar] [CrossRef] [Green Version]
  49. Pollock, K.H.; Nichols, J.D.; Simons, T.R.; Farnsworth, G.L.; Bailey, L.L.; Sauer, J.R. Large scale wildlife monitoring studies: Statistical methods for design and analysis. Environmetrics 2002, 13, 105–119. [Google Scholar] [CrossRef]
  50. Porcher, I.F. On the gestation period of the blackfin reef shark, Carcharhinus melanopterus, in waters off Moorea, French Polynesia. Mar. Biol. 2005, 146, 1207–1211. [Google Scholar] [CrossRef]
  51. Balcik-Misir, G.; Tufan, B.; Köse, S. Monthly variation of total lipid and fatty acid contents of Atlantic bonito, Sarda sarda (Bloch,1793) of Black Sea. Int. J. Food Sci. Technol. 2014, 49, 2668–2677. [Google Scholar] [CrossRef]
  52. Mahaliyana, A.; Jinadasa, B.; Liyanage, N.; Jayasinghe, G.; Jayamanne, S. Nutritional composition of skipjack tuna (Katsuwonus pelamis) caught from the oceanic waters around Sri Lankae. Am. J. Food Nutr. 2015, 3, 106–111. [Google Scholar]
  53. Bagthasingh, C.; Aran, S.; Vetri, V.; Innocen, A.; Kannaiyan, S. Seasonal variation in the proximate composition of sardine (Sardinella gibbosa) from Thoothukudi coast. J. Food Compos. Anal. 2016, 49, 9–18. [Google Scholar]
  54. Gámez-Meza, N.; Higuera-Ciapara, I.; Calderson de la Barca, A.; Vásquez-Moreno, L.; Noriega-Rodrìguez, J.; Angulo-Guerrero, O. Seasonal variation in the fatty acid composition and quality of sardine oil from Sardinops sagax caeruleus of the Gulf of California. Lipids 1999, 34, 639–642. [Google Scholar] [CrossRef]
  55. Bonnin, L.; Robbins, W.D.; Boussarie, G.; Kiszka, J.J.; Dagorn, L.; Mouillot, D.; Vigliola, L. Repeated long-range migrations of adult males in a common Indo-Pacific reef shark. Coral Reefs 2019, 38, 1121–1132. [Google Scholar] [CrossRef]
  56. Lea, J.S.E.; Humphries, N.E.; von Brandis, R.G.; Clarke, C.R.; Sims, D.W. Acoustic telemetry and network analysis reveal the space use of multiple reef predators and enhance marine protected area design. Proc. R. Soc. B 2016, 283, 20160717. [Google Scholar] [CrossRef]
  57. Mourier, J.; Planes, S. Direct genetic evidence for reproductive philopatry and associated fine-scale migrations in female blacktip reef sharks (Carcharhinus melanopterus) in French Polynesia. Mol. Ecol. 2013, 22, 201–214. [Google Scholar] [CrossRef]
  58. Chapman, D.D.; Pikitch, E.K.; Babcock, E.A.; Shivji, M.S. Marine reserve design and evaluation using automated acoustic telemetry: A case-study involving coral reef associated sharks in the Mesoamerican Caribbean. Mar. Technol. Soc. J. 2005, 39, 42–53. [Google Scholar] [CrossRef] [Green Version]
  59. Chapman, D.D.; Pikitch, E.K.; Babcock, E.A.; Shivji, M.S. Deep-diving and diel changes in vertical habitat use by Caribbean reef sharks Carcharhinus perezi. Mar. Ecol. Prog. Ser. 2007, 344, 271–275. [Google Scholar] [CrossRef]
  60. Clarke, C.; Lea, J.S.E.; Ormond, R.F.G. Reef-use and residency patterns of a baited population of silky sharks, Carcharhinus falciformis, in the Red Sea. Mar. Fresh. Res. 2011, 62, 668–675. [Google Scholar] [CrossRef]
  61. Heupel, M.R.; Simpfendorfer, C.A.; Fitzpatrick, R. Large–scale movement and reef fidelity of grey reef sharks. PLoS ONE 2010, 5, e9650. [Google Scholar] [CrossRef] [Green Version]
  62. Vianna, G.M.S.; Meekan, M.G.; Meeuwig, J.J.; Speed, C.W. Environmental Influences on Patterns of Vertical Movement and Site Fidelity of Grey Reef Sharks (Carcharhinus amblyrhynchos) at Aggregation Sites. PLoS ONE 2013, 8, e60331. [Google Scholar] [CrossRef] [Green Version]
Figure 1. Locations of study areas: (a) the three islands constituting the Cayman Islands in the Caribbean Sea, and (b) D’Arros Island and St. Joseph’s Atoll in the Amirante Islands, Seychelles, in the Indian Ocean. Data analysed for this study resulted from deployments of BRUVS at varied intervals of 0.5–2 km around the whole of both Grand Cayman and Little Cayman in the Cayman Islands, and D’Arros Island and St. Joseph’s Atoll in the Seychelles. The faint red lines around each island indicate the extent of territorial waters [41].
Oceans 01 00019 g001
Figure 2. Image of a BRUVS as used in the present study, showing the open weave plastic body, a high-definition camera (GoPro Hero 3 or 4) under a roll cage, a bait arm with outer bait bag (lower left) and lines (upper right) leading to a surface marker buoy. (Photo with permission by James Lea).
Oceans 01 00019 g002
Figure 3. Examples of variations in natural patterning and injuries on dorsal fins of sharks recorded as screen grabs from BRUVS videos. (a) Differences in natural patterning on right and left sides of first dorsal fins of two different blacktip reef sharks, Carcharinus melanopterus, (first shark i and ii, second shark iii and iv), and (b) dorsal fins of four different grey reef sharks, C. amblyrhynchos. The yellow circles highlight the location of distinctive features; the yellow lines are added to allow variation in the shape of the black fin tip to be seen more clearly. Note that the different sides of an individual blacktip reef shark’s dorsal fin tend to be similar, but are not identical to each other.
Oceans 01 00019 g003aOceans 01 00019 g003b
Figure 4. Examples of variation in natural markings (circled) on different shark species taken from BRUVS videos of two different Caribbean reef sharks, Carcharinus perezi (top), a nurse shark, Ginglymostoma cirratum, (centre), and a set of four images (bottom) showing distinctive features on different individual whitetip reef sharks, Triaenodon obesus.
Oceans 01 00019 g004
Figure 5. Cayman Islands: The mean number (bar) and 95% confidence interval (error bar) of individually identified sharks observed for deployment periods of 60, 120 and 150 min for IndN compared with the same periods for MaxN. Significant differences found between pairs of IndN and MaxN using paired t tests are noted by ★ for p ≤ 0.05, ★★ for p ≤ 0.001 and ★★★ for p ≤ 0.0001 (see Table A1).
Oceans 01 00019 g005
Figure 6. Amirante Islands: The mean number (bar) and 95% confidence interval (error bar) of individually identified sharks observed for deployment periods of 60, 120 and 150 min for IndN compared with the same periods for MaxN. Significant differences found between pairs of IndN and MaxN using paired t tests are noted by ★ for p ≤ 0.05, ★★ for p ≤ 0.001 and ★★★ for p ≤ 0.0001 (see Table A1).
Oceans 01 00019 g006
Figure 7. Mean and 95% confidence interval of time taken (hh:mm) by shark species to arrive at the BRUVS camera. Top: Cayman Islands, Bottom: Amirante Islands. The red line indicating a mean time taken to arrive of 1 h (60 min) is included for convenience.
Oceans 01 00019 g007
Table 1. The numbers of individually identifiable sharks of different species (i.e., those carrying distinguishing features enabling them to be recognised again as individuals) and the corresponding percentages these represent of all records of that species observed on video recordings from Baited Remote Underwater Video Stations (BRUVS) (a) in the Cayman Islands (451 BRUVS) and (b) in the Amirante Islands (210 BRUVS).
AreaScientific NamesEnglish NamesNumber of Individually Identifiable Sharks% Recognisable Sharks of All Records of the Species
(a) Cayman IslandsCarcharhinus limbatusblacktip860
Carcharhinus pereziCaribbean reef13554.4
Galeocerdo cuviertiger4100
Ginglymostoma cirratumnurse20182.8
Negaprion brevirostrislemon1466.7
Sphyrna mokarrangreat hammerhead466.7
(b) Amirante IslandsCarcharhinus albimarginatussilvertip416.7
Carcharhinus amblyrhynchosgrey reef9677.9
Carcharhinus leucasbull139.1
Carcharhinus melanopterusblacktip reef32285.3
Nebrius ferrugineustawny nurse4478.3
Negaprion acutidenssicklefin6555.3
Sphyrna mokarrangreat hammerhead133.3
Triaenodon obesuswhitetip reef3063.9
Table 2. Proportion of BRUVS deployments in which IndN was greater than MaxN in (a) the Cayman Islands (n = 451) and (b) the Amirante Islands (n = 210). The proportion as a percentage of BRUVS is the percentage of BRUVS with sharks in which IndN was greater than MaxN.
AreaSpeciesNo. of BRUVS with SharksBRUVS IndN > MaxN as%
(a) Cayman IslandsCarcharhinus limbatus80
Carcharhinus perezi8520
Galeocerdo cuvier40
Ginglymostoma cirratum13122.1
Negaprion brevirostris119.1
Sphyrna mokarran40
(b) Amirante IslandsCarcharhinus albimarginatus10
Carcharhinus amblyrhynchos5733.3
Carcharhinus leucas911.1
Carcharhinus melanopterus8066.3
Nebrius ferrugineus3315.2
Negaprion acutidens4628.3
Sphyrna mokarran10
Triaenodon obesus277.4
Table 3. Comparison of IndN and MaxN for all shark species combined ± standard deviation (S.D.) recorded on BRUVS in (a) Cayman Islands (BRUVS n = 109) and (b) Amirante Islands (BRUVS n = 55) for 60, 120 and 150 min deployment periods. Only cases where BRUVS ran for 150 min were used to compare across the three periods with Friedman ANOVA χ2, p = probability value, df = 2.
Study AreaDeployment Period (min)IndNMaxN
Mean Number & S.D. of All SharksΧ2pMean Number & S.D. of All SharksΧ2p
(a) Cayman Islands600.78137.90.000010.72119.20.00001
0.910.82
1201.811.44
1.380.95
1501.961.56
1.51.08
(b) Amirante Islands602.4572.80.000011.4554.30.00001
2.711.24
1203.732.13
3.051.28
1503.842.16
3.041.23
Table 4. Comparison of mean ± standard deviation (S.D.) values of IndN and MaxN for each shark species for BRUVS deployment periods of 60, 120 and 150 min for (a) the Cayman Islands and (b) the Amirante Islands. Shown too are the results of a Friedman ANOVA (χ2, p = probability value, n = number of BRUVS in sample; df = 2) for the differences in the means across the three deployment periods. Post hoc results are available in Table A4.
IndNMaxN
AreaShark SpeciesPeriod minMeanS.D.χ2MeanS.D.χ2
pp
nn
(a) Cayman IslandsCarcharhinus limbatus600.50.5560.60.554
1201 0.0491 0.1
1501 61 5
Carcharhinus perezi600.780.8854.50.640.750.6
1201.671.220.000011.280.880.00001
1501.821.35451.431.0247
Galeocerdo cuvier600.330.5840.330.584
1201 0.11 0.1
1501 31 3
Ginglymostoma cirratum600.60.7579.90.550.6367.6
1201.431.030.000011.10.60.00001
1501.570.93701.190.4669
Negaprion brevirostris600.330.5280.330.528
1201 0.0181 0.018
1501 61 6
Sphyrna mokarran600.50.5840.50.584
1201 0.11 0.1
1501 41 4
(b) Amirante IslandsCarcharhinus albimarginatus600.50.7120.50.712
1201 0.41 0.4
1501 21 2
Carcharhinus amblyrhynchos600.690.6218.70.690.6218.7
1201.120.590.000091.120.590.00009
1501.190.49261.190.4926
Carcharhinus melanopterus601.231.07141.231.0714
1201.470.860.00091.470.860.0009
1501.470.86301.470.8630
Nebrius ferrugineus600.80.7980.80.798
1201.30.480.0181.30.480.018
1501.30.48101.30.4810
Negaprion acutidens600.640.63140.640.6314
1201.210.430.00091.210.430.0009
1501.210.43141.210.4314
Triaenodon obesus600.640.580.640.554.3
1201 0.0181 0.00001
1501 111 11
Table 5. The re-sightings rates on BRUVS for shark species (a) in the Cayman Islands and (b) in the Amirante Islands, both within years and between years. Only re-sights recorded on BRUVS videos are included here (as opposed to other re-sightings that were recorded during other related activities). Note that the total number of individuals re-sighted over the whole period is not necessarily the sum of the re-sights in each year, since some re-sights may be of individuals that have already been re-sighted.
AreaSpeciesYearNo. of Distinguishable IndividualsRe-Sights within YearRe-Sights within Year as%Re-Sights from Previous YearsTotal Individuals Re-Sighted as%
(a) Cayman IslandsCarcharhinus limbatus2015100
201640000
20173133.3012.5
Carcharhinus perezi20154424.5
20164748.506.6
201769710.149.6
Galeocerdo cuvier20152150
2016100033.3
2017100150
Ginglymostoma cirratum201551917.6
20166822.9110.1
2017791316.52128.8
Negaprion brevirostris20153133.3
2016600011.1
2017412519.1
Sphyrna mokarran20152150
2016100033.3
2017100033.3
(b) Amirante IslandsCarcharhinus albimarginatus2015200
201621500
2017000025
Carcharhinus amblyrhynchos20152314.3
20163425.91
2017340026.8
Carcharhinus melanopterus20151071413.1
20167978.92
201713564.429.8
Nebrius ferrugineus2015900
20161715.90
20171815.604.5
Negaprion acutidens20152328.7
20162129.50
2017210006.2
Triaenodon obesus2015700
20168112.50
2017140016.8
Table 6. A comparison of the values of MaxN reported by authors for BRUVS deployed (A) in the Caribbean Sea and tropical western mid-Atlantic Ocean, and (B) in the Indian Ocean. In (A), the area in the Bahamas was Eleuthera (1: Brooks et al. [10]) and in Belize it was Glover’s Reef (6: Bond et al. [11]). (B) included an area in the BMR in the BIOT, Indian Ocean (3: Tickler et al. [12]), MOU74 and Rowley Shoals, E. Australia (4: Meekan et al. [42]), Raja Ampat in Indonesia (5: Jaiteh et al. [46]; 6: Beer [47]), and Houtman Abrolhos Islands, W. Australia (7: Santana et al. [48]). * denotes unfished or protected areas. Catch per unit effort (CPUE) values for the present study were calculated as the shark MaxN per hour on BRUVS.
Literature ReviewCurrent Study
Shark SpeciesOceanCPUEBRUVS NCountryYearsDepth mReferenceAreaCPUEBRUVS NYears
Carcharhinus limbatusA0.003279Bahamas2008–20094–151CI0.014512015–2017
Carcharhinus perezi1.43200Belize2009–201010–2520.1284512015–2017
0.28200Belize2009–201010–252
0.081279Bahamas2008–20094–151
Galeocerdo cuvier0.013279Bahamas2008–20094–1510.0044512015–2017
Ginglymostoma cirratum0.215279Bahamas2008–20094–1510.1784512015–2017
Negaprion brevirostris0.035279Bahamas2008–20094–1510.0134512015–2017
Sphyrna mokarran0.012279Bahamas2008–20094–1510.0044512015–2017
Carcharhinus albimarginatusB0.19138Indian Ocean201210–803AI0.012102015–2017
024–41E Australia2003-20045–714
0.30680E Australia * 4
Carcharhinus amblyrhynchos1.35138Indian Ocean201210–8030.1682102015–2017
0.21658E Australia2003–20045–714
0.39824–41E Australia * 4
0.180Indonesia20121–345
0.5580Indonesia *20121–345
Carcharhinus melanopterus0.1138Indian Ocean201210–8030.3282102015–2017
0.580Indonesia *20121–345
0.280Indonesia20122–855
0.3328Indonesia20151–346
Galeocerdo cuvier0.01138Indian Ocean201210–80302102015–17
024–41E Australia2003–20045–714
0.05680E Australia * 4
0.00731W Australia201235–1067
Nebrius ferrugineus0.15138Indian Ocean201210–8030.0982102015–2017
024–41E Australia2003–20045–714
0.01980E Australia * 4
Negaprion acutidens0.025328Indonesia20152–8560.1252102015–2017
Sphyrna mokarran0.01138Indian Ocean201210–8030.0032102015–2017
0.02824–41E Australia2003–20045–714
0.01880E Australia * 4
Triaenodon obesus0.2138Indian Ocean201210–8030.0652102015–2017
0.27324–41E Australia2003–20045–714
0.13980E Australia * 4
0.025328Indonesia20152–854
BRUVS N = number of BRUVS deployed. Years indicate when the study was undertaken. AI = Amirante Islands, CI = Cayman Islands.
Publisher’s Note: MDPI stays neutral with regard to jurisdictional claims in published maps and institutional affiliations.