Article

Regional Plantar Pressure in the Transmetatarsal Amputation Limb Under Different Contralateral Limb Conditions: An Exploratory Case-Comparison

1
School of Podiatric Medicine, University of Texas Rio Grande Valley, Harlingen, TX 78550, USA
2
College of Engineering and Computer Science, University of Texas Rio Grande Valley, Edinburg, TX 78539, USA
3
School of Mathematical and Statistical Science, University of Texas Rio Grande Valley, Edinburg, TX 78539, USA
4
Jomarg Innovation Ltd., 17 Dalnair Street, Glasgow G3 8SD, UK
*
Author to whom correspondence should be addressed.
Prosthesis 2026, 8(9), 91; https://doi.org/10.3390/prosthesis8090091
Submission received: 23 May 2026 / Revised: 24 August 2026 / Accepted: 27 August 2026 / Published: 31 August 2026

Abstract

Background: Transmetatarsal amputation (TMA) alters foot biomechanics and is associated with abnormal plantar loading that may contribute to plantar tissue breakdown. Although plantar pressure abnormalities following TMA have been reported, the potential role of contralateral limb status in regional plantar loading patterns remains incompletely understood. This exploratory case-comparison study examined plantar loading under two different contralateral limb conditions. Methods: This exploratory case-comparison evaluated in-shoe plantar pressure in two individuals with unilateral TMA: one with an intact contralateral limb and one with a contralateral transtibial prosthesis. Plantar pressure data were collected using a Pedar-X system during overground walking at a self-selected speed. Regionally resolved outcome measures, including peak plantar pressure (PPP), pressure–time integral (PTI), and maximum force (MF), were calculated for the TMA limb. Interlimb asymmetry was assessed in the unilateral TMA participant using normalized asymmetry indices (AIs). Results: The participant with a contralateral transtibial prosthesis exhibited substantially higher PPP and MF across all TMA regions (increases of approximately 40–99%) compared with the participant with an intact contralateral limb. In contrast, PTI values were lower under the prosthetic condition. Within-subject analysis revealed pronounced interlimb asymmetry, with increased midfoot loading in the TMA limb (PPP AI: +38–44%; MF AI: >100%) and greater rearfoot loading in the intact limb (PPP AI: −25% to −35%). Conclusions: In this exploratory case-comparison, the participant with a contralateral transtibial prosthesis exhibited higher regional peak plantar pressures and maximum forces, together with lower pressure–time integrals, than the participant with an intact contralateral limb. Regional asymmetry was also observed in the unilateral TMA participant. These descriptive findings suggest that contralateral limb condition may be associated with differences in plantar loading patterns; however, the observations should be interpreted cautiously because of the exploratory nature of this two-participant case-comparison. Future studies involving larger cohorts are needed to determine whether these observations are generalizable.

1. Introduction

Transmetatarsal amputation (TMA) is commonly performed as a limb-salvage procedure for individuals with diabetes and forefoot pathology and is generally preferred over more proximal amputations because of improved functional outcomes and a lower physiological cost of ambulation [1,2]. In the United States alone, an estimated 10,000–20,000 TMA procedures are performed annually, underscoring its continued clinical relevance in limb-preservation strategies [3]. Despite these advantages, TMA substantially alters foot biomechanics by shortening the forefoot lever arm, reducing plantar contact area, and disrupting muscular balance. These biomechanical changes contribute to abnormal gait loading and may increase mechanical stress at the distal residuum, potentially predisposing the plantar tissues to breakdown [4,5]. Long-term outcomes after TMA remain guarded, with prior reports indicating high rates of ulcer recurrence, re-amputation, and progression to higher-level amputation, including involvement of the contralateral limb [2,5,6]. Elevated plantar mechanical stress during ambulation is recognized as an important factor associated with diabetic foot ulcer development and recurrence [7,8,9].
Individuals with TMA frequently adopt compensatory gait strategies that may alter plantar load distribution in both the amputated and contralateral limbs, particularly in the presence of peripheral neuropathy and vascular disease [1]. These adaptations often shift loading toward specific plantar regions, especially the residual midfoot and distal residuum, rather than distributing loads uniformly across the foot [5,10]. Previous biomechanical investigations have reported elevated peak plantar pressures, altered timing of peak loading during late stance, slower walking speeds, shorter step lengths, and reduced ankle plantarflexor power following TMA [1,5,9,10,11]. Overall, these findings suggest that plantar loading after TMA is characterized not only by increased magnitude but also by region-specific redistribution of mechanical stress.
Although altered plantar loading following TMA has been widely described, many previous investigations have summarized loading using whole-foot or global pressure metrics, potentially obscuring clinically relevant localized stress concentrations. Because plantar tissue breakdown develops at specific anatomical locations rather than across the entire foot, regionally resolved analysis may provide greater insight into localized mechanical loading than global pressure measures alone [12,13,14,15]. In addition, impairment of the contralateral limb may further modify loading patterns through compensatory gait adaptations, altered weight transfer, reduced push-off capacity, and changes in stance time. These biomechanical adaptations may redistribute loading to specific regions of the TMA limb, although this possibility has received limited investigation under functional in-shoe walking conditions.
Despite these observations, region-specific characterization of plantar loading in the context of contralateral limb status remains poorly understood, particularly in individuals with limb asymmetry or contralateral limb compromise, under functional, in-shoe conditions. This gap is clinically important because compensatory strategies arising from contralateral limb impairment may not uniformly affect the entire foot but instead redistribute load to specific plantar regions, thereby increasing localized tissue stress and the risk of breakdown.
Therefore, the primary objective of this exploratory case-comparison study was to characterize regionally resolved in-shoe plantar pressure distributions of the TMA limb in two individuals with different contralateral limb conditions: one with an intact contralateral limb and one with a contralateral transtibial prosthesis. A secondary objective was to describe interlimb regional plantar loading asymmetry in the participant with unilateral TMA. Rather than testing causal relationships, this exploratory comparison was intended to characterize plantar loading patterns and generate observations that may inform future studies involving larger patient cohorts.

2. Materials and Methods

2.1. Participants

Two individuals with unilateral left TMA were enrolled in this exploratory case-comparison study. Both participants had diabetes mellitus, and their transmetatarsal amputations were performed because of diabetic foot complications. No additional tendon-balancing or forefoot offloading procedures were performed following TMA. Participant demographic and clinical characteristics are summarized in Table 1. Given the exploratory case-comparison design, the two participants were considered individual clinical observations rather than representative of a broader patient population. All study procedures were approved by the University of Texas Rio Grande Valley Institutional Review Board. Written informed consent was obtained from both participants prior to data collection.

2.2. Experimental Protocol

In-shoe plantar pressure data were collected using the Pedar-X system (novel GmbH, Munich, Germany), a validated capacitive pressure measurement system widely used for dynamic gait analysis [16]. Flexible instrumented insoles were placed within standardized extra-depth diabetic footwear designed to accommodate partial foot amputation and orthotic inserts. For Participant 1, insoles were positioned bilaterally in the amputated (left) and intact (right) limbs. For Participant 2, an insole was placed only within the TMA limb. Plantar pressure data were not collected from the contralateral transtibial prosthetic limb because the objective of this exploratory case-comparison was to characterize regional plantar loading patterns in the TMA limb under differing contralateral limb conditions rather than to quantify bilateral plantar loading.
Participants walked at a self-selected comfortable speed to reflect habitual clinical ambulation. After a brief familiarization period, continuous walking trials were recorded under steady-state conditions. Walking speed was intentionally not externally constrained because the purpose of this exploratory case-comparison study was to characterize regional plantar loading under representative functional walking conditions rather than to compare gait speed or spatiotemporal parameters. Accordingly, no gait normalization procedures were performed. Plantar pressure data were collected during continuous walking, and 25 steady-state steps of the amputated limb during straight-line gait (excluding gait initiation and termination) were selected for step analysis. Using 25 steps exceeds the minimum recommended for valid and reliable in-shoe plantar pressure assessment (~12 steps per foot) and was chosen to better capture step-to-step variability and provide a more representative characterization of plantar loading patterns in this case study [16].
Data were collected at a sampling frequency of 100 Hz, consistent with commonly reported acquisition rates for in-shoe plantar pressure measurements during walking. Walking speed was not externally constrained to preserve natural gait patterns. A continuous walking protocol was used to capture step-to-step variability and to provide a more representative characterization of plantar loading patterns under functional conditions, consistent with the descriptive, exploratory nature of this case study.

2.3. Data Processing and Analysis

Plantar pressure data were processed using Pedar-X Expert analysis software (version 28.3.8.7; novel GmbH, Munich, Germany). For the TMA limb, the available residual plantar surface was partitioned into four anatomically relevant regions: medial rearfoot, lateral rearfoot, medial midfoot, and lateral midfoot [14]. The medial and lateral midfoot masks extended distally to the available plantar surface of the residual foot; therefore, measurable plantar contact near the distal aspect of the residuum was incorporated into the corresponding midfoot region. A separate distal-residuum mask was not defined. Distal forefoot and toe masks were not defined because these anatomical structures were absent following TMA.
For the intact limb (Participant 1 only), the plantar surface was subdivided into eight regions to enable finer anatomical resolution: medial rearfoot, lateral rearfoot, medial midfoot, lateral midfoot, first metatarsal head (MTH1), combined second through fifth metatarsal heads (MTH2–5), hallux (toe 1), and combined lesser toes (toes 2–5). The higher-resolution masking approach was used to preserve clinically relevant distinctions in forefoot and digital loading.
For each plantar region, the following outcome measures were computed: peak plantar pressure (PPP), defined as the maximum pressure recorded within the region during stance; pressure–time integral (PTI), representing cumulative load exposure over time; and maximum force (MF), representing the maximum regional vertical force reported by the Pedar-X analysis software during stance. Regional plantar-loading outcomes were obtained using the Pedar-X Step Analysis procedure with the anatomical masking applied. The step analysis output provided PPP, PTI, and MF for each analyzed step and each plantar region. All outcome measures were calculated per step and then averaged across the 25 selected steps to obtain representative regional values for each limb [14].
Percentage differences between participants were calculated to quantify relative changes in plantar loading of the TMA limb associated with the contralateral limb condition. Differences were expressed relative to Participant 1 (intact contralateral limb) using the following equation:
% Difference = (X_{Participant 2} − X_{Participant 1})/X_{Participant 1} × 100
where X represents the regional outcome measure (PPP, PTI, or MF). Positive values indicate greater loading in Participant 2 (contralateral transtibial prosthesis), whereas negative values indicate lower loading relative to Participant 1.
Interlimb asymmetry in regional plantar loading was quantified for Participant 1 to address the secondary aim of the study. Asymmetry indices (AI) were calculated for anatomically corresponding regions (rearfoot and midfoot) using a normalized difference approach:
AI = (X_TMA − X_Intact)/(0.5 (X_TMA + X_Intact)) × 100
where X represents the regional outcome measure (PPP, PTI, or MF). This formulation expresses asymmetry as a percentage difference relative to the mean loading across both limbs, allowing comparison across regions and outcome measures. Positive values indicate greater loading in the TMA limb, whereas negative values indicate greater loading in the intact limb. Because the denominator represents the mean of the two limb values rather than either limb serving as a fixed reference, the normalized AI can range theoretically from −200% to +200% for nonnegative loading measures. Consequently, absolute AI values greater than 100% are mathematically possible when the loading difference between limbs is large relative to their mean.

3. Results

3.1. Comparison of TMA Limb Loading Under Different Contralateral Limb Conditions

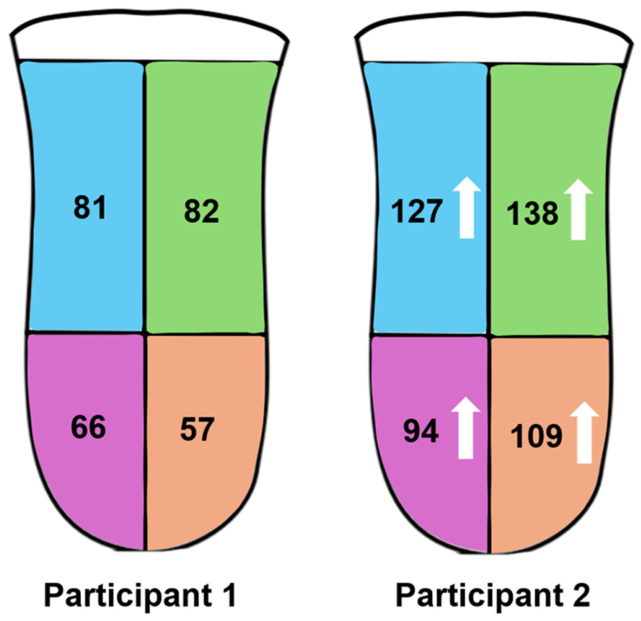
Regional plantar loading patterns of the TMA limb differed between the two participants (Table 2; Figure 1). Participant 2, who ambulated with a contralateral transtibial prosthesis, exhibited higher peak plantar pressures across all analyzed regions of the TMA limb compared with Participant 1, who had an intact contralateral limb.
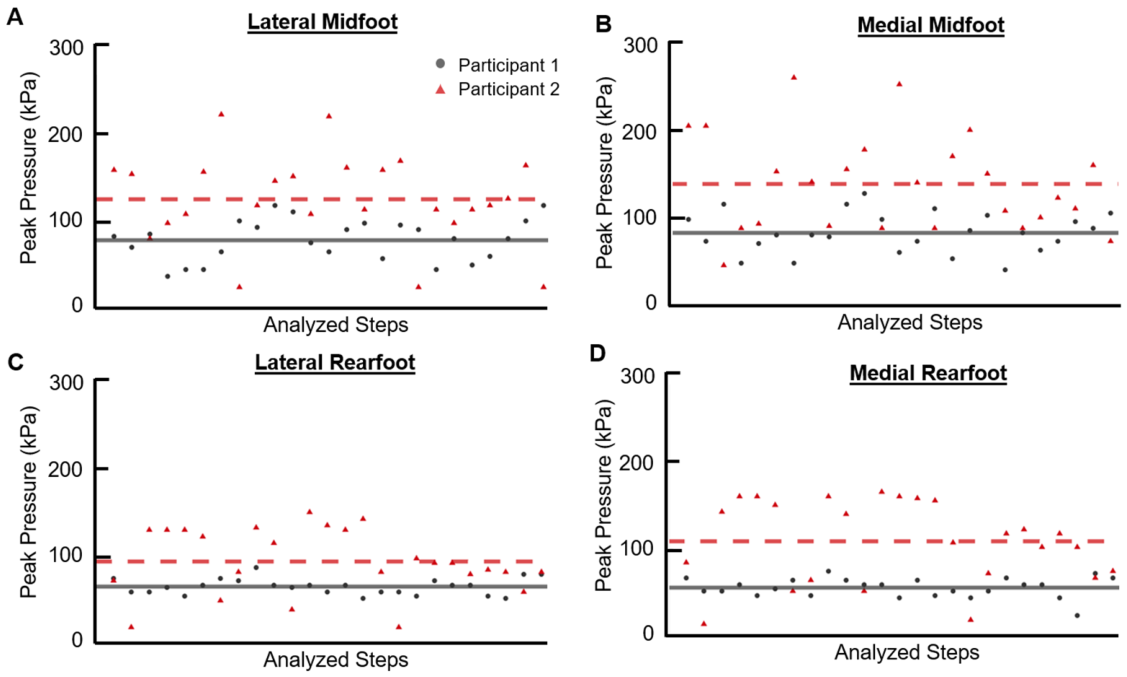
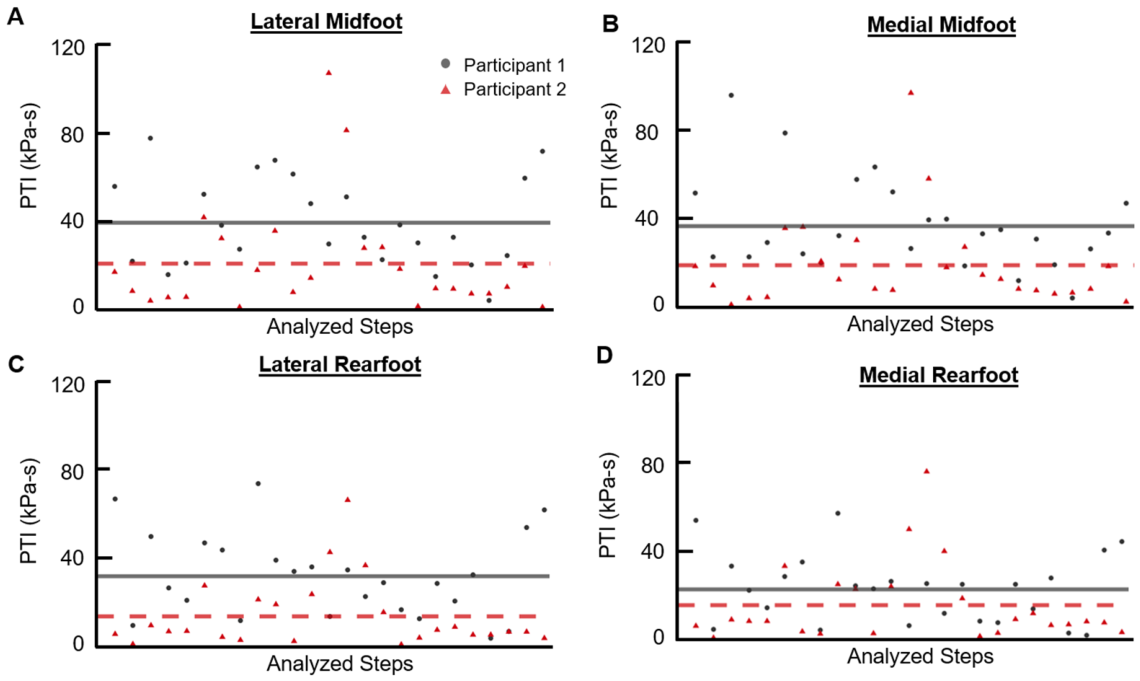
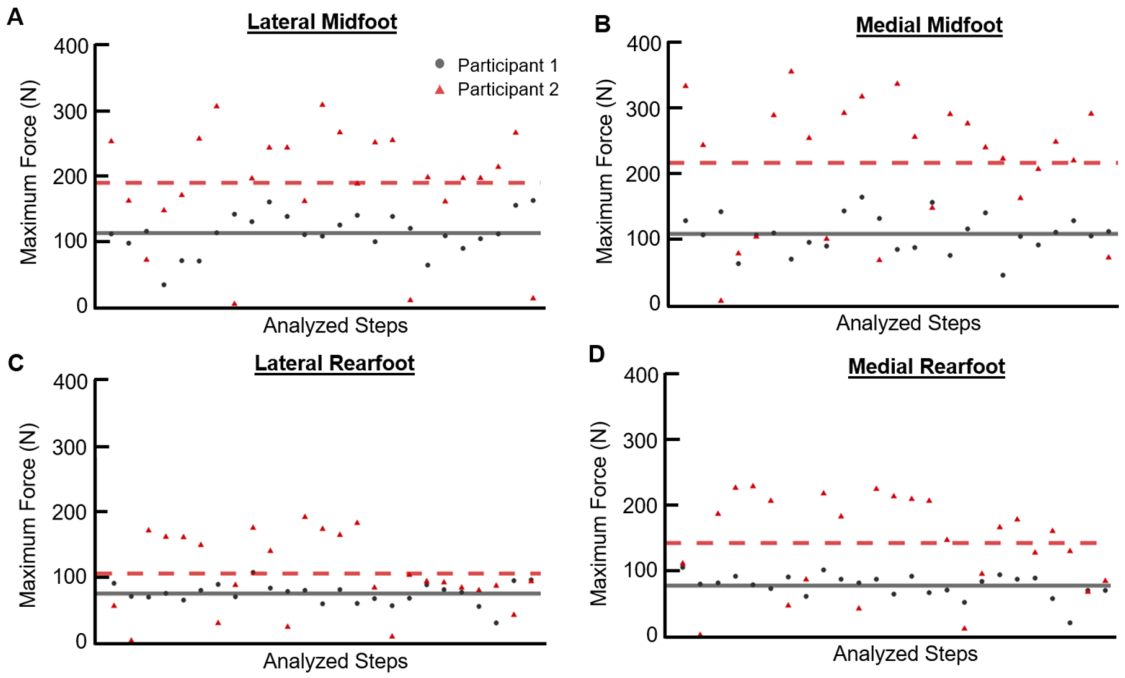
Peak plantar pressure in Participant 2 was approximately 43–93% higher than Participant 1, with the largest differences observed in the medial rearfoot (+92.9%) and medial midfoot (+68.2%). A similar trend was observed for maximum force, which was approximately 40–99% higher across regions, including a near doubling in medial midfoot loading (+99.0%). In contrast, pressure–time integral values were approximately 32–58% lower across all analyzed regions in Participant 2. The individual step-level PPP, PTI, and MF values across the 25 analyzed steps are presented in Figure 2, Figure 3 and Figure 4, respectively, illustrating the step-to-step variability underlying the regional summary values reported in Table 2.
In this exploratory case-comparison, the participant with a contralateral transtibial prosthesis exhibited higher peak plantar pressures and maximum forces, together with lower pressure–time integrals, than the participant with an intact contralateral limb. These observations are descriptive and should not be interpreted as establishing a causal relationship. Higher peak plantar pressures were observed in both the midfoot and rearfoot regions (Figure 1).

3.2. Interlimb Asymmetry in Regional Plantar Loading

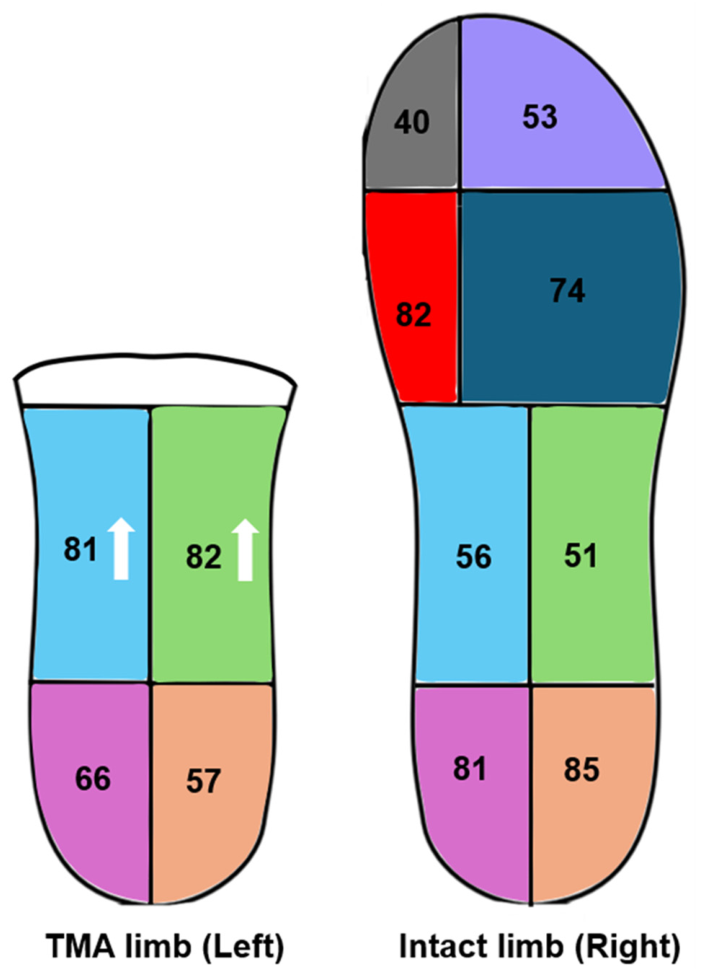
Within-subject comparison of the TMA and intact limbs in Participant 1 revealed regional asymmetry in plantar loading (Table 3; Figure 5). Greater loading was observed in the TMA limb at the midfoot, whereas lower loading was observed at the rearfoot relative to the intact limb.
For peak plantar pressure, asymmetry indices indicated greater loading in the TMA limb at the medial (+38.8%) and lateral (+44.1%) midfoot. In contrast, rearfoot regions exhibited negative asymmetry values, reflecting higher loading in the intact limb (medial rearfoot: −35.3%; lateral rearfoot: −25.1%).
A similar pattern was observed for pressure–time integral, with positive asymmetry values in the midfoot (medial: +50.6%; lateral: +57.3%) and negative asymmetry values in the rearfoot (medial: −50.9%; lateral: −25.0%). Maximum force also demonstrated higher positive asymmetry values in the midfoot (medial: +102.0%; lateral: +110.6%) and negative asymmetry values in the rearfoot (medial: −32.3%; lateral: −32.7%).
Collectively, these descriptive findings show a consistent pattern of greater midfoot loading in the TMA limb and greater rearfoot loading in the intact limb across the evaluated plantar loading metrics (Figure 5). These observations describe the loading patterns identified in this participant and should not be interpreted as evidence of a generalized loading pattern in individuals with TMA.

4. Discussion

4.1. Summary of Objectives and Principal Findings

The primary objective of this exploratory case-comparison study was to characterize regionally resolved plantar pressure distributions of the TMA limb under different contralateral limb conditions: one participant with an intact contralateral limb and one participant with a contralateral transtibial prosthesis. A secondary objective was to characterize interlimb asymmetry in plantar loading in the participant with unilateral TMA. In this exploratory comparison, the participant with a contralateral transtibial prosthesis exhibited higher regional peak plantar pressures and maximum forces, together with lower pressure–time integrals, than the participant with an intact contralateral limb. Additionally, the participant with unilateral TMA demonstrated greater midfoot loading in the TMA limb and greater rearfoot loading in the intact limb. These observations are generally consistent with previous reports describing compensatory plantar loading following TMA; however, because of the exploratory design and small number of participants, the present findings should be interpreted as descriptive observations rather than evidence of causal relationships or generalized loading patterns [1,4].

4.2. TMA Limb Loading with a Contralateral Transtibial Prosthesis

One of the principal observations of this exploratory case-comparison study was that the participant with a contralateral transtibial prosthesis exhibited higher peak plantar pressures and maximum forces across all analyzed regions of the TMA limb than the participant with an intact contralateral limb (Table 2; Figure 1). The magnitude of these differences ranged from approximately 40% to 99%. Although these observations may suggest that contralateral limb condition influences regional plantar loading, they should be interpreted cautiously because participant-specific characteristics, including time since amputation, neuropathy severity, and other unmeasured factors, may also have contributed to the observed differences (Table 1).
Previous studies have demonstrated that TMA compromises the forefoot lever arm and reduces effective push-off, often leading to compensatory loading of more proximal regions such as the midfoot [4,17]. The observations from the present exploratory case- comparison are generally consistent with these biomechanical adaptations and further suggest that the presence of a contralateral transtibial prosthesis may contribute to altered regional plantar loading. However, because this study included only two participants, it is not possible to determine the independent contribution of contralateral limb status from other participant-specific clinical factors. The regional loading patterns illustrated in Figure 1 therefore should be interpreted as descriptive observations that warrant confirmation in larger studies.

4.3. Interpretation of Peak Pressure, Pressure–Time Integral, and Maximum Force

One noteworthy observation from this exploratory case-comparison study was the differing behavior of peak plantar pressure, maximum force, and pressure–time integral between the two participants. While peak plantar pressure and maximum force were higher in the participant with a contralateral transtibial prosthesis, pressure–time integral values were consistently lower across the analyzed regions (Table 2). Previous studies have suggested that altered gait timing and rollover characteristics following partial foot amputation may influence plantar loading patterns [1,17].
The step-level data provide additional context for these regional summary measures (Figure 2, Figure 3 and Figure 4). Considerable step-to-step variability was observed across PPP, PTI, and MF, with particularly large variability in PTI for Participant 2 (Figure 3). These observations illustrate that the regional mean values represent loading patterns that varied across individual steps and should therefore be interpreted descriptively. Although PTI has been associated with cumulative tissue loading, repeated exposure to elevated peak plantar pressures and maximum forces may also contribute to localized mechanical stress within the residuum [10,14]. The observed step-level variability further supports the exploratory nature of these findings and the need for confirmation in larger studies.

4.4. Interlimb Asymmetry Following Unilateral TMA

Within-subject analysis of Participant 1 demonstrated region-specific asymmetry in plantar loading between the TMA and intact limbs (Table 3; Figure 5). Greater loading was observed in the medial and lateral midfoot of the TMA limb, whereas rearfoot regions exhibited greater loading in the intact limb. This loading pattern is consistent with the redistribution of plantar loading expected following loss of the distal forefoot and is generally consistent with previous reports describing proximal load transfer and compensatory gait adaptations after transmetatarsal amputations [1,4]. However, these observations represent a single participant and should therefore be interpreted as descriptive rather than representative of all individuals with unilateral TMA.
Plantar loading at the metatarsal heads and toes was present only in the intact limb because these anatomical structures were absent following TMA. This observation illustrates the structural asymmetry associated with TMA and may contribute to altered loading patterns between limbs. Although previous clinical studies have reported high rates of contralateral limb complications following partial foot amputation [2,6], the present exploratory case-comparison was not designed to evaluate the development of contralateral pathology.

4.5. Clinical Implications

Although the present findings are exploratory, they may have several clinical implications. The participant with a contralateral transtibial prosthesis exhibited higher peak pressures and maximum forces in the TMA limb, whereas the participant with unilateral TMA demonstrated region-specific interlimb asymmetry. These observations may indicate regions that warrant closer clinical monitoring during routine follow-up; however, because this study involved only two participants, they should not be interpreted as evidence that these loading patterns are present in all individuals with TMA.
Regionally resolved in-shoe plantar pressure assessment may provide clinically useful information for identifying localized loading patterns and guiding individualized offloading strategies, including footwear modifications, orthotic interventions, or prosthetic adjustments [5,14]. The present exploratory observations support the potential value of such assessments but should be considered hypothesis-generating until confirmed in larger studies incorporating comprehensive biomechanical and spatiotemporal gait analyses.

4.6. Limitations

Several limitations should be considered when interpreting these findings. First, this exploratory case-comparison included only two participants; therefore, the observed between-participant differences cannot be generalized to the broader population of individuals with TMA or attributed independently to contralateral limb status. The participants also differed in clinical characteristics, including time since TMA, neuropathy severity, body mass index, and contralateral limb status (Table 1), each of which may have contributed to the observed plantar loading patterns. Accordingly, the between-participant comparisons should be considered descriptive and hypothesis-generating, rather than evidence of a causal effect of the contralateral limb condition.
Second, participants walked at a self-selected comfortable speed, but walking speed was not instrumentally recorded or normalized. Because walking speed can influence plantar pressure outcomes, differences in walking velocity between participants may have contributed to the observed loading differences and cannot be separated from other participant-specific factors. More broadly, kinematic and spatiotemporal gait variables, including stance time, were not collected; therefore, potential mechanisms underlying the lower pressure–time integrals and greater variability observed in the participant with a contralateral transtibial prosthesis cannot be determined from the present data. In addition, distal residual plantar contact was incorporated within the medial and lateral midfoot masks rather than quantified as a separate region; therefore, loading specifically attributable to the distal residuum could not be independently evaluated. Finally, plantar pressure measurements were not obtained from the contralateral prosthetic limb in Participant 2, precluding direct assessment of bilateral plantar loading in that participant. Future studies incorporating larger cohorts, controlled or measured walking speed, bilateral measurements, and comprehensive spatiotemporal and kinematic gait analysis are needed to examine these exploratory observations.

5. Conclusions

This exploratory case-comparison study identified differences in regional plantar loading between two individuals with TMA under different contralateral limb conditions. The participant with a contralateral transtibial prosthesis exhibited higher regional peak plantar pressures and maximum forces, together with lower pressure–time integrals, than the participant with an intact contralateral limb. Region-specific interlimb asymmetry was observed in the participant with the unilateral TMA, with greater midfoot loading in the TMA limb and greater rearfoot loading in the intact limb. These descriptive observations suggest that regionally resolved plantar pressure assessment may provide useful information for characterizing individual loading patterns after TMA; however, the findings should be interpreted cautiously and considered as hypothesis-generating. Larger studies incorporating bilateral measurements and comprehensive gait assessment are needed to determine whether these observations are reproducible and generalizable.

Author Contributions

Conceptualization, H.R. and J.L.F.; methodology, H.R., S.F. and G.F.; software, H.R. and S.F.; validation, H.R., G.F., L.V. and J.L.F.; formal analysis, H.R. and S.F.; investigation, H.R., L.V. and J.L.F.; resources, H.R.; data curation, H.R. and S.F.; writing—original draft preparation, H.R., S.F., G.F., L.V. and J.L.F.; writing—review and editing, H.R., S.F., G.F., L.V. and J.L.F.; visualization, H.R.; supervision, H.R., L.V. and J.L.F.; project administration, H.R., L.V. and J.L.F.; funding acquisition, H.R. All authors have read and agreed to the published version of the manuscript.

Funding

This research was supported by the National Institute on Disability, Independent Living, and Rehabilitation Research (NIDILRR), Administration for Community Living (ACL), U.S. Department of Health and Human Services, under grant number 90IFST0019. The contents of this manuscript do not necessarily represent the policy of the U.S. Department of Health and Human Services and should not be assumed to reflect endorsement by the federal government.

Institutional Review Board Statement

The study was conducted in accordance with the Declaration of Helsinki and approved by the University of Texas Rio Grande Valley Institutional Review Board (protocol code IRB-24-0454, approved on 20 December 2024).

Informed Consent Statement

Informed consent was obtained from all subjects involved in the study. Written informed consent has been obtained from the patients to publish this paper.

Data Availability Statement

The original contributions presented in this study are included in the article. Further inquiries can be directed to the corresponding author.

Conflicts of Interest

Co-author Dr. Gerrard Farrell was employed by the company Jomarg Innovation Ltd. The remaining authors declare that the research was conducted in the absence of any commercial or financial relationships that could be construed as a potential conflict of interest.

Abbreviations

The following abbreviations are used in this manuscript:
AIAsymmetry index
BMIBody mass index
MFMaximum force
MTHMetatarsal head
PPPPeak plantar pressure
PTIPressure–time integral
TMATransmetatarsal amputation

References

  1. Mueller, M.J.; Salsich, G.B.; Bastian, A.J. Differences in the gait characteristics of people with diabetes and transmetatarsal amputation compared with age-matched controls. Gait Posture 1998, 7, 200–206. [Google Scholar] [CrossRef] [Scilit] [PubMed]
  2. Humphrey, J.A.; Kanthasamy, S.; Coughlin, P.; Coll, A.P.; Robinson, A.A.H. Outcome of trans-metatarsal amputations in patients with diabetes mellitus. Foot 2019, 40, 22–26. [Google Scholar] [CrossRef] [Scilit] [PubMed]
  3. Mueller, M.J.; Sinacore, D.R. Rehabilitation factors following transmetatarsal amputation. Phys. Ther. 1994, 74, 1027–1033. [Google Scholar] [CrossRef] [Scilit] [PubMed]
  4. Moore, J.W. Prostheses, Orthoses, and Shoes for Partial Foot Amputees. Clin. Podiatr. Med. Surg. 1997, 14, 775–783. [Google Scholar] [CrossRef] [Scilit]
  5. Mueller, M.J.; Strube, M.J.; Allen, B.T. Therapeutic footwear can reduce plantar pressures in patients with diabetes and transmetatarsal amputation. Diabetes Care 1997, 20, 637–641. [Google Scholar] [CrossRef] [Scilit] [PubMed]
  6. Czerniecki, J.M.; Littman, A.J.; Landry, G.; Norvell, D.C. Risks and Risk Factors for Contralateral Amputation in Patients who have Undergone Amputation for Chronic Limb Threatening Ischaemia. Eur. J. Vasc. Endovasc. Surg. 2022, 64, 111–118. [Google Scholar] [CrossRef] [Scilit] [PubMed]
  7. Cavanagh, P.R.; Bus, S.A. Off-loading the diabetic foot for ulcer prevention and healing. J. Vasc. Surg. 2010, 52, 37S–43S. [Google Scholar] [CrossRef] [Scilit] [PubMed]
  8. Bus, S.A. Preventing foot ulcers in diabetes using plantar pressure feedback. Lancet Digit. Health 2019, 1, e250–e251. [Google Scholar] [CrossRef] [Scilit] [PubMed]
  9. Armstrong, D.G.; Lavery, L.A. Plantar pressures are higher in diabetic patients following partial foot amputation. Ostomy Wound Manag. 1998, 44, 30–32, 34, 36. [Google Scholar]
  10. Kelly, V.E.; Mueller, M.J.; Sinacore, D.R. Timing of peak plantar pressure during the stance phase of walking. A study of patients with diabetes mellitus and transmetatarsal amputation. J. Am. Podiatr. Med. Assoc. 2000, 90, 18–23. [Google Scholar] [CrossRef] [Scilit] [PubMed]
  11. Mueller, M.J.; Strube, M.J. Therapeutic footwear: Enhanced function in people with diabetes and transmetatarsal amputation. Arch. Phys. Med. Rehabil. 1997, 78, 952–956. [Google Scholar] [CrossRef] [Scilit] [PubMed]
  12. Ledoux, W.R.; Shofer, J.B.; Cowley, M.S.; Ahroni, J.H.; Cohen, V.; Boyko, E.J. Diabetic foot ulcer incidence in relation to plantar pressure magnitude and measurement location. J. Diabetes Complicat. 2013, 27, 621–626. [Google Scholar] [CrossRef] [Scilit] [PubMed]
  13. Chatwin, K.E.; Abbott, C.A.; Boulton, A.J.M.; Bowling, F.L.; Reeves, N.D. The role of foot pressure measurement in the prediction and prevention of diabetic foot ulceration-A comprehensive review. Diabetes Metab. Res. Rev. 2020, 36, e3258. [Google Scholar] [CrossRef] [Scilit] [PubMed]
  14. Heino, D.; Telfer, S.; Nagle-Christensen, A.; Ledoux, W.R.; Muir, B.C. Quantifying differences in high-pressure region mapping between dynamic in-shoe and barefoot plantar pressure in diabetic subjects. J. Biomech. 2026, 199, 113201. [Google Scholar] [CrossRef] [Scilit] [PubMed]
  15. Lockhart, M.; Dinneen, S.F.; O’Keeffe, D.T. Plantar pressure measurement in diabetic foot disease: A scoping review. J. Diabetes Investig. 2024, 15, 990–999. [Google Scholar] [CrossRef] [Scilit] [PubMed]
  16. Arts, M.L.J.; Bus, S.A. Twelve steps per foot are recommended for valid and reliable in-shoe plantar pressure data in neuropathic diabetic patients wearing custom made footwear. Clin. Biomech. 2011, 26, 880–884. [Google Scholar] [CrossRef] [Scilit] [PubMed]
  17. Tang, S.F.T.; Chen, C.P.C.; Chen, M.J.L.; Chen, W.P.; Leong, C.P.; Chu, N.K. Transmetatarsal amputation prosthesis with carbon-fiber plate: Enhanced gait function. Am. J. Phys. Med. Rehabil. 2004, 83, 124–130. [Google Scholar] [CrossRef] [Scilit] [PubMed]
Figure 1. Regional distribution of peak in-shoe plantar pressure in the transmetatarsal amputation (TMA) limb for Participant 1 and Participant 2. Mean peak plantar pressure (kPa) is shown for the medial and lateral midfoot and rearfoot regions. Values displayed on the foot schematic are rounded to the nearest kPa; exact numerical values are reported in Table 2. Arrows indicate regions where peak plantar pressure is higher in Participant 2 (contralateral transtibial prosthesis) compared to Participant 1 (intact contralateral limb).
Prosthesis 08 00091 g001
Figure 2. Step-level peak plantar pressure (PPP) across 25 analyzed steps for Participant 1 (intact contralateral limb) and Participant 2 (contralateral transtibial prosthesis) in the (A) lateral midfoot, (B) medial midfoot, (C) lateral rearfoot, and (D) medial rearfoot regions. Individual symbols represent regional PPP values for each analyzed step. Horizontal lines indicate the corresponding mean across the 25 steps (solid gray, Participant 1; dashed red, Participant 2).
Prosthesis 08 00091 g002
Figure 3. Step-level pressure–time integral (PTI) across 25 analyzed steps for Participant 1 (intact contralateral limb) and Participant 2 (contralateral transtibial prosthesis) in the (A) lateral midfoot, (B) medial midfoot, (C) lateral rearfoot, and (D) medial rearfoot regions. Individual symbols represent regional PTI values for each analyzed step. Horizontal lines indicate the corresponding mean across the 25 steps (solid gray, Participant 1; dashed red, Participant 2).
Prosthesis 08 00091 g003
Figure 4. Step-level maximum force (MF) across 25 analyzed steps for Participant 1 (intact contralateral limb) and Participant 2 (contralateral transtibial prosthesis) in the (A) lateral midfoot, (B) medial midfoot, (C) lateral rearfoot, and (D) medial rearfoot regions. Individual symbols represent regional MF values for each analyzed step. Horizontal lines indicate the corresponding mean across the 25 steps (solid gray, Participant 1; dashed red, Participant 2).
Prosthesis 08 00091 g004
Figure 5. Regional distribution of peak in-shoe plantar pressure for the transmetatarsal amputation (TMA) limb and intact limb in Participant 1. Mean peak plantar pressure (kPa) is shown for anatomically corresponding plantar regions in both limbs, with forefoot and toe regions displayed for the intact limb only. Values displayed on the foot schematic are rounded to the nearest kPa; exact numerical values are reported in Table 3. Arrows indicate regions where peak plantar pressure is higher in the TMA limb relative to the intact limb.
Prosthesis 08 00091 g005
Table 1. Clinical characteristics of the two participants included in this exploratory case-comparison study. Both participants underwent left transmetatarsal amputation (TMA) secondary to diabetic foot complications. Participant 1 had an intact contralateral limb, whereas Participant 2 had a contralateral transtibial amputation and ambulated with a transtibial prosthesis at the time of testing.
VariableParticipant 1Participant 2
GenderMaleMale
Age (years)6762
BMI (kg/m2)28.230.9
Date of left TMAMay 2024May 2017
Contralateral limbIntactTranstibial prosthesis
Contralateral transtibial amputation-2018
NeuropathyStage 2–3Stage 4
Tendon balancing procedureNoNo
BMI: body mass index.
Table 2. Comparison of in-shoe plantar pressure outcomes in the transmetatarsal amputation (TMA) limb between two participants with different contralateral limb status. Both participants had a left-sided TMA. Participant 1 had an intact contralateral limb, whereas Participant 2 had a contralateral transtibial amputation.
OutcomesFoot RegionsParticipant 1Participant 2% Difference
Peak Plantar Pressure (kPa)Medial midfoot82.2 (23.3)138.3 (56.1)+68.2%
Lateral midfoot80.6 (23.5)126.8 (50.6)+57.3%
Medial rearfoot56.5 (11.1)109.0 (46.6)+92.9%
Lateral rearfoot65.9 (9.2)94.3 (37.3)+43.1%
Pressure–Time Integral (kPa-s)Medial midfoot36.6 (20.8)18.9 (20.8)−48.4%
Lateral midfoot39.1 (20.3)20.4 (25.1)−47.8%
Medial rearfoot22.5 (15.6)15.2 (18.2)−32.4%
Lateral rearfoot31.5 (19.2)13.2 (15.6)−58.1%
Maximum Force (N)Medial midfoot109.0 (29.3)216.9 (97.3)+99.0%
Lateral midfoot112.7 (31.1)189.6 (86.3)+68.3%
Medial rearfoot77.4 (17.9)142.2 (71.2)+83.7%
Lateral rearfoot74.9 (15.9)105.3 (57.9)+40.6%
Data are reported as mean (standard deviation) across analyzed steps. Foot regions were defined relative to the residual foot anatomy, with no distal forefoot mask present due to amputation. Percentage differences were calculated relative to Participant 1. Positive values indicate greater loading in Participant 2, whereas negative values indicate lower loading.
Table 3. Comparison of regionally resolved in-shoe plantar pressure outcomes between the transmetatarsal amputation (TMA) limb and the intact limb in Participant 1.
OutcomesFoot RegionsLeft Foot (TMA)Right Foot (Intact)AI
Peak Plantar Pressure (kPa)Toe 1-40.3 (18.1)-
Toe 2–5-52.5 (36.5)-
MTH 1-81.8 (40.8)-
MTH 2–5-73.9 (20.9)-
Medial midfoot82.2 (23.3)55.5 (5.5)+38.8%
Lateral midfoot80.6 (23.5)51.4 (5.1)+44.1%
Medial rearfoot56.5 (11.1)80.7 (14.1)−35.3%
Lateral rearfoot65.9 (9.2)84.9 (14.2)−25.1%
Pressure–Time Integral (kPa-s)Toe 1-12.8 (11.1)-
Toe 2–5-15.8 (16.5)-
MTH 1-34.1 (21.7)-
MTH 2–5-34.1 (18.6)-
Medial midfoot36.6 (20.8)21.8 (13.8)+50.6%
Lateral midfoot39.1 (20.3)21.7 (14.1)+57.3%
Medial rearfoot22.5 (15.6)37.3 (24.7)−50.9%
Lateral rearfoot31.5 (19.2)40.5 (25.1)−25.0%
Maximum Force (N)Toe 1-8.9 (5.2)-
Toe 2–5-24.9 (23.3)-
MTH 1-50.9 (27.7)-
MTH 2–5-93.5 (38.5)-
Medial midfoot109.0 (29.3)35.4 (11.2)+102.0%
Lateral midfoot112.7 (31.1)32.4 (8.1)+110.6%
Medial rearfoot77.4 (17.9)107.4 (22.1)−32.3%
Lateral rearfoot74.9 (15.9)104.2 (23.6)−32.7%
Data are reported as mean (standard deviation) across analyzed steps. A dash (-) indicates regions that were absent due to amputation and therefore not analyzed. Asymmetry indices (AI) were calculated for anatomically corresponding regions using a normalized difference approach. Positive AI values indicate greater loading in the TMA limb, whereas negative values indicate greater loading in the intact limb. Analyses were restricted to anatomically comparable regions present in both limbs. Toe 1 represents the hallux; toes 2–5 represent the lesser toes; MTH 1 corresponds to the first metatarsal head; and MTH 2–5 correspond to the combined region of the second through fifth metatarsal heads.
Disclaimer/Publisher’s Note: The statements, opinions and data contained in all publications are solely those of the individual author(s) and contributor(s) and not of MDPI and/or the editor(s). MDPI and/or the editor(s) disclaim responsibility for any injury to people or property resulting from any ideas, methods, instructions or products referred to in the content.