Article

Finite Element Optimization of 3D Abiotic Glucose Fuel Cells for Implantable Medical Devices

by
Cong Ma
1,
Elizabeth Gibson
2,
Mirella Di Lorenzo
3 and
Patrick Degenaar
1,*
1
School of Engineering, Newcastle University, Newcastle Upon Tyne NE1 7RU, UK
2
School of Natural and Environmental Sciences, Newcastle University, Newcastle Upon Tyne NE1 7RU, UK
3
Department of Chemical Engineering, University of Bath, Bath BA2 7AY, UK
*
Author to whom correspondence should be addressed.
Prosthesis 2025, 7(6), 136; https://doi.org/10.3390/prosthesis7060136
Submission received: 29 August 2025 / Revised: 17 October 2025 / Accepted: 21 October 2025 / Published: 30 October 2025

Abstract

As the world’s population ages, the incidence of chronic disorders is on the rise. Active Implantable Medical Devices are, therefore, evolving to meet the challenge. As the size of these devices decreases to facilitate implantation, the challenge of providing stable, continuous power becomes significant. Lithium batteries provide reliable, stable power to implants; however, their miniaturization leads to a reduction in the stored energy capacity, total lifespan, and overall capability. Consequently, there is a need for on-body energy harvesting alternatives. This study utilizes literature data on abiotic glucose fuel cells to feed into a finite element model incorporating both diffusion and reaction aspects to investigate how the 3D macro-architecture of the fuel cell device can be used to optimize the energy output. Accordingly, optimal 3D architectures are determined to enable power outputs ranging from several tens of microwatts to one hundred microwatts from an implantable package. This will help with the 3D architecture design of future similar abiotic fuel cell units and speed up the process of figuring out the best settings for key parameters (like shape, size, and separation).

1. Introduction

Owing to their capacity to manage chronic conditions, mitigate acute medical events, and enhance patients’ quality of life, the prevalence and clinical significance of Active Implantable Medical Devices (AIMDs) continue to increase [1]. This is particularly the case as the world population ages, which is increasing the rate of chronic ailments. The basic principle of these devices is to use electrical currents to stimulate nerves [2], nerve bundles [3], or muscle tissue [4]. Some devices integrate sensors [5] and/or have drug-release systems [6]. Although the field has been in mature clinical use for decades, bioelectronic medicine continues to evolve thanks to technological advances in multiple disciplines.
Current applications are varied and include pacemakers [7], cochlear implants [8], deep brain stimulators [9], and functional neural modulators such as bladder control [10]. A further application variant is the emerging field of bioelectronic medicine, which aims to stimulate the peripheral nervous system and provide therapeutic benefits to those with chronic disorders such as neuroinflammatory disease and diabetes [11,12].
All these applications are continuously evolving. However, a historic challenge for all implantable devices has been power provision. The average (i.e., pulsed power divided by total time) power requirements for these applications vary from approximately 10 μW for cardiac pacemakers [13] to milliwatts for sensory prosthetics [14], as per Table 1 below and illustrated in Figure 1.
Batteries commonly used in cardiac pacemakers generally have a life expectancy of 7–10 years [17,18]. Once the battery starts to run out, the patient has to undergo surgery for replacement. This poses risks to the patients while increasing the costs to the healthcare systems. Rechargeable medical batteries tend to have a 3× lower per-volume capacity than non-rechargeable ones [19]. This means that the lifetime of a rechargeable battery is significantly shorter than that of a non-rechargeable battery of the same volume. Furthermore, as part of medical device risk assessment, a key question is “What if the patient/clinician forgets to recharge the battery?”
Current implantable electronic medical devices utilize non-rechargeable batteries with volumes between tens of mm3 (µL) to tens of cm3 (mL) and a capacity of ~1041 Wh L−1 (Li/I2 battery system) [19]. However, commercially available implantable and medical-grade batteries typically have a lower capacity of approximately 750 Wh L−1 [20]. Additionally, there is an edge effect, as the battery must be encapsulated in its pressure chamber, which increases its volume.
To provide a comparison, Table 1 summarizes different power use cases from less than 10 µW to greater than 10 mW with varying battery volumes to explore the impact on lifetime.
Various alternatives to lithium batteries have been explored and/or utilized to address the energy demands of bioelectronics, such as thermal and mechanical energy scavenging from the human body, fuel cells [21,22], nuclear batteries [23,24,25], or direct power transfer [26], yielding power in the nW–µW range and using local energy storage for when the person is sleeping (no motion, darkness). Amongst these options, biological fuel cells are particularly attractive. For these systems, key fuel sources explored are urea [27] and glucose [22].
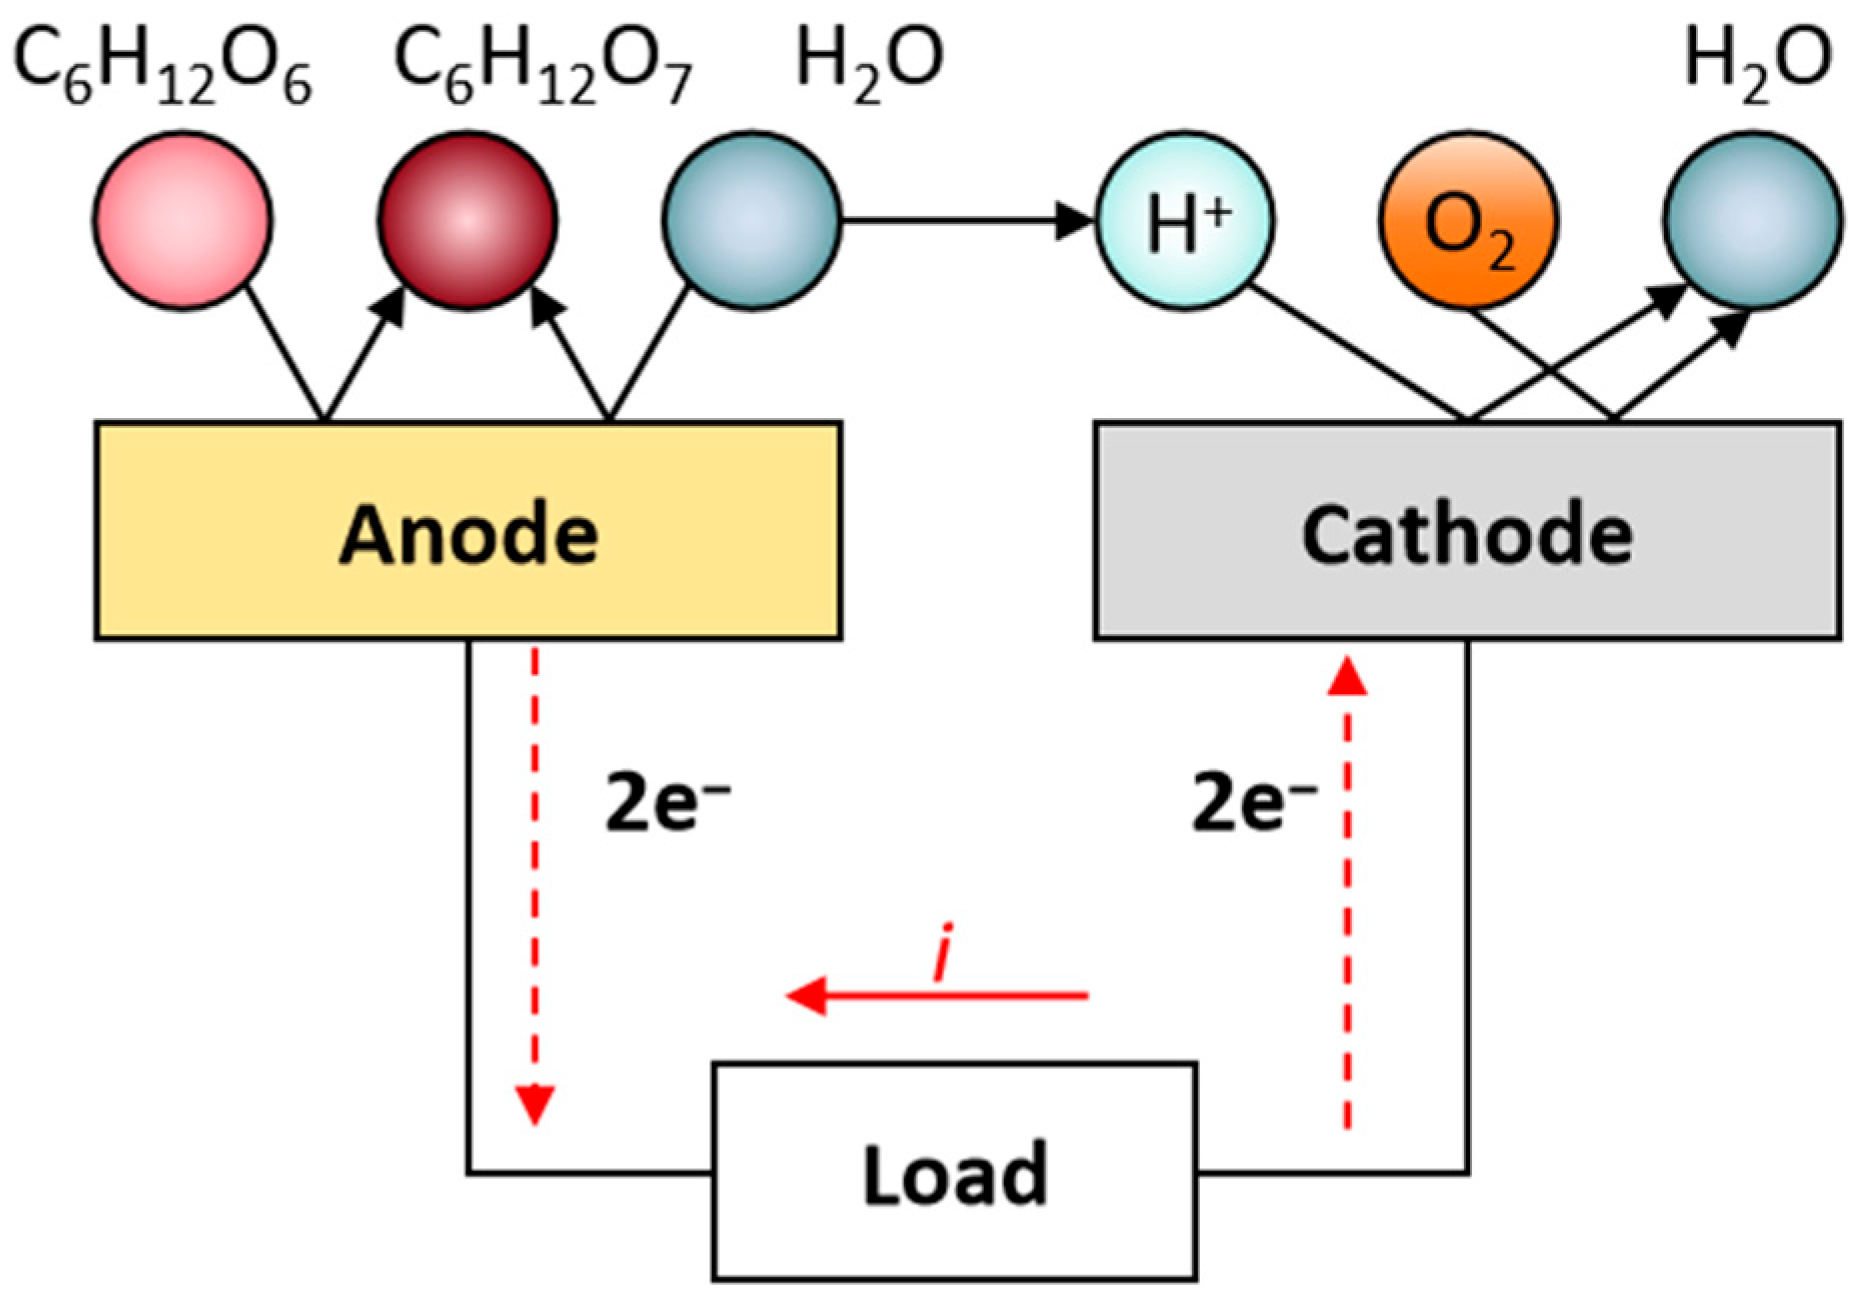
In the human body, glucose undergoes a cascade of biocatalytic reactions until complete oxidation to carbon dioxide and water, releasing a total of 24 electrons. To harvest energy, glucose fuel cells grab a portion of the electrons released from these oxidation reactions with an electrode (the anode) connected through an electrical circuit to a counter electrode (the cathode), as shown in Figure 2. For implantable applications, fuel cells can utilize enzymes (enzymatic fuel cells), inorganic catalysts (abiotic fuel cells), or a combination of both (hybrid fuel cells).
Typically, a partial oxidation occurs with the release of two electrons at the anode.
A n o d e : C 6 H 12 O 6 + H 2 O C 6 H 12 O 7 + 2 H + + 2 e  
C a t h o d e : 1 2 O 2 + 2 H + + 2 e H 2 O
O v e r a l l : C 6 H 12 O 6 + 1 2 O 2 C 6 H 12 O 7
Few in vivo tests of enzymatic and hybrid systems have been reported, including implantation in a living organism such as lobsters [28], clams [29], mice [30], and a female Blaberus [31]. Nonetheless, the instability and short lifespan of enzymes seriously challenge the use of enzymatic fuel cells in implantable applications and confine their use to short-term applications, e.g., disposable sensor patches.
By contrast, the use of an abiotic catalyst can enable longer and stable lifetimes.
In this case, the catalytic activity is a function of the 3D nanostructure of the electrode, which maximizes the exposed catalytic active sites per unit area. Typical nanostructures used in abiotic glucose fuel cells include metals such as Au [32], Pt [33], and Pd [34] (pure or combined), as well as carbon-based and composite materials including conductive polymers [35]. Particularly effective is the use of gold nanostructures. In 2020, Gonzalez-Solino et al. [36] used porous gold as the anode and a platinum–gold alloy as the cathode in acute experiments, achieving a maximum power output of 143 nW mm−2 (800 nW whole cell) at a glucose concentration of 6 mmol L−1 in vitro.
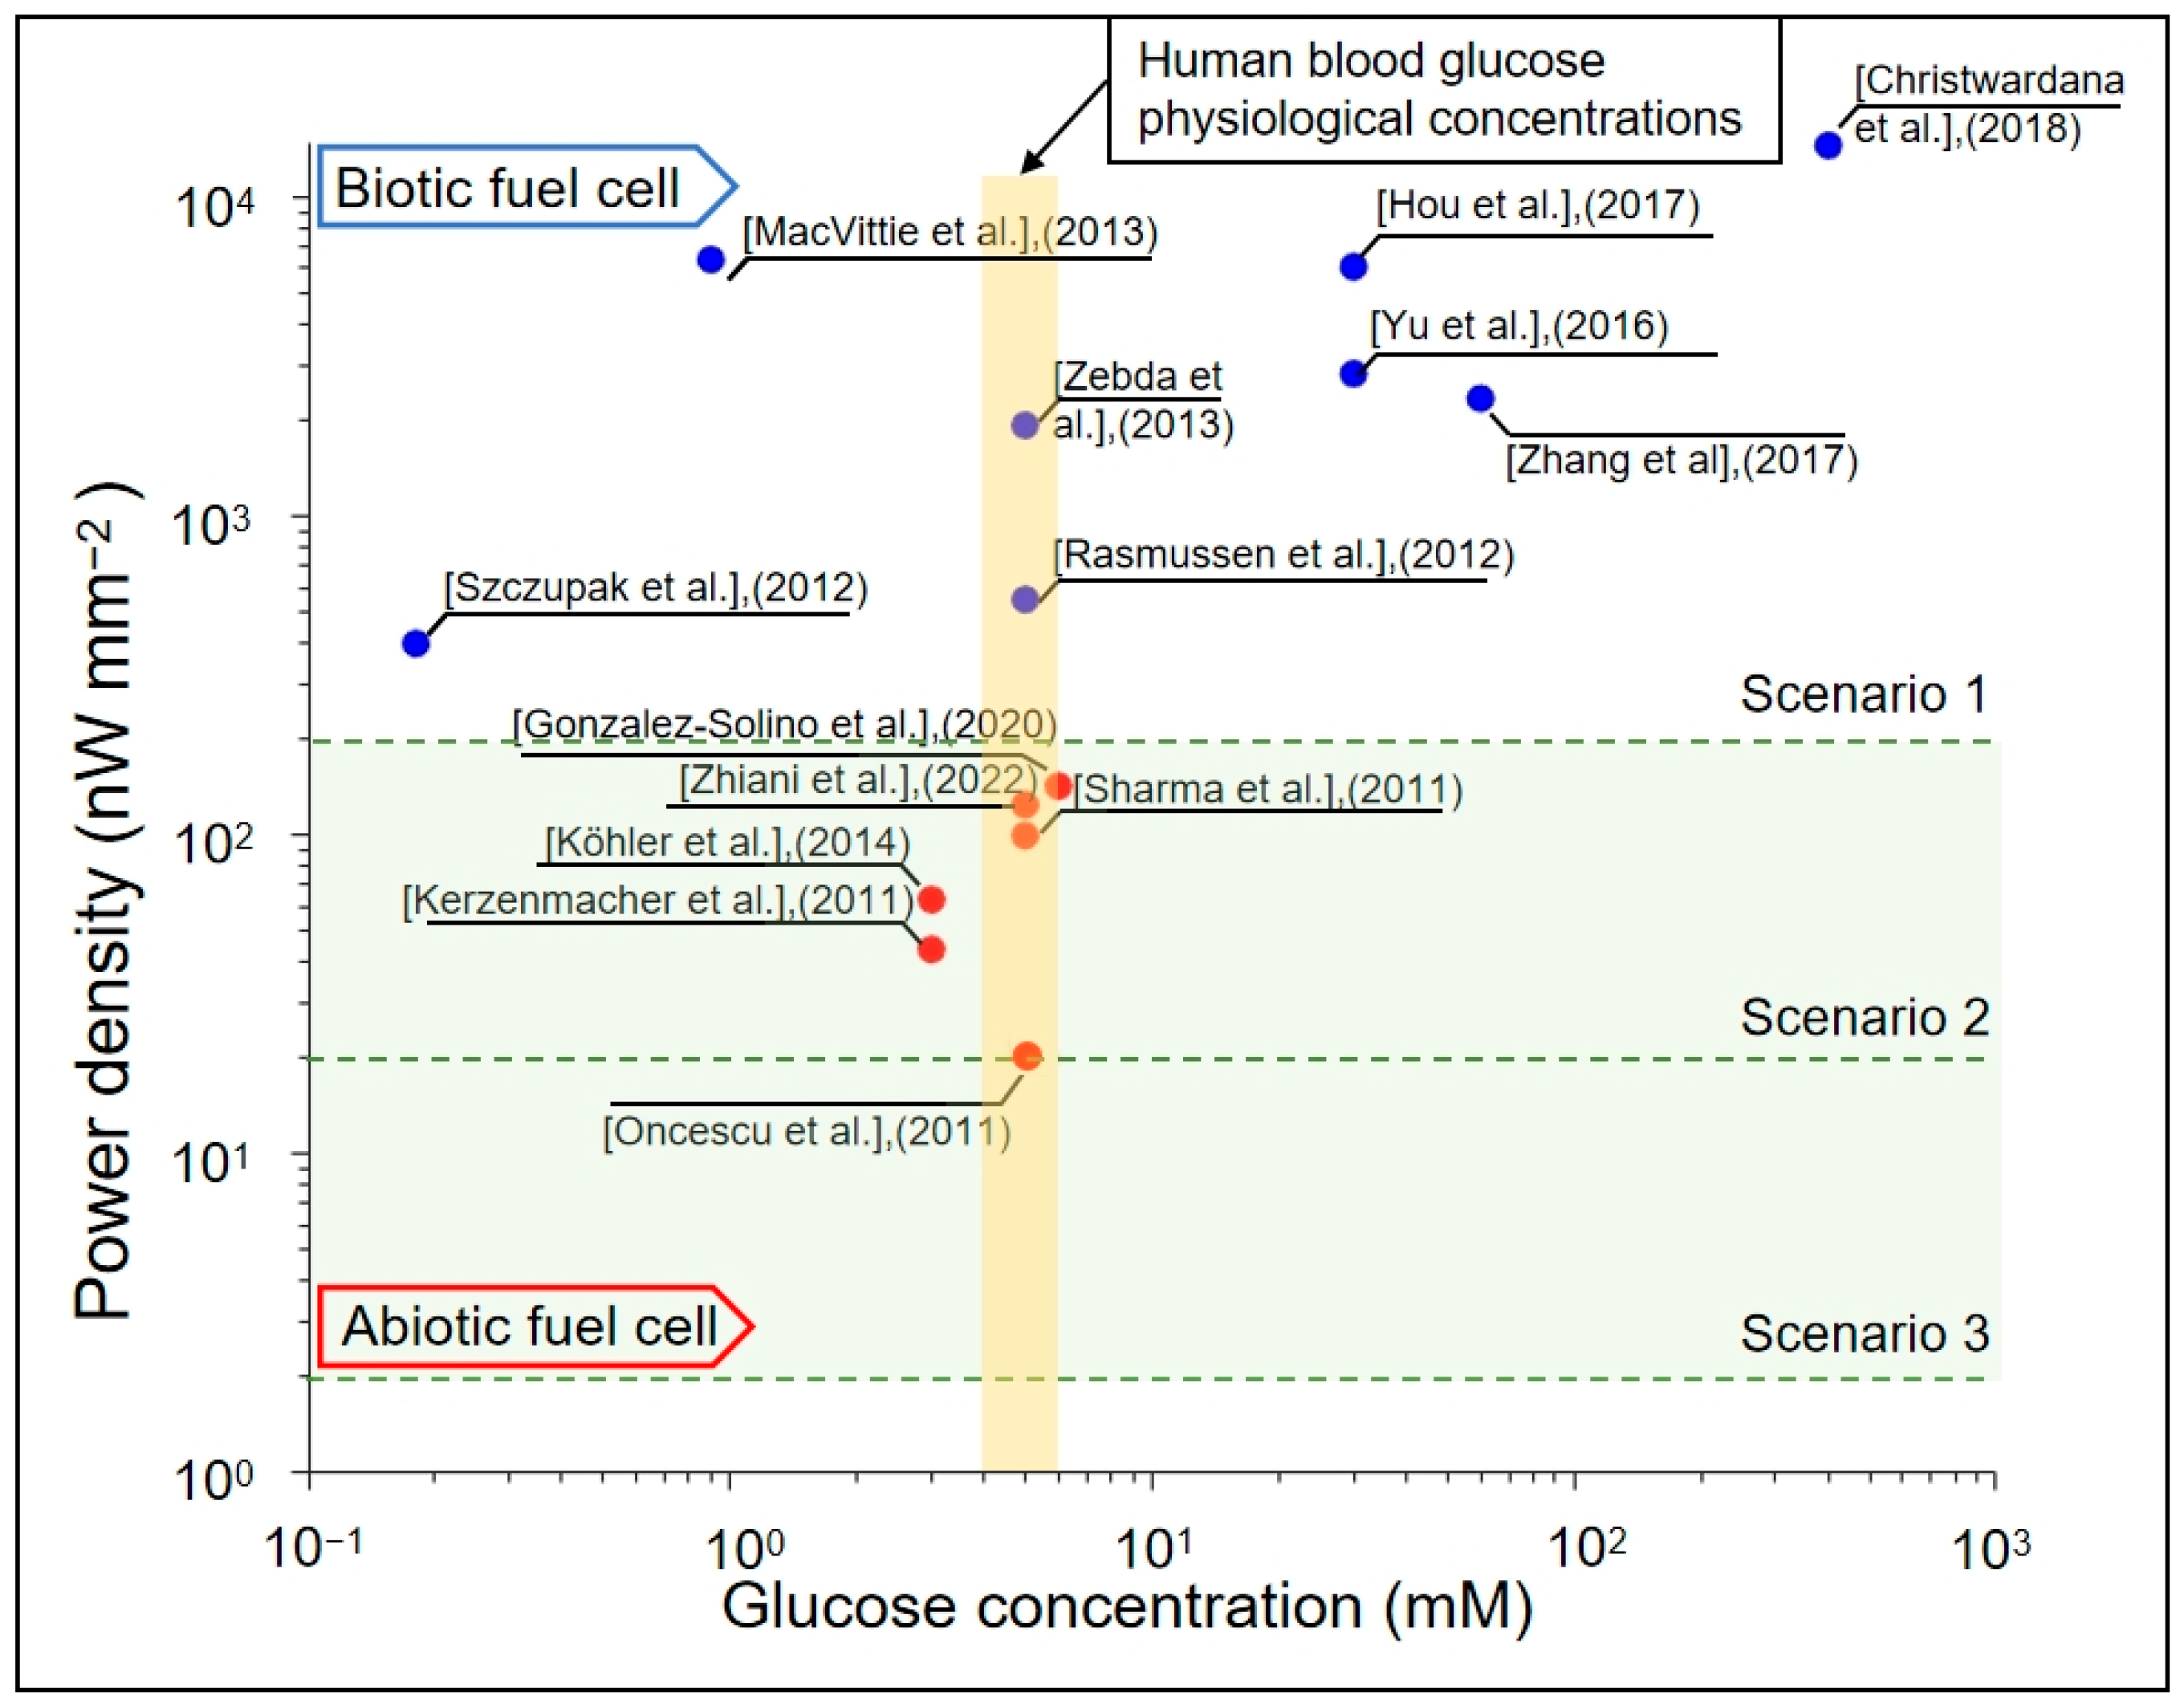
Figure 3 compares the power density recently reported with both enzyme-based (blue) and abiotic (red) fuel cells (these data include both in vivo and in vitro). However, an exhaustive discussion of the literature is beyond the scope of this article.
The data is grouped according to the range of power generated: (1) high, 200 nW mm−2; (2) medium, 20 nW mm−2; and (3) low, 2 nW mm−2. As shown, enzymatic fuel cells generate the highest power, given the high specificity of enzymes. It is worth noting that several studies refer to impractically high glucose concentrations, which are up to two orders of magnitude higher than the typical levels in physiological fluids.
Based on the power densities of the three scenarios, finite element modeling was conducted to evaluate the effects of electrode geometry and design on power output in abiotic glucose fuel cells. A “finger-crossed” configuration was employed to enhance substance transfer between the anode and cathode, thereby improving power generation efficiency. To increase voltage output within thermodynamic constraints, multiple units were electrically connected in a stacked arrangement. This study, therefore, focuses on determining the optimal 3D arrangement of such units. The resulting easy-to-manufacture model will also facilitate the optimization of key design parameters of future similar models, including unit shape, size, with or without a diffusion cavity, and unit separation.

2. Methodology

2.1. Simulation Setup

In this study, COMSOL finite element modeling (FEM) was used to optimize the design of an abiotic glucose fuel cell unit and the creation of 3D stacks. Our ultimate objective is to determine how different architectures generate different power levels.
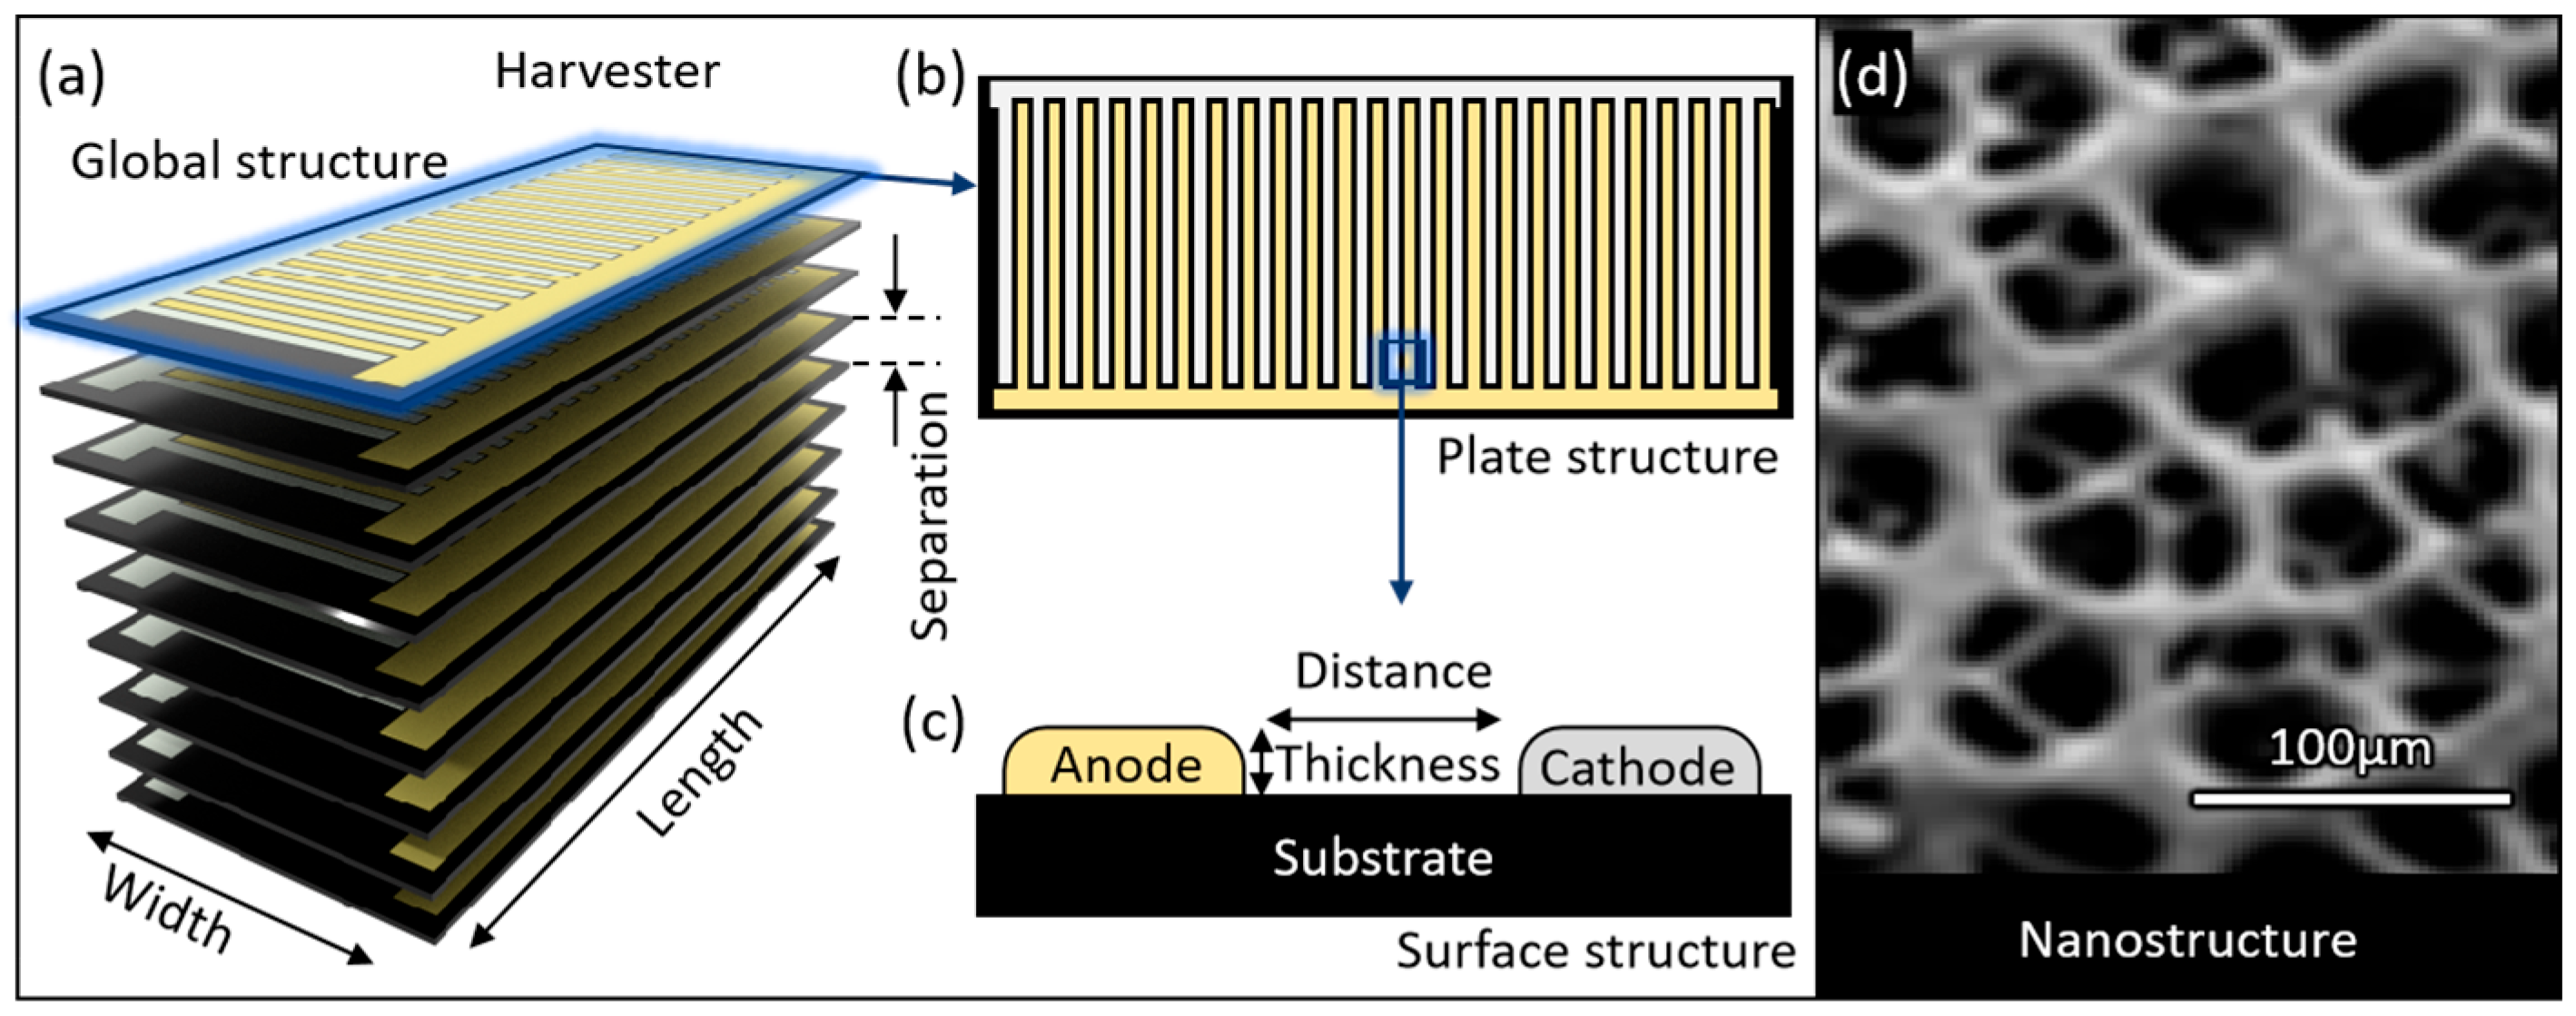
The design of the fuel cell unit consisted of shape, electrode dimensions, electrode distance, unit dimensions, and unit diffusion cavity dimensions. The specific design was considered as per Figure 4a–c. In this design process, only parameters such as unit dimensions and diffusion cavity dimensions were adjusted within the specified range. However, it should be noted that we envisage the fuel as per Figure 4, with a reaction surface consisting of, perhaps, interdigitated anode (e.g., gold) and cathode (e.g., platinum) in a nanostructured form as per Figure 4d to ensure catalysis [36].
The simulation then considered the arrangement of these fuel cell units into 3D structures, as shown in Figure 4a, including factors such as the number of units and the separation between units.
In the modeling, the surface reaction rates were set considering the groups in Figure 5. In the separation between units, the concentrations of glucose and oxygen are determined by the interaction between surface reactions and diffusion. Surface reactions consume concentrations, while diffusion replenishes them, as shown in Figure 5c.
COMSOL V6.0 with the Transport of Diluted Species Toolbox was used for the finite element analysis modeling. We manually incorporated the equations used, summarized in Table 2. The following hypotheses were used in the modeling:
  • Blood glucose typically ranges between 3.9 and 6.9 mM, while diffusion into interstitial fluid reduces availability by ~25–30%. Physiological dissolved oxygen in plasma is low (~0.05–0.1 mM), with the majority carried bound to hemoglobin (~9 mM equivalent). In highly vascularized regions, however, hemoglobin unloading continually replenishes the dissolved fraction. Accordingly, we assumed half the arterial oxygen content as an optimistic, perfusion-supported boundary condition to prevent artificial oxygen limitation and to focus on geometric effects. In less-perfused tissues, absolute power would be reduced, but the identified structural trends (optimal spacing, stacking, and geometry) remain valid. We, therefore, set fixed concentrations of 5 mMol L−1 glucose and 4.5 mMol L−1 oxygen at the boundaries of our simulation to be consistent with typical tissue fluid conditions [47,48,49,50].
  • The fuel cells are operated at body temperature, 310.15 K.
  • The mesh grid was set to ‘extremely fine’.
  • The central diffusion cavities do not act as sources of glucose or oxygen but rather serve solely as diffusion pathways.
  • Surface reaction rate (RR).
As shown in Figure 5a,b, the 3D structure is assumed to have a single-sided reaction surface. The reaction rate (RR) can then be modeled as a function of glucose and oxygen concentrations, as described in Equation (4).
R R = k · G l u · O 2 1 2
G l u and [ O 2 ] are the ratios of the real-time concentrations of glucose and oxygen, respectively, to their initial concentrations. At the cathode, O 2 and H 2 combine to form H 2 O as per the abiotic anode–cathode equations in Equation (2). As only 0.5 × O 2 molecules are required per glucose molecule, in conjunction with the Rate Law (for the basic reaction in which the reaction order is equal to its stoichiometric number), then [ O 2 ] 1 / 2 is defined in the rate equation.
k from Equation (4) is the reaction constant. We can derive this by working backward from the literature-reported power densities presented in Figure 3 and corresponding voltage values. The final result of the fuel cells is a current density J i ,   which, per definition, is given in Equation (5) below:
J i = P V
where   J i is current density, P is power density, and V is the operational voltage. We can then define the electron generation rate by dividing the charge generation rate by the charge constant (Equation (6)):
Φ e = J i e
where Φ e is the electron generation rate per unit area and e is the electron charge constant. From Equations (1) and (2), the glucose consumption rate equals half the electron generation rate (Equation (7)):
Φ g l u =   Φ e 2
where Φ g l u is the glucose consumption rate. Dividing this by Avogadro’s constant yields the molar rate of glucose consumption, defined here as the reaction constant k , with units of mol s−1m−2 (Equation (8)):
k   = Φ g l u A v = P V · 1 2 e A v
where A v is Avogadro’s constant. From Equation (8) above, it is possible to calculate k for each scenario (S): [S1, S2, S3] = [200, 20, 2] nW mm−2. Thus, [ k 1, k 2, k 3] = [2.5 × 10⁻⁶, 2.5 × 10⁻⁷, 2.5 × 10⁻⁸] (mol s−1m−2) are calculated and inserted into Table 2.
6.
Diffusion
At the boundaries of the simulation model, the concentrations of oxygen and glucose are assumed to be fixed at physiological levels. And glucose and oxygen enter the fuel cell only by diffusion to replenish concentrations. This diffusion model can be formulated as a vector diffusion flu × J (mol s−1m−2) flowing over a unit area per unit time interval and defined mathematically by Fick’s first law [51], as per Equation (9):
J = D × d φ d x
where d φ (for an ideal mixture) is the concentration gradient between mesh nodes and d x is the distance between the nodes. D is the diffusion coefficient. The diffusion coefficients were obtained from research papers by Wei Xing et al. [52] and Alexey N Bashkatov et al. [53] as D (glucose) = 0.96 × 10⁻⁹ m2/s (=0.96 × 10⁻³ mm2/s) and D (oxygen) = 3 × 10⁻⁹ m2/s (=3 × 10⁻³ mm2/s). These values have been provided in Table 2.
At the unit surface, glucose and oxygen diffuse from the tissue fluid to the electrode, where they are consumed by electrochemical reactions. As substrates are consumed at the unit surface, local reactant concentrations decrease, leading to a reduced reaction rate (Equation (4)). This depletion simultaneously increases the concentration difference with tissue fluid, thereby driving diffusive flux toward the surface (Equation (9)). Because the diffusion distance varies across the unit, an equilibrium between diffusion (supply) and surface reaction (consumption) establishes a concentration gradient along the unit surface.
7.
Integral analysis
COMSOL simulation takes into account reaction equations, concentration, and diffusion, ultimately leading to the distribution of glucose and oxygen concentrations and, thus, the distribution of reaction rates. These distributions are used to calculate the total current in Matlab according to Equation (10):
C u r r e n t = 2 · q · A v R R x , y d x d y
where q is the charge constant (1.602 × 10⁻¹⁹ C) and A v is Avogadro’s constant (6.02 × 10²³ mol−1). Finally, Equation (11) was used to calculate the power:
P o w e r = C u r r e n t   ·   V o l t a g e  
A previous study using nanoporous gold electrodes in abiotic glucose fuel cell reported an operating voltage of ~0.4 V, which serves as the assumed value for the voltage in this study [54]. Theoretically, the maximum voltage can reach ~1.2 V [55]. In practice, factors such as the stability of the electrode nanostructure and internal resistance may reduce the achievable power. Therefore, the final operating voltage typically fluctuates within ±0.2 V of the assumed value, depending on the specific architecture design. Nonetheless, the structural optimization identified here remains valid.

2.2. Structural Model

The initial niche for implantable fuel cells is expected to be in small, potentially injectable devices where traditional medical batteries may face limitations.
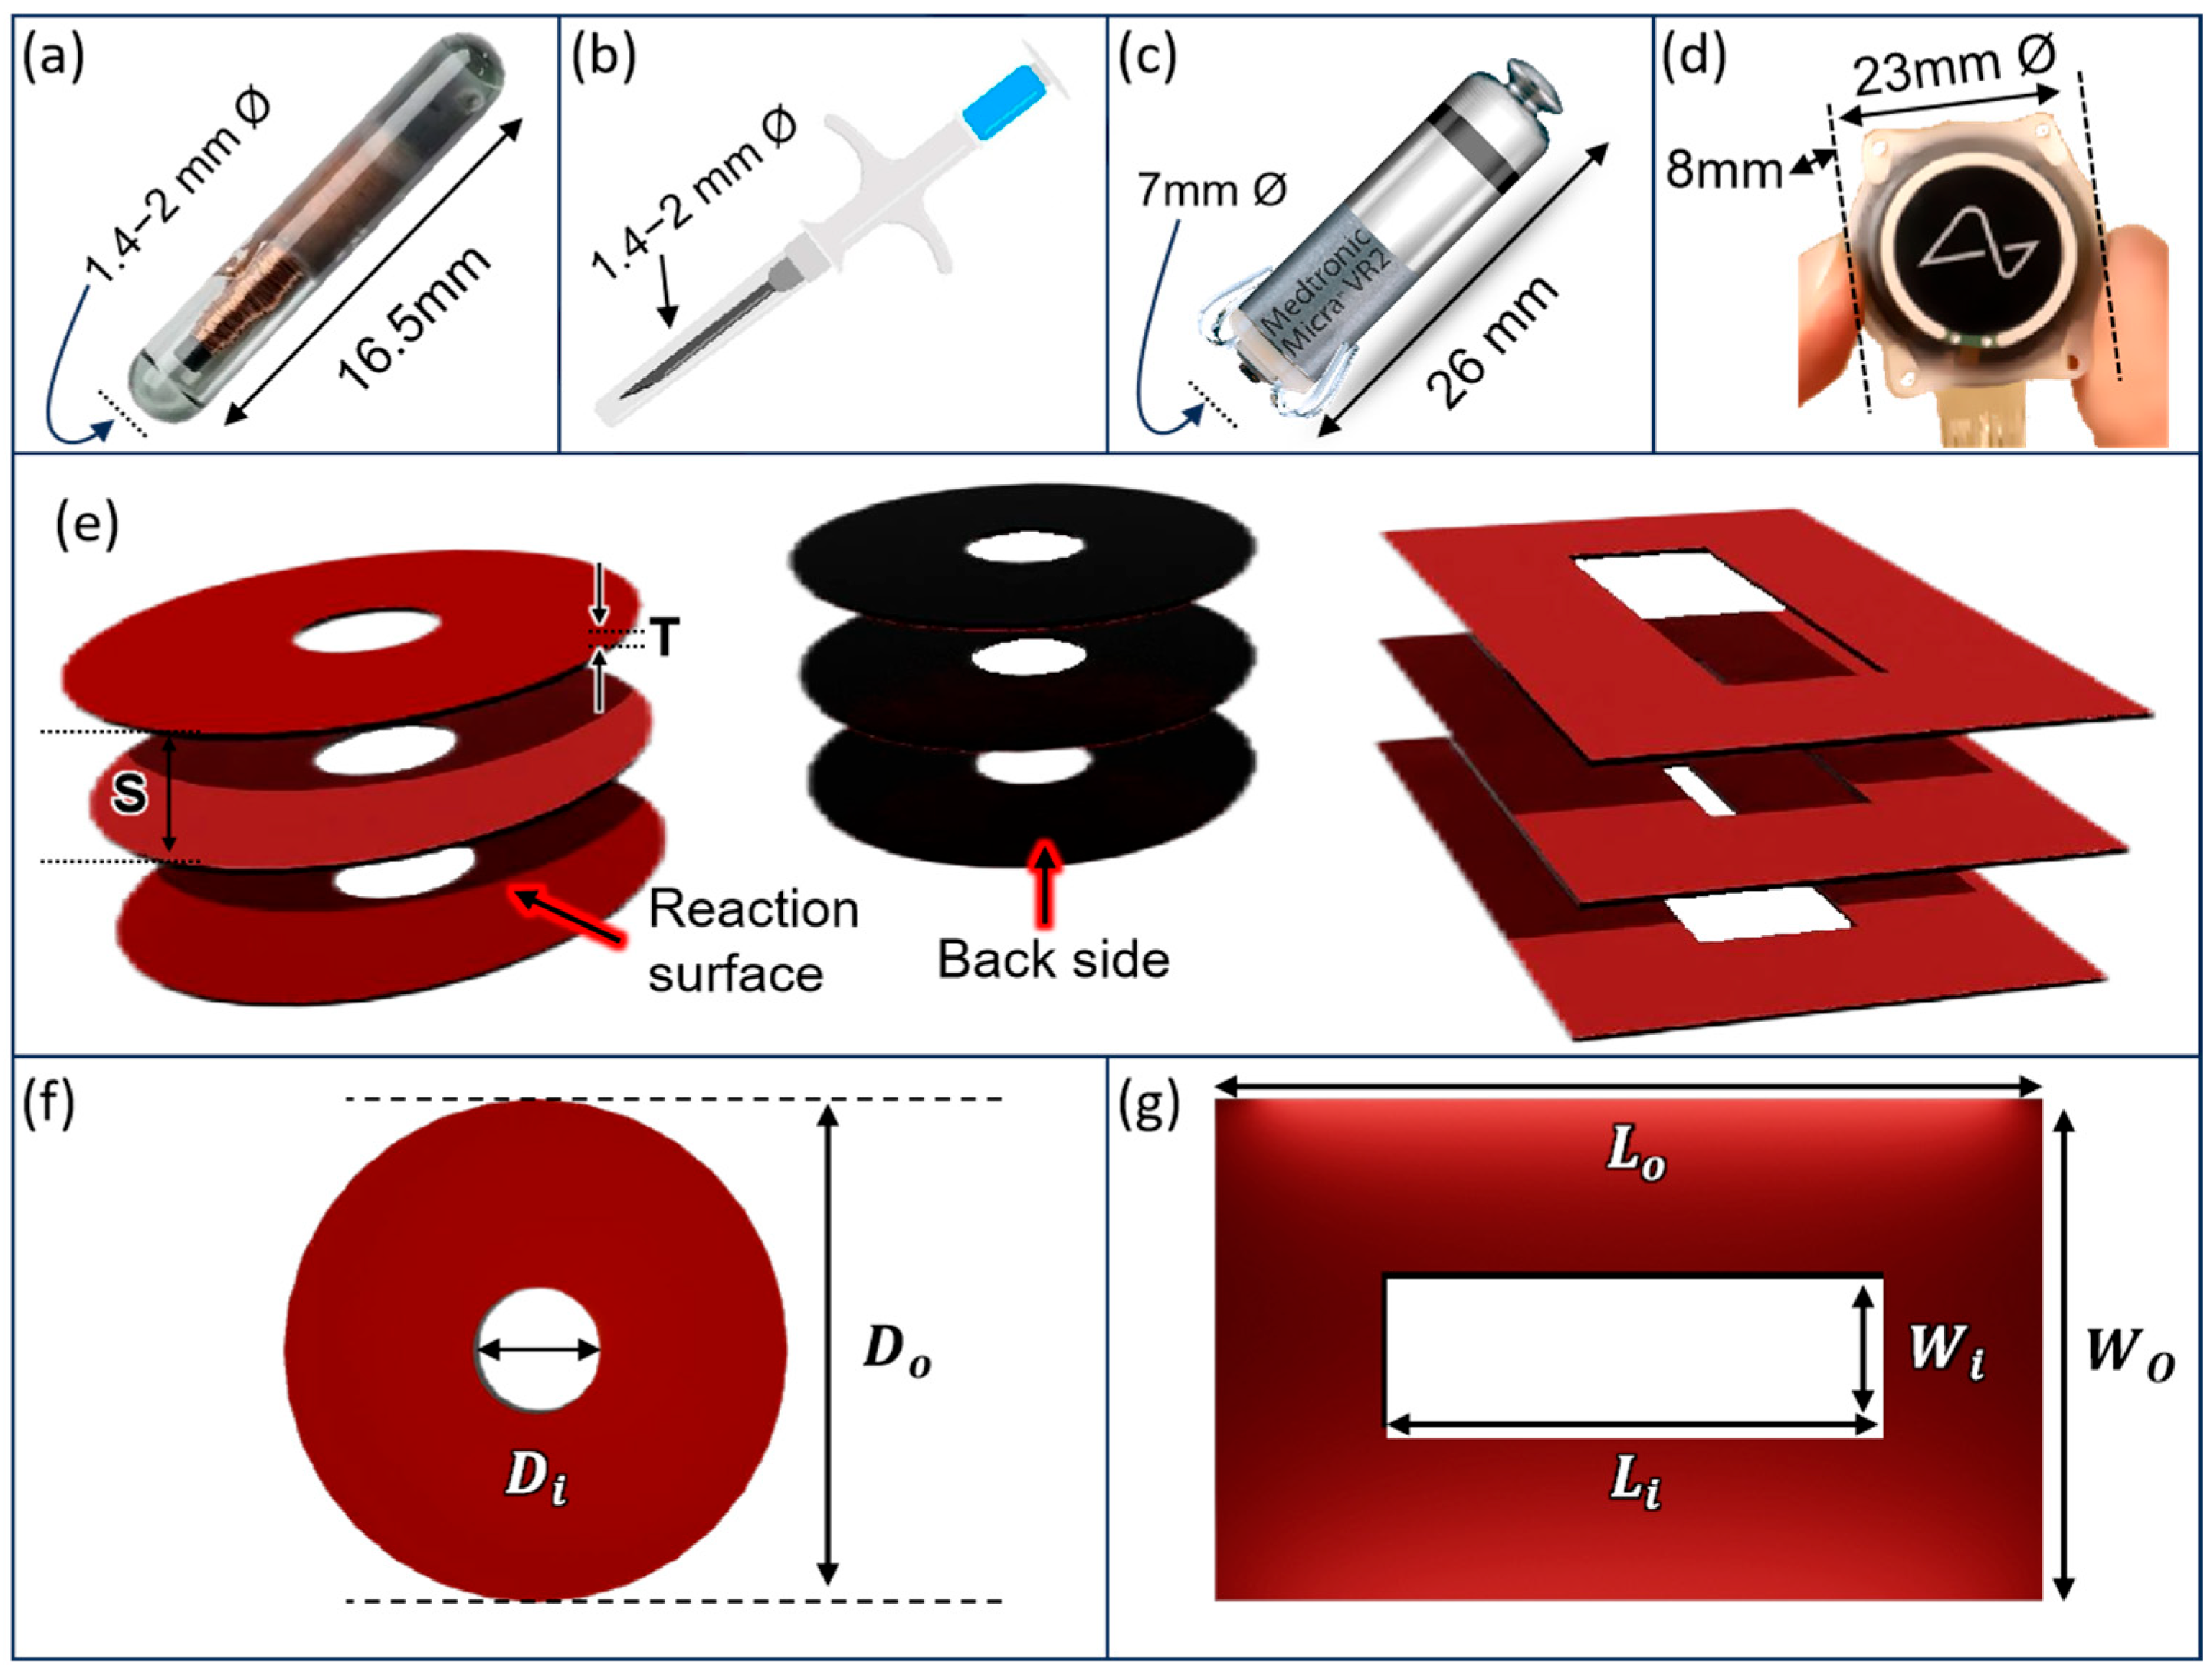
Four medical and veterinary domains can be considered to inform the dimensions of injectable devices. The first is the diameter range of commonly used intravenous catheters. These range from 0.6 mm in diameter (26 gauge) to 2 mm in diameter (14 gauge) [56]. Increasing in size are laparoscopic tools, which range from 2 mm to 12 mm in diameter (Ø) [57]. Animal radio frequency communication (RFC) tags, which are regularly injected into animals, can also be considered. These range from 1.25 mm Ø × 7 mm long to 3 mm Ø × 16.5 mm long [58]. Additionally, the dimensions of mini catheter-delivered cardiac pacemakers, such as the Abbott Nanostim (6 mm Ø × 42 mm long) and the Medtronic Micra (6.7 mm Ø × 25.9 mm long) [59], can be taken into account. These have been summarized in Figure 6.
Additionally, flat disc- or coin-shaped devices, such as those used for subcutaneous operations, can also be considered. For example, the Neuralink control unit is 23 mm Ø × 8 mm thick [60]. The Neuralink device consumes relatively high power. However, ultra-low-power applications that could utilize glucose energy scavenging could include drug release and passive biosensing (e.g., glucose and urea sensing).
These two cases are considered as shown in Figure 6 and Table 3. To constrain the range of possibilities, unit areas between 30 and 240 mm2 were selected, corresponding to the smallest and largest cases described above. The device length/thickness was fixed at 8 mm to match typical dimensions of disc-shaped devices and injectable tags. For the injectable case, the width was limited to 6 mm, aligning with the smallest and largest laparoscopic diameters. This approach compresses the simulation space while maintaining realistic dimensions.
The next consideration is the optimization of the implant volume. More units packed into the volume would increase total surface area and, thus, power. However, it would also reduce the distance between units and, thus, reduce diffusion of glucose and oxygen. As such, each unit is assumed to be 0.1 mm thick, corresponding to the thickness of a typical thin Si wafer while providing sufficient rigidity. Scenarios with unit separations between 0.01 mm and 7.9 mm are then considered.
The final consideration was whether a central diffusion cavity in the middle of a stack of units would be beneficial in the trade-off of diffusion vs. surface area. As such, both coin- and pill-shaped cases with cavities occupying 5%, 15%, 25%, and 35% of the total area were considered. These dimensions are illustrated in Figure 6 and detailed in Table 3.

3. Results

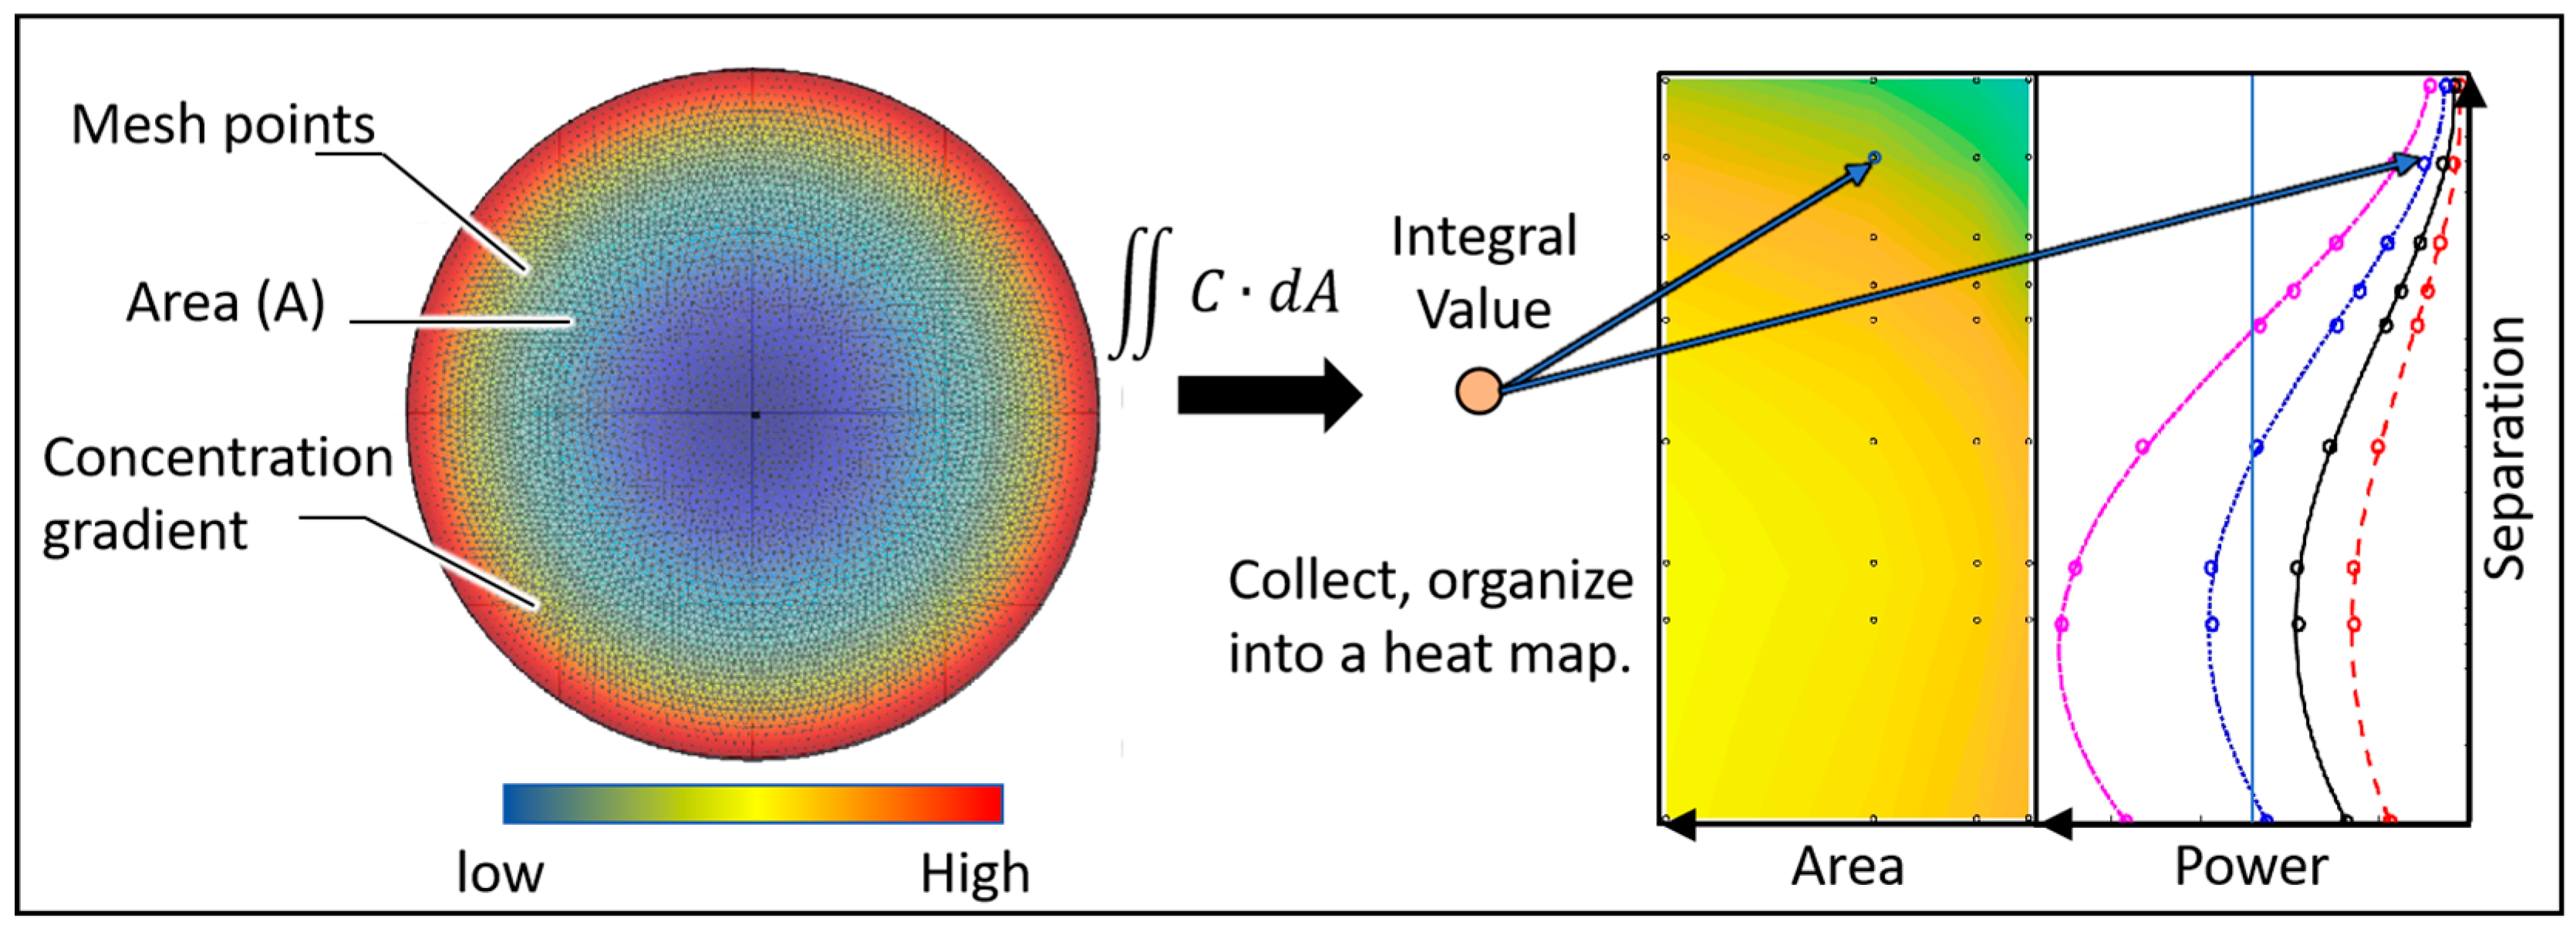
The experimental process of this study involved repeated testing under different scenarios, including the size and shape of the unit, the separation between units, and diffusion cavity sizes, in order to assess their impact on unit energy and stack energy. The data obtained was organized into heat maps and line graphs, as shown in Figure 7 (right). The highlighted areas in the heat map represent more power. The results of this study identify the optimal parameter combination for the model, which will be easy to manufacture.

3.1. Individual-Unit Devices

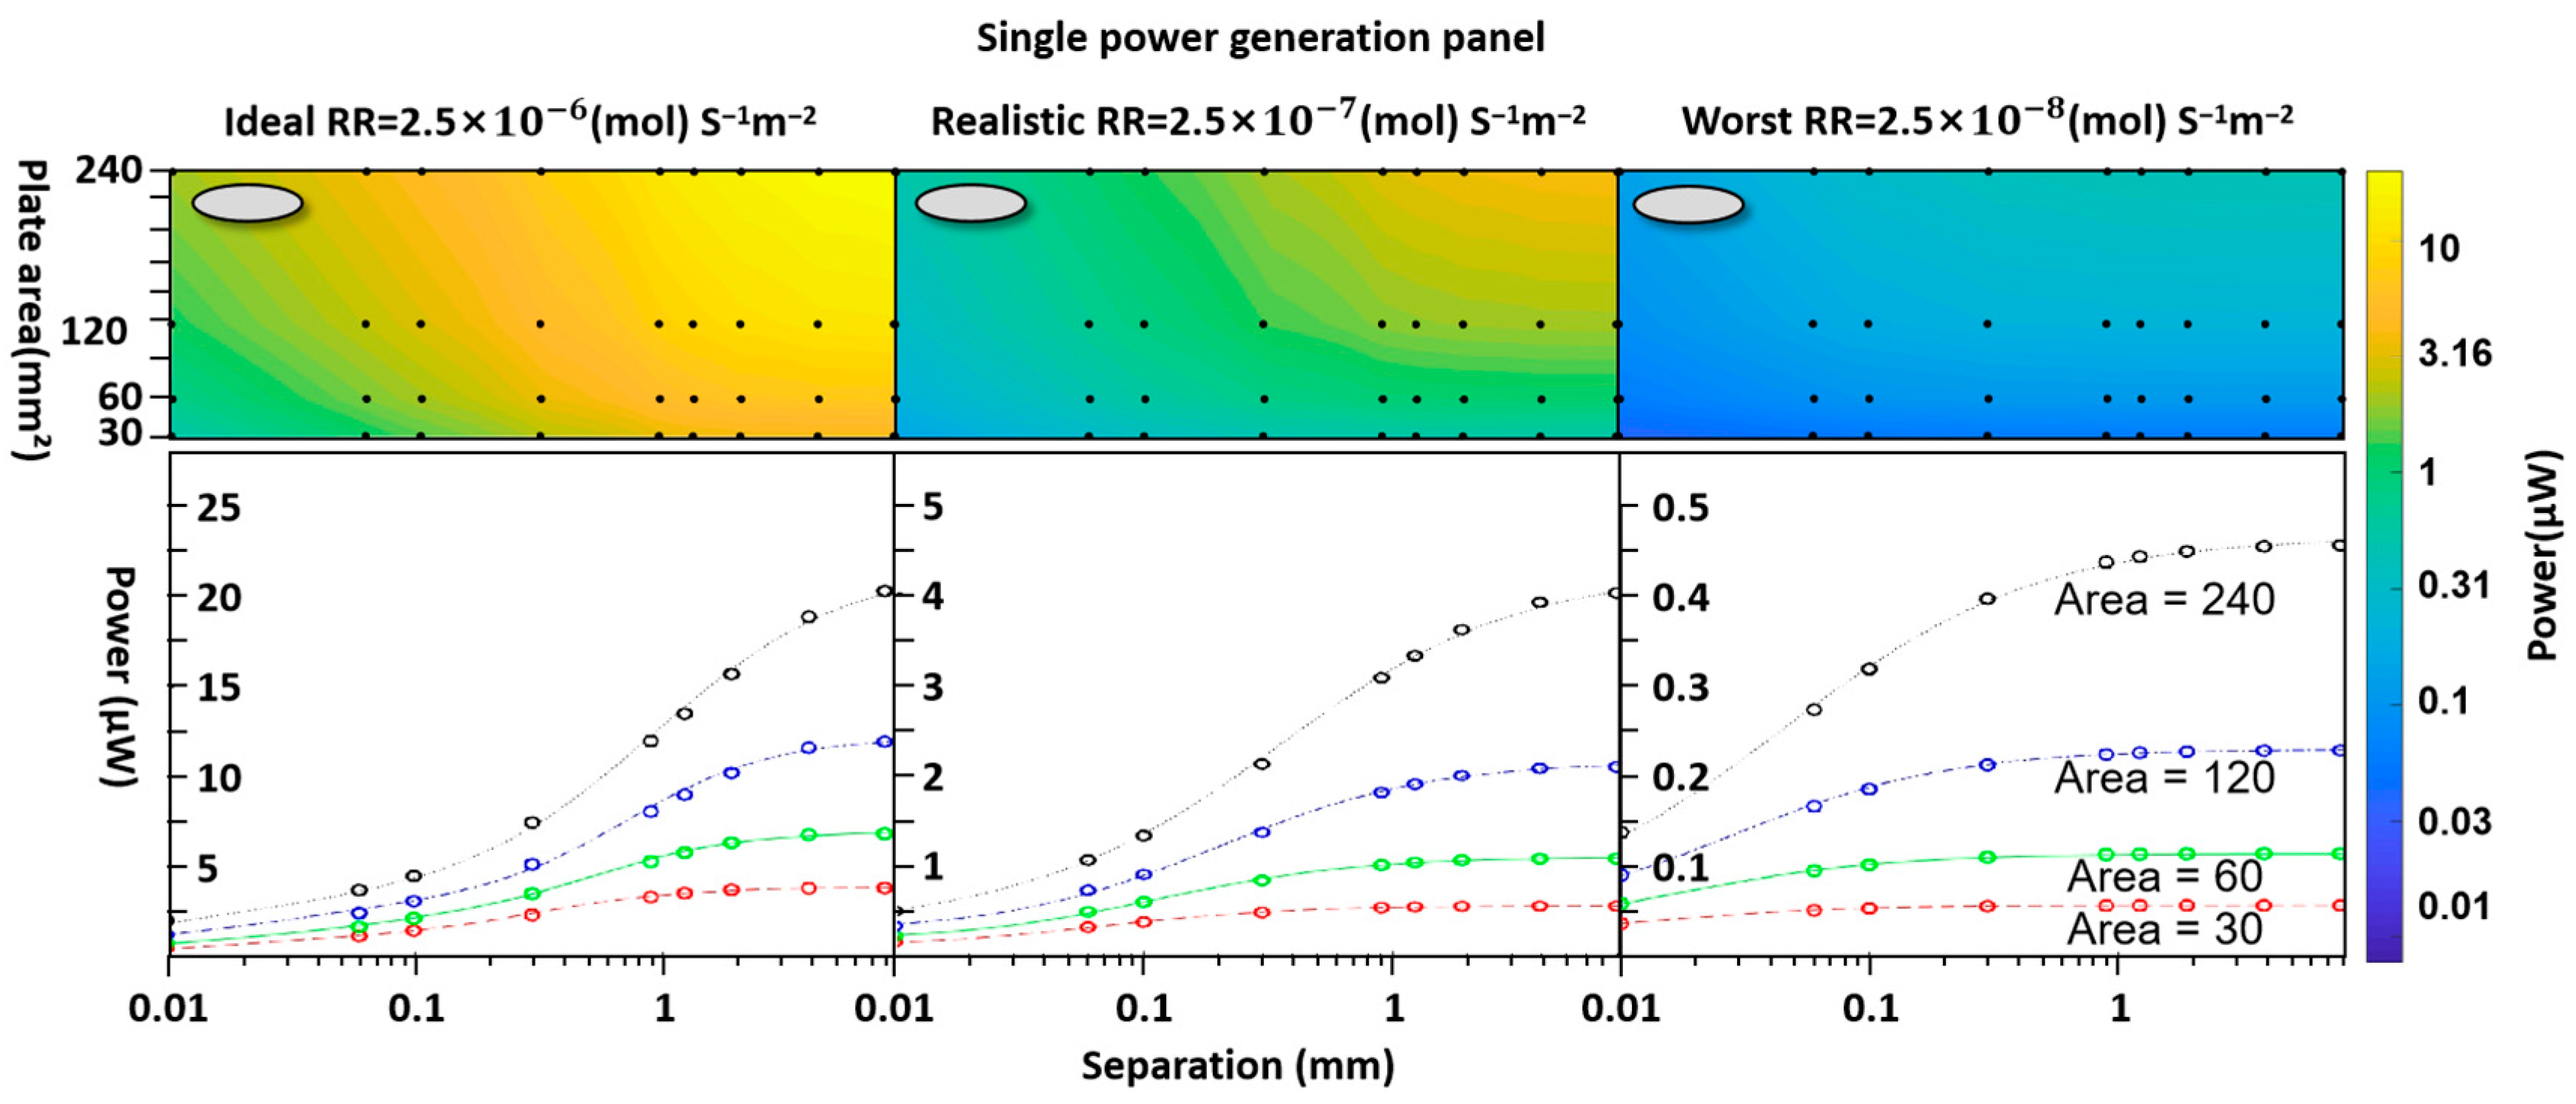
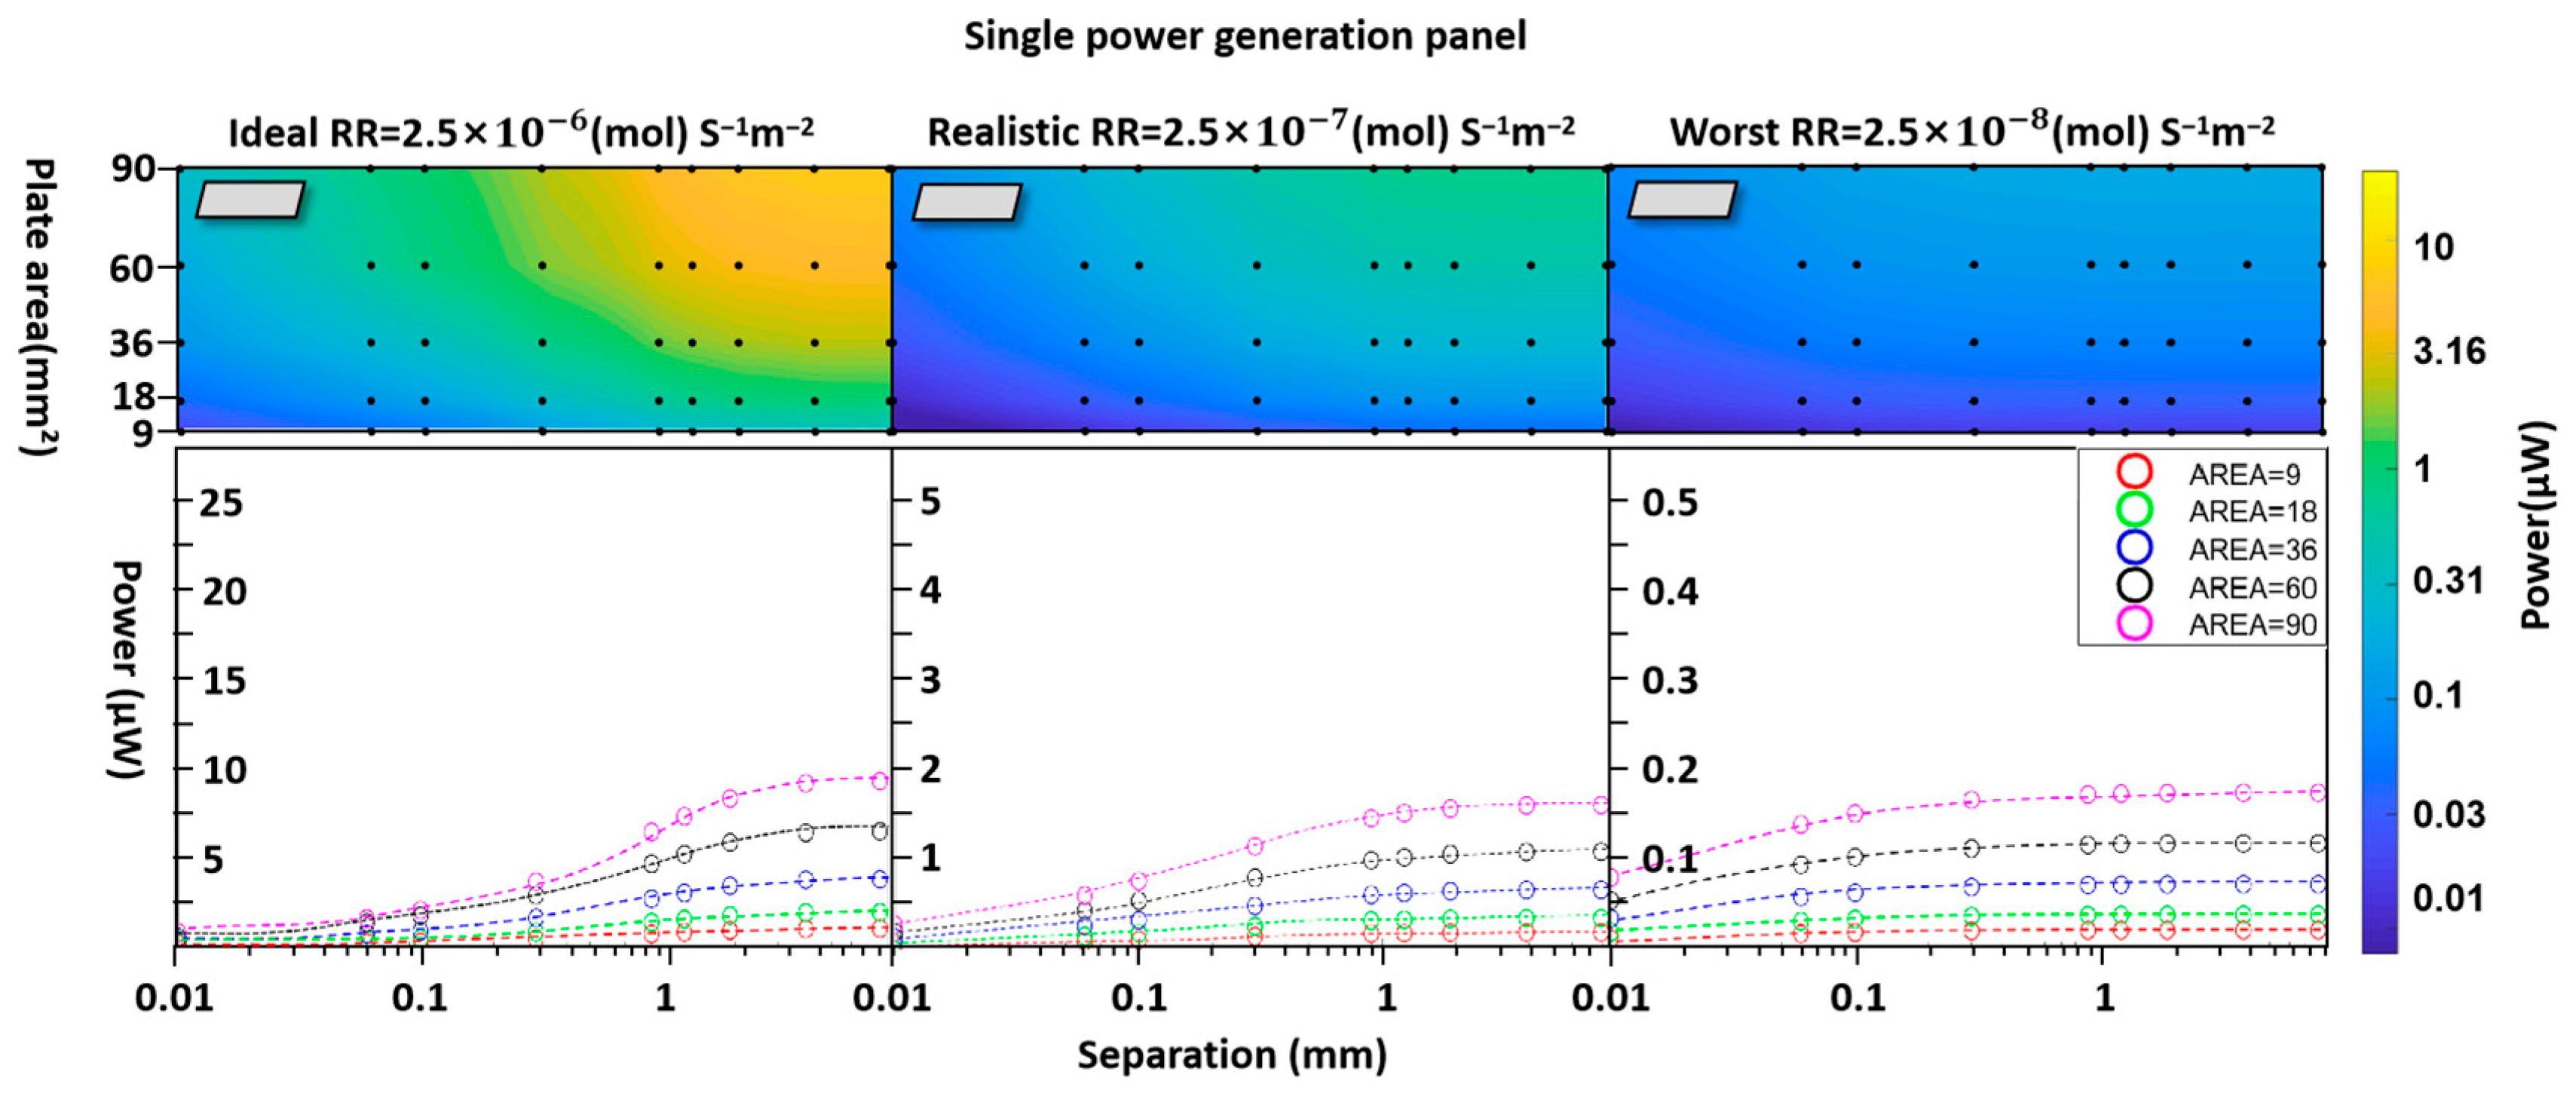
Figure 8 and Figure 9 (top) show the heat maps of output power vs. unit area and separation distance for different reaction rates, i.e., [ 2.5 × 10 6 , 2.5 × 10 7 , 2.5 × 10 8 ] (mol) s−1m−2 on the left-hand, center, and right-hand sides, respectively; (bottom) shows the line graphs for the same data.
As would be expected, the greater the separation and the unit area, the greater the power. Similarly, increasing the reaction rate also leads to increased output power.
As can be seen from the line graphs, the separation area of the generator unit and power are not linearly related. For higher reaction rates, the benefits of increasing area are sublinear due to diffusion limitations. This is more clearly the case when the separation is small, as diffusion becomes more challenging.

3.2. Multistack Units Without Diffusion Cavities

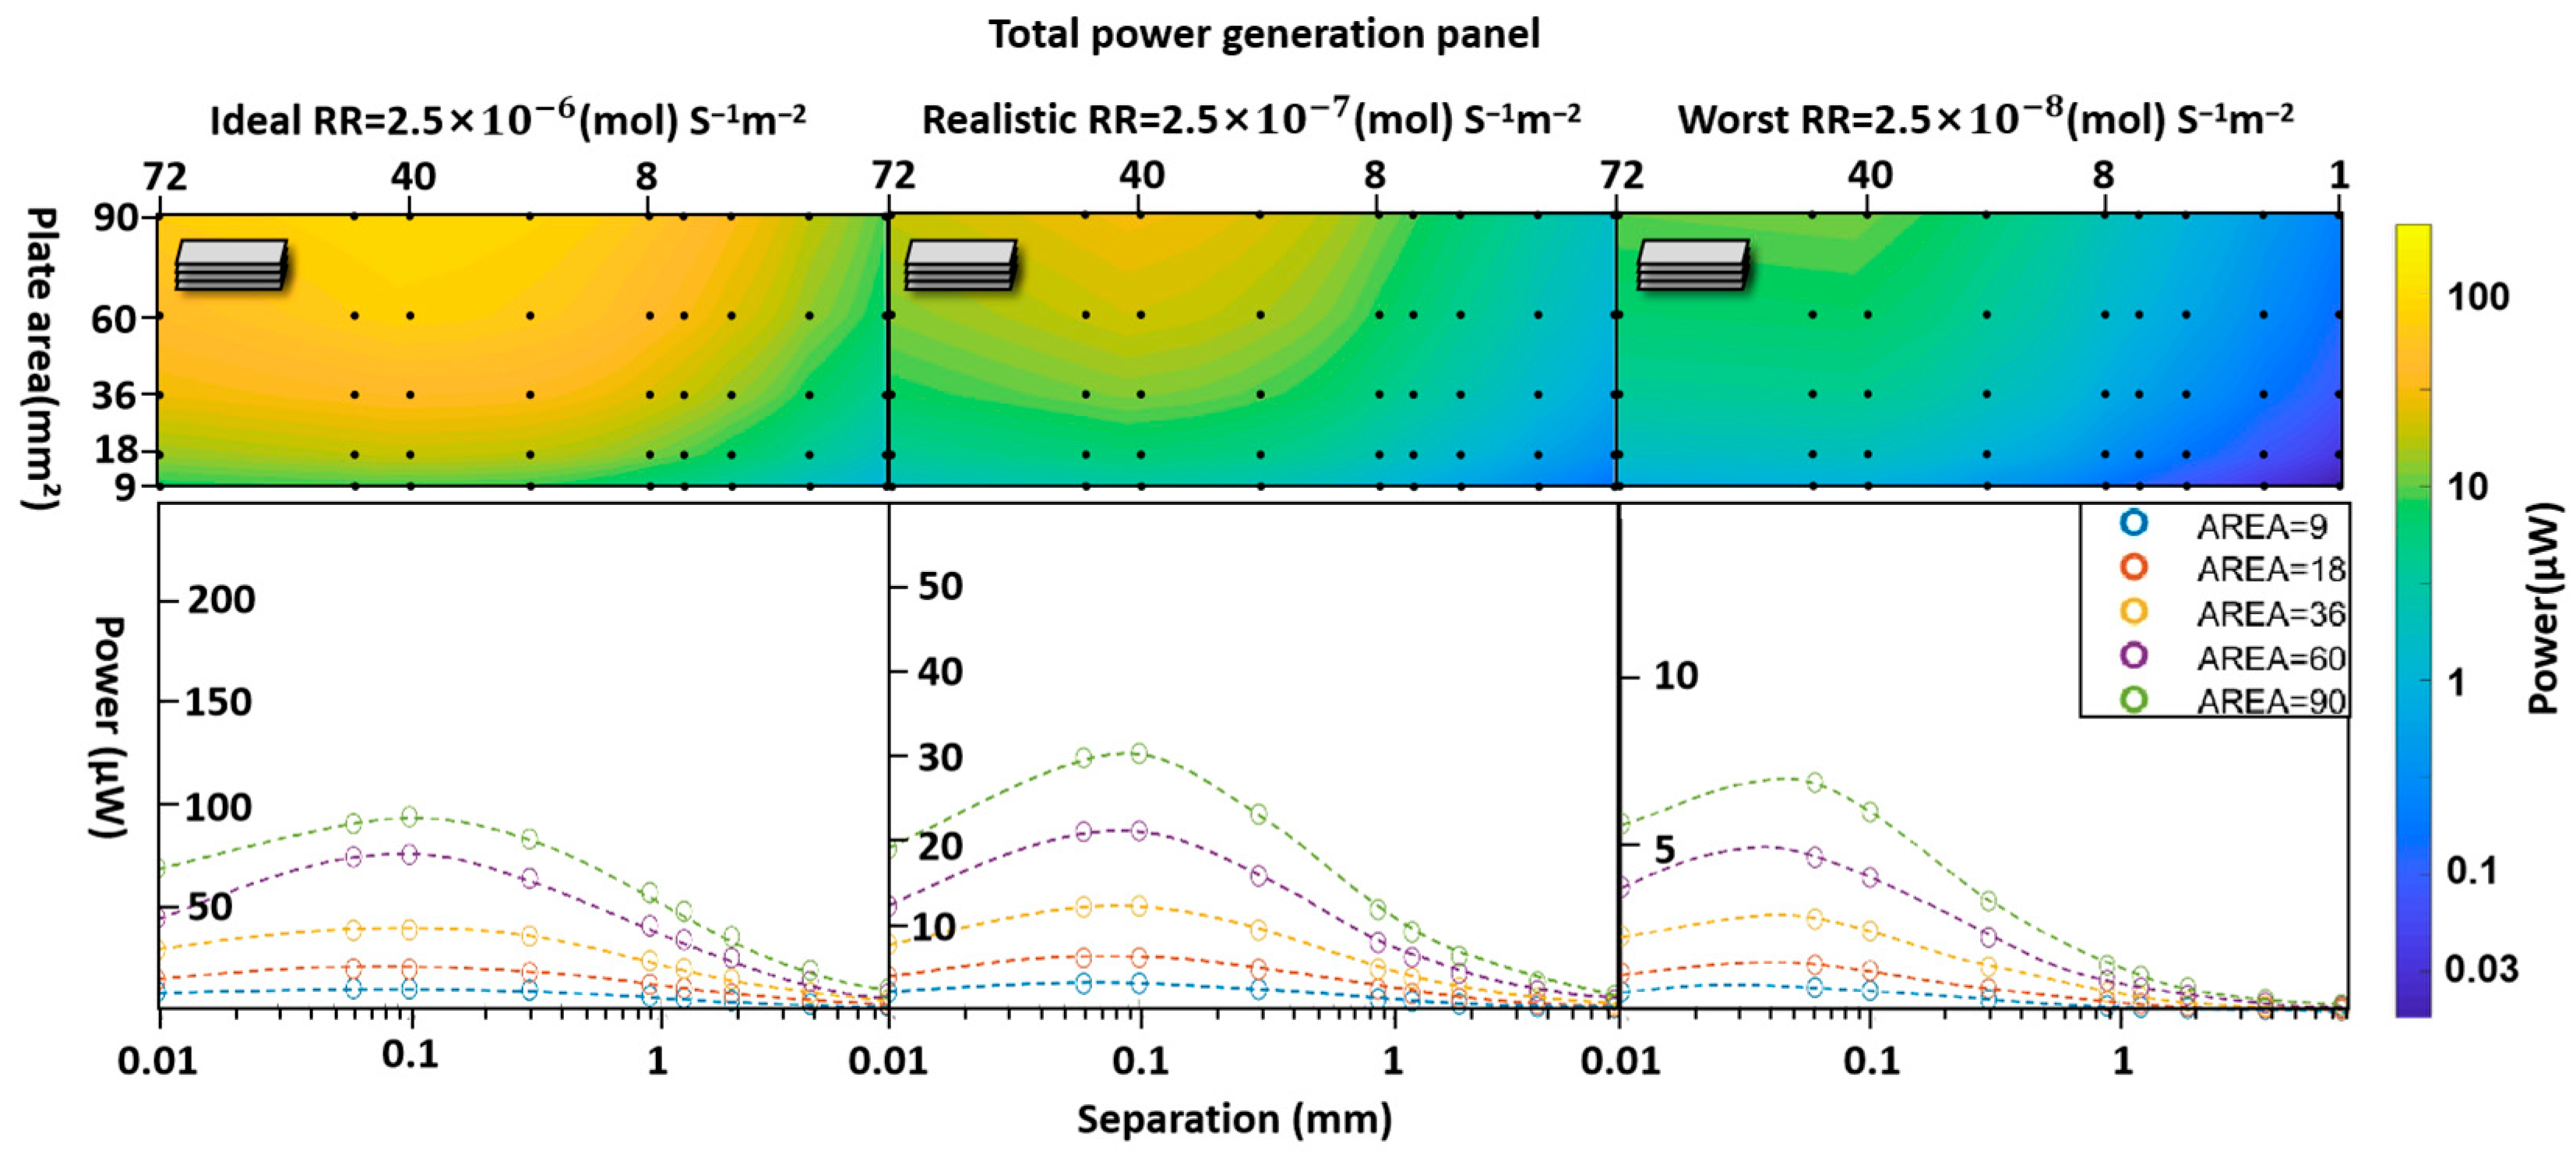
Figure 10 and Figure 11 (top) show the heat maps of output power vs. unit area and separation distance for different reaction rates, i.e., [ 2.5 × 10 6 , 2.5 × 10 7 , 2.5 × 10 8 ] (mol) s−1m−2 on the left-hand, center, and right-hand sides, respectively; (bottom) shows the line graphs of the same data. More area gives more power, but separation now has a maximum, as there is a trade-off between increased area with more units and decreased diffusion.
From the line graphs in Figure 10 and Figure 11, it can be observed that when the separation reaches approximately 60 μm, the total power of the stack reaches the maximum value, which requires 50 units. (An individual unit thickness of 100 µm is assumed.) Obviously, this will be a challenge during the manufacturing and assembly stages. Assembly difficulty, total electrode area, and diffusion supply need to be balanced. In order to control manufacturing and assembly challenges and ensure sufficient total power, perhaps an eight-layer (with ~0.9 mm separation) system is optimal.
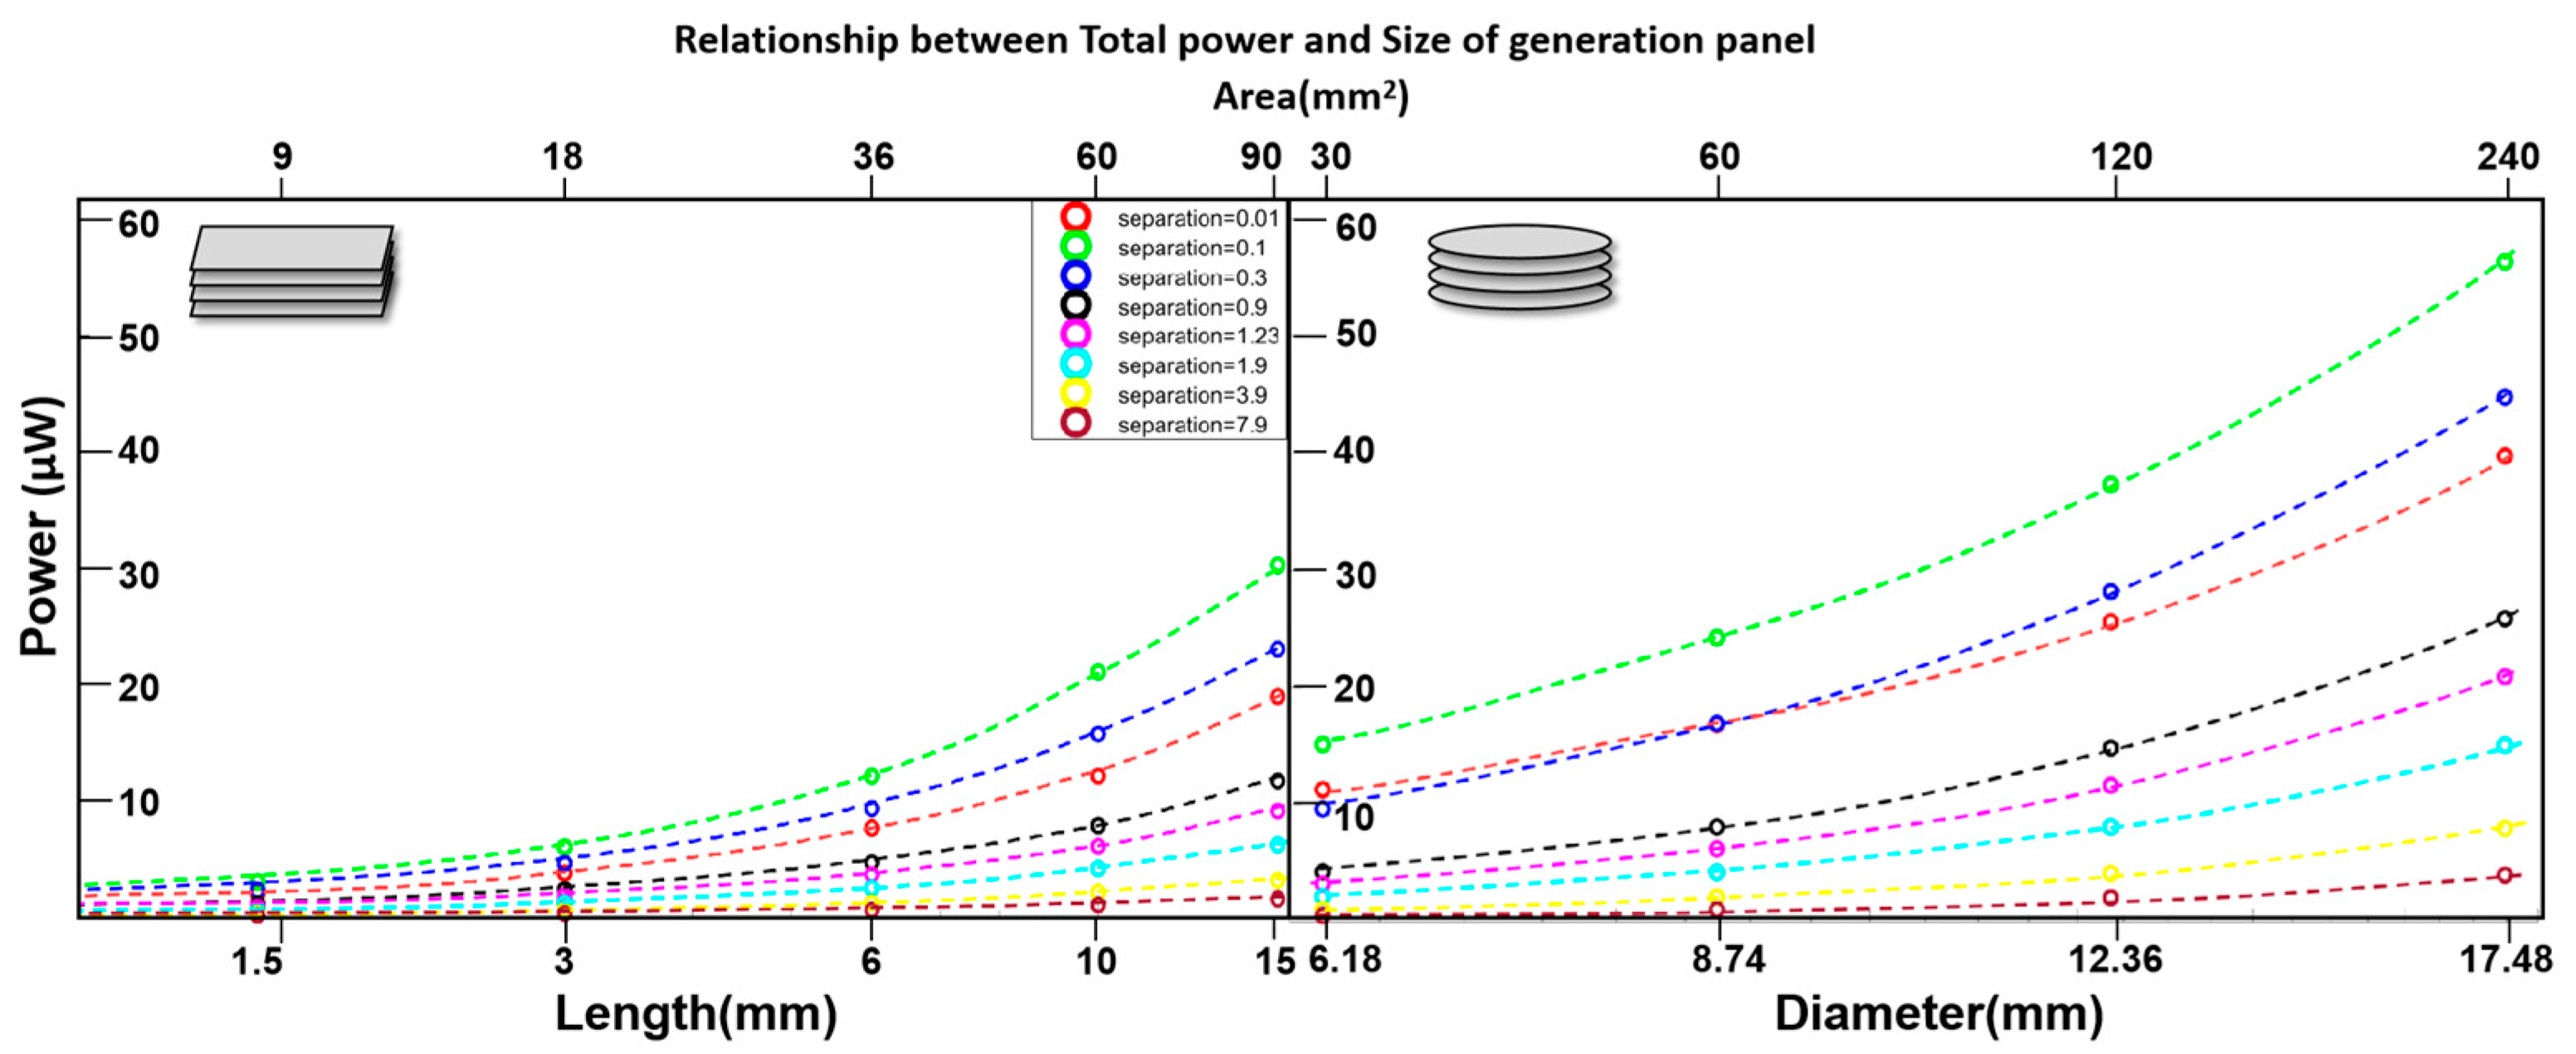
Figure 12 presents the data in terms of power vs. length/diameter for different unit separations. The disc-shaped device provides more power, as the total area can be much larger.

4. The Effect of Adding Central Diffusion Cavities

Figure 13, Figure S1, and Figure S2 (top) show the heat maps of output power vs. unit area and separation distance for both disc- and pill-shaped devices. The bottom row of the figures provides line graphs for the same data. All data is shown for a reaction rate of 2.5 × 10⁻⁷ (mol) s−1m−2. The presence of small cavities in the middle allows unreacted glucose and oxygen from the upper unit to diffuse to the inner units, increasing the concentration of glucose and oxygen at the inner reaction surfaces. However, the difference is found to be relatively small, ~2.5%, but positive. This indicates that the inner centers of the units do not have as frequent reactions due to concentration limitations. For smaller reaction rates and larger separations, the differences are smaller, as diffusion becomes less of an issue. As such, this structure might not be worth considering if it significantly complicates the fabrication engineering. However, in this study, the cavities function solely as diffusion pathways; if they also acted as additional concentration sources, the results would differ substantially.

5. Discussion

In the unit’s design, ideally, the surface reaction rate should be as large as possible, but this depends on the quality of the electrode nanostructure. Accordingly, three scenarios were considered based on the current literature. A highly optimistic scenario, in which advances in the surface nano- and microstructure of fuel cells yield an effective reaction rate significantly higher than that simulated in Scenario 1, is not ruled out. Even in such a case, the main principles proposed herein would remain valid.
Compared to previous studies, as early as 1970, Drake et al. achieved ~22 nW mm−2 (5720 nW whole cell) in dog implants using Pt-based electrodes [61]; with advances in electrode nanomodification techniques, as shown in Figure 3, Sharma et al. (2011) achieved ~100 nW mm−2 (5000 nW whole cell) in acute pig implants using a Pt thin-film anode and graphene cathode [38]. More recently, Gonzalez-Solino et al. (2020) [36] demonstrated ~143 nW mm−2 with a porous Au anode and Pt–Au cathode under 6 mM glucose concentration, though the total power remained below the μW range. By contrast, as shown in the line graph sections of Figure 10 and Figure 11, under idealized conditions, these simulations predict total outputs in the tens to hundreds of μW, substantially exceeding these reports. This discrepancy arises from the mesoscale optimization of the 3D architecture, in which multiple stacked plates provide a much larger surface area than in prior designs. Combined with Figure 12, although the total power does not scale linearly with area, area remains a key parameter in abiotic glucose fuel cell performance.
As shown in Figure 3, under the same glucose concentration of 5 mM, Oncescu et al. (2011) tested the distance between electrodes using a Pt–Ni alloy as the anode and Pt as the cathode [44]. Among electrode distances of 50 μm, 100 μm, 160 μm, and 260 μm, the power density reached its maximum value (2 μW cm−2) at a distance of 160 μm [44]. In the same year, Sharma et al. set the electrode separation at 25 μm but did not conduct further studies on distance variations. In 2022, Mohammad et al. employed a novel bypass depletion design utilizing Pt/rGO as the anode electrode and Fe-Co/KB as the cathode electrode, achieving a maximum power density of 12.5 μW cm−2 in human serum [37]. However, no further studies were conducted on electrode distance. In microscale research, electrode distance plays a very important role. Previous studies have hypothesized that at the microscale, fuel cell performance degradation results from the reaction products forming at the anode failing to rapidly diffuse to the cathode. This accumulation on electrode surfaces ultimately leads to active site blockage. However, robust published data or simulations to prove this remain lacking at present. This paper treats individual reaction plates as units with fixed characteristics, thus focusing on the separation between units at the mesoscale, which differs from previous studies of electrode distance at the microscale. Research into the distance between cathodes and anodes at the microscale will become the focus of the next round of simulations.
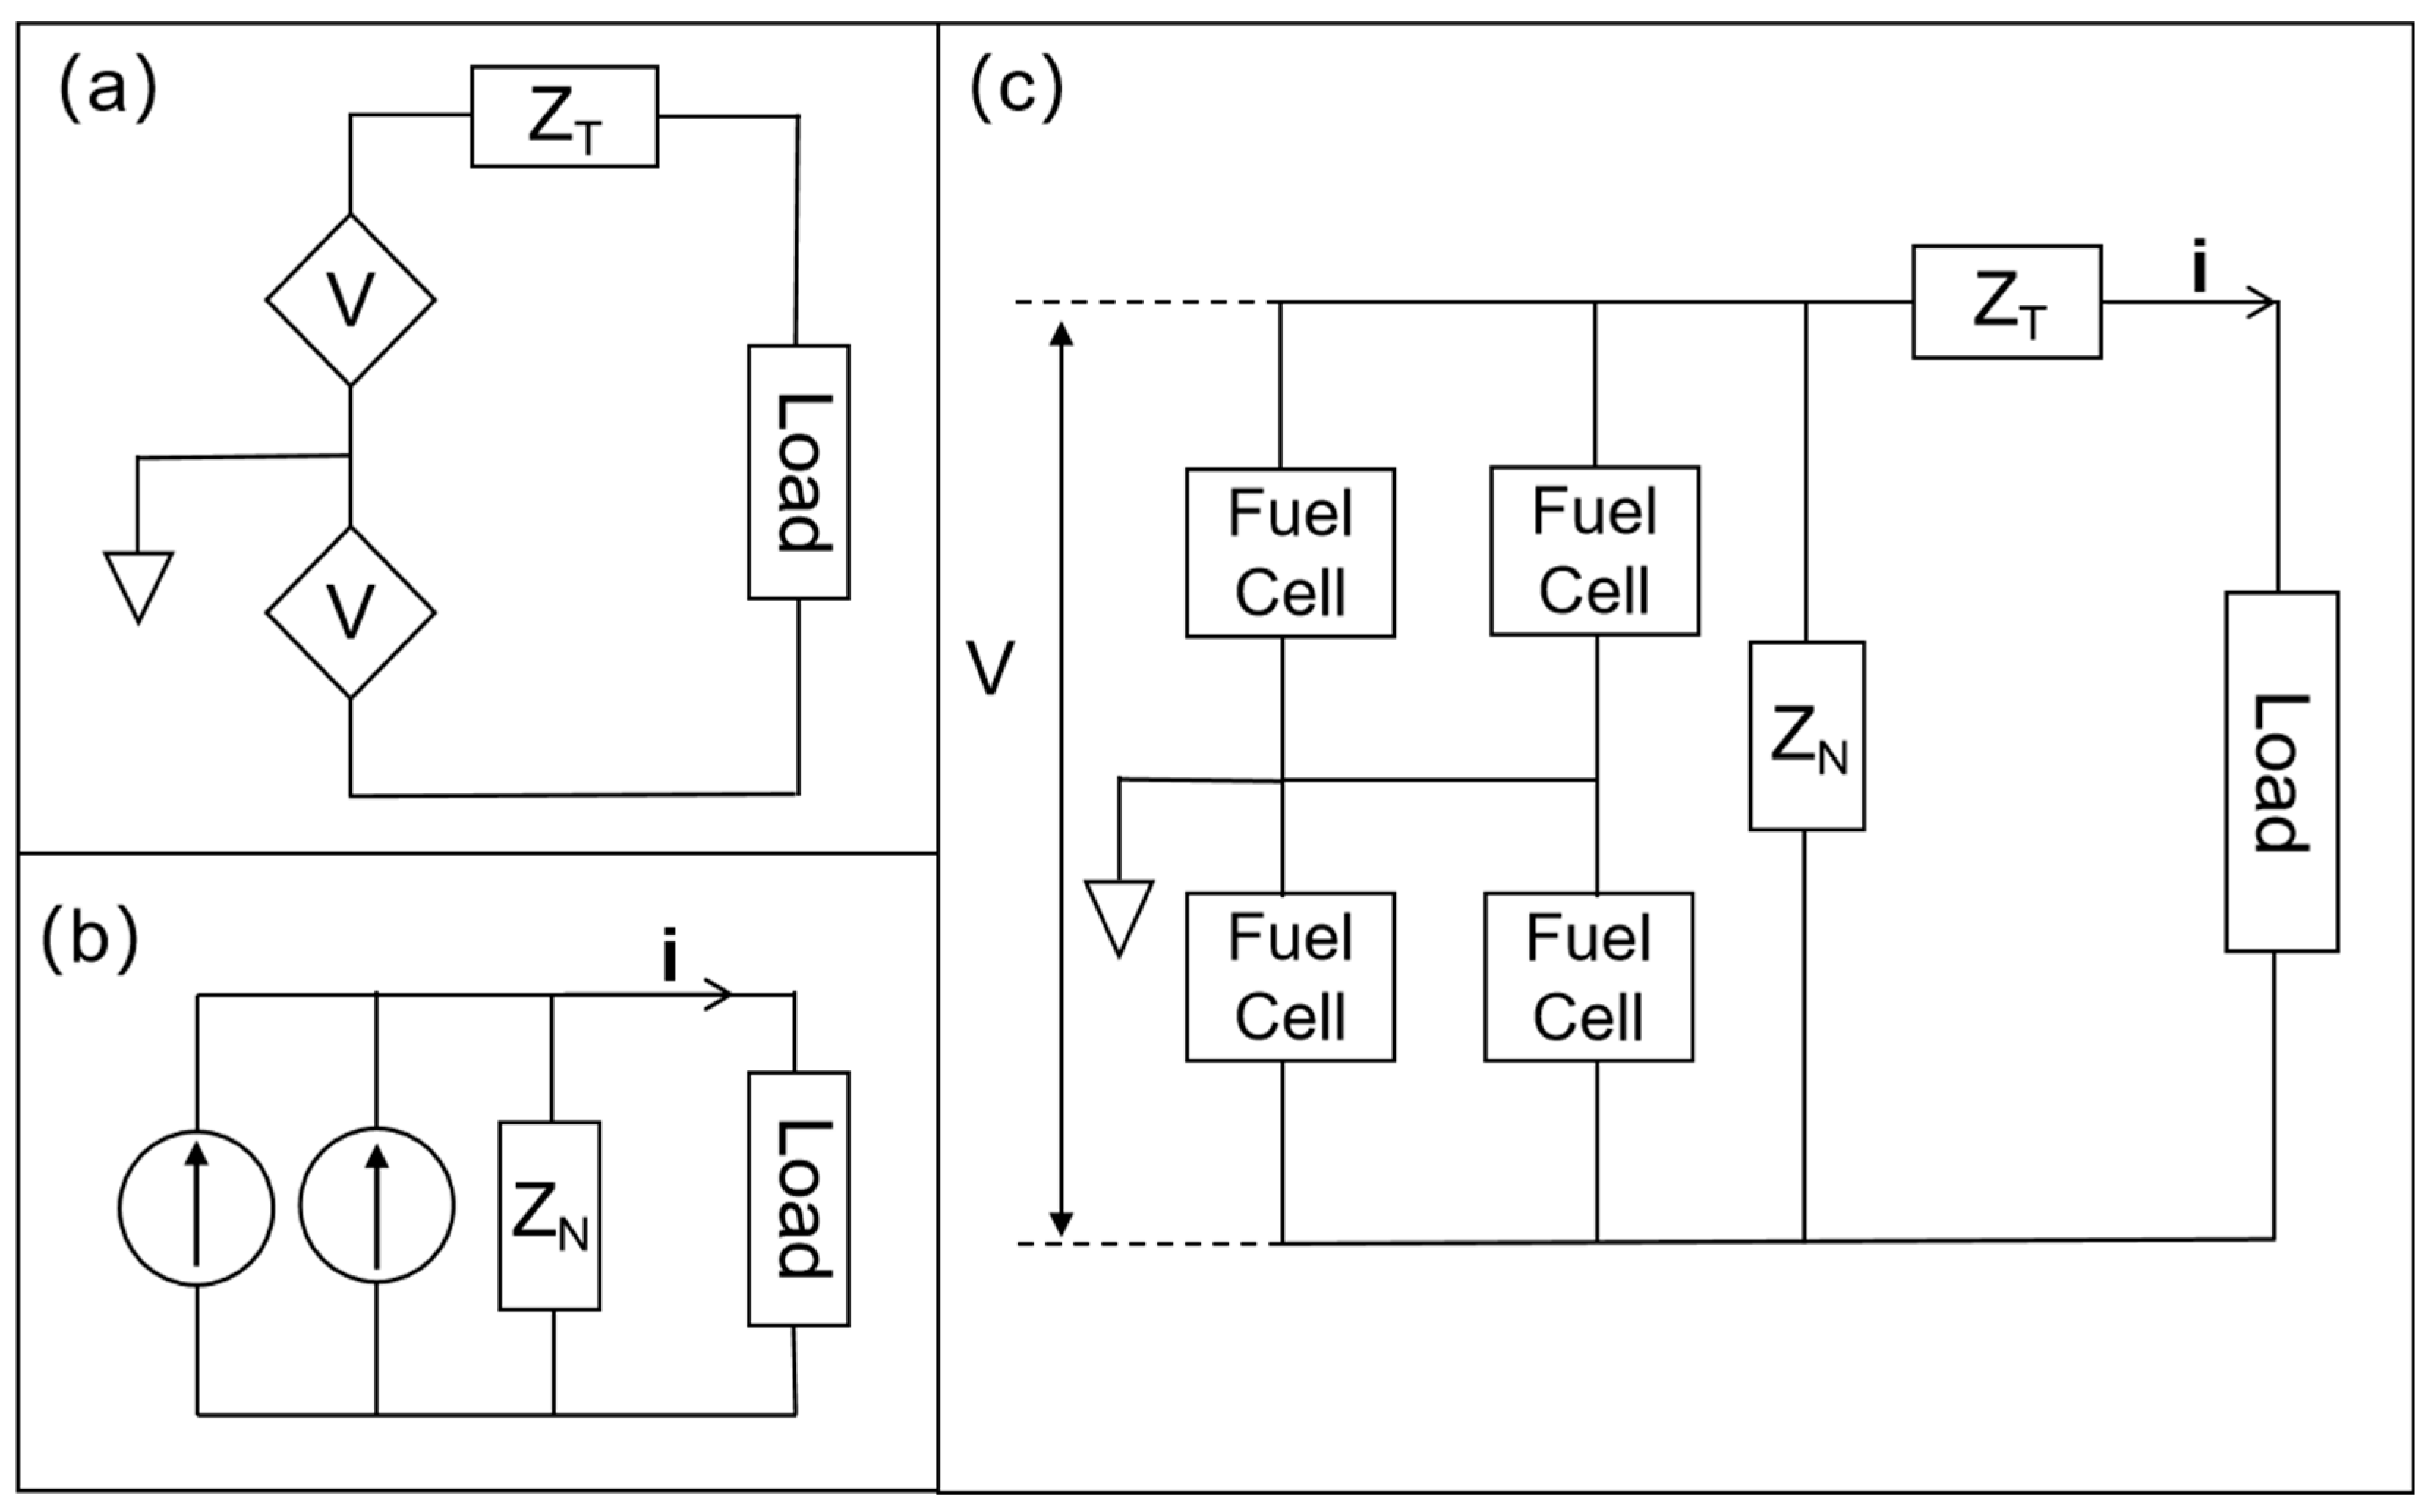
Another consideration is that, while the cathode–anode exchange area should be maximized, electron leakage due to direct electron transfer through tissue fluid must be prevented when the anode and cathode are in close proximity. That will need to be considered at the engineering and circuit loading stage. Individual fuel cell units can be placed in parallel or in series as per Figure 14a and Figure 14b giving more current or more voltage, respectively. Given that each unit gives ~0.4 V, this is challenging for power management electronics to boost. So, putting units in series could help improve the voltage. But, conversely, increased voltage could increase leakage and, possibly, electrolytic degradation. As such, a configuration as per Figure 14c is probably optimal. The 0.4 V assumption represents an estimate based on prior research. In practice, performance is influenced by electrode degradation, current density, and circuit-level losses. The present FEM framework focuses on the mesoscale, e.g., diffusion and reaction kinetics, without explicit treatment of ion/electron transport, electric fields, leakage, or loading. Future work will extend the model to incorporate these factors.
We would hypothesize that, depending on the architecture, the voltage achievable in practice may be +/− 0.2 V from our assumed value. Indeed, the maximum theoretical voltage is 1.2 V [55]. Although these variations could be considered fluctuations in the overall power supply, there is a further consideration. Useful electronics require voltages of the order of 1 V and above. It is possible to use voltage converters to boost voltages, but the minimum effective operation of these converters is around 0.4 V. Fuel cells can be put in series to boost voltage, but it may be difficult to put more than two in series, given that the surrounding fluid will be at a common voltage (see Figure 14).
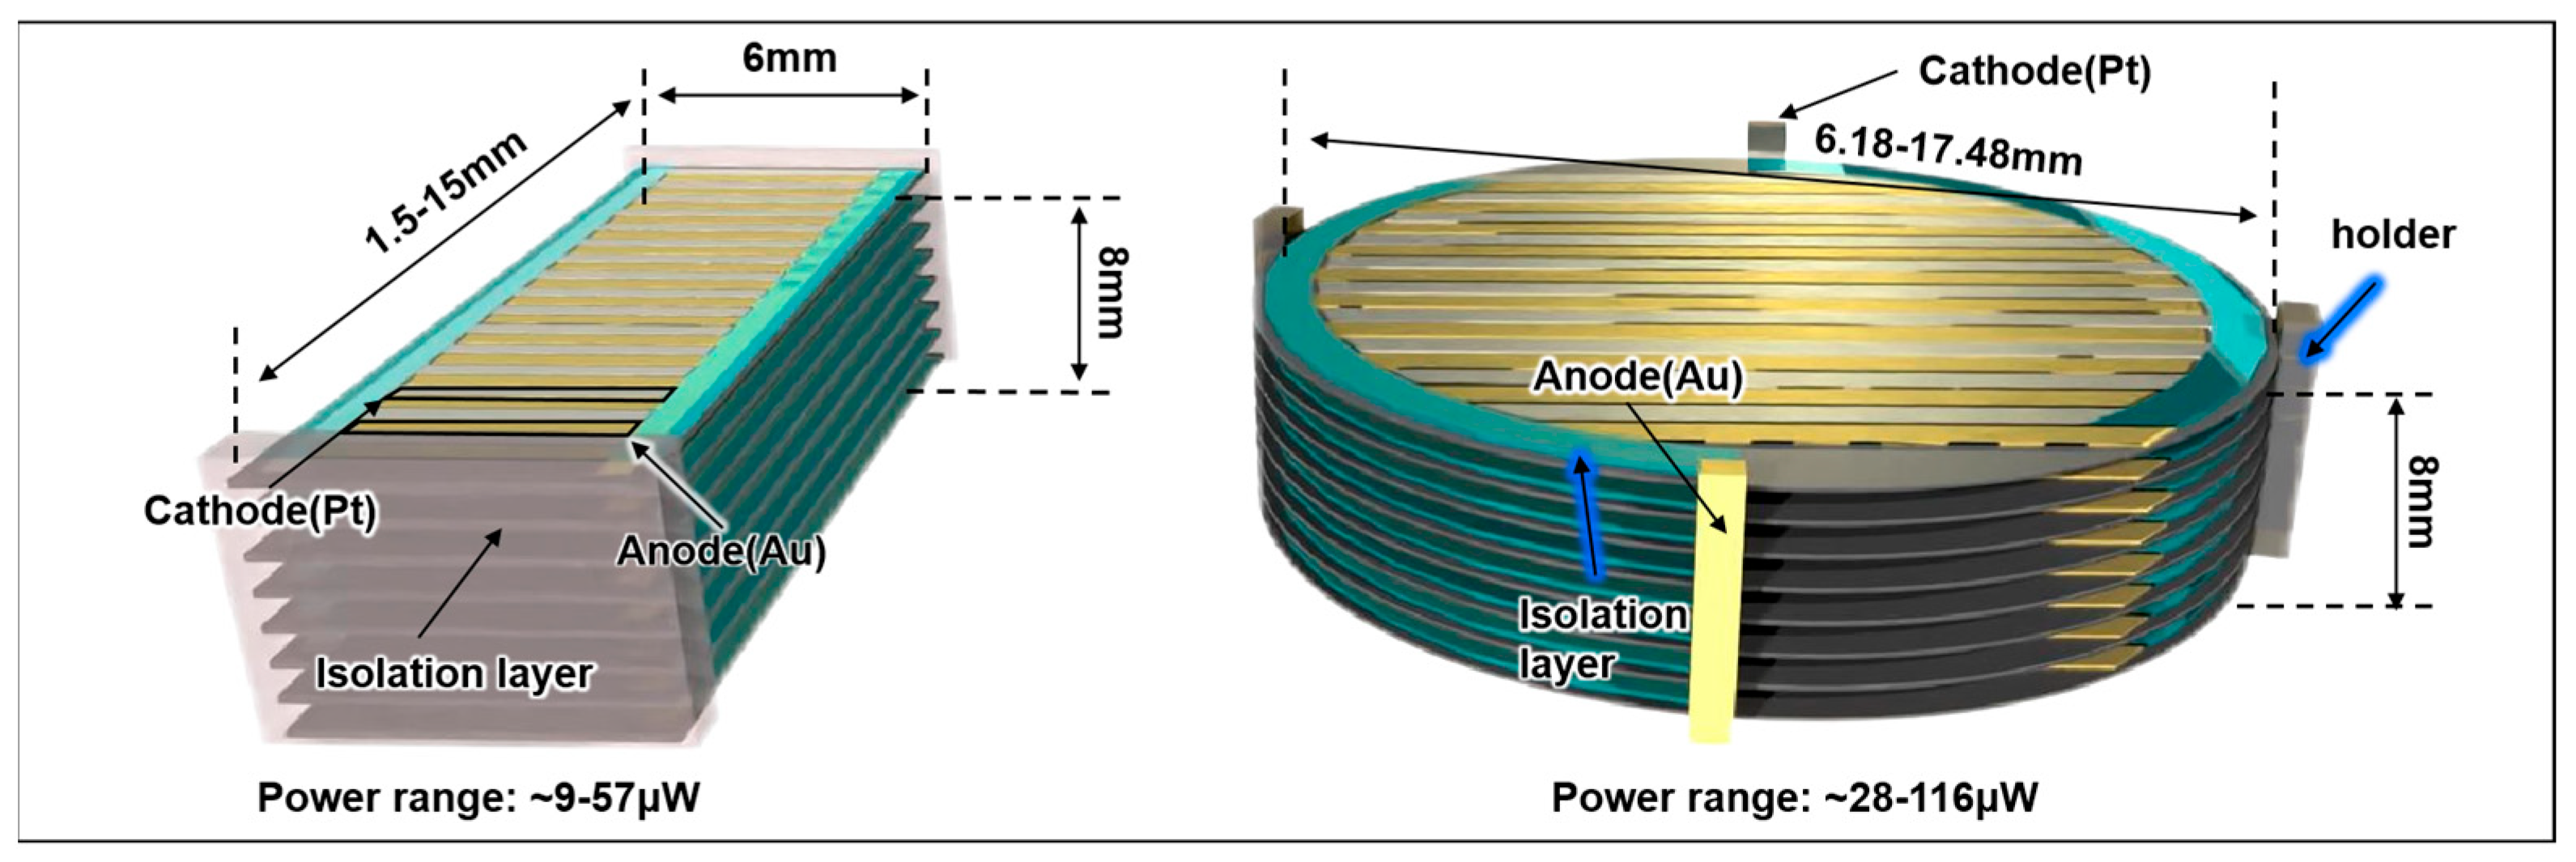
An additional consideration is the trade-off between power output and manufacturability. Separation spaces were simulated down to 0.01 mm; at 0.1 mm separation, glucose and oxygen were rapidly depleted, generating steep diffusion gradients that limited individual electrode reaction rates. Nonetheless, stacking multiple fuel cells provides an effective balance between total electrode area and diffusion efficiency. However, achieving this configuration could require several tens of units, posing short-term manufacturing challenges. Increased structural complexity also raises the probability of failure. At separations >2 mm, glucose and oxygen are sufficiently replenished by diffusion, but the device volume is underutilized, reducing total power output. This trade-off explains why an intermediate spacing (~0.9 mm, i.e., 8 units) maximizes power while maintaining manufacturing feasibility. Although an extremely narrow, elongated unit placed near the concentration boundary could theoretically maximize diffusion, such a design is impractical. Similarly, evaluating a central diffusion cavity offers negligible performance gains while introducing significant manufacturing challenges and structural fragility, as materials tend to soften and become fragile at the microscale. Within this range, power outputs of up to ~116 µW for coin-type devices and ~57 µW for pill-shaped devices were achieved (Figure 15, Table 4). This remains within the clinically relevant range for low-power implants and is relatively easy to manufacture.
Lithium batteries are stable and have a long regulatory history in medical implants [1]. It is difficult for any novel technology to displace incumbents. As such, it is important to define the niche to which implantable fuel cells could fit and, thus, provide context to the results. We, therefore, took data from the Contego range of implantable batteries (data provided by Resonetics Inc., Nashua, United States.) and plotted them in Figure 16. The x-axis was set to represent device volume, and the y-axis was set to represent battery lifetime. The black lines describe non-rechargeable batteries, and the red lines are rechargeable. The diagonal lines represent different power consumption domains for the batteries. The gap is clearly in the top left-hand corner of this graph.
Assuming biofouling is not a limiting factor, abiotic glucose fuel cells can, theoretically, operate indefinitely. Using the same bottom x-axis to represent volume, the top x-axis was defined in terms of power, as the simulation data indicated that power output scales with volume. Based on these simulations, a general yellow region was highlighted to represent the operational niche of fuel cells, partially overlapping with that of existing batteries. In summary, sustained operation is achievable at current levels of several tens of microamps—potentially up to 100 µA or less. It should be noted here that average power is not continuous power—it is the average over multiple sleep and power phases. Usually, deep sleep phases are ~100 nA, and operation is perhaps 1–10 mA. Currently, most medical-grade implantable lithium batteries have volumes of 500–6000 mm3, whereas the abiotic glucose fuel cells studied here occupy <2000 mm3. Unlike lithium batteries, fuel cells do not store finite energy but rather continuously harvest it from glucose in interstitial fluid. Thus, for low-power implants, abiotic glucose fuel cells offer a clear advantage in sustained power delivery and longevity. Biofouling remains the biggest challenge for implantable fuel cells. Without protection, tissue proteins or cells can quickly coat the device, hindering catalysis. Anti-biofouling membranes—often made from superhydrophobic materials like PEG, glycosylated, or amphoteric polymers—are being explored. Developing stable, long-lasting, anti-biofouling coatings remains a major hurdle [62].

6. Conclusions

With the development of small electronic medical implants, a long-lasting and stable energy supply module for medical implants becomes more and more important. This study presents a detailed finite element simulation to optimize the 3D structure of abiotic glucose fuel cells for implantable medical devices. By modeling various structural configurations, the effects of surface area, separation, and reaction rate on overall power generation are investigated. The results show that limiting the number of power-generating units to eight with a spacing of about 0.9 mm balances manufacturability and optimal performance when it is practically easy to fabricate.
While introducing central diffusion cavities can marginally improve diffusion and enhance power output, the gain is minimal and outweighed by the reduction in active electrode area and increased complexity. Simulations show that coin-shaped designs can generate up to ~100 µW, whereas compact, rectangular (pill-shaped) units can achieve ~40 µW—both sufficient for many low-power and ultra-low-power medical applications.
These results support the feasibility of using abiotic glucose fuel cells in subcutaneous or catheter-delivered implants. Future work will address real-world challenges such as biofouling and integration with energy management electronics. Overall, this modelling framework lays the foundation for fabricating practical, long-lasting, and miniaturized power sources for next-generation biomedical implants.

Supplementary Materials

The following supporting information can be downloaded at: https://www.mdpi.com/article/10.3390/prosthesis7060136/s1, Figure S1: Power of disc-shaped devices with central cavities, Figure S2: Power of pill-shaped devices with central cavities.

Author Contributions

C.M. performed the simulations, analyzed the data, drafted the text sections, and produced the data graphs. P.D. was involved in overseeing the research and analysis and actively wrote sections of the text and developed some of the images. E.G. and M.D.L. supervised the research and analysis and actively provided comments. All authors have read and agreed to the published version of the manuscript.

Funding

This research was funded by EPSRC Glutronics grant number (EP/Z536027/1).

Institutional Review Board Statement

Not applicable.

Informed Consent Statement

Not applicable.

Data Availability Statement

The original contributions presented in this study are included in the article. Further inquiries can be directed to the corresponding author.

Acknowledgments

We used all available tools at our disposal including AI-assisted literature search, AI-assisted grammar checking (Grammarly), and AI tools to debate the direction of the research. The papers in the literature review were reviewed by humans in order to generate Figure 3 and the associated tables. The drafting and writing of the manuscript were, however, performed by humans (the authors), as were the artistic and data figures.

Conflicts of Interest

The authors declare no conflicts of interest.

References

  1. Yang, S.; Sencadas, V.; You, S.S.; Jia, N.Z.; Srinivasan, S.S.; Huang, H.; Ahmed, A.E.; Liang, J.Y.; Traverso, G. Powering Implantable and Ingestible Electronics. Adv. Funct. Mater. 2021, 31, 2009289. [Google Scholar] [CrossRef] [PubMed]
  2. Goggins, E.; Mitani, S.; Tanaka, S. Clinical perspectives on vagus nerve stimulation: Present and future. Clin. Sci. 2022, 136, 695–709. [Google Scholar] [CrossRef]
  3. Brinkman, D.J.; Gupta, I.; Matteucci, P.B.; Ouchouche, S.; de Jonge, W.J.; Coatney, R.W.; Salam, T.; Chew, D.J.; Irwin, E.; Yazicioglu, R.F.; et al. Splenic arterial neurovascular bundle stimulation in esophagectomy: A feasibility and safety prospective cohort study. Front. Neurosci. 2022, 16, 1088628. [Google Scholar] [CrossRef]
  4. Ito, A.; Yamamoto, Y.; Sato, M.; Ikeda, K.; Yamamoto, M.; Fujita, H.; Nagamori, E.; Kawabe, Y.; Kamihira, M. Induction of functional tissue-engineered skeletal muscle constructs by defined electrical stimulation. Sci. Rep. 2014, 4, 4781. [Google Scholar] [CrossRef] [PubMed]
  5. Cicha, I.; Priefer, R.; Severino, P.; Souto, E.B.; Jain, S. Biosensor-Integrated Drug Delivery Systems as New Materials for Biomedical Applications. Biomolecules 2022, 12, 1198. [Google Scholar] [CrossRef]
  6. Khadka, B.; Lee, B.; Kim, K.T. Drug Delivery Systems for Personal Healthcare by Smart Wearable Patch System. Biomolecules 2023, 13, 929. [Google Scholar] [CrossRef]
  7. Joung, Y.H. Development of implantable medical devices: From an engineering perspective. Int. Neurourol. J. 2013, 17, 98–106. [Google Scholar] [CrossRef] [PubMed]
  8. Wilson, B.S.; Dorman, M.F. Cochlear implants: A remarkable past and a brilliant future. Hear. Res. 2008, 242, 3–21. [Google Scholar] [CrossRef]
  9. Jacob, M.V.; Bazaka, K. Implantable Devices: Issues and Challenges. Electronics 2012, 2, 1–34. [Google Scholar] [CrossRef]
  10. Noblett, K.L.; Cadish, L.A. Sacral nerve stimulation for the treatment of refractory voiding and bowel dysfunction. Am. J. Obstet. Gynecol. 2014, 210, 99–106. [Google Scholar] [CrossRef]
  11. Pavlov, V.A.; Tracey, K.J. Bioelectronic medicine: Preclinical insights and clinical advances. Neuron 2022, 110, 3627–3644. [Google Scholar] [CrossRef]
  12. Fritz, J.R.; Huston, J.M. Advances in bioelectronic medicine: Noninvasive electrical, ultrasound and magnetic nerve stimulation. Bioelectron. Med. 2019, 2, 143–150. [Google Scholar] [CrossRef]
  13. Wang, X.; Meng, X.; Zhu, Y.; Ling, H.; Chen, Y.; Li, Z.; Hartel, M.C.; Dokmeci, M.R.; Zhang, S.; Khademhosseini, A. A sub-1V, microwatt power-consumption iontronic pressure sensor based on organic electrochemical transistors. EEE Electron Device Lett. 2021, 42, 46–49. [Google Scholar] [CrossRef]
  14. Moerke, C.; Wolff, A.; Ince, H.; Ortak, J.; Öner, A. New strategies for energy supply of cardiac implantable devices. Herzschrittmachertherapie Elektrophysiologie 2022, 33, 224–231. [Google Scholar] [CrossRef] [PubMed]
  15. Khalifa, A.; Lee, S.; Molnar, A.C.; Cash, S. Injectable wireless microdevices: Challenges and opportunities. Bioelectron. Med. 2021, 7, 19. [Google Scholar] [CrossRef]
  16. Antfolk, C.; Kopta, V.; Farserotu, J.; Decotignie, J.D.; Enz, C. The WiseSkin artificial skin for tactile prosthetics: A power budget investigation. In Proceedings of the 014 8th International Symposium on Medical Information and Communication Technology (ISMICT), Firenze, Italy, 2–4 April 2014; pp. 1–4. [Google Scholar] [CrossRef]
  17. Katz, D.; Akiyama, T. Pacemaker Longevity: The World’s Longest-Lasting VVI Pacemaker. Ann. Noninvasive Electrocardiol. 2007, 12, 223–226. [Google Scholar] [CrossRef]
  18. Pfenniger, A.; Jonsson, M.; Zurbuchen, A.; Koch, V.M.; Vogel, R. Energy Harvesting from the Cardiovascular System, or How to Get a Little Help from Yourself. Ann. Biomed. Eng. 2013, 41, 2248–2263. [Google Scholar] [CrossRef] [PubMed]
  19. Bock, D.C.; Marschilok, A.C.; Takeuchi, K.J.; Takeuchi, E.S. Batteries used to power implantable biomedical devices. Electrochim. Acta 2012, 84, 155–164. [Google Scholar] [CrossRef] [PubMed]
  20. Available online: https://resonetics.com/sensor-technology-medical-power/medical-batteries/ (accessed on 22 October 2025).
  21. Hannan, M.A.; Mutashar, S.; Samad, S.A.; Hussain, A. Energy harvesting for the implantable biomedical devices: Issues and challenges. Biomed. Eng. Online 2014, 13, 79. [Google Scholar] [CrossRef]
  22. Kerzenmacher, S.; Ducrée, J.; Zengerle, R.; von Stetten, F. Energy harvesting by implantable abiotically catalyzed glucose fuel cells. J. Power Sources 2008, 182, 1–17. [Google Scholar] [CrossRef]
  23. Wei, X.; Liu, J. Power sources and electrical recharging strategies for implantable medical devices. Front. Energy 2008, 2, 1–13. [Google Scholar] [CrossRef]
  24. The Complete Guide to Medical Device Batteries. Available online: https://Ufinebattery.com (accessed on 22 October 2025).
  25. Amar, A.B.; Kouki, A.B.; Cao, H. Power approaches for implantable medical devices. Sensors 2015, 15, 28889–28914. [Google Scholar] [CrossRef]
  26. Kurs, A.; Karalis, A.; Moffatt, R.; Joannopoulos, J.D.; Fisher, P.; Soljačić, M. Wireless Power Transfer via Strongly Coupled Magnetic Resonances. Science 2007, 317, 83–86. [Google Scholar] [CrossRef]
  27. Magotra, V.K.; Kumar, S.; Kang, T.W.; Inamdar, A.I.; Aqueel, A.T.; Im, H.; Ghodake, G.; Shinde, S.; Waghmode, D.P.; Jeon, H.C. Compost Soil Microbial Fuel Cell to Generate Power using Urea as Fuel. Sci. Rep. 2020, 10, 4154. [Google Scholar] [CrossRef]
  28. MacVittie, K.; Halámek, J.; Halámková, L.; Southcott, M.; Jemison, W.D.; Lobel, R.; Katz, E. From cyborg lobsters to a pacemaker powered by implantable biofuel cells. Energy Environ. Sci. 2012, 6, 81–86. [Google Scholar] [CrossRef]
  29. Szczupak, A.; Halámek, J.; Halámková, L.; Bocharova, V.; Alfonta, L.; Katz, E. Living battery—Biofuel cells operating in vivo in clams. Energy Environ. Sci. 2012, 5, 8891–8895. [Google Scholar] [CrossRef]
  30. Lee, D.Y.; Yun, J.-H.; Bin Park, Y.; Hyeon, J.S.; Jang, Y.; Choi, Y.-B.; Kim, H.-H.; Kang, T.M.; Ovalle, R.; Baughman, R.H.; et al. Two-Ply Carbon Nanotube Fiber-Typed Enzymatic Biofuel Cell Implanted in Mice. IEEE Trans. NanoBiosci. 2020, 19, 333–338. [Google Scholar] [CrossRef] [PubMed]
  31. Rasmussen, M.; Ritzmann, R.E.; Lee, I.; Pollack, A.J.; Scherson, D. An Implantable Biofuel Cell for a Live Insect. J. Am. Chem. Soc. 2012, 134, 1458–1460. [Google Scholar] [CrossRef]
  32. Yang, L.; Zhang, Y.; Chu, M.; Deng, W.; Tan, Y.; Ma, M.; Su, X.; Xie, Q.; Yao, S. Facile fabrication of network film electrodes with ultrathin Au nanowires for nonenzymatic glucose sensing and glucose/O2 fuel cell. Biosens. Bioelectron. 2014, 52, 105–110. [Google Scholar] [CrossRef]
  33. Kloke, A.; Ko, C.; Zengerle, R.; Kerzenmacher, S. Porous Platinum Electrodes Fabricated by Cyclic Electrodeposition of PtCu Alloy: Application to Implantable Glucose Fuel Cells. J. Phys. Chem. C 2012, 116, 19689–19698. [Google Scholar] [CrossRef]
  34. Zhao, Y.; Fan, L.; Hong, B.; Zhang, Y.; Zhang, M.; Que, Q.; Ji, J. Three-dimensional Porous Palladium Foam-like Nanostructures as Electrocatalysts for Glucose Biofuel Cells. Energy Technol. 2016, 4, 249–255. [Google Scholar] [CrossRef]
  35. Niyazi, A.; Metcalfe, B.; Leese, H.S.; Di Lorenzo, M. One-step polyaniline-platinum nanoparticles grafting on porous gold anode electrodes for high-performance glucose fuel cells. J. Power Sources 2025, 654, 23781. [Google Scholar] [CrossRef]
  36. Gonzalez-Solino, C.; Metcalfe, B.W.; Lorenzo, M.D. Power generation and autonomous glucose detection with an integrated array of abiotic fuel cells on a printed circuit board. J. Power Sources 2020, 472, 228530. [Google Scholar] [CrossRef]
  37. Zhiani, M.; Barzi, S.; Ahmadi, A.; Vizza, F.; Gharibi, H.; Azhari, A. Ex vivo energy harvesting by a by-pass depletion designed abiotic glucose fuel cell operated with real human blood serum. J. Power Sources 2022, 521, 230972. [Google Scholar] [CrossRef]
  38. Sharma, T.; Hu, Y.; Stoller, M.; Feldman, M.; Ruoff, R.S.; Ferrari, M.; Zhang, X. Mesoporous silica as a membrane for ultra-thin implantable direct glucose fuel cells. Lab Chip 2011, 11, 2460–2465. [Google Scholar] [CrossRef]
  39. Zebda, A.; Cosnier, S.; Alcaraz, J.-P.; Holzinger, M.; Le Goff, A.; Gondran, C.; Boucher, F.; Giroud, F.; Gorgy, K.; Lamraoui, H.; et al. Single glucose biofuel cells implanted in rats power electronic devices. Sci. Rep. 2013, 3, 1516. [Google Scholar] [CrossRef]
  40. Christwardana, M.; Kim, D.-H.; Chung, Y.; Kwon, Y. A hybrid biocatalyst consisting of silver nanoparticle and naphthalenethiol self-assembled monolayer prepared for anchoring glucose oxidase and its use for an enzymatic biofuel cell. Appl. Surf. Sci. 2018, 429, 180–186. [Google Scholar] [CrossRef]
  41. Zhang, H.; Zhang, L.; Han, Y.; Yu, Y.; Xu, M.; Zhang, X.; Huanh, L.; Dong, S. RGO/Au NPs/N-doped CNTs supported on nickel foam as an anode for enzymatic biofuel cells. Biosens. Bioelectron. 2017, 97, 34–40. [Google Scholar] [CrossRef]
  42. Hou, C.; Liu, A. An integrated device of enzymatic biofuel cells and supercapacitor for both efficient electric energy conversion and storage. Electrochim. Acta 2017, 245, 303–308. [Google Scholar] [CrossRef]
  43. Yu, Y.; Xu, M.; Bai, L.; Han, L.; Dong, S. Recoverable hybrid enzymatic biofuel cell with molecular oxygen-independence. Biosens. Bioelectron. 2016, 75, 23–27. [Google Scholar] [CrossRef] [PubMed]
  44. Oncescu, V.; Erickson, D. A microfabricated low cost enzyme-free glucose fuel cell for powering low-power implantable devices. J. Power Sources 2011, 196, 9169–9175. [Google Scholar] [CrossRef]
  45. Kerzenmacher, S.; Kräling, U.; Metz, T.; Zengerle, R.; von Stetten, F. A potentially implantable glucose fuel cell with Raney-platinum film electrodes for improved hydrolytic and oxidative stability. J. Power Sources 2011, 196, 1264–1272. [Google Scholar] [CrossRef]
  46. Köhler, C.; Frei, M.; Zengerle, R.; Kerzenmacher, S. Performance loss of a Pt-based implantable glucose fuel cell in simulated tissue and cerebrospinal fluids. ChemElectroChem 2014, 1, 1895–1900. [Google Scholar] [CrossRef]
  47. Available online: https://medlineplus.gov/ency/article/003482.htm (accessed on 22 October 2025).
  48. Available online: https://www.cosinuss.com/en/measured-data/vital-signs/oxygen-saturation/ (accessed on 22 October 2025).
  49. Collins, J.A.; Rudenski, A.; Gibson, J.; Howard, L.; O’Driscoll, R. Relating oxygen partial pressure, saturation and content: The haemoglobin–oxygen dissociation curve. Breathe 2015, 11, 194–201. [Google Scholar] [CrossRef]
  50. Available online: https://www.ncbi.nlm.nih.gov/books/NBK538336/?utm_source (accessed on 22 October 2025).
  51. Lewis, P.M.; Ackland, H.M.; Lowery, A.J.; Rosenfeld, J.V. Restoration of vision in blind individuals using bionic devices: A review with a focus on cortical visual prostheses. Brain Res. 2015, 1595, 51–73. [Google Scholar] [CrossRef]
  52. Xing, W.; Yin, M.; Lv, Q.; Hu, Y.; Liu, C.; Zhang, J. Oxygen Solubility, Diffusion Coefficient, and Solution Viscosity. In Rotating Electrode Methods and Oxygen Reduction Electrocatalysts; Elsevier: Amsterdam, The Netherlands, 2014. [Google Scholar]
  53. Bashkatov, A.N.; Genina, E.A.; Sinichkin, Y.P.; Kochubey, V.I.; Lakodina, N.A.; Tuchin, V.V. Glucose and mannitol diffusion in human dura mater. Biophys. J. 2003, 85, 3310–3318. [Google Scholar] [CrossRef] [PubMed] [PubMed Central]
  54. La Malfa, F.; Di Lorenzo, M.; Qualtieri, A.; De Vittorio, M.; Rizzi, F.; Desmaële, D. A novel flexible conductive sponge-like electrode capable of generating electrical energy from the direct oxidation of aqueous glucose. In Journal of Physics: Conference Series, Proceedings of the Journal of Physics: Conference Series, Daytona Beach, FL, USA, 4–7 December 2018; IOP Publishing: Philadelphia, PA, USA, 2019; Volume 1407. [Google Scholar] [CrossRef]
  55. Chen, Y.; Prasad, K.P.; Wang, X.; Pang, H.; Yan, R.; Than, A.; Chan-Park, M.B.; Chen, P. Enzymeless multi-sugar fuel cells with high power output based on 3D graphene–Co3O4 hybrid electrodes. Phys. Chem. Chem. Phys. 2013, 15, 9170–9176. [Google Scholar] [CrossRef] [PubMed]
  56. Available online: https://www.ciamedical.com/insights/iv-catheter-sizes/ (accessed on 22 October 2025).
  57. Limperg, T.B.; Novoa, V.Y.; Curlin, H.L.; Veersema, S. 2024. Laparoscopic Trocars: Marketed Versus True Dimensions–A Descriptive Study. J. Minim. Invasive Gynecol. 2024, 31, 304–308. [Google Scholar] [CrossRef]
  58. Available online: https://www.dipolerfid.com/product/rfid-tags-for-animal-identification (accessed on 22 October 2025).
  59. Beurskens, N.E.G.; Tjong, F.V.Y.; Knops, R.E. End-of-life management of leadless cardiac pacemaker therapy. Arrhythmia Electrophysiol. Rev. 2017, 6, 129–133. [Google Scholar] [CrossRef]
  60. Available online: https://newatlas.com/computers/mibmi-text-accuracy/ (accessed on 22 October 2025).
  61. Drake, R.F.; Kusserow, B.K.; Messinger, S.; Matsuda, S. A tissue implantable fuel cell power supply. ASAIO J. 1970, 16, 199–205. [Google Scholar]
  62. He, Z.; Yang, X.; Wang, N.; Mu, L.; Pan, J.; Lan, X.; Li, H.; Deng, F. Anti-Biofouling Polymers with Special Surface Wettability for Biomedical Applications. Front. Bioeng. Biotechnol. 2021, 9, 807357. [Google Scholar] [CrossRef] [PubMed]
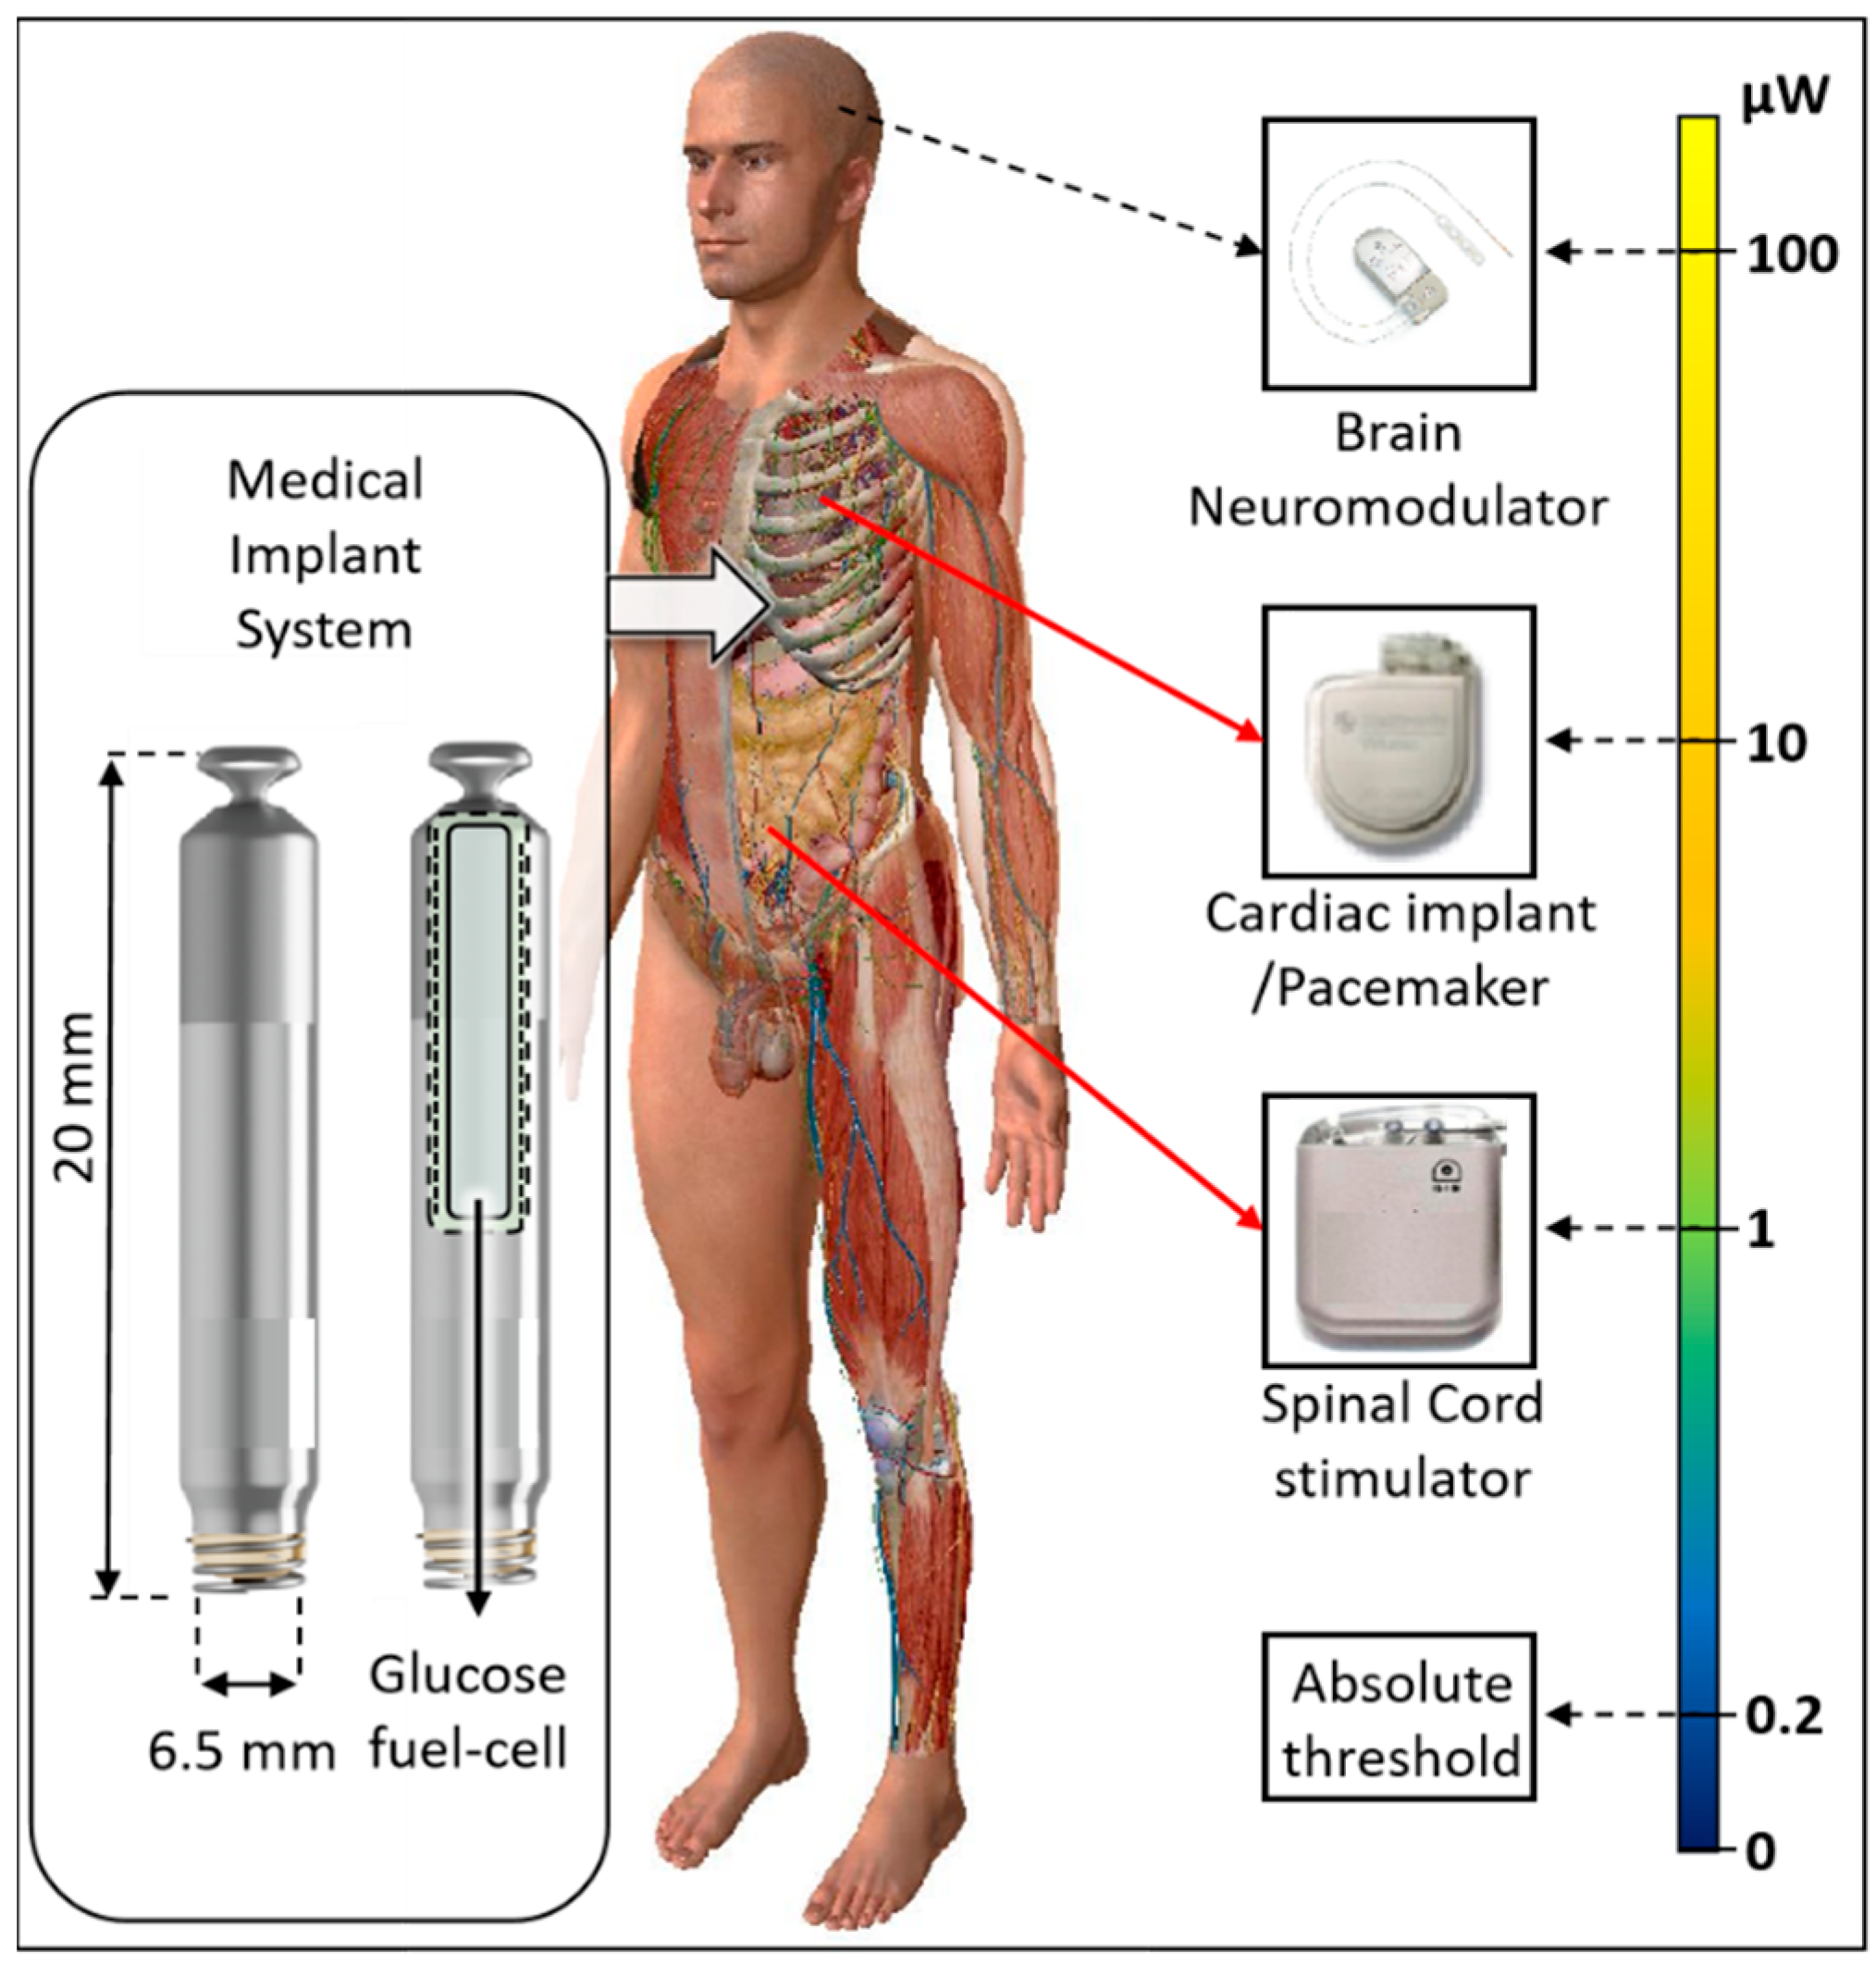
Figure 1. The concept of power provision for Active Implantable Medical Devices. (Left) How a conceptual fuel cell could replace the battery section of an existing implant. (Right) The range of power requirements for different types of implants.
Prosthesis 07 00136 g001
Figure 2. The chemical reaction facilitating the fuel cell. The red dashed arrow shows the direction of electron flow, while the red solid arrow shows the direction of current flow.
Prosthesis 07 00136 g002
Figure 3. Comparison of the power density of glucose enzymatic and abiotic fuel cells from past literature. Blue dots show past glucose enzymatic fuel cell research, red dots show past glucose abiotic fuel cell research. Three scenarios were established corresponding to three base response rates. Scenario 1 refers to a past research paper that did not involve in vivo experimentation and is, therefore, considered the ideal result [28,29,31,36,37,38,39,40,41,42,43,44,45,46]. Scenario 2 is the hypothetical real-world result, i.e., 10 percent of Scenario 1, and Scenario 3 is the worst possible result, i.e., 1 percent of Scenario 1.
Prosthesis 07 00136 g003
Figure 4. The structure of an abiotic fuel cell. (a) The global 3D architecture with multiple panels is the basis of this work. (b) The topology of a single panel. (c) The surface structure of individual fuel cell electrodes. (d) The fuel cell electrode nanostructure.
Prosthesis 07 00136 g004
Figure 5. (a) Schematic of a 4-unit abiotic fuel cell system with a central diffusion cavity. (b) Schematic of a 4-unit abiotic fuel cell system without a diffusion cavity. (c) A 3D and 2D demonstration of diffusion and surface reactions in separation in COMSOL. The 2D viewpoint shows the flow direction and concentration gradient of glucose and oxygen in separation.
Prosthesis 07 00136 g005
Figure 6. (a). A dog radio frequency identification (RFID) tag. (b). Typical 12−16-gauge RFID insertion syringe. (c). A catheter-delivered cardiac pacemaker unit (Medtronic Micra). (d). The Neuralink control unit. (e). A 3D rendering of pill-shaped and coin-shaped implantable fuel cell used for simulation. The key parameter is the separation (S) between units. (f,g). Schematic diagrams of individual units of coin-shaped and pill-shaped fuel cells used for simulation. Their key parameters are unit size and diffusion cavity size.
Prosthesis 07 00136 g006
Figure 7. The simulation method. The concentration gradient of glucose is calculated across the surface of the different structures. The power generation is then calculated and integrated for different parameters of area and separation. The highlighted areas in the heatmap on the right show higher power, while the line graph shows the trend of power in different areas (different colored lines) and at different separations.
Prosthesis 07 00136 g007
Figure 8. From left to right are the power of cylinder model single power unit when the reaction rate is 2.5 × 10⁻⁶, 2.5 × 10⁻⁷, and 2.5 × 10⁻⁸ (mol) s−1m−2. The highlighted areas in the heatmap at the top of subfigures show higher power. The line graphs at the bottom of subfigures clearly show the trend of single-unit power at different areas with different separations.
Prosthesis 07 00136 g008
Figure 9. From left to right are the power of rectangular unit model single power unit when the reaction rate is 2.5 × 10⁻⁶, 2.5 × 10⁻⁷, and 2.5 × 10⁻⁸ (mol) s−1m−2. The highlighted areas in the heatmap at the top of subfigures show higher power. The line graphs at the bottom of subfigures clearly show the trend of single-unit power at different areas with different separations.
Prosthesis 07 00136 g009
Figure 10. From left to right are the total power of the cylinder model when the reaction rate is 2.5 × 10⁻⁶, 2.5 × 10⁻⁷, and 2.5 × 10⁻⁸ (mol) s−1m−2. The highlighted areas in the heatmap at the top of subfigures show higher power. The line graphs at the bottom of subfigures clearly show the trend of multi-unit power for different areas with different separations. The maximum power is when the separation is close to 60 μm.
Prosthesis 07 00136 g010
Figure 11. From left to right are the total power of the rectangular unit model when the reaction rate is 2.5 × 10⁻⁶, 2.5 × 10⁻⁷, and 2.5 × 10⁻⁸ (mol) s−1m−2. The red arrow points to the maximum power. The highlighted areas in the heatmap at the top of subfigures show higher power. The line graphs at the bottom of subfigures clearly show the trend of multi-unit power for different areas with different separations. The maximum power occurs when the separation is approximately 60 μm.
Prosthesis 07 00136 g011
Figure 12. The relationship between total energy and size when the reaction rate is 2.5 × 10⁻⁷ (mol) s−1m−2, with the pill-type generator unit without diffusion cavities on the left and the coin-type generator unit without cavities on the right. Total power and size are not linearly related.
Prosthesis 07 00136 g012
Figure 13. The power generated by a single generating unit and multiple generating units when the base rate is 2.5 × 10⁻⁷, (mol) s−1m−2. The red arrows show the maximum power at each separation. The highlighted areas in the heatmap at the top of subfigures show higher power. The line graphs at the bottom of subfigures clearly show the trend of single-unit and multiple-unit power at different areas with different separations. Below the red line (1 μW) is cannot work.
Prosthesis 07 00136 g013
Figure 14. (a). Viewing the fuel cell as a series connection of Thevenin equivalent circuit, i.e., a voltage source with higher voltage but lower current, and ZT is Thevenin impedance. (b). Viewing the fuel cell as a parallel connection of Norton equivalent circuit, i.e., a current source with higher current but lower voltage, and ZN is Norton impedance. (c). A combination of the two, which is probably the best choice.
Prosthesis 07 00136 g014
Figure 15. A manufacturable ideal model. It represents that the broad pill-shaped unit’s size is 1.5–15 × 6 mm (with power ~9–57 μW), and the coin-shaped unit’s diameter is 6.18–17.48 mm (with power ~28–116 μW), and there are 8 power-generating units. Their anode material is gold, and their cathode material is platinum.
Prosthesis 07 00136 g015
Figure 16. Comparison of an abiotic glucose fuel cell with existing medical implantable batteries: the red and black points indicate the lifetimes of existing batteries, calculated based on varying power consumption and curve fitting. Given the long projected lifetime of an abiotic glucose fuel cell, the yellow region of the graph represents the area considered advantageous. In addition, size is limited due to the presence of factors such as encapsulation.
Prosthesis 07 00136 g016
Table 1. Range of power consumption for different classes of medical implants.
ImplantPower Range
(μW)
Lifetime with a 10 mL BatteryLifetime with a 1 mL BatteryLifetime with a 50 µL BatteryRefs.
Bioelectronic medicine<10>118
years
>11
years
>7
months
[13,15]
Pacemaker~10–100~11–118 years~1–11
years
~0.6–7
months
[13]
Neuro-
stimulator
~100–400~3–11
years
~0.3–1
year
~0.1–0.6
months
[14]
Sensory
prosthetics
>10,000Wireless powerWireless powerWireless power[16]
Table 2. Chemical parameters used in the model.
Module ParametersValueUnit
Diffusion coefficientGlucose: 0.9 × 10⁻⁹
Oxygen: 3 × 10⁻⁹
m2 s−1
Boundary glucose concentration5mMol L−1
Boundary oxygen concentration4.5mMol L−1
Basic surface reaction rate2.5 × 10−6
2.5 × 10⁻⁷
2.5 × 10⁻⁸
(mol) s−1m−2
Table 3. Physical parameters of the models.
ParameterValuesUnit
ThicknessT0.1mm
SeparationS0.01, 0.06, 0.1, 0.3, 0.9, 1.23, 1.9, 3.9, 7.9mm
Cylinder
Outer diameter D o 6.18, 8.74, 12.36, 17.48mm
AreaA30, 60, 120, 240mm2
Block without a diffusion cavity
WidthW6mm
LengthL1.5, 3, 6, 10, 15mm
AreaA9, 18, 36, 60, 90mm2
Cylinder with a diffusion cavity
Outer diameter D o 8.74mm
Inner diameter (cavity) D i 1.994, 3.384, 4.37, 5.17mm
AreaA57, 51, 45, 39,mm2
Block with a diffusion cavity
Outer length L O 10mm
Inner length (cavity) L i 3, 6, 7.5, 7mm
Outer width W O 6mm
Inner width (cavity) W i 1, 1.5, 2, 3mm
AreaA57, 51,45, 39mm2
Table 4. Parameters of the final model.
Module ParametersValueUnit
Separation0.9mm
Thickness of the generator unit0.1mm
Number of generation units8
Basic surface reaction rate2.5   × 10 6 (mol) s−1m−2
Pill-shaped device
Length1.5–15mm
Width6mm
Area9–90mm2
Total Power (range)~9–57μW
Disc-shaped device
Diameter6.18–17.48mm
Area30–240mm2
Total Power range~28–116μW
Disclaimer/Publisher’s Note: The statements, opinions and data contained in all publications are solely those of the individual author(s) and contributor(s) and not of MDPI and/or the editor(s). MDPI and/or the editor(s) disclaim responsibility for any injury to people or property resulting from any ideas, methods, instructions or products referred to in the content.