Abstract
Background: A promising improvement in orthodontic diagnostics is the use of convolutional neural networks (CNNs) to predict skeletal maturity using dental radiographic data, namely the calcification phases of the lower canine. Objectives: The purpose of this study is to improve the prediction of skeletal growth maturation through the use of sophisticated deep learning techniques, particularly CNNs, in the analysis of orthopantomography developmental markers. Methods: The CNN was trained and validated using the suggested model, which enables precise assessment of skeletal maturity across data collected from patients undergoing orthodontic and dental evaluations. By using a multiclass classification framework to classify the various stages of skeletal maturation. Results: CNN model predicting the development of the lower canine from the second molar provided a test accuracy of 97.50%, the model made it possible to automatically interpret radiographic features that were previously evaluated manually. Conclusions: CNN models can be trained to correctly identify the lower canine calcification stage, this helped clinicians with treatment planning and timing, especially with regard to growth modification, implant, prosthodontics approach and its clinical applicability. It guarantees ethical imaging procedures and optimizes clinical workflows by doing away with the necessity for further imaging.
1. Introduction
In recent years, there has been growing interest in the use of artificial intelligence (AI) in orthodontics. For example, AI is expected to replace the laborious manual identification of multiple anatomical landmarks on cephalograms and three-dimensional CBCT images [1,2,3,4].
Increasing the number of training sessions enhanced the effectiveness of the AI models [5]. Growing advances in artificial intelligence (AI), especially convolutional neural networks (CNNs), hold promise for non-invasive, effective, and highly accurate growth prediction tools using current diagnostic records like OPGs. Accurate assessment of skeletal maturation is essential for timing orthodontic and prosthodontic interventions [6]. Studies have looked at the predictive association between lower second molar calcification and lower canine developmental stage, which are important indicators for determining when the maximum will occur based only on the lower second molars’ calcification stage using OPGs [7]. In addition to orthodontists, prosthodontists who plan growth-sensitive therapies may find this method to be very helpful.
In order to produce precise information and forecasts, models can identify intricate patterns in images, text, audio, and other types of data [8]. Kim et al.’s 2023 study tested machine- and statistically predicted skeletal landmarks, linear, and angular parameters using longitudinal lateral cephalometric radiographs [9]. The study found that linear individualized orthodontic growth projection had the highest accuracy, 97.87%. The ability of AI classifiers to identify skeletal development stages using hand-wrist radiographs was also investigated by Gonca et al. in 2024 [10]. Although techniques like hand-wrist radiography and cervical vertebral maturation (CVM) have been employed historically, they necessitate lateral cephalograms and expose patients to extra radiation. CNNs may reliably predict skeletal maturation stages utilizing cervical vertebrae [7] and second molar calcification patterns, according to a recent study by Mohammed et al. (2024) [6].
The use of deep learning in software has sped up image processing processes. An artificial intelligence technique called deep learning teaches computers to evaluate data similarly to how the human brain does. In order to produce precise information and predictions, deep learning models can identify intricate patterns in text, audio, images, and other types of data [8].
In a study conducted by Koch et al., 2025, a custom CNN that was trained using 20,000 OPGs was able to produce age estimation results that were on par with those of forensic specialists [11]. Using gradients from the target class—age—that flow into the last convolutional layer, the method produced a heatmap that included into account information beyond teeth and dental roots. With the help of the jaw, periodontal membrane, paranasal sinus, and maxillary sinus, among other non-dental aspects of the entire head region, the CNN improves the accuracy of age assessment [10].
High accuracy and multiple skeletal features make the model suitable for individualized orthodontic growth projection [9]. It was observed that fractal dimension analysis, when applied in isolation, lacks sufficient accuracy for predicting maturation stages. However, its integration with Chapman stage, chronological age, and sex substantially enhances the model’s ability to estimate skeletal growth rates in developing individuals [10].
An interesting study used salivary biomarkers to find a less invasive orthodontic skeletal maturity test than radiography. 3 multinomial logistic regression models predicted CVM stages using age, gender, and biomarker levels. Model 3 (which contained all factors) had the highest prediction accuracy at 76.4%. The results imply that salivary ALP and IGF−1 levels and demographic characteristics can be used to determine optimal orthodontic treatment time objectively and non-invasively [12].
All the previous studies utilize more than one variable to predict the puberty age which may be difficult to obtain, In this study, skeletal growth maturation utilizing can be accurately predicted by Convolutional Neural Network-based deep learning techniques, employing the calcification level of the lower canine, to facilitate the detection of skeletal maturation from OPG images only.
No prior research has utilized multiclass classification for picture recognition, representing a notable progression in the application of AI for preventive strategies in dentistry by introducing a novel method for predicting lower canine development based on the calcification stage of the lower second molars using OPGs alone. This approach could be highly beneficial not only for orthodontists but also for prosthodontics’ involved in planning growth-sensitive interventions. Earlier deep-learning studies on panoramic radiographs have focused on dental or chronological age estimation from whole images or single-tooth stages, or on skeletal maturity via CVM/hand–wrist methods; none have used a sequential, multiclass CNN to predict the mandibular canine developmental stage from the lower second molar ROI (Region of interest) alone. This cross-tooth, ROI-based inference fills a methodological gap between biologically correlated teeth and AI-enabled maturation assessment, thereby extending prior dental-age and CVM-based approaches.
We hypothesize that convolutional neural network (CNN)-based analysis of panoramic radiographs (OPGs), using the calcification stage of the lower second molar, can accurately predict the developmental stage of the mandibular canine. This automated approach will provide a reliable, non-invasive, and reproducible alternative to conventional skeletal maturity assessment methods, thereby minimizing radiation exposure and reducing diagnostic subjectivity.
2. Materials and Methods
2.1. Study Design and Ethical Approval
This study aimed to retrospectively perform a cross-sectional diagnostic analysis using deep learning to predict the developmental stages of the lower canine with lower second molar calcification patterns as visualized in the OPGs. From January to July 2025, this study was carried out at the University of Sulaimani’s College of Dentistry, with approval from the Committee of Ethics and Scientific Research No. 320/25. The present study was conducted in accordance with the principles outlined in the Declaration of Helsinki, and all data were anonymized before analysis.
2.2. Sample Selection and Inclusion Criteria
A total of 1200 digital OPGs were collected retrospectively from academic and private dental centers. The sample was 600 males and 600 females aged 8–16. The inclusion criteria were OPGs with adequate quality; both the lower 2nd molars and canines are clearly visualized as in Figure 1, no systemic disease, craniofacial syndrome, and no previous orthodontic treatment. Examinations with inadequate image quality, overlapping dental structures, or incomplete records were excluded.
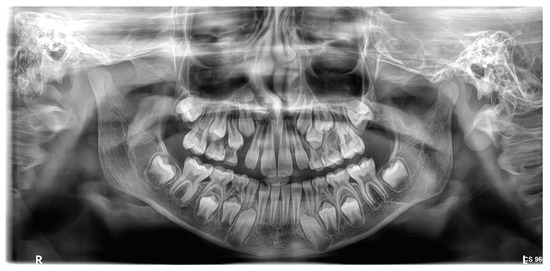
Figure 1.
Both the lower 2nd molars and canines are clearly visualized as in OPG image.
All train/validation/test splits were performed at the patient level to prevent data leakage between the train/validation/test sets and to ensure true generalization. Each OPG image was cropped and labeled independently into two ROIs: one for the lower second molar and another for the lower canine. Nonetheless, both ROIs from the same patient were put into the same dataset split (train, validation, or test). As such, ensuring that no cropped image and corresponding label emanating from the same individual was present in two subsets. The agreement of inter-rater was evaluated by using Cohen’s Kappa, which yielded a value of k = 0.9, this result indicate a strong agreement between annotators.
The CNN architecture consisted of three convolutional layers to balance between complexity and computation power because of moderate size of our dataset. Three layers was used because it was enough abstraction and did not lead to overfitting. Based on previous literature and experimentation, a dropout rate of 0.5 was applied to mitigate overfitting while maximizing generalizability. Large hyperparameter grid search was not performed but quick tests of more shallow and deeper networks (e.g., two or five convolutional layers) gave worse results on the validation accuracy and ended up longer to train. Therefore, the final architecture was selected based on the best-performing architecture in preliminary tests.
2.3. Image Annotations and Labeling
Two experienced orthodontists, blinded to the study’s aims, independently assessed each OPG. The tooth development of the lower second molars and lower canines was determined using the classification system of Demirjian [13], which subdivides tooth development into developmental stages C through H and is therefore well-established as an evaluative technique for dental maturity, making it beneficial for radiographic analysis of patients [10].
To standardize the assessment and preprocess the images for ML (Machine Learning), each image is individually cropped to isolate the region of interest (ROI) circumscribing the lower second molar and lower canine. Each of these cropped ROIs was saved as a separate image file and named according to the appropriate Demirjian stage. Such a narrowed-down query reduced noise in the form of background data, thereby providing more precise training input to CNN models.
Cohen’s kappa coefficient (κ) was used to assess interrater agreement and ensure the reliability of the annotations. In the event of divergence, the two authors reached a consensus through a joint review. These labeled, cropped images were then used as ground truth, which were in turn used for training and validating the deep learning models. Figure 2 shows the cropped images.
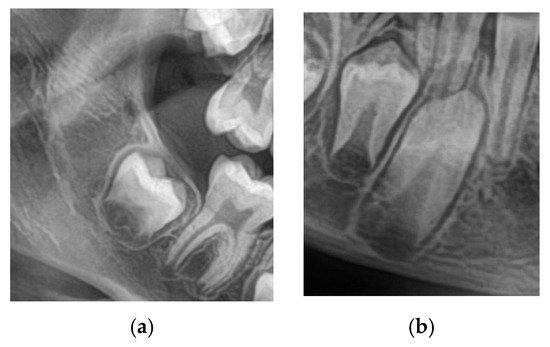
Figure 2.
(a) Cropped lower 2nd Molar. (b) Cropped lower Canine.
2.4. Image Preprocessing
The preprocessing technique is implemented on each image after annotation to standardize the data and enhance the model’s robustness. An image of the ROI surrounding the lower second molar and lower canine was manually cropped and resized to 128 × 128 pixels. Most background noise was removed by applying a non-local means filter, preserving anatomical boundaries from blurring. The pixel values were normalized to the range of (0, 1) values.
Data augmentation was employed during training to enhance generalizability and prevent overfitting. These comprised random horizontal flipping, rotation (±15 degrees), zooming (±10%), and brightness shifts. These processes ensured that, while the data split was class-preserving, the model would learn from diverse representations.
2.5. Model Architecture and Modeling
Two CNNs were created. The first model (Model A) was trained to classify the developmental stage of the lower second molar. In the second model (Model B), the molar input was selected to predict the developmental stage of the lower canine.
Every CNN is simply three convolutional layers with ReLU activations, followed by max pooling layers to down-sample the features spatially.
Our approach aligns with prior CNN applications in medical and dental imaging, where relatively shallow networks have been effective. For example, Lee et al. (2020) [14] used a CNN with four convolutional layers to classify dental developmental stages on panoramic images with high accuracy. Similarly, Wallraff et al. (2021) [15] applied CNNs with three to five convolutional layers for dental age estimation, achieving AUC values exceeding 0.90. These architectures contrast with very deep networks (e.g., ResNet-50, DenseNet) frequently used in general medical imaging tasks, which require much larger annotated datasets to avoid overfitting (Rokhshad et al., 2025) [16]. By employing three convolutional layers, our study ensures sufficient complexity to capture the morphological variations in calcification stages while remaining computationally efficient and clinically practical for integration into real-world diagnostic workflows. Beside ReLU activation function was applied after each of the three convolutional layers that comprised the CNN architecture. Given the size of the dataset, this configuration was selected to preserve a balance between representational power and overfitting risk. Due to its demonstrated ability to accelerate training and mitigate vanishing gradient problems, ReLU was selected. Preliminary experiments tested deeper architectures, but they frequently resulted in overfitting and did not produce appreciable accuracy gains. This design aligns with several earlier studies in medical imaging and dentistry, where moderately deep CNNs (3 to 4 layers) have demonstrated generalization while achieving high classification accuracy.
In order to combat overfitting, dropout layers (rate 0.5) were used. The last output layer was a fully connected dense layer with a SoftMax activation function for multi-class classification. The SoftMax equation is shown as follows.
where zj is logit (raw output) for class j, and C is the total number of classes.
The cross-entropy loss function and the Adam optimizer with a learning rate of 0.001 were used to train the model.
In order to maintain class balance, the dataset was further divided into training and validation sets, with 80% and 20% allotted, respectively, using a stratified sampling technique. The training process was conducted by using over 50 epochs with a batch size of 32. Early stopping and model checking points were employed based on validation loss. Although an 80–20% split was applied in this study, future work should incorporate k-fold cross-validation (e.g., 5- or 10-fold) to evaluate model stability across multiple data partitions. Such approaches would ensure that the reported accuracy is not influenced by a particular dataset split and would provide more comprehensive insight into the generalizability of the model. Additionally, external validation on independent datasets would represent the most rigorous method to confirm the reproducibility and consistency of the results.
Figure 3 illustrates the diagram of the CNN architecture model, which displays the activation functions of the layers and the output layers. Each model consists of three convolutional layers activated with rectified linear unit (ReLU) functions, followed by max-pooling layers that reduce the spatial dimensions and extract the most relevant features. Dropout layers (rate = 0.5) were incorporated to minimize overfitting by randomly deactivating a subset of neurons during training. The final fully connected dense layer, equipped with a SoftMax activation function, outputs the probability distribution across multiple Demirjian developmental stages (C–H). The diagram highlights the sequential flow of data from input (cropped ROI of the lower second molar or canine) through convolutional feature extraction, pooling, and dropout, to the classification output. This layered structure allows the model to progressively learn hierarchical features of dental calcification patterns and reliably assign developmental stages. The complete model pipeline is shown in Figure 3. As in any pipeline, the input OPG image goes through a preprocessing step, which includes cropping the image to the relevant regions. In this case, the relevant regions are the areas containing the canines and the molars, henceforth referred to as ROIs. In the subsequent steps, each ROI is processed through the appropriate branch of the CNN; the canine crop goes through the branch dedicated to canine classification and the molar crop goes through the branch for molar classification. The classification of Demirjian stages is carried out in each branch after going through several convolutional and pooling layers in order to extract the relevant features. The model can specialize for the different anatomical features of canines and molars because of the separate pathways.
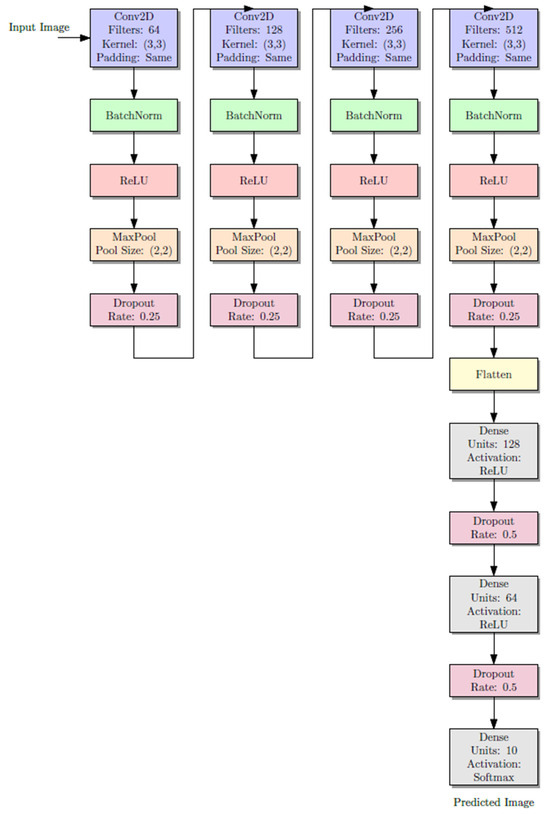
Figure 3.
Architecture Model Design of CNN.
2.5.1. Strategy of Predictions
The prediction strategy involved a sequential deep learning design using two CNN models trained independently. Model A (the first model) was constructed to identify the developmental stage of the lower second molar from the cropped ROI of the OPG. The lower canine’s developmental stage that corresponded to the anticipated second molar stage was then predicted using the second model (Model B), which was fed the second molar image.
The second molar is initially assessed for maturity before being employed as a predictive signal to forecast the development of the lower canine in this two-stage architecture, which replicates a clinically realistic workflow. This pipeline makes use of the spatial-architectural properties that CNNs have learnt from the related radiographic textures and morphology, in contrast to traditional approaches that depend on statistical correlations or manual assessments. The result of Model B is a classification of the lower canine into one of the Demirjian stages (C–H) (Appendix A), enabling a classification of developmental maturity with minimal human input. This approach eliminates the need for manual feature extraction or supplementary imaging, enabling a completely automated decision-support framework based solely on OPG images. Figure 4 shows the complete architecture prediction pipeline. The duplication of the CNN input representation may have been misleading. We show two input- arrows to the CNN model (indicated by pink) to symbolize both canine and molar cropped images when are passed through the same CNN architecture for classification independently. These two streams are not identical; instead, they correspond to two kinds of ROI crops performed in distinct contexts of the pipeline.
2.5.2. Evaluation Metrics
The performance of CNN models evaluated using standard classification metrics (accuracy, precision, recall, F1-score, confusion matrix, and area under the receiver operating characteristic curve (AUC-ROC)), as well as standard metrics for predicting relevance to one of the classes.
In this case, TP (True Positive), FP (False Positive), and FN (False Negative) refer to the counts of correctly and incorrectly predicted classes by the model. These metrics are defined as follows:

Figure 4.
The pipeline workflow of the proposed model.
Figure 4.
The pipeline workflow of the proposed model.

Precision
The precision measures the number of correctly predicted positive samples among all predicted samples.
Recall
Recall measures the quantity of actual positives that the model correctly predicted
F1-Score
The F1-score metric is the harmonic mean of precision and recall, which is the balancing both aspects
Besides these metrics, confusion matrices were created to better illustrate the model’s performance throughout the developmental steps, visualizing predicted labels versus actual labels. The discrimination ability of the model with all phases was evaluated using ROC curves with matching AUCs.
All of the evaluation measures were calculated using the Python 3.11.13 packages scikit-learn, NumPy 2.3.2, and Matplotlib 3.10.6. Together, these metrics enabled a robust evaluation of the model’s performance in accurately classifying lower canine development based on second molar calcification.
2.6. Outcome Measures
The primary outcome was the correctness of the CNN model predicting the developmental status of the lower canine using only the ROI of the second molar. The second molar stage is most closely associated with the pubertal growth spurt, and the development of an AI-based diagnostic tool reproducible for clinical practice was a secondary outcome.
2.7. Hardware and Software
All models were implemented in Python using TensorFlow 2 deep learning frameworks and Keras. The work was conducted on Google Colab, a cloud-based environment with GPU acceleration. NVIDIA Tesla T4 (16 GB RAM)|Python 3 VM. The training and validation procedures were in the 3.10 runtime environment. Additionally, Documentation was prepared on the codebase and workflow for reproducibility, allowing the code to be run from both a cloud-based server and a local GPU.
3. Results
The performance of the developed deep-learning models was evaluated on a separate test set of 240 OPG images. Two main tasks were set: (1) classification of stages of calcification of lower second molars and (2) prediction of lower canine developmental stages (based on molar input). To analyze the results, we applied classification metrics (i.e., accuracy, precision, recall, and F1-score), confusion matrices, and area under the curve (AUC) from receiver operating characteristic (ROC) analysis.
3.1. Classification Lower Second Molar
The CNN trained for the classification of second molar calcification stages achieved an overall test accuracy and weighted F1-score of 94.17% (0.94, respectively). At every stage, performance was consistently good, with the highest F1-scores going to E, F, and G (0.99, 0.96, and 0.92, respectively). Misclassifications were minimal and between adjacent stages, particularly G and H, and C and D, consistent with the expected overlap in dental development.
Figure 5 presents the detailed classification results for each of the six Demirjian stages using a confusion matrix, which reveals that the vast majority of true positive predictions are located along the diagonal. The ROC curve, shown in Figure 6, revealed an AUC = 1.00 (with the exception of stage G: AUC = 0.99), suggesting excellent discriminatory power (stages C, D, E, F, and H: AUC = 1.00).
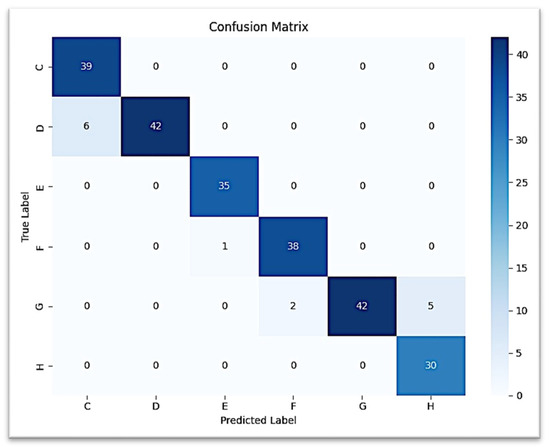
Figure 5.
Confusion Matrix for 2nd Molar.
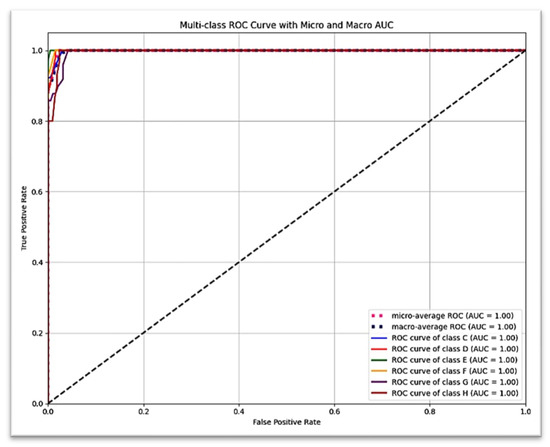
Figure 6.
AUC for 2nd Molar.
In our dataset, stages A and B of Demirjian’s classification were not represented because the study sample included individuals aged 8–16 years, an age range in which the lower second molars and canines have already progressed beyond the earliest calcification stages. At this developmental period, teeth are typically observed from stage C onward, when crown completion and initial root formation are more advanced and radiographically visible.
Therefore, only stages C–H were present in both the true labels and predicted labels. This explains why stages A and B do not appear in the classification outcomes. The focus on C–H stages is consistent with previous studies applying Demirjian’s method in orthodontic and forensic contexts, where younger age groups (below 6–7 years) are required to capture the earliest calcification stages.
3.2. Prediction of Lower Canine Based on Second Molar
The second CNN model predicting the development of the lower canine from the second molar ROI provided a test accuracy of 97.50% (0.975 weighted F1-score). Classification was perfect (F1 = 1.00) for stages C, D, and E. Stage F was predicted with high performance (precision = 0.95, recall = 1.00, F1 = 0.97), while stage H had lower precision (0.90) but retained perfect recall. Confusion occurred most often between stage G and stage H, with very few G samples classified as H.
The confusion matrix for canine prediction graphed in Figure 7 shows that almost all of the strong diagonal elements indicate the correct stage predicted stage. A similar multi-class ROC curve (Figure 8) suggests that the model is robust to all stages of canine development (AUC = 1.00 for all but G stages, which scored AUC = 0.99).
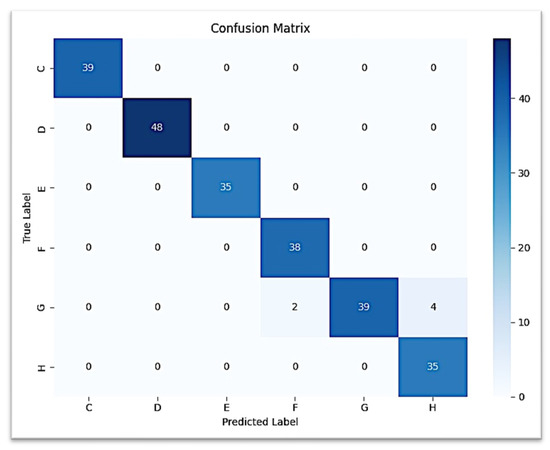
Figure 7.
Confusion Matrix for Canine.
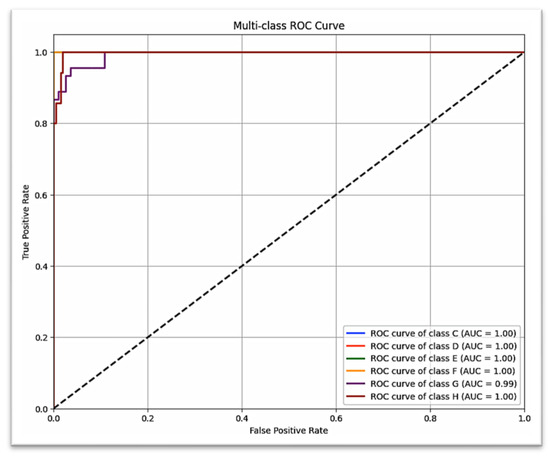
Figure 8.
AUC for Canine.
Although high accuracies were obtained (94.2% for molar classification and 97.5% for canine prediction), overfitting remains a potential concern in deep learning studies with moderately sized datasets. To address this, we used dropout regularization, data augmentation, and early stopping to reduce model variance. The performance consistency across both training and validation sets, together with biologically plausible misclassifications, supports the reliability of the results. Nonetheless, external validation on independent datasets and longitudinal samples will be necessary to definitively confirm that overfitting has not influenced model performance.
3.3. Comparative Performance Summary
A comparative overview of the two models can be found in Table 1. In nearly all classes, canine prediction model consistently performed better than molar classifier, and especially for precision and recall of latter development stages. These findings corroborate the hypothesis that second molar classification stages can be useful for predicting lower canine development as found by AI models.

Table 1.
Result Summary of Canine and Molar Predictions.
4. Discussion
This is the first study to apply CNN-based prediction of lower canine development using lower second molar calcification data from OPGs. It offers a non-invasive, radiation-free, and clinically accessible method for growth assessment. Unlike prior work focused on cervical vertebrae or chronological age, this research emphasizes dental maturation correlation, potentially transforming how clinicians approach timing for growth-sensitive interventions.
A promising improvement in orthodontic diagnostics is the use of convolutional neural networks to predict skeletal maturity using dental radiographic data, namely the calcification phases of the lower canine. Though dependable, the conventional methods of skeletal maturity assessment—cervical vertebral maturation phases or hand-wrist radiographs—involve extra radiation exposure. There is evidence that the phases of dental calcification, particularly in the mandibular canine, are indications of skeletal development and coincide with pubertal growth spurts [17,18]. Incorporating CNN algorithms into this evaluation enables automated, objective, and effective interpretation of radiographic images, potentially lowering diagnostic subjectivity and variability [14]. According to recent research, CNN models can be trained to correctly identify the lower canine calcification stage by employing Demirjian. These models may identify subtle differences in mineralization patterns and categorize them into suitable development stages by comparing OPGs [14]. Since CNNs can learn intricate spatial hierarchies, they are well-suited to this task and can distinguish between the subtle variations in tooth development that match up with skeletal growth phases. Using OPGs, a common imaging tool in orthodontics, to track the lower canine’s growth is a great way to anticipate when the skeleton will be fully developed [13]. Additionally, in accordance with the ALARA (As Low As Reasonably Achievable) criterion of radiographic exposure [18], CNN-based techniques do away with the necessity for extra radiographs. Still, we need to figure out how to overcome these restrictions. CNN model accuracy may be impacted by image quality, patient age distribution, and ethnicity. The data of this work was obtained from several academic and private dental centers in Sulaimani and Erbil cities. Although most of the population in these areas is Kurdish, there are also Arabic, Turkish, and other ethnic groups represented. Our study did not take these ethnic differences into account when estimating growth stages, since they are unrelated to dental calcification. In addition, widely used reference tables, which indicate that the peak growth spurt occurs between 12 and 14 years in boys and 11–13 years in girls, cannot be consistently applied to populations of different ethnic backgrounds in the present day.
The model’s performance may be affected by the categorization scheme as well as the ground truth annotations provided by human experts [14,18]. To expand their clinical use, convolutional neural networks (CNNs) trained on larger and more diverse datasets should have their predictions validated using longitudinal growth data and gold standard maturity markers [17,18]. Lastly, CNN-based evaluation of lower canine calcification offers a consistent, non-invasive, and radiation-free substitute for skeletal maturity assessment. This approach could be used to help determine when to administer growth-modification therapies if it is clinically validated and refined further to be part of regular orthodontic screening.
Because of its high link with the pubertal growth spurt, the mandibular (lower) canine is frequently utilized in skeletal maturity assessment and is a valid predictor for determining the best time to receive orthodontic treatment [17,18]. Panoramic radiography has been the most used types of imaging modalities for age estimation [19]. According to the ALARA principle, evaluating the lower canine does not necessitate additional radiographic exposure because OPGs are frequently utilized in orthodontic diagnosis [20]. Furthermore, the lower canine is well suited for automated classification using convolutional neural networks (CNNs), which can accurately and rapidly examine developmental stages, due to its distinct morphological traits and obvious visibility [14]. It also erupts before the second molars. The lower canine is a non-invasive and efficient marker for skeletal maturity assessment because of its biological dependability, imaging accessibility, and AI technology compatibility. Making accurate diagnoses and developing successful treatment plans requires a thorough grasp of children’s growth and developmental trends [17]. Determining the beginning and peak of the pubertal growth surge is crucial for growth modification procedures in particular [18].
In order to make sure that therapies follow a patient’s developmental trajectory, skeletal growth prediction is crucial in orthodontics and orthognathic surgery. It enables orthodontists to address skeletal issues effectively and achieve better treatment results. Ongoing assessments and collaboration between orthodontists and other healthcare providers are important for forecasting and managing skeletal development. One of the most important stages of skeletal transformation is the teenage growth spurt, especially during puberty. For appropriate treatment planning, it is essential to precisely determine the onset and magnitude of this expansion. This prediction is especially important when considering dental implants in growing individuals or in regions where active skeletal development could impact the implants’ long-term stability [6].
As conventional methods like CVM and hand-wrist radiographs provide reliable indicators of skeletal maturity, they also introduce additional radiation exposure and procedural complexity [21], so this study addressed a clinical gap by exploring the predictive link between lower second molar calcification and lower canine development to offer an accurate, non-invasive alternative to traditional skeletal maturity assessments by implementing a CNN-based deep learning approach on routinely panoramic radiographs as they are already part of standard orthodontic and pediatric dental records. Two deep-learning CNN models was assessed: one designed to classify lower second molar calcification stages, and another developed to predict lower canine developmental stages based on the molar’s ROI.
The model trained to classify the lower second molar achieved a test accuracy of 94.2% and a weighted F1-score of 0.94, affirming its interpretability in classifying Demirjian stages based on calcification patterns. The next model, which predicts development stage of the lower mandibular canine from the second molar region only, was even stronger, with a test accuracy of 97.5% and a weighted F1-score of 0.975. These findings provide additional support for the argument that the calcification stage of the second molar provides enough dental information to be used as a substitution for later-stage dental development, including that of the mandibular canine, which is highly associated with the timing of the pubertal growth spurt, The anatomical complexity might explain the observed disparity in accuracy between the canine and second molar classification tasks. Compared to the single-rooted canines, second molars are multi-rooted and have a more complex radiographic anatomy which can be more beneficial for CNN models to learn from. This difference in anatomy might impact the model’s differentiating proficiency for the developmental stages and needs to be investigated in studies aimed at model generalizability for different tooth types.
Early studies have evaluated the potential of artificial intelligence in estimating skeletal and dental maturation, particularly using the cervical vertebral maturation method and chronological age. For instance, Mohammed et al. (2024) demonstrated that CNNs can be used to accurately categorize cervical vertebral maturation stages from lateral cephalometric radiographs, resulting in high concordance with clinician annotations [6]. According to Wallraff et al. (2021), deep learning models have also been effectively used to evaluate dental and chronological age using panoramic photos [15]. These studies, however, ignored the relationships between various dental traits and instead concentrated more on single dental features.
In order to validate the ability of deep learning to model dental growth patterns, Balel et al. (2025) extended this line of work by creating a CNN-based method for predicting chronological age using OPGs [22]. The ability of CNNs to provide fully automated dental age evaluation based on full panoramic pictures in the pediatric population was also shown by Rokhshad et al. (2025), offering a promising non-invasive screening tool [16].
Although the proposed CNN models demonstrated high accuracy, the absence of external validation using datasets from different populations limits the generalizability of the findings. Future research should test the model across larger and ethnically diverse cohorts to confirm its robustness. Moreover, comparative studies are needed to benchmark our CNN framework against alternative machine learning models (e.g., Random Forests, SVMs, ensemble methods) and against expert orthodontic assessments, in order to validate its clinical applicability and justify its superiority over traditional approaches.
The practical implications of this study are significant. By providing an automated, objective, and reproducible method of predicting skeletal growth stages from panoramic radiographs that are already part of routine dental records. However, several impediments may hinder its immediate clinical implementation. First, the model has not yet undergone external validation on datasets from different populations; thus, its generalizability remains uncertain. Second, the model’s performance depends on the quality and standardization of radiographic images, which can vary across centers due to equipment differences and patient positioning. Third, integration into clinical workflows requires user-friendly software interfaces and regulatory approval, which may present logistical and legal challenges. Finally, clinicians may show resistance to relying on AI-based predictions without transparent interpretability, highlighting the need for explainable AI frameworks to build trust. Addressing these barriers will be critical for translating the model from research into routine orthodontic and prosthodontic practice.
5. Limitation
Despite the promising outcomes of this study, several limitations should be acknowledged. First, the sample was retrospectively collected from a limited geographic region (Sulaimani and Erbil), which may restrict the generalizability of the findings to populations with different ethnic, genetic, or environmental backgrounds. Second, although efforts were made to ensure image quality, variations in radiographic resolution, angulation, and patient positioning could have influenced the CNN model’s performance. Third, the study design was cross-sectional, preventing the evaluation of longitudinal growth changes; future validation using longitudinal data and gold-standard skeletal maturity indicators is necessary. Fourth, the CNN relied on annotations based on the Demirjian classification system, which, despite being widely used, may introduce inter-observer variability. Additionally, although the model demonstrated high accuracy, overfitting remains a potential risk due to reliance on a single dataset. Finally, clinical applicability requires external validation on larger and more diverse datasets before the model can be recommended for routine diagnostic use.
6. Conclusions
An accurate and non-invasive substitute for conventional techniques is the CNN-based prediction of skeletal maturity utilizing mandibular canine calcification. This method minimizes radiation exposure and is consistent with the ALARA concept, utilizing panoramic radiographs already taken in routine practice. Because of its strong correlation with pubertal development, the lower canine is a perfect anatomical landmark for AI-driven evaluation. This method has possible uses in pediatric and forensic dentistry and promotes the best possible treatment scheduling in orthodontics and prosthodontics. It guarantees ethical imaging procedures and optimizes clinical workflows by doing away with the necessity for further imaging.
AI enhances diagnostic reliability by eliminating subjectivity, improves efficiency through automation, and enables consistent interpretation across large populations. Thus, AI should not be viewed merely as a tool to reduce radiation but as a transformative approach that standardizes growth assessment and supports clinicians in making more accurate, timely, and individualized treatment decisions.
Author Contributions
Conceptualization, M.H.M. and T.M.A.M.; methodology, M.H.M., T.M.A.M., F.A.K. and A.J.A.; investigation, B.B.A. and A.N.A.; data curation, M.H.M., T.M.A.M., B.B.A. and A.N.A.; writing—original draft preparation, B.B.A., A.N.A., F.A.K. and A.J.A.; writing—review and editing, M.H.M., T.M.A.M., B.B.A., A.N.A., F.A.K. and A.J.A. All authors have read and agreed to the published version of the manuscript.
Funding
This research received no external funding.
Institutional Review Board Statement
The study was conducted in accordance with the Declaration of Helsinki, and approved by the Ethics Committee of College of Dentistry, University of Sulaimani No 320/25.
Informed Consent Statement
Informed consent was obtained from all subjects involved in the study.
Data Availability Statement
The present study’s data are available with the corresponding author on request.
Conflicts of Interest
The authors declare no conflict of interest.
Abbreviations
The following abbreviations are used in this manuscript:
| CNNs | Convolutional Neural Networks |
| OPG | Artificial intelligence Orthopantomograph |
| AI | Artificial intelligence |
| CBCT | Cone beam computed tomograph |
| CVM | Cervical vertebral maturation |
| ROI | Region of interest |
| AUC-ROC | Area under the receiver operating characteristic curve |
| AUC | Area under the curve |
| ALARA | As Low As Reasonably Achievable |
Appendix A
Developmental stages of tooth—Demirjian et al. [13] color atlas of dental medicine; orthodontic diagnosis; Thomas grabber; 1992, Thieme Medical Publishers (page no.100).

References
- Ghowsi, A.; Hatcher, D.; Suh, H.; Wile, D.; Castro, W.; Krueger, J.; Park, J.; Oh, H. Automated landmark identification on cone-beam computed tomography: Accuracy and reliability. Angle Orthod. 2022, 92, 642–654. [Google Scholar] [CrossRef] [PubMed]
- Bulatova, G.; Kusnoto, B.; Grace, V.; Tsay, T.P.; Avenetti, D.M.; Sanchez, F.J.C. Assessment of automatic cephalometric landmark identification using artificial intelligence. Orthod. Craniofacial Res. 2021, 24 (Suppl. 2), 37–42. [Google Scholar] [CrossRef]
- Hwang, H.W.; Park, J.H.; Moon, J.H.; Yu, Y.S.; Kim, H.; Her, S.B.; Srinivasan, G.; Aljanabi, M.N.A.; Donatelli, R.E.; Lee, S.J. Automated identification of cephalometric landmarks: Part 2-might it be better than human? Angle Orthod. 2020, 90, 69–76. [Google Scholar] [CrossRef]
- Park, J.H.; Hwang, H.W.; Moon, J.H.; Yu, Y.S.; Kim, H.; Her, S.B.; Srinivasan, G.; Aljanabi, M.N.A.; Donatelli, R.E.; Lee, S.J. Automated identification of cephalometric landmarks: Part 1-comparisons between the latest deep-learning methods YOLOV3 and SSD. Angle Orthod. 2019, 89, 903–909. [Google Scholar] [CrossRef]
- Lee, J.M.; Moon, J.H.; Park, J.A.; Kim, J.H.; Lee, S.J. Factors influencing the development of artificial intelligence in orthodontics. Orthod. Craniofacial Res. 2024, 27, 6–12. [Google Scholar] [CrossRef]
- Mohammed, M.H.; Omer, Z.Q.; Aziz, B.B.; Abdulkareem, J.F.; Mahmood, T.M.A.; Kareem, F.A.; Mohammad, D.N. Convolutional Neural Network-Based Deep Learning Methods for Skeletal Growth Prediction in Dental Patients. J. Imaging 2024, 10, 278. [Google Scholar] [CrossRef]
- Baccetti, T.; Franchi, L.; McNamara, J.A., Jr. The cervical vertebral maturation (CVM) method for the assessment of optimal treatment timing in dentofacial orthopedics. Semin. Orthod. 2005, 11, 119–129. [Google Scholar] [CrossRef]
- Dipalma, G.; Inchingolo, A.D.; Inchingolo, A.M.; Piras, F.; Carpentiere, V.; Garofoli, G.; Azzollini, D.; Campanelli, M.; Paduanelli, G.; Palermo, A.; et al. Artificial intelligence and its clinical applications in orthodontics: A systematic review. Diagnostics 2023, 13, 3677. [Google Scholar] [CrossRef] [PubMed]
- Kim, E.; Kuroda, Y.; Soeda, Y.; Koizumi, S.; Yamaguchi, T. Validation of machine learning models for craniofacial growth prediction. Diagnostics 2023, 13, 3369. [Google Scholar] [CrossRef]
- Gonca, M.; Sert, M.F.; Gunacar, D.N.; Kose, T.E.; Beser, B. Determination of growth and developmental stages in hand–wrist radiographs: Can fractal analysis in combination with artificial intelligence be used? J. Orofac. Orthop./Fortschritte Kieferorthopädie 2024, 85, 1–5. [Google Scholar] [CrossRef]
- Koch, R.M.; Mentzel, H.J.; Heinrich, A. Deep learning for forensic age estimation using orthopantomograms in children, adolescents, and young adults. Eur. Radiol. 2025, 35, 4191–4202. [Google Scholar] [CrossRef]
- Soukhakian, A.; Zahed, M.; Pakshir, H.R.; Ajami, S.; Zangooi Booshehry, M. A New Regression Model Based on Salivary Biomarkers, Chronological Age and Gender to Predict the Stage of Cervical Vertebral Maturation in Orthodontic Patients. J. Dent. 2025, 26, 241–249. [Google Scholar] [CrossRef]
- Demirjian, A.; Goldstein, H.; Tanner, J.M. A new system of dental age assessment based on seven left mandibular teeth. Hum. Biol. 1973, 45, 211–227. [Google Scholar]
- Lee, J.H.; Kim, D.H.; Jeong, S.N.; Choi, S.H. Deep learning for automated classification of dental development stages using panoramic radiographs. Sci. Rep. 2020, 10, 20457. [Google Scholar]
- Wallraff, S.; Vesal, S.; Syben, C.; Lutz, R.; Maier, A. Age estimation on panoramic dental X-ray images using deep learning. In Proceedings of the German Workshop on Medical Image Computing, Regensburg, Germany, 7–9 March 2021; pp. 186–191. [Google Scholar]
- Rokhshad, R.; Nasiri, F.; Saberi, N.; Shoorgashti, R.; Ehsani, S.S.; Nasiri, Z.; Azadi, A.; Schwendicke, F. Deep learning for age estimation from panoramic radiographs: A systematic review and meta-analysis. J. Dentistry 2025, 154, 105560. [Google Scholar] [CrossRef]
- Kiran Kumar, K.; Sridharan, K.; Sivakumar, A.; Premkumar, S. Correlation between mandibular canine calcification stages and skeletal maturity indicators. J. Indian Orthod. Soc. 2017, 51, 123–128. [Google Scholar]
- Perinetti, G.; Di Lenarda, R.; Contardo, L. Dental calcification stages as predictors of skeletal maturity: A review. Angle Orthod. 2013, 83, 1042–1050. [Google Scholar]
- Jeon, K.J.; Kim, Y.H.; Lee, J.Y.; Jung, H.I.; Han, S.S. Dental Radiography for Age Estimation: A Scoping Review. J. Korean Dent. Sci. 2022, 15, 31–50. [Google Scholar]
- Kumar, S.; Valiathan, A. Accuracy of dental age estimation methods and its implications in forensic dentistry. J. Forensic. Dent. Sci. 2016, 8, 55–63. [Google Scholar]
- Hashim, H.A.; Mansoor, H.; Mohamed, M.H. Assessment of skeletal age using hand-wrist radiographs following Bjork system. J. Int. Soc. Prev. Community Dent. 2018, 8, 482–487. [Google Scholar] [CrossRef] [PubMed]
- Balel, Y.; Sağtaş, K.; Bülbül, H.N. Development and evaluation of a deep learning-based system for dental age estimation using the demirjian method on panoramic radiographs. BMC Oral. Health 2025, 25, 1172. [Google Scholar] [CrossRef] [PubMed]


Disclaimer/Publisher’s Note: The statements, opinions and data contained in all publications are solely those of the individual author(s) and contributor(s) and not of MDPI and/or the editor(s). MDPI and/or the editor(s) disclaim responsibility for any injury to people or property resulting from any ideas, methods, instructions or products referred to in the content. |
© 2025 by the authors. Licensee MDPI, Basel, Switzerland. This article is an open access article distributed under the terms and conditions of the Creative Commons Attribution (CC BY) license (https://creativecommons.org/licenses/by/4.0/).