Article

Comparison of Condylar Position Discrepancies Assessed Using an Optical Jaw Tracking System and a Conventional Condylar Position Indicator

1
Section of Orthodontics, Department of Dental Clinical Specialties, Faculty of Odontology, Complutense University of Madrid, 28040 Madrid, Spain
2
Section of Orthodontics, Faculdade de Medicina Dentária da Universidade do Porto, 4200-393 Porto, Portugal
3
Clinicas Den, 08006 Barcelona, Spain
4
Clinica Martin Goenaga, 20005 San Sebastián, Spain
5
BIOCRAN (Craniofacial Biology: Orthodontics and Dentofacial Orthopedics) Research Group, Complutense University of Madrid, 28040 Madrid, Spain
*
Author to whom correspondence should be addressed.
Prosthesis 2025, 7(2), 40; https://doi.org/10.3390/prosthesis7020040
Submission received: 2 March 2025 / Revised: 3 April 2025 / Accepted: 8 April 2025 / Published: 9 April 2025
(This article belongs to the Section Prosthodontics)

Abstract

:
Background: Assessment of functional occlusion is crucial in orthodontics and prosthodontics. With scientific advancements, optical jaw tracking systems are increasingly used to evaluate mandibular kinematics. Objectives: To compare the performance of an optical jaw tracking system (Modjaw®) and a traditional condylar position indicator (CPI) in identifying condylar position discrepancies within an orthodontic population. A secondary objective was to explore the association between condylar discrepancies and temporomandibular disorders (TMD). Methods: Measurements were collected from 132 patients consecutively recruited from the private practice of a coauthor, using Modjaw and CPI, analyzing discrepancies in the sagittal, vertical, and transverse planes. TMD presence was determined clinically and using the DC-TMD questionnaire. Receiver operating characteristic (ROC) curves and diagnostic metrics were used to evaluate the tools’ performance. Results: No correlation was found between CPI and Modjaw measurements. CPI did not effectively discriminate between patients with and without TMD, with areas under the curve (AUC) not statistically significant. In contrast, the AUCs for Modjaw were 0.683 for the vertical plane (p = 0.001), 0.654 for the sagittal plane (p = 0.004), and 0.777 for the transverse plane (p < 0.001). The cut-off values for TMD screening using Modjaw were established at 2 mm (vertical), 1 mm (sagittal), and 0.5 mm (transverse), exhibiting some specificity, especially in the transverse dimension, but very low sensitivity. Conclusions: No correlation was found between Modjaw and CPI for assessing condylar position discrepancies. While these discrepancies may aid orthodontic treatment planning, they lack sufficient sensitivity for reliable TMD diagnosis. Modjaw’s cut-off points may help exclude TMD risk in orthodontic patients.

1. Introduction

The determination of a stable, functional, and reproducible mandibular position has long been a focus in dentistry, particularly in orthodontics and prosthodontics. Over time, the concept of an ideal condylar position has evolved, reflecting advancements in understanding occlusion and temporomandibular joint (TMJ) function [1,2,3,4]. Functional occlusion implies skeletal and muscle stability, essential for successful treatment outcomes in these fields. The current biopsychosocial model for managing temporomandibular disorders (TMDs) emphasizes the use of the patient’s maximum intercuspation (MI) for diagnosing and treatment planning [5]. However, cases requiring significant occlusal reorganization, such as complex orthodontic or prosthodontic treatments, require determining a balanced and reproducible reference position [5].
Traditionally, centric occlusion (CO), defined as the occlusion of opposing teeth when the mandible is in centric relation (CR) has been used as a diagnostic and therapeutic reference [6]. While CO is pragmatically useful in prosthodontics and orthodontics for occlusal reorganization, or when MI is unavailable, its diagnostic use in identifying temporomandibular joint condylar position lacks anatomical and clinical support [7,8]. Modern approaches now favor MI as the primary reference, except in cases of unstable occlusion where CR-MI discrepancies exceed 2 mm sagittally or vertically and 0.5 mm transversally [3,8,9,10]. In such cases, additional evaluation and planning are essential [3,8].
Technological advancements have introduced tools like optical jaw tracking systems, including Modjaw® (Modjaw®, Villeurbanne, France), which enable dynamic, real-time assessments of mandibular movements and condylar positions [11,12,13,14,15,16]. Unlike traditional articulators, which rely on static approximations, optical systems provide precise and dynamic monitoring of jaw movements, offering immediate clinical feedback and minimizing operator-dependent errors [13,17,18,19]. These systems are promising for diagnosing occlusal and functional discrepancies and improving orthodontic treatment planning [11,13,14].
The clinical relevance of condylar discrepancies in diagnosing TMD remains debated. While the clinical significance of condylar discrepancies in diagnosing TMD remains debated, their assessment is still relevant in orthodontic practice [4]. Accurate evaluation of condylar position may aid in understanding occlusal stability and mandibular function, which are essential factors in treatment planning [3,9,10]. Furthermore, although condylar discrepancies alone may not serve as definitive diagnostic criteria for TMD, their identification could contribute to a more comprehensive functional assessment, especially in patients presenting with symptoms of temporomandibular dysfunction [3,9,10]. While the prevalence of TMD is reported as 31% in adults and 11% in children, these rates are higher among orthodontic patients [20,21]. Despite this, evidence indicates that orthodontic treatment neither causes nor cures TMD [7,8,9,10,11,12,13,14,15,16,17,18,19,20,21,22]. Instead, TMD diagnosis requires a multifaceted approach involving clinical examination, patient history, and validated questionnaires like the DC-TMD [23]. Imaging techniques, such as cone beam computed tomography and magnetic resonance imaging, and tools like condylar position indicators (CPI), are not recommended for routine diagnosis due to their limitations in sensitivity and specificity [24,25].
Although previous studies have suggested potential associations between condylar position discrepancies and TMD, there is no consensus on their clinical significance [3,8,10,26].
Instruments like CPI and jaw tracking systems are primarily designed to evaluate functional discrepancies rather than serve as standalone diagnostic tools for TMD. Nevertheless, understanding condylar position discrepancies is critical for orthodontic treatment planning, particularly in patients with unstable occlusion [9,26,27]. By providing accurate assessments of mandibular dynamics, tools like Modjaw may enhance treatment precision and reduce errors associated with traditional methods [11,28,29].
This study aimed to compare the performance of Modjaw and CPI in identifying condylar position discrepancies (CO-MI discrepancies) within an orthodontic population. A secondary objective was to evaluate their utility in screening for TMD, emphasizing the limited diagnostic value of condylar discrepancies in this context.
The null hypotheses are “there are no statistically significant differences between condylar position assessed with CPI or Modjaw” and “condylar discrepancies have no diagnostic value for TMD”.

2. Materials and Methods

This study was designed as a cross-sectional, observational, monocentric study and reported according to the STARD guidelines [30]. Ethical approval was obtained from the Ethics Committee of the researcher’s institution (internal code: 22/270-E). All participants provided written informed consent in accordance with the Helsinki Declaration (2002 version).

2.1. Population

Patients seeking orthodontic treatment were consecutively recruited from the private practice of one of the coauthors from April 2022 to October 2023. Inclusion criteria were as follows: (i) individuals over 14 years of age, (ii) permanent dentition, (iii) incisor overlap < 70%, and (iv) overjet < 8 mm. Exclusion criteria were as follows: (i) prior or ongoing orthodontic or splint therapy, (ii) presence of maxillofacial trauma or surgery, and (iii) physical or cognitive disability.

2.2. Diagnostic Tools and Procedures

As a reference standard to assess the presence or absence of TMD, a standardized questionnaire Axis I from the International Consortium for TMD and Orofacial Pain was administered, and a thorough oral examination was conducted by an experienced clinician [23].

2.3. CPI Records

Dental impressions were taken and converted into dental cast. A CO record was obtained using Almore® wax (Almore Int. Hickory, NC, USA) with Roth’s power centric technique [31]. Additionally, an MI record was established using bite registration Moyco® wax (Moyco Union Broach, York, PA, USA). A transfer bow was customized to the patient and then transferred to the semi-adjusted articulator (Panadent®, Panadent Corp., Colton, CA, USA) for cast mounting. After mounting the casts on the articulator in CR, they were transferred to the CPI (Panadent Corp., Colton, CA, USA). Using the MI wax, occlusion was established and fixed. The CO-MI discrepancy was then recorded on the CPI grid as the condylar discrepancy, measured in millimeters as the linear distance to the grid’s reference line (with the intersection point of the x and y axes serving as the reference for CO and the marked point as the reference for MI) [10].

2.4. Optical Jaw Tracking System (Modjaw) Records

To determine the condylar position using Modjaw, digital models were obtained with an intraoral scanner, iTero® (Align Technology, San José, CA, USA). The STL files were imported to Modjaw’s software (TwimTM). After calibration, the tracking devices were placed (the para-occlusal clutch and peri-cranial bow), and the cutaneous condylar, sub-nasal, and five mandibular dental reference points were identified. The size and shape of the para-occlusal clutch, which is bonded to the buccal surface of lower teeth without causing occlusal interference, limited the study sample to subjects with an incisor overlap < 70% and overjet < 8 mm, as stated in the eligibility criteria. This restriction was necessary because excessive incisor overlap or overjet could compromise the accuracy of Modjaw readings due to incisor trauma on the sensor. The following mandibular movements were recorded (3 repetitions): open/close, protrusion, lateral excursions, speech, and chewing. A section of the record with pure rotation was cropped and the terminal hinge axis was located. The software automatically recalibrated mandibular displacements using the new hinge axis and checked its validity. The condylar position graphs were used to measure condylar discrepancy similarly to the CPI grid, but in this case, the intersection point refers to MI, and the calculated condylar position is the CO reference.

2.5. Outcome Measures

The following data were recorded: the presence or absence of TMD signs/symptoms, and the CO-MI discrepancies in the three planes (sagittal, vertical, and transversal) assessed with CPI and Modjaw. One calibrated examiner took all the records.

2.6. Statistical Analysis

To assess the measurement error, a subsample of 30 measurements was randomly selected and measured twice, and the intraclass correlation coefficient (ICC) was used. An ICC higher than 0.90 was used as a criterion to ensure the reliability of the measurements [32].

2.7. Sample Size Estimation

The sample size calculation was performed using PASS 2022 (NCSS LLC; Kaysville, UT, USA) Power Analysis and Sample Size Software and conducted for Pearson’s (parametric) and Spearman’s rank (non-parametric) correlations. The target correlation coefficients were set at 0.4 (R = 0.40), according to the recommendations by Cohen (1992), with a confidence level of 95.0% and precision of 0.3, resulting in recommended sample sizes of 123 for Pearson’s and 132 for Spearman’s rank correlations [33,34]. For the ROC analysis, a sample size of 102 patients was required to detect an area under the curve (AUC) of 0.90 with a 95% confidence interval.

2.8. Correlation Analysis

The distribution of outcomes was assessed using the Kolmogorov–Smirnov test. Since normality was not confirmed, Spearman’s correlation coefficient was applied to evaluate the relationship between CPI and Modjaw measurements.

2.9. ROC Curve Analysis

Receiver operating characteristic (ROC) curves were generated for both CPI and Modjaw by combining CO-MI discrepancy measurements with TMD classification (“0” for no TMD and “1” for TMD). The area under the curve (AUC) was calculated, with values ≤ 0.5 indicating no better-than-random performance. Key classifier evaluation metrics included the Gini index, maximum K-S value, and optimal cut-off points to maximize sensitivity and specificity.
To enhance clinical relevance, cut-off values were rounded to the nearest 0.5 mm, and their corresponding sensitivity, specificity, positive predictive values, and negative predictive values were recalculated [35]. Sensitivity and specificity were categorized as low (<70%), fair (70–80%), moderate (80–90%), or high (>90%), and Youden’s index was used to assess discriminative ability [36].
The statistical analysis was performed using IBM SPSS, version 30 (IBM Corp., Armonk, NY, USA), with a significance level of p ≤ 0.05.

3. Results

Measurement error analysis showed no significant differences between repeated measurements (p > 0.05). All ICC values were above 0.90 for both CPI and Modjaw measurements, indicating no systematic error and ensuring measurement reliability (Appendix A).
The sample comprised 132 patients with a mean age of 23.69 years (SD: 11.57), where 69% were female. TMDs were present in 31.5% of the sample according to the questionnaire and clinical examination. Any adverse events took place during the study.

3.1. Correlation Analysis
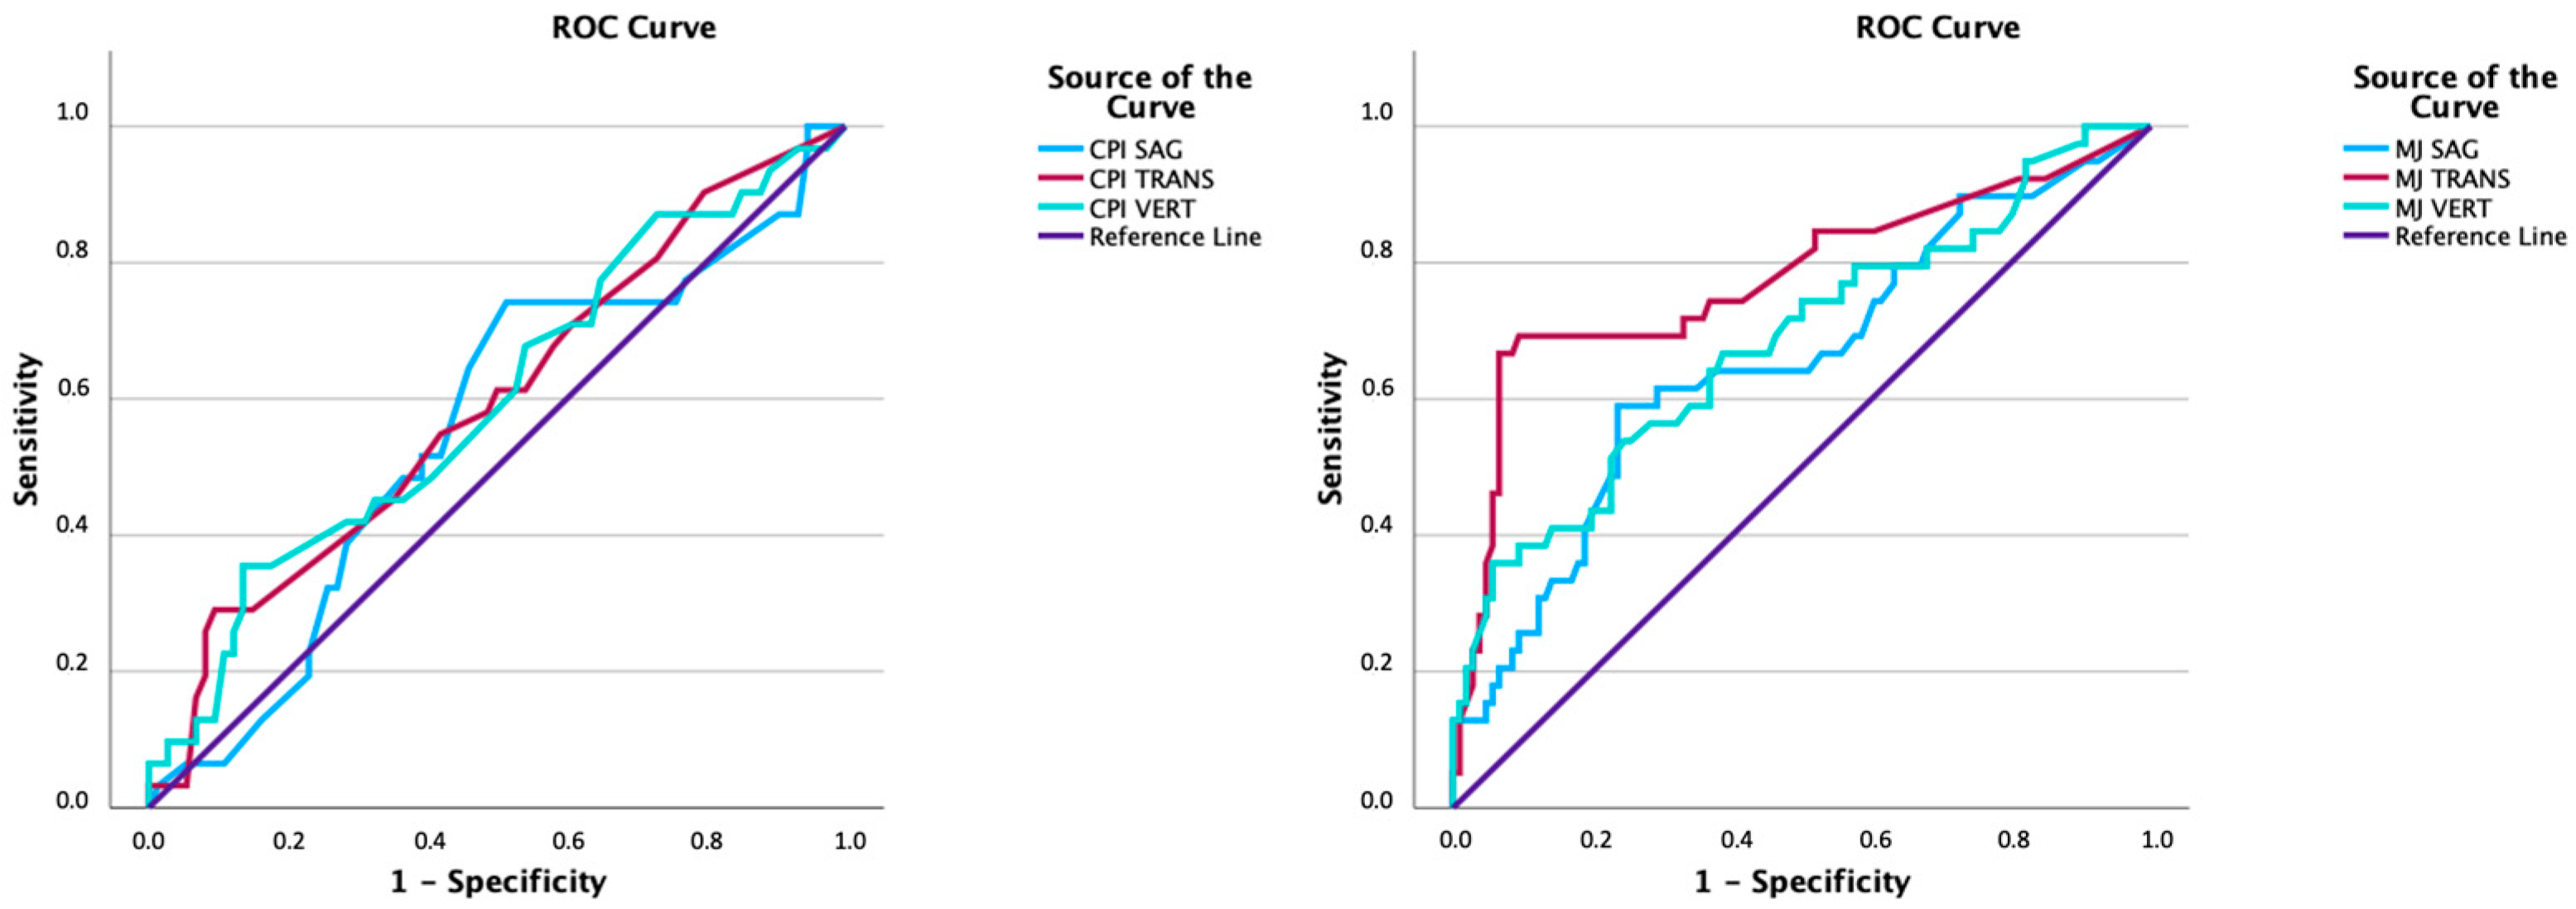
Table 1 summarizes the correlation values between measurements obtained with CPI and Modjaw. Correlation coefficients were close to zero and non-significant for sagittal right (R = −0.067; p > 0.05), vertical left (R = −0.064; p > 0.05), and transversal (R = 0.066; p > 0.05). A weak positive correlation was observed for vertical right (R = 0.230; p > 0.05) and sagittal left (R = 0.286; p < 0.05). Overall, these results indicate very low agreement between the two tools. Figure 1 illustrates the graphical representation of the correlations.

3.2. ROC Analysis

ROC curve analysis (Figure 2) revealed that CPI performed poorly, with AUC values for all planes not significantly different from random chance (AUC ≤ 0.5; Table 2). In contrast, Modjaw showed better discriminative ability, with AUC values ranging from 0.654 in the sagittal plane to 0.777 in the transversal plane.
Optimal cut-offs for TMD classification based on Modjaw measurements were determined as 1.77 mm (vertical), 0.91 mm (sagittal), and 0.49 mm (transversal), and these exhibited higher sensitivity and specificity metrics than CPI (Table 3). Rounded cut-offs for Modjaw included 2 mm (vertical), 1 mm (sagittal), and 0.5 mm (transversal), which showed low sensitivity but high specificity, particularly in the transversal plane (Table 4). For CPI, cut-offs of 4.5 mm (vertical) and 1.5 mm (transversal) demonstrated very low sensitivity but moderate specificity. In contrast, Modjaw’s cut-off of 0.5 mm (transversal) exhibited the highest sensitivity (66.67%) and very high specificity (93.40%). Youden’s indices supported the poor overall performance of most models, except for Modjaw in the transversal plane.
Youden’s indices indicated poor overall performance of most binary classification models, except for Modjaw in the transversal plane (cutt-off of 0.5 mm) (Figure 3).

4. Discussion

This study compared CPI and Modjaw in assessing condylar discrepancies (CO-MI discrepancies) and evaluated their diagnostic utility for TMD in an orthodontic population using the DC-TMD questionnaire as the gold standard.
According to a 2021 meta-analysis, TMD has a prevalence of 31% in adult patients with higher rates in orthodontic populations [20,21]. Consistently, our sample comprised 26% of patients with signs and symptoms of TMD. The broad eligibility criteria provide good external validity for typical orthodontic patients in our practice.
A key finding of this study is the lack of correlation between the measurements obtained by CPI and Modjaw. Correlation coefficients were near zero for most planes, with only weak positive correlations observed for sagittal right and vertical right measurements. These results highlight the fundamental methodological differences between the tools. CPI relies on static, wax-based registrations of CO and MI using a semi-adjusted articulator, while Modjaw dynamically analyzes mandibular movement to establish the hinge axis. Some recent investigations have shown that the hinge axis recorded by Modjaw is reproducible and accurate [12]. However, the published studies on this subject are still very recent and with small samples; further investigation is recommended. Additionally, the disparity in measurements recorded with Modjaw and CPI may be influenced by the precision differences between intraoral scanners and plaster models. Some authors have suggested that the type of intra-oral scanner used to create digital models might affect the results from Modjaw, indicating the device’s sensitivity to small changes [14]. However, in this investigation, this factor did not impact the results, as all models were obtained using the same scanner. Dental articulators, due to the multiple steps required for obtaining the CPI reading (involving two distinct devices), are prone to several errors that may distort the results and yield misleading data. CPI recordings may lead to misleading interpretations, overestimating the clinical relevance of CO-MI discrepancies and, consequently, not enhancing the diagnostic value. The clinical relevance of these findings lies in the distinction between static and dynamic assessments of mandibular function. CPI has traditionally been used as a static tool for condylar position analysis, but it does not capture full mandibular motion. In contrast, Modjaw records dynamic movements, potentially offering a more physiologically relevant reference based on functional parameters. Given the weak correlations observed, Modjaw may have clinical utility by integrating a fully dynamic mandibular analysis into orthodontic diagnosis and treatment planning. Beyond its diagnostic role, Modjaw may also serve as a valuable tool for evaluating mandibular function throughout treatment. By continuously monitoring mandibular dynamics over time, clinicians can evaluate the effectiveness of therapeutic interventions, track changes in condylar position, and adjust treatment plans accordingly.
To test the accuracy of Modjaw and CPI in screening TMD, various diagnostic tests were used. The study’s methodology comprehensively evaluated the CPI and Modjaw tests’ usefulness and discriminative capacity. ROC curve analysis, associated metrics, and cut-off values thoroughly assessed test performances, offering valuable insights for clinical decision-making. ROC curve analysis revealed that CPI performed no better than random in distinguishing between patients with and without TMD. Modjaw exhibited superior performance, with AUC values ranging from 0.654 to 0.777. However, even for Modjaw, sensitivity was consistently low, indicating that condylar discrepancies measured by these tools lack the diagnostic sensitivity required to reliably detect TMD. Specificity values for Modjaw were higher, particularly in the transversal plane (93.40%), suggesting potential utility for excluding TMD in patients presenting with minimal condylar discrepancies. This aligns with previous studies indicating higher condylar displacements on the transverse plane in symptomatic patients, as assessed with CPI [26,37].
When using diagnostic tests, it is crucial to consider both sensitivity and specificity. Cut-off points maximizing both aspects were significantly higher for CPI than for Modjaw in all three planes assessed. Additionally, our results suggest higher values for TMD diagnosis with CPI (vertical plane: 4.3 mm; sagittal plane: 1.95 mm; transversal plane: 1.35 mm) than those reported in the existing literature [26,37]. This discrepancy may be attributed to most studies focusing on clinically significant differences for orthodontic treatment planning, rather than TMD diagnosis. Smaller changes may not represent TMD but still imply significant orthodontic planning adjustments.
Considering the rounded cut-off values for sensitivity and specificity with both tools, caution should be taken when interpreting the values for CPI due to its limited discriminatory value in detecting TMD, evident from the AUCs. Rounded cut-off points for Modjaw were 2 mm vertically, 1 mm sagittally, and 0.5 mm transversally. Specificity exceeded sensitivity in all planes, particularly vertically and transversally (95.28% and 93.40%, respectively), indicating low false-positive rates for values below 2 mm vertically and 0.5 mm transversally. The highest sensitivity was observed transversally, with a true positive rate of 66.67% for values above 0.5 mm. Importantly, the clinical utility of these tools should not be overstated. The thresholds established in this study reflect Modjaw’s ability to identify discrepancies relevant to orthodontic treatment planning rather than TMD diagnosis. Therefore, the rounded cut-off values presented for Modjaw could be clinically used to exclude TMD risk but not to confirm a positive diagnosis. These findings align with the growing consensus that TMD diagnosis requires a multifaceted approach, including clinical examination and validated questionnaires, rather than relying solely on imaging or instrumental data. No comparative studies are available, needing further research and study replication for validation.
This study focused on an orthodontic population, so its findings cannot be directly applied to edentulous patients, who may have different occlusal and neuromuscular adaptations. Further research should assess the use of Modjaw in prosthodontic planning and post-rehabilitation evaluations for edentulous cases.
The results of this investigation lead us to reject the null hypothesis that “there are no statistically significant differences between condylar position assessed with CPI or Modjaw” and to accept the null hypothesis that “condylar discrepancies have no diagnostic value for TMD”.
The clinical implications of these findings suggest that Modjaw can be used more effectively than conventional CPI for functional diagnosis in orthodontics. It can also be used to assist in screening patients for TMD, excluding that diagnosis in patients who present with condylar discrepancy values below the cut-off values determined in this investigation. Moreover, Modjaw presents as a useful tool to determine the functional occlusion, which should be used while diagnosing and treatment planning on these patients. Nevertheless, DC-TMD questionnaires and a thorough clinical exam should be routinely performed and used for TMD diagnosis [2].

5. Conclusions

The lack of correlation between CPI and Modjaw measurements underscores the need for dynamic assessments in modern orthodontics and prosthodontics. This study highlights the limitations of CPI and Modjaw in diagnosing TMD. Modjaw demonstrated superior performance compared to CPI but still lacked the sensitivity necessary for reliable TMD diagnosis. Both tools are more suited for assessing condylar discrepancies in treatment planning than for clinical TMD diagnostics. Threshold values established for Modjaw—2 mm (vertical), 1 mm (sagittal), and 0.5 mm (transversal)—may serve as reference points for clinical applications but should not be used for TMD screening. Further research is required to confirm these findings and explore their implications for clinical practice.

Author Contributions

J.S., C.M., E.M., A.C. and D.M. participated in the conceptualization; J.S. and C.M. developed the methodology for the study; J.S., E.M. and D.M. performed data collection; J.S. and C.M. prepared the original draft; and all the authors participated in the review process. All authors have read and agreed to the published version of the manuscript.

Funding

This research received no external funding.

Institutional Review Board Statement

The study was conducted in accordance with the Declaration of Helsinki and was approved by the Ethics Committee of Hospital Clínico San Carlos, Madrid, with internal code 22/270-E.

Informed Consent Statement

Informed consent was obtained from all subjects involved in the study.

Data Availability Statement

The data presented in this study are available on request from the corresponding author due to ethical reasons.

Acknowledgments

We would like to thank the BIOCRAN (Craniofacial Biology: Orthodontics and Dentofacial Orthopedics) Research Group, Faculty of Odontology, Complutense University of Madrid, for its support.

Conflicts of Interest

The authors declare no conflicts of interest.

Abbreviations

The following abbreviations are used in this manuscript:
TMJtemporomandibular joint
TMDtemporomandibular disorders
CRcentric relation
COcentric occlusion
MImaximum intercuspation
MJModjaw
CPIcondylar position indicator
SAGsagittal
VERTvertical
TRANStransverse
Lleft
Rright
ROCreceiver operating characteristic
AUCarea under the curve
ICCintraclass correlation coefficient

Appendix A. Measurement Error Analysis for Repeated Measurements (n = 30)

1st MeasurementRepetitionp-ValueICC
Mean (SD)Mean (SD)
CPI
 Vertical right 2.19 (1.54)2.19 (1.52)0.8460.998
 Sagittal right−2.02 (1.21)−2.02 (1.19)0.8510.997
 Vertical left 3.01 (1.45)3.02 (1.45)0.5580.999
 Sagittal left−2.16 (1.37)−2.12 (1.35)0.1300.997
 Transversal−0.75 (0.95)−0.78 (0.95)0.1290.996
Modjaw
 Vertical right0.08 (1.01)0.14 (1.22)0.2270.967
 Sagittal right−0.33 (0.79)−0.30 (1.07)0.6460.910
 Vertical left−0.01 (0.74)−0.05 (0.91)0.5020.945
 Sagittal left−0.39 (0.75)−0.39 (0.90)0.9270.971
 Transversal0.10 (0.72)0.13 (0.80)0.3260.981
p: paired Student’s t-test significance value; ICC: intraclass correlation coefficient.

References

  1. Okeson, J. Management of Temporomandibular Disorders and Occlusion, 7th ed.; Elsevier: St. Louis, MO, USA, 2008. [Google Scholar]
  2. Kandasamy, S.; Rinchuse, D.J.; Greene, C.S.; Johnston, L.E. Temporomandibular disorders and orthodontics: What have we learned from 1992–2022? Am. J. Orthod. Dentofac. Orthop. 2022, 161, 769–774. [Google Scholar] [CrossRef] [PubMed]
  3. Crawford, S.D. Condylar axis position, as determined by the occlusion and measured by the CPI instrument, and signs and symptoms of temporomandibular dysfunction. Angle Orthod. 1999, 69, 103–115. [Google Scholar]
  4. Freeland, T. Articulators in Orthodontics. Semin. Orthod. 2012, 18, 51–62. [Google Scholar] [CrossRef]
  5. Manfredini, D.; Ercoli, C.; Poggio, C.E.; Carboncini, F.; Ferrari, M. Centric relation—A biological perspective of a technical concept. J. Oral Rehabil. 2023, 50, 1355–1361. [Google Scholar] [CrossRef]
  6. Academy of Denture Prosthetics. Nomenclature Committee. The Glossary of Prosthodontic Terms. J. Prosthet. Dent. 2017, 117, e1–e105. [Google Scholar] [CrossRef]
  7. Roth, R.H. Occlusion and condylar position. Am. J. Orthod. Dentofac. Orthop. 1995, 107, 315–318. [Google Scholar] [CrossRef]
  8. Roth, R.H. Functional occlusion for the orthodontist. J. Clin. Orthod. 1981, 15, 32–40, 44–51. [Google Scholar]
  9. Shildkraut, M.; Wood, D.P.; Hunter, W.S. The CR-CO discrepancy and its effect on cephalometric measurements. Angle Orthod. 1994, 64, 333–342. [Google Scholar]
  10. Cordray, F.E. Articulated dental cast analysis of asymptomatic and symptomatic populations. Int. J. Oral Sci. 2016, 8, 126–132. [Google Scholar] [CrossRef]
  11. Cheong, C.; Radomski, K.; Otten, J.; Lee, S. A clinical comparative analysis using an optical tracking device versus conventional tracking device in the production of occlusal appliances. J. Prosthodont. 2025, 34, 350–356. [Google Scholar] [CrossRef]
  12. Bapelle, M.; Dubromez, J.; Savoldelli, C.; Tillier, Y.; Ehrmann, E. Modjaw® device: Analysis of mandibular kinematics recorded for a group of asymptomatic subjects. Cranio® 2021, 42, 483–489. [Google Scholar] [CrossRef]
  13. Bedrossian, E.A.; Bedrossian, E.; Kois, J.C.; Revilla-Leon, M. Use of an optical jaw-tracking system to record mandibular motion for treatment planning and designing interim and definitive prostheses: A dental technique. J. Prosthet. Dent. 2022, 132, 659–674. [Google Scholar] [CrossRef]
  14. Revilla-Leon, M.; Agustin-Panadero, R.; Zeitler, J.M.; Barmak, A.B.; Yilmaz, B.; Kois, J.C.; Pérez-Barquero, J.A. Differences in maxillomandibular relationship recorded at centric relation when using a conventional method, four intraoral scanners, and a jaw tracking system: A clinical study. J. Prosthet. Dent. 2023, 132, 964–972. [Google Scholar] [CrossRef]
  15. Revilla-León, M.; Fernández-Estevan, L.; Barmak, A.B.; Kois, J.C.; Pérez-Barquero, J.A. Accuracy of the maxillomandibular relationship at centric relation position recorded by using 3 different intraoral scanners with or without an optical jaw tracking system: An in vivo pilot study. J. Dent. 2023, 132, 104478. [Google Scholar] [CrossRef]
  16. Revilla-Leon, M.; Zeitler, J.M.; Gomez-Polo, M.; Kois, J.C. Utilizing additively manufactured custom devices to record mandibular motion by using optical jaw tracking systems: A dental technique. J. Prosthet. Dent. 2022, 131, 560–566. [Google Scholar] [CrossRef]
  17. Solaberrieta, E.; Minguez, R.; Barrenetxea, L.; Otegi, J.R.; Szentpetery, A. Comparison of the accuracy of a 3-dimensional virtual method and the conventional method for transferring the maxillary cast to a virtual articulator. J. Prosthet. Dent. 2015, 113, 191–197. [Google Scholar] [CrossRef]
  18. da Cunha, D.V.; Degan, V.V.; Vedovello Filho, M.; Bellomo, D.P., Jr.; Silva, M.R.; Furtado, D.A.; Andrade, A.O.; Milagre, S.T.; Pereira, A.A. Real-time three-dimensional jaw tracking in temporomandibular disorders. J. Oral Rehabil. 2017, 44, 580–588. [Google Scholar] [CrossRef]
  19. Zhao, W.; Feng, Y.; Cao, R.; Sun, J.; Zhang, J.; Zhao, X.; Liu, W. Comparative analysis of three jaw motion tracking systems: A study on precision and trueness. J. Prosthodont. 2024, 34, 263–270. [Google Scholar] [CrossRef]
  20. Valesan, L.F.; Da-Cas, C.D.; Réus, J.C.; Denardin, A.C.S.; Garanhani, R.R.; Bonotto, D.; Januzzi, E.; de Souza, B.D.M. Prevalence of temporomandibular joint disorders: A systematic review and meta-analysis. Clin. Oral Investig. 2021, 25, 441–453. [Google Scholar] [CrossRef]
  21. Romani, V.; Di Giorgio, R.; Castellano, M.; Barbato, E.; Galluccio, G. Prevalence of craniomandibular disorders in orthodontic pediatric population and possible interactions with anxiety and stress. Eur. J. Paediatr. Dent. 2018, 19, 317–323. [Google Scholar]
  22. Manfredini, D.; Stellini, E.; Gracco, A.; Lombardo, L.; Nardini, L.; Siciliani, G. Orthodontics is temporomandibular disorder-neutral. Angle Orthod. 2016, 86, 649–654. [Google Scholar] [CrossRef]
  23. Schiffman, E.; Ohrbach, R.; Truelove, E.; Look, J.; Anderson, G.; Goulet, J.-P.; List, T.; Svensson, P.; Gonzalez, Y.; Lobbezoo, F.; et al. Diagnostic Criteria for Temporomandibular Disorders (DC/TMD) for Clinical and Research Applications: Recommendations of the International RDC/TMD Consortium Network and Orofacial Pain Special Interest Group. J. Oral Facial Pain Headache 2014, 28, 6–27. [Google Scholar] [CrossRef]
  24. Al-Saleh, M.A.; Alsufyani, N.A.; Saltaji, H.; Jaremko, J.L.; Major, P.W. MRI and CBCT image registration of temporomandibular joint: A systematic review. J. Otolaryngol. Head Neck Surg. 2016, 45, 30. [Google Scholar] [CrossRef]
  25. Tegnander, T.; Chladek, G.A.-O.; Hovland, A.; Żmudzki, J.A.-O.; Wojtek, P. Relationship between Clinical Symptoms and Magnetic Resonance Imaging in Temporomandibular Disorder (TMD) Patients Utilizing the Piper MRI Diagnostic System. J. Clin. Med. 2021, 10, 4698. [Google Scholar] [CrossRef]
  26. Weffort, S.Y.; de Fantini, S.M. Condylar displacement between centric relation and maximum intercuspation in symptomatic and asymptomatic individuals. Angle Orthod. 2010, 80, 835–842. [Google Scholar] [CrossRef]
  27. Fantini, S.; Paiva, J.; Rino, J.; Dominguez, G.; Abrão, J.; Vigoritto, J. Increase of condylar displacement between centric relation and maximal habitual intercuspation after occlusal splint therapy. Braz. Oral Res. 2005, 19, 176–182. [Google Scholar] [CrossRef]
  28. Kordass, B.; Gartner, C.; Sohnel, A.; Bisler, A.; Voß, G.; Bockholt, U.; Seipel, S. The virtual articulator in dentistry: Concept and development. Dent. Clin. N. Am. 2002, 46, 493–506. [Google Scholar] [CrossRef]
  29. Camci, H.; Salmanpour, F. A new technique for testing accuracy and sensitivity of digital bite registration: A prospective comparative study. Int. Orthod. 2021, 19, 425–432. [Google Scholar] [CrossRef]
  30. Cohen, J.F.; Korevaar, D.A.; Altman, D.G.; Bruns, D.E.; Gatsonis, C.A.; Hooft, L.; Irwig, L.; Levine, D.; Reitsma, J.B.; de Vet, H.C.; et al. Stard 2015 guidelines for reporting diagnostic accuracy studies: Explanation and elaboration. BMJ Open 2016, 6, e012799. [Google Scholar] [CrossRef]
  31. Schmitt, M.; Kulbersh, R.; Freeland, T.; Bever, K.; Pink, F. Reproducibility of the Roth Power Centric in Determining Centric Relation. Semin. Orthod. 2003, 9, 102–108. [Google Scholar] [CrossRef]
  32. Fleiss, J. The Design and Analysis of Clinical Experiments; Wiley Classics Library Edition: Hoboken, NJ, USA, 1999. [Google Scholar]
  33. Cohen, J. A power primer. Psychol. Bull. 1992, 112, 155–159. [Google Scholar] [CrossRef] [PubMed]
  34. Bujang, M. An elaboration on sample size determination for correlations based on effect sizes and confidence interval width: A guide for researchers. Restor. Dent. Endod. 2024, 49, e21. [Google Scholar] [CrossRef] [PubMed]
  35. Akobeng, A.K. Understanding diagnostic tests 1: Sensitivity, specificity and predictive values. Acta Paediatr. 2007, 96, 338–341. [Google Scholar] [CrossRef]
  36. Fletcher, R.H.; Fletcher, S.W.; Fletcher, G.S. Clinical Epidemiology: The Essentials, 5th ed.; Lippincott Williams & Wilkins: Philadelphia, PA, USA, 2014. [Google Scholar]
  37. Girardot, R.A., Jr. Comparison of condylar position in hyperdivergent and hypodivergent facial skeletal types. Angle Orthod. 2001, 71, 240–246. [Google Scholar]
Figure 1. Correlation between CPI and Modjaw measurements.
Prosthesis 07 00040 g001
Figure 2. ROC curves for CPI and Modjaw. MJ: Modjaw; SAG: sagittal displacement; VERT: vertical displacement; TRANS: transversal displacement.
Prosthesis 07 00040 g002
Figure 3. Overall model quality for CPI (A) and Modjaw (B). A good model has a value above 0.5. Values ≤ 0.5 indicate the model is no better than random prediction. MJ: Modjaw; SAG: sagittal displacement; VERT: vertical displacement; TRANS: transversal displacement.
Prosthesis 07 00040 g003
Table 1. Correlation between CPI and Modjaw measurements.
VariableCPIModjawR95% CI
Mean (SD)Mean (SD)Lower BoundUpper Bound
Vertical left 2.96 (2.01)−0.07 (0.74)−0.064 NS−0.3040.175
Vertical right 2.45 (1.81)0.24 (0.98)0.230 NS−0.0040.464
Sagittal left−2.25 (1.85)−0.48 (0.69)0.286 *0.0560.516
Sagittal right−1.90 (1.47)−0.40 (0.71)−0.067 NS−0.3060.173
Transversal−0.56 (1.01)0.04 (0.73)0.066 NS−0.1740.305
SD: standard deviation; R: Spearman’s correlation coefficient. * p < 0.05. NS p > 0.05.
Table 2. Area under the ROC curve for CPI and Modjaw.
VariablesAreaAsymptotic Significance aAsymptotic 95% Confidence Interval
Lower BoundUpper Bound
CPI VERT0.5950.1260.4730.716
CPI SAG0.5540.3880.4320.675
CPI TRANS0.5930.1320.4720.713
MJ VERT0.6830.0010.5800.786
MJ SAG0.6540.0040.5490.759
MJ TRANS0.777<0.0010.6790.876
a. Null hypothesis: true area = 0.5. MJ: Modjaw; VERT: vertical CO-MI displacement; SAG: sagittal CO-MI displacement; TRANS: transversal CO-MI displacement.
Table 3. Classifier evaluation metrics for CPI and Modjaw.
Variable(s)Gini IndexK-S Statistics
Max K-S aCut-Off (mm)
CPI VERT0.1890.2204.30
CPI SAG0.1070.2281.95
CPI TRANS0.1850.1961.35
MJ VERT0.3660.3021.77
MJ SAG0.3080.3540.91
MJ TRANS0.5540.6010.49
a. The maximum value Kolmogorov–Smirnov (K-S) metric and also the maximum value of Youden’s index. MJ: Modjaw; VERT: vertical CO-MI displacement; SAG: sagittal CO-MI displacement; TRANS: transversal CO-MI displacement.
Table 4. Rounded cut-offs used for CPI and Modjaw, and their corresponding binary classification statistics (including sensitivity, specificity, positive predictive value, negative predictive value and Youden’s index).
VariableCut-Off (mm)SensitivitySpecificityPPVNPVYouden’s Index
CPI VERT4.535.4886.4952.3876.190.220
CPI SAG274.1948.6537.7081.820.228
CPI TRANS1.529.0390.5456.2575.280.196
MJ VERT228.2195.2868.7578.290.235
MJ SAG148.7277.3644.1980.390.261
MJ TRANS0.566.6793.4078.7988.390.601
MJ: Modjaw; VERT: vertical CO-MI displacement; SAG: sagittal CO-MI displacement; TRANS: transversal CO-MI displacement; PPV: positive predictive value; NPV: negative predictive value.
Disclaimer/Publisher’s Note: The statements, opinions and data contained in all publications are solely those of the individual author(s) and contributor(s) and not of MDPI and/or the editor(s). MDPI and/or the editor(s) disclaim responsibility for any injury to people or property resulting from any ideas, methods, instructions or products referred to in the content.

