Article

Mechanical Behavior of Oil-Saturated Silicone Membranes for Adipose Tissue Synthesis in Clinical and Theatrical Prosthesis

by
Richard Arm
*,
Arash Shahidi
,
Andreea Pislaru
,
Kalana Marasinghe
,
Richard Bibb
and
Theodore Hughes-Riley
Nottingham School of Art & Design, Nottingham Trent University, Bonington Building, Dryden Street, Nottingham NG1 4GG, UK
*
Author to whom correspondence should be addressed.
Prosthesis 2024, 6(6), 1340-1358; https://doi.org/10.3390/prosthesis6060097
Submission received: 30 August 2024 / Revised: 7 November 2024 / Accepted: 13 November 2024 / Published: 19 November 2024
(This article belongs to the Special Issue Innovative Prosthetic Devices Applied to the Human Body)

Abstract

:
Emulating very soft tissues with synthetic materials is important for clinical prosthetists who want to improve compliance in maxillofacial and breast prosthesis. It is equally important for theatrical prosthetists wanting to model bariatric conditions and soft organs for surgical or palpation training. Polydimethylsiloxane (PDMS) gels, which are often used in medical model construction, are stiff and highly elastic compared to the friable soft tissues found in the body. Silicone oil is known to soften PDMS gels, but it is not known precisely how oil dispersal affects these gels and what proportion of oil is needed to simulate very soft tissue membranes like adipose tissue. In this work, internationally agreed test standards were used to mechanically characterize a range of PDMS gel membranes saturated with different amounts of silicone oil to determine whether materials with behavioral similarities to adipose tissue could be created. Mechanical properties like hardness, elasticity, strength, viscoelastic behavior and cure-time are presented in this study, which are all key factors required by the creators of such membranes. Results were compared to identical tests on porcine fat and data in the literature for porcine and human fat. The data revealed a strong correlation between increases in oil content and decreases in membrane hardness, strength and elastic modulus. It was also found that increases in oil content caused proportional increases in cure time, while membranes with equal amounts of oil and gel were best at mimicking characteristics of human and porcine fat, like hardness and elasticity.

1. Introduction

Polydimethylsiloxane (PDMS) gels, or silicones, are routinely used by maxillofacial prosthetists (anaplastologists) to create all kinds of soft, elastomeric membranes as an integral part of their daily work in simulating human soft tissues [1]. Colorless, non-toxic and mechanically acrobatic, PDMS gels can be easily altered by users with the addition of inert fillers, hardeners and softeners to alter gel compliance [2,3]. Knowledge of these properties and how to achieve predictable results remains the tacit, embodied know-how of experienced prosthetists, and is virtually undocumented in the academic literature.
The purpose of this investigation was to determine the effect of PDMS oil dispersion in PDMS gel for prosthetic use as a surrogate for the oily membrane of the hypodermis, also known as subcutaneous adipose tissue (SAT) or, more simply, fat. This is especially useful for the production of life-like models for clinical training, such as breast examination, tumor identification and soft tissue palpation in bariatric patients, but also for improving maxillofacial prosthesis mobility, where the hypodermis plays a crucial role in soft tissue behavior [4,5].
In this investigation, warmed porcine SAT specimens were obtained from a licensed butchers (Michael Carter Fresh Foods, Nottingham, UK) and were tested alongside five PDMS gel membranes containing various amounts of oil, in order to compare their mechanical properties. Each synthetic, PDMS membrane contained different amounts of added silicone oil, which was incrementally increased for each group tested. The results of the tests on porcine SAT and PDMS membranes were also compared and measured against the sparse data available in the literature. Internationally agreed test standards were used to prepare and examine the mechanical characteristics of porcine SAT and PDMS surrogates, so the results of this work can be easily reproduced and compared to other work. Specifically, data were gathered on cure time, hardness, elasticity, strength and viscoelasticity, aspects important and familiar to clinical and theatrical prosthetists.
Mechanical characterization of porcine SAT, contained in this study, was used to provide a benchmark for surrogate (PDMS) material behavior, but porcine tissue characterization is not the focus of this work. The focus here is to establish a robust test regime and to characterize the behavior of oil saturated PDMS gels. Utilization of popular, commercially available materials, like PDMS, well-known to multidisciplinary investigators, make results of this study especially useful for a wide audience.
This study also reveals several previously unknown quantitative changes in PDMS membrane behavior that may be useful for a wide range of applications, beyond prosthesis. Additionally, the overarching objective of this work was to present the results in a way that makes them accessible to investigators from a wide variety of disciplinary backgrounds. To do this, all methods and materials used are documented thoroughly, and the results are presented in a visual, tangible manner where the tactile properties of the materials can be clearly communicated. As such, this work does not include any theoretical work, finite element analysis or mathematical constitutive modeling.

Background

To simulate very soft, oily membranes analogous to SAT, it is necessary to first understand the composition of these membranes and how they respond to mechanical deformation. SAT is broadly defined in the literature as an oily, gel-like material found throughout the human body, typically just under the skin [4,5]. Due to its friable, oily nature, SAT is incompressible and immiscible with water-based substances like blood and is highly temperature-dependent in its response to mechanical deformation [4,5]. Comley and Fleck investigated the response of SAT to mechanical stresses, but their observations were based on non-standard test methods using custom-made equipment, making replication of their results and direct comparisons with other studies, problematic [6,7,8]. Nevertheless, their groundbreaking work showed that SAT had a Young’s modulus of 0.011 ± 0.006 MPa, exhibiting a non-linear, stress–strain vector up to 30% in uniaxial elongation [6,7,8].
Frustratingly, Comley and Fleck are not unique in their use of non-standard and undisclosed test regimes. For example, most studies that use bespoke test equipment often fail to share the full details of their test apparatus’ specification, design or construction and specimen conditions like hydration and temperature, conditions well-known to affect the mechanical response of both organic soft tissues and synthetic elastomers alike [9,10].
Fortunately, some mechanical tests on other very soft tissues, where elevated hardness is an indication of diseases like liver fibrosis, skin sclerosis and diabetes, test standards like indentation, have been reported [11,12,13,14,15,16,17,18,19,20]. Indentation by durometer is a simple and reliable method that can be used to measure the Shore hardness of soft tissues and soft elastomers, alike. In particular, the fat pad of the heel has been previously recreated using PDMS gels, characterized by indentation by durometer hardness tests [21,22]. The value of test standards, especially indentation by durometer, are recognized and reported in some literature sources [2,21,22], but no published examples specifically documenting adipose fat hardness measurements, with reference to the standard, could be found. Due to this gap in the literature, an objective of this investigation was to identify adjustable mechanical properties of modified PDMS gels, so that they can be used to emulate their biological counterparts (SAT) using recognized test standards. Critically, accessibility and affordability of durometers, and the reliability of results they produce, means that they could be widely adopted in future studies, using the recommended universal standards.
The softening effect of PDMS oil is also quite poorly understood and has previously been mistaken for ethoxylated polyethyleneimine (PEIE) softeners like ‘Smith’s prosthetic deadener’, perhaps due to the similar softening properties [23]. However, PDMS oil and PEIE are very different additives, that yield different physical characteristics when mixed with PDMS gels. Most notably, oil-saturated PDMS gel results in an oily, soft, self-lubricating cured gel [24], while in contrast, PEIE mixed with PDMS gel produces a sticky, soft, cured gel, that is not oily at all [3].
It is well known in the prosthesis fabrication community that the dispersal of PDMS oil during PDMS elastomer preparation retards polymeric cross-linking of the platinum salt-based catalyst and the base siloxane, but no specific values are given in the literature. Specifically, cure time can be defined as the time it takes for the two liquid components of the PDMS (base and catalyst) to be mixed and formed into a solid mass that can be removed from a surface without leaving a residue. The impact of oil addition on the cure time is especially important to prosthetists and researchers since it affects how long the liquid remains in a usable fluid state from a processing perspective.
Researchers at the Optical and Biomedical Engineering Laboratory (OBEL, University of Western Australia) recognized that the dispersal of silicone oil in PDMS gel created very soft, viscoelastic materials which are mechanically analogous to soft, visceral tissues or soft friable internal organs [25]. The mixing ratios specified on the OBEL website claim that between 100% and 600% (by weight) oil dispersal in a relatively firm 45 Shore A hardness PDMS rubber yielded moduli between 0.3 MPa and 0.01 MPa, respectively. The hardness results were indeed within range of most very soft tissues given in the literature, but a lack of reported test methodologies or standards stifles validation of their results [9,10,11,12].
PDMS gels have also been combined with oil at higher percentages than those used by OBEL, to simulate other soft tissues, specifically for medical imaging training. For example, Oldenburg and colleagues used 900% oil blended with a firm 44 Shore A hardness PDMS gel to simulate human skin in magnetic resonance imaging scenarios [26]. Other researchers used similar percentages of oil to create soft tissue phantoms for magnetic resonance elastography imaging, noting that the elastic modulus of the cured PDMS changed from 0.359 MPa to 0.012 MPa as the amount of oil was increased from 100% to 900%, respectively [27]. Other similar investigations used a firm PDMS, with a 43 Shore A hardness, to look at the changes in tensile and shear characteristics with the addition of 10–30% oil dispersal, where a significant softening effect was observed [28]. Unfortunately, all of these studies failed to disclose any test methodologies or adhere to test standards, making repeatability or validation of their work, problematic.
PDMS oil has also previously been used as a mixed viscosity reducer. In one study, up to 50% oil (by weight) was added to a PDMS gel to reduce the mixed viscosity, and it was found that the modulus was reduced as the percentage of oil was increased [29]. Other investigations have also explored the potential of PDMS oil as a thinning agent to reduce the mixed viscosity of PDMS elastomers too. In one study, blends of PDMS gel and oil ranging from 50% and 83% oil, were used to reduce the thickness of the PDMS gel to improve removal of air bubbles in the cured gel [30]. In their effort to simulate the optical properties of breast tissues in medical imaging scenarios, they noticed that adding oil also caused a softening effect in the PDMS gel [30].
Interestingly, the unique behavior of oil-saturated PDMS elastomers has been linked to its molecular structure when cured, where the presence of oil prevents the gel from fully cross-linking (curing). Briefly, the dispersal of PDMS oil in a PDMS gel causes what are known by chemists as ‘dangling chain polymers’. These molecular ‘dangling chains’ allow the oil content to migrate through the cured gel, causing what is known as leeching, where the PDMS gel feels oily to touch [31].
From a prosthetist’s viewpoint, the addition of oil causes a characteristic lubricating, softening and slumping effect, that becomes more pronounced as more oil is added [32,33]. Importantly, this slumping or relaxation phenomena is a trait typically associated with very soft, organic tissue behavior, like SAT, the spleen and the liver [32,33,34].

2. Materials and Methods

A two-part, room temperature vulcanizing (RTV2) PDMS gel with a native Shore A of 10 (Platsil® gel 10, Polytek, PA, USA), popular among prosthetists, was used to produce 50 test specimens from five manufactured membranes, each with varying amounts of oil (0%, 50%, 100%, 150% and 200% added oil, by weight). Each specimen was characterized using a variety of repeatable internationally agreed test standards, as shown in Table 1.
Mechanical tests were conducted on warmed porcine SAT (Michael Carter Fresh Foods, Nottingham, UK) to establish a benchmark data set, using the same methods and equipment that would be employed to test the hardness of PDMS membranes. The hardness data gathered were also compared to data on human SAT found in the literature.
Data on Shore hardness, elastic modulus and ultimate tensile strength were recorded. Multi-axial tensile tests were also conducted to identify the effect of preconditioning on the viscoelastic, time-dependent properties of the PDMS membranes at specific hardness intervals. Summarily, the tests used for this mechanical study included hardness, spring force, tensile stress-strain tests, Young’s modulus, ultimate tensile strength and multi-axial compression tests.

2.1. Test Stamdards Used

The mechanical test methods, codes and references used for this study can be found in Table 1. A selection of North American and international test standards were used to ensure rigorous documentation and repeatability of mechanical tests. Readers are encouraged to refer to these resources for a detailed account of precisely how to gather results comparable to this study.

2.2. Shore Hardness

Indentation by durometer is the only agreed standard that has been certified for the measurement of soft tissues and soft elastomers alike, which makes comparative studies among these groups particularly insightful. Indentation by durometer is a non-destructive test that uses a spring-loaded blunt cone, or a hemispherical indenter, connected to a display (analog dial or digital screen) to measure penetrative depth and the related resistive force on the spring. Data values are expressed as Shore hardness units (e.g., SH 00 or SH 000). Reisfeld and colleagues determined that the 00-calibrated durometer was best suited to measuring the hardness of skin [20]. Due to the softness of the specimens created for this investigation, type 00 and 000-calibrated durometers were used for data acquisition (SN: 50168 ‘Checkline’; Cedarhurst, NY, USA). Both durometers had an identical mass of 246 g and were mounted to the same stand to reduce user error when collecting data. The combined weight of the durometer and descending arm of the stand increased the total test mass exerted on the spring-loaded indenter to 403 g. The stand conformed with ASTM D2240-03 (stand eligibility remained unchanged in the more recent ASTM D2240-21) [35]. The (type 2) durometer stand (RX-OS-4H) controlled the rate of descent during tests, so each loading interaction was identical. The distance between the test surface and the specimen was 25 mm for all tests. Prior to test commencement, three specimens were plied to a total thickness of 6 mm, using 3 × 2 mm thick disc specimens as per the standard. Each stack of specimens was measured five times in different, randomly selected, locations. Each reading was taken after three seconds of surface contact. Five measurements were taken 6 mm apart and 12 mm from any edge and recorded directly as a shore 00/000 hardness value. The arithmetic mean was calculated and presented in the relevant charts.

2.3. Spring Force

The shore hardness values were converted to an indenter spring force value in Newton’s as per the standard. Spring force is a useful tool for comparative purposes using the formula given in Equation (1).
N = 0.203 + 0.00908 H 00 H 000
where N is the force in Newtons, and H 00 and H 000 equal the degree of hardness specified by the durometer.

2.4. Tensile Stress–Strain

Ultimate tensile strength, Young’s modulus and stress-strain behavior was measured with the tensile test in extension to failure. A Zwick/Roell Z2.5 tensile testing machine (Zwick/Roell GmbH & Co. KG, Ulm, Germany) was used to conduct the tests as per the standards. Raw test data were captured using TestXpert II software (version V1.8, ZwickRoell GmbH & Co. KG, Ulm, Germany), and the results were processed using a program written in Matlab (Version R2020a, The Mathworks Inc., Natick, MA, USA). Graphs and charts were prepared using Microsoft Excel software (version 2405, Microsoft, Redmond, WA, USA).
Test standards BS/ISO 37:2024 [36], ASTM D412-16 (2021) [37] and BS ISO 5893:2002 [38], shown in Table 1, were used to fix the test parameters to best suit the test specimens’ softness. Specifically, test standard BS ISO 5893:2002 [38] specifies three suitable methods for measuring elongation (or ‘deflection’). Method ‘A’ (grip-to-grip separation) was selected to align results with similar publications found in the literature [41,42]. Pneumatic jaws with rubber (polyurethane) grips were used to prevent any slippage (as reported in the literature) that can occur during the elongation of elastomeric membranes [43,44]. The grips were mounted to a 200 N load-cell with grip-to-grip separation set to 25 mm, with a preload of 0.05 N, and test speed of 50 mm/min. Eleven different speed options are specified by the standard, ranging from 1 mm/min to 500 mm/min. The present study adopted a 50 mm/min test speed to align it more closely with more similar studies on human skin that used a non-standard speed of 55 mm/min [43,44]. Slower test speeds on soft tissues such as human skin are primarily intended to provide sufficient time for the viscous and fibrous components to react to the deformation stresses, as detailed in the literature [45,46]. The same test speed was maintained for the multi-axial study in Section 2.5.
Young’s modulus was determined using the deformation slope’s first rising, linear region. All readings were taken after the initial toe region of the curve as the specimen straightened under loading, but before the anisotropic area of the curve, as per the standard (BS/ISO 37:2024) [36].
Ultimate tensile strength (UTS) maps the mechanical strength limitations of specimen groups. Strength is an indication of durability and is especially important for reusable prosthetics like maxillofacial prostheses and surgical simulations where user interactions are not monitored nor sympathetic to appliance longevity. The UTS is identified by the sudden loss of stress during extension. Specimens do not have to rupture to be classified as failed; only a significant, unrecovered loss of resistance to stress is required to determine failure, as per the standard (BS/ISO 37:2024) [36].

2.5. Multi-Axial Compression

Data gathered from multi-axial tests can provide useful information on the viscoelastic response to deformation of a sample, like hysteresis, force degradation, unrecovered deformation and force decay. The Zwick/Roell Z2.5 tensile testing machine (Zwick/Roell GmbH & Co. KG, Ulm, Germany) was used to gather all multi-axial deformation data. The standard used herein, ISO 20932-2:2018 [39], was adopted for the mechanical characterization of elasticated fabrics, which share many mechanical properties with soft tissues and composite elastomers.
The samples were secured using method ‘A’ in accordance with the ISO 20932-2:2018 [39] standard, which is classified as the ‘Dynamic test’. For this test, a horizontally mounted ring-clamp device was used, while the samples were supported from underneath with a telescopic spacer block to prevent specimen weight distortion (sagging). The hemispherical Teflon probe tip had a specific diameter of 100 mm, and the inside ring clamp diameter of the test area was 120 mm. The probe was connected to a 200 N load cell, and the speed was consistent for all multi-axial tests at 50 mm/min. Each sample was subjected to six cycles up to 5 N. As mentioned in the literature, 5–8 N represents the force exerted on soft tissues during palpation, organ handling or surgical tool forces. [2,47,48,49].
The force displacement curve for each specimen was collected throughout each cycle. The testing procedure was consistent for all specimens, using identical setups and timings. Force decay was assessed by maintaining the sample at maximum force for sixty seconds during the fifth cycle. Unrecovered deformation, or bagging, was determined during the sixth cycle while unloading at 0.2 N.

2.6. Materials

Two membrane types were tested, organic and synthetic porcine SAT and PDMS membranes. Specimens from the same animal were used for all tests on porcine SAT. Five PDMS membranes were tested with incremental amounts of added oil, up to a 2:1 ratio (oil to PDMS, respectively) or 200% total volume by weight.

2.7. Porcine Fat

Porcine SAT was obtained from the abdomen of an 18-month-old bacon pig slaughtered for human consumption, purchased commercially from a licensed local butcher (Michael Carter Fresh Foods, Mapperley, Nottingham, UK). The SAT was harvested 24 h after slaughter and stored in a chilled cabinet.
The epidermis and connective tissues were debrided from the fat to a uniform thickness of 6 mm using a surgical scalpel while still chilled. The fat specimens were warmed to 37 °C in a saline solution prior to testing. Testing was conducted using a 000-calibrated Shore hardness durometer (Rex gauge LLC, Lake Zurich, IL, USA) mounted onto a RX-OS-4H stand (Rex gauge LLC, Lake Zurich, IL, USA) to eliminate operator error. Twenty-five readings were taken from three separate specimens from the same region of the same animal.

2.8. PDMS Membranes

Common to all specimens were the base ingredients, primarily, PDMS gel and PDMS oil. Specifically, Platsil® Gel 10, a platinum-based silicone gel with a 10 Shore hardness and pure PDMS (silicone) oil. PDMS gels are commercially available (Polytek Development Corp’®, Easton, PA, USA). PDMS oil (Lubrisolve®, Somerset, UK) is widely available as a lubricant, commonly used for optics and exercise equipment. Comparable formulas are available globally, but brand names may differ in other regions outside the USA, UK and Europe.
When mixed at the stoichiometric ratio (1:1), the viscous liquids that comprise the PDMS gel form a soft, elastic gel (Shore A-10 is equivalent to approximately Shore 00-50). The short cross-linking time (cure-time) of the chosen PDMS gel was important because the addition of PDMS oil in the gel (prior to curing) is known to delay cross-linking. The amount of oil added to each group was increased in 50% increments from 0% to 200%, by weight. Both PDMS gel and oil are widely available and have been used in similar previous studies [2,23,24,25,26,27,28,29,30,31].

2.9. General Material Preparation

All materials were prepared as per the standard (BS/ISO 23529:2016) [40]. Materials were weighed using digital scales and mixed by hand in a plastic beaker with a clean wooden tongue depressor. Preparation, by hand, was preferred over automated mixing machines because automated machines are rarely used by prosthetists, mainly due to cost and the short working times of materials. Additionally, research also suggests that hand-mixing by an experienced user yields superior results over a wider range of materials and fillers [50]. Each mixture was stirred for five minutes until thoroughly homogeneous before being degassed in a vacuum chamber (Easy Composites®, Stoke-on-Trent, UK) for five minutes at −982 mbar (−736 mm Hg) to remove entrapped air from the mixture. After degassing, mixtures were removed from the vacuum chamber, poured into a leveled gauge mold that measured 500 mm × 500 mm × 2 mm, and allowed to cure for 24 h. Once cured, the 2 mm thick membrane was powdered with talcum powder (Johnson and Johnson®, Neuss, Germany) to reduce surface tackiness before being cut into test specimens, dumbbell and disc shapes for the uniaxial and multi-axial tests, respectively.
Dumbbell cutting dye, type 1A, was given preference in the tensile test shape because Annex C of the standard (ISO 37:2024) [36] states that type 1A was least likely to break outside the test area when testing soft specimens. All specimens were cut prior to demolding to mitigate the risk of sample distortion when cutting. Completed specimens were measured and stored according to the standard.

3. Results

Mechanical test results provided in this section focus on the tactile characteristics of materials. Digital image correlation and other optical analyses are excluded from this study to maintain a concise presentation of results relevant to the sense of touch. Before the results of mechanical tests can be discussed, it is important to briefly discuss data concerning specimen preparation, specifically cure time. More information regarding these results can be found at Supplementary Materials: https://zenodo.org/records/14179120.

3.1. The Effect of Oil Dispersal in PDMS Gel Membrane Cure Time

Twenty-five specimens were prepared for this experiment, five groups of five, each group with a different oil content (0%, 50%, 100%, 150% and 200% oil, by weight). It was found that when blended with the PDMS gel used in this study, PDMS oil slowed the gel cure time by 63% (15 min) with the introduction of just 50% oil (or a 2:1 ratio of gel to oil, respectively). For each additional 50% of oil, the cure time was delayed by an additional 31% ± 13% (average of 7.5 ± 3 min). Ambient test conditions were warm and dry, normally around 23.7 °C and 15% RH (relative humidity).

3.2. Membrane Hardnesses

Results of hardness tests include data on the porcine fat and PDMS gel membranes prepared specifically for this study.

3.3. Porcine SAT Membrane Hardness

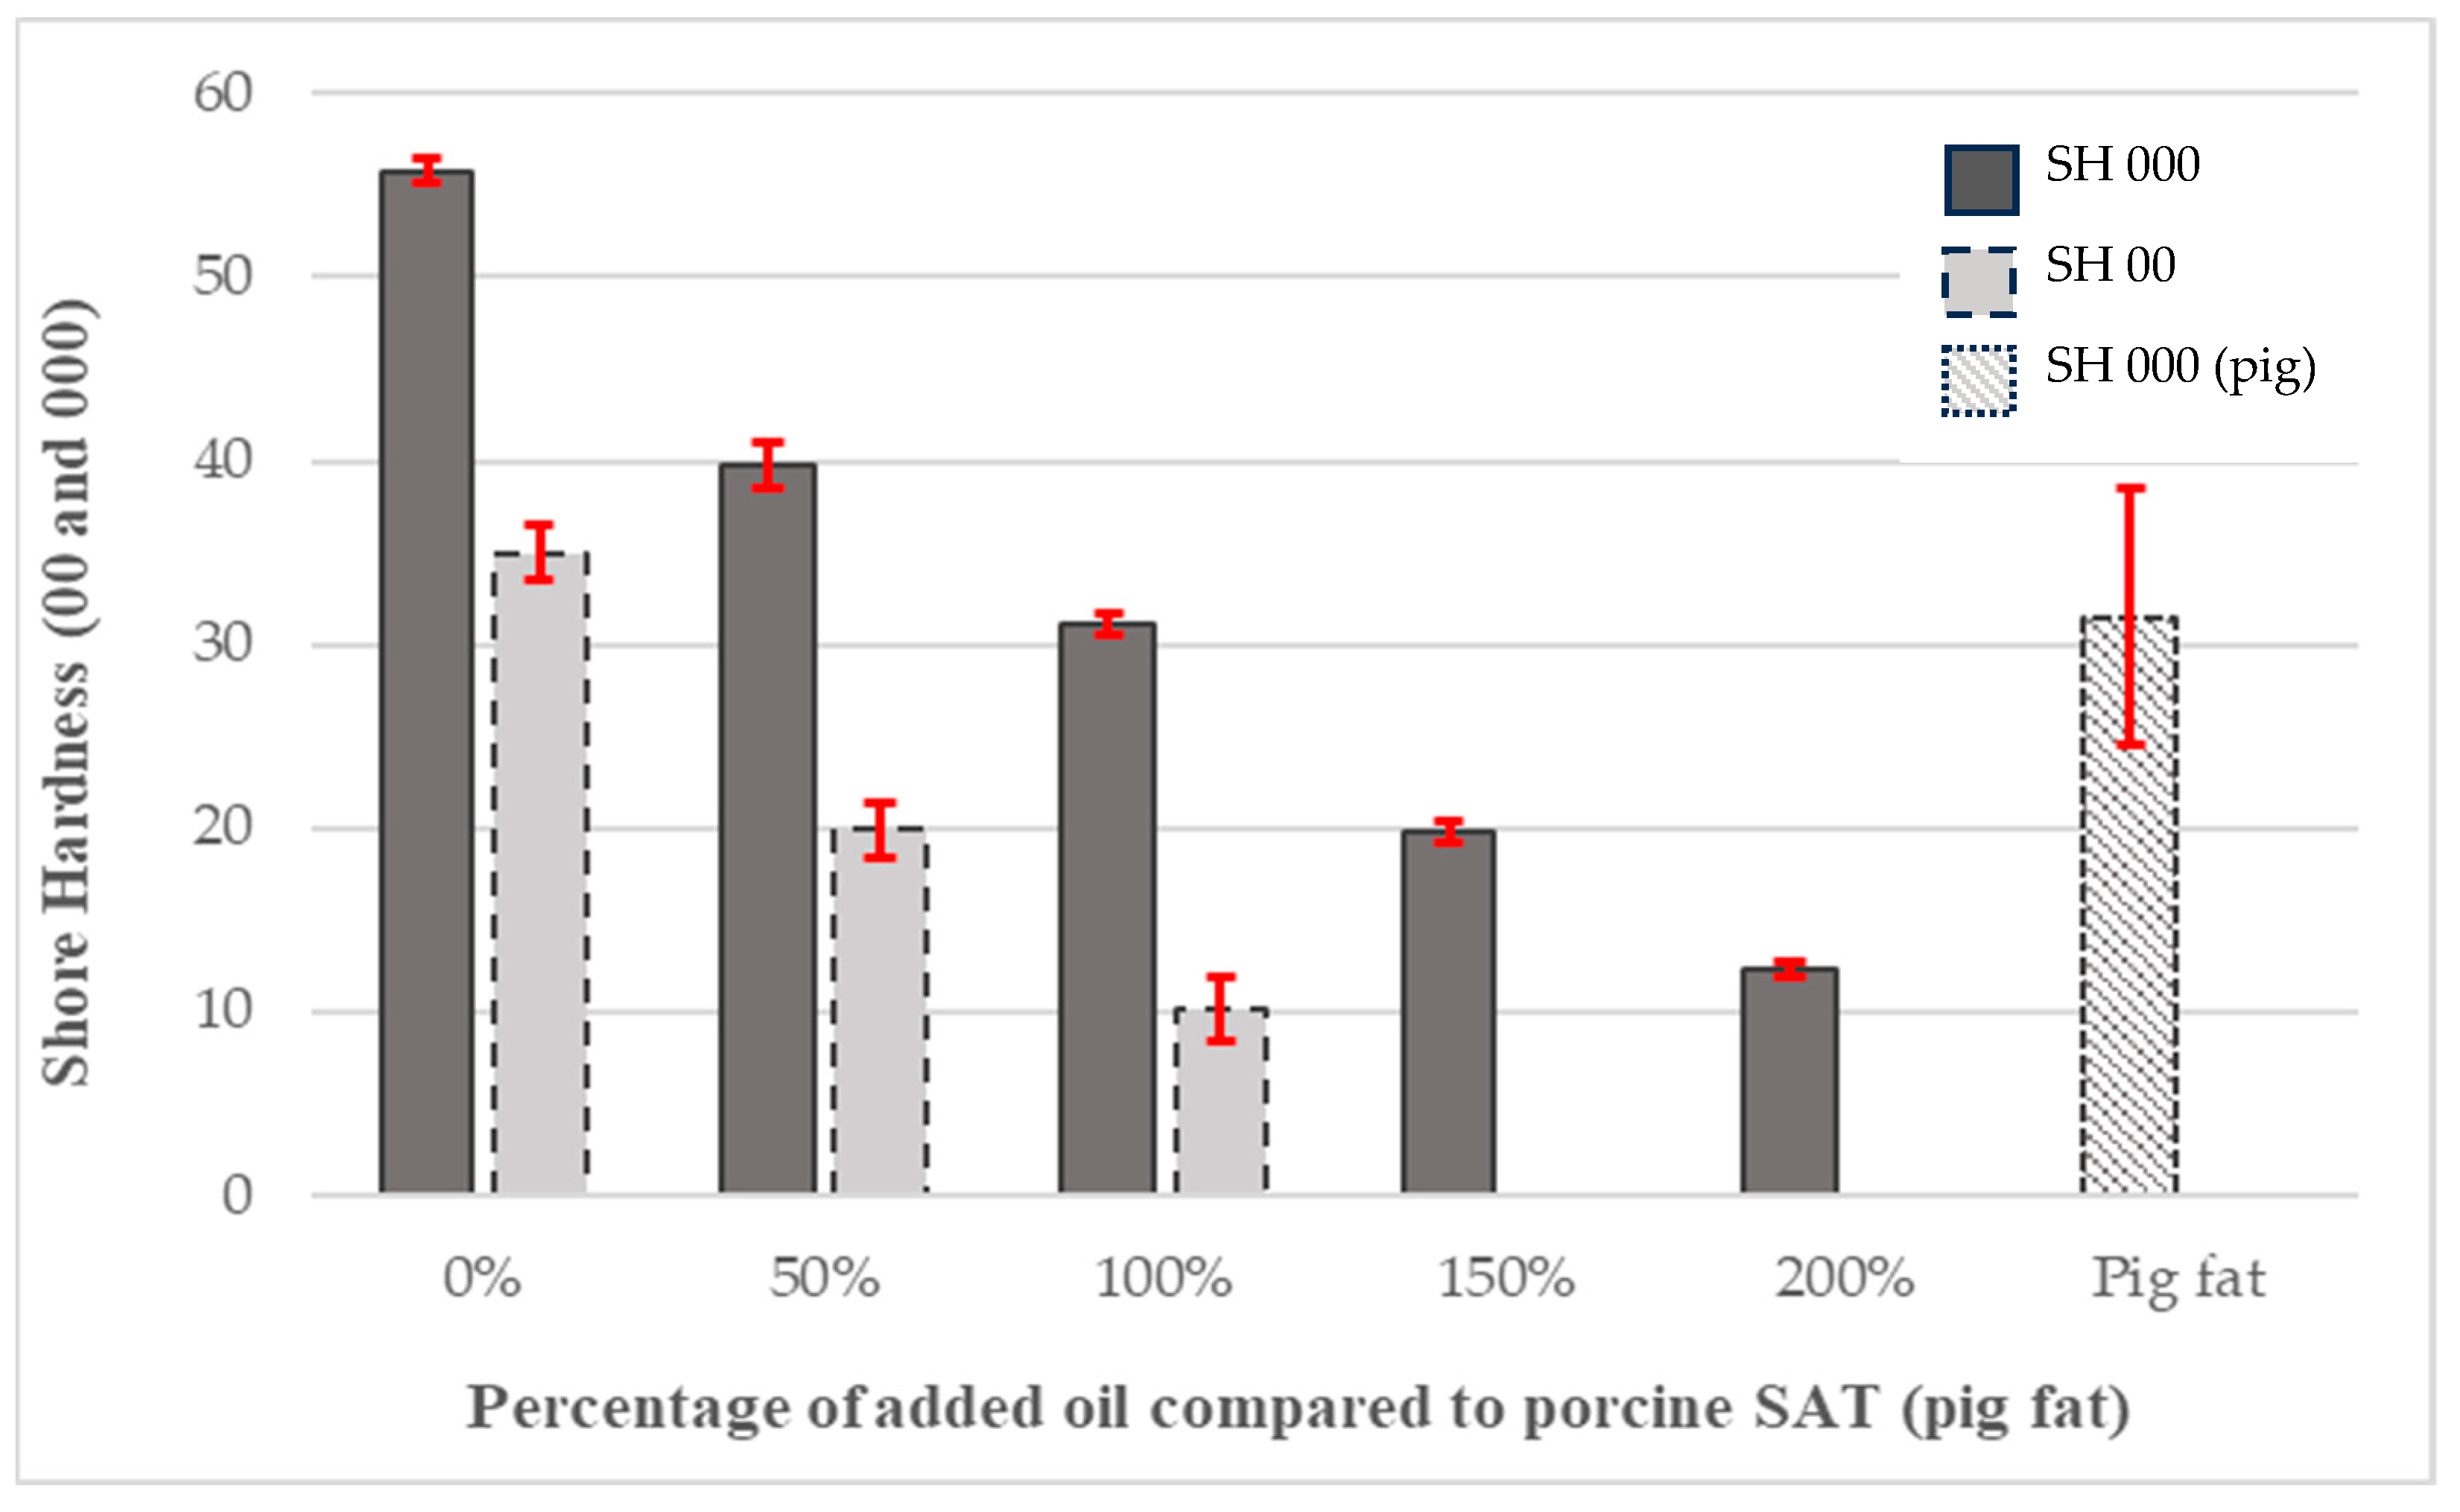
Indentation tests on the porcine SAT showed it had an average hardness of 31.7 H 000 with a standard deviation of 6.91 H 000, shown in Figure 1.

3.4. PDMS Membrane Hardness

The results of the 00 and 000 calibrated Shore hardness tests on PDMS membranes are shown in Figure 2.
As the amount of oil increased from 1:2 to 2:1 (oil to gel), the hardness of the material significantly softened, steadily becoming softer as the amount of added oil was increased. After a slightly larger initial drop in hardness of 16 H 000 between the control group with no added oil and the group with the least amount of added oil (50% or 1:2 ratio), the hardness gradually decreased as more oil was added. The average reduction in hardness across the remaining three groups (100–200%) was 9 H 000 for every additional 50% of added oil. The deviation in the results is shown for each group in Figure 2.
Also shown in Figure 2, only results gathered using the 000 Shore hardness-calibrated durometer could be used to collect data from all of the samples. Data gathered using the 000 Shore hardness durometer had a linear regression value of R2 = 0.9875. The formula used to calculate the linear relationship is given in Equation (2).
y = 85.184 e 0.372 x
Based on the 00 Shore hardness-calibrated durometer readings, the linear regression was found to be similarly strong, at R2 = 0.9976, despite the reduced number of data points available. The formula describing this linear relationship is provided in Equation (3).
y = 66.311 e 0.62 x

3.5. Ultimate Tensile Strength of PDMS Gel Membranes with Dispersed Oil

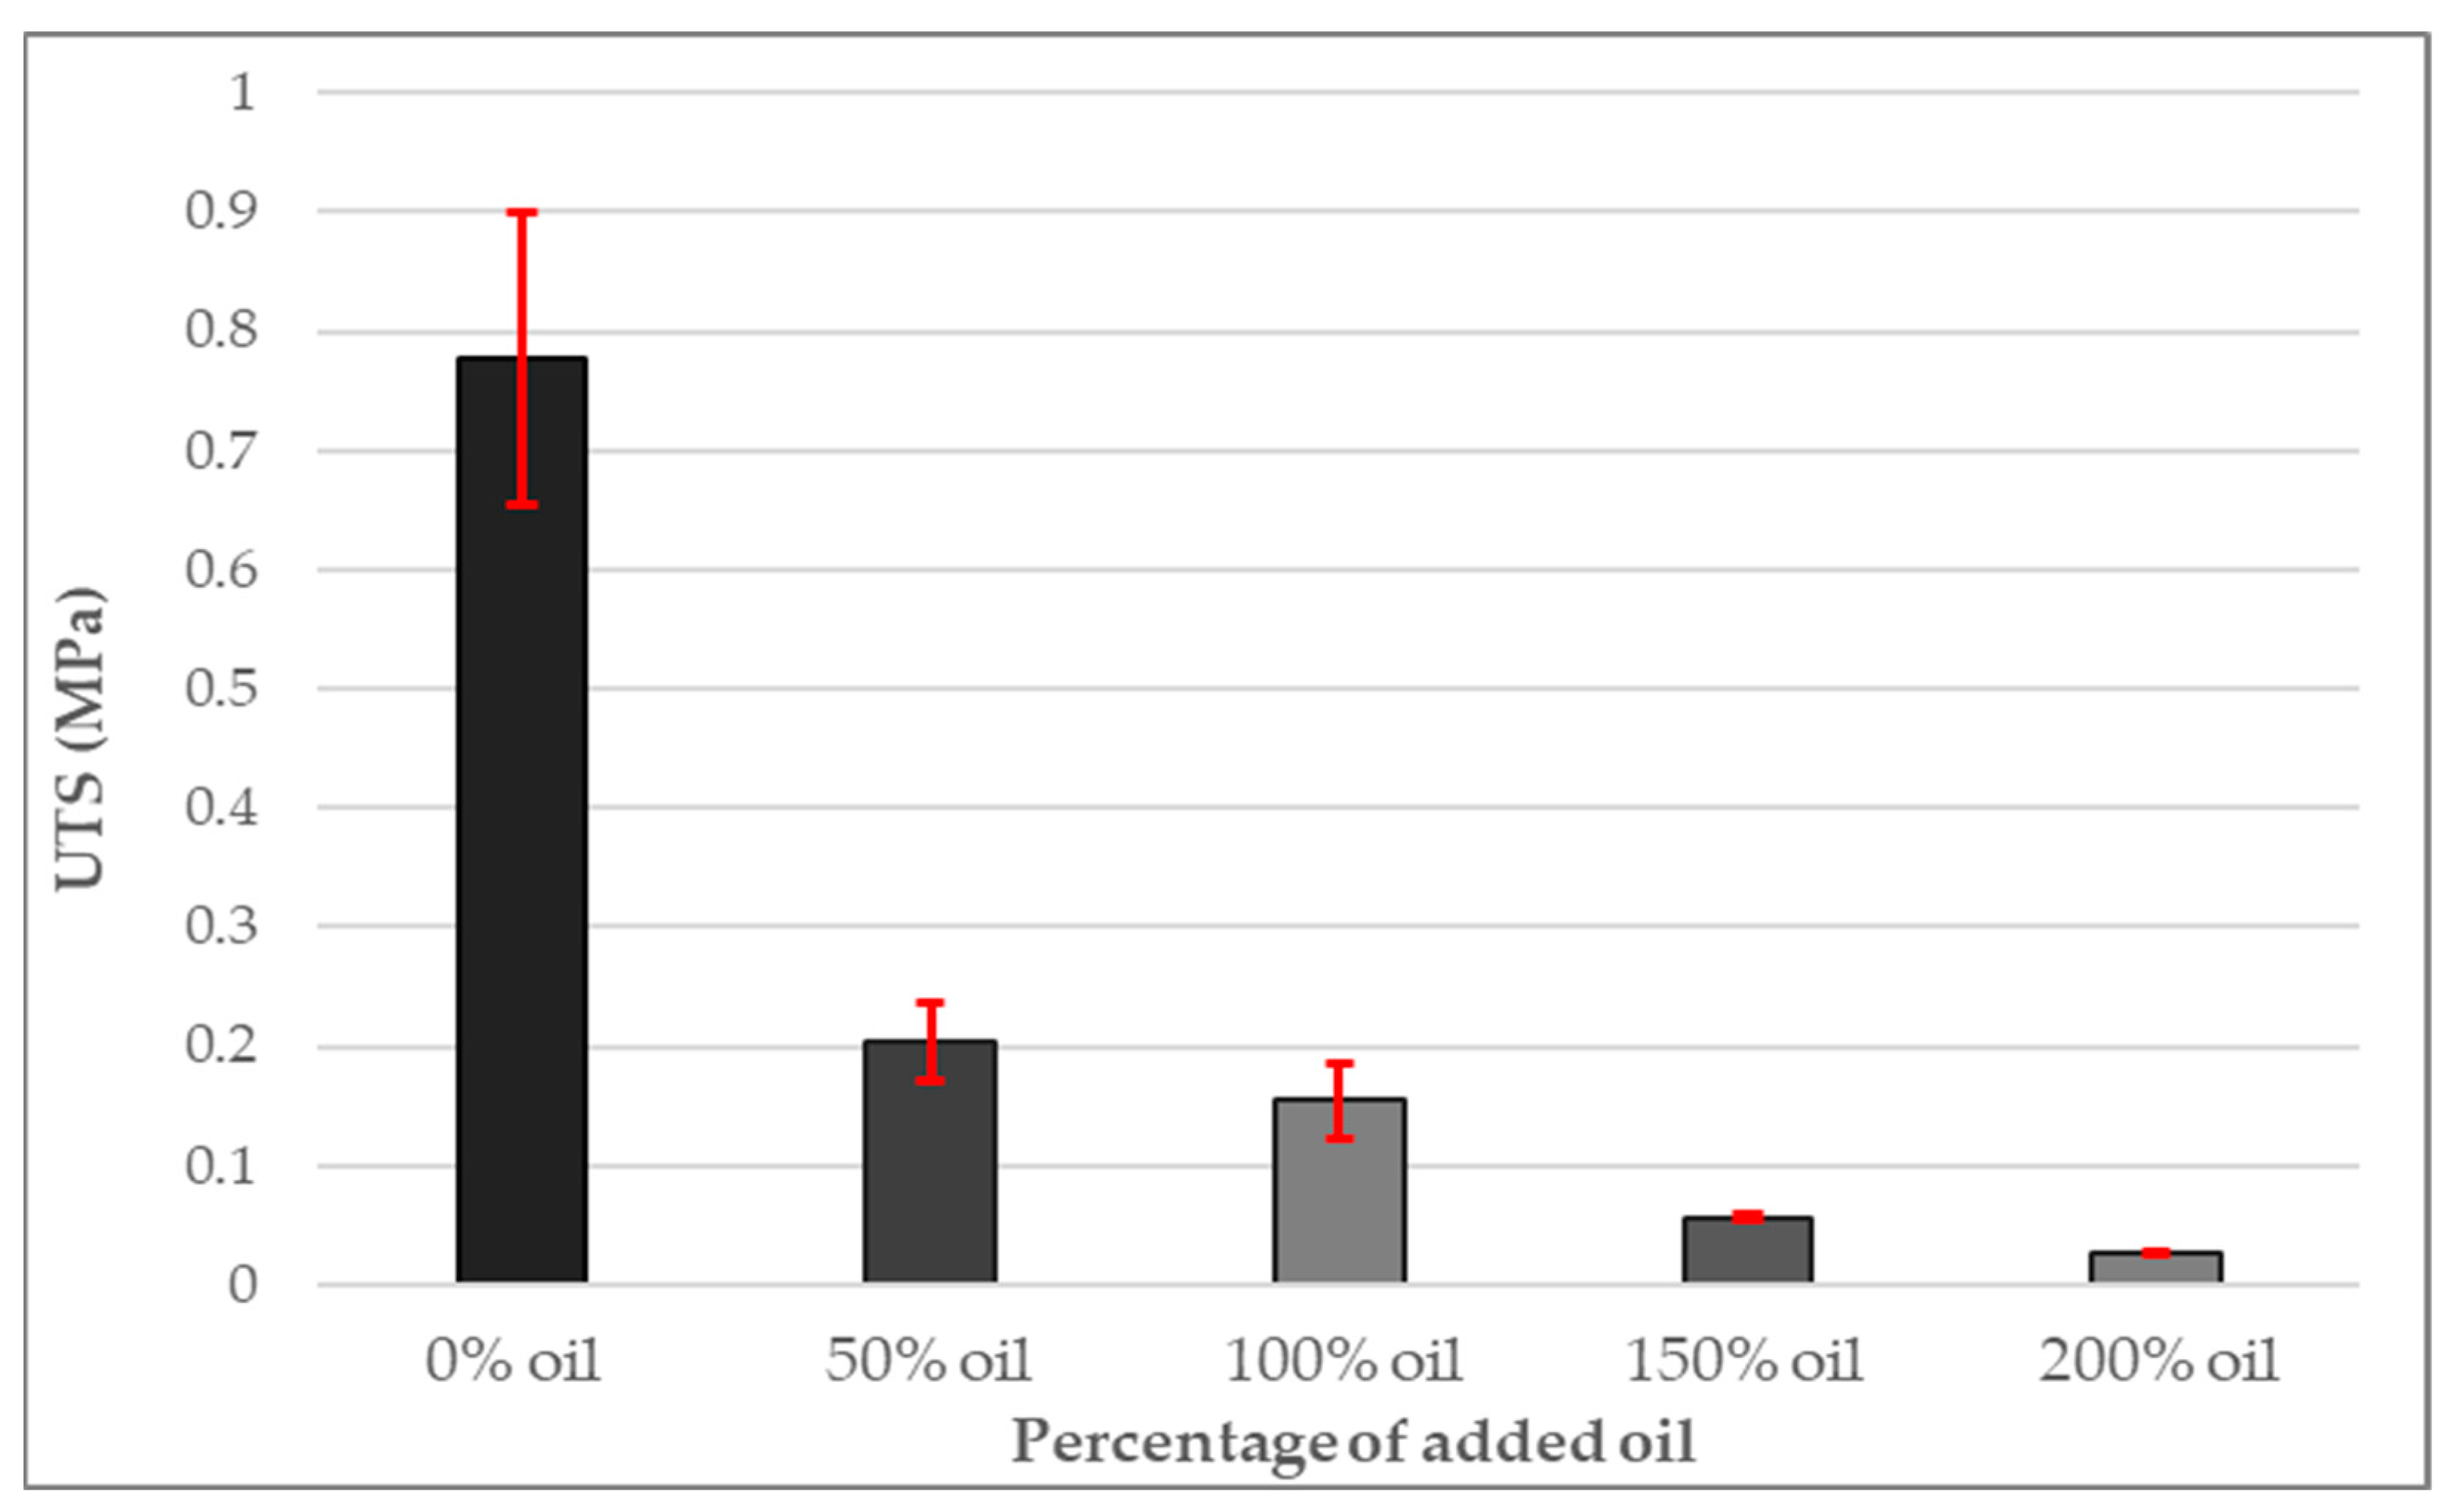
UTS values are provided in Figure 3, demonstrating that changes in UTS were influenced by oil content. After a large initial loss of strength (0.566 MPa) with the introduction of 50% oil, strength continued to decrease at a much slower rate as the amount of oil was increased beyond 50%. The results of UTS tests also showed that the addition of just 50% oil weakened the PDMS gel significantly (by 73%).
Standard deviation was seen to significantly diminish as the amount of added oil was increased. Deviation of UTS in specimens without oil was 0.24 MPa, while specimens with the most oil added exhibited much less deviation amongst specimens with just 0.001 MPa deviation.
Linear regression of the four groups that contained oil, shown in Figure 3, was R2 = 0.9623, calculated using the formula given in Equation (4).
y = 0.0629 x + 0.268

3.6. Young’s Modulus of PDMS Gel Membranes with Dispersed Oil

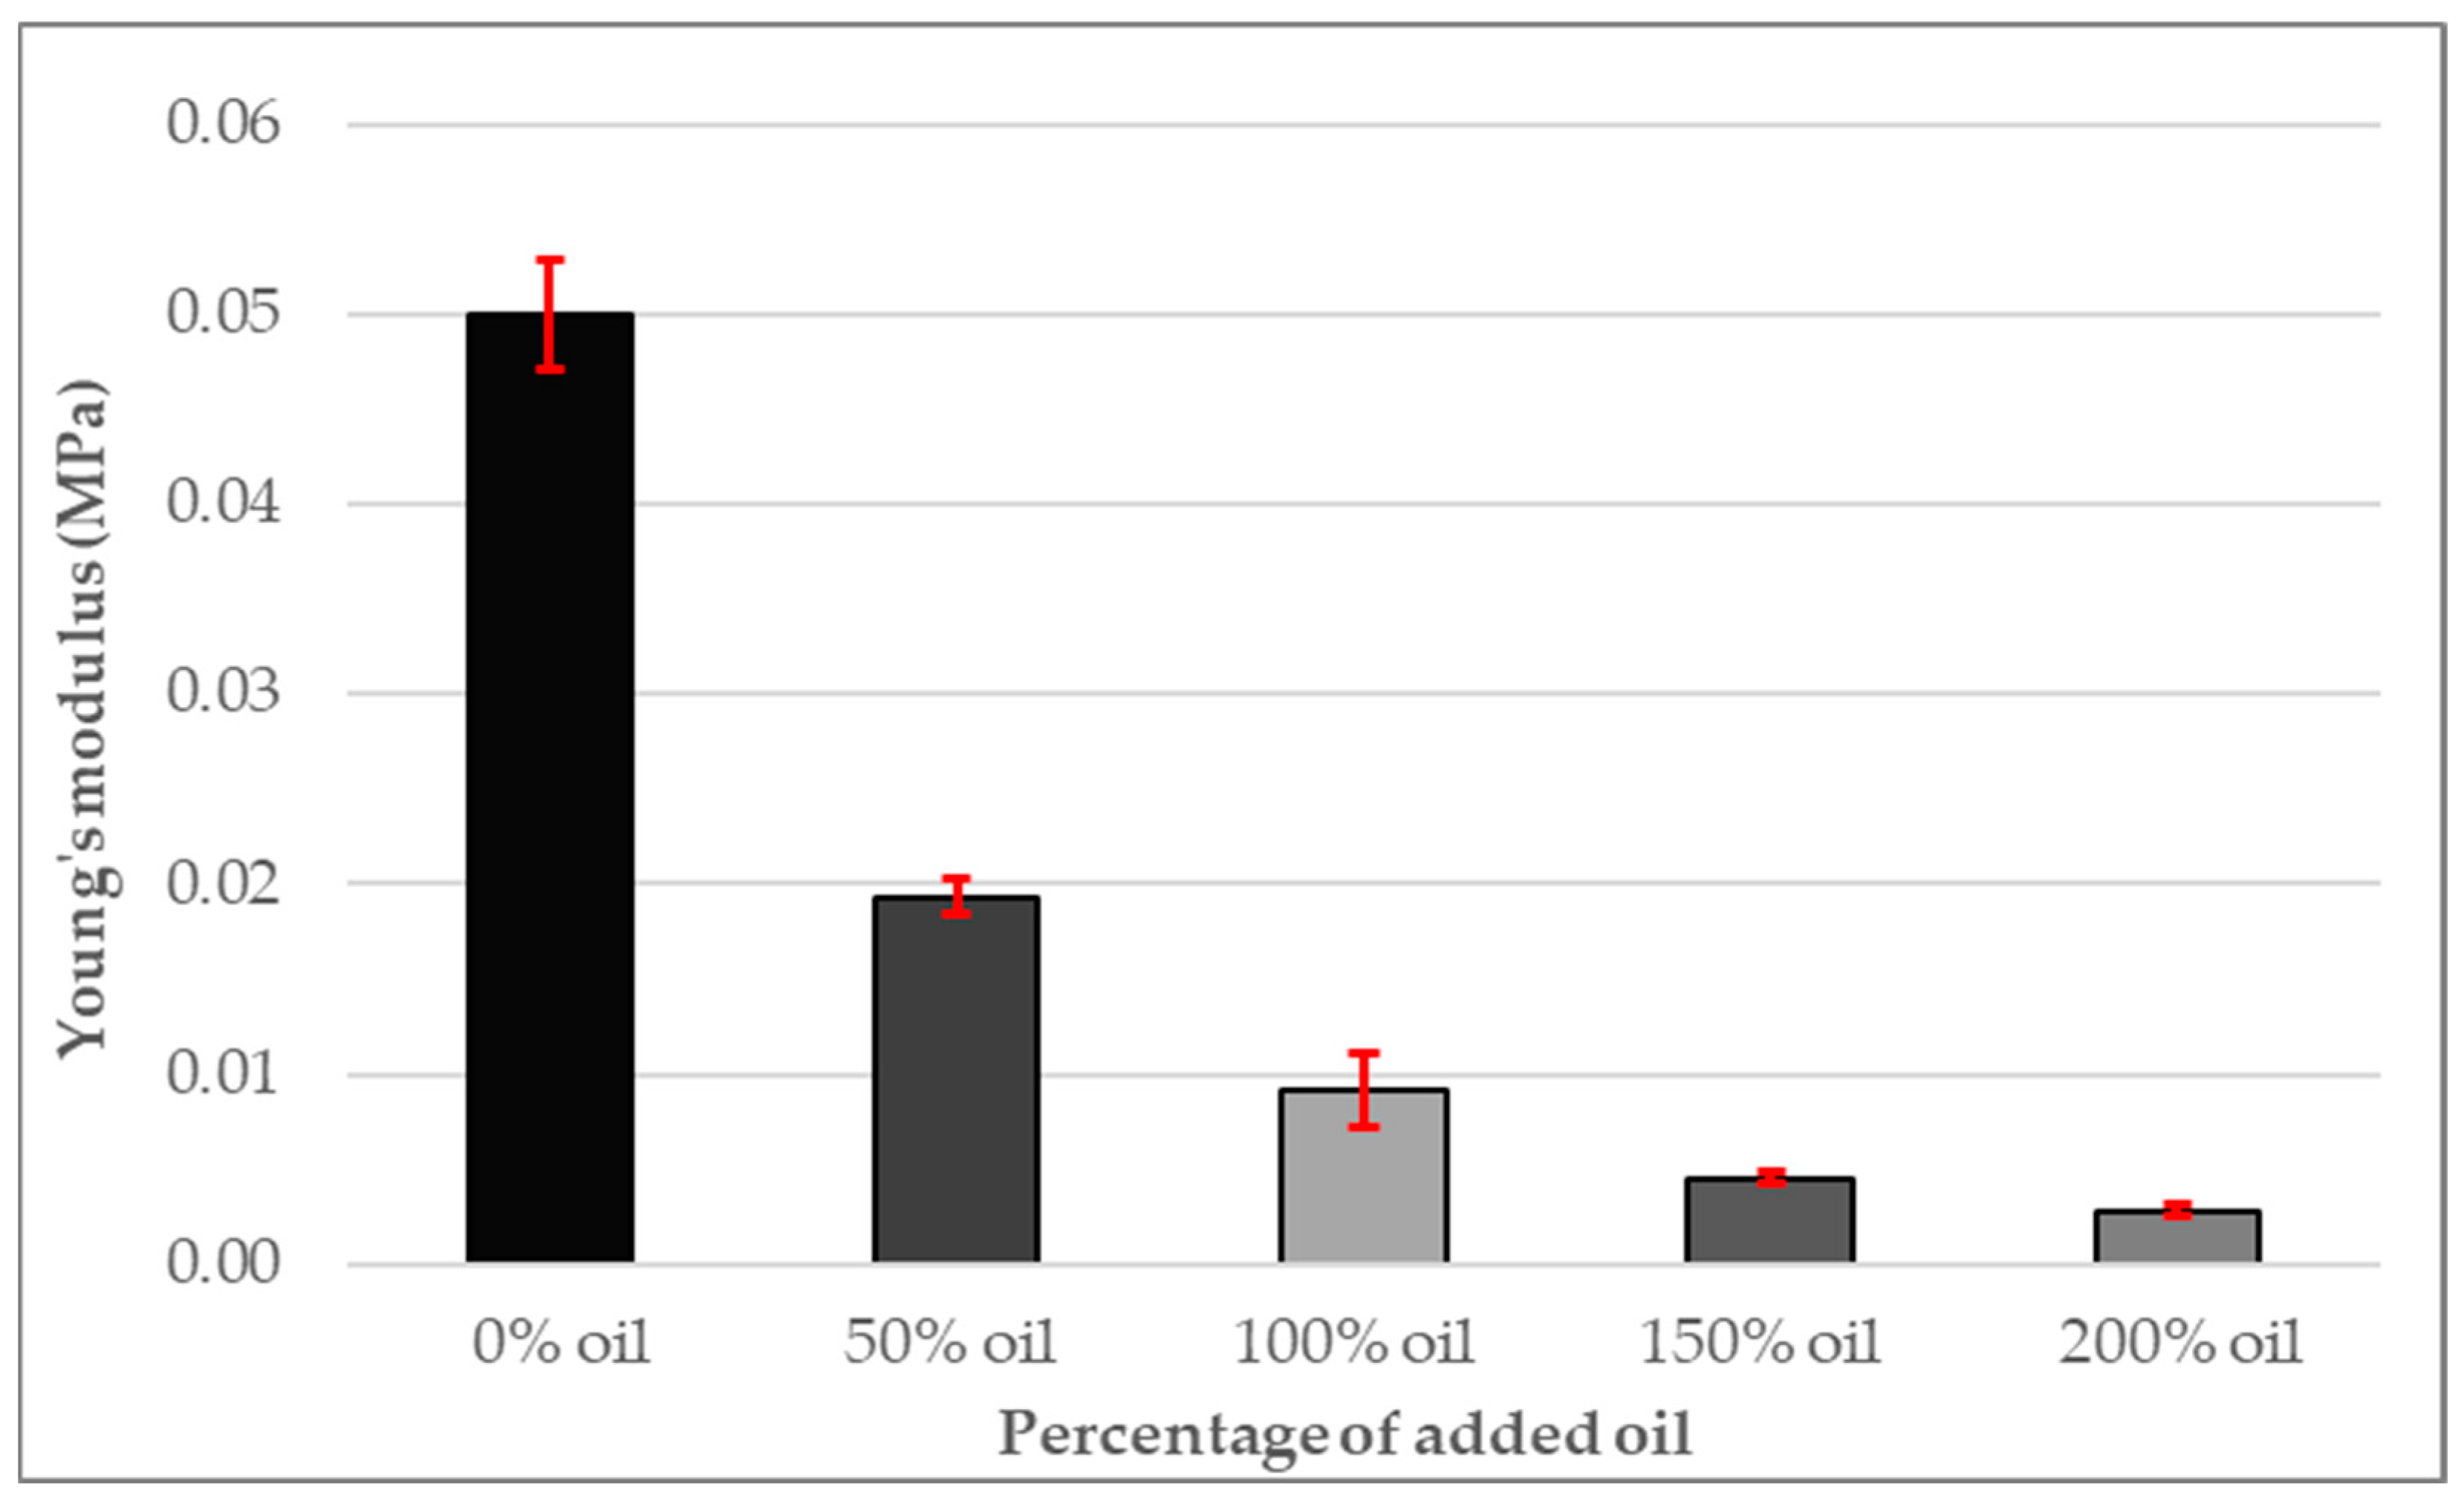
Figure 4 shows the Young’s moduli (in MPa) gathered from all specimen groups as the amount of oil was increased.
The elastic region of all specimens tested was under 1 N and under 100% extension. Evaluation of exponential relationship revealed R2 = 0.9883, suggesting a strong relationship between the amount of oil added and changes observed in Young’s modulus. Equation (5) was used to calculate the R2 value.
y = 0.0432 e 1.43 x
With the addition of 50% oil, the elasticity of the PDMS fell by >60% to 0.019 MPa compared to the PDMS gel without oil. With the addition of 100% oil, elasticity decreased by >80% to 0.009 MPa when compared to the group with 50% oil. This trend of a decreasing elastic modulus continued throughout the test specimen groups as the amount of added oil was increased. At the maximum amount of added oil (200%), the modulus was just 0.002 MPa.

3.7. Uniaxial Characteristics of PDMS Gel Membranes with Dispersed Oil

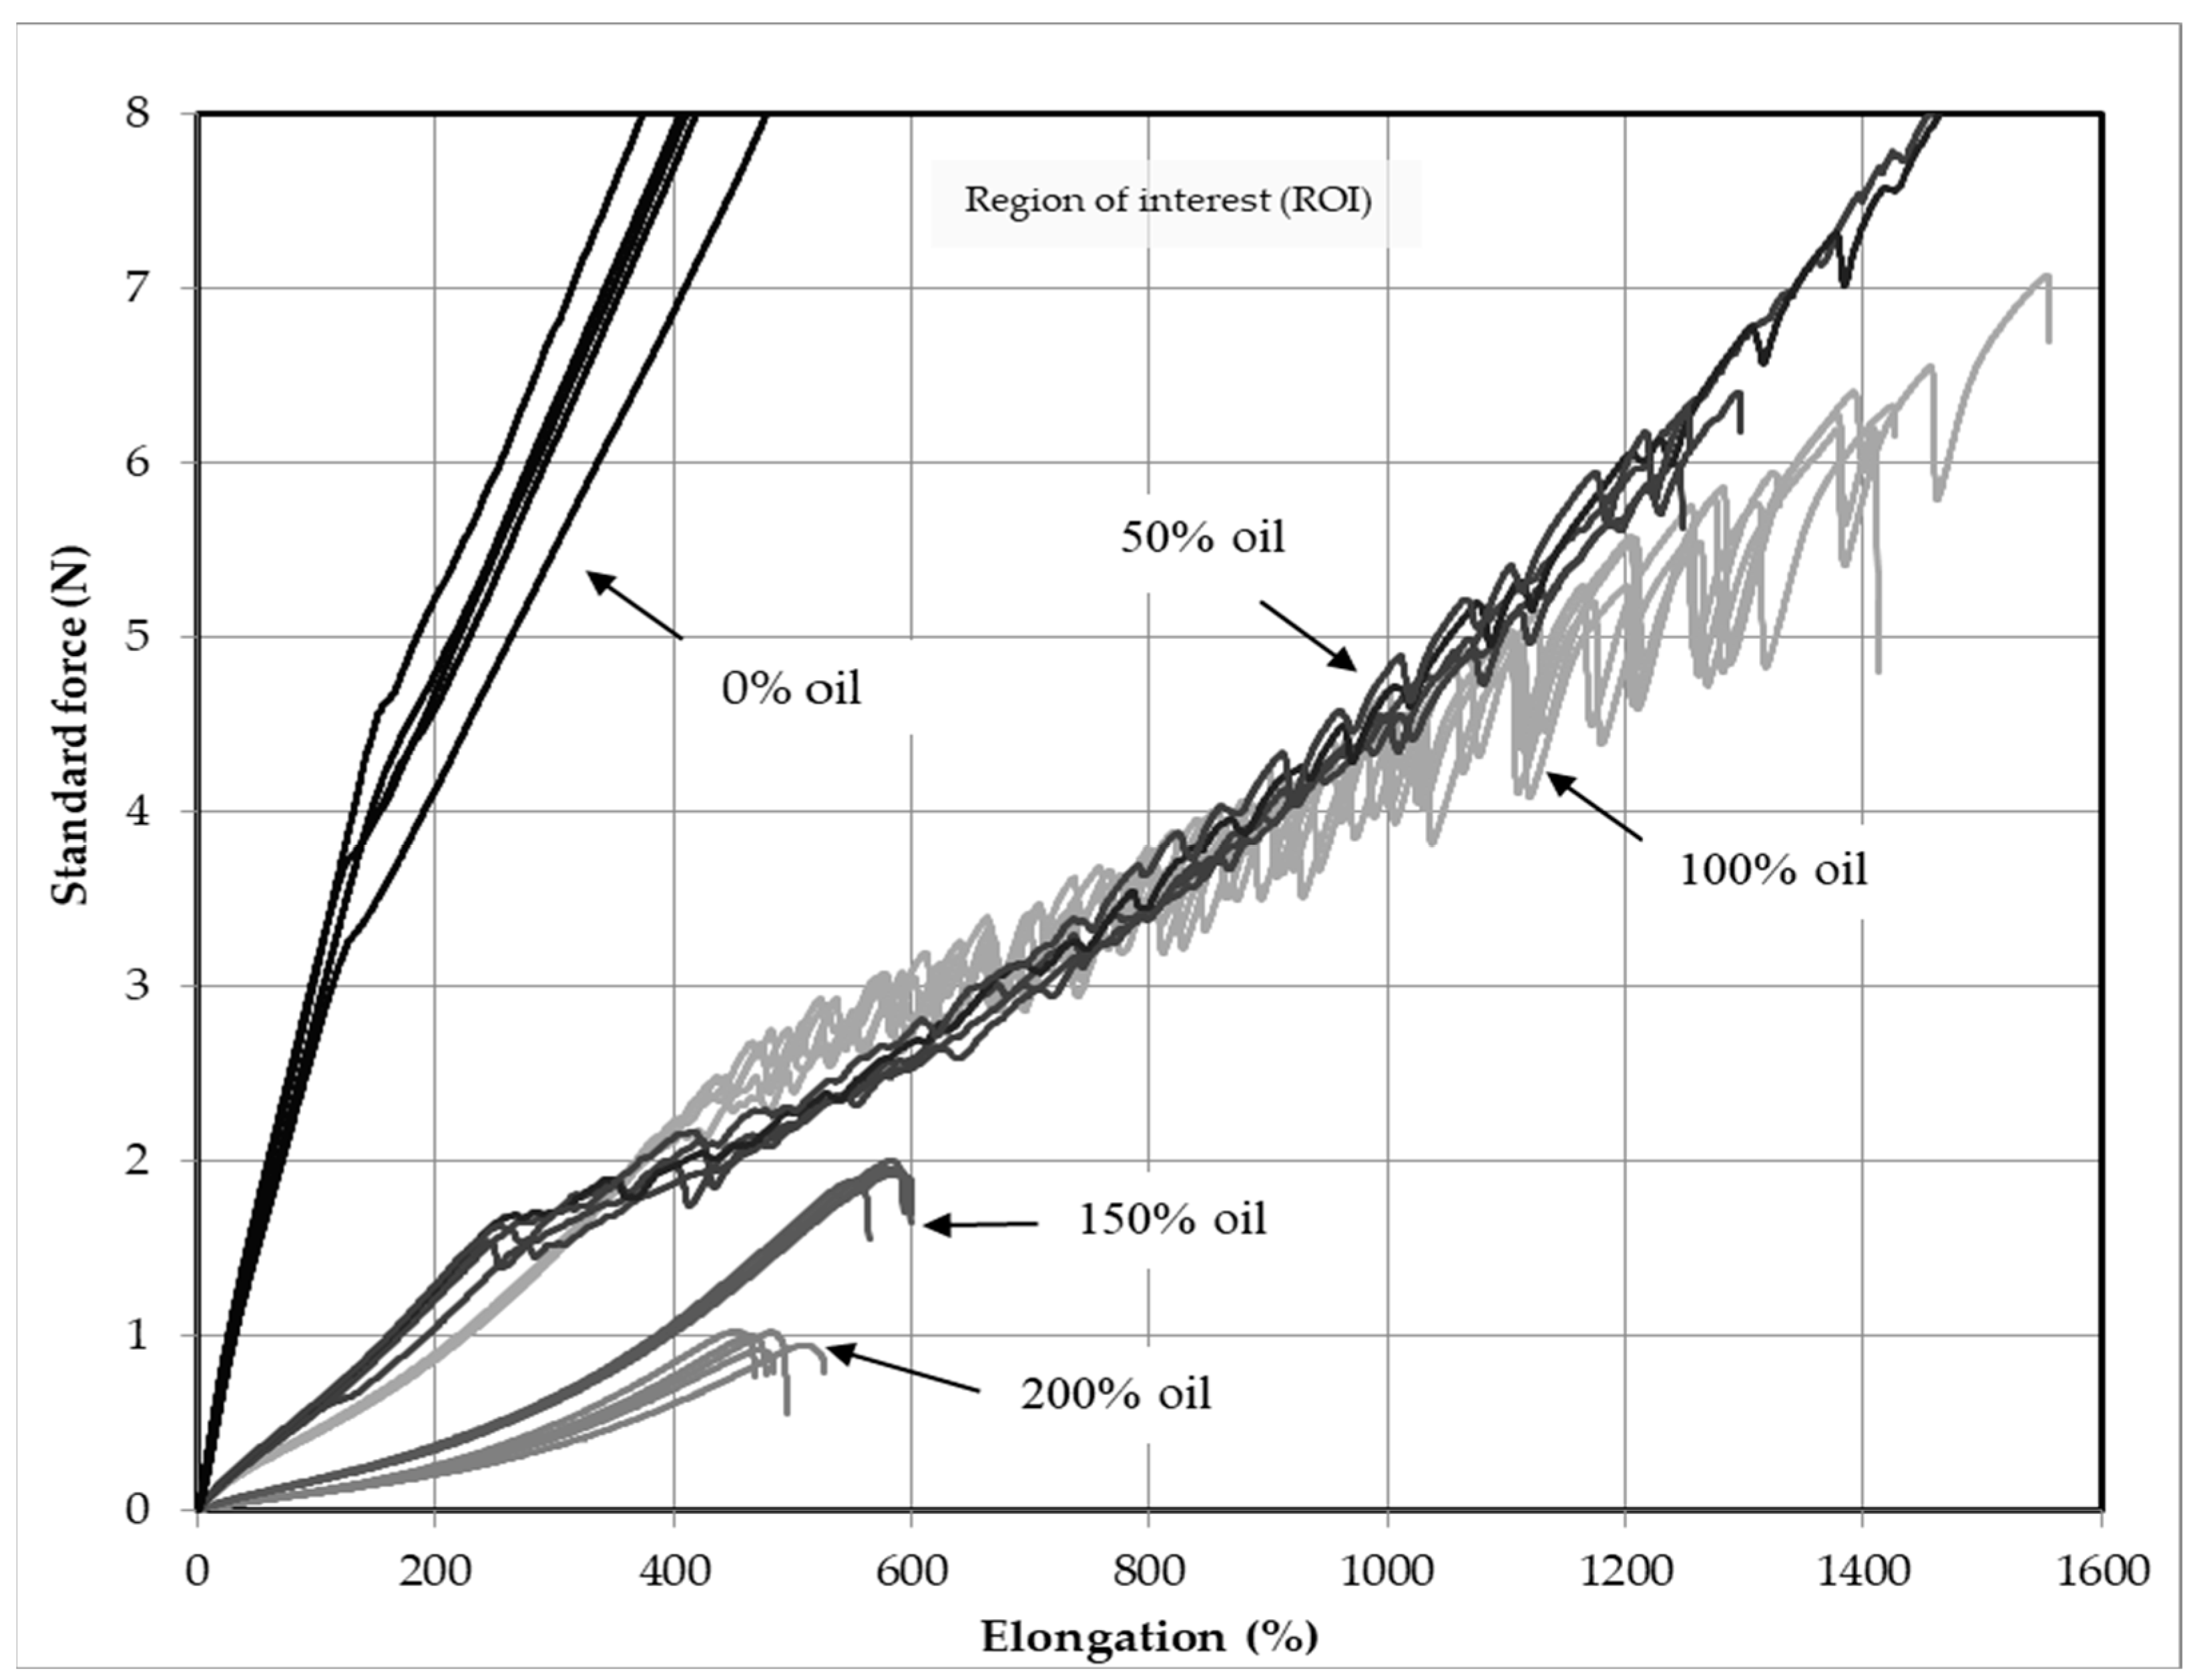
As shown in Figure 5, the characteristic behavior of all specimens during extension and demonstrates their response to stress and strain. The stress–strain curves are only shown up to 8 N as this is the maximum force exerted by clinicians in real-world soft tissue manipulation, and also because it reveals the lower values with better clarity. The chart also shows unusual, serrated stress-strain curves that were only observed in specimens with 50% and 100% added oil.
Each group is indicated with a different gray tone and has been labeled with its respective oil content. In this figure, each PDMS membrane group is shown to reveal the comparative changes in mechanical properties with and without added oil. Data from the specimens containing oil appear on this graph to have a linear Hookean vector at this scale. After a closer inspection of the stress–strain curve characteristics, it can be seen that all specimen groups exhibit a strain-hardening quality, with a relatively short linear elastic region followed by a gradually steepening vector.
The two groups containing the most added oil (150% and 200%) exhibited a decrease in overall extensibility of >1000% when compared to the three remaining groups with no oil and less oil added. The two groups with the most added oil also showed the lowest ultimate tensile strength (1 N), yield (1 N) and breaking point (500% Strain), all occurring in short succession. This suggests a very soft and weak gel with non-linear and non-time dependent characteristics.
In contrast, the PDMS without added oil was found to be highly elastic up to 100% elongation, with a long, non-linear, hardening trajectory up to around 1000% elongation. At high strains, between 1000% and 1800%, all specimens in the group with no added oil began to exhibit signs of permanent deformation. Specimens with the least amount of added oil (50–100%) exhibited an inclined serrated vector at higher strains during extension.
Although the elastic modulus was different for each specimen group, including the control group without added oil, the recoverable, linear, elastic region for all specimens was <200% extension. All test specimens entered a phase of plastic viscoelasticity beyond around 200% extension.

3.8. Multi-Axial Test Results of PDMS Gel Membranes with Dispersed Oil

Multi-axial data analysis has been presented using the standard adopted from elastic fabric test standard procedures (ISO 20932-2:2018) [39]. The influence of oil content on deformability and the time-dependent loss of elasticity was observed, and an exaggerated extensibility was immediately noticeable when handling the specimens. Hysteresis, force degradation, unrecovered deformation and force decay were all measured, but not all data have been presented here in the interest of conciseness, and only statistically significant results are presented in detail.

3.9. Hysteresis of PDMS Gel Membranes with Dispersed Oil

During preconditioning of the control specimen group (that was lacking added oil) only very small (<5%) changes were seen in the loading and unloading vectors, typical of pseudoelastic membrane behavior [51]. As the oil content increased, the elastic response gradually slowed, demonstrating increased viscoelastic strain softening at and above 100% oil saturation. A greater change during preconditioning was observed in all groups with added oil.

3.10. Force Degradation of PDMS Gel Membranes with Dispersed Oil

A force of 5 N was applied to each specimen, and the loss of energy was monitored and recorded. It was found that relaxation was still slightly decreased by the end of all tests in all groups, but not significantly. There appeared to be no clear relationship between the amount of added oil and the rate of energy loss in all specimens at the end of the 60 s holding period. However, the group with 150% oil content behaved slightly differently than the rest of the groups, exhibiting a greater energy loss than the other specimens during the first five seconds of the tests. Conversely, less energy was lost for the remainder of the 60 s test period compared to the other groups tested. All of the groups with added oil lost most of their stored energy within the first two to three seconds, proceeding to relax more slowly for the duration of the test, whereas, in contrast, the PDMS without oil had a much more gradual loss of energy over the 60 s test period. Although some differences were apparent in the graph, the loss of force is relatively small in all cases (<0.05 N) and, therefore, was not statistically significant.

3.11. Unrecovered Deformation of PDMS Gel Membranes with Dispersed Oil

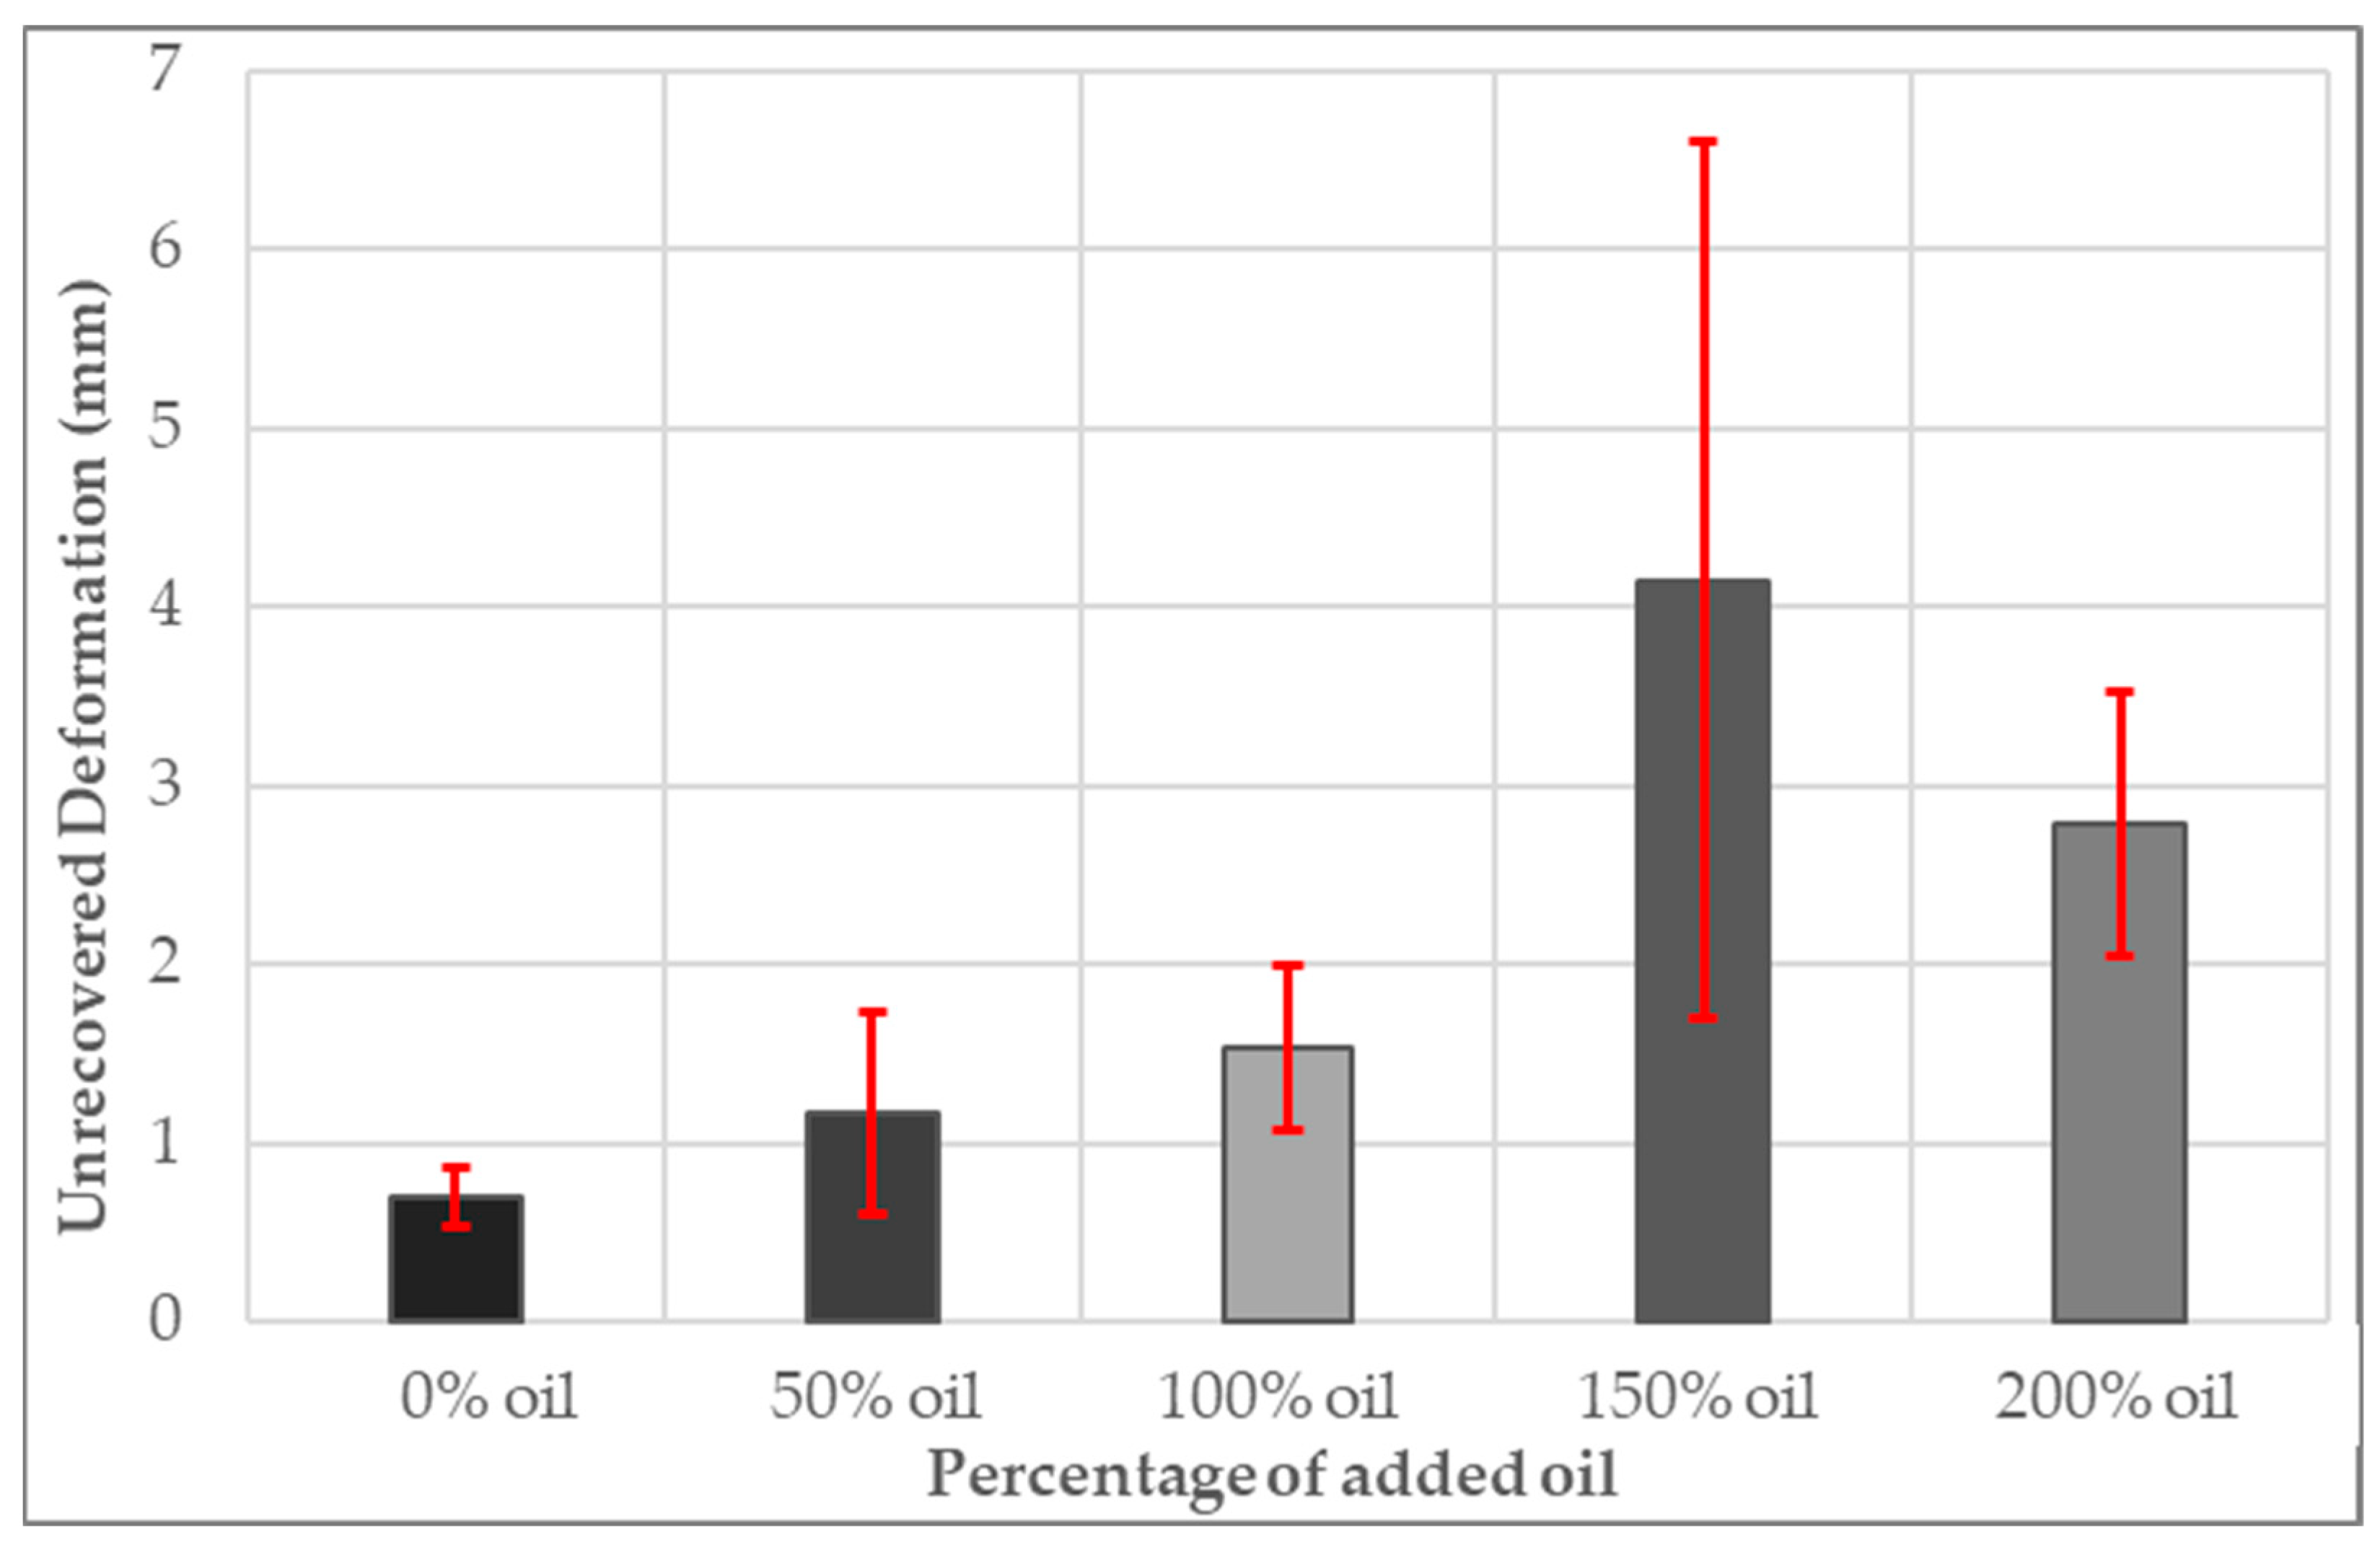
Unrecovered deformation or ‘bagging’ results record the rate of permanent change influenced by holding each specimen at 5 N for 60 s. An analysis of the unrecovered deformation data revealed that each group exhibited gradual incremental plasticity or permanent deformation, except for the group with 150% added oil, where the amount of permanent deformation was approximately twice what one might assume when compared to other specimen groups. This group also had a significant deviation of almost 5 mm between specimens. The results demonstrate the material’s permanent deformation rate increased as more oil was added. Figure 6 helps illustrate the disproportionate increase in permanent deformation at 150% oil content compared to the other groups tested. Considering the greater variation in the results shown, the group with 150% added oil still lies within the expected trend trajectory albeit at the lower end of predicted values. Because of the large error in the group with 150% oil, the calculated R2 value, 0.654, indicates a poor linear correlation between the amount of oil and membrane recoverability (Equation (6)). With the group containing 150% oil removed from the data set, the predictive model is significantly improved at R2 = 0.9881.
y = 0.7137x − 0.0771

3.12. Summary of Mechanical Changes in Oily PDMS Membranes

A summary of all the statistically significant mechanical changes that occurred in all PDMS specimens is summarized in Table 2.

4. Discussion

Despite their widespread use, porcine soft tissue membranes, like skin, can be harder and less elastic than equivalent human soft tissue membranes [2,6,7,8,10,41,47,49,52,53,54]. The main differences between human skin and porcine skin are cited to be thickness, structure, density and surface topography. [2,6,7,8,10,41,47,49,52,53,54] In recognition of these differences, the characterization of porcine fat has been used sparingly during this study, serving only as a benchmark for comparison in the hardness tests (the only recognized standardized test method for soft elastomers and soft tissues).
Additionally, an in-depth analysis of animal or human tissue was beyond the scope of this investigation, although it is envisioned that the data provided here will aid such comparative studies in the future.
All the data, and images of mechanical test assemblies for this investigation can be found at Supplementary Materials: https://zenodo.org/records/14179120.

4.1. Hardness Characteristics

Porcine adipose tissue test results were given here to provide baseline data (at the same scale) to aid in the comparison with synthetic mediums. During hardness tests, the 00 calibrated durometer was unable to measure the softest two groups of the five groups created for this investigation (150% and 200% added oil) because it was beyond the lower test limit of the device: Therefore, a 000 hardness calibrated durometer (H 000) was used. The 00 hardness results have still been included to broaden our study’s comparability with other studies that may have used the 00 calibrated durometer [2,11,12,13,14,15,16,17,18,19,20].
The results showed that the average hardness of warmed porcine adipose tissue was 31 H 000, equivalent to PDMS gel with 100% added oil, whereas the hardness of PDMS gel without oil was equivalent to 55 H 000, which was noticeably harder.
As the results of the tests conducted on porcine SAT during this study were found to be around 30 H 000, it was reasonable to assume that, based on the literature that confirms human tissues to be softer than porcine tissue, any human equivalent should be lower than this value. It is proposed that the ideal surrogate human SAT membrane should be between 15 and 30 H 000, when considering the work conducted in this study alongside the literature. To achieve these values, the ideal PDMS candidate would require between 100% and 200% of added oil (assuming a PDMS gel membrane with a 6 mm thickness and a native hardness of 10 Shore A was used).

4.2. Uniaxial Characteristics

The manufacturer of PDMS A10 (Platsil gel® 10, Polytek Development Corp’ ®) published data on the mechanical properties of their material, presumably taken from uniaxial tests; however, no standards were mentioned in the manufacturer’s literature (www.polytek.com (accessed on 20 September 2023)), nor were the test protocols specified. To quantify the mechanical impact of the addition of oil, it was necessary to first characterize a control group with both uniaxial and multi-axial standards. The results using Platsil gel® 10 showed that using the standard extensibility was far more significant than previously reported by the manufacturer, who reported an extensibility of 970% (strain percentage). When tested as per the standard, extensibility was actually 1634% strain percentage, with an average of 41 N. Additionally, the ultimate tensile strength of the control group specified by the manufacturer was 1.57 MPa, but the results reported here, using the standard, found it to be significantly weaker, at 0.77 MPa, around half the reported strength.
Such considerable differences in the control group’s characteristics highlights the importance of using standardized test methods. As such, it does not present a problem for the analysis or transferability of the data here either, since the new control group values are reported and used comparatively in place of the given values in the manufacturer’s literature. This emphasizes the need for academic research to not rely solely on commercially available or manufacturer supplied data.
Young’s modulus has been the focus for many previous biomechanical investigators using uniaxial tests, but a Young’s modulus only reveals the Hookean characteristics of the mechanical profile in the elastic region. The Young’s modulus for human adipose tissue was previously found to be 0.011 ± 0.006 MPa [6,7,8]. Interestingly, this investigation has shown that PDMS membranes with 100% added oil to have a similar modulus of 0.009 ± 0.004 MPa.
Extension to failure helped to provide a more comprehensive mechanical profile, beyond the range of the Young’s modulus where, at higher strain, strain softening and strain hardening were observed. Testing beyond the Hookean region revealed several behavioral phenomena not previously reported in the literature for PDMS gels. The serrated stress–strain curves, shown in Figure 5, are attributed to the Lüders effect, and related Portevin–Le Chatelier (PLC) effect and the Mullins effect, in particular. Interestingly, the PLC effect and Lüders effect are the manifestation of uneven strain distribution in the plastic flow region of the materials during extension. Typically, these phenomena only appear in the literature [55,56] when testing alloys like aluminum and steel [57,58] and have not been observed in soft elastomers prior to this investigation.
Serrations in the mechanical resistance to deformation may have an impact on other applications beyond prosthetics where oil-saturated silicones might be useful, such as soft robotics, where localized weaknesses might lead to premature membrane failure, or in sensitive strain sensor applications where a smooth response is needed to reliably monitor small changes in deformation.
This study is the first time both effects have been observed in soft elastomeric gels. The precise mechanism of the serration in loading vectors was likely initiated by strain percentage, softening at low strains (the Mullin’s effect), previously described as the ‘flow region’ of the material [59]. As seen clearly in Figure 5, the specimen group containing 50% oil exhibited a short Lüders plateau at around 300% strain, providing supporting evidence of the Lüders effect in action. In metals, this usually occurs before strain hardening, not afterwards, as was observed in the current investigation. Similar to ductile metal behavior, the flow region seen here, manifests when the specimens are deformed beyond the elastic limit and can no longer return to the original length, eventually resulting in each specimen’s rupture (failure) [55,56,57,58,59,60].
As shown in Figure 5, three clear oil-reliant behavioral groups emerged from uniaxial test results. The first group (without oil) had a high elastic modulus and a high extensibility, the second group (50–100% added oil) had a lower elastic modulus but an equally high extensibility and, finally, a third group (150–200% added oil) had low elastic modulus and a very low extensibility. All specimens with the least amount of added oil exhibited three very different behavioral zones. The first zone can be characterized by a low strain linear elasticity, the second zone by high strain viscoelastic strain softening and, finally, the third zone, by flow before failure. The specimen groups with the most added oil did not behave this way. Instead, they exhibited a long, low-strain, linear, elastic region followed by gradual viscoelastic strain hardening, where the atomic crystalline structure begins to fracture and reorganize, hardening in the process, prior to failure.

4.3. Multi-Axial Characteristics

During multi-axial testing, a gradual increase in viscoelasticity was noticed across all the groups, consistent with the increasing amount of oil. Groups with more oil were affected the most by preconditioning, evident in the intervals between the loading and unloading cycles. Figure 6 illustrates the clear relationship between the amount of added oil, the loss of elasticity and permanent deformation, important aspects of viscoelastic behavior.
Interestingly, it was noticed that specimens with 150% oil content behaved differently to the rest of the groups during all multi-axial tests, except when investigating hysteresis. In particular, the group with 150% oil exhibited a greater energy loss (relaxation) than the other specimens during the first five seconds. It could be argued that, on its own, this was not significant (0.05 N).
Further, all specimens with 150% oil behaved differently than expected when compared to the other samples, and significant plastic deformation (bagging) was almost double the amount seen in other specimens, even when compared to the group with the most added oil. The results from the group with 150% added oil were so different from all other specimens that it disrupted the predictive model for unrecovered deformation, instead giving a poor correlation between oil content and bagging amount (R2 value = 0.654). It is unclear why this occurred, as all specimens in the study were produced and stored together. More importantly, the analysis of cyclic hysteresis showed the group conforming to the expected softening pattern due to incremental oil addition, as seen in other tests, such as the uniaxial and hardness characterizations. It is not understood why this particular group behaved more like a plastic than a viscoelastic solid, and this phenomenon has been identified as a candidate for future investigations.

5. Conclusions

This work aimed to investigate the effect of oil dispersion in PDMS gel for use as a surrogate fatty tissue of the hypodermis. This study has identified several, previously unknown, quantitative, behavioral changes relating to oil saturation of PDMS gel that will be particularly useful to prosthetists due to predictive changes in cure time, hardness, modulus and extensibility. These tunable characteristics, demonstrated by this work, are particularly useful for clinical and theatrical prosthetics appliance designers, as previously discussed. The dearth of mechanical data on human fat in the literature made direct comparison difficult, so limited data were gathered on a porcine equivalent to demonstrate transferability and provide a benchmark for surrogate material behavior. Utilization of popular commercially available materials, that are well known in clinical practice and the arts, have been examined in this study, making the results especially useful to multidisciplinary researchers and fabricators of clinical and theatrical prosthetics. The use of test standards throughout this study expedited the development of a robust test regime that exploits a variety of accessible test methods and machines, inviting other investigators to add their own transferable data, observations and analysis to this work. This investigation provides a solid scientific foundation for all future developments of both physical (artificial) and constitutive models of very soft tissues like adipose tissues.

Summary

  • Significant differences were observed in all tests when comparing specimens with and without oil, except in force decay and force degradation experiments.
  • A strong correlation was found between increasing oil content and decreasing hardness, UTS and elastic modulus.
  • A strong correlation was found between increasing oil content and increasing extensibility and cure time.
  • A weak relationship was found between increasing oil content relaxation and elastic recoverability.
  • Evidence of the Lüders and PLC effects were observed, for the very first time, in soft gel membranes with 50% and 100% added oil.
  • PDMS gel (Shore A-10) membranes with 100% added oil were best at mimicking subcutaneous adipose tissue. They exhibited the same hardness observed in identical tests on warmed porcine fat and the Young’s modulus of human fat given in the literature.
Future work should focus on further investigating the behavior of PDMS gel with 100% added oil because this group showed the most unusual mechanical behavior as well as being most similar to human fat and warmed porcine fat. Digital image correlation and finite element analysis of human fat measured alongside these materials would further enrich the findings presented here.
Finally, this work empowers prosthetists to create more scientifically accurate soft tissue models with tunable and predictable mechanical properties, advancing our understanding of PDMS gels and their acute diversity.

Supplementary Materials

The following supporting information can be downloaded at: https://zenodo.org/records/14179120 (https://doi.org/10.5281/zenodo.14179120).

Author Contributions

Conceptualization, R.A., A.S. and T.H.-R.; methodology, R.A., A.S. and T.H.-R.; software, R.A., A.S. and K.M.; validation, R.A., A.S. and R.B.; formal analysis, R.A. and A.S.; investigation, R.A. and A.S.; writing—original draft preparation, R.A.; writing—review and editing, R.A., A.S., K.M., A.P., T.H.-R. and R.B.; visualization, R.A., K.M. and T.H.-R.; supervision, A.S. and T.H.-R.; project administration, R.A., A.S. and T.H.-R. All authors have read and agreed to the published version of the manuscript.

Funding

This research was funded by Nottingham School of Art and Design, Nottingham Trent University, Nottingham, UK.

Institutional Review Board Statement

Not applicable.

Data Availability Statement

All data are available at: https://doi.org/10.5281/zenodo.13619963.

Acknowledgments

The authors wish to thank the Nottingham School of Art and Design for providing the facilities and resources to conduct this research.

Conflicts of Interest

The authors declare no conflicts of interest.

References

  1. Lanzara, R.; Viswambaran, M.; Kumar, D. Maxillofacial prosthetic materials: Current status and recent advances: A comprehensive review. Int. J. Appl. Dent. Sci. 2021, 7, 255–259. [Google Scholar] [CrossRef]
  2. Arm, R.; Shahidi, A.; Clarke, C.; Alabraba, E. Synthesis and characterisation of a cancerous liver for presurgical planning and training applications. BMJ Open Gastroenterol. 2022, 9, e000909. [Google Scholar] [CrossRef] [PubMed]
  3. Debreceni, T. Special Makeup Effects for Stage and Screen: Making and Applying Prosthetics.; Routledge: London, UK; Focal Press: Oxen, UK, 2013; pp. 14–17. [Google Scholar]
  4. Agache, P.G.; Monneur, C.; Leveque, J.L.; De Rigal, J. Mechanical properties and Young’s modulus of human skin in vivo. Arch. Dermatol. Res. 1980, 269, 221–232. [Google Scholar] [CrossRef] [PubMed]
  5. Gordon, J. A System of Human Anatomy; Blackwood and Anderson: London, UK, 1815; Volume 1, pp. 223–225. [Google Scholar]
  6. Comley, K.; Fleck, N. The compressive response of porcine adipose tissue from low to high strain rate. Int. J. Impact Eng. 2012, 46, 1–10. [Google Scholar] [CrossRef]
  7. Comley, K.; Fleck, N.A. A micromechanical model for the Young’s modulus of adipose tissue. Int. J. Solids Struct. 2010, 47, 2982–2990. [Google Scholar] [CrossRef]
  8. Comley, K.; Fleck, N.A. The toughness of adipose tissue: Measurements and physical basis. J. Biomech. 2010, 43, 1823–1826. [Google Scholar] [CrossRef]
  9. Fung, Y.-C. Biomechanics: Mechanical Properties of Living Tissues, 2nd ed.; Behaviour of Soft Tissues Under Uniaxial Loading; Springer Science & Business Media: New York, NY, USA, 2013; Volume 7, pp. 269–271. [Google Scholar]
  10. Kerdok, A.E.; Ottensmeyer, M.P.; Howe, R.D. Effects of perfusion on the viscoelastic characteristics of liver. J. Biomech. 2006, 39, 2221–2231. [Google Scholar] [CrossRef]
  11. Falanga, V.; Bucalo, B. Use of a durometer to assess skin hardness. J. Am. Acad. Dermatol. 1993, 29, 47–51. [Google Scholar] [CrossRef]
  12. Yoon, Y.C.; Lee, J.S.; Park, S.U.; Kwon, J.H.; Hong, T.H.; Kim, D.G. Quantitative assessment of liver fibrosis using shore durometer. Ann. Surg. Treat. Res. 2017, 93, 300–304. [Google Scholar] [CrossRef]
  13. Chatzistergos, P.E.; Allan, D.; Chockalingam, N.; Naemi, R. Shore hardness is a more representative measurement of bulk tissue biomechanics than of skin biomechanics. Med. Eng. Phys. 2022, 105, 103816. [Google Scholar] [CrossRef]
  14. Kissin, E.Y.; Schiller, A.M.; Gelbard, R.B.; Anderson, J.J.; Falanga, V.; Simms, R.W.; Korn, J.H.; Merkel, P.A. Durometry for the assessment of skin disease in systemic sclerosis. Arthritis Care Res. Off. J. Am. Coll. Rheumatol. 2006, 55, 603–609. [Google Scholar] [CrossRef] [PubMed]
  15. Romanelli, M.; Falanga, V. Use of a durometer to measure the degree of skin induration in lipodermatosclerosis. J. Am. Acad. Dermatol. 1995, 32, 188–191. [Google Scholar] [CrossRef] [PubMed]
  16. Piaggesi, A.; Romanelli, M.; Schipani, E.; Campi, F.; Magliaro, A.; Baccetti, F.; Navalesi, R. Hardness of plantar skin in diabetic neuropathic feet. J. Diabetes Its Complicat. 1999, 13, 129–134. [Google Scholar] [CrossRef] [PubMed]
  17. Strzalkowski, N.D.J.; Triano, J.J.; Lam, C.K.; Templeton, C.A.; Bent, L.R. Thresholds of skin sensitivity are partially influenced by mechanical properties of the skin on the foot sole. Physiol. Rep. 2015, 3, e12425. [Google Scholar] [CrossRef] [PubMed]
  18. Aghassi, D.; Monoson, T.; Braverman, I. Reproducible measurements to quantify cutaneous involvement in scleroderma. Arch. Dermatol. 1995, 131, 1160–1166. [Google Scholar] [CrossRef]
  19. Periyasamy, R.; Sneh, A.; Ammini, A. The effect of aging on the hardness of foot sole skin: A preliminary study. Foot 2012, 22, 95–99. [Google Scholar] [CrossRef]
  20. Reisfeld, P.L. A hard subject: Use of a durometer to assess skin hardness. J. Am. Acad. Dermatol. 1994, 31 Pt 1, 515. [Google Scholar] [CrossRef]
  21. Tong, J.; Lim, C.S.; Goh, O.L. Technique to study the biomechanical properties of the human calcaneal heel pad. Foot 2003, 13, 83–91. [Google Scholar] [CrossRef]
  22. Chanda, A.; McClain, S. Mechanical modelling of healthy and diseased calcaneal fat pad surrogates. Biomimetics 2019, 4, 1. [Google Scholar] [CrossRef]
  23. Ahmadzadeh, S.M.H.; Hukins, D.W. Feasibility of using mixtures of silicone elastomers and silicone oils to model the mechanical behaviour of biological tissues. Proc. Inst. Mech. Eng. Part H J. Eng. Med. 2014, 228, 730–734. [Google Scholar] [CrossRef]
  24. Cai, Z. Drop Wetting and Sliding on Soft, Swollen Elastomers. Ph.D. Thesis, University of Kentucky, Lexington, KY, USA, 2022. Available online: https://uknowledge.uky.edu/cme_etds/148/ (accessed on 13 July 2023).
  25. Anon. Tissue-Mimicking Phantoms. OBEL (Optical And Biomedical Engineering Laboratory), School of Electrical, Electronic and Computer Engineering, The University of Western Australia, Australia. 2023. Available online: https://obel.ee.uwa.edu.au/research/techniques/tissue-mimicking-phantoms/ (accessed on 14 December 2023).
  26. Oldenburg, A.L.; Toublan, F.J.J.; Suslick, K.S.; Wei, A.; Boppart, S.A. Magnetomotive contrast for in vivo optical coherence tomography. Opt. Express 2005, 13, 6597–6614. [Google Scholar] [CrossRef] [PubMed]
  27. Liang, X.; Oldenburg, A.L.; Crecea, V.; Chaney, E.J.; Boppart, S.A. Optical micro-scale mapping of dynamic biomechanical tissue properties. Opt. Express 2008, 16, 11052–11065. [Google Scholar] [CrossRef]
  28. Moučka, R.; Sedlačík, M.; Osička, J.; Pata, V. Mechanical properties of bulk Sylgard 184 and its extension with silicone oil. Sci. Rep. 2021, 11, 19090. [Google Scholar] [CrossRef] [PubMed]
  29. Davoodi, E.; Montazerian, H.; Khademhosseini, A.; Toyserkani, E. Sacrificial 3D printing of shrinkable silicone elastomers for enhanced feature resolution in flexible tissue scaffolds. Acta Biomater. 2020, 117, 261–272. [Google Scholar] [CrossRef]
  30. Ustbas, B.; Kilic, D.; Bozkurt, A.; Aribal, M.E.; Akbulut, O.; Ustbas, B.; Kilic, D.; Bozkurt, A.; Aribal, M.E.; Akbulut, O. Silicone-based composite materials simulate breast tissue to be used as ultrasonography training phantoms. Ultrasonics 2018, 88, 9–15. [Google Scholar] [CrossRef] [PubMed]
  31. Zhang, C.; Liu, L.; Zhang, Z.; Pal, K.; Kim, J.K. Effect of silica and silicone oil on the mechanical and thermal properties of silicone rubber. J. Macromol. Sci. Part B 2011, 50, 1144–1153. [Google Scholar] [CrossRef]
  32. Liu, Z.; Yeung, K. The preconditioning and stress relaxation of skin tissue. J. Biomed. Pharm. Eng. 2008, 2, 22–28. [Google Scholar]
  33. Wolf, K.J.; Weiss, J.D.; Uzel, S.G.; Skylar-Scott, M.A.; Lewis, J.A. Biomanufacturing human tissues via organ building blocks. Cell Stem Cell 2022, 29, 667–677. [Google Scholar] [CrossRef]
  34. Maclean, C.; Brodie, R.; Nash, D.H. Shore OO Hardness Measurement of Bovine Aorta and Mock Vessel Materials for Endovascular Device Design. 2019. Available online: https://www.bssm.org/media/z11jr0sq/88_craig_maclean_formatted.pdf (accessed on 2 March 2023).
  35. ASTM D2240-15(2021); Standard Test Method for Rubber Property—Durometer Hardness. ASTM International: West Conshohocken, PA, USA, 2021. Available online: https://www.astm.org/d2240-15r21.html (accessed on 5 May 2023).
  36. ISO 37:2024; Rubber, Vulcanized or Thermoplastic—Determination of Tensile Stress-Strain Properties. ISO: Geneva, Switzerland, 2024. Available online: https://www.iso.org/standard/86892.html (accessed on 14 April 2023).
  37. ASTM D412-16(2021); Standard Test Methods for Vulcanized Rubber and Thermoplastic Elastomers—Tension. ASTM International: West Conshohocken, PA, USA, 2021. Available online: https://www.astm.org/standards/d412 (accessed on 14 April 2023).
  38. ISO 5893:2019; Rubber and Plastics Test Equipment—Tensile, Flexural and Compression Types (Constant Rate of Traverse)—Specification. ISO: Geneva, Switzerland, 2019. Available online: https://www.iso.org/standard/77424.html (accessed on 15 April 2023).
  39. ISO 20932-2:2018; Textiles—Determination of the Elasticity of Fabrics Part 2: Multiaxial Tests. ISO: Geneva, Switzerland, 2018. Available online: https://www.iso.org/standard/69490.html (accessed on 9 October 2023).
  40. ISO 23529:2016; Rubber—General Procedures for Preparing and Conditioning Test Pieces for Physical Test Methods. ISO: Geneva, Switzerland, 2016. Available online: https://www.iso.org/standard/70323.html (accessed on 9 October 2023).
  41. Shergold, O.A.; Fleck, N.A.; Radford, D. The uniaxial stress versus strain response of pig skin and silicone rubber at low and high strain rates. Int. J. Impact Eng. 2006, 32, 1384–1402. [Google Scholar] [CrossRef]
  42. Bergström, J.S.; Boyce, M.C. Constitutive modelling of the large strain time-dependent behaviour of elastomers. J. Mech. Phys. Solids 1998, 46, 931–954. [Google Scholar] [CrossRef]
  43. Annaidh, A.N.; Bruyère, K.; Destrade, M.; Gilchrist, M.D.; Otténio, M. Characterization of the anisotropic mechanical properties of excised human skin. J. Mech. Behav. Biomed. Mater. 2012, 5, 139–148. [Google Scholar] [CrossRef]
  44. Jacquemoud, C.; Bruyere-Garnier, K.; Coret, M. Methodology to determine failure characteristics of planar soft tissues using a dynamic tensile test. J. Biomech. 2007, 40, 468–475. [Google Scholar] [CrossRef] [PubMed]
  45. Ziraki, S.; Zebarjad, S.M.; Hadianfard, M.J. A study on the tensile properties of silicone rubber/polypropylene fibres/silica hybrid nanocomposites. J. Mech. Behav. Biomed. Mater. 2016, 57, 289–296. [Google Scholar] [CrossRef] [PubMed]
  46. Haider, Y.M.; Abdullah, Z.S.; Jani, G.H.; Mokhtar, N. Evaluation of some mechanical properties of a maxillofacial silicon elastomer reinforced with polyester powder. Int. J. Dent. 2019, 2019, 2948457. [Google Scholar] [CrossRef]
  47. Arm, R.; Shahidi, A.; Dias, T. Mechanical behaviour of silicone membranes saturated with short strand, loose polyester fibres for prosthetic and rehabilitative surrogate skin applications. Materials 2019, 12, 3647. [Google Scholar] [CrossRef] [PubMed]
  48. Madhani, A.J.; Niemeyer, G.; Salisbury, J.K. The black falcon: A teleoperated surgical instrument for minimally invasive surgery. In Proceedings of the 1998 IEEE/RSJ International Conference on Intelligent Robots and Systems. Innovations in Theory, Practice and Applications (Cat. No. 98ch36190), Victoria, BC, Canada, 17 October 1998; IEEE: Piscataway, NJ, USA, 1998; Volume 2, pp. 936–944. [Google Scholar]
  49. Brown, J.D.; Rosen, J.; Kim, Y.S.; Chang, L.; Sinanan, M.N.; Hannaford, B. In-vivo and in-situ compressive properties of porcine abdominal soft tissues. In Medicine Meets Virtual Reality 11; IOS Press: Amsterdam, The Netherlands, 2003; pp. 26–32. [Google Scholar]
  50. Bello, M.; Welch, C.F.; Goodwin, L.A.; Keller, J. Sylgard® Mixing Study; No. LA-UR-14-26638; Los Alamos National Laboratory (LANL): Los Alamos, NM, USA, 2014. [Google Scholar]
  51. Humphrey, J.D. Mechanics of the arterial wall: Review and directions. Crit. Rev. Biomed. Eng. 1995, 23, 1–162. [Google Scholar] [CrossRef]
  52. Ramphal, P.S.; Coore, D.N.; Craven, M.P.; Forbes, N.F.; Newman, S.M.; Coye, A.A.; Little, S.G.; Silvera, B.C. A high-fidelity tissue-based cardiac surgical simulator. Eur. J. Cardio-Thorac. Surg. 2005, 27, 910–916. [Google Scholar] [CrossRef]
  53. Wei, J.C.; Cartmill, I.D.; Kendall, M.A.; Crichton, M.L. In vivo, in situ and ex vivo comparison of porcine skin for micro projection array penetration depth, delivery efficiency and elastic modulus assessment. J. Mech. Behav. Biomed. Mater. 2022, 130, 105187. [Google Scholar] [CrossRef]
  54. Trotta, A.; Annaidh, A.N. Mechanical characterisation of human and porcine scalp tissue at dynamic strain rates. J. Mech. Behav. Biomed. Mater. 2019, 100, 103381. [Google Scholar] [CrossRef]
  55. Portevin, A.; Le Chatelier, F. Le traitement thermique des alliages légers d’aluminium à base de cuivre. (“Heat treatment of copper-based light aluminium alloys”). Rev. Métallurgie 1924, 21, 233–246. [Google Scholar] [CrossRef]
  56. Lüders, W. Über die äusserung der elasticität an stahlartigen eisenstäben und stahlstäben, und über eine beim biegen solcher stäbe beobachtete molecularbewegung. (“About the expression of elasticity in steel-like iron rods and steel rods, and about a molecular movement observed when bending such rods”). Dinglers. Polytech. J. 1860, 5, 18–22. [Google Scholar]
  57. Abbadi, M.; Hähner, P.; Zeghloul, A. On the characteristics of Portevin–Le Chatelier bands in aluminium alloy 5182 under stress-controlled and strain-controlled tensile testing. Mater. Sci. Eng. A 2002, 337, 194–201. [Google Scholar] [CrossRef]
  58. Conrad, H. Effect of stress on the Lüders band velocity in low carbon steels. J. Mech. Phys. Solids 1963, 11, 437–440. [Google Scholar] [CrossRef]
  59. Ren, S.; Morgeneyer, T.; Mazière, M.; Forest, S.; Rousselier, G. Effect of Lüders and Portevin–Le Chatelier localization bands on plasticity and fracture of notched steel specimens studied by DIC and FE simulations. Int. J. Plast. 2021, 136, 102880. [Google Scholar] [CrossRef]
  60. Coër, J.; Manach, P.Y.; Laurent, H.; Oliveira, M.C.; Menezes, L.F. Piobert–Lüders plateau and Portevin–Le Chatelier effect in an Al–Mg alloy in simple shear. Mech. Res. Commun. 2013, 48, 1–7. [Google Scholar] [CrossRef]
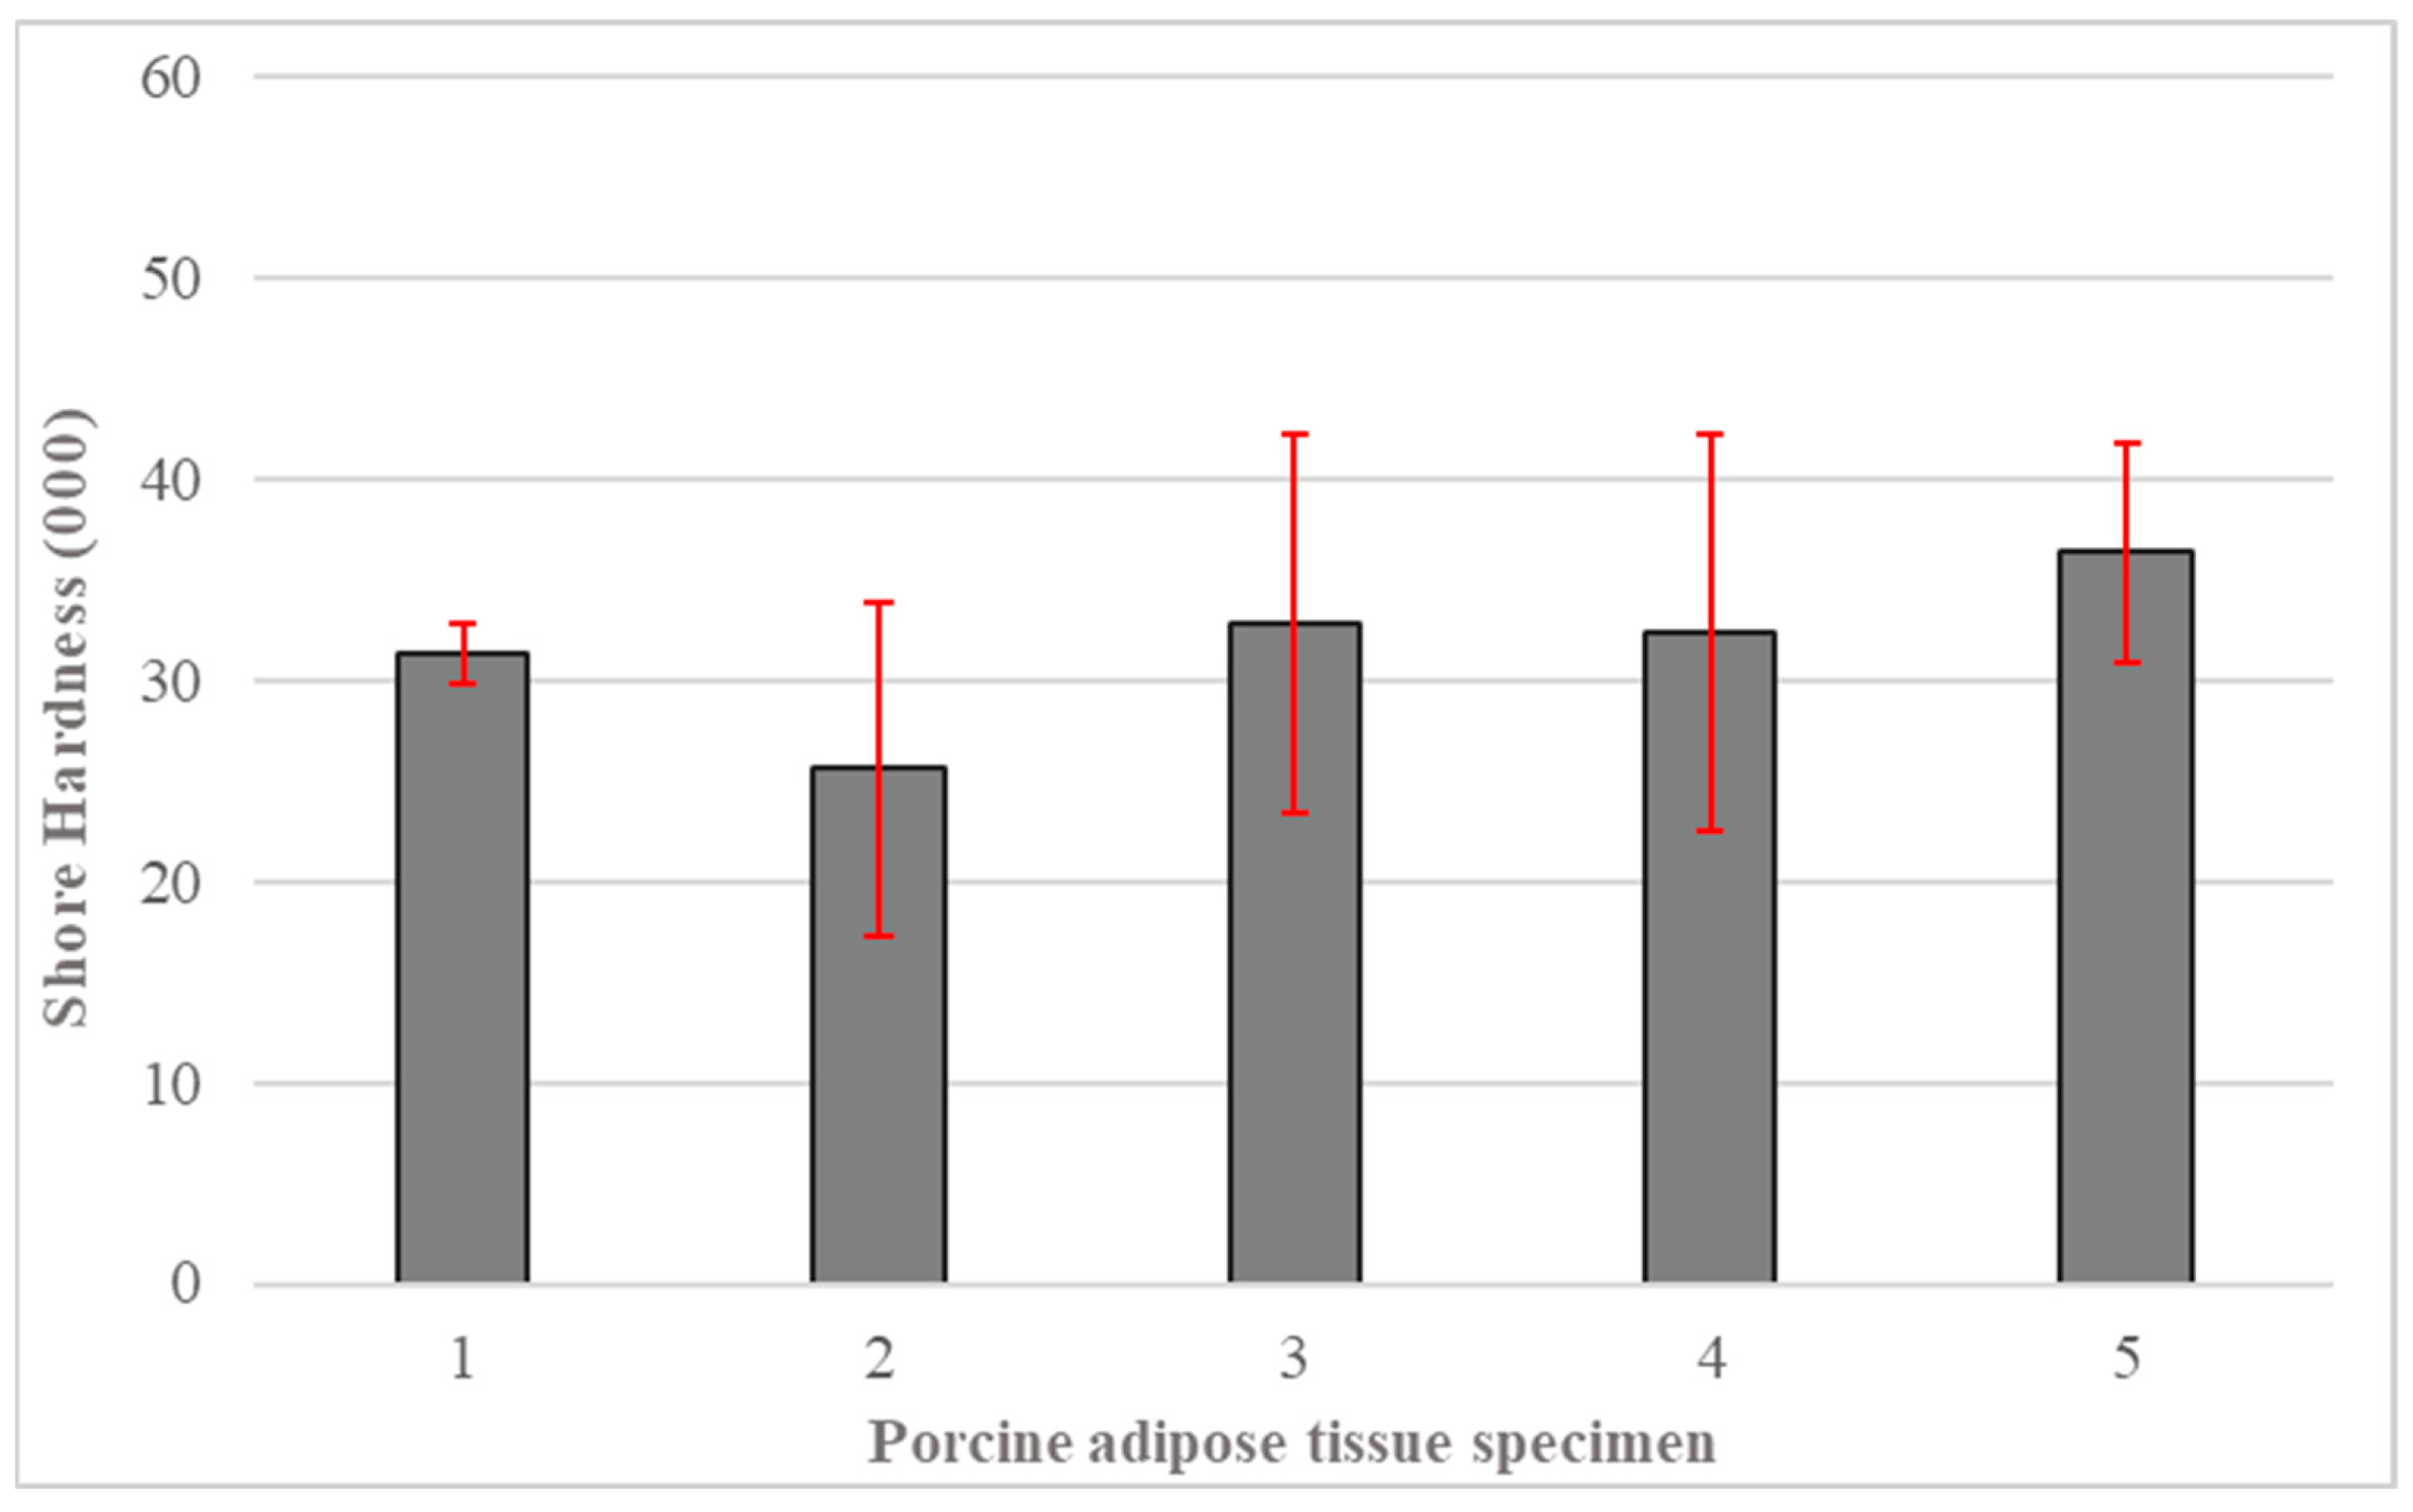
Figure 1. Shore hardness values (000): The hardness of five different specimens of porcine adipose fat taken from one individual’s abdomen. Each bar represents one region or group, measured with a Shore 000-calibrated durometer. Each bar represents the Shore hardness value for each group tested, while the error bars represent the standard deviation in each group.
Prosthesis 06 00097 g001
Figure 2. Shore hardness values (SH 00 and SH 000): This chart shows the influence of increasing oil content in comparison to average porcine SAT hardness. The cross-hatched bar on the right represents the mean hardness of porcine SAT shown in Figure 1, for easy comparison. All other bars represent the mean value of each group of PDMS and are shown in shore hardness values between 0 and 60. The dark colored bars show the H 000 Shore hardness, while the lighter colored bars show H 00 Shore hardness. Error bars shown for each group represent the standard deviation shown in red.
Prosthesis 06 00097 g002
Figure 3. Ultimate tensile strength: The influence of increasing oil content. Each bar represents the group’s average strength from 0% oil to 200% oil. Ultimate tensile strength tests show the effect of adding oil on the mechanical strength of PDMS. Error bars, shown in red, indicate the standard deviation.
Prosthesis 06 00097 g003
Figure 4. Young’s modulus: This chart shows the influence of increasing oil content. Each bar shows the Young’s modulus with increasing amounts of PDMS oil. Error bars are shown in red and indicate the standard deviation in each group. Each bar represents the arithmetic mean average observed in each group tested in uniaxial extension.
Prosthesis 06 00097 g004
Figure 5. Uniaxial extension to failure (force versus strain %): Region of interest up to 1600% elongation, showing the influence of increasing oil content on the stress-strain curves illustrating material behavior.
Prosthesis 06 00097 g005
Figure 6. The influence of increasing oil content: Multi axial compression test results of the unrecovered deformation (mm). Each bar represents the mean average of each group with varying amounts of added oil. Error bars, shown in red, indicate the standard deviation in each group.
Prosthesis 06 00097 g006
Table 1. List of all mechanical test standards used in the conduct of this investigation.
Name and Purpose of TestTest Assignment Code
Shore Hardness. Standard test method for rubber property. Durometer hardness [35].ASTM D2240-15 (2021)
Tensile stress-strain. Rubber, vulcanized or thermoplastic. Determination of tensile stress–strain properties [36].ISO 37:2024
Tensile stress-strain. Standard test methods for vulcanized rubber and thermoplastic elastomers. Tension [37].ASTM D412-16 (2021)
Apperatus configuration. Test equipment. Tensile, flexural and compression types (constant rate of traverse). Specification [38].ISO 5893:2019
Multi-axial compression. Determination of the elasticity of fabrics Part 2: Multiaxial tests [39].ISO 20932-2:2018
Material storage and preparation. General procedures for preparing and conditioning test pieces for physical test methods [40].ISO 23529:2016
Table 2. Summary of comparative changes in mechanical characteristics.
Amount of OilObserved Mechanical Characteristics
No added oilSoft, high elasticity, high extensibility, good recoverability, poor viscoelasticity.
50–100%
added oil
Moderately softer, lower elasticity, higher extensibility, moderate recoverability, PVC effect evident, moderate viscoelasticity.
150–200%
added oil
Very soft, lower elasticity, lower extensibility, low recoverability, higher viscoelasticity.
Disclaimer/Publisher’s Note: The statements, opinions and data contained in all publications are solely those of the individual author(s) and contributor(s) and not of MDPI and/or the editor(s). MDPI and/or the editor(s) disclaim responsibility for any injury to people or property resulting from any ideas, methods, instructions or products referred to in the content.