1. Introduction
Current advanced prosthetic knee technology uses kinematic detection with discrete state-based control to modulate gait activities [
1,
2]. However, unforeseen surfaces or obstacles are by nature chaotic and do not always exhibit a recognized kinematic warning. Consequently, amputees stumble and often fall, since the knee system does not react and offer support. Fear of falling affects approximately half of lower-limb amputees [
3]. Statistically, even though active knees show an improvement over passive knees in falling, almost all patients still fall [
4,
5], and more than 50% of lower-limb patients report falling at least once a year [
6]. Therefore, systems that can accurately detect stumbles are needed to inform knee control to prevent falls. Though future work may include external sensing for truly predictive results, this research focuses on a novel interpretation of prosthetic knee industry standard kinematic data.
Key defining gait characteristics have been well documented by the literature both in individuals with a healthy gait and those with pathological diagnoses, such as cerebral palsy or muscular dystrophy [
7,
8,
9,
10,
11]. Due to these distinctions, gait classification has grown in applied machine learning (ML), specifically in the differentiation between healthy and pathological gait [
12,
13,
14]. Likewise, gait activity, such as walking, running, and standing, has been documented by datasets such as HuGaDB and classified by ML algorithms with high success levels (Badawi et al.: accuracy: 98.6%; Keçeci et al.: accuracy: >99% with many networks) [
15,
16,
17].
Stumbles have been studied for many years with various levels of intensity. To date, there are eight stumble studies involving able-bodied subjects [
18,
19,
20,
21,
22,
23,
24,
25]. Though some numbers were difficult to ascertain from methods, the number of subjects in these studies ranged from 4 to 18 (avg: 8 ± 4), and each subject stumbled between 1 and 27 times (avg: 11 ± 9). The most common methods of stumble induction were an obstacle, a line, or a treadmill perturbation. For the most part, these were set at either a preprogrammed position or gait phase.
Among transfemoral amputees, there are more variables to consider, like knee type and stumble side (intact or prosthetic). Fewer stumble studies were found for transfemoral amputees, and the methodology was often not clearly delineated. Though there are some assumptions with the able-bodied subject trials, several of the amputee subject trials have stumbling time or summative stumbles. The studies had on average nine subjects (±6) but were often mixed between transfemoral and able-bodied subjects [
26,
27,
28,
29,
30,
31,
32,
33]. Outside of two studies, the average amount of stumbles was six (±4), and repeatability is further reduced by the stumbles being split across leg sides and types of knees. Those two studies, though both still with mixed subject pools (including transtibial), included a large quantity of induced stumbles [
32,
34], with the study by Shirota et al. having high levels of repeatability of 36 stumbles per amputee per side with only one knee tested. The study by Shawen et al. was much less repeatable, with stumble induction methods ranging from self-induced tripping to poorly defined pushes from the side, but still inducing stumbles 36 times per amputee. These two studies offer a large pool of stumble inductions but are both limited in variance of the controlled induction type and in scope of the knee systems compared repeatably.
Additionally, the literature shows several implementations of real-time gait event detections using sensors and many more gait activity classifications with potential for real-time applications [
35,
36,
37,
38,
39]. However, with the limitation of studies that measure stumble characteristics, especially constrained to patients with amputations, no studies have been found that attempt to classify stumbles in gait in real time. Even most gait activity studies are limited to postliminary processing. The work presented in this study seeks to fill that gap, both by beginning to provide the gait data pertaining to transfemoral amputees during stumble events and by presenting a first approach to classifying stumble and gait events using ML. The scope of the research is constrained to signals and parameters that can be measured and implemented into electromechanical prosthetic knee systems, such as the one developed by some of the authors [
40]. The goal is that early, real-time recognition of stumbles will lead to fall prevention by influencing prosthetic knee control systems.
1.1. Gait Data
Some of the most complete research conducted in gait analysis was by Sagawa et al., who reviewed the preferred biomechanical and physiological parameters that are most often used in determining gait characteristics. Though their results were inconclusive, the most common parameters pertaining to the knee joint were oxygen consumption, knee flexion angle, gait velocity, cadence, stride length, stance time, and maximum vertical ground reaction force [
41]. Though some of these parameters are not feasible to measure within a prosthetic knee system, the following sensors are commonly used to determine knee joint parameters: accelerometers [
21,
42,
43], gyroscopes [
42,
44], goniometers [
45,
46], magnetometers [
47], and linear sensors (i.e., hall pass or linear potentiometer). Therefore, this research centered on using an IMU that contains three axes as the foundational component to capture kinematic data: an accelerometer, a gyroscope, and a magnetometer.
1.2. Machine-Learning Networks
As stated previously, ML networks have been successful in classifying a variety of gait types and conditions and differentiating between gait activities. The types of networks used have varied between nearest neighbor, random forest, neural networks, and combinations of those and more. Fundamentally, the classifications of those networks have focused on gait mode classification (walking, running, etc.). Though the input data are time-dependent, gait mode classification is not considered a forecasting task in itself.
However, real-time prediction, as presented in the current research, does involve forecasting and gait classification due to the machine’s requirement to use a continuous time-dependent data stream to predict gait mode. To do this, forecasting on a time series requires different configurations or types of ML networks that retain information from previous predictions known as recurrent neural networks (RNN). A popular RNN is Long Short-Term Memory (LSTM) [
48].
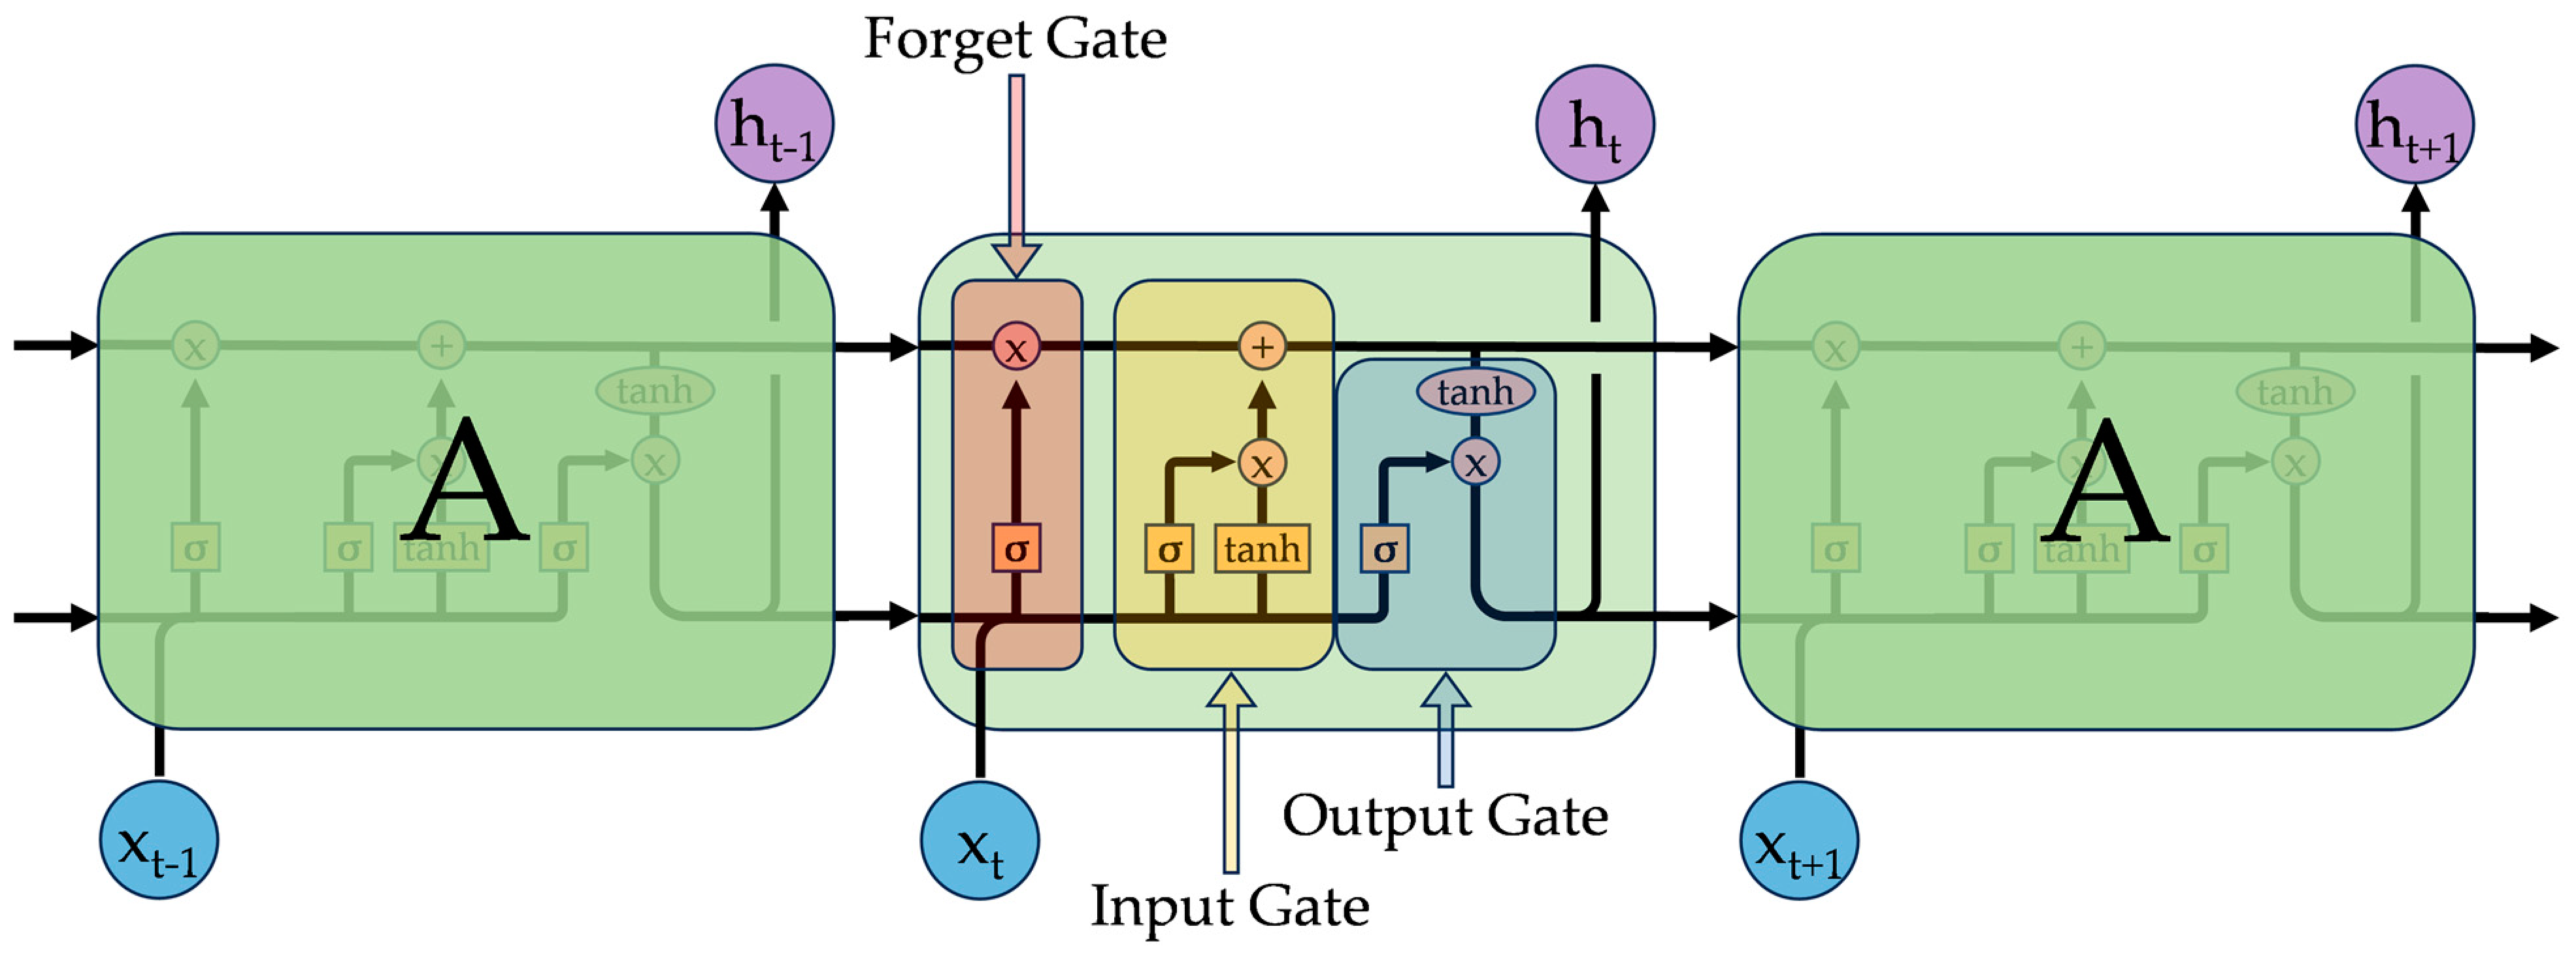
LSTMs, shown in
Figure 1, function by using three types of data gates within each memory block: forget, remember/input, and output. As time progresses, the network retains previous information via two recurrent states, the memory state and the hidden state. The blocks of the network receive the network input, the hidden output of the previous block, and the memory data stream from the previous block. Learning layers (memory blocks between the initial input and final output of the network) decide what information to forget from the data stream, what information to add to the data stream, and what prediction to make. The output is a combination of the current block’s data stream and the block’s prediction. The dependency on past predictions, coupled with the ability to discard old information, allows LSTMs to function in time series where the subsequent output depends on the previous output.
Though error functions are used to optimize a ML network, accuracy is often the metric used to evaluate the performance of the network. In addition to this, the F-score, precision, recall, and false positive rate (FPR) were also considered.
2. Methods
To train the ML network, data had to be collected, and classification labels added manually. Amputee gait and stumble data were collected using a sensor system embedded in a LIMBS M3 prosthetic knee. The sensor array was made of two nine degrees-of-freedom (DoF) sensors—one attached to the thigh and one to the shank segment of the knee (pictured in
Figure 2). Each sensor recorded data from a unique perspective. From a position time perspective, the data progressed from position (magnetometer) to change in position (gyroscope) to the rate of velocity change (accelerometer).
Subjects were asked to walk at selected speeds on a treadmill while in a safety harness, and stumbles were induced in three different ways (shown in
Figure 3): (1) to simulate inadequate leg momentum during a step, a bungee attached to the foot applied a breaking force to their prosthesis during gait; (2) to simulate tripping over an obstacle, a bumper was inserted in front of their prosthesis during gait; (3) to simulate uneven surfaces, an object was dropped onto the treadmill while the subject was stepping, which induced raised elevation, foot slipping, and small toe catches. Stumbles were induced during the second half of the prosthesis swing phase. These three events cover the primary forms of stumble during gait as described by the literature and aided in collecting a variety of stumble simulations to train the ML network to predict gait activity modes. For classification, the data were split into four events: walking, bungee stumble, obstacle stumble, and uneven stumble. Treadmill stumble induction is well established in the literature and is effective at inducing realistic stumbles [
30].
2.1. Gait Trials
The study was reviewed and approved by The University of Texas at El Paso’s (UTEPs) IRB for study 1329153-3. Four subjects consented to the study, but data were collected for three subjects before the study was permanently put on hold due to COVID-19. The three subjects are labeled S1, S2, and S4. Subject qualifying criteria were as follows: age between 21 and 60, unilateral transfemoral amputation, no secondary health conditions or neurological disorders, activity level of at least K3, and general good health.
The trials were conducted using the data collection system described below, along with a RTM600™ Rehabilitation Treadmill (Biodex, Shirley, NY, USA) and Unweighing Harness (Biodex, Shirley, NY, USA). The data collection system was made up of two nine-DoF Sensor Sticks (SparkFun Electronics, Niwot, CO, USA) and a Raspberry Pi 3 or Google Coral (Adafruit, New York City, NY, USA and Google, Mountain View, CA, USA). To prevent chances of injury, the harness was adjusted so that in the event of a fall, neither the patient’s arms nor knees touched the ground.
The subjects were fit with a LIMBS M3 (LIMBS International, El Paso, TX, USA) knee that contained the sensor array and a Niagara Foot v1 (LIMBS International, El Paso, TX, USA) with a rubber sole. The array in no way impeded the normal movement of the prosthetic knee. A prosthetist fit the prosthetic appropriately during the trial.
Subjects were asked to walk at three self-selected speeds for five minutes and a final five minutes of walking at speeds that were varied within the self-selected speed ranges. This walk was without induced stumbles. After this acclimation period, the patients were asked to wear a pair of glasses that restricted their vision of the ground. These were worn to prevent the subjects from reflexively predicting stumbles as they saw them approaching. Patients were asked to walk normally at a speed they selected between 0.8 m/s and 1.5 m/s. Stumbles were induced during that time. The patients were asked to allow themselves to fall naturally until caught by the harness. This process continued until a minimum of 30 stumbles had been recorded. Finally, subjects were asked to stand for one minute while shifting their weight on and between legs.
Recorded Data
Each stumble event was recorded and tracked with the time of the data stream. The frequency of the data recording was 60 Hz. Data recordings from each sensor included three-dimensional sensor data of acceleration, velocity, and magnetic field for the prosthetic knee. The data collection system had one sensor attached to the thigh and one sensor attached to the shank. Each sensor was oriented for acceleration and magnetic field to be orthogonal to and velocity to be rotational on the frontal (X), transverse (Y), and sagittal (Z) planes with respect to the body segment. If the subjects stumbled, a researcher pressed a button that tracked stumble alongside the sensor data.
During data evaluation and preparation, it was observed that several of the tracked stumbles were not aligned with actual stumble induction. By observing all channels of sensor data, the stumbles were manually re-marked, and several were deleted for being indiscernible from normal gait. The distribution of the cleaned stumbles can be seen in the Results (
Section 3).
The data for training recurrent networks were sampled into rows per each current timestep, which will be referred to as “samples”. Each included both the current sensor data and 10 historic sensor data points equally distributed across the last 20 timesteps. During training, this row was reshaped into a matrix of features and timesteps for the input layer.
2.2. Machine Learning
The overarching method behind training the ML model was incremental testing with increasingly complex mechanisms. The ML architecture was implemented through Keras and TensorFlow [
50,
51]. Described below are the methods used, with specifics being found in the Methods (
Section 2).
2.2.1. Classes
Fundamentally, the data had four classes: walking, stumbling by bungee, stumbling by obstacle, and stumbling by unevenness. However, the classes were also at times combined into simply walking and stumbling.
To train the networks, the data were split into training and testing datasets. Training sets were used to identify data stream patterns that lead to successful predictions; test sets were used to evaluate the model’s performance. Because of the time series-dependent nature of the data and prediction sequences (motions leading up to a stumble or non-stumble are sequential and time-dependent), samples could not simply be randomized and split for training and testing. Rather, to avoid compromising network integrity, the train/test split used a leave-one-out (LOO) methodology. LOO views each subject as one complete case, and the process will iterate through all subjects as the test set. This eliminated the overlap of training and testing data and allowed the network to be trained on two subjects while predicting the events of the third iteratively. To offset data class imbalances, artificial data points were created during stumbling events based on raw data curve-fitting techniques.
Additionally, the classes of standing and sitting were deemed outside the scope of this project due to lack of data, proper evaluation methods, and impact on control methods. In the end, the remaining classes were a summative “stumble” and “walking”.
2.2.2. Optimizing
A few methods were applied to increase accuracy and decrease the computational load. First, the features were evaluated, and it was determined that magnetometer data were not highly reproducible. Though easy to interpret and understand, magnetometer data are dependent on the sensor’s orientation relative to the magnetic field of the earth. Therefore, the lab setup made the data for all three initial subjects comparable, but there was no guarantee that future tests would have similar and consistent orientations. Therefore, all six magnetometer features were eliminated after the initial model.
2.2.3. Hyperparameter Tuning
The final stage of network configuration was hyperparameter tuning within the bounds established by the earlier testing. The tuning was iterated through all the combinations of network parameters to optimize the network for this dataset.
Table 1, below, highlights the parameters tuned, the ranges, and the steps. Training batch size was also evaluated separately within 60, 80, 120, 200, 400, and 600 samples. Hyperparameter evaluation was set to maximize accuracy and F-score. This was implemented through the KerasTuner [
52].
Various combinations of the different layers were also tried, with the layer orders being switched, disabled, or tuned individually. The hyperparameter output was evaluated for the top three combinations of values for each LOO dataset. The combination that was the most common across the different datasets was chosen as the final output.
2.2.4. Models
Classification of the data was performed in two major stages: initial and deployed. Neither of these stages represents one network, but rather they represent the result of many iterations. A distinction is made between them, because the initial network was developed after an exploration of different ML algorithms and basic data-cleaning methods. The deployed network refined the basic methodology set by the initial network and implemented a more robust algorithm application.
Before the gait trials were conducted, the gait data from HuGaDB were explored and classified with a simple LSTM network. Because HuGaDB included similar data as intended to be used, namely, thigh and shank accelerometer and gyroscope data, the principles learned were applied to this study. Though the LSTM network was preselected for its success with the HuGaDB, Gradient Recurrent Unit (GRU) and Simple Recurrent Neural Network (SimpleRNN) were still tested in comparison by evaluating all three networks’ performances with different networks sizes (50, 100, 200, and 400) and output layer activation functions (softmax, sigmoid, or none). This was done at the beginning with just an input and output layer model. For the recurrent networks, the data were transformed to include 10 past data points along with the current sensor sample.
Additionally, to model the rule-based method of commercial prosthetic knees, a “Simple Rule” classification model was developed. This model used a calculated knee angle (>25 deg) with knee angular velocity (>100 deg/s; extension) obtained from the sensors to determine step occurrences, particularly the leg extension phase. During each such extension, the model checked for three rules: bungee, obstacle, and uneven detection. Each used repeatable sensor information to establish whether that type of stumble occurred. When a stumble was detected, it would continue for 0.5 s after the last detection. This “Simple Rule” model was used as a baseline comparison for the ML developed through this study.
Thereafter, data were cleaned with a MinMax scaler that adjusted each data channel to fall between 0 and 1. It was fit to training data and applied to transform validation and test data. Training files were augmented with artificial data, and manually marked stumble data were used. Various learning rates and optimizers were attempted, but RMSprop, with its default learning rate of 0.0001, performed well most consistently.
The initial machine-learning algorithm applied to the collected data was a LSTM network with one input layer, four hidden layers, and one output layer. The layers were an 11 by 18 input array, 300-node LSTM hidden layer, a 200-node LSTM hidden layer, a 100-node dense hidden layer, a 0.9-dropout hidden layer, and a two-class output with softmax activation layer. The train length was 20 epochs with a categorical cross-entropy loss function using the RMSprop optimizer. Training involved the full 18 features from the sensors and included 10 historical data points. The three different forms of stumble were trained as one general “stumble” class. Because there were only three subjects, LOO was used; two subjects were used for training, and one for testing. For the purpose of training, the data collected during the induced stumbles were used. This data included both gait and stumble events at a roughly 9:1 ratio, though artificial data shifted that ratio to 4:1. The validation dataset was 15% of the training data. At this stage, one minute of non-stumble walking data from the test subject was added to the training data. This was thought to keep the algorithm from overfitting and to help the system be aware of the subject’s specific gait.
After hyperparameter tuning, the deployed network retained all four hidden layers. The layer parameters chosen during tuning were an 11 by 12 input array, a 200-node LSTM hidden layer, a 50-node LSTM hidden layer, a 300-node dense hidden layer, a 0.1-dropout hidden layer, and a two-class output layer with softmax activation. The train length was 30 epochs with a categorical cross-entropy loss function using the RMSprop optimizer at a learning rate of 0.001. As before, the three different forms of stumbles were combined into one “stumble” class, and artificial stumble data were used to balance the data. Different from before, the cleaned stumble data were used, and the magnetometer data were excluded. As before, LOO was used in conjunction with a small batch of non-stumble walking data from the test subject. The sum of changes between the initial and deployed networks includes the following: hyperparameter tuning, feature reduction, manual data marking. Each LOO procedure was run three times, and the results were averaged.
2.2.5. Result Evaluation
Traditionally, ML algorithms are evaluated by various metrics, such as accuracy, precision, recall, and F-score, which all depend on the prediction to ground-truth comparison. The results given in the Data Classification of the results highlight this principle (
Section 3.3). Yet, it became clear that for this application, the ground-truth comparisons were more difficult to ascertain. The marked stumbles were often not initiated at the most accurate time, nor did they end exactly when the stumbles were over. This phenomenon was one of the reasons why the stumble data used for training were cleaned manually. However, even with a cleaned stumble, the true positive prediction would often not coincide perfectly with a marker. This led to errors in accuracy. Since an improper reaction to a few false positive predictions could cause an artificial stumble, a different metric had to be applied. Therefore, instead of predictions evaluated against the ground truth on a rolling data sample basis, the predictions and ground truths were used to evaluate individual steps instead. Steps were identified using the cyclic angular velocity peaks from the data to identify the gait cycle. Within each step, the rolling samples were evaluated, and a small six-sample buffer was applied to eliminate spikes in FPs. If 80% of the six samples were positive, then the ML model was predicting a stumble for the step. This was essentially a first step toward the control system.
4. Discussion
Though there is still a dearth of repeatable data, the literature suggests that amputees and able-bodied subjects react similarly to induced stumbles, typically by increasing gait frequency and decreasing step length following a perturbation [
29,
32]. Additionally, it appears that subjects with amputations still use the sensory information of the impact [
32]. However, without the muscular control on the prosthetic leg, a new sudden step may not fully extend, which can lead to collapse. Therefore, the implementation of classification algorithms into intelligent prosthetic knees that seek emulate support-like intact leg responses should be established. To provide support and prevent falls, control systems should seek to accomplish the following: minimize knee angle at heel strike and provide stance support for quick recovery steps.
4.1. Gait Trials
It is important to note that though the beginning of the stumble was an estimate, so was the tracked stumble event. The tracked stumble events were recorded by a researcher when the stumbles were induced, and the subject stumbled. However, the bungee method had a significant delay between induction and actual stumble, whereas the obstacle was a near instantaneous stumble. Therefore, tracked events should be seen more as a highlighting of which gait cycle had stumbles as opposed to the exact instance of the stumble.
The various stumble modes were all selected to model scenarios encountered by amputees during normal gait. The bungee stumble was chosen to simulate a lack of adequate forward momentum of the prosthetic to lock the passive knee in preparation for heel strike. The data for this showed large spikes that are atypical for walking gait. The abnormal accelerations indicate rotation and imbalance.
The reactionary sensor data of stumbling with an obstacle do not seem to drastically vary from stumbling with a bungee. Gait imbalance is resolved very similarly to bungee stumble, and gait appears to resume. In both instances, it appears as though the subject did not fully extend the knee and quickly proceeded into a shaky flexion again.
Figure 4 shows stumbling with an uneven surface. This stumble has a diminished trough (arrow 1), yet it can be highlighted by arrow 2 that the subject has had a successful heel strike. This is supported by the spike in the X (orthogonal to transverse) acceleration and Z (sagittal plane) gyroscopes that can be seen in normal walking to accompany heel strike. Although, as in the previous stumble modes, there were increases in acceleration and angular velocity indicating imbalance, the subject clearly recovered and completed a step. Though the subject had to accelerate their step frequency, the sensor data show that the subject resumed gait after stumbling.
4.2. Machine-Learning Classification
As seen in the results, the initial networks showed very little difference between GRU and LSTM. Even though the scores above 70% favored the GRU on average, the LSTM performed an equal maximum (76%) and was selected for its familiarity and success on predicting the HuGaDB dataset. The “Simple Rule” prediction performed better than all the initial ML models and was therefore used as a comparative standard. However, it was developed with very specific rules and likely would have been limited in its accuracy bounds. Once the ML models were diversified beyond input and output layers, the models quickly exceeded the 78.8% accuracy of the “Simple Rule” baseline model, with 83.0 and 85.5%. A rule-based model could likely be developed that approached such accuracies for stumbles, but the reliance on very specific conditions would plausibly limit its generalization. With a combination of the different stumble methods into one class, the ML models showed a generalization that would likely be applicable to chaotic stumbles that did not match defined expected stumble patterns.
Through the ML model development process, several oversights were discovered and addressed iteratively. This is to be expected when developing such a model. For instance, in typical machine learning, data are randomized and divided into training, testing, and validation sets. However, this dataset contains time series data with historic data points. Therefore, a randomized dataset could very well yield a train and test sample separated by milliseconds. This was addressed by LOO, but initially, many iterations of the network did not account for this. Previous experience with the similar HuGaDB dataset also encouraged the application of a similar successful ML network to this stumble dataset. Additionally, the original dataset was not cleaned to account for human error during the stumble marking. Though the methods of testing different networks were still employed, these assumptions and oversights could potentially indicate that the current model is not the most suitable model for this data. The model methods were chosen almost exclusively with subject 4 (S4) being the test set. This is reflected in the results, where predictions for S4 are more accurate and precise. Though hyperparameter turning was performed with consideration for all three subjects, either S1 and S2 predict very well for S4, or the networks are still more fundamentally inclined to benefit that subject.
The objectives for this study were to achieve a classification system with accuracy greater than 90%, precision greater than 75%, and recall greater than 60%. These values were optimistically chosen when considering the confusion matrix of subject 4 during the initial model training with walking data (accuracy 85.5%, precision 69.9%, and recall 43.4%). With more data and finer tuning, such goals may have been achieved. However, at that stage, it was understood that the traditional approach of analyzing model performance by the sample was not practical. A stumble classification could be 0.01 s early and be considered a FP, and the stumble markings were never intended to perfectly extend to the end of each stumble. In fact, it became clear that the end of a stumble may be more difficult to ascertain and classify than the beginning. It was therefore understood that more realistic metrics would address not samples, but stumble inductions and complete gait cycles for performance. According to these new “instance” definitions, the model’s performance on each subject averaged 66.9% accuracy, 33.8% precision, and 49.6% recall. This is a decrease for the traditional model metrics and below the objectives of this study. By these standards, the hypothesis of the study was unsupported by the results. However, for practical application, this result may still be improved with the implantation of a robust control system.
4.3. Limitations
This study was intentionally restricted to common kinematic sensors, as described in the Gait Data (
Section 1.1) of the introduction. Though this was done to showcase the ML model’s capabilities with currently used methods, it does mean that the stumble classification is limited to detection after initiation. Future integration of peripheral sensors to measure the environment may well predict stumbles. However, the demonstrated reaction time of less than 0.1 s indicates promise in this method.
A fundamental constraint of the ML model is the dataset of the three subjects. Though more subjects were scheduled, initial COVID-19 lockdowns prevented further data collection. Artificial data and data-cleaning methods were used, but the fact remains that ML models require high-quality and labeled data, and more diverse datasets yield more beneficial models. More data were collected during subsequent trials, but these data were not available to train this model.
Because the control systems of commercial knees are proprietary, there are no direct comparisons that can be made for the evaluation of the ML model. Therefore, the limitation is that a “Simple Rule” model had to be developed to be used as a baseline comparison. However, the score achieved by this system is not meant to be seen as representative of what commercial systems would be able to achieve, but rather as standard against which the new ML models could be evaluated.
Further, many different approaches were attempted, and data were processed and reprocessed several times. It is not clear whether the current model is the absolute best model for the data as it is applied currently. Additionally, the low number of subjects potentially restricted the model selection with overfitting of the general parameter selection process. Therefore, though the model has performed admirably, it may be constrained to data similar to the training data.
4.4. Future Work
Future work would include revisiting the model selection process and hyperparameter tuning to validate the model and parameter choices with all data transformations, such as feature selection, data cleaning, artificial data, and stumble mode combination.
Exploration of the data gathered in subsequent trials would likely improve the model’s performance. With the early limitation of subjects during the initial trials, the expansion of the dataset provides an opportunity to greatly improve the classification model and parameter choices. Additional methods, such as ensembling and transfer learning, warrant further investigation. Particularly for ensembling, a feature selection method should be applied. The current system uses twelve channels of data, but it is unclear whether all of these are useful, or whether some of the calculated data, such as angle or knee velocity, could not replace and improve on the current features. With proper feature selection, there is the possibly of a more accurate and more compact model. If the networks could be made smaller, the possibility of multiple parallel ensembled models in real time could result in greater network performance. Overall, this research establishes the base protocol, but there are many avenues for exploration for continued work with this dataset.
4.5. Broader Implications
Time series data classification is no new task, and several studies have suggested networks that can be implemented in real time either because of their usefulness or because their architecture was designed to be low-impact. The deployed network demonstrated in this study was not only designed to be deployed in real time but was successfully deployed in later studies. Additionally, as the HuGaDB initial classification suggested, the activities of standing, sitting, and running are accurately classifiable by the LSTM architecture. Future work should include an expansion of the classes for more versatile knee applications.
A fundamental shift in the research occurred during the model development process and display of the data. Though traditional sample-based analysis is a comfortable and known quantity, it does not necessarily apply to all datasets. For this study, it became apparent that sample-based metrics were giving much higher accuracy than was realistic. The imbalance of classes especially contributed to this. A new perspective on the data was developed and applied in subsequent work, but continued, future analysis of this data should be conducted. Different tuning methods should be implemented, such as utilizing a cost matrix with custom weights with penalties and rewards for step metrics, and the data should be retrained according to this different set of metrics. This would allow for more customized tuning based on the perceived costs of certain types of errors.


