Article

Kinetics of Lower Limb Prosthesis: Automated Detection of Vertical Loading Rate

1
Institute of Biomedical and Health Innovation, The School of Exercise and Nutrition Science of the Queensland University of Technology, 4059 Brisbane, Australia
2
Institute of Biomedical and Health Innovation, The School of Chemistry, Physics and Mechanical Engineering of the Queensland University of Technology, 4059 Brisbane, Australia
3
School of Public Health, Social Work of the Queensland University of Technology, 4059 Brisbane, Australia
4
Jamieson Trauma Institute Metro North Hospital and Health Service Brisbane, Chair of Trauma at Queensland University of Technology, 4059 Brisbane, Australia
5
Institute of Biomedical and Health Innovation, The School of Physical Sciences of the Queensland University of Technology, 4059 Brisbane, Australia
*
Author to whom correspondence should be addressed.
Current address: The College of Public Health, Medical and Veterinary Sciences of the James Cook University, 4814 Townsville, Australia.
Prosthesis 2019, 1(1), 16-28; https://doi.org/10.3390/prosthesis1010004
Submission received: 6 September 2019 / Revised: 18 October 2019 / Accepted: 26 October 2019 / Published: 29 October 2019
(This article belongs to the Section Orthopedics and Rehabilitation)

Abstract

:
Vertical loading rate could be associated with residuum and whole body injuries affecting individuals fitted with transtibial prostheses. The objective of this study was to outline one out of five automated methods of extraction of vertical loading rate that stacked up the best against manual detection, which is considered the gold standard during pseudo-prosthetic gait. The load applied on the long axis of the leg of three males was recorded using a transducer fitted between a prosthetic foot and physiotherapy boot while walking on a treadmill for circa 30 min. The automated method of extraction of vertical loading rate, combining the lowest absolute average and range of 95% CI difference compared to the manual method, was deemed the most accurate and precise. The average slope of the loading rate detected manually over 150 strides was 5.56 ± 1.33 kN/s, while the other slopes ranged from 4.43 ± 0.98 kN/s to 6.52 ± 1.64 kN/s depending on the automated detection method. An original method proposed here, relying on progressive loading gradient-based automated extraction, produced the closest results (6%) to manual selection. This work contributes to continuous efforts made by providers of prosthetic and rehabilitation care to generate evidence informing reflective clinical decision-making.

1. Introduction

Because the ability of individuals with lower limb loss to walk with a prosthesis is paramount to their quality of life, prosthetic care providers make bespoke clinical decisions intending to sustain the capacity of residuum to be fitted with a prosthesis. Allegedly, achieving satisfactory prosthetic attachment highly depends on the residuum health. This term can be defined as the holistic state of physical well-being of the residuum’s distinct neuromusculoskeletal system, encapsulating resected skin, nerves, muscles and bone [1,2,3]. The intrinsic determinants of residuum health, mainly including the length of residuum and muscle reassignment, are established during surgical amputation [4,5]. Most common extrinsic determinants of residuum health could be substantially influenced by rehabilitation specialists and suppliers of components (e.g., manufacturers, prosthetists) who facilitate control of the prosthetic joint movements and fitting of components that, altogether, ultimately pertain to the level of activity [6].
Clinical decisions around management of extrinsic determinants are more likely to have a physical ripple effects on the residuum (e.g., skin damage, muscle contracture, heterotopic bone growth, neuroma, phantom pain). These mechanical constraints constitute a loading profile broadly described as the pattern of three forces and moments applied on and around the anatomical axes of residuum over a series of gait cycles.
For example, prosthetists seek to align ankle and knee units of a lower limb so that individuals can comfortably apply half and, at least, full bodyweight while standing and ambulating, respectively. Such symmetrical loading should enable a more balanced gait that, in return, might reduce incidence of falls as well as musculoskeletal injuries of sound joints due to overuse (e.g., back pain, osteoarthritis) [3,7,8]. Choice and alignment of components for typical socket-suspended prostheses are critical to generate a suitable loading profile and subsequent intra-socket pressure [9,10,11,12,13]. This could minimize risks of skin damage too often responsible for prosthesis abandonment [14]. A relevant loading regimen applied by bone-anchored prostheses is also critical for safe and efficient osseointegration around the implant [15,16,17]. Underloading might weaken the bone/implant stability and lead to loosening and infection. Overloading might increase pain and, ultimately, lead to periprosthetic fractures.
The loading profile can be calculated using inverse dynamics equations, providing the comprehensive dynamics and kinematics information responsible for the prosthetic and sound ankle, knee and hip joint kinetics [18,19,20,21,22,23,24,25]. However, this method relies on fixed equipment placed in delimited space. Ground reaction forces are collected using floor-mounted force-plates in walkways, stairs or ramps. Positions of lower limb segments within a calibrated volume are captured using 3D motion analysis systems [18,19,26,27]. Valid dynamic measurements require sole contact of each foot on a force-plate that could be achieved through individualized arrangements of the starting point and/or force-plate positioning to avoid targeting and/or repetitive recording of invalid trials [18,19,20]. The sum of steps to be collected in a session is conditioned by the number and arrangement of force-plates and cameras [18,19,20]. Otherwise, shortcomings with foot placement and the number of steps could be alleviated by using an instrumented treadmill, provided that 3D motion capture has the capacity to record for an extended period of time. Finally, inverse dynamics calculations are potentially sensitive to accurate extraction of inertial characteristics of prosthetic components [28,29].
In addition to being resource intensive, the extraction of the loading profile using this approach is, altogether, partially reflective of the true prosthetic loading regimen applied during daily ambulation [18,19]. Therefore, evidence provided in this way, showing the effects of an intervention, has limited applicability.
Alternatively, the loading profile can be directly measured using state-of-the-art portable kinetic systems including compact multi-axis transducers fitted within a prosthesis (Figure 1). Such systems are capable of recording and storing, or sending wirelessly, the actual load applied on residuum for a virtually unlimited number of steps during unrestricted daily activities. Therefore, they should provide more ecological prosthetic loading profile information. Here, the term “ecological” refers to loading data collected during the course of the participants’ actual daily living activities, which can provide better insights into the range of critical loading characteristics [30,31,32,33,34].
A handful of studies validated the direct measurement methods, showing comparable forces and moments measured with a JR3 load cell or commercial iPecLab devices, and forces and moments calculated with inverse dynamics relying on force-plates and 3D motion capture [18,19,20,24,35].
Direct measurements of the loading profile have been conducted on case-series and a cohort of individuals with transtibial amputation (TTA) fitted with socket-suspended prostheses [4,9,10,11,12,13,15,16,17,19,21,26,27,35,36,37,38,39,40,41,42,43,44,45,46]. These studies analysed force versus moment in various planes during several walking activities (e.g., walking and turning round a circle) to compare prosthetic feet, determine the effect of anteroposterior alignment perturbations on rollover, and predict intra-socket pressures [36,37,47].
Loading profiles have also been directly measured on cohorts of individuals fitted with transfemoral bone-anchored prostheses during a rehabilitation program (e.g., static load bearing, use of walking aids), standardized activities (e.g., walking in a straight line and around a circle, ascending and descending stairs and ramps), and unscripted daily activities (e.g., open environment, fall) [4,15,16,17,19,26,27,35,38,39,40,41,42,43,44,45,46]. These studies characterized the prosthetic loading profile using a range of variables associated with spatio-temporal characteristics (e.g., cadence, duration of gait cycle (GC) and support and swing phases), loading boundaries (e.g., maximum and minimum magnitude), a series of points of interest or local extremum (e.g., onset and magnitude of points of inflection between loading rate) and impulse [35,38,39,40,43,46,48,49,50]. Extraction of these variables for a large number of steps usually generated during ecological recordings was facilitated by the semi-automated detection of gait events (e.g., heel contact (HC), toe-off (TO)) and points of interest using set loading thresholds, as well as extraction of maximum or minimum loading magnitude within a time window selected manually, respectively [26,27,51,52,53].
Incidentally, a single-case study differentiated the specific loading profile of transfemoral bone-anchored prostheses fitted with either mechanical or microprocessor-controlled knee units using vertical loading rate [46]. Expressed in kN/s, this slope of the loading rate corresponded to a quasi-linear section of the force applied on the long axis of the residuum (FLG) occurring between HC and first loading peak (FLG1) during the first half of the support phase (Figure 1) [27]. In contrast with points of interest represented by a magnitude of loading at a given time during the support phase, the vertical loading rate provided further information by reporting the variation of magnitude between two points of calculation occurring within HC and FLG1 at the critical initial loading phase. In another word, the loading rate could be considered as a single clinical indicator compounding not only the magnitude of the vertical load but also the time taken to achieve this vertical loading. Impulse of the vertical loading, determined by the trapezoid method, also takes into consideration the magnitude and the time of application, but mostly gives information on the overall amount of force applied over a certain period of time.
Additional information provided by the vertical loading rate has been widely reported to explain lower limb musculoskeletal injuries and evidence efficiency of footwear on able-bodied participants [54]. Likewise, the vertical prosthetic loading rate could be used for a better understanding of the link between loading profile and residuum skin damage or development of osseointegration, as well as musculoskeletal injuries of back, sound knees and hips (Figure 1). Nonetheless, this variable is still largely overlooked when analyzing the ecological prosthetic loading profile measured directly.
The underlying reasons for under reporting the vertical loading rate might be found in the extraction process itself. At this stage, there is a lack of clear indications for the selection of points of calculation occurring within HC and FLG1 that should best represent the quasi-linear section of FLG. Detection of these points must be performed manually somehow, while relying on visual inspection of FLG for each individual GC. Consequently, this manual selection of the slope could be subjected to high inter-rater variability. More practically, this method is simply unattainable when considering large data sets acquired during ecological assessments, reaching up to 3000 steps in five hours recording [35,38,39,40,46].
Altogether, there is a need for elucidating vertical loading rate and slope extraction standards that will allow supplanting manual selection by specific algorithms capable of automatically detecting the slope produced during prosthetic gait. This will facilitate consistent reporting of loading rate data essential for cross-comparison of separate studies (e.g., benchmark, meta-analyses).
The long-term aim of this work was to facilitate the development of an automated extraction of lower limb prosthetic vertical loading rate. The main purpose of this study was to outline a worthwhile automated method to detect points of calculation of vertical loading rate produced during pseudo-transtibial prosthetic gait. The specific objective was to compare the efficacy of five automated methods of detection against manual selection of vertical loading rate, including three automated methods relying on criterion presented in the literature and two original methods.

2. Results

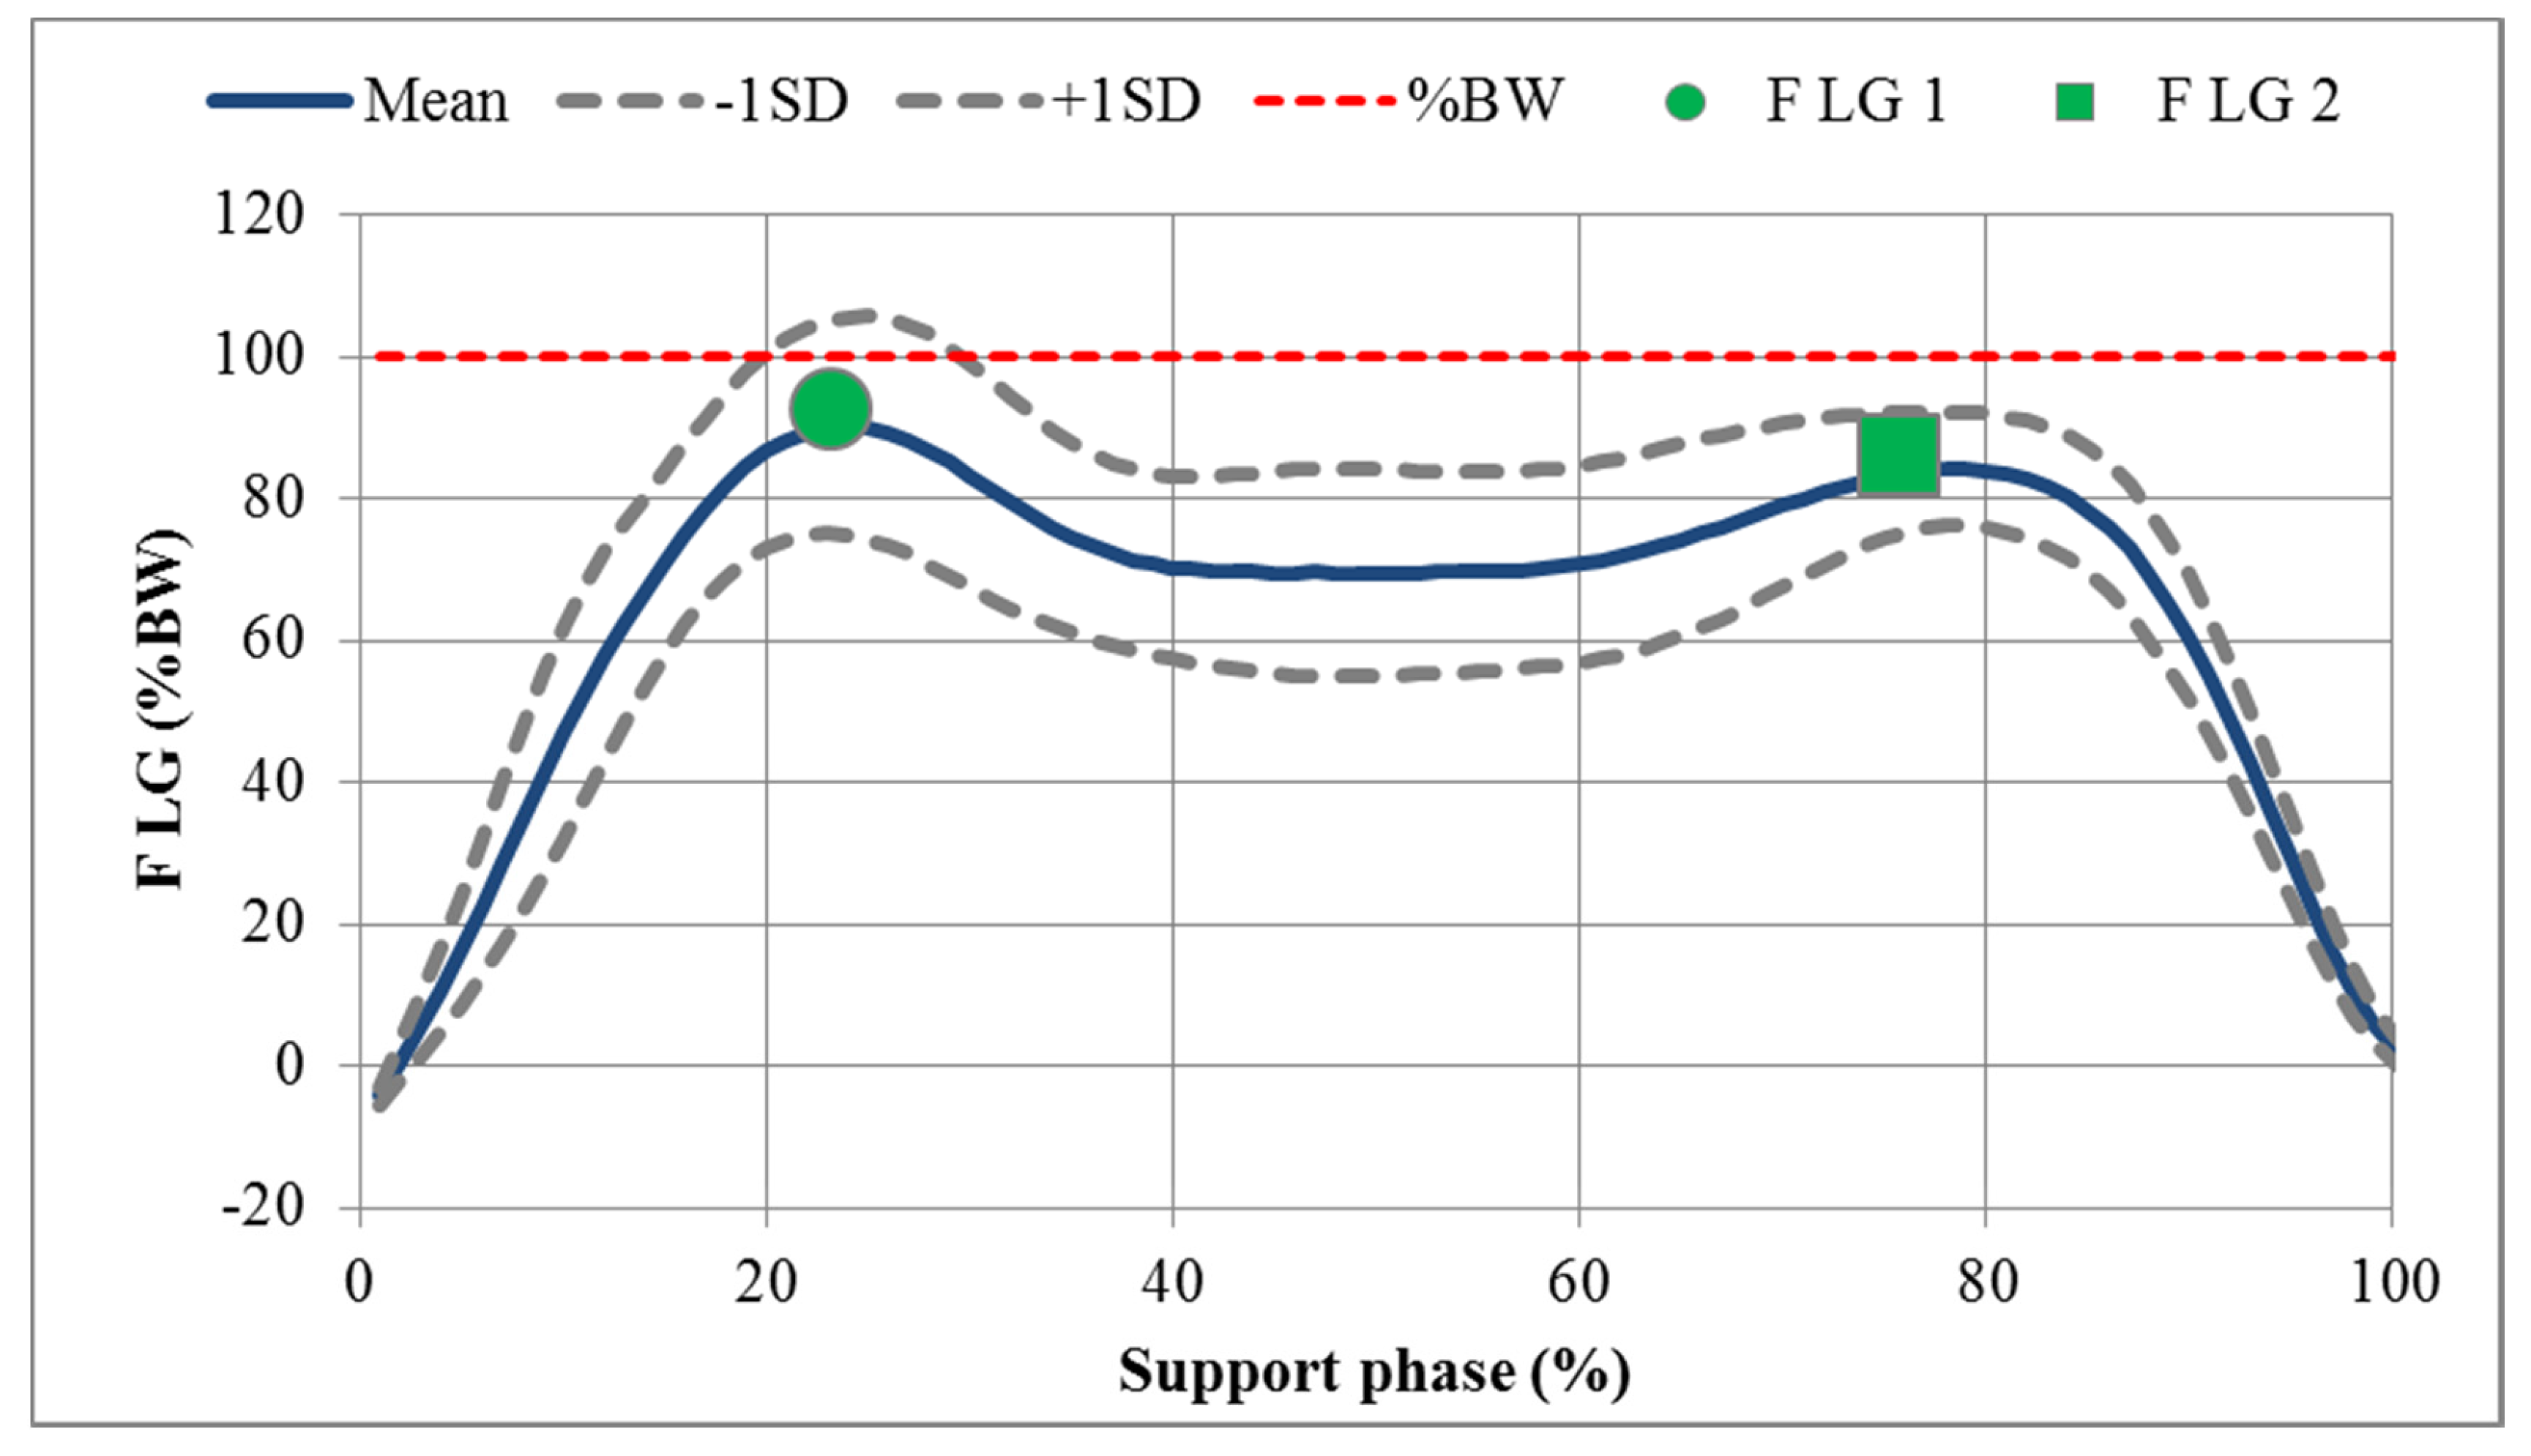
A total of 150 gait cycles, including approximately 50 successive cycles per participant, were considered for analysis. The cadence, duration of GC and support phase was 46 strides/min, 1.32 ± 0.11 s, 0.80 ± 0.08 s or 61 ± 6% GC, respectively. An overview of the mean pattern of FLG measured with the transducer during the whole support phase is provided in Figure 2.
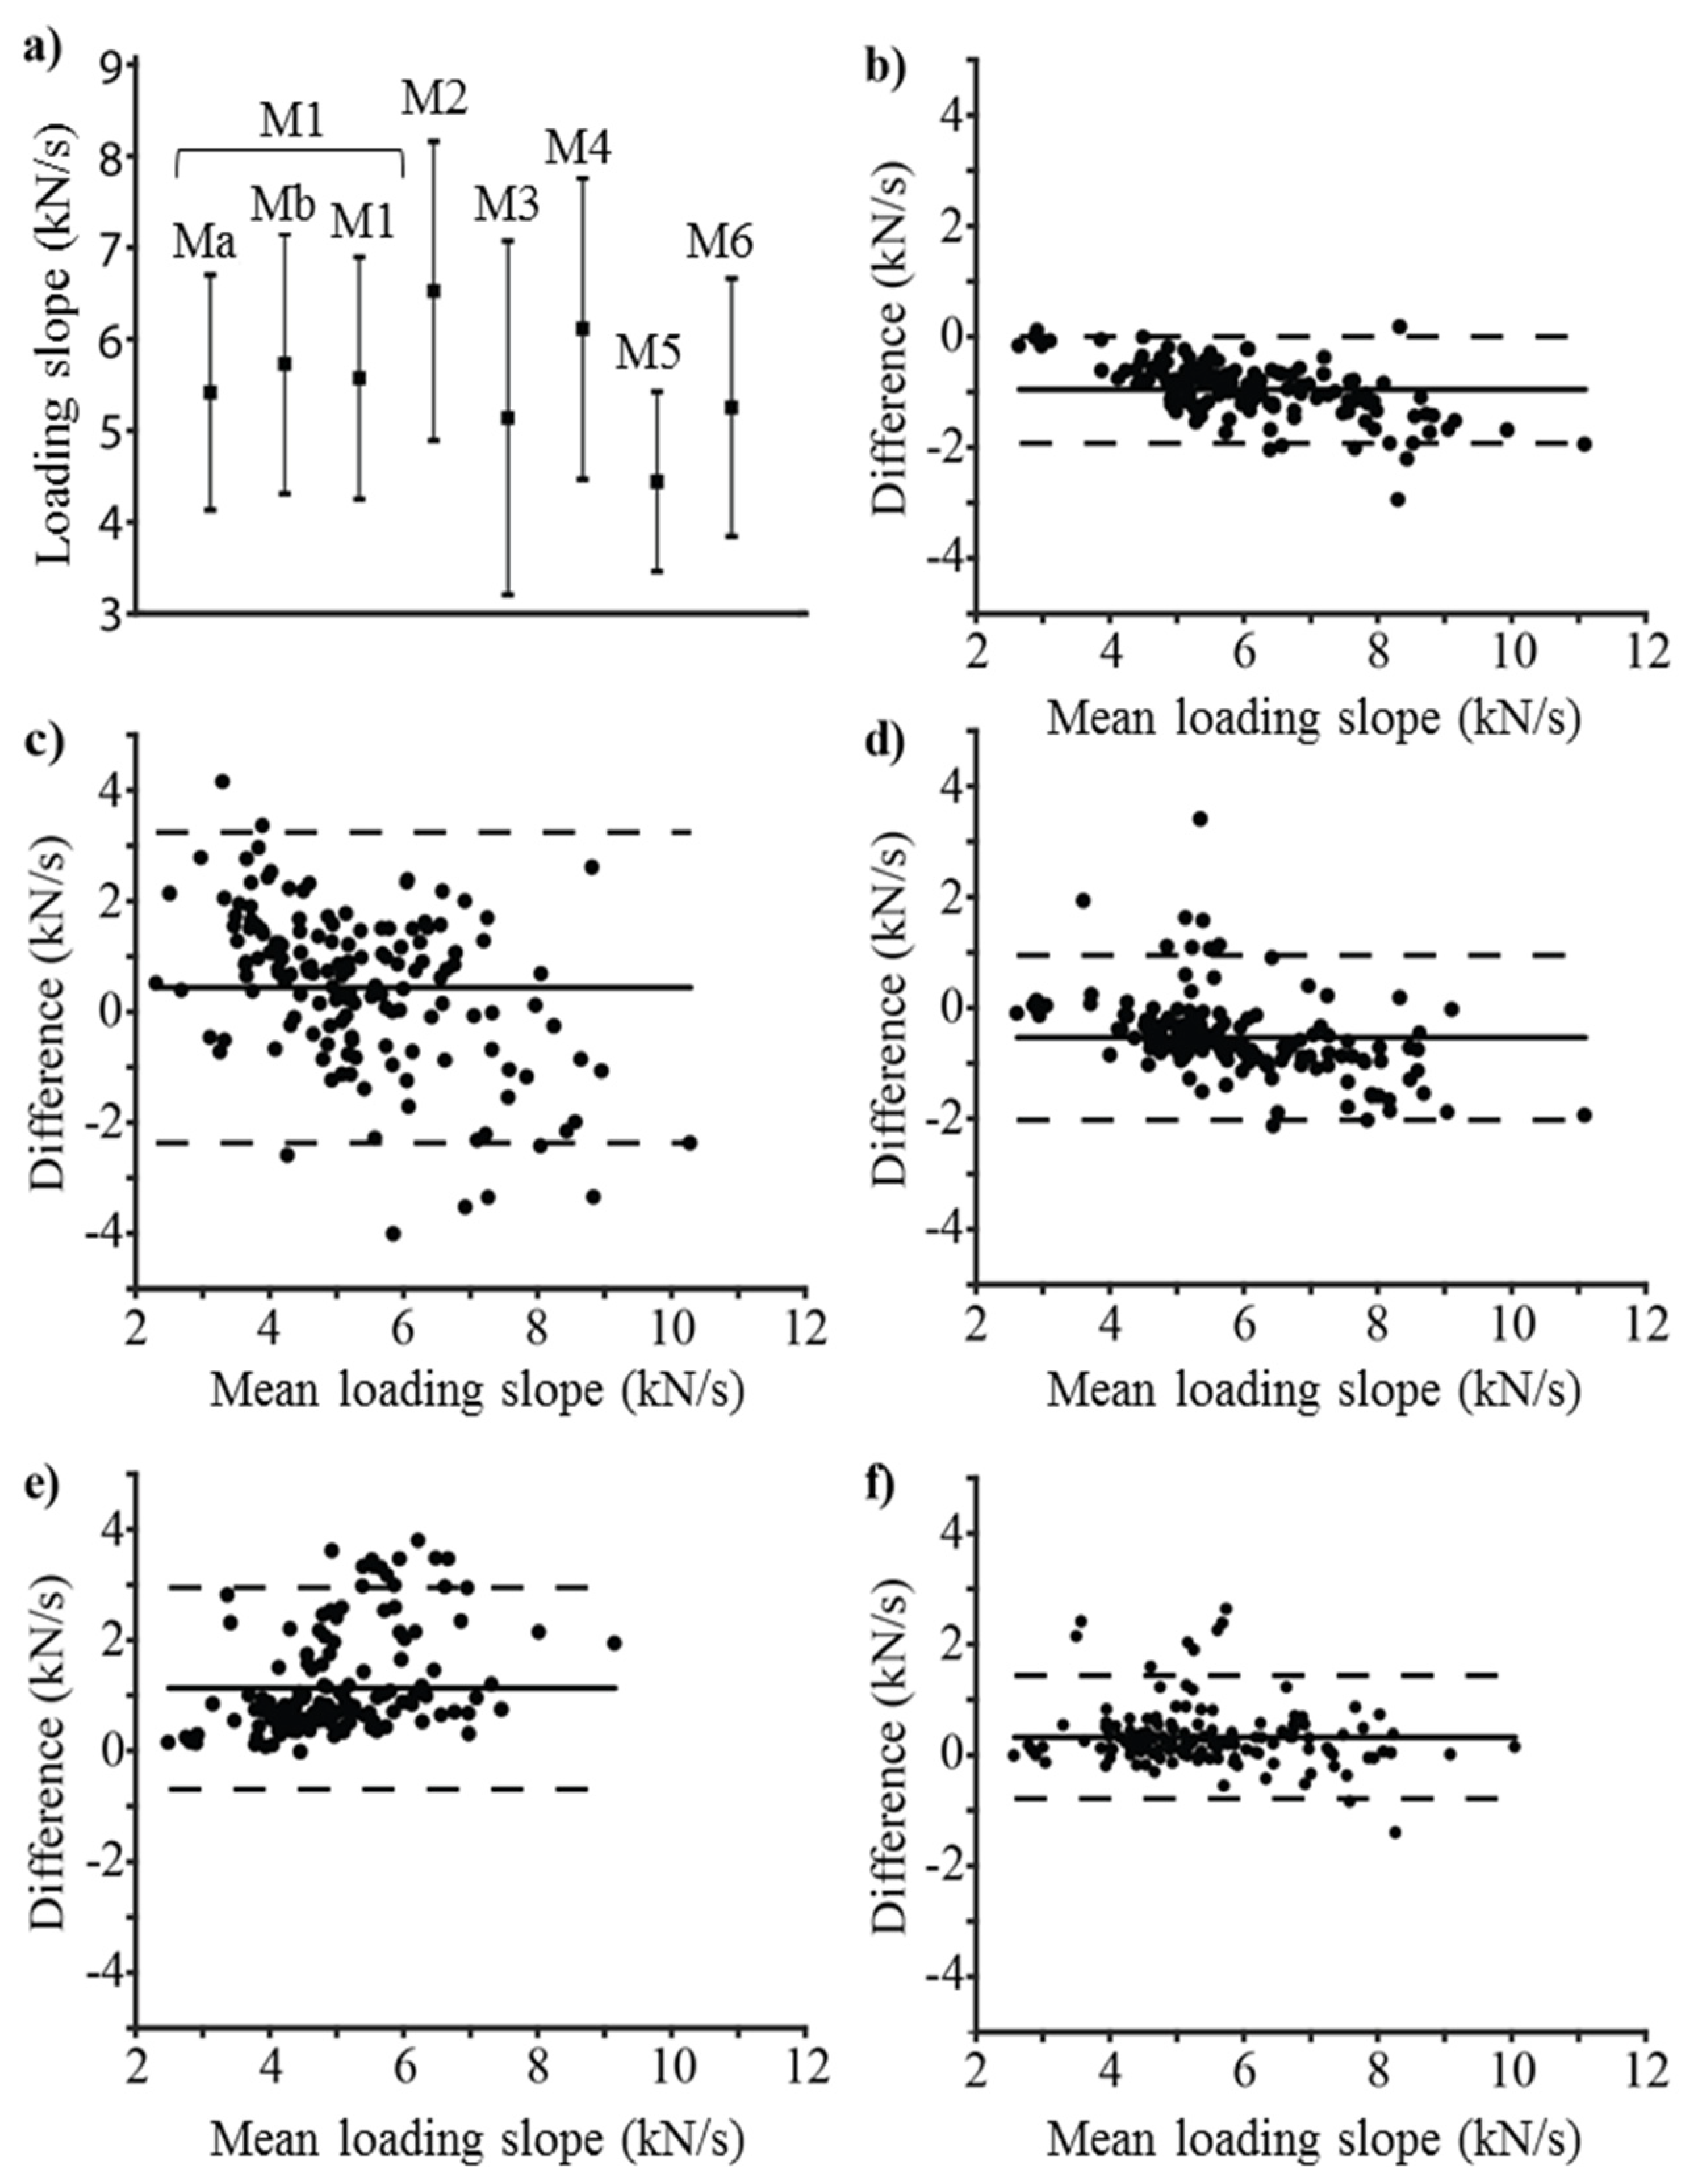
The average slope was 5.56 ± 1.33 kN/s for M1, 6.52 ± 1.64 kN/s for M2, 5.13 ± 1.94 kN/s for M3, 6.11 ± 1.65 kN/s for M4, 4.43 ± 0.98 kN/s for M5 and 5.24 ± 1.41 kN/s for M6.
The average slopes detected with M2 and M4 were 15% and 9% steeper, while the ones with M3, M5 and M6 were 9%, 26% and 6% flatter than M1, respectively.
Mean difference with M1 and 95% CI was −0.95 [−1.92, 0.02] kN/s for M2, 0.44 [−2.37, 3.25] kN/s for M3, −0.54 [−2.02, 0.94] kN/s for M4, 1.13 [−0.68, 2.95] kN/s for M5 and 0.32 [−0.79, 1.43] kN/s for M6 (Figure 3b–f).
The ranking of the methods by decreasing absolute average and range of 95% CI differences combined was: M6, M2, M4, M3 and M5.
The Matlab program we used computed the slopes for each method consecutively. Therefore, we cannot report differences in computing time between each method. However, all computing was done in a matter of seconds.

3. Discussion

The average slopes of vertical loading rate ranged between 4.43 ± 0.98 kN/s to 6.52 ± 1.64 kN/s for M2 to M5, respectively. The difference between the manual (M1) and the automated (M2–M6) detection of slopes of vertical loading rate ranged between −0.96 kN/s and 1.13 kN/s for M2 to M5, respectively.

3.1. Limitations

A clear limitation of this work was the use of an instrumented physiotherapy boot worn by able-bodied participants to produce a pseudo-prosthetic gait rather than actual loads applied by individuals with TTA during prosthetic gait.
Another limitation was the appraisal of the differences in magnitude of slopes between manual and automated methods of detection. Altogether, the differences with M1 seemed generally low for each method based on basic algebraic interpretations. Regardless of the possible statistical significance of the differences, a more comprehensive understanding was limited as there is little evidence showing how minimal clinically important differences in vertical loading rate translate into noticeable outcomes for patients (e.g., comfort score, skin damage) as highlighted previously [55,56].

3.2. Interpretation

Clearly, relying on easily detectable points of inflection, such as HC and FLG1, generated worse results, with a 26% difference between M5 and M1. This confirmed that vertical loading in a pseudo-prosthetic gait generates transient intermediate loading phases before and after the loading rate, instead of a linear progression between HC and FLG1.
Methods relying on previously established selection criterion generated acceptable differences of less than 15% for M2–M5. This indicates that set vertical loading thresholds extracted from dynamics studies on able-bodied participants during walking or running might only be partially transferable to prosthetic gait.
Furthermore, this study revealed that M6 produced the smallest difference (6%) compared to M1, indicating that a progressive loading gradient-based automated detection of vertical loading rate during pseudo-prosthetic gait might be worthwhile.
Finally, comparison with existing literature showed that, interestingly, FLG applied by the participants presented with similar features to FLG applied by actual individuals fitted with transfemoral prostheses [39,40,46]. For instance, the force applied during the push off phase represented by FLG2 (e.g., 76 ± 6% SUP, 689.73 ± 85.31 N or 86 ± 8% BW) was 52.45 ± 79.12 N or 7 ± 10% BW smaller that FLG1 (e.g., 23 ± 3% SUP, 742.18 ± 133.90 N or 92 ± 15% BW). However, further comparison with loading rates published in the literature was challenging due to the discrepancy in measurements and reporting of the data. Frossard et al. (2010) showed that the loading rate on the long axis of a transfemoral osseointegrated implant during the initial part of a fall was 0.34 N/ms. Frossard et al. (2013) indicated that the slope of the loading rate applied on the long axis of osseointegrated implants by transfemoral bone-anchored prostheses was 70.56 ± 1.86 deg when walking [46]. Revill et al. (2008) reported that the peak vertical force loading rate applied by able-bodied participants during barefoot walking ranged between 100 and 120 BW/s.

3.3. Generalizability

Further generalization of the results was also impeded by the typical intrinsic limitations of this small case-series study with an asymptomatic, rather than TTA, population. A reasonably large range of body mass and height within the group of participants should affect stride length and induced some variability in vertical loading patterns [38,39]. Nonetheless, other confounders that could potentially add variability were controlled as only able-bodied males walked with surrogate prosthesis at steady pace using a treadmill.

3.4. Future Studies

One way to extend this work will be to continue exploring ways to better understand the loading profile, including the vertical loading rate, relying on more advanced data processing analysis such as principal component analysis.
In the meantime, the next logical step of this work will be to extract the vertical loading rate, applying M6 for larger cohorts of individuals with TTA performing actual daily activities [38,39,57,58]. Further longitudinal studies could improve the robustness of the algorithm proposed in M6 by considering cohorts with various lengths of residuum, body weights and functional classification.
Further evidence of the clinical utility of M6 could be achieved by additional cross-sectional studies establishing how vertical loading rate recorded with prosthetic components, various anthropomorphic designs, alignments and methods of attachment (e.g., socket suspension, bone-anchorage) could be associated with particular adverse events affecting residuum and overall health (e.g., skin damage, development of osseointegration, injuries of sound joints) as well as participants’ experience (e.g., comfort, satisfaction) [1,44,45,48,49,59].

4. Materials and Methods

4.1. Participants

We recruited three able-bodied males (83 ± 14.8 kg, 1.77 ± 0.1 m, 43 ± 5 yrs) using an arm-length recruitment strategy between June 2017 and March 2018. No exclusion criteria were applied for ethnicity, gender, age, weight and height or level of activity. The specific inclusion criterion included being free of lower limb injuries or pain at the time of recording and capable of walking for 30 min on a treadmill using a pseudo-prosthesis. Human research ethical approval was received from the University Human Research Ethics Committee of the Queensland University of Technology (1600001124) and approved by U.S. Army Medical Research and Materiel Command (USAMRMC), Office of Research Protections (ORP), and the Human Research Protection Office (HRPO). Written consent was obtained from all the participants.

4.2. Apparatus

Participants walked with two surrogate transtibial prostheses made of a physiotherapy boot and a solid ankle cushion heel foot. The loading applied on the left leg was measured using a portable kinetic system (i.e., iPecLab, RTC, US) including a transducer fitted between the boot and foot [24]. The transducer was positioned so that the vertical axis of its coordinate system was collinear with the long axis of the leg. A spacer replaced the transducer on the right side.
FLG was recorded by the transducer set at 200 Hz and sent wirelessly to a laptop nearby, while participants walked at 5 km/h speed on a treadmill with a 1% incline for 25 to 30 min [24].

4.3. Processing

The raw loading data were processed and analyzed using a specifically designed Matlab program (MathWork, Natick, MA, USA, Version R2019a).
Gait events (e.g., HC, TO) were detected automatically when FLG crossed 10% of the bodyweight [30,32,33,57]. The first 10–15 min of the walk, corresponding to circa 100 strides, were discarded to avoid considering data clouded by the participants acclimation with the pseudo-prostheses. This contributed to reducing the error detection rate to nil when considering only the 50 successive strides taken post acclimation. The slope of the vertical loading rate was calculated so that a high and low magnitude indicated a steep and flat slope for the six methods (M1–M6), respectively.
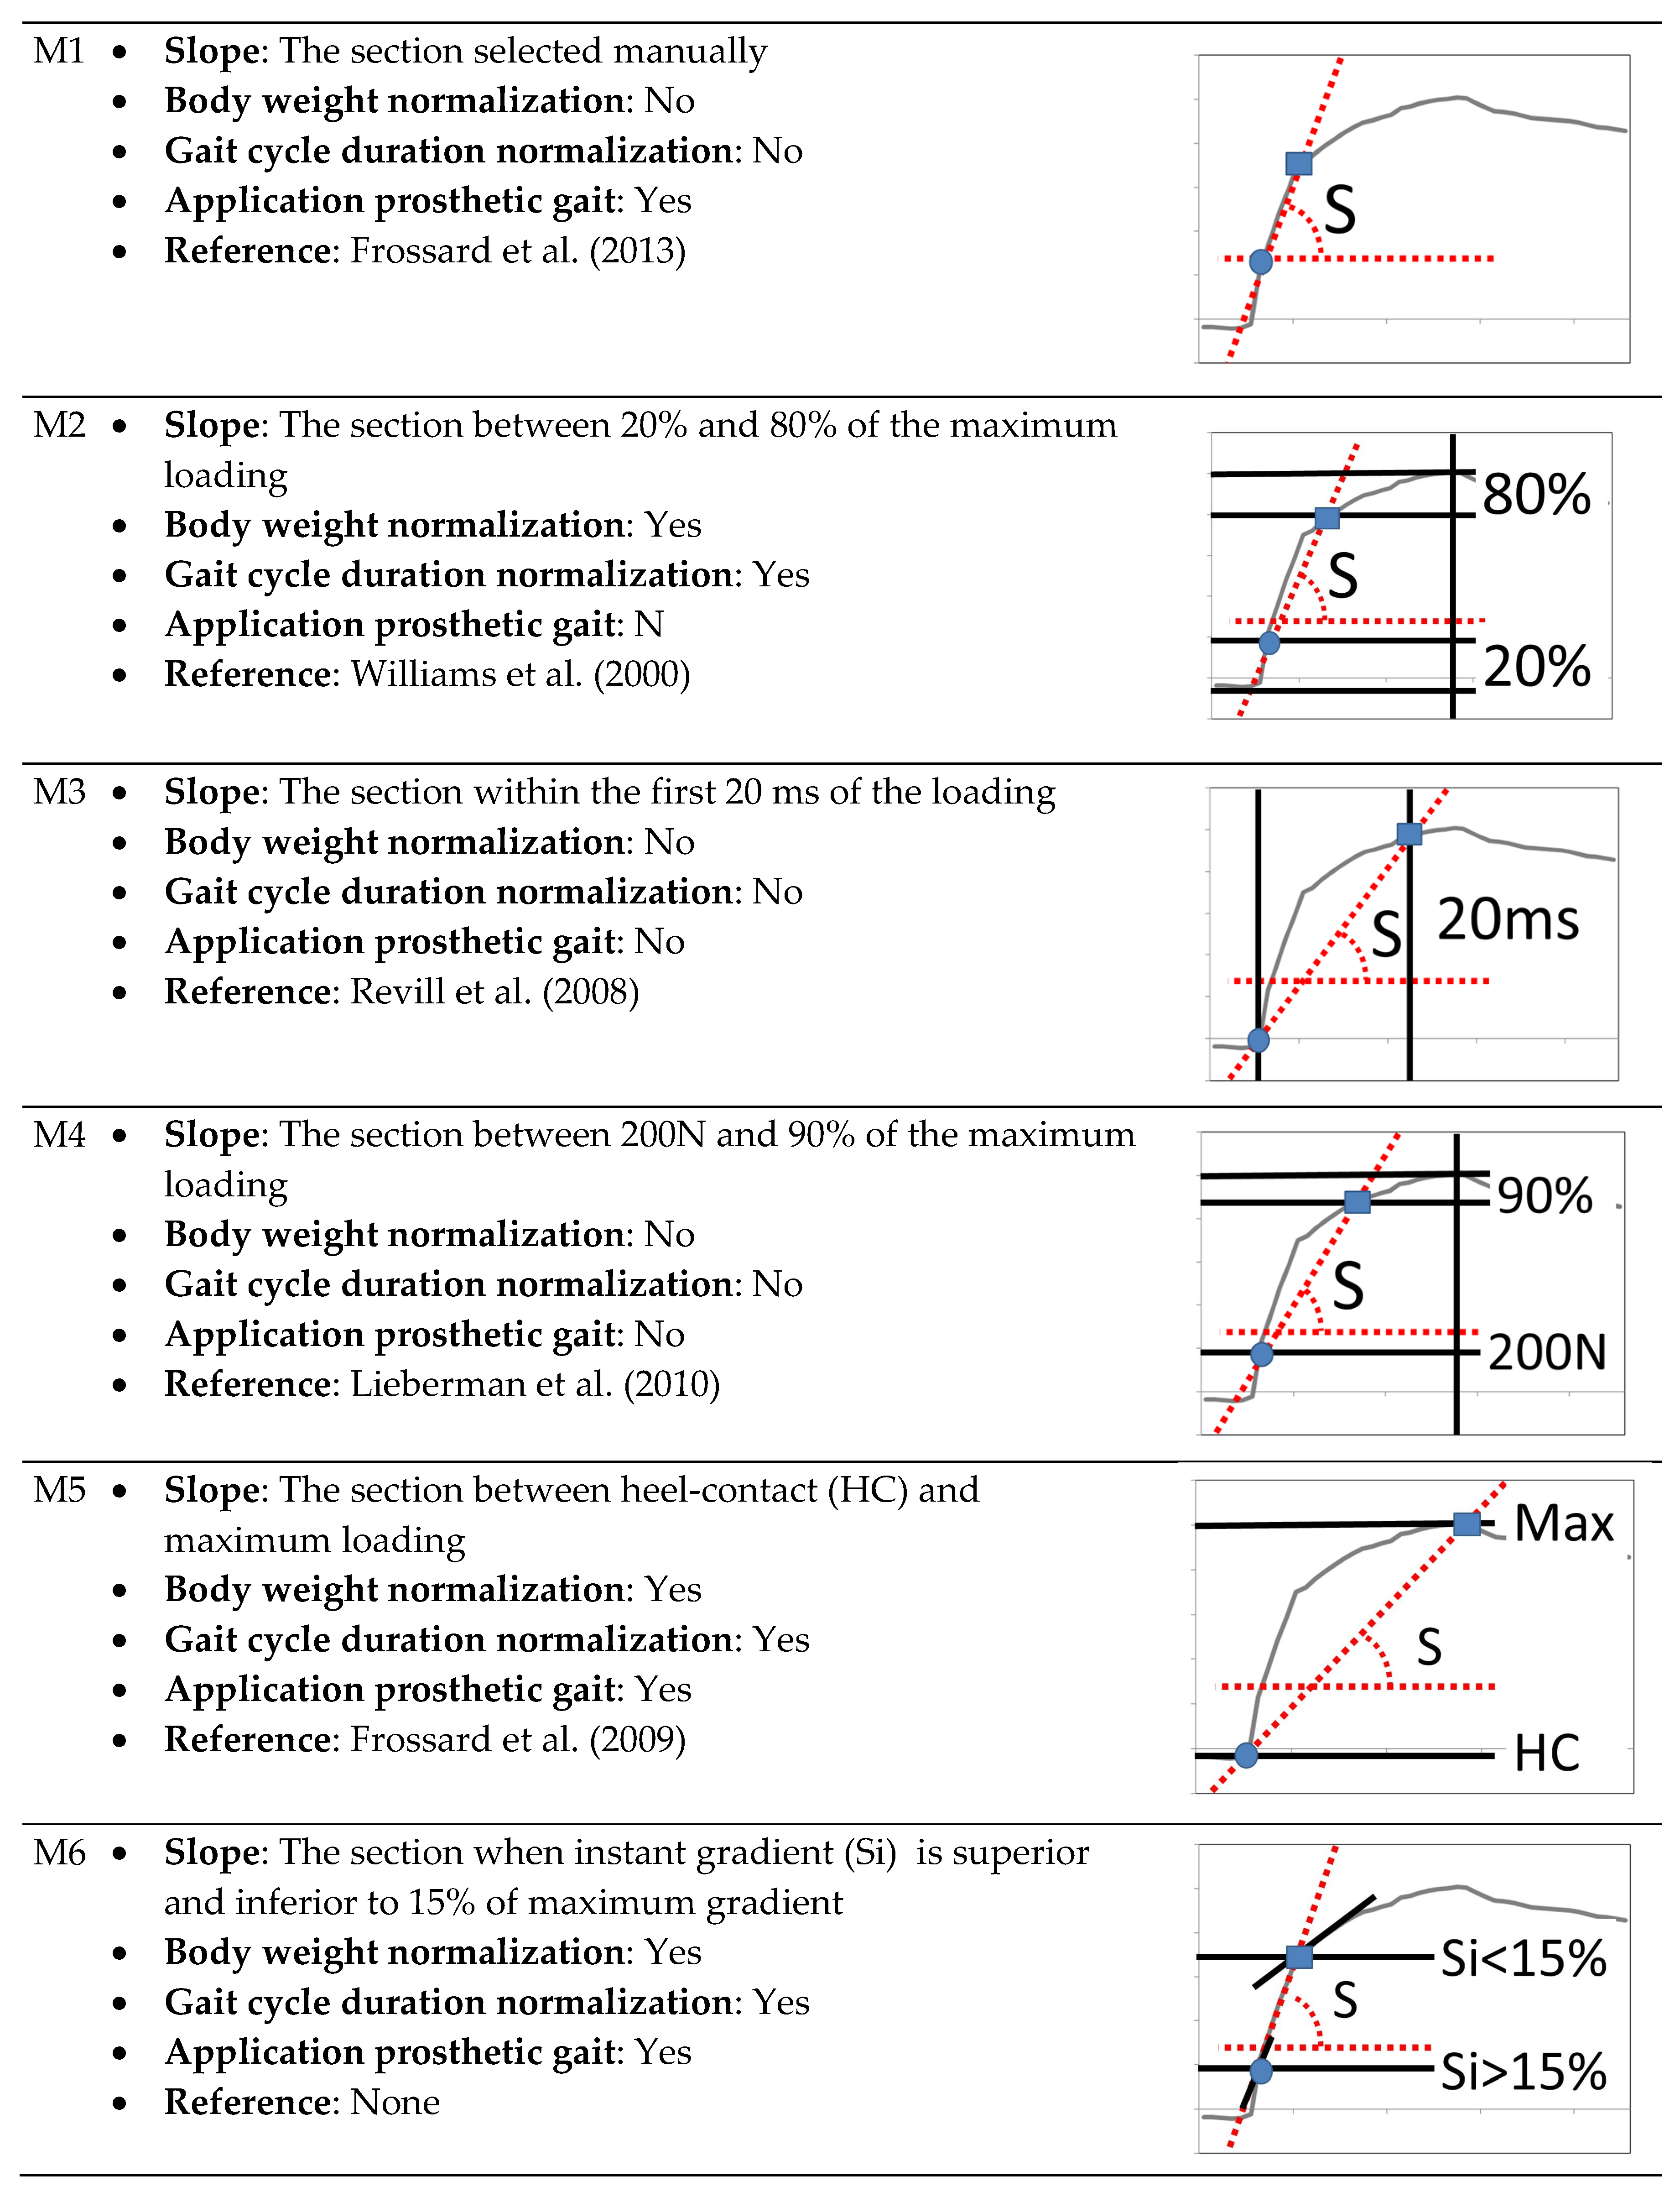
An overview of the criterion for automated detection of the slope of the vertical loading rate, including the section of the loading rate used to calculate the slope, the requirement for normalization of load with bodyweight (Newtons vs. % BW) and time of GC (seconds vs. % GC), as well as a supporting reference for each of the six methods compared, is provided in Figure 4.
In M1, the slope considered was the average of the slopes selected by both experts (Ma, Mb) who manually identified a section of FLG, expressed in Newtons over time, expressed in seconds, that they deemed the most relevant, as described in Frossard et al. (2014), while characterizing the loading rate of transfemoral bone-anchored prostheses fitted with different components during walking [46].
In M2, the slopes were detected automatically for the section between 20% and 80% of the maximum FLG, expressed in % BW over a percentage of the gait cycle, as described by Williams et al. (2000), while characterizing the loading rate on able-bodied participants during running [53].
In M3, the slopes were detected automatically for the section within the first 20 ms of FLG, expressed in Newtons over time, expressed in seconds, as described by Revill et al. (2008), while characterizing the loading rate on able-bodied participants during walking [52].
In M4, the slopes were detected automatically for the section between 200 N and 90% of the maximum FLG, expressed in Newtons over time, expressed in seconds, as described by Lieberman et al. (2010), while characterizing the loading rate on able-bodied participants during running [51].
In M5, the slopes were calculated between HC and FLG1, expressed in % BW over time, expressed in % GC, as described by Frossard et al. (2009), while characterizing the loading profile with transfemoral bone-anchored prosthesis during walking with aids and falls [40,45].
Purposely designed for this study, M6 relied on a progressive loading gradient-based automated extraction method. The slopes were calculated between two points on FLG occurring when the instantaneous slopes (Si) were superior and inferior to 15% of the maximum gradient between HC and FLG1, respectively. Si was calculated as the numerical first derivative of the FLG expressed in % BW with respect to time expressed in % GC.

4.4. Analysis

The efficacy of a given method (Mi) was reported using the average and one standard deviation of all slopes detected for the three participants combined. M1 was considered as the gold standard. Automated methods were compared against M1 using the average and 95% confidence interval (CI) of the difference and are represented in a Bland–Altman plot. A positive or negative difference indicated that the slope detected automatically was flatter or steeper than M1, respectively. The automated method combining the lower absolute average and range of 95% CI difference was deemed the most accurate and precise.

5. Conclusions

This study provided critical technical information to report the efficacy of several methods of extraction of vertical loading rate for the first time. Indeed, an attempt to outline a worthwhile automated method relying on progressive loading gradient-based detection of points of calculation was shared.
This study should be considered as a stepping-stone in the broad developments of automated characterization of prosthetic loading profiles of individuals with lower limb amputation. More particularly, this study could facilitate analysis of large ecological kinetic datasets obtained during rehabilitation and beyond. We will argue that extraction of loading rate as suggested could be used by prosthetic care providers to guide prosthetic adjustments aiming at maintaining residuum health including choices, fitting and alignment of components. In return, the knowledge of loading rate following these interventions could assist rehabilitation specialists in making a differential diagnosis of the most common issues compromising the residuum health, such as skin damage, muscle contracture or heterotopic bone growth.
Altogether, this work contributes to the on-going efforts made by all providers of rehabilitation and prosthetic care to generate ever better evidence informing reflective clinical decision-making.

Author Contributions

Conceptualization, L.F., M.W.M.J., I.S. and C.L.; methodology, L.F. and M.W.M.J.; software, M.W.M.J.; validation, L.F. and M.W.M.J.; project administration, L.F.; supervision, L.F. and C.L.; resources, L.F., M.W.M.J. and I.S.; funding, L.F., I.S., P.A.L., M.S. and C.L.; writing – original draft, L.F., M.W.M.J.; writing – review and editing, L.F., M.W.M.J., I.S., P.A.L., M.S. and C.L.

Funding

This work was supported by the Office of the Assistant Secretary of Defense for Health Affairs, through the Orthotics and Prosthetics Outcomes Research Program—Prosthetics Outcomes Research Award under Award No. W81XWH-16-1-0475. Opinions, interpretations, conclusions and recommendations are those of the authors and are not necessarily endorsed by the Department of Defense.

Acknowledgments

The authors would like to acknowledge the contribution of Scott Wearing to the development of the study design. The authors would also like to credit Alex Bek and Sally Cavenett for authorizing the use of the photos inserted in Figure 1.

Conflicts of Interest

The authors declare no conflicts of interest.

Abbreviations

%GCUnit of time expressed in percentage of gait cycle
%BWUnit of vertical force (FLG) expressed in percentage of body weight
CIConfidence interval
FLGForce applied on the long axis of the leg
FLG1First loading peak during the first half of the support phase
GCGait cycle
HCHeel contact
MaSlope selected by expert a
MbSlope selected by expert b
MiMethod i (M1–M6) of automated detection of vertical loading rate
SVertical loading slope
SiInstantaneous vertical loading slope
TOToe-off

References

  1. Portnoy, S.; Yizhar, Z.; Shabshin, N.; Itzchak, Y.; Kristal, A.; Dotan-Marom, Y.; Siev-Ner, I.; Gefen, A. Internal mechanical conditions in the soft tissues of a residual limb of a trans-tibial amputee. J. Biomech. 2008, 41, 1897–1909. [Google Scholar] [CrossRef] [PubMed]
  2. Sartori, M.; Llyod, D.G.; Farina, D. Neural data-driven musculoskeletal modeling for personalized neurorehabilitation technologies. IEEE Trans. Biomed. Eng. 2016, 63, 879–893. [Google Scholar] [CrossRef] [PubMed]
  3. Besier, T.F.; Fredericson, M.; Gold, G.E.; Beaupre, G.S.; Delp, S.L. Knee muscle forces during walking and running in patellofemoral pain patients and pain-free controls. J. Biomech. 2009, 42, 898–905. [Google Scholar] [CrossRef] [PubMed] [Green Version]
  4. Pather, S.; Vertriest, S.; Sondergeld, P.; Ramis, M.A.; Frossard, L. Load characteristics following transfemoral amputation in individuals fitted with bone-anchored prostheses: A scoping review protocol. JBI Database System. Rev. Implement. Rep. 2018, 16, 1286–1310. [Google Scholar] [CrossRef] [PubMed]
  5. Fernandez, J.; Zhang, J.; Heidlauf, T.; Sartori, M.; Besier, T.; Röhrle, O.; Lloyd, D. Multiscale musculoskeletal modelling, data–model fusion and electromyography-informed modelling. Interface Focus 2016, 6. [Google Scholar] [CrossRef]
  6. Sooriakumaran, S.; Uden, M.; Mulroy, S.; Ewins, D.; Collins, T. The impact a surgeon has on primary amputee prosthetic rehabilitation: A survey of residual lower limb quality. Prosthet. Orthot. Int. 2018, 42, 428–436. [Google Scholar] [CrossRef]
  7. Besier, T.F.; Draper, C.E.; Gold, G.E.; Beaupre, G.S.; Delp, S.L. Patellofemoral joint contact area increases with knee flexion and weight-bearing. J. Orthop. Res. 2005, 23, 345–350. [Google Scholar] [CrossRef]
  8. Besier, T.F.; Gold, G.E.; Delp, S.L.; Fredericson, M.; Beaupre, G.S. The influence of femoral internal and external rotation on cartilage stresses within the patellofemoral joint. J. Orthop. Res. 2008, 26, 1627–1635. [Google Scholar] [CrossRef] [Green Version]
  9. Boone, D.A.; Kobayashi, T.; Chou, T.G.; Arabian, A.K.; Coleman, K.L.; Orendurff, M.S.; Zhang, M. Influence of malalignment on socket reaction moments during gait in amputees with transtibial prostheses. Gait Posture 2013, 37, 620–626. [Google Scholar] [CrossRef]
  10. Kobayashi, T.; Arabian, A.K.; Orendurff, M.S.; Rosenbaum-Chou, T.G.; Boone, D.A. Effect of alignment changes on socket reaction moments while walking in transtibial prostheses with energy storage and return feet. Clin. Biomech. (Bristol Avon) 2014, 29, 47–56. [Google Scholar] [CrossRef]
  11. Kobayashi, T.; Orendurff, M.S.; Zhang, M.; Boone, D.A. Individual responses to alignment perturbations in socket reaction moments while walking in transtibial prostheses. Clin. Biomech. (Bristol Avon) 2014, 29, 590–594. [Google Scholar] [CrossRef] [PubMed]
  12. Kobayashi, T.; Orendurff, M.S.; Arabian, A.K.; Rosenbaum-Chou, T.G.; Boone, D.A. Effect of prosthetic alignment changes on socket reaction moment impulse during walking in transtibial amputees. J. Biomech. 2014, 47, 1315–1323. [Google Scholar] [CrossRef] [PubMed]
  13. Kobayashi, T.; Orendurff, M.S.; Zhang, M.; Boone, D.A. Socket reaction moments in transtibial prostheses during walking at clinically perceived optimal alignment. Prosthet. Orthot. Int. 2015, 40, 503–508. [Google Scholar] [CrossRef] [PubMed] [Green Version]
  14. Paterno, L.; Ibrahimi, M.; Gruppioni, E.; Menciassi, A.; Ricotti, L. Sockets for limb prostheses: A review of existing technologies and open challenges. IEEE Trans. Biomed. Eng. 2018, 65, 1996–2010. [Google Scholar] [CrossRef] [PubMed]
  15. Vertriest, S.; Pather, S.; Sondergeld, P.; Frossard, L. Rehabilitation programs after the implantation of transfemoral osseointegrated fixations for bone-anchored prostheses: A scoping review protocol. JBI Database System. Rev. Implement. Rep. 2017, 15, 1–13. [Google Scholar] [CrossRef] [PubMed]
  16. Vertriest, S.; Coorevits, P.; Hagberg, K.; Branemark, R.; Haggstrom, E.E.; Vanderstraeten, G.; Frossard, L.A. Static load bearing exercises of individuals with transfemoral amputation fitted with an osseointegrated implant: Loading compliance. Prosthet. Orthot. Int. 2017, 41, 393–401. [Google Scholar] [CrossRef]
  17. Vertriest, S.; Coorevits, P.; Hagberg, K.; Branemark, R.; Haggstrom, E.; Vanderstraeten, G.; Frossard, L. Static load bearing exercises of individuals with transfemoral amputation fitted with an osseointegrated implant: Reliability of kinetic data. IEEE Trans. Neural Syst. Rehabil. Eng. 2015, 23, 423–430. [Google Scholar] [CrossRef]
  18. Frossard, L.; Cheze, L.; Dumas, R. Dynamic input to determine hip joint moments, power and work on the prosthetic limb of transfemoral amputees: Ground reaction vs knee reaction. Prosthet. Orthot. Int. 2011, 35, 140–149. [Google Scholar] [CrossRef]
  19. Dumas, R.; Branemark, R.; Frossard, L. Gait analysis of transfemoral amputees: Errors in inverse dynamics are substantial and depend on prosthetic design. IEEE Trans. Neural Syst. Rehabil. Eng. 2017, 25, 679–685. [Google Scholar] [CrossRef]
  20. Dumas, R.; Cheze, L.; Frossard, L. Loading applied on prosthetic knee of transfemoral amputee: Comparison of inverse dynamics and direct measurements. Gait Posture 2009, 30, 560–562. [Google Scholar] [CrossRef] [Green Version]
  21. Neumann, E.; Frossard, L.; Ramos, M.; Bidwell, K. Prosthesis: Load cell applicability to outcome measurement—Chapter 6. In Advances in Medicine and Biology; Berhardt, L.V., Ed.; Nova Science Publishers: New York, NY, USA, 2017; pp. 133–172. [Google Scholar]
  22. Stephenson, P.; Seedhom, B.B. Estimation of forces at the interface between an artificial limb and an implant directly fixed into the femur in above-knee amputees. J. Orthop. Sci. 2002, 7, 192–297. [Google Scholar] [CrossRef] [PubMed]
  23. Dumas, R.; Cheze, L.; Frossard, L. Load during prosthetic gait: Is direct measurement better than inverse dynamics? Gait Posture 2009, 30, S86–S87. [Google Scholar] [CrossRef] [Green Version]
  24. Koehler, S.R.; Dhaher, Y.Y.; Hansen, A.H. Cross-validation of a portable, six-degree-of-freedom load cell for use in lower-limb prosthetics research. J. Biomech. 2014, 47, 1542–1547. [Google Scholar] [CrossRef] [PubMed]
  25. Thesleff, A.; Ludvigsson, S.; Ohr, E.; Ortiz-Catalan, M. Load exposure of osseointegrated implants for transfemoral limb prosthesis during running. Conf. Proc. IEEE Eng. Med. Biol. Soc. 2018, 1743–1746. [Google Scholar] [CrossRef]
  26. Frossard, L.; Stevenson, N.; Sullivan, J.; Uden, M.; Pearcy, M. Categorization of activities of daily living of lower limb amputees during short-term use of a portable kinetic recording system: A preliminary study. J. Prosthet. Orthot. 2011, 23, 2–11. [Google Scholar] [CrossRef]
  27. Frossard, L.; Stevenson, N.; Smeathers, J.; Haggstrom, E.; Hagberg, K.; Sullivan, J.; Ewins, D.; Lee Gow, D.; Gray, S.; Branemark, R. Monitoring of the load regime applied on the osseointegrated fixation of a trans-femoral amputee: A tool for evidence-based practice. Prosthet. Orthot. Int. 2008, 32, 68–78. [Google Scholar] [CrossRef]
  28. Futamure, S.; Bonnet, V.; Dumas, R.; Venture, G. A sensitivity analysis method for the body segment inertial parameters based on ground reaction and joint moment regressor matrices. J. Biomech. 2017, 64, 85–92. [Google Scholar] [CrossRef]
  29. Narang, Y.S.; Arelekatti, V.N.; Winter, A.G. The effects of prosthesis inertial properties on prosthetic knee moment and hip energetics required to achieve able-bodied kinematics. IEEE Trans. Neural Syst. Rehabil. Eng. 2016, 24, 754–763. [Google Scholar] [CrossRef]
  30. Chia Bejarano, N.; Ambrosini, E.; Pedrocchi, A.; Ferrigno, G.; Monticone, M.; Ferrante, S. A novel adaptive, real-time algorithm to detect gait events from wearable sensors. IEEE Trans. Neural Syst. Rehabil. Eng. 2015, 23, 413–422. [Google Scholar] [CrossRef]
  31. Crea, S.; Cipriani, C.; Donati, M.; Carrozza, M.C.; Vitiello, N. Providing time-discrete gait information by wearable feedback apparatus for lower-limb amputees: Usability and functional validation. IEEE Trans. Neural Syst. Rehabil. Eng. 2015, 23, 250–257. [Google Scholar] [CrossRef]
  32. Khandelwal, S.; Wickstrom, N. Gait event detection in real-world environment for long-term applications: incorporating domain knowledge into time-frequency analysis. IEEE Trans. Neural Syst. Rehabil. Eng. 2016, 24, 1363–1372. [Google Scholar] [CrossRef] [PubMed]
  33. Maqbool, H.F.; Husman, M.A.B.; Awad, M.I.; Abouhossein, A.; Iqbal, N.; Dehghani-Sanij, A.A. A real-time gait event detection for lower limb prosthesis control and evaluation. IEEE Trans. Neural Syst. Rehabil. Eng. 2017, 25, 1500–1509. [Google Scholar] [CrossRef] [PubMed]
  34. Zhang, F.; D’Andrea, S.E.; Nunnery, M.J.; Kay, S.M.; Huang, H. Towards design of a stumble detection system for artificial legs. IEEE Trans. Neural Syst. Rehabil. Eng. 2011, 19, 567–577. [Google Scholar] [CrossRef] [PubMed]
  35. Frossard, L.; Beck, J.; Dillon, M.; Chappell, M.; Evans, J.H. Development and preliminary testing of a device for the direct measurement of forces and moments in the prosthetic limb of transfemoral amputees during activities of daily living. J. Prosthet. Orthot. 2003, 15, 135–142. [Google Scholar] [CrossRef]
  36. Neumann, E.S.; Brink, J.; Yalamanchili, K.; Lee, J.S. Regression estimates of pressure on transtibial residual limbs using load cell measurements of the forces and moments occurring at the base of the socket. JPO J. Prosthet. Orthot. 2013, 25, 1–12. [Google Scholar] [CrossRef]
  37. Neumann, E.S.; Brink, J.; Yalamanchili, K.; Lee, J.S. Use of a load cell and force-moment analysis to examine transtibial prosthesis foot rollover kinetics for anterior-posterior alignment perturbations. JPO J. Prosthet. Orthot. 2012, 24, 160–174. [Google Scholar] [CrossRef]
  38. Lee, W.; Frossard, L.; Hagberg, K.; Haggstrom, E.; Brånemark, R. Kinetics analysis of transfemoral amputees fitted with osseointegrated fixation performing common activities of daily living. Clin. Biomech. 2007, 22, 665–673. [Google Scholar] [CrossRef]
  39. Lee, W.; Frossard, L.; Hagberg, K.; Haggstrom, E.; Lee Gow, D.; Gray, S.; Branemark, R. Magnitude and variability of loading on the osseointegrated implant of transfemoral amputees during walking. Med. Eng. Phys. 2008, 30, 825–833. [Google Scholar] [CrossRef] [Green Version]
  40. Frossard, L.; Hagberg, K.; Haggstrom, E.; Branemark, R. Load-relief of walking aids on osseointegrated fixation: Instrument for evidence-based practice. IEEE Trans. Neural Syst. Rehabil. Eng. 2009, 17, 9–14. [Google Scholar] [CrossRef]
  41. Frossard, L.; Tranberg, R.; Haggstrom, E.; Pearcy, M.; Branemark, R. Fall of a transfemoral amputee fitted with osseointegrated fixation: Loading impact on residuum. Gait Posture 2009, 30, S151–S152. [Google Scholar] [CrossRef] [Green Version]
  42. Frossard, L.; Gow, D.L.; Hagberg, K.; Cairns, N.; Contoyannis, B.; Gray, S.; Branemark, R.; Pearcy, M. Apparatus for monitoring load bearing rehabilitation exercises of a transfemoral amputee fitted with an osseointegrated fixation: A proof-of-concept study. Gait Posture 2010, 31, 223–228. [Google Scholar] [CrossRef] [PubMed] [Green Version]
  43. Frossard, L.; Hagberg, K.; Häggström, E.; Gow, D.L.; Brånemark, R.; Pearcy, M. Functional outcome of transfemoral amputees fitted with an osseointegrated fixation: Temporal gait characteristics. J. Prosthet. Orthot. 2010, 22, 11–20. [Google Scholar] [CrossRef]
  44. Frossard, L.A. Load on osseointegrated fixation of a transfemoral amputee during a fall: Determination of the time and duration of descent. Prosthet. Orthot. Int. 2010, 34, 472–487. [Google Scholar] [CrossRef] [PubMed]
  45. Frossard, L.A.; Tranberg, R.; Haggstrom, E.; Pearcy, M.; Branemark, R. Load on osseointegrated fixation of a transfemoral amputee during a fall: Loading, descent, impact and recovery analysis. Prosthet. Orthot. Int. 2010, 34, 85–97. [Google Scholar] [CrossRef] [PubMed]
  46. Frossard, L.; Haggstrom, E.; Hagberg, K.; Branemark, P. Load applied on a bone-anchored transfemoral prosthesis: Characterisation of prosthetic components—A case study. J. Rehabil. Res. Dev. 2013, 50, 619–634. [Google Scholar] [CrossRef]
  47. Neumann, E.S.; Yalamanchili, K.; Brink, J.; Lee, J.S. Transducer-based comparisons of the prosthetic feet used by transtibial amputees for different walking activities: A pilot study. Prosthet. Orthot. Int. 2012, 36, 203–216. [Google Scholar] [CrossRef] [PubMed]
  48. Lee, W.C.; Doocey, J.M.; Branemark, R.; Adam, C.J.; Evans, J.H.; Pearcy, M.J.; Frossard, L.A. FE stress analysis of the interface between the bone and an osseointegrated implant for amputees--implications to refine the rehabilitation program. Clin. Biomech. (Bristol Avon) 2008, 23, 1243–1250. [Google Scholar] [CrossRef]
  49. Helgason, B.; Palsson, H.; Runarsson, T.P.; Frossard, L.; Viceconti, M. Risk of failure during gait for direct skeletal attachment of a femoral prosthesis: A finite element study. Med. Eng. Phys. 2009, 31, 595–600. [Google Scholar] [CrossRef] [Green Version]
  50. Frossard, L. Loading characteristics data applied on osseointegrated implant by transfemoral bone-anchored prostheses fitted with basic components during daily activities. Data Br. 2019, 26, 104492. [Google Scholar] [CrossRef]
  51. Lieberman, D.E.; Venkadesan, M.; Werbel, W.A.; Dauod, A.I.; D’Andrea, S.; Davis, I.S.; Mang’Eni, R.O.; Pitsiladis, Y. Foot strike patterns and collison forces in habitually barefoot versus shod runners. Nature 2010, 463, 531–535. [Google Scholar] [CrossRef]
  52. Revill, A.L.; Perry, S.D.; Michelle Edwards, A.; Dickey, J.P. Variability of the impact transient during repeated barefoot walking trials. J. Biomech. 2008, 41, 926–930. [Google Scholar] [CrossRef] [PubMed]
  53. Williams III, D.S.; McClay, I.S.; Manal, K.T. Lower extremity mechanics in runners with a converted forefoot strike pattern. J. Appl. Biomech. 2000, 16, 210–218. [Google Scholar] [CrossRef]
  54. An, W.; Rainbow, M.J.; Cheung, R.T. Effects of surface inclination on the vertical loading rates and landing pattern during the first attempt of barefoot running in habitual shod runners. Biomed. Res. Int. 2015, 2015, 240153. [Google Scholar] [CrossRef] [PubMed]
  55. Orendurff, M.S. Literature review of published research investigating microprocessor-controlled prosthetic knees: 2010–2012. JPO J. Prosthet. Orthot. 2013, 25, P41–P46. [Google Scholar] [CrossRef]
  56. Copay, A.G.; Subach, B.R.; Glassman, S.D.; Polly, D.W., Jr.; Schuler, T.C. Understanding the minimum clinically important difference: A review of concepts and methods. Spine J. 2007, 7, 541–546. [Google Scholar] [CrossRef]
  57. Hansen, M.; Haugland, M.K.; Sinkjaer, T. Evaluating robustness of gait event detection based on machine learning and natural sensors. IEEE Trans. Neural Syst. Rehabil. Eng. 2004, 12, 81–88. [Google Scholar] [CrossRef]
  58. Pitkin, M.; Cassidy, C.; Muppavarapu, R.; Edell, D. Recording of electric signal passage trough a pylon in direct skeletal attachment of leg prostheses. IEEE Trans. Biomed. Eng. 2012, 59, 1349–1353. [Google Scholar] [CrossRef]
  59. Douglas, T.; Solomonidis, S.; Sandham, W.; Spence, W. Ultrasound imaging in lower limb prosthetics. IEEE Trans. Neural Syst. Rehabil. Eng. 2002, 10, 11–21. [Google Scholar] [CrossRef]
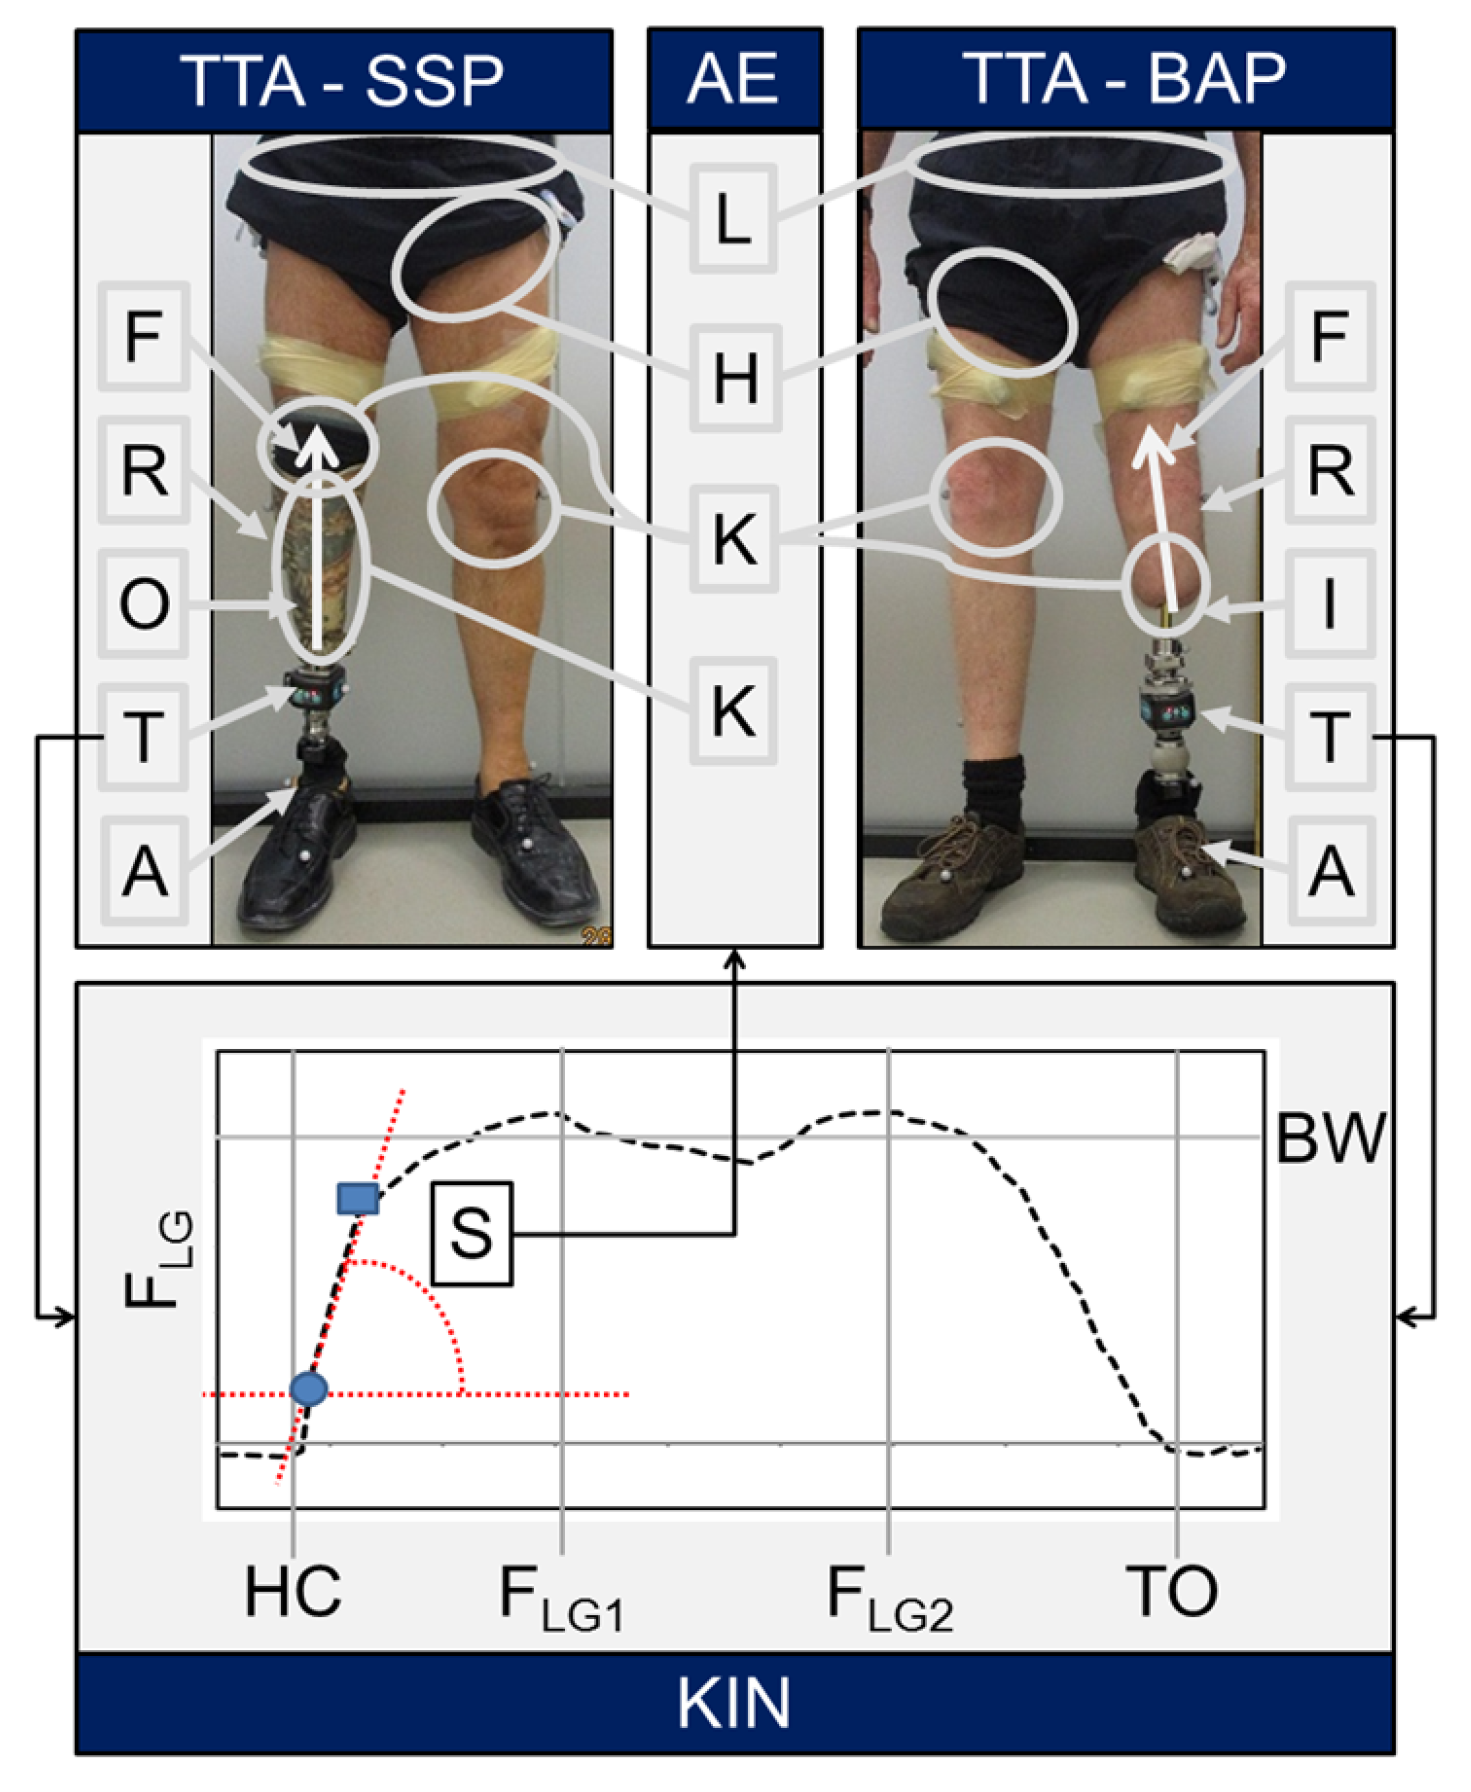
Figure 1. Overview of potential link between ankle units (A) affecting the long axis (F) of the residuum (R) of individuals with transtibial amputation (TTA) fitted with either a socket (O) suspended-prosthesis (SSP) or a bone-anchored prosthesis (BAP) through an osseointegrated implant (I), kinetic data (KIN) including the slope of vertical loading rate (S) of quasi-linear section of the force applied on the long axis (FLG) of the residuum, measured directly by transducer (T) that occurred between heel contact (HC) and first loading peak (FLG1) during the first half of the support phase, and adverse events (AE) including skin damage of residuum and musculoskeletal injuries of low back (L) and hips (H) and knees (K). TO: Toe-off, BW: body weight.
Prosthesis 01 00004 g001
Figure 2. Mean and standard deviation of force applied on the long axis of the leg (FLG) as well as mean onset and magnitude of FLG1 and FLG2 measured by transducer for 150 gait cycles. %BW: percentage of the body weight.
Prosthesis 01 00004 g002
Figure 3. Mean and standard deviation of slopes of vertical loading rates generated with each of the six methods of detection (M1–M6) (a), as well as 150 slopes, mean and 95% confidence intervals of difference between M1, considered as the gold standard, and M2 (b), M3 (c), M4 (d), M5 (e) and M6 (f) represented by solid and dashed lines, respectively.
Prosthesis 01 00004 g003
Figure 4. Criterion for automated detection of the slope of the vertical loading rate (S) during the first half of the support phase for each of the six methods compared, including three automated methods relying on criterion presented in the literature (M2, M3, M4) and two original methods (M5, M6). Application to prosthetic gait indicates if the method has been applied to individuals with lower limb amputation (Yes) or able-bodied participants (No).
Prosthesis 01 00004 g004