Abstract
This paper aims to address the possibility of parametric resonance effects in microtubules via tryptophan qubits, using the Hamiltonian of the cavity quantum electrodynamics (QED) model involving photons in a waveguide and the surrounding environment. The time evolution equations for qubits and photons are derived using the input–output formulation. Input signals with a 560 nm wavelength are amplified by Rabi oscillations for tryptophan qubits in excited states. Here, the qubits organized in multiple layers are all in excited states. When an appropriate decay to the environment occurs as internal loss, which is prepared in multiple layers, we find binary patterns of the parametric amplification of input signals and the reduction of output signals. This property might help us to understand the information processing of optical signals by filtering them with the use of tryptophan residues in microtubules and diffused nonlocal processing spreading over the whole brain in the form of holograms.
1. Introduction
Issues of the language used by the human brain to process and integrate diffused information [1] are often referred to as the binding problem [2] and still remain open questions. Lashley’s experiments suggest that our memory is non-local and diffused throughout the brain [3]. Even if parts of the brain are damaged or injured, their functions, such as information processing, are compensated for by undamaged parts of the brain, which is called equipotentiality [4]. How such brain functions are lost depends on the extent and severity of the responsible lesions and the affected brain areas, which has been compared to the mass action principle [5]. Pribram proposed holography that records the interference patterns of two coherent optical waves on two-dimensional plates with a certain thickness as an explanation for the mechanisms of memory and perception in the human brain [1,6]. Even if parts of these holograms are lost, the entirety of the information is reconstructed, indicating the robustness of the brain against localized damage. When changing the angles of coherent waves, multiple memories are recorded on the same plates, allowing for huge memory capacity in the brain. More recently, Pribram’s holographic mechanism was developed further at the level of dipole oscillations of the neuronal membrane as the origin of the generation of electromagnetic fields [7]. Jibu and Yasue, who were Pribran’s collaborators, studied quantum brain dynamics, corresponding to quantum field theory for water dipoles and photons, based on the hypothesis of memory and using the spontaneous breakdown of symmetry representing the macroscopic order of aligned water dipoles maintained by long-range correlations via massless Nambu–Goldstone bosons, which had been originally proposed in the monumental works by Ricciardi, Umezawa, Stuart, and Takahashi [8,9,10,11]. Quantum field theory has been demonstrated to be applicable to biological systems consisting of matter and photons and, under specific conditions of nonlinear interactions and sufficient energy supply, may lead to spontaneous breakdown of symmetry [12], boson condensation [13], coherent domains [14], water dipole lasers [15], and Josephson junction effects [16]. McFedden emphasized that consciousness can be explained by invoking the presence of electromagnetic fields, which play a significant role in information transfer among several areas of the brain [17]. Preceding works suggest that photonic degrees of freedom can lead to a significant enhancement of information processing in the brain compared to either electric signaling via action potentials or biochemical interactions in terms of neurotransmitter molecules.
An experimental study performed by Albrecht-Buehler in fact indicates that the processing of electromagnetic signals occurs in living cells, in general, not only in neurons [18]. These electromagnetic interactions involve photon emission, most likely by mitochondria, and detection by centrosomes. It has also been reported that cells emit ultra-weak photons [19] as a byproduct of cellular metabolism. Furthermore, aromatic residues, particularly tryptophan, but also tyrosine and phenylalanine, have been shown by careful experimentation in tubulin and microtubules to absorb ultraviolet light, which causes these proteins to undergo electronic transitions [20]. After photoexcitation, electronic energy can diffuse over 6.6 nm in microtubules [21], suggesting that microtubules are effectively light harvesters. The excitation lifetimes have been estimated to range from 2 ns to 5 ns depending on the environmental conditions, including the presence of ligands binding to these proteins. These aromatic amino acids can absorb energetic photons in the UV range and can provide a source of diffused non-local -electrons involving interactions through the formation of transition dipoles on photoexcitation [22]. Incidentally, circadian clock activity depends on tryptophan-mediated photoreduction [23].
Prior to these experimental investigations, the feasibility of coherent energy transfer in microtubules had been predicted based on computational models in [24], which suggested that thermal energy might assist quantum coherent transport. Super-radiant and sub-radiant states for tryptophans in microtubules were hypothesized to exist by Celardo et al. in 2019 [25], where super-radiant states represent cooperative states with fast decay rates, whose intensity scales with the number of tryptophans, while sub-radiant states involve slow decay rates but also very low intensities of re-emitted photons. Shirmovsky has suggested that entangled state formation occurs for tryptophans consisting of a double ring representing a six-carbon ring and a five ring with one nitrogen involving the greatest electron resonance in microtubules [26]. The quantum entanglement distribution of cellular microtubules and a quantum teleportation protocol have also been investigated in [27]. Tryptophan mega-networks and hierarchically organized tubulin structures have been recently proposed by Babcock et al. in [28]. In order to model photon dynamics in microtubules, we can derive solutions for super-radiant photon emissions in these protein polymers [25,29,30,31,32,33]. The coherent emission of photons can directly lead to holographic interference patterns around brain microtubules with two optical signals, consisting of a reference wave and an object wave, producing an image under appropriate conditions [1,6,32,34]. It is, therefore, natural to seek a physical mechanism whereby local information processed by neuronal microtubules could be converted into diffused nonlocal information contained in holographic images that would be produced in the human brain.
Our aim in this paper is to provide solutions for parametric resonance effects produced by layers of tryptophan qubits in microtubules as an optical information processing mechanism, which is routinely generated in holography but is here applied to the human brain according to the scheme shown in Figure 1. We can assume that input signals are irradiated to tryptophan qubits in microtubules in either parallel or perpendicular directions, where qubits play the role of filters of optical signals. Parametric resonance in classical mechanics [35] represents the rapidly increasing displacement x from the rest point for oscillators with small displacements induced by periodically changing frequency . Parametric resonance produces the strongest effect if the frequency evolves at twice the natural oscillator frequency , such as in with . We adopt here a cavity quantum electrodynamics model coupled with a waveguide and the environment and investigate a parametric resonance mechanism for photon fields interacting with tryptophan qubits in microtubules. In several theoretical approaches, the photon degrees of freedom have been represented in terms of off-diagonal elements of tryptophan states with dipole–dipole interaction between tryptophan quantum states , such as the term . Unfortunately, some of the dynamical properties of photon waves might be overlooked in such approaches, which could lead to incomplete parametric resonance solutions. Since the wavelength corresponding to the energy difference between the excited state and the ground state is 280 nm, the photon coherent waves with wavelength 560 nm can be amplified. We find that if all qubits are in the excited state , the corresponding output signals are amplified in a parametric resonance situation, while the output signals become suppressed if all of the corresponding qubits are in the ground state for multiple tryptophan layers. We propose to use these qubits as filters of optical signals, where qubits in the excited state amplify the input optical signals, and output signals act as an information processing mechanism carried out by microtubules. In the case in which the input signals are filtered, we can discuss diffused nonlocal information in terms of binary holograms, where information is encoded as optical signals [1,6,32,34].
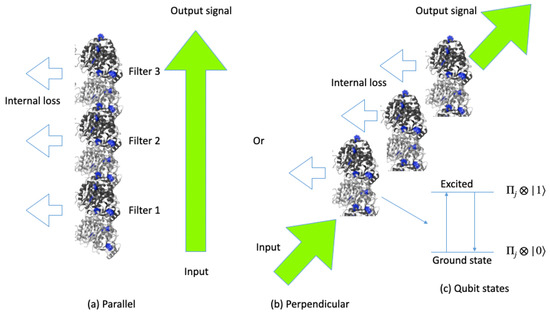
Figure 1.
Input and output signals passing through tryptophan qubits in (a) parallel and (b) perpendicular directions. Tryptophans in tubulins depicted in blue color involve all excited or ground states in (c).
This paper is organized as follows. In Section 2, we provide a cavity QED model for parametric resonance. In Section 3, we present numerical results in the case of parametric amplification for photon coherent waves. In Section 4, we discuss our results. In Section 5, we provide concluding remarks. In this paper, we adopt the natural unit where the speed of light, c, and the Planck constant, ℏ, are both set to unity.
2. Parametric Resonance Model
In this section, we construct our model Hamiltonian for the tryptophan–photon system in microtubules. We describe tryptophans in microtubules as qubits coupled with photons as cavity modes involving energy dissipation to the waveguide and the surrounding environment.
We begin with the Hamiltonian with N qubits, where we refer to [36,37], as
where represents the energy difference between an excited state and the ground state for qubits in the two-energy-level approximation, and represents the energy of the cavity mode. The first term in Equation (1) represents the contribution of qubits, the second term represents that of the cavity, and the third term represents the interaction between qubits and the cavity mode, with representing the coupling constant. The fourth term represents the energy contribution of the photons with energy mode k in the waveguide and the interaction between the cavity mode and the photons with mode k, with representing the decay rate by external loss to the waveguide, while the fifth term represents the energy contribution of the photons in the environment and the interaction between the cavity mode and the photons with mode k, with representing the decay rate by internal loss to the environment. We have referred to the Hamiltonian of the cavity QED coupled with the waveguide [37,38] and added the third term in Equation (1) as the interaction between qubits and the cavity. Here, we adopt
in the time-independent case and the creation and annihilation operators for the cavity mode with energy by and a, respectively. We specify those in photon modes k in the waveguide by and and those in photon modes k in the environment by and . Here, we find and . The integration in is set to be from to .
The commutation relations for these operators are given as
and the commutation relations between any two creation operators and between any two annihilation operators are zero.
Using the Heisenberg equation, we derive
Similarly, we can derive
For photons in the waveguide and the environment, we can derive
Here, we adopt an input–output formulation, introduced in [39]. Solving the time evolution Equations (11) and (12), we find the solution of as
and
Performing the inverse-Fourier transformation with gives
and we find the relation
where we introduce
Similarly, we find by Equation (14)
We then define as the output photons to the waveguide and as the input photons from the waveguide. For in Equation (16), we find
Regarding the Heisenberg equation for the cavity mode, we derive
Taking the expectation values for , , , and in Equations (8)–(10) and (23), we can derive relations
with and . We assume the existence of coherent states of photons—namely, we use using Equation (4) and if we prepare a coherent state as . The expectation values represent the position in the Bloch sphere, where the north pole represents the excited state and the south pole represents the ground state . In addition, using Equations (24)–(26), we find the conservation law as
Next, we verify the necessary conditions for parametric resonance solutions. The quantum state of a qubit at the initial time is given by
for arbitrary parameters and the jth qubit. Using the Hamiltonian in Equation (1), the quantum state approximately evolves according to
which induces Rabi oscillations. Taking the expectation value of for the jth qubit, we find
Using the above relation and Equation (23), we can derive
with ∗ representing the complex conjugate and . We set
and rewrite
Using the rotating-wave approximation and neglecting a nonresonant mode, namely
and its complex conjugate in Equations (33) and (34), we can derive
The matrix notation is introduced as
Considering the solution as , we need to investigate the solution of the relation
namely,
The solution is
The condition for represents
In the in-phase case of and for all qubits, we find the condition for parametric resonance as
Even in the case of , the condition for parametric resonance is satisfied by preparing an extremely large number of tryptophan qubits N. In addition, even if we prepare random with , due to , the condition for parametric resonance is
Finally, we extend our model to the hierarchy involving multiple layers of microtubules through which incident photons in waveguide propagate. This closely corresponds to the geometry of parallel bundles of microtubules in the axons and dendrites on neurons in the human brain. The corresponding time evolution equations are
with for layers of tryptophans of microtubules. Here, we use
for and
for , where we have used . We investigate .
3. Numerical Simulations for Filtering of Optical Signals
The initial conditions for qubits are set to be
with for all qubits, or
with for all qubits for and . We prepare tryptophan qubits for each layer. When we begin with the initial conditions in Equations (56) and (57) or (58) and (59), , and are independent of j for each layer. The initial conditions for photons are set to be
for , with qubits for each layer and .
We use =4.463 eV = 36,000 cm−1 to represent the energy difference between the excited state and the ground state , corresponding to the wavelength 280 nm. is set to be , representing the wavelength 560 nm. The chosen time step is . We set for the external loss to and that for the internal loss to . We set = 0.01, which means that with is comparable to . We set . We adopt the fourth-order Runge–Kutta method for time evolution. We adopt the energy supply using Equations (52) and (53).
In Figure 2, we show the time evolution of and for layer with the initial condition . begins at 1 and rapidly decreases at around t = 20 fs. When is around zero, the amplitude of the oscillations of approaches its maximum value 1, where qubits are near with . When approaches , the amplitude of the oscillations of approaches its minimum value 0. At , gradually increases, and then the peak is less than 1 at around . At around , rapidly decreases and approaches , and the amplitude of the oscillations of approaches 1 at . At , gradually increases, and its peak is around . The maximum values of the peaks of gradually tend to decrease.
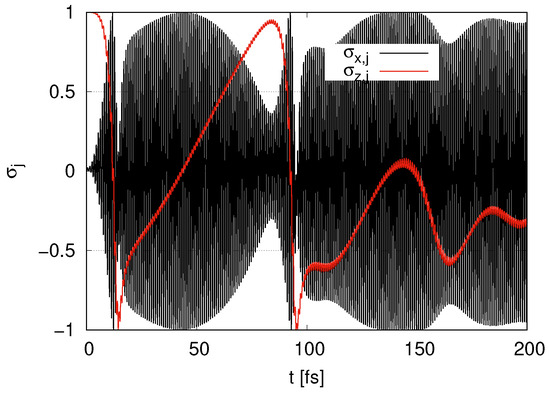
Figure 2.
Time evolution of and in the case of layer with .
In Figure 3, we depict the time evolution of for as an output signal or ‘out’ with an input signal as ‘in’ scaled by . At early times, namely when , the output signal is less than the input, where is still near 1, as shown in Figure 2. The output signal is rapidly amplified in Figure 3 at , where rapidly decreases in Figure 2. The output signal in Figure 3 decreases at , at which gradually increases in Figure 2. At , the amplitude of the oscillations of the output signal in Figure 3 increases, and then rapidly decreases in Figure 2. At , the amplitude of the output signal decreases, while the amplitude increases at , at which stops increasing temporarily in Figure 2. As gradually increases in Figure 2 at , the amplitude of the output signal gradually decreases. As decreases in Figure 2 at , the amplitude of the output signal increases. Although the amplitude of the output signal exceeds the input at , it is less than the amplitudes at and . The amplitude of the output signal decreases at and approaches zero, as gradually increases. During time evolution, the frequency of the output signal corresponds to that of the input signal, namely . We find that, as decreases (and increases), the amplitude of the output signal increases (and decreases).
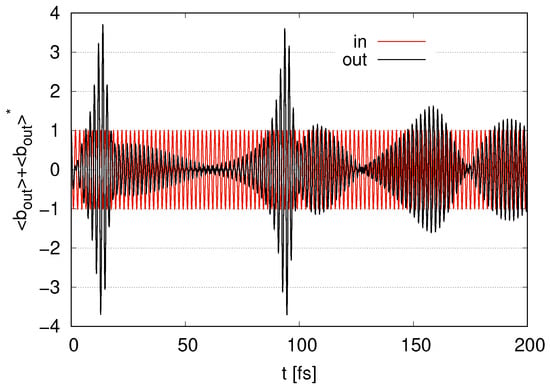
Figure 3.
Time evolution of represented as an output signal with represented as ‘in’ scaled by in the case of layer with .
In Figure 4, we show the time evolution of in the case of layer with . begins with and gradually increases at . We find that oscillates and its amplitudes take the maximum value 1 around . rapidly decreases at . At , tends to increase with oscillation, but its increase is moderate. As approaches 0, the amplitudes of the oscillations of approach 1. keeps oscillating at all times.
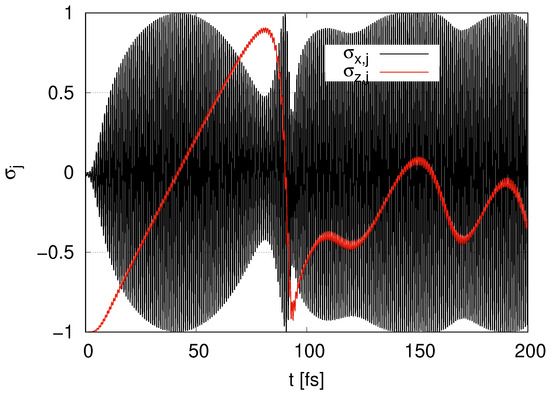
Figure 4.
Time evolution of and in the case of layer with .
In Figure 5, we depict the time evolution of in the case of layer as the output signal and scaled by . The output signal begins with zero and the maximum value of the amplitude gradually increases at , while the amplitude tends to decrease at . The amplitude gradually increases at and takes the maximum value at around , at which rapidly decreases, as shown in Figure 4. The amplitude rapidly decreases and approaches 0 in Figure 5 at , when rapidly increases from to in Figure 4. The amplitude gradually increases in Figure 5 at , at which moderately increases and decreases in Figure 4. The amplitude gradually decreases in Figure 5 at , at which we find that increases in Figure 4. The amplitude increases in Figure 5 at , at which takes the local maximum value and starts to decrease in Figure 4. While the amplitude shows continuous increasing and decreasing, its maximum value is in the first peak at around . We find that the amplitude of the output signal increases (and decreases) in Figure 5 as decreases (and increases) in Figure 4. We also find that the frequency of the output signal corresponds to for ‘in’.
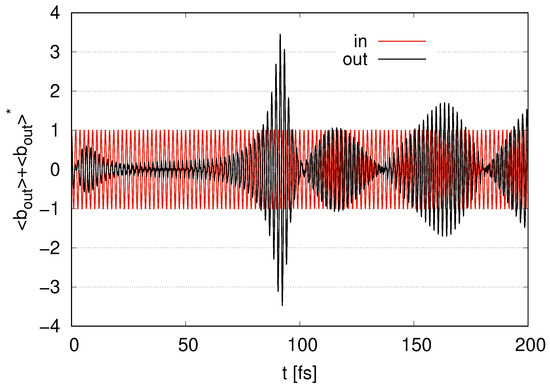
Figure 5.
Time evolution of represented as the output signal with represented as ‘in’ scaled by in the case of layer with .
We now change the frequency of the cavity mode from to and . Since we set the relation , the case of represents and the case of represents . The case of corresponds to . In Figure 6, we show the time evolution of the output signal in the two cases of and . In both cases, the amplitudes reach their maximum values at around . The maximum value in Figure 6 is smaller than the maximum value at in the case of in Figure 3. We find that as deviates from zero, the maximum value of the amplitude of the output signal decreases irrespective of the positive or negative . The amplitudes in the case of are slightly smaller than that in in Figure 6 at . The amplitudes gradually decrease at . The amplitudes in the case of are slightly larger than that in at . The frequency of the output signal in both cases and corresponds to , even if for the cavity mode deviates from , as we find that the time points of the peaks in oscillation in both cases and correspond to those for ‘in’ at .
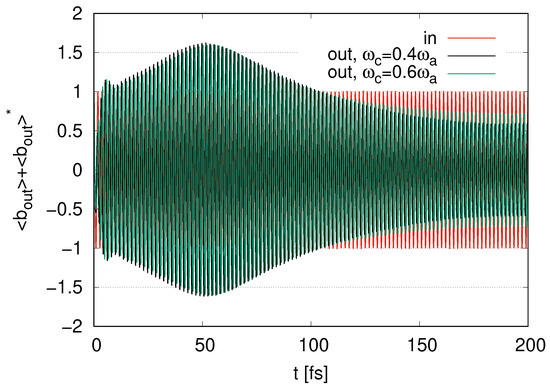
Figure 6.
Time evolution of represented as output signal for and with represented as ‘in’ scaled by in the case of layer with .
We now increase the number of layers. We set . In Figure 7, we show the time evolution of and in the case of layers with . The time evolution of and in the case of with is the same as that in Figure 2. At early times , remains at 1. At , rapidly decreases and approaches , while it rapidly increases and approaches 1 at , at which the amplitudes of the output signal in rapidly increase in Figure 3. The ‘in’ for the second layer is the output signal for the first layer. in Figure 7 rapidly decreases again at . in Figure 7 fluctuates around the minimum at since fluctuates around zero in Figure 3. in Figure 7 rapidly increases to at , at which point the amplitudes of rapidly increase and reach the peaks in Figure 3. in Figure 7 rapidly decreases and approaches at . starts increasing at around and ceases to increase at , at which point the amplitudes of decrease and increase in Figure 3. in Figure 7 increases again to at , at which point the amplitudes of attain peaks locally.
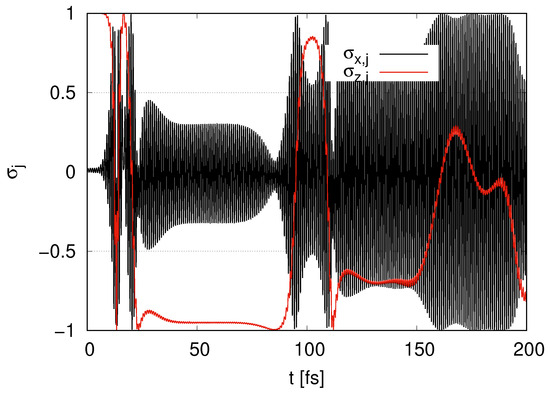
Figure 7.
Time evolution of and in the case of layers with .
In Figure 8, we show the time evolution of the output signal for the second layer (2l) (and the output signal for the first layer (1l), which is the same as that in Figure 3). We find the first peak for the amplitudes of the output signal (2l) in Figure 8 at around , at which point rapidly decreases in Figure 7. The amplitudes slightly decrease at around and reach the second peak at around , at which rapidly decreases again from 1 to in Figure 7. The second peak for (2l) is larger than the peak for . At , the output signal (2l) fluctuates around zero. We find a peak for the amplitudes (2l) in Figure 8 at , at which point rapidly decreases in Figure 7. We find several small peaks for the output signal (2l) in Figure 8 at , at which point is within the range of to in Figure 7. We find a decay in the peaks for (2l) compared with the peaks for (1l) since decreases rapidly after enters the second layer.
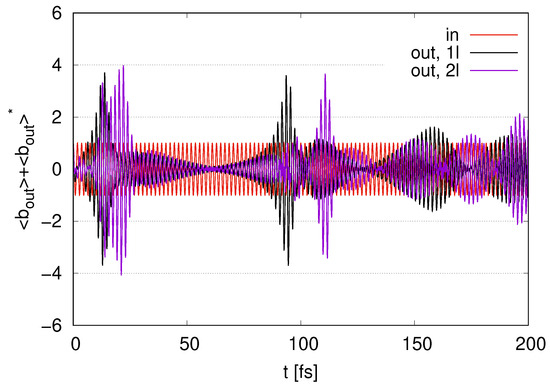
Figure 8.
Time evolution of represented as output signal with represented as ‘in’ scaled by in the case of (1l) and 2 layers (2l) with .
Next, we compare the cases with the number of layers ranging from to 5, represented by (1l) to (5l). In Figure 9, we show the time evolution of represented as the output signal for to 5 with . At , we find peaks for the output signals. As we increase , the number of modes tends to increase and then the maximum values tend to increase. We find a decay in the time points of the peaks since there are decays in signal transfer from the first to the th layer. At , we find several peaks in the output signals. We find that the decay in the time points of peaks increases as the number of increases. The maximum values for the peaks at are smaller than those at for each . In Figure A1 in Appendix A, we show the time evolution of . As the time points for decrease, the output signals show their peaks.
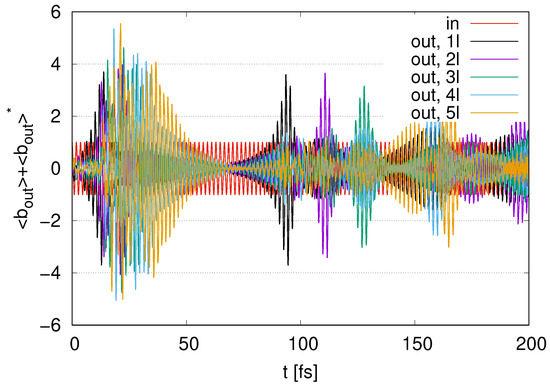
Figure 9.
Time evolution of represented as output signal with represented as ‘in’ scaled by in the cases of to 5 layers with .
In Figure 10, we show the time evolution of represented as an ‘out’ signal for to 5 with . We find a small increase in the amplitudes at around for these layers. After fluctuations at , we find peaks in the output signals for these layers. As we increase the number of layers , a decay in the time points of the peaks appears at . The amplitudes of these peaks tend to decrease as increases. At later times , several peaks still exist.
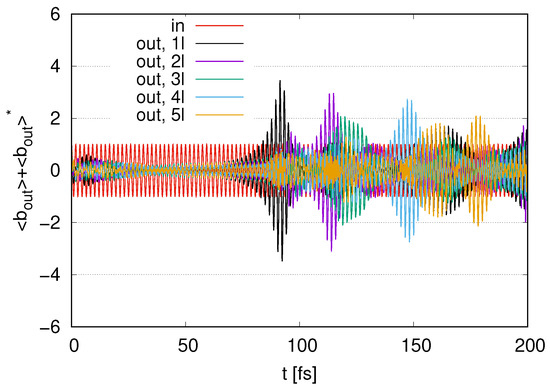
Figure 10.
Time evolution of represented as output signal with represented as ‘in’ scaled by in the case of to 5 layers with .
We next consider how the internal energy loss to the environment affects the results by changing from 0 to (with ) with a fixed for external loss. In Figure 11, we show the time evolution of the output signals in the cases of to 5 layers represented by (1l) to (5l) with and internal loss by . Comparing Figure 9 with Figure 11, the time evolution appears simpler in Figure 11. We find peaks in the amplitudes of the output signals in Figure 11 at . The maximum value in Figure 11 for (5l) is less than that in Figure 9. Fluctuations around zero appear at . Peaks in amplitudes also appear at around . As the number of layers increases, the amplitudes of the peaks decrease. We show the time evolution of in Figure A2 in Appendix A, where a time delay in the decrease for appears as increases and tends to remain at after the decrease as increases. As increases, the typical output signals in Figure 11 in the case of the initial conditions with appear only at early times .
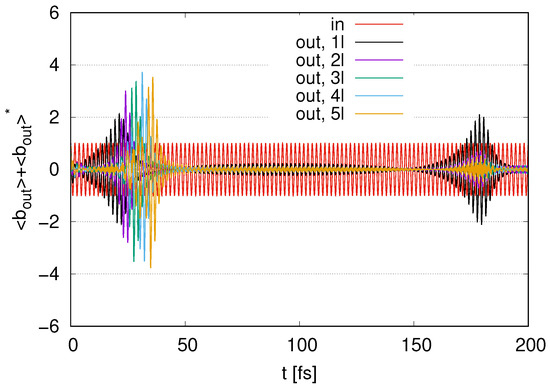
Figure 11.
Time evolution of represented as output signal with represented as ‘in’ scaled by in the case of to 5 layers with and internal loss by .
In Figure 12, we show the time evolution of the output signals for to 5 layers with and internal loss . We find fluctuations around zero at . The amplitudes of these fluctuations decrease as the number of layers increases. We find peaks in the amplitudes for the output signals at around . As the number of layers increases, the maximum values of the amplitudes decrease in the case of with , representing smaller output signals for larger . The amplitudes of the output signals in at around are larger than the input signal amplitudes, even for a nonzero . Meanwhile, in , represented by (5l), the amplitudes of the output signals are smaller than those for the input signal at all times. While an increase in the output signal in appears in Figure 11, the increase in the output signal in is suppressed in Figure 12 at all times by an internal energy loss with nonzero .
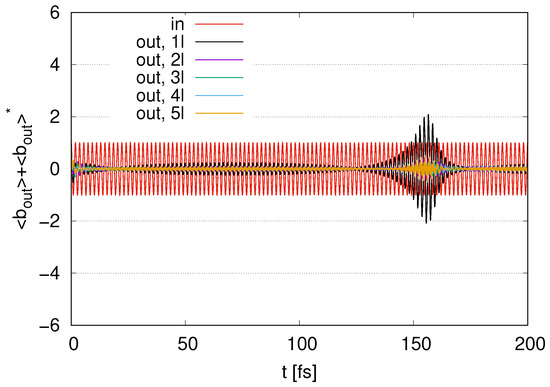
Figure 12.
Time evolution of represented as the output signal with represented as ‘in’ scaled by in the case of to 5 layers with and internal loss by .
In all of our numerical simulations, the deviation from 1 in is less than ; hence, probability conservation is achieved.
4. Discussion
In this paper, we have introduced the cavity QED model coupled with a waveguide and the environment. Our model system consists of tryptophan residues as qubits in microtubules and cavity modes coupled with input and output signals. Microtubules in neurons are arranged in parallel bundles interconnected by microtubule-associated proteins (MAPs). Each microtubule is typically composed of 13 protofilaments, and its building blocks are tubulin heterodimers. These tubulin dimers have eight tryptophan residues that can be photoexcited. Assuming the lengths of neuronal microtubules to be 10 microns, with tubulin dimers being 8 nm long, we can estimate the number of qubits to exceed 150,000. Depending on the length of the average neuron, there could be thousands of microtubules in its axon, dendrites, and soma, leading to hundreds of millions of qubit tryptophans, envisaged here as quantum information processors. Finally, the human brain has in the order of 100 billion neurons, connected, on average, by 10,000 synapses. These massive numbers of densely interconnected systems, capable of quantum computing, exceed the computing power of any man-made technological device available today. Our paper presents a physical framework for the modeling of the basic computational unit within the brain’s complex hierarchy of qubits.
The Hamiltonian proposed for this purpose in our paper involves the term , which might originate from the term with matter fields and vector potential fields , with with an elementary charge e and particle mass m for spacetime points x in quantum electrodynamics. We have solved Heisenberg’s equations for , for qubits, annihilation operator a, creation operator for the cavity mode, and creation and annihilation operators for photons in the waveguide and the environment, and we have derived time evolution equations for the expectation values of these operators. Using the input–output formulation, we have derived time evolution equations for the expectation values of , representing the position on the Bloch sphere, and . We then found that the time evolution equation of (28) involves coupling with Rabi oscillations of qubits.
We have investigated a cavity QED involving a two-energy-level system of tryptophan residues in microtubules as qubits coupled with photons in a waveguide and the environment. Although macroscopic biological systems cannot be described in such a simple model, molecular properties can emerge in the investigation of nano-scale systems of amino acids in microtubules. Molecular systems of tryptophan residues with benzene rings involve the superposition of quantum states representing the ground state and the excited state. Since tryptophans absorb and emit photons, they are coupled with photons in a waveguide and the environment. The cavity QED model can then be feasible in describing nano-scale molecular systems consisting of tryptophans in microtubules coupled with photons.
We have investigated the parametric amplification of the input signal emitted as output signals using the Rabi oscillations of tryptophan qubits with multiple layers of microtubules in the axons of neuronal cells. We have prepared parameters for tryptophan qubits corresponding to the wavelength . Then, the wavelength of the input signal with frequency to be amplified by parametric resonance is set to , which is within the range of wavelengths of visible light. Being able to produce optical signals as a result of quantum processes within neurons forms the basis for their interference patterns and hence possible holographic formation. We set qubits for each layer, corresponding to the order of eight tryptophans in each tubulin dimer. The parameters , and for cavity modes represent the wavelengths of , , and , respectively. Meanwhile, for external loss to the waveguide represents the size , comparable with the wavelengths of cavity modes, corresponding to the size of coherence domains in microtubules. for internal loss to the environment is the size , corresponding to the length of microtubules (on the order of several microns), where photons dissipate their energy into the environment. We show the sensitivity of and by changing these parameters in Appendix B. is found to be sensitive to the maximum values of peaks at when changing from , since for the external loss corresponds to the coupling between the system and a waveguide. As we increase , the maximum values of the peaks increase. As we increase , several peaks at gradually disappear, where corresponds to the size . The internal loss to the environment plays the role of eliminating redundant output signals . corresponds to , representing the radius of a cell, namely the size of total energy dissipation in the whole system. This parameter is estimated as follows. The interaction term (with the system volume V) is in the order of , where we have used ∼ and ∼, where the number density ∼ with the volume of tubulin dimers V∼. Using the mass of tryptophan , ∼, and elementary charge , we find the coefficient ∼. While the elementary charge e is related to the tryptophan dipole moment as ∼∼, the tryptophan is surrounded by water molecules with density . Since the surrounding water molecules with the dipole moment amplify the effects of the dipole moment of a tryptophan by the ratio ∼, the charge e related to the dipole moment of a tryptophan is amplified as . Hence, we find ∼∼ or ∼. The time range that we have given in this paper corresponds to the time scales of super-radiance in microtubules investigated in [25,29,31,32]. We adopt super-radiant photon emissions as an input signal for tryptophan residues in the tubulin dimers of microtubules.
We prepare initial conditions for and for all tryptophan qubits for in each layer with for to 5 layers, namely the initial conditions and , respectively. In the case of , we find the rapid decay of qubits from , inducing the parametric amplification of the output signals at in Figure 9 and Figure A1 with parameters and . At , in Figure 9, relatively small peaks in the amplitudes occur due to the decay of qubits from to in Figure 9. Meanwhile, pumping from to by input waves from a waveguide appears with damping at in the case of in Figure 10, and small peaks emerge at . In the case of nonvanishing internal loss , the main peaks emerge at for the initial conditions in Figure 11. On the other hand, the peaks tend to disappear in the case of in Figure 12 as the number of layers increases. We can use tryptophan layers with this property as filters for input signals. Using several layers as filters, the states induce the amplification of the output signals, while the states induce the diminishing of the output signals if an appropriate decay to the environment representing internal loss is present. Internal loss is found to play the role of stabilization of the output signals.
We now discuss the dissipation effects of energy to the surrounding phonons in the environment. We can consider the additional term in the Hamiltonian as
where is an annihilation operator for phonons in the environment, is a creation operator for phonons, v is the sound velocity in the surrounding water media, and is the decay parameter. The Heisenberg equation for is given by
The solution is written as
Taking the inverse Fourier transformation, we arrive at
Using the input–output formulation and taking in the above equation, we find the time evolution equation for involving the following additional term as
where the term represents the same form as that of the internal loss. How do we determine the parameter ? Photons are coupled to surrounding water molecules involving vibrational motions corresponding to phonon degrees of freedom. When water molecules collide with one another, the energy dissipation of water–photon degrees of freedom to phonons occurs. Since the mean free path of water molecules is approximately and the velocity of water molecules is , the time scale for a collision is , which means the thermalization time involving four-times collisions. Hence, we can set ∼∼. The time scale of is much longer than that for parametric resonance that we have investigated in this paper ∼, so that the dissipation to phonons emerges at longer time scales. Therefore, the parametric amplification and propagation of signals is completed before thermal dissipation to surrounding phonons occurs.
Our study provides an explanation of how local events taking place in microtubules are converted into diffused nonlocal information bits in the brain. Quantum information in tryptophan qubits is represented as superposition states of the ground state and the excited state . When tryptophan qubits are entangled with surrounding water molecules, the excited state is approximately equal to the sub-radiant state with vanishing decay rates; as a result, sub-radiance achieves stable states , as shown in [40] (or [25] for the system of tryptophans and photons). Then, the stable sub-radiant states and the ground state are adopted as basis states for the encoding of quantum information—namely, sub-radiance is a key concept in adopting these basis states. Starting with tryptophan qubits in excited states or ground states with input signals from a waveguide representing super-radiant waves emitted from microtubules [25,29,30,31,32,33], the coherent dynamics of tryptophan qubits in a tubulin dimer also emerge due to sub-radiance and super-radiance corresponding to the source of coherence. Ultra-efficient super-radiant photon emission among tryptophan qubits might play the role of integrating information in a large network of tryptophans [28]. In the case whereby tryptophan qubits are in excited states, incident coherent waves represented as input signals are amplified by parametric resonance, while, in cases where qubits are in the ground state, coherent waves are suppressed by internal loss in multiple layers (by filters). Information from input signals might be processed via filters of multiple layers of tryptophan qubits. We then encounter binary patterns of incident waves corresponding to the high and low transmittance of light waves, which can be interpreted as binary holograms for optical information processing [41,42,43]. Quantum information contained in qubits is transferred to optical holographic information diffused in the whole brain, although the quantum states for qubits are disturbed by input signals in converting information from qubits to output optical signals. The energy contained in qubits is transferred to output signals, with the amplification of optical information. Memory can be encoded in microtubules by involving phosphorylated tubulin dimers represented as qubits [44], which, according to the mechanism presented here, might then be converted into hologram memory by parametric resonance if the phosphorylation for tubulins induces excitations in tryptophan qubits in tubulin dimers. While we have investigated qubits in a tubulin dimer as a filter, each tubulin dimer corresponds to an optical cell in the two-dimensional binary hologram. These optical cells encode information for the Fourier transformation of optical images. The 150,000/8 Trps∼20,000 tubulin dimers in a microtubule correspond to optical cells of binary holograms. Information from 150,000 qubits is converted into optical images by adopting these optical cells, where each optical cell amplifies or reduces the output signals. We have investigated the function of each optical cell as a filter in this study.
Optical holographic signals might be memorized in surrounding water–photon systems in the framework of quantum brain dynamics, adopting the stable vacua of aligned water dipoles emerging in the spontaneous breakdown of symmetry, where the water dipoles aligned in the same direction change the transmittance of light [34,45]. The exclusion zone water experimentally suggested in [46,47] is a candidate for coherent water. Qubit systems consisting of tryptophans can be holographic filters of optical signals. After qubits performing quantum computations are prepared, the information in qubits is converted to optical holographic patterns in surrounding water molecules and will be diffused across the whole brain. These patterns correspond to binary patterns of water dipoles that are all aligned and in random directions, corresponding to binary patterns of high and low transmittance, respectively. Then, tryptophan systems in microtubules might be considered as holographic screens consisting of qubits that are prepared and measured as suggested in the free energy principle of quantum systems [48].
Each tubulin dimer has 8 tryptophan, 36 tyrosine, and 42 phenylalanine residues, each of which can be electronically excited by electromagnetic waves of appropriate wavelengths. Tryptophan, tyrosine, and phenylalanine residues absorb photons with wavelengths , , and , respectively. Here, we have adopted the minimum wavelengths for ultraviolet photon absorption in [49]. Adopting parametric resonance, as introduced in this paper, input signals with wavelengths , , and corresponding to twice the wavelengths of the absorption spectra in tryptophan, tyrosine, and phenylalanine residues, respectively, are amplified most strongly. Then, we can adopt color holography by using at least three wavelengths for memory storage. Visual information contained in the microtubules of neurons in the visual cortex could then be processed by binary holograms with three wavelengths when we experience color images. The diversity of memory in the brain will emerge when adopting mixed colors to generate composite color images.
The mechanism of anesthesia is still an open question. We next discuss how this problem can be addressed using our model for parametric resonance and color holography. Anesthetic molecules shift the frequency of collective dipole modes, with corresponding to photons with wavelength [50]. We, therefore, set the wavelength of the cavity mode in our model as . As we have shown in Figure 3 and Figure 6, the deviation of the wavelength for cavity modes from that of the input signals weakens parametric amplification as the deviation increases. In the absence of anesthetic molecules, the input signals with wavelengths , , and are amplified by tryptophan, tyrosine, and phenylalanine residues with half of these wavelengths and the cavity modes with . Then, under these conditions, the color holography mechanism works and functions appropriately. In the case whereby anesthetic molecules are administered and the wavelength of the cavity modes is shifted, the balance of parametric amplification in color holography might be broken. Then, information processing and transfer in the whole brain would be disturbed, leading to loss of consciousness.
5. Concluding Remarks
We have shown in this paper how the parametric resonance of input signals emitted as output signals with wavelength using Rabi oscillations of tryptophan qubits with wavelength can describe the mechanism of quantum information processing in the neurons of the human brain. A specific representation of these quantum processing units has been chosen to involve tryptophan (and possibly other) residues of tubulin dimers in microtubules because of the documented and experimentally verified quantum excitation of these amino acids using electromagnetic waves in the ultraviolet range. In the case whereby these qubits are all in excited states, the input signal is amplified, while, in the case in which qubits are all in the ground state, the amplification of the input signal is diminished, which corresponds to the filtering of optical signals. We have proposed and elaborated mathematically on a mechanism that the human brain can employ to use tryptophan qubits involving Rabi oscillations. The filtering of signals by parametric resonance can be efficiently adopted for optical information processing in holography.
Author Contributions
Conceptualization, A.N., S.T. and J.A.T.; methodology, A.N.; software, A.N.; validation, A.N.; formal analysis, A.N.; investigation, A.N.; resources, A.N. and S.T.; data curation, A.N.; writing—original draft preparation, A.N.; writing—review and editing, S.T. and J.A.T.; visualization, A.N.; supervision, S.T. and J.A.T.; project administration, A.N., S.T. and J.A.T. All authors have read and agreed to the published version of the manuscript.
Funding
This research received no external funding.
Data Availability Statement
Dataset available on request from the authors: The raw data supporting the conclusions of this article will be made available by the authors on request.
Conflicts of Interest
The authors declare no conflicts of interest.
Correction Statement
This article has been republished with a minor correction to the Data Availability Statement. This change does not affect the scientific content of the article.
Appendix A. Time Evolution of Qubits in Cases of = 1 to 5
In this section, we show the time evolution of with for and involving internal loss to the environment in Figure A1 and Figure A2, respectively.
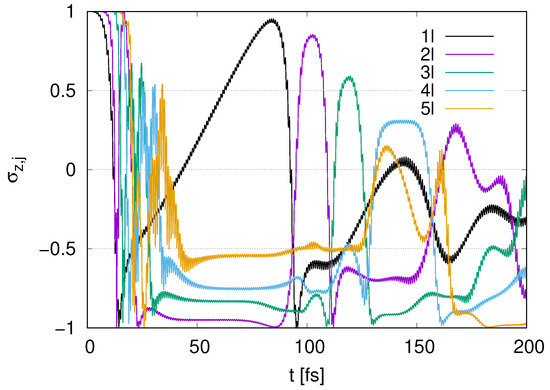
Figure A1.
Time evolution of in the case of to 5 layers represented by (1l) to (5l) with with .
In Figure A1, we find a rapid decay for at before the time range of for parametric amplification in Figure 9. Fluctuations in with and 5 appear at . While the pumping for with emerges at , the s with and 5 do not change drastically at . After the rapid decay for with at , fluctuations for s with and 5 emerge.
In Figure A2, a rapid decay emerges for at , which overlaps with the time range for parametric resonance in Figure 11. We find that the decay is delayed as the number increases. While pumping appears for with at , s with and 5 take approximately constant values. After the decay for with at around , with increases slightly.
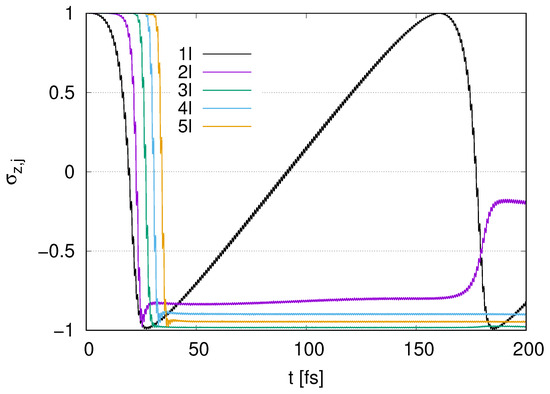
Figure A2.
Time evolution of in the case of to 5 layers represented by (1l) to (5l) with with .
Appendix B. Sensitivity for Parameters κi and κe
In this section, we investigate the sensitivity of internal and external loss by changing the parameters and .
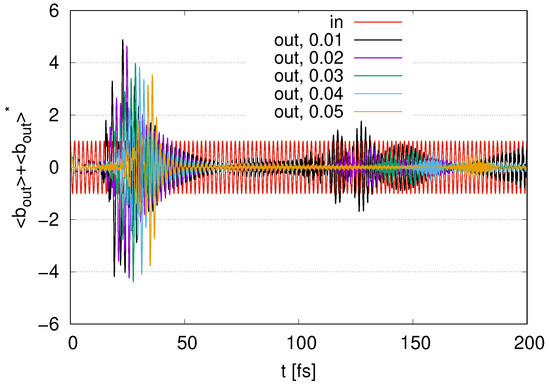
Figure A3.
Time evolution of scaled by in the case of layers with with , , , , and and fixed .
In Figure A3, we show the time evolution of the output signals in the case of layers with by changing the parameters of internal loss with , , , , and and a fixed external loss . When increasing , the amplitudes of the oscillations within decrease and the time ranges of the peaks are delayed. While we find several peaks at in , these peaks gradually disappear as increases. While the internal loss eliminates several signals at , the output signals at are still present, even if increases.
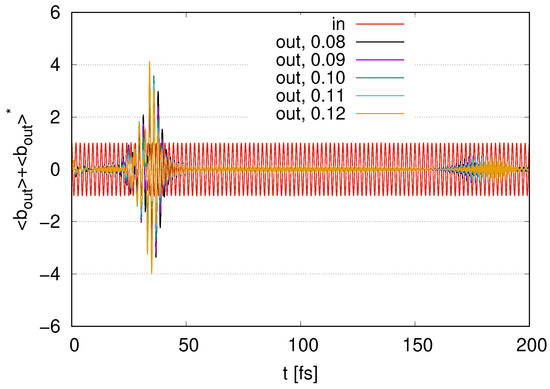
Figure A4.
Time evolution of scaled by in the case of layers with with , , , , and and fixed .
In Figure A4, we show the time evolution of the output signals in the case of layers with by changing the parameters of external loss with , , , , and and a fixed internal loss . As we increase , the maximum values of the peaks at increase since we increase the coupling between the system and the waveguide. While the maximum values increase as the s increase, the time widths of the peaks slightly decrease. We find small peaks at compared with the input signal. The time ranges of the peaks are gradually delayed as we increase .
References
- Pribram, K.H. Languages of the Brain: Experimental Paradoxes and Principles in Neuropsychology; Prentice-Hall: Saddle River, NJ, USA, 1971. [Google Scholar]
- Treisman, A. The binding problem. Curr. Opin. Neurobiol. 1996, 6, 171–178. [Google Scholar] [CrossRef]
- Lashley, K.S. Brain Mechanisms and Intelligence: A Quantitative Study of Injuries to the Brain; University of Chicago Press: Chicago, IL, USA, 1929. [Google Scholar]
- Bartlett, F.; John, E. Equipotentiality quantified: The anatomical distribution of the engram. Science 1973, 181, 764–767. [Google Scholar] [CrossRef]
- Freeman, W.J. Mass Action in the Nervous System; Academic Press: New York, NY, USA, 1975. [Google Scholar]
- Pribram, K.H.; Yasue, K.; Jibu, M. Brain and Perception: Holonomy and Structure in Figural Processing; Psychology Press: London, UK, 1991. [Google Scholar]
- Cavaglia, M.; Deriu, M.A.; Tuszynski, J.A. Toward a holographic brain paradigm: A lipid-centric model of brain functioning. Front. Neurosci. 2023, 17, 1302519. [Google Scholar] [CrossRef]
- Ricciardi, L.M.; Umezawa, H. Brain and physics of many-body problems. Kybernetik 1967, 4, 44–48. [Google Scholar] [CrossRef] [PubMed]
- Stuart, C.; Takahashi, Y.; Umezawa, H. On the stability and non-local properties of memory. J. Theor. Biol. 1978, 71, 605–618. [Google Scholar] [CrossRef]
- Stuart, C.; Takahashi, Y.; Umezawa, H. Mixed-system brain dynamics: Neural memory as a macroscopic ordered state. Found. Phys. 1979, 9, 301–327. [Google Scholar] [CrossRef]
- Jibu, M.; Yasue, K. Quantum Brain Dynamics and Consciousness; John Benjamins: Amsterdam, The Netherlands, 1995. [Google Scholar]
- Del Giudice, E.; Doglia, S.; Milani, M.; Vitiello, G. Spontaneous symmetry breakdown and boson condensation in biology. Phys. Lett. A 1983, 95, 508–510. [Google Scholar] [CrossRef]
- Del Giudice, E.; Doglia, S.; Milani, M.; Vitiello, G. A quantum field theoretical approach to the collective behaviour of biological systems. Nucl. Phys. B 1985, 251, 375–400. [Google Scholar] [CrossRef]
- Del Giudice, E.; Doglia, S.; Milani, M.; Vitiello, G. Electromagnetic field and spontaneous symmetry breaking in biological matter. Nucl. Phys. B 1986, 275, 185–199. [Google Scholar] [CrossRef]
- Del Giudice, E.; Preparata, G.; Vitiello, G. Water as a free electric dipole laser. Phys. Rev. Lett. 1988, 61, 1085. [Google Scholar] [CrossRef]
- Del Giudice, E.; Smith, C.; Vitiello, G. Magnetic Flux Quantization and Josephson Systems. Phys. Scr. 1989, 40, 786–791. [Google Scholar] [CrossRef]
- McFadden, J. The CEMI field theory closing the loop. J. Conscious. Stud. 2013, 20, 153–168. [Google Scholar]
- Albrecht-Buehler, G. Rudimentary form of cellular “vision”. Proc. Natl. Acad. Sci. USA 1992, 89, 8288–8292. [Google Scholar] [CrossRef]
- Mould, R.R.; Mackenzie, A.M.; Kalampouka, I.; Nunn, A.V.; Thomas, E.L.; Bell, J.D.; Botchway, S.W. Ultra weak photon emission—A brief review. Front. Physiol. 2024, 15, 1348915. [Google Scholar] [CrossRef] [PubMed]
- Kalra, A.P.; Biswas, S.; Mulrain, I.; Wang, M.; Tuszynski, J.A.; Scholes, G.D. All lit up: Exploring the photophysical properties of protein polymers. J. Phys. Chem. Lett. 2023, 14, 5891–5900. [Google Scholar] [CrossRef]
- Kalra, A.P.; Benny, A.; Travis, S.M.; Zizzi, E.A.; Morales-Sanchez, A.; Oblinsky, D.G.; Craddock, T.J.; Hameroff, S.R.; MacIver, M.B.; Tuszynski, J.A.; et al. Electronic energy migration in microtubules. ACS Cent. Sci. 2023, 9, 352–361. [Google Scholar] [CrossRef]
- Kurian, P.; Obisesan, T.; Craddock, T.J. Oxidative species-induced excitonic transport in tubulin aromatic networks: Potential implications for neurodegenerative disease. J. Photochem. Photobiol. B Biol. 2017, 175, 109–124. [Google Scholar] [CrossRef] [PubMed]
- Lin, C.; Top, D.; Manahan, C.C.; Young, M.W.; Crane, B.R. Circadian clock activity of cryptochrome relies on tryptophan-mediated photoreduction. Proc. Natl. Acad. Sci. USA 2018, 115, 3822–3827. [Google Scholar] [CrossRef] [PubMed]
- Craddock, T.J.A.; Friesen, D.; Mane, J.; Hameroff, S.; Tuszynski, J.A. The feasibility of coherent energy transfer in microtubules. Journal of the Royal Society Interface. J. R. Soc. Interface 2014, 11, 20140677. [Google Scholar] [CrossRef]
- Celardo, G.; Angeli, M.; Craddock, T.; Kurian, P. On the existence of superradiant excitonic states in microtubules. New J. Phys. 2019, 21, 023005. [Google Scholar] [CrossRef]
- Shirmovsky, S.E.; Chizhov, A.V. Modeling of the entangled states transfer processes in microtubule tryptophan system. Biosystems 2023, 231, 104967. [Google Scholar] [CrossRef]
- Shirmovsky, S.E. On the possibility of implementing a quantum entanglement distribution in a biosystem: Microtubules. Biosystems 2024, 245, 105320. [Google Scholar] [CrossRef]
- Babcock, N.; Montes-Cabrera, G.; Oberhofer, K.; Chergui, M.; Celardo, G.; Kurian, P. Ultraviolet superradiance from mega-networks of tryptophan in biological architectures. J. Phys. Chem. B 2024, 128, 4035–4046. [Google Scholar] [CrossRef]
- Jibu, M.; Hagan, S.; Hameroff, S.R.; Pribram, K.H.; Yasue, K. Quantum optical coherence in cytoskeletal microtubules: Implications for brain function. Biosystems 1994, 32, 195–209. [Google Scholar] [CrossRef]
- Nishiyama, A.; Tanaka, S.; Tuszynski, J.A. Non-Equilibrium Quantum Brain Dynamics: Super-Radiance and Equilibration in 2+1 Dimensions. Entropy 2019, 21, 1066. [Google Scholar] [CrossRef]
- Nishiyama, A.; Tanaka, S.; Tuszynski, J.A. Non-equilibrium Quantum Brain Dynamics II: Formulation in 3+1 dimensions. Phys. A Stat. Mech. Its Appl. 2021, 567, 125706. [Google Scholar] [CrossRef]
- Nishiyama, A.; Tanaka, S.; Tuszynski, J.A.; Tsenkova, R. Holographic Brain Theory: Super-Radiance, Memory Capacity and Control Theory. Int. J. Mol. Sci. 2024, 25, 2399. [Google Scholar] [CrossRef] [PubMed]
- Nishiyama, A.; Tanaka, S.; Tuszynski, J.A. Quantum Brain Dynamics: Optical and Acoustic Super-Radiance via a Microtubule. Foundations 2024, 4, 288–305. [Google Scholar] [CrossRef]
- Nishiyama, A.; Tanaka, S.; Tuszynski, J.A. Quantum Brain Dynamics and Holography. Dynamics 2022, 2, 187–218. [Google Scholar] [CrossRef]
- Landau, L.D.; Lifshitz, E.M. Mechanics, Third Edition: Volume 1 (Course of Theoretical Physics), 3rd ed.; Butterworth-Heinemann: Oxford, UK, 1976. [Google Scholar]
- Lin, Z.; Inomata, K.; Koshino, K.; Oliver, W.; Nakamura, Y.; Tsai, J.S.; Yamamoto, T. Josephson parametric phase-locked oscillator and its application to dispersive readout of superconducting qubits. Nat. Commun. 2014, 5, 4480. [Google Scholar] [CrossRef] [PubMed]
- Koshino, K. Theory of resonance fluorescence from a solid-state cavity QED system: Effects of pure dephasing. Phys. Rev. A—At. Mol. Opt. Phys. 2011, 84, 033824. [Google Scholar] [CrossRef]
- Asaoka, R.; Gea-Banacloche, J.; Tokunaga, Y.; Koshino, K. Stimulated Emission of Superradiant Atoms in Waveguide Quantum Electrodynamics. Phys. Rev. Appl. 2022, 18, 064006. [Google Scholar] [CrossRef]
- Walls, D.; Milburn, G.J. Input–output formulation of optical cavities. In Quantum Optics; Springer: Berlin/Heidelberg, Germany, 2008; pp. 127–141. [Google Scholar]
- Nishiyama, A.; Tanaka, S.; Tuszynski, J.A. Waveguide Quantum Electrodynamics: Tryptophans Entangled with Water as Data Qubits in a Microtubule. Dynamics 2025, 5, 7. [Google Scholar] [CrossRef]
- Brown, B.R.; Lohmann, A.W. Complex spatial filtering with binary masks. Appl. Opt. 1966, 5, 967–969. [Google Scholar] [CrossRef] [PubMed]
- Lohmann, A.W.; Paris, D. Binary Fraunhofer holograms, generated by computer. Appl. Opt. 1967, 6, 1739–1748. [Google Scholar] [CrossRef]
- Brown, B.; Lohmann, A. Computer-generated binary holograms. IBM J. Res. Dev. 1969, 13, 160–168. [Google Scholar] [CrossRef]
- Craddock, T.J.A.; Tuszynski, J.A.; Hameroff, S. Cytoskeletal Signaling: Is Memory Encoded in Microtubule Lattices by CaMKII Phosphorylation? PLoS Comput. Biol. 2012, 8, e1002421. [Google Scholar] [CrossRef]
- Nishiyama, A.; Tanaka, S.; Tuszynski, J.A. Quantum Brain Dynamics and Virtual Reality. BioSystems 2024, 242, 105259. [Google Scholar] [CrossRef]
- Zheng, J.m.; Pollack, G.H. Long-range forces extending from polymer-gel surfaces. Phys. Rev. E 2003, 68, 031408. [Google Scholar] [CrossRef]
- Del Giudice, E.; Voeikov, V.; Tedeschi, A.; Vitiello, G. The origin and the special role of coherent water in living systems. In Fields of the Cell; Research Signpost: Kerala, India, 2014; pp. 95–111. [Google Scholar]
- Fields, C.; Friston, K.; Glazebrook, J.F.; Levin, M. A free energy principle for generic quantum systems. Prog. Biophys. Mol. Biol. 2022, 173, 36–59. [Google Scholar] [CrossRef]
- Feraud, K.; Dunn, M.S.; Kaplan, J. Spectroscopic Investigations of Amino Acids and Amino Acid Derivatives: I. Ultra-Violet Absorption Spectra of l-Tyrosine, dl-Phenylalanine, and l-Tryptophane. J. Biol. Chem. 1935, 112, 323–328. [Google Scholar] [CrossRef]
- Craddock, T.J.; Kurian, P.; Preto, J.; Sahu, K.; Hameroff, S.R.; Klobukowski, M.; Tuszynski, J.A. Anesthetic alterations of collective terahertz oscillations in tubulin correlate with clinical potency: Implications for anesthetic action and post-operative cognitive dysfunction. Sci. Rep. 2017, 7, 9877. [Google Scholar] [CrossRef] [PubMed]
Disclaimer/Publisher’s Note: The statements, opinions and data contained in all publications are solely those of the individual author(s) and contributor(s) and not of MDPI and/or the editor(s). MDPI and/or the editor(s) disclaim responsibility for any injury to people or property resulting from any ideas, methods, instructions or products referred to in the content. |
© 2025 by the authors. Licensee MDPI, Basel, Switzerland. This article is an open access article distributed under the terms and conditions of the Creative Commons Attribution (CC BY) license (https://creativecommons.org/licenses/by/4.0/).