1. Introduction
Aerodynamic analysis is a fundamental aspect of truck design because it enables the assessment and optimization of the interaction between the airflow and the vehicle. Beyond improving energy efficiency and overall performance, aerodynamics also contributes to driving stability and safety. For medium- and heavy-duty freight vehicles, aerodynamic analysis allows the quantification of the forces and pressure loads acting on the bodywork and associated components, thereby supporting the development of more efficient designs with reduced resistance to motion. These aerodynamic loads are commonly grouped into three main components [
1]: drag, which opposes vehicle motion and penalizes fuel efficiency; lift, which may act upward or downward and can affect stability by reducing tire normal load or increasing ground loading; and side force, which influences directional stability, particularly under crosswind conditions [
2,
3].
The complexity of vehicular aerodynamic problems arises from their nonlinear nature and from the interaction of multiple variables that govern the flow field around the vehicle. This complexity often exceeds the capability of traditional analytical methods to deliver accurate solutions. Consequently, two primary approaches are typically employed: wind-tunnel testing and Computational Fluid Dynamics (CFD). Both methods provide valuable means to evaluate and optimize vehicle aerodynamic design [
4,
5].
Previous studies have shown that modifying external flow can improve vehicle aerodynamics by reducing air resistance [
6,
7,
8]. Flow-control devices, including cab and rear deflectors, can enhance aerodynamic efficiency [
9]. A well-designed rear deflector may increase surface pressure, alter the rear flow, reduce reverse wake flow, and improve road holding [
10].
Similarly, vortex-generator strategies—often implemented as small protuberances and widely used in aeronautics to delay flow separation—have also shown potential in automotive applications, helping to reduce aerodynamic drag without requiring major modifications to the vehicle geometry [
11,
12,
13]. Such devices have been studied in light-duty vehicle design and have been shown to delay separation and improve aerodynamic performance, leading to reduced fuel consumption and mitigation of the environmental impact of combustion [
9].
Truck aerodynamics can be improved through cab- and trailer-mounted devices, with deflectors among the most effective options [
10]. Their importance has grown with fuel costs because trucks typically exhibit high drag and considerable optimization potential [
14]. Recent reviews identify cab deflectors as effective add-ons for reducing drag, fuel consumption, and emissions, depending on geometry and operating conditions [
15].
Table 1 summarizes the most relevant findings from the specialized literature, providing the conceptual framework that links these previous studies with the motivation of the present work and the subsequent formulation of its objectives.
The literature shows that vehicle aerodynamics strongly influences energy demand and stability through drag, lift, and side forces. Because these flows are nonlinear and involve separation, wake development, and vortical structures, they are commonly investigated using wind-tunnel testing or CFD. Previous studies also report that deflectors can improve truck aerodynamics, particularly by reducing drag.
However, important gaps remain. Many studies describe general efficiency gains without consistently quantifying engineering metrics such as required tractive power over a representative speed range. In addition, the influence of deflectors is not always examined through pressure and velocity fields, and relatively few studies simultaneously assess drag, lift, and road-load power demand in medium-duty box trucks.
Medium-duty freight trucks were selected as the object of study because they represent a highly used vehicle segment in urban and interurban distribution, where box-type geometries generate considerable aerodynamic resistance under highway operating conditions. Accordingly, this study presents a comparative CFD assessment of a front deflector on a medium-duty freight truck under zero-yaw conditions from 50 to 120 km/h.
Accordingly, the main objective of this research is to evaluate, through a comparative CFD-based approach, the aerodynamic effect of a front deflector on a medium-duty freight truck operating under zero-yaw highway conditions within the 50–120 km/h speed range. Specifically, the study aims to: (i) quantify the changes in drag and lift forces and in their corresponding aerodynamic coefficients between the baseline and deflector-equipped configurations; (ii) determine how the drag reduction produced by the deflector affects the required propulsion power; and (iii) interpret the pressure and velocity fields, together with the pressure-coefficient CP distributions, to identify the dominant flow mechanisms responsible for the observed aerodynamic behavior.
The remainder of this paper is organized as follows.
Section 2 describes the methodological framework, including the resistive-force model and CFD setup.
Section 3 presents the numerical results for the baseline and deflector-equipped configurations.
Section 4 discusses the underlying aerodynamic mechanisms, engineering implications, and study limitations. Finally,
Section 5 summarizes the main conclusions and outlines directions for future research.
2. Materials and Methods
This section describes the methodological framework adopted to evaluate the vehicle’s aerodynamic performance and its impact on energy demand using computational fluid dynamics (CFD). It presents the analyzed configurations, computational domain, boundary conditions, numerical model, mesh strategy, and main aerodynamic indicators used to quantify the influence of the front deflector on the flow field and the resulting aerodynamic loads.
2.1. Aerodynamic Condition
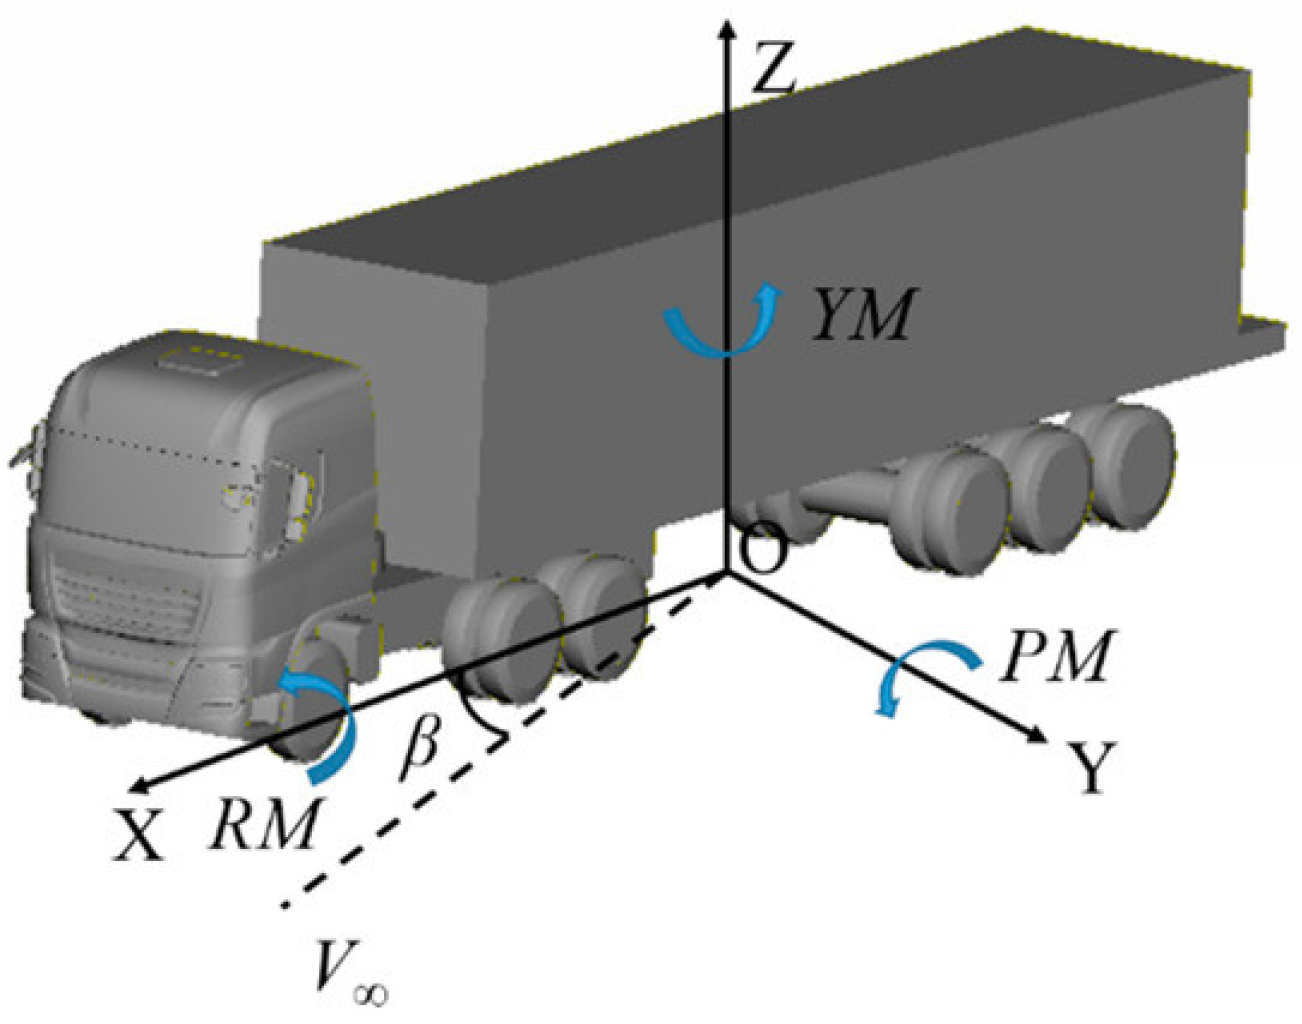
Figure 1, adapted from [
17], illustrates a typical reference coordinate system for a tractor–trailer configuration. Aerodynamic drag acts opposite to the direction of motion along the X-axis, thereby resisting forward travel, while lift acts perpendicular to the incoming airflow along the Z-axis. Vα denotes the relative inlet velocity associated with an inflow angle α\alphaα when a crosswind component is present.
In the present study, the incoming flow was assumed to be aligned with the vehicle’s longitudinal axis (β = 0°), corresponding to zero-yaw, head-on conditions with no crosswind component. Under these conditions, the relative inlet velocity Vα reduces to the free-stream velocity (). Accordingly, the reference velocity used to calculate the drag and lift coefficients, CD and CL, was taken directly from the investigated speed range of 50–120 km/h.
2.2. Resistive Forces and Required Propulsion Power
Under constant speed conditions on a flat road, acceleration and gradient resistance were assumed to be zero. Therefore, the total tractive force,
, was calculated as the sum of rolling resistance
and aerodynamic drag
:
Rolling resistance
was obtained as:
where
is the rolling resistance coefficient,
is the vehicle mass, and
is the gravitational acceleration. A constant rolling resistance coefficient of
= 0.0150 was adopted for all vehicle speeds.
The corresponding propulsion-power demand was obtained as:
where
is the required propulsion power and
is the vehicle speed. Transmission losses and engine efficiency were not included in this calculation. For this reason, propulsion power refers to the required tractive power, calculated at the vehicle level. Based on this balance of forces, Computational Fluid Dynamics (CFD) was used to determine the aerodynamic drag force and, consequently, to evaluate the total tractive force and the required propulsion power for both vehicle configurations.
2.3. Computational Fluid Dynamics (CFD)
When Computational Fluid Dynamics (CFD) is used to estimate airflow over truck surfaces, several stages are required to define and solve the numerical problem [
6,
13]. In this study, CFD resolved the airflow and quantified the aerodynamic forces for the baseline and deflector-equipped configurations. The numerical methodology comprised the definition of the vehicle geometry, computational domain, boundary conditions, mesh, turbulence model, and solution procedure.
2.3.1. Vehicle Geometry and Configurations
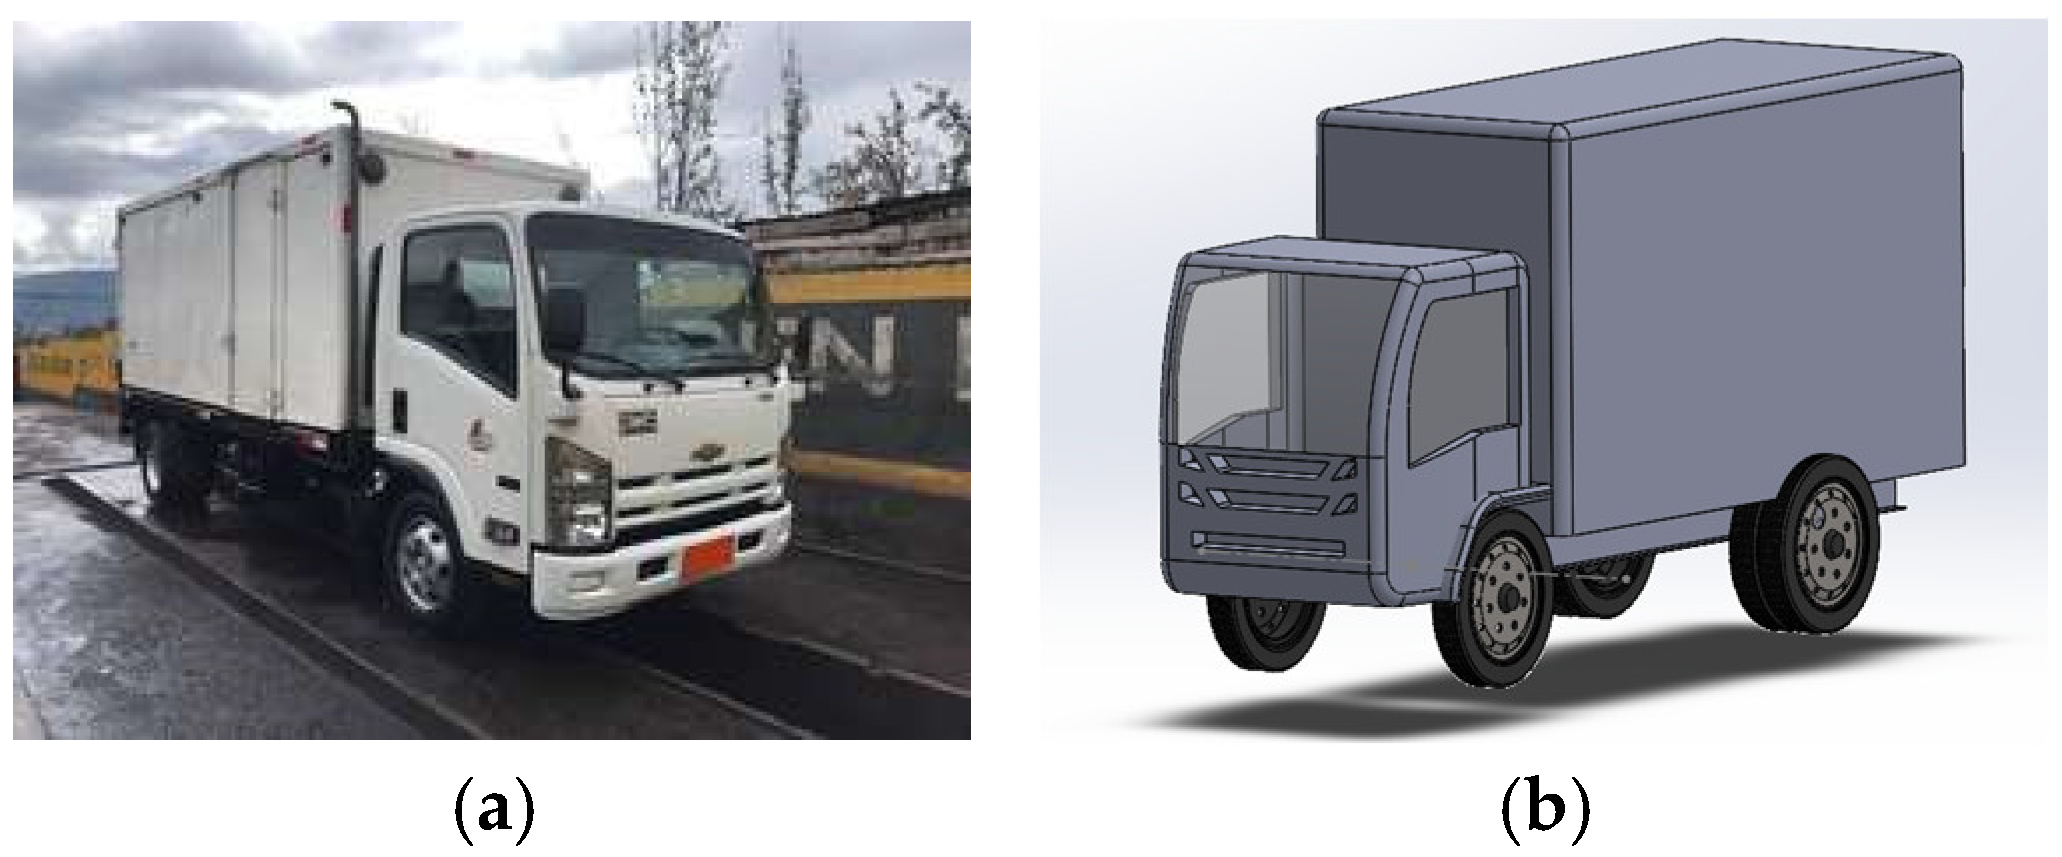
Figure 2a shows the Chevrolet NQR 1015 truck (Chevrolet, General Motors Company, Detroit, MI, USA) considered in the aerodynamic study, while
Figure 2b presents the simplified CAD model developed with SOLIDWORKS 2025 (Dassault Systèmes SolidWorks Corporation, Waltham, MA, USA). This simplification is commonly adopted in comparative aerodynamic studies to reduce computational cost while preserving the main flow features governing drag and wake formation, ensuring that relative performance differences between configurations remain representative.
2.3.2. Computational Domain
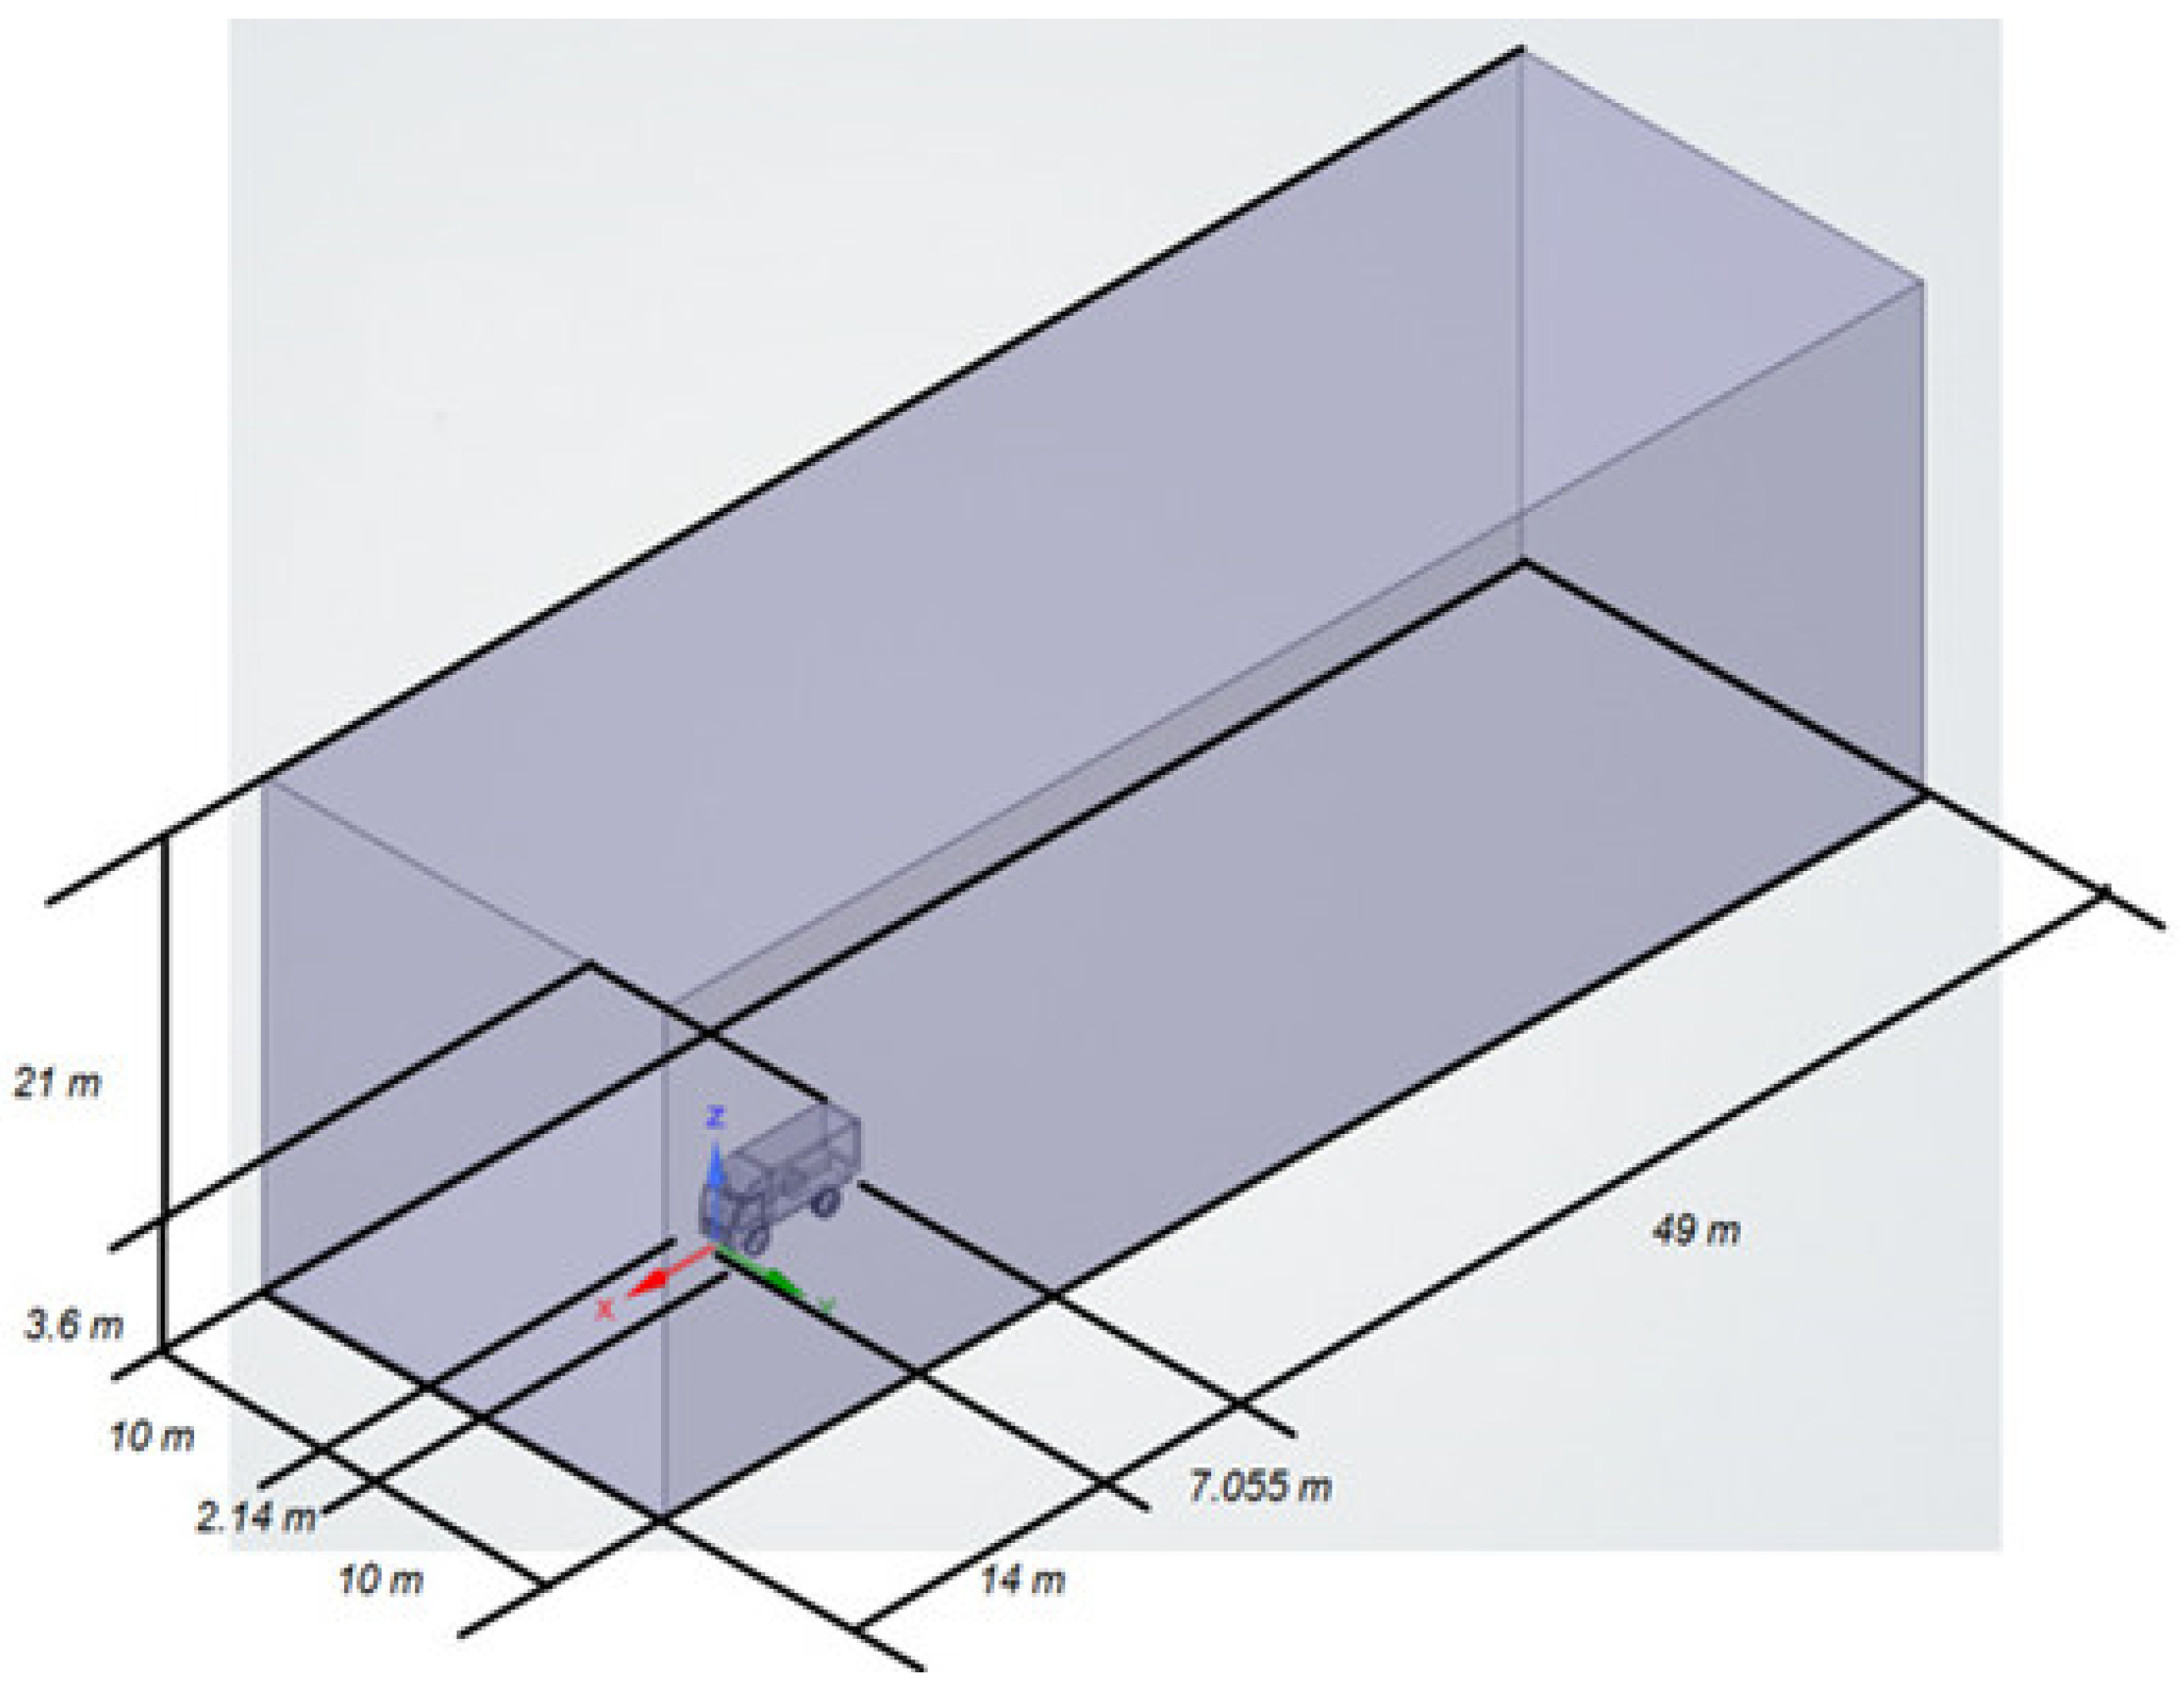
The vehicle length, Lv = 7.055 m, was used to define the longitudinal dimensions of the computational domain. The inlet was located 2L upstream of the vehicle, while the outlet was positioned 7L downstream. Lateral and upper clearances were defined as five times the vehicle width and six times its height, respectively. The resulting blockage ratio was approximately 1.3% (see
Figure 3).
2.3.3. Numerical Model, Fluid Properties, and Boundary Conditions
The flow was modeled as steady, incompressible, and turbulent. At the maximum analyzed speed of 120 km/h, the Mach number remained below 0.3, supporting the assumption of incompressible flow.
Based on the truck’s height and a representative speed of 100 km/h, the Reynolds number was approximately 6.5 × 10
6, confirming a fully turbulent regime. Turbulence was represented using the RANS k–ω SST model due to its suitability for external flows involving adverse pressure gradients and separation [
5,
18,
19].
Boundary Conditions
For each inlet velocity between 50 and 120 km/h, a uniform velocity profile was prescribed at the domain inlet. The turbulence intensity was set to 5%, and the turbulence length scale was defined as 0.07Lref, where Lref corresponds to the truck height. A static gauge pressure of 0 Pa was imposed at the outlet. Slip conditions were applied to the side and upper boundaries of the computational domain, whereas the truck body, deflector, and wheel surfaces were modeled as smooth no-slip walls. The ground was treated as a stationary wall, and the wheels were considered non-rotating. The same boundary conditions were used for the baseline and deflector-equipped configurations to ensure a consistent comparative assessment [
20].
The main numerical settings used in the CFD simulations are summarized in
Table 2.
2.3.4. Mesh Characterization and Grid-Independence Assessment
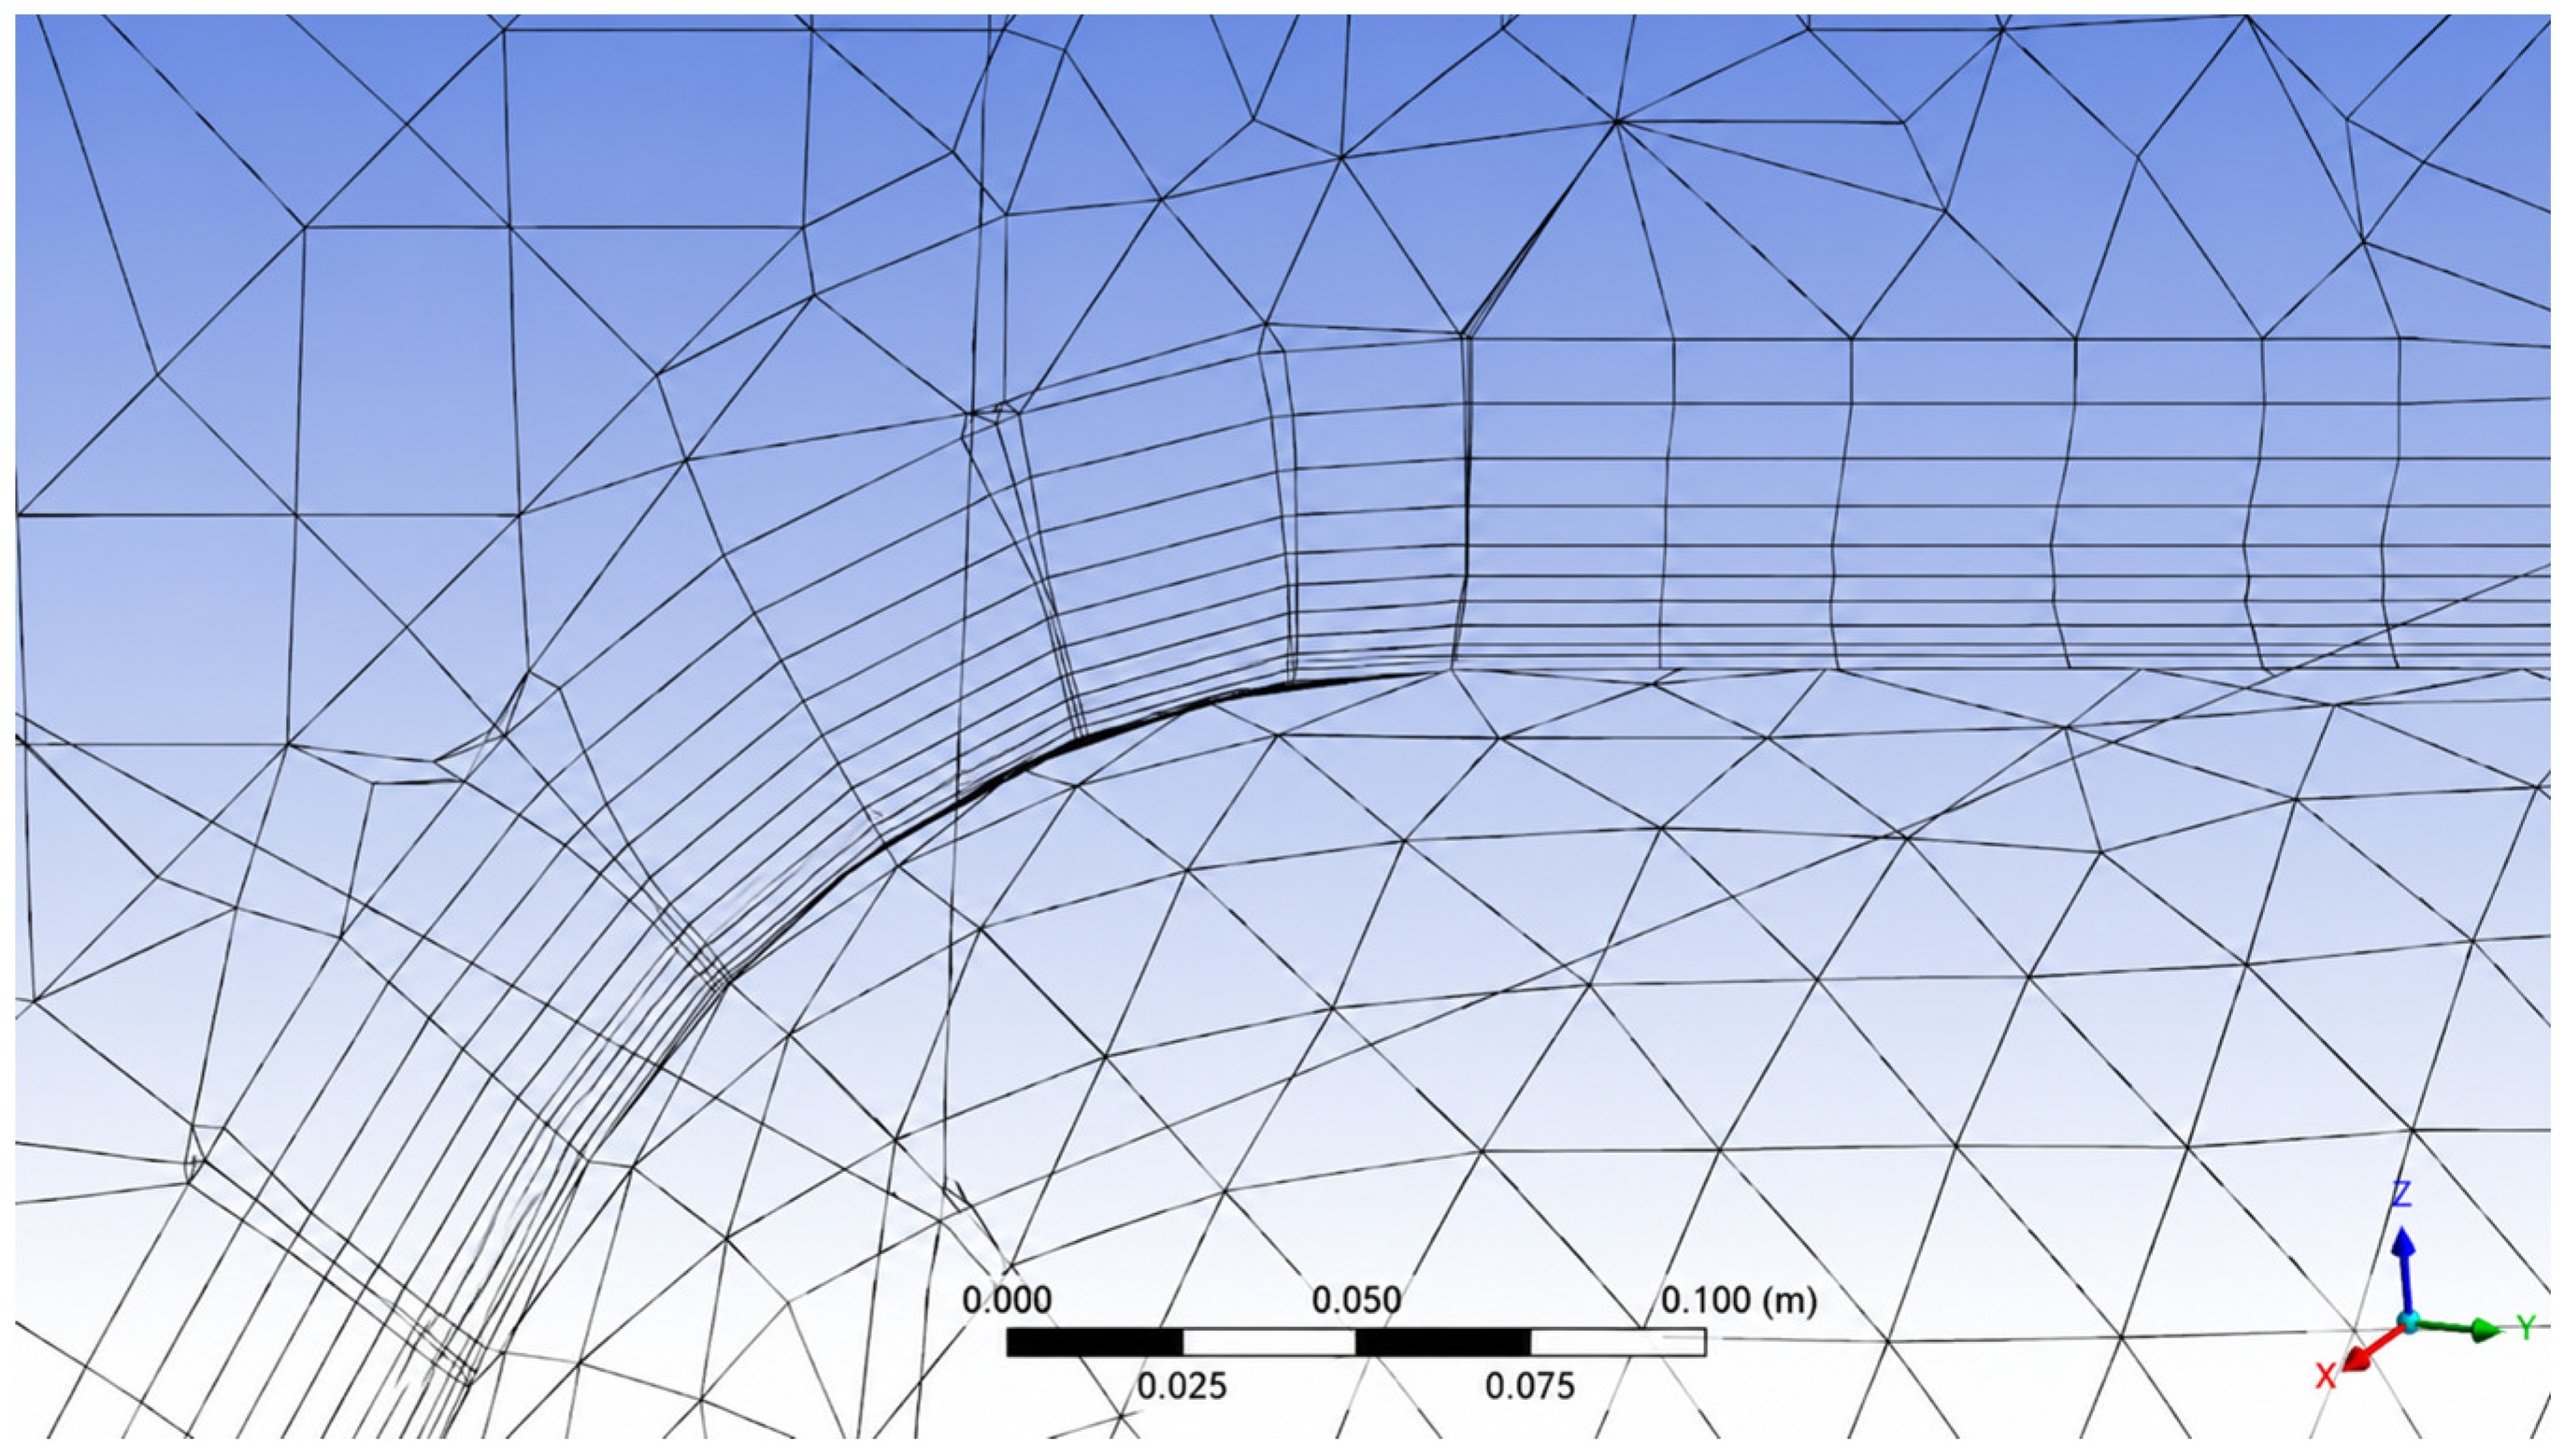
The computational domain was discretized using an unstructured tetrahedral mesh with 10 inflation layers adjacent to the vehicle surfaces. The first-layer thickness was 1.3 × 10
−5 m, with a growth rate of 1.15.
Figure 4 illustrates the near-wall inflation layers generated around the truck surface.
Three mesh levels were generated to assess mesh quality and grid-independence: coarse, medium, and fine. As shown in
Table 3, the average y+ values decreased from 5.85 to 4.37 and 3.91 with refinement, indicating improved near-wall resolution for the k–ω SST turbulence model. In addition, the average orthogonal quality increased from 0.746 to 0.874, while average skewness remained within acceptable limits, confirming the overall suitability of the discretization.
The evaluation of mesh independence at 100 km/h is summarized in
Table 4. The relative change in C
D decreased from 1.83% to 0.46% between successive refinements, while the drag force showed the same convergence trend. The low calculated GCI values for C
D support the numerical reliability of the solution. Therefore, the fine mesh was considered suitable for comparative aerodynamic analysis.
2.3.5. Simulation and Post-Processing
The baseline and deflector-equipped configurations were simulated under identical numerical conditions for inlet velocities ranging from 50 to 120 km/h in increments of 10 km/h. For each case, the drag and lift forces were obtained by integrating the pressure and viscous contributions over the vehicle surfaces. The corresponding aerodynamic coefficients were calculated as:
where
and
are the drag and lift force components, respectively;
is the air density,
is the inlet velocity, and
A is the projected frontal area of the vehicle. The resulting drag force was subsequently used, together with the rolling resistance, to calculate the required propulsion power.
Post-processing included the extraction of pressure and velocity fields, aerodynamic loads, and local values at the monitoring points P1–P3. The surface pressure-coefficient was calculated as:
where
is the local static pressure and
is the free-stream static pressure. The C
P distributions were evaluated along the normalized streamwise coordinate x/L to compare the surface-pressure behavior of the baseline and deflector-equipped configurations.
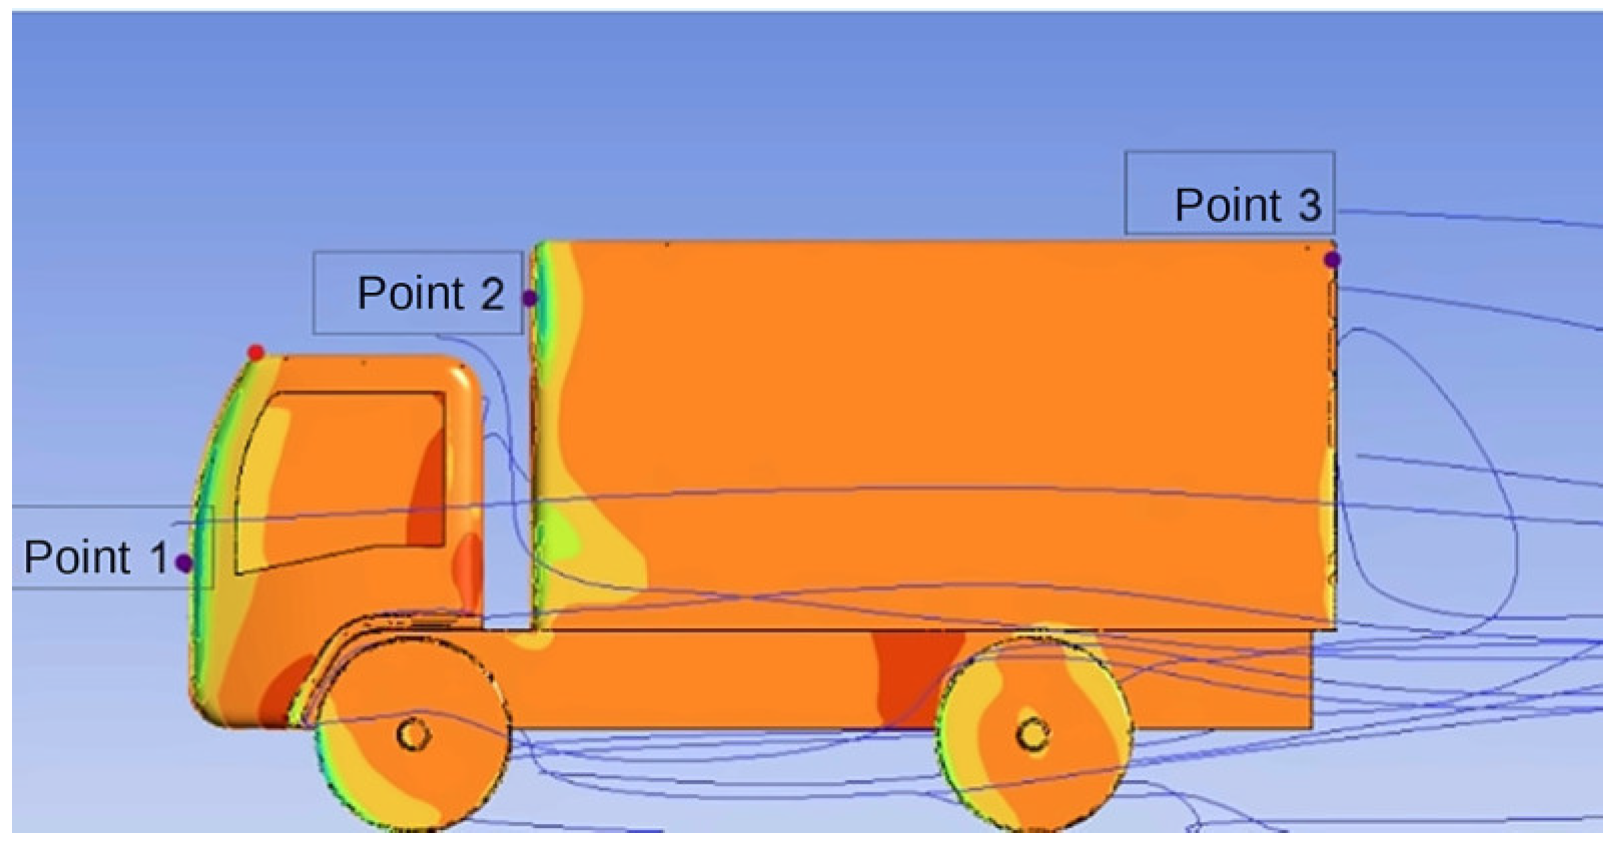
To complement the global aerodynamic coefficients and provide a localized interpretation of flow behavior, three numerical monitoring points were placed in the fluid domain near the vehicle surface to extract local velocity and static pressure values during CFD post-processing (see
Figure 5). Point P1 was located at the front of the cab, representing the impact or stagnation zone directly exposed to the incident flow. Point P2 was located at the transition between the cab and the cargo box, where strong local velocity and pressure gradients were expected. Point P3 was located near the rear upper edge of the cargo box, a region associated with flow separation and wake formation. Therefore, these points were not intended to describe the entire surface pressure field, but rather to provide local indicators of the dominant aerodynamic mechanisms: frontal stagnation, flow reorganization between the cab and the box, and wake behavior.
The CFD workflow was implemented in ANSYS Workbench–Fluent 2025 (Ansys, Inc., Canonsburg, PA, USA) using a sequential procedure that includes geometry preparation, computational domain definition, mesh generation, boundary condition assignment, numerical solution, and post-processing. The same workflow was applied to both the reference and deflector configurations to ensure consistent benchmarking across the analyzed speed range. Subsequently processed aerodynamic loads, local flow variables, and surface pressure coefficient distributions were used to support the interpretation of pressure gradients, separation-prone regions, and wake-related flow characteristics that govern the truck’s aerodynamic response.
3. Results
Based on the CFD simulations, this section presents the aerodynamic and propulsion power results obtained for the baseline and deflector-equipped configurations. The comparison includes global aerodynamic loads, dimensionless coefficients, required propulsion power, local velocity and pressure values, and surface pressure-coefficient distributions over the investigated speed range.
3.1. Global Aerodynamic Loads and Propulsion Power
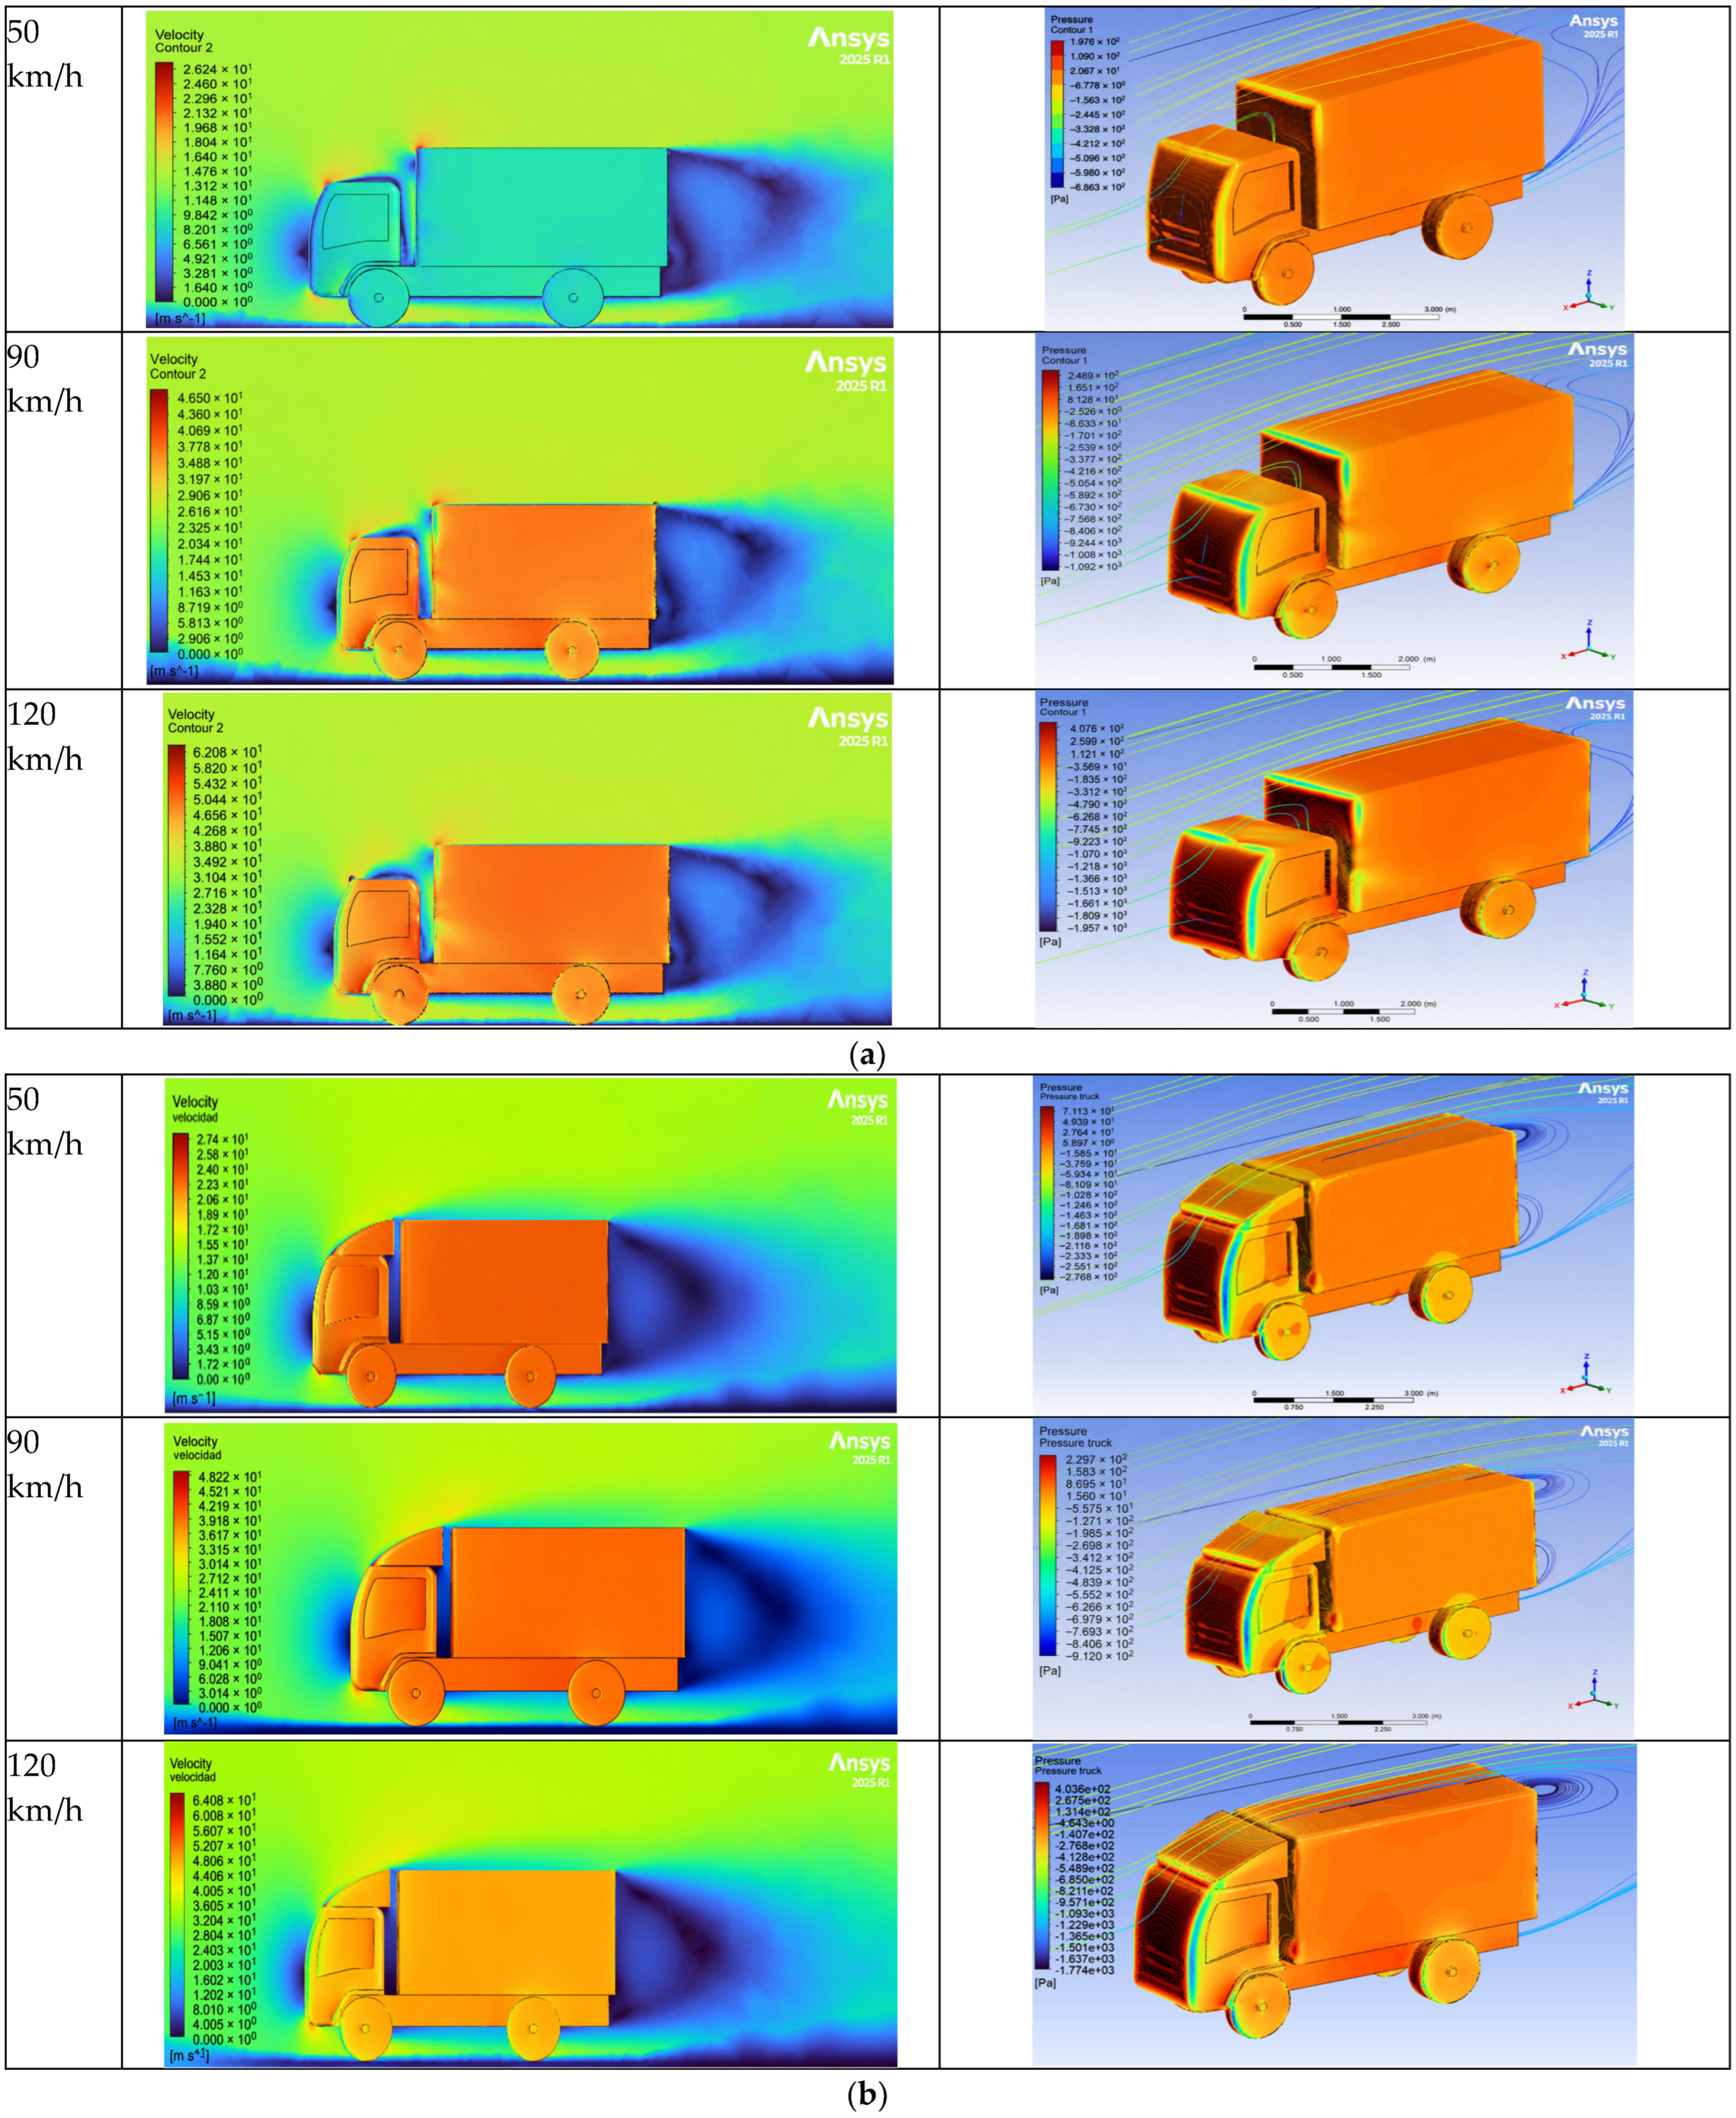
Figure 6 presents the pressure and velocity contours obtained for the baseline and deflector-equipped configurations at 50, 90, and 120 km/h. Differences between the two configurations become more evident as vehicle speed increases, particularly near the cab–box transition and in the downstream flow region.
The mean aerodynamic and energy-related indicators calculated over the eight simulated velocities are summarized in
Table 5. The mean drag force decreased from 907.10 N in the baseline configuration to 778.68 N with the front deflector, corresponding to a reduction of 14.2%. The mean lift force decreased from 91.70 to 29.46 N, representing a reduction of 67.9%.
The mean drag coefficient decreased from 0.5763 to 0.4952, equivalent to a reduction of 14.1%, whereas the mean lift coefficient decreased from 0.0613 to 0.0163, corresponding to a reduction of 73.5%.
The reduction in aerodynamic drag also decreased the mean total tractive force from approximately 2157.88 to 2029.46 N, representing a reduction of approximately 6.0%. Consequently, the mean required propulsion power decreased from 53.86 to 50.39 kW, equivalent to a reduction of 6.4%.
All reported mean values were calculated as arithmetic means over the eight simulated inlet velocities. The mean propulsion-power values were obtained from the arithmetic mean of the eight independently calculated power values and not by multiplying the mean tractive force by the mean vehicle speed. Negative percentages indicate reductions relative to the baseline configuration.
3.2. Drag Force, Lift Force, and Required Propulsion Power
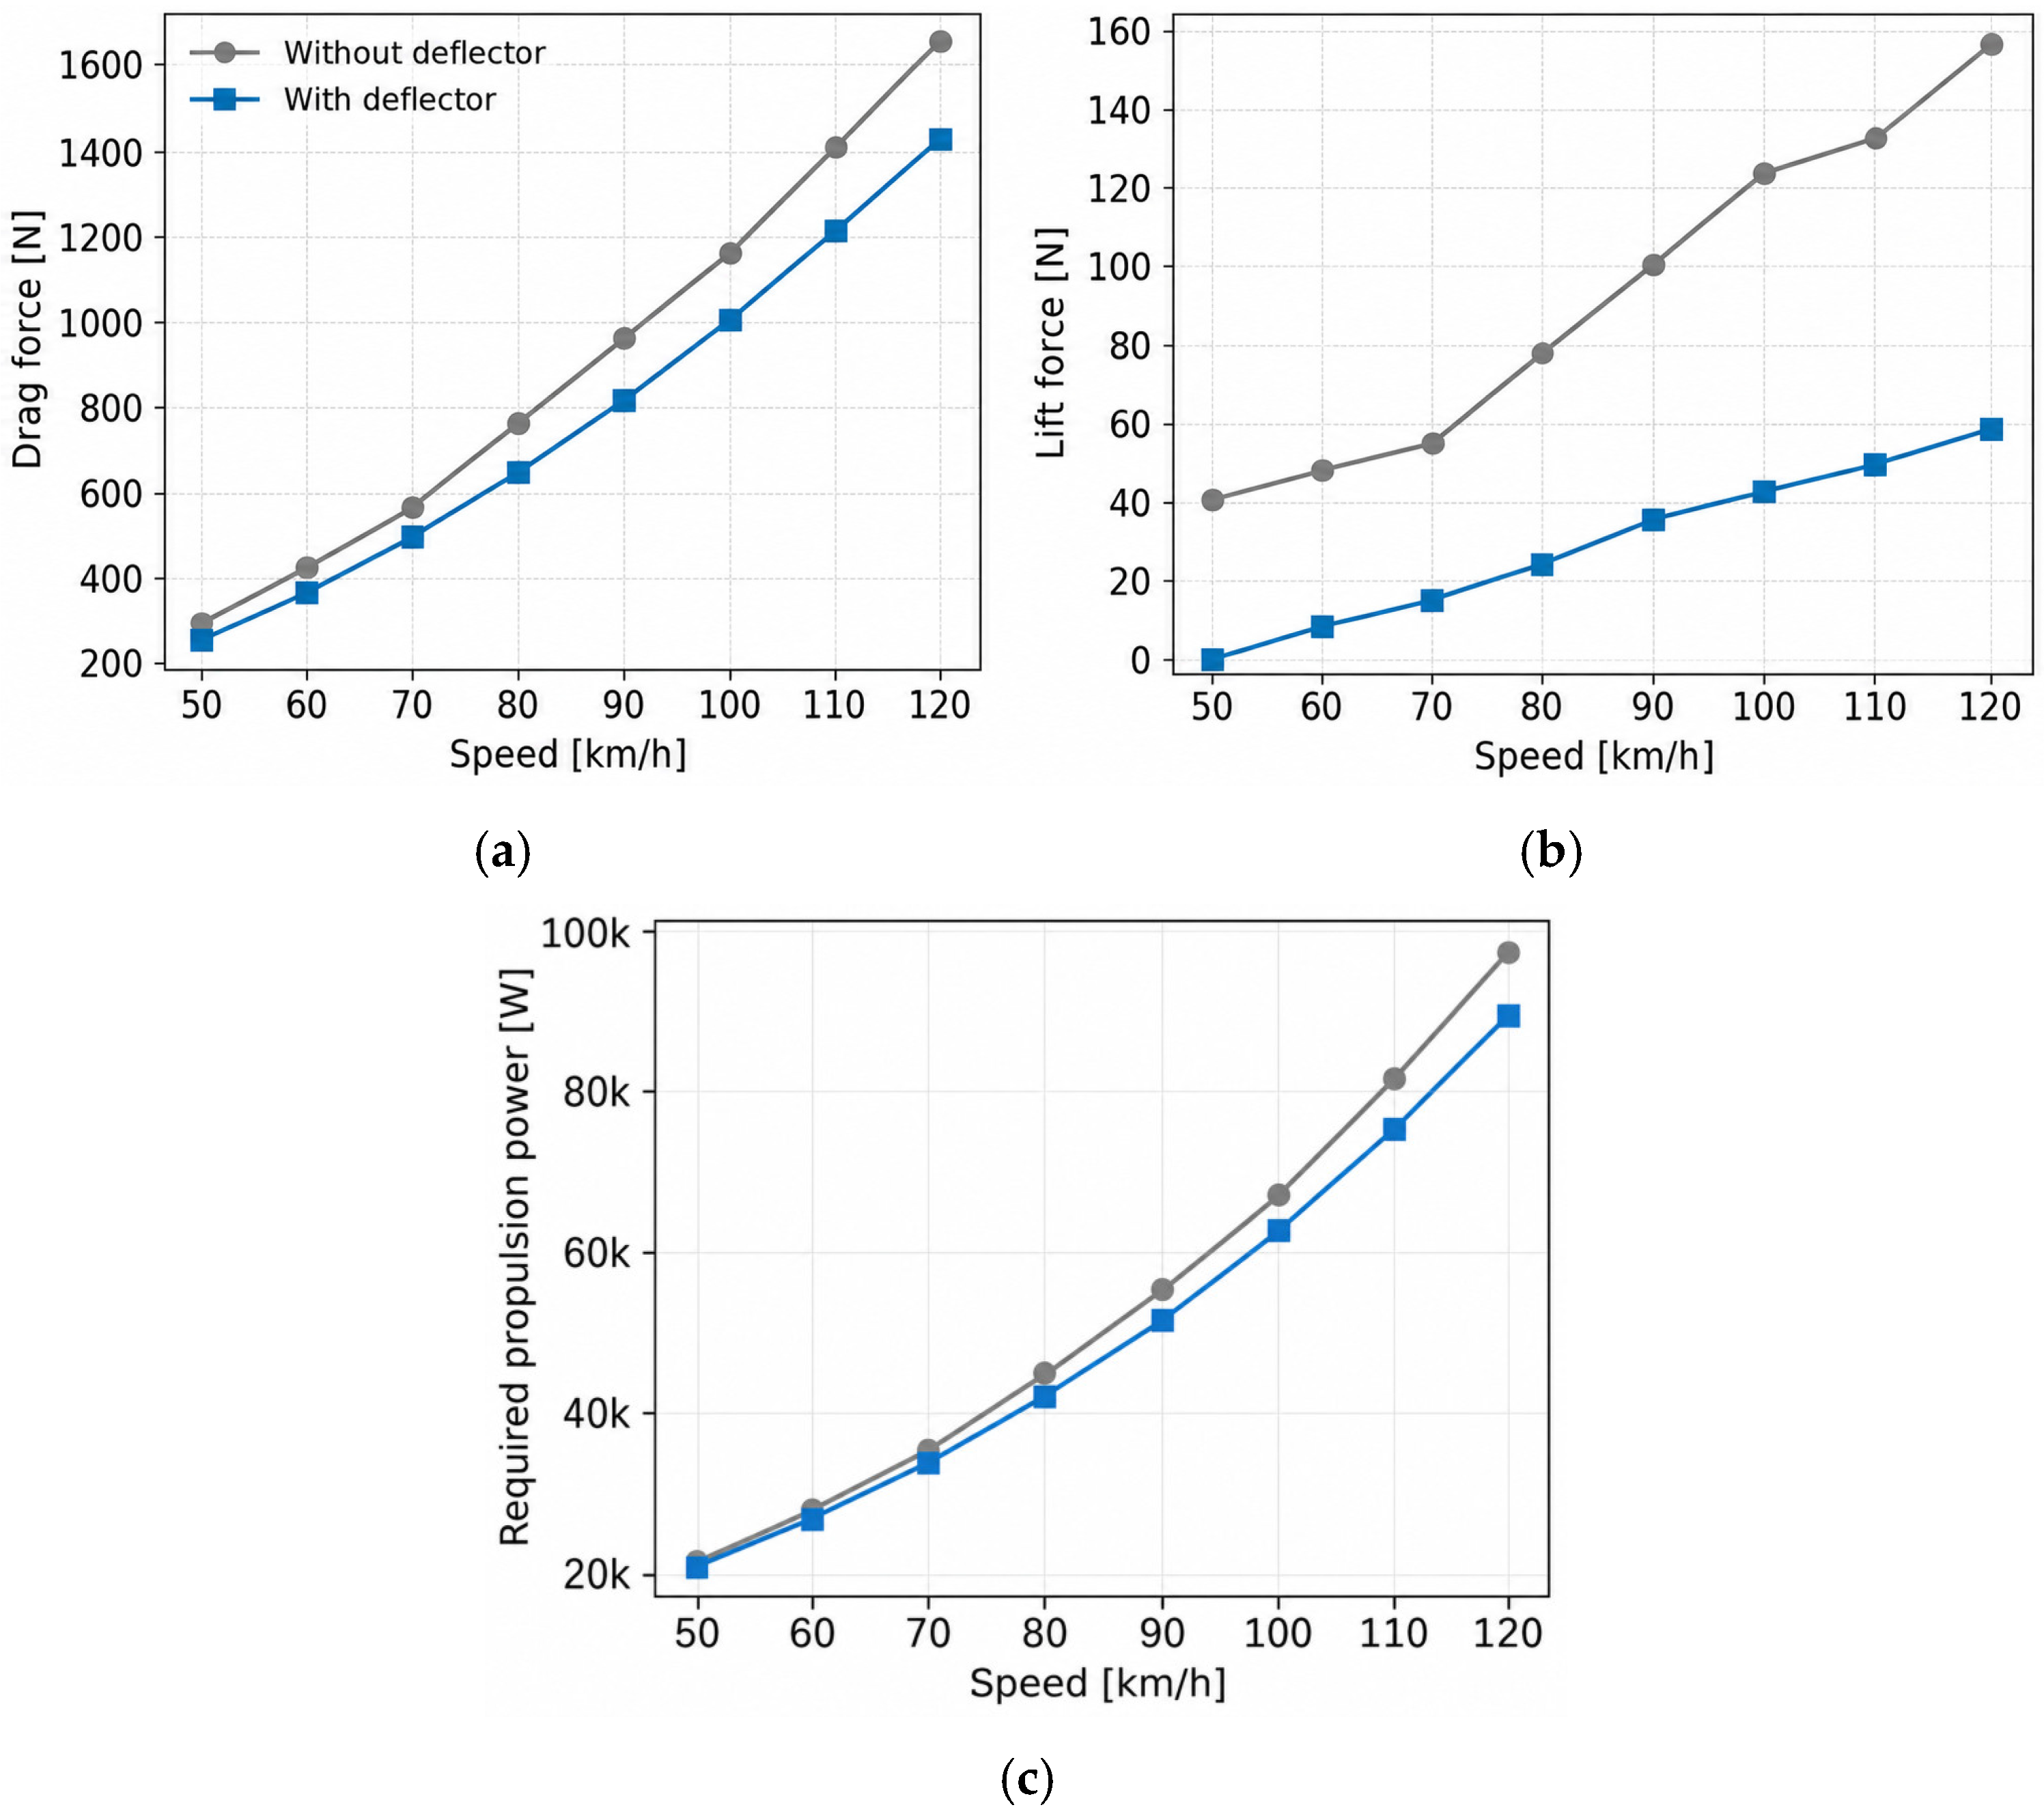
Figure 7 shows the variation in drag force, lift force, and required propulsion power with vehicle speed for both configurations.
As shown in
Figure 7a, the drag force increased continuously with speed. In the baseline configuration, it increased from 295.06 N at 50 km/h to 1669.82 N at 120 km/h (see
Appendix A). With the front deflector, the corresponding values were 254.76 and 1433.87 N. The deflector therefore produced lower drag force values at every simulated velocity.
Figure 7b shows a similar increase in lift force with vehicle speed. Without the deflector, the lift force increased from 40.69 N at 50 km/h to 155.69 N at 120 km/h (see
Appendix A), whereas the corresponding values with the deflector were 0.35 and 58.51 N. The lift force remained positive in both configurations but was consistently lower with the deflector.
Figure 7c shows that the required propulsion power increased nonlinearly with vehicle speed. The difference between configurations also increased with speed. The mean required propulsion power decreased by 6.4%, while the maximum saving was obtained at 120 km/h, reaching approximately 7.91 kW, equivalent to 8.1% (see
Appendix A).
3.3. Aerodynamic Coefficients
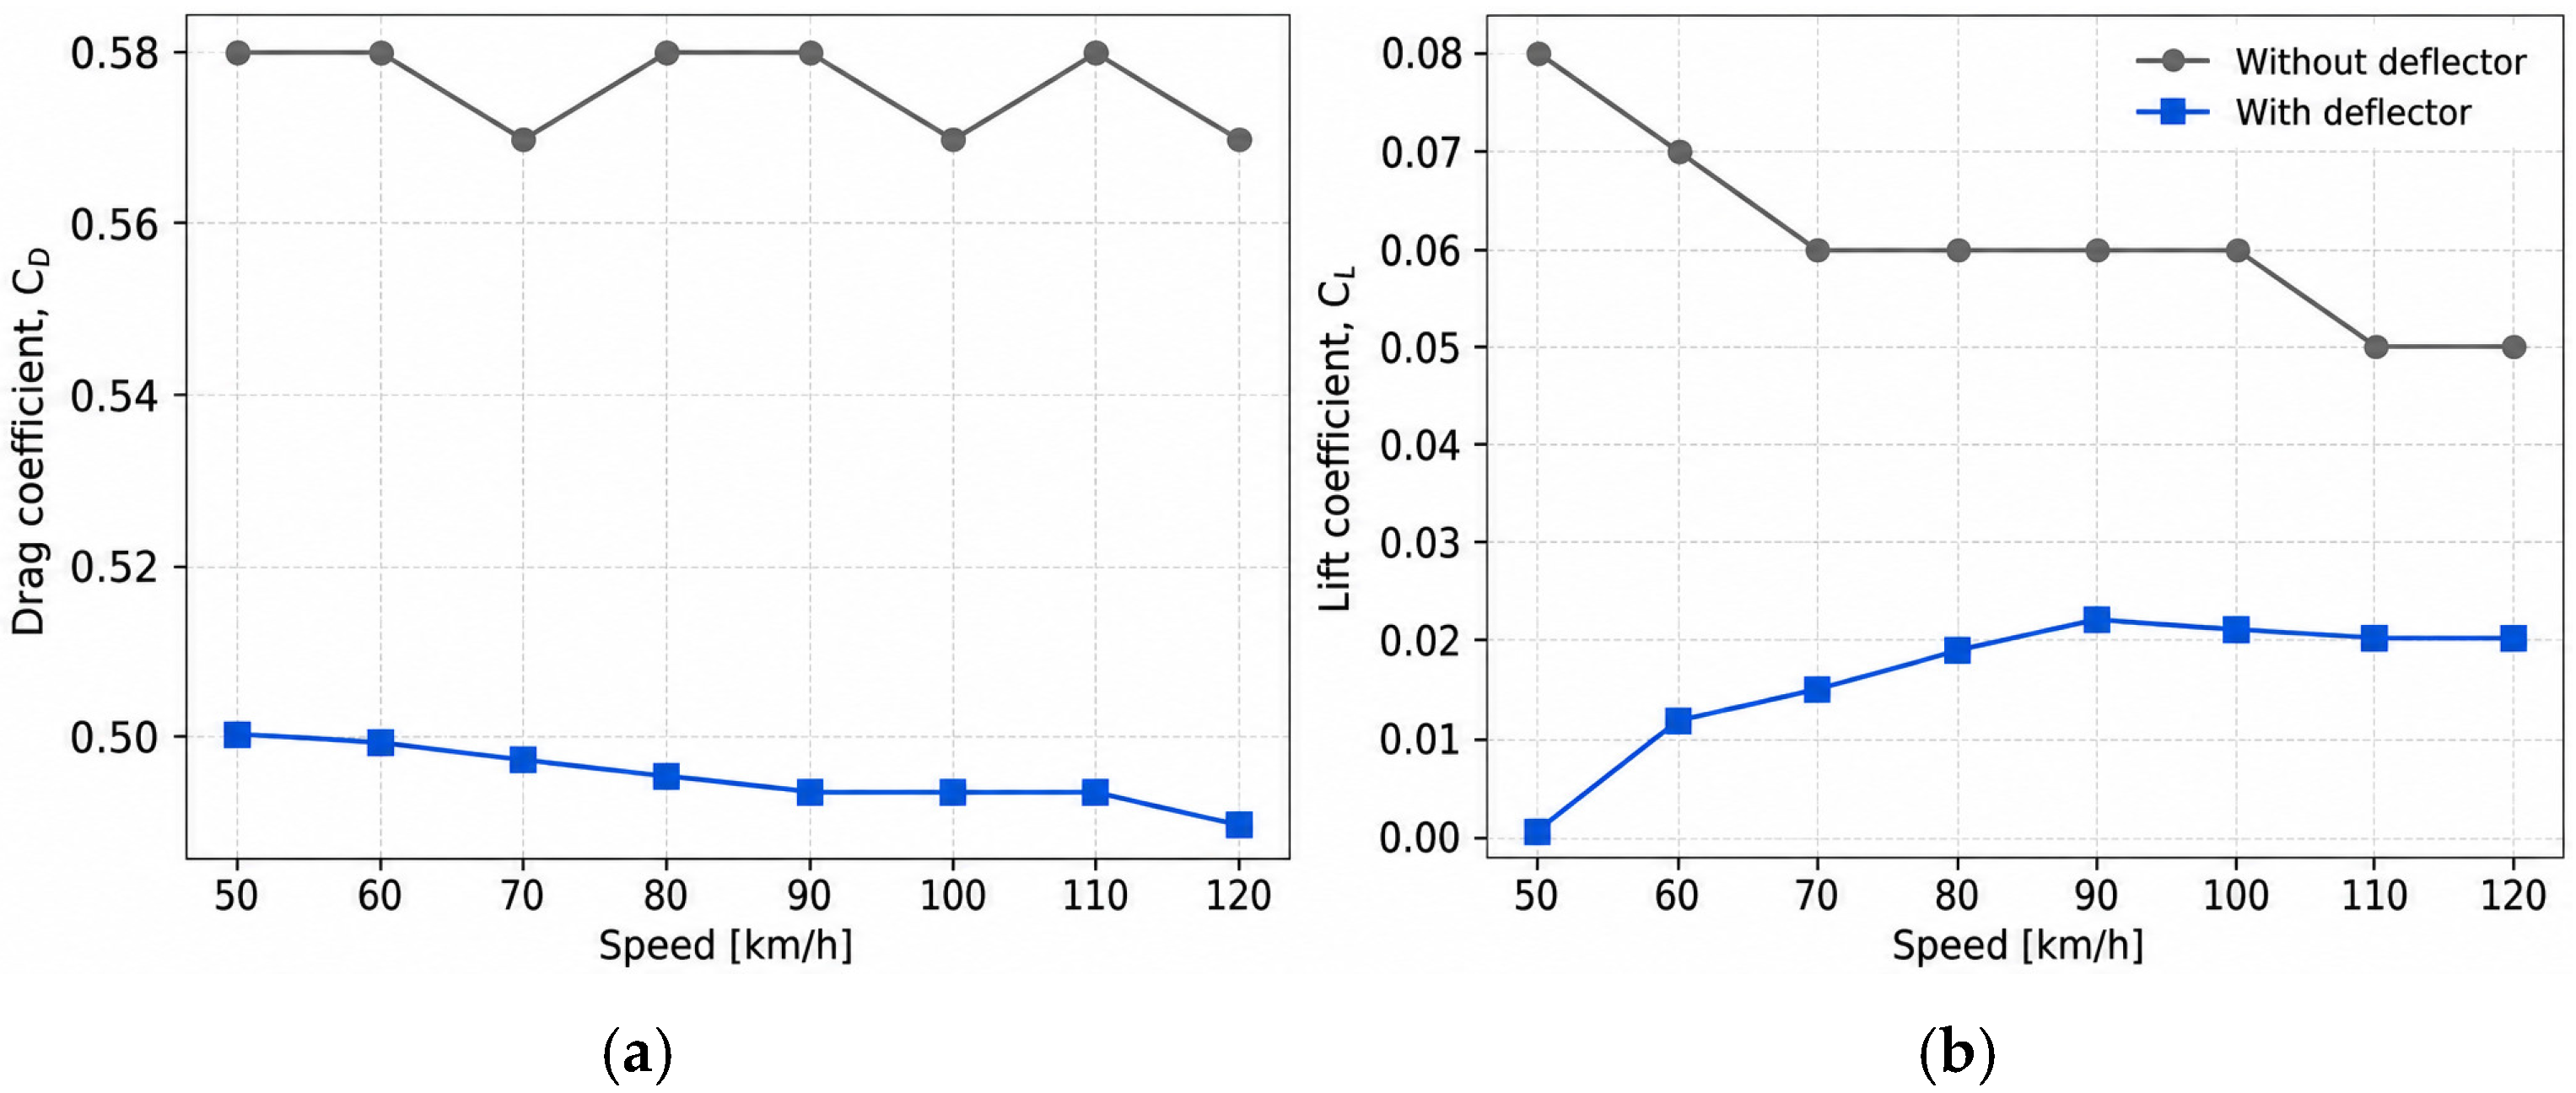
Figure 8 presents the variation in the aerodynamic coefficients with vehicle speed for the baseline and deflector-equipped configurations.
Figure 8a shows the drag coefficient, C
D; varied approximately between 0.57 and 0.58, for the baseline configuration, whereas the deflector-equipped configuration exhibited values between approximately 0.49 and 0.50. Whereas the deflector-equipped configuration exhibited values between approximately 0.49 and 0.50. The mean reduction in C
D was 14.1%.
Figure 8b shows that the lift coefficient was also lower with the deflector over the complete speed range. In the baseline configuration, C
L decreased from 0.08 at 50 km/h to 0.05 at 120 km/h. With the deflector, the values ranged from 0.001 at 50 km/h to approximately 0.020 at 120 km/h. The mean lift coefficient decreased by 73.5%.
Local Velocity and Static Pressure Response
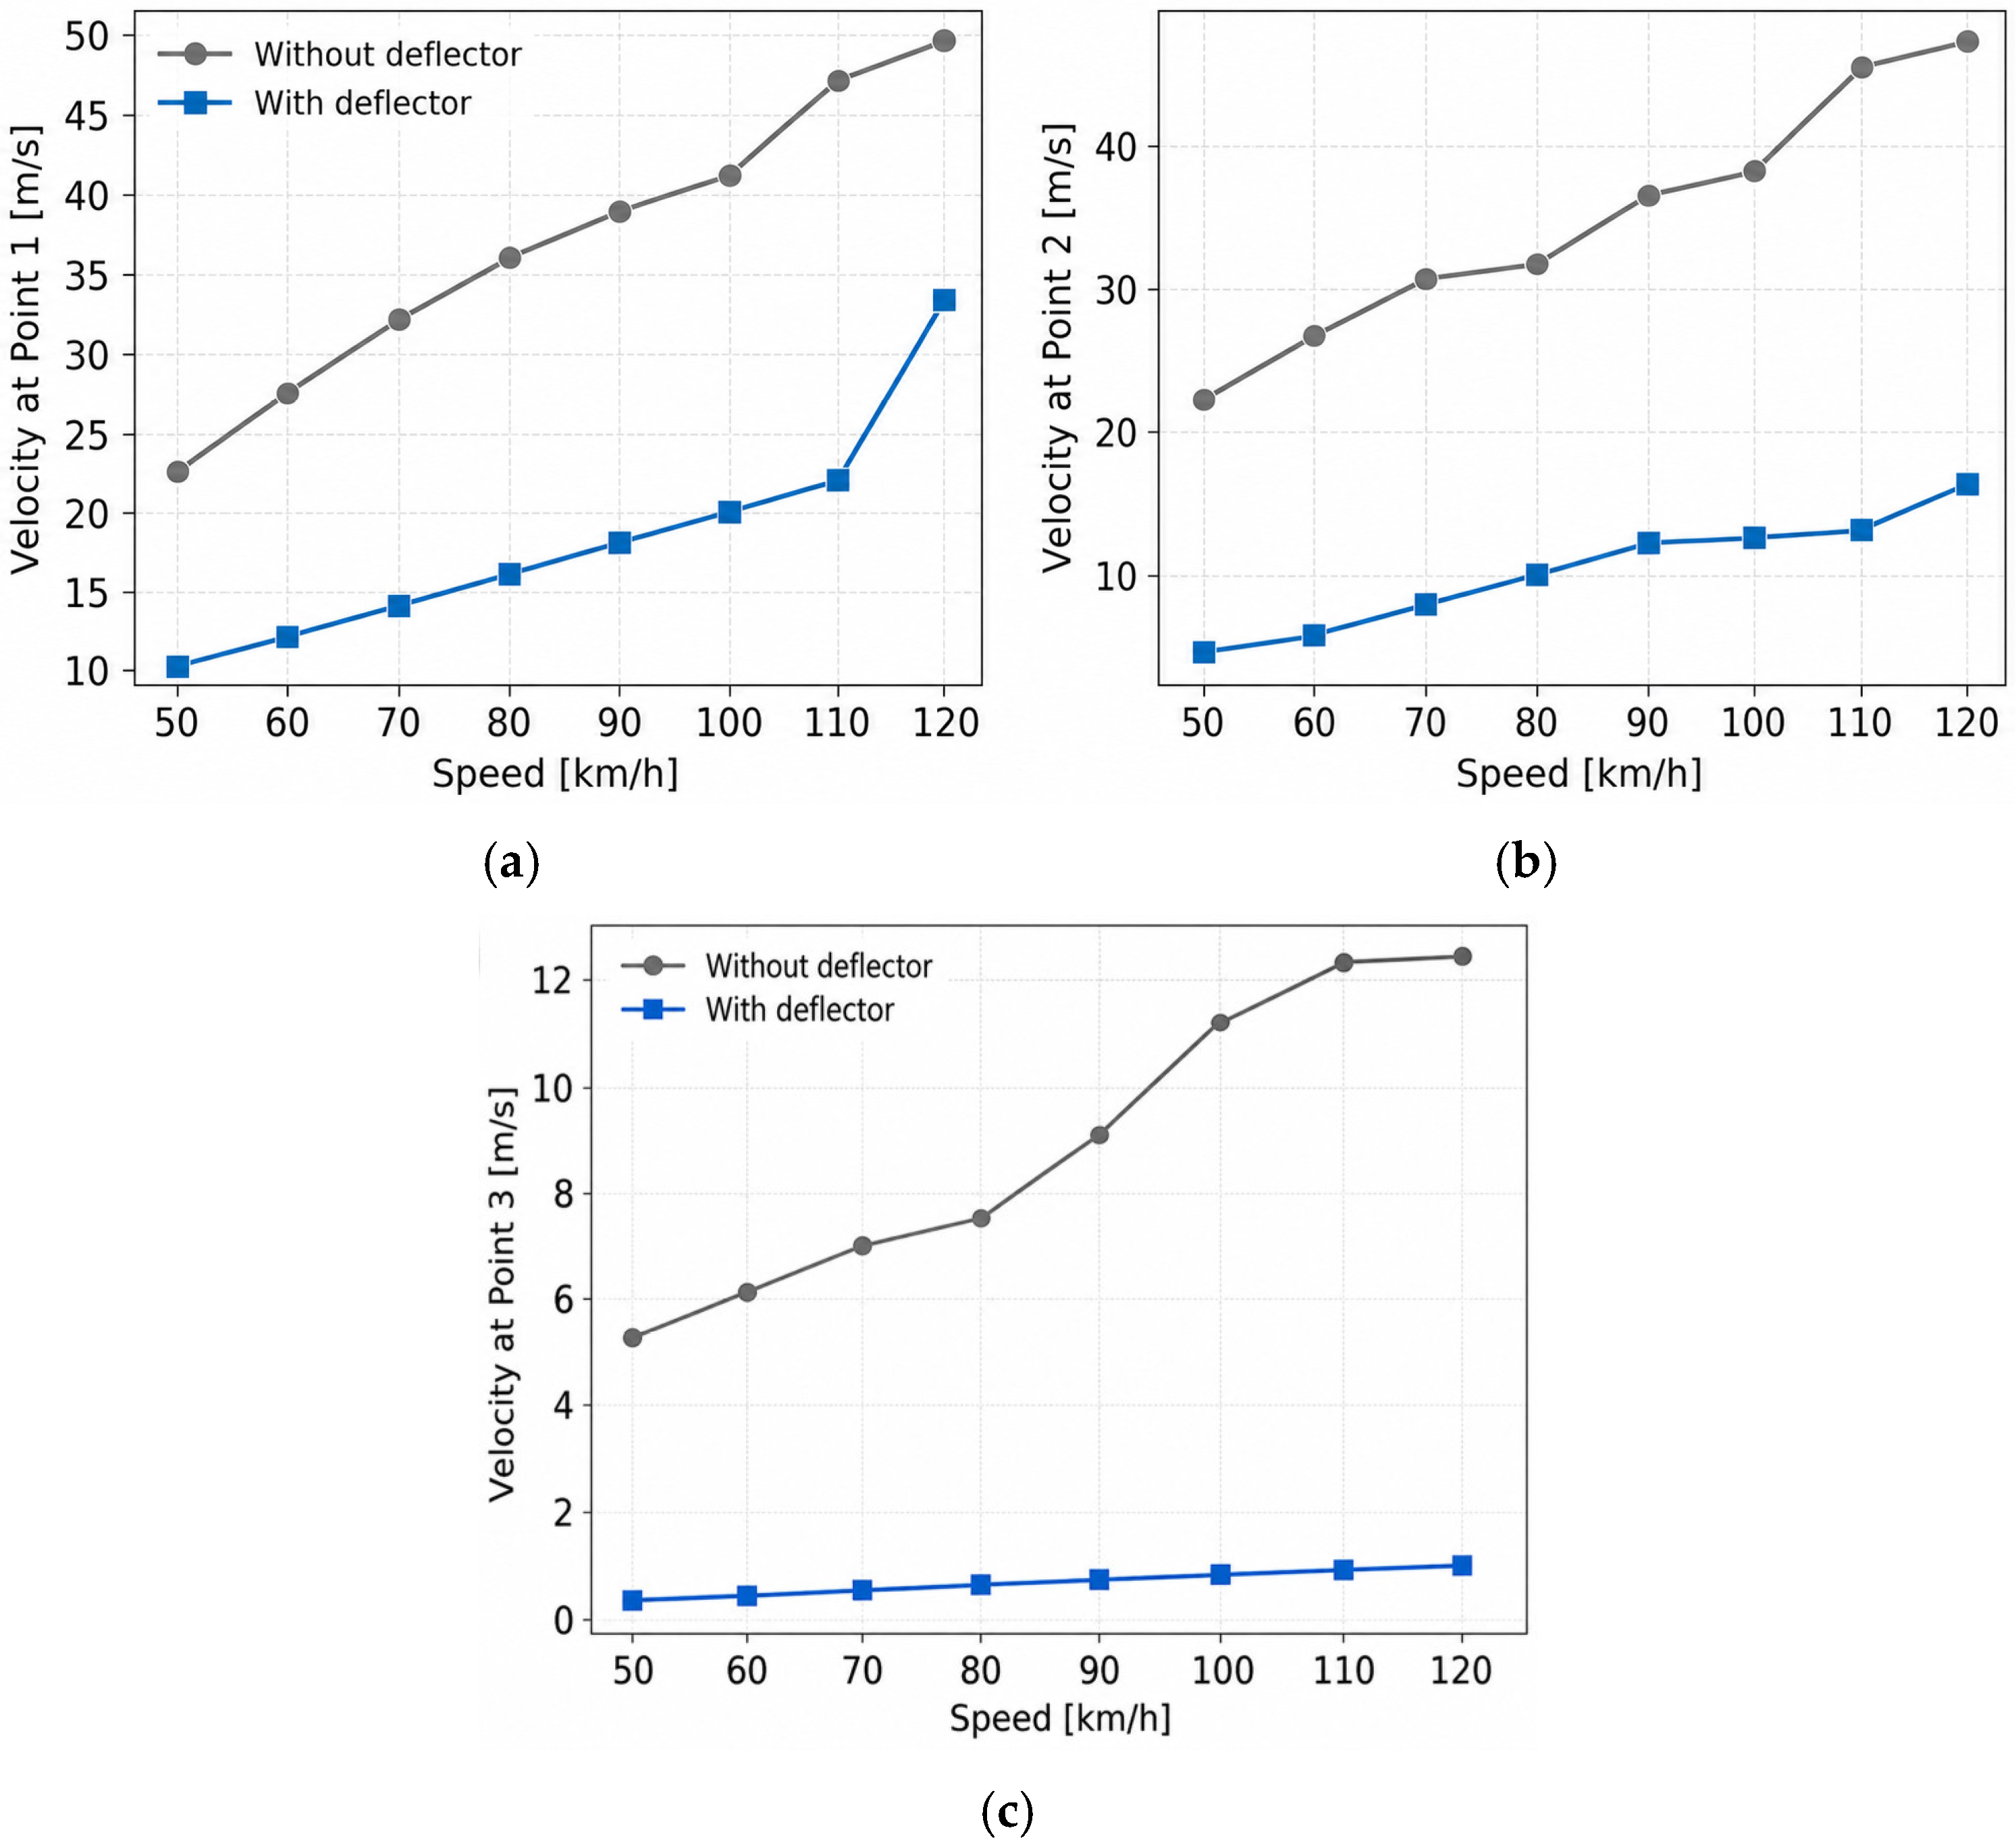
Figure 9 presents the local velocity values obtained at monitoring points P1–P3. At all three points, local velocity generally increased with vehicle speed, while lower values were obtained for the deflector-equipped configuration.
At P1, the mean local velocity decreased from 36.79 to 18.10 m/s. At P2, it decreased from 34.94 to 10.45 m/s, while at P3 it decreased from 8.90 to 0.64 m/s. These reductions correspond to approximately 50.8%, 70.1%, and 92.8%, respectively.
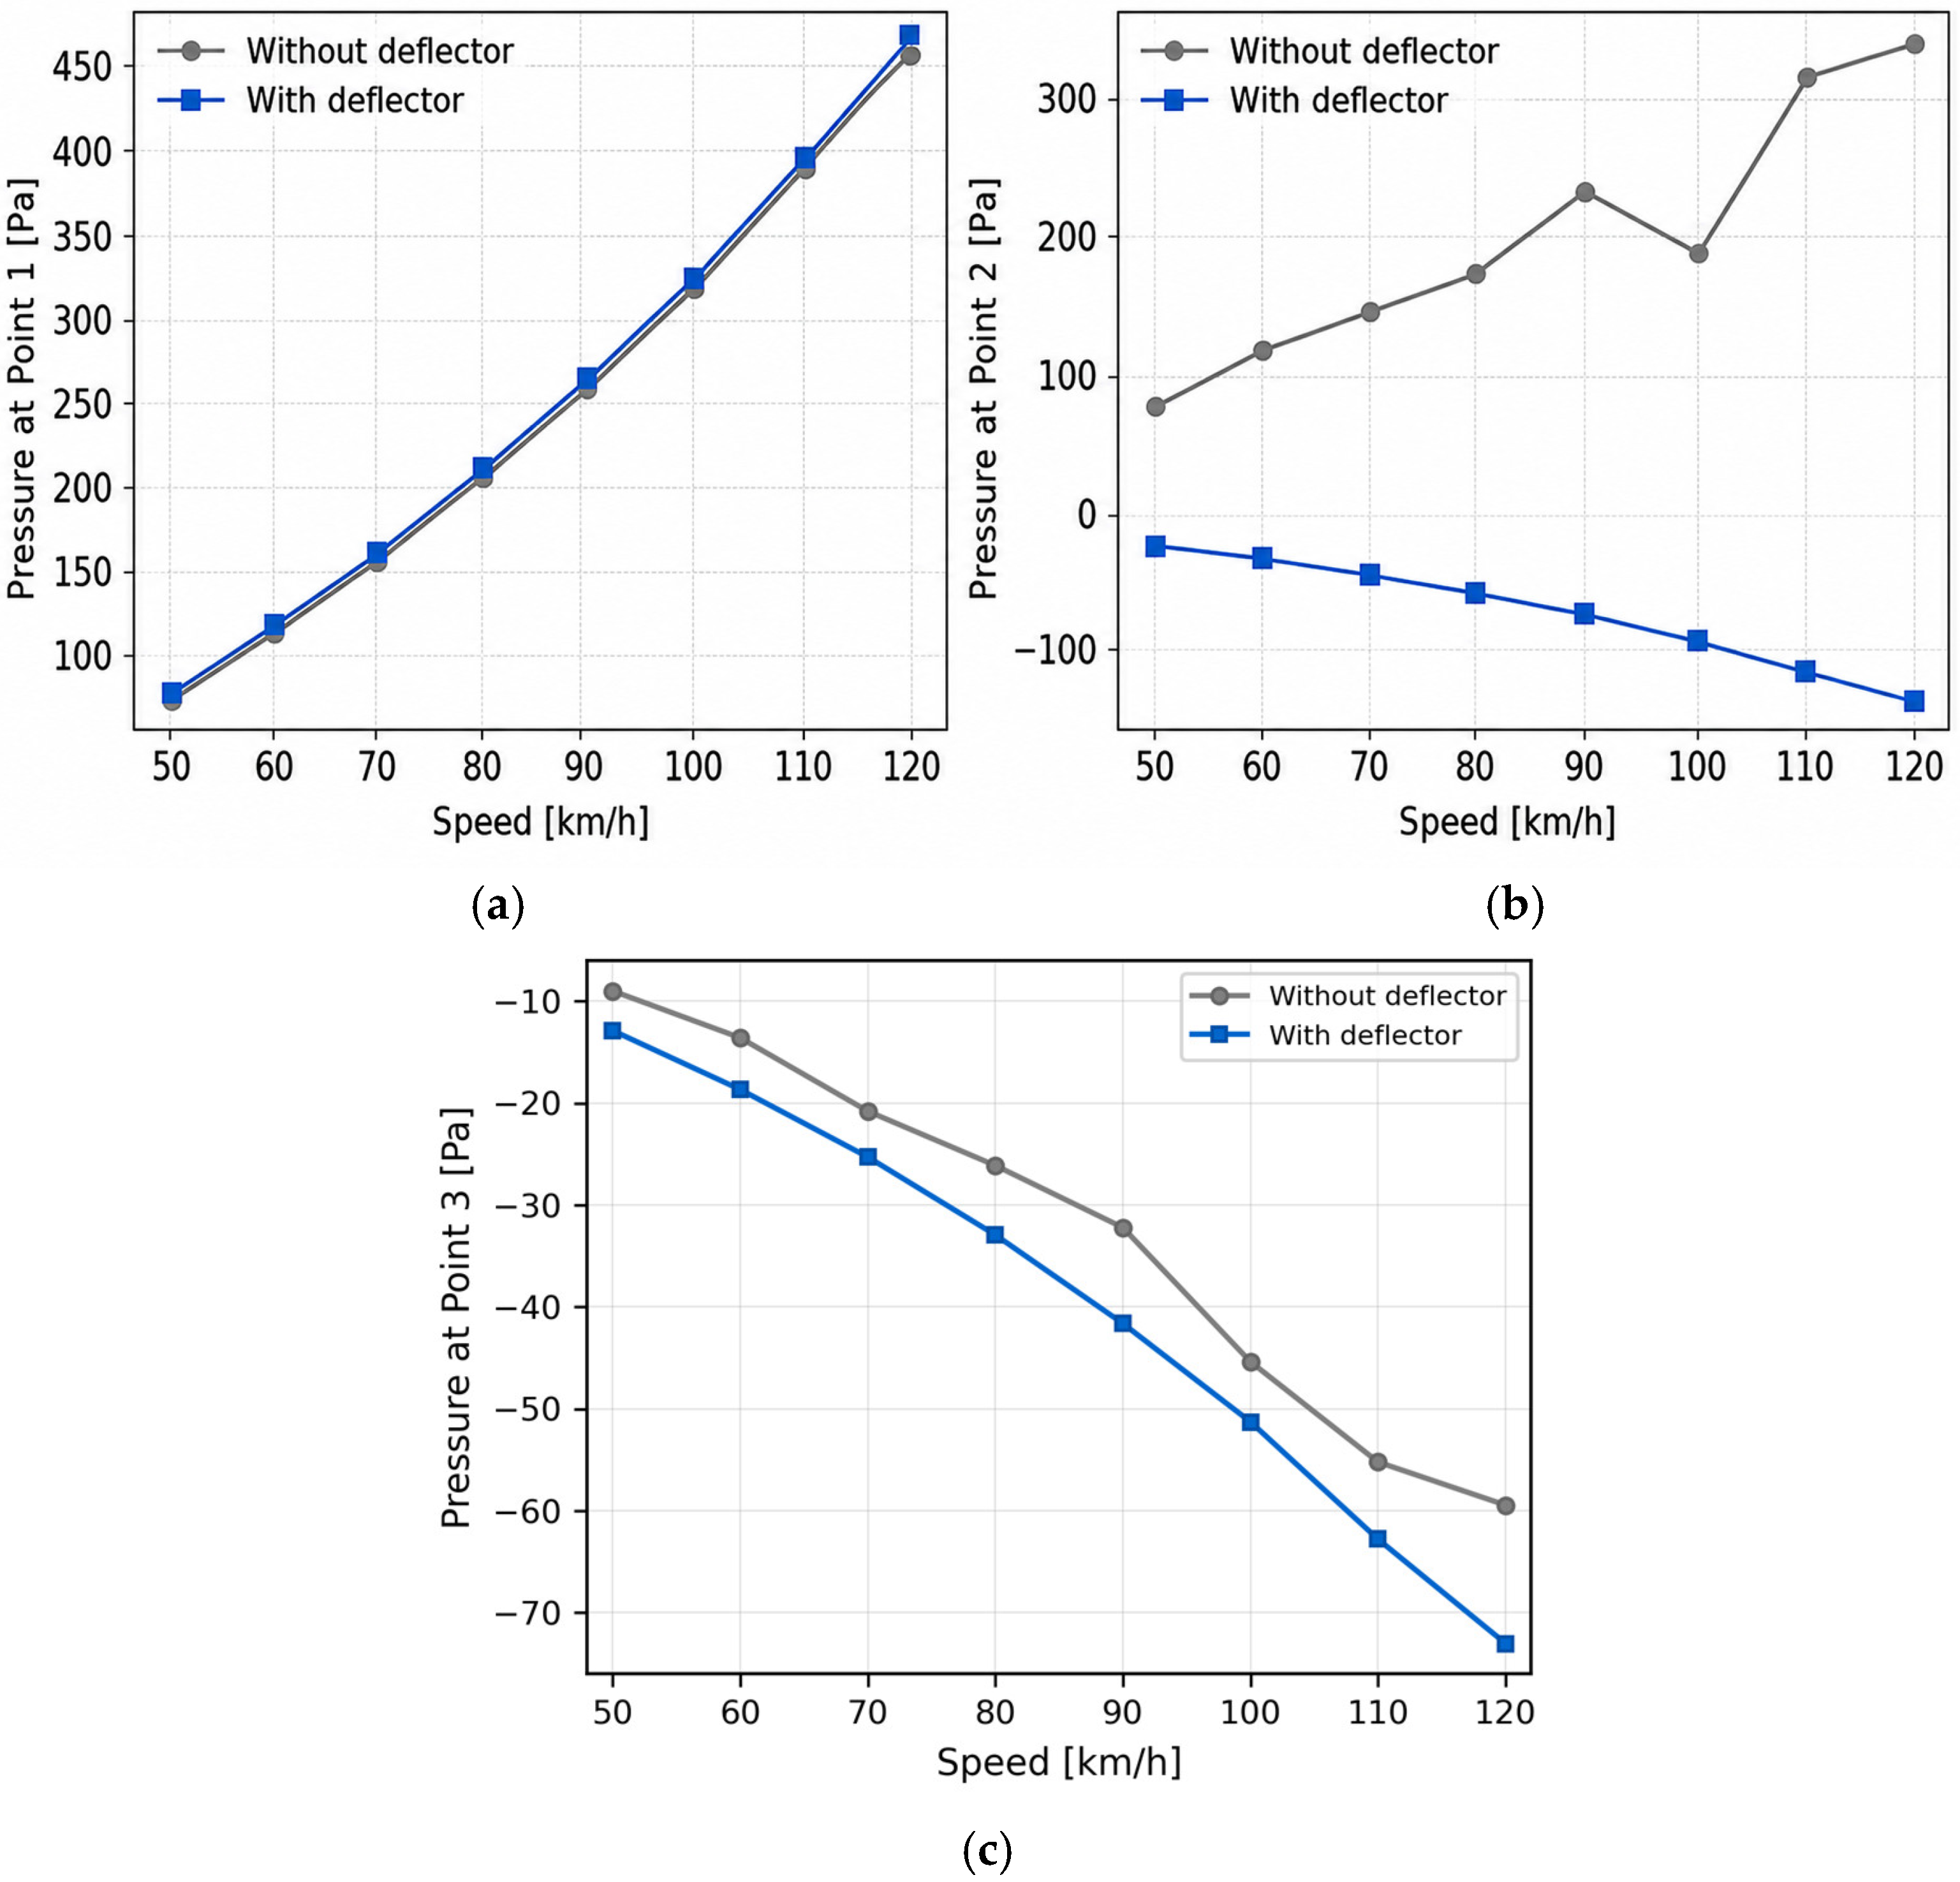
Figure 10 presents the corresponding static pressure values. At P1, pressure increased with vehicle speed and showed only small differences between configurations. At P2, the baseline configuration exhibited positive pressure values, whereas the deflector-equipped configuration produced negative values, reaching approximately −146 Pa at 120 km/h. At P3, negative pressures were obtained for both configurations, with more negative values generally observed with the deflector.
3.4. Surface Pressure-Coefficient Distributions
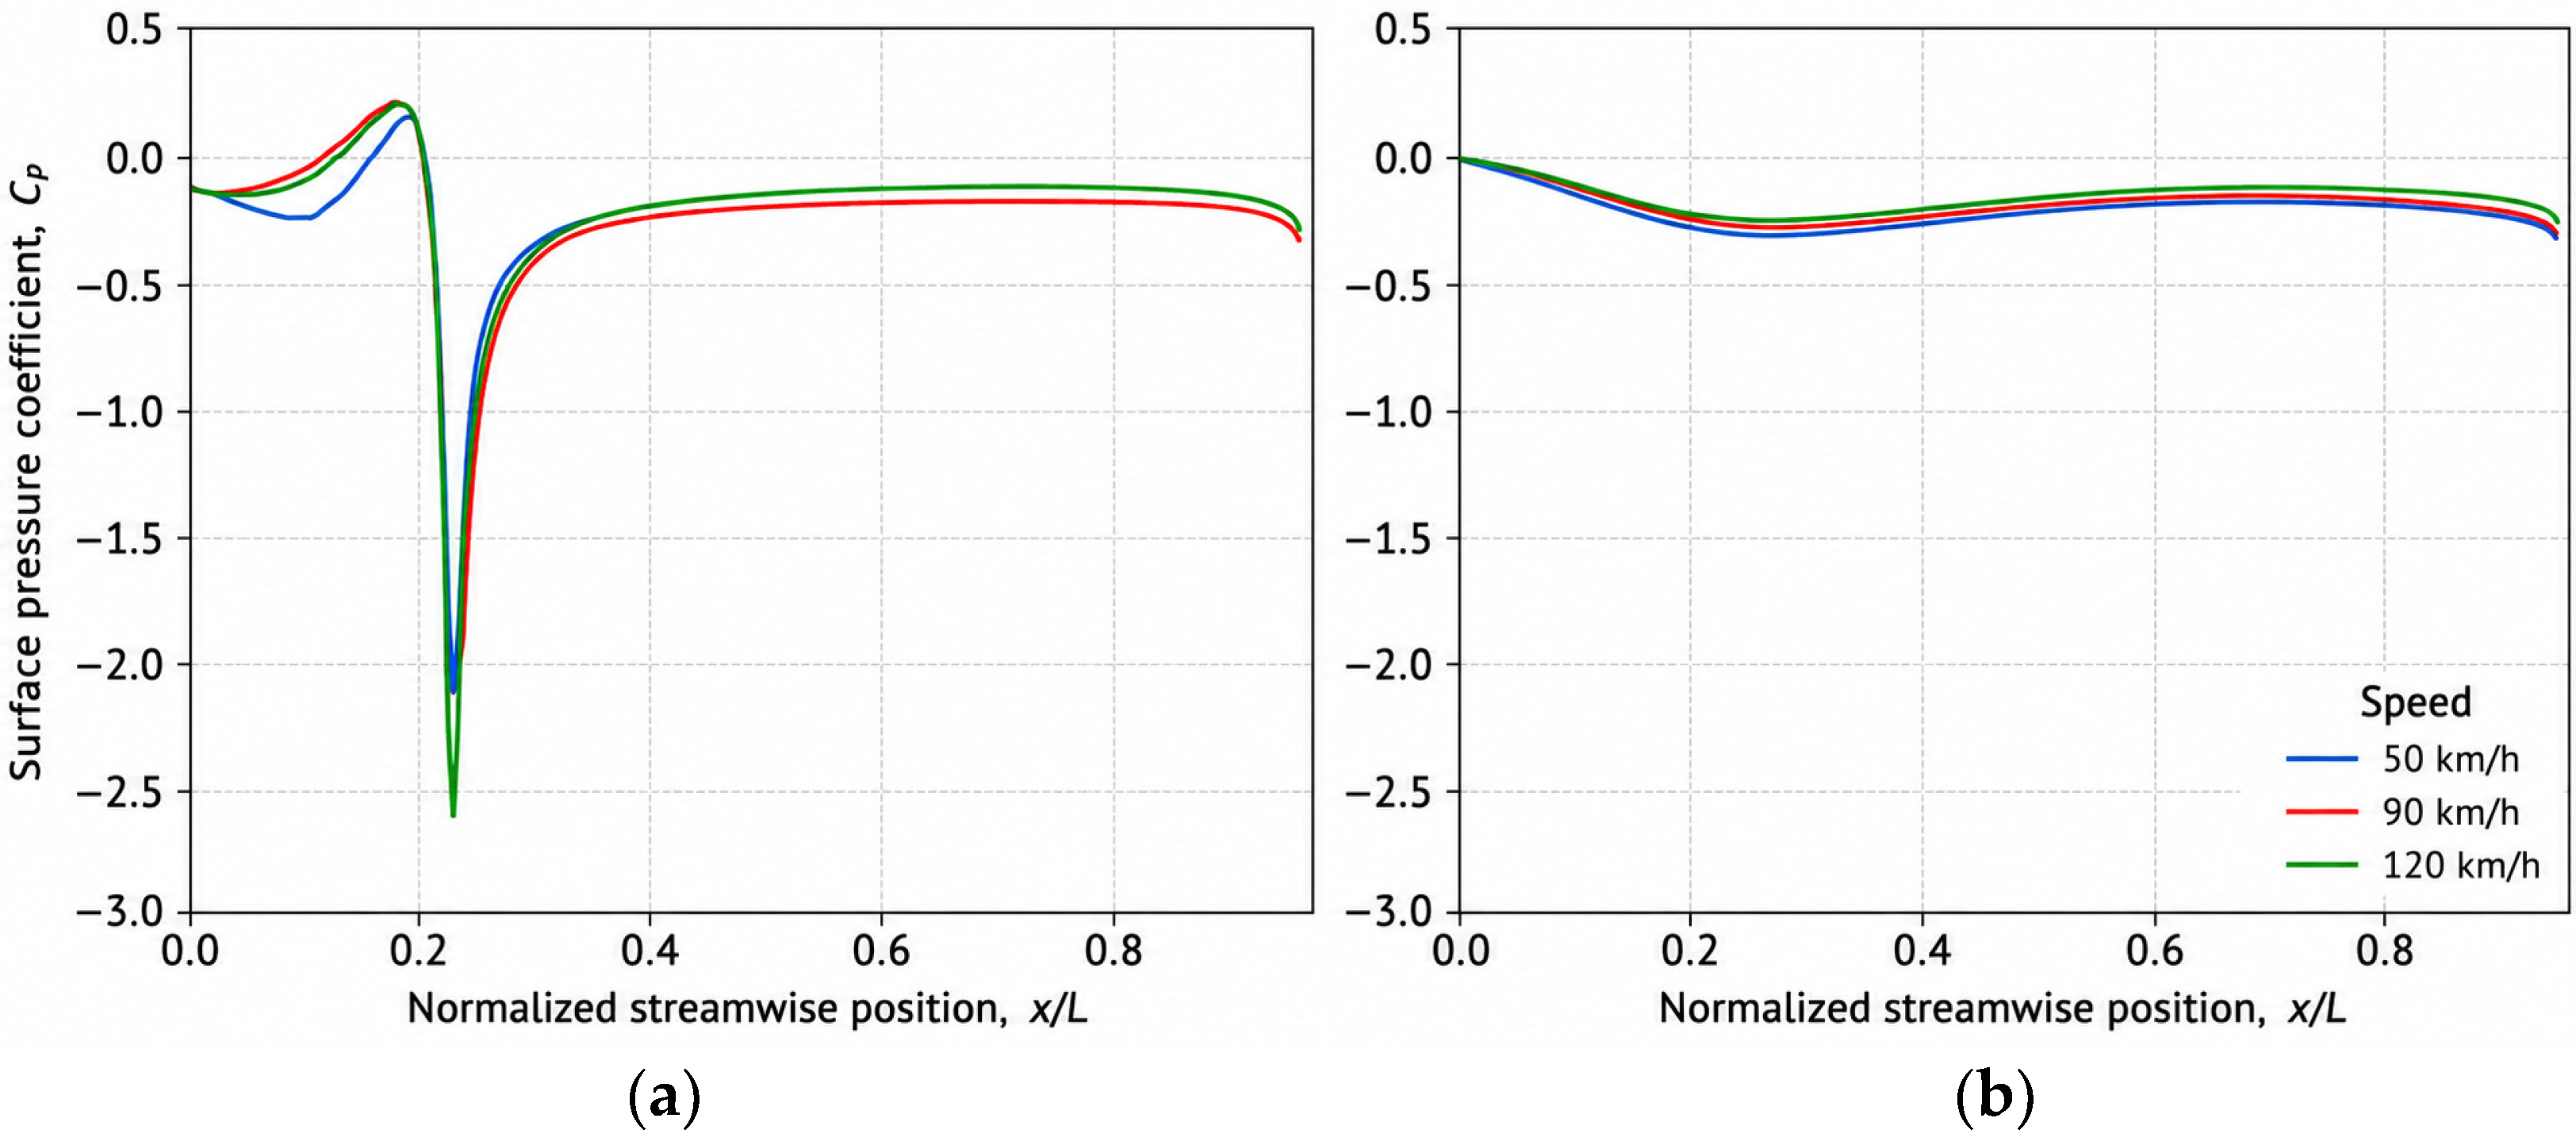
Figure 11 presents the surface pressure-coefficient distributions along the normalized streamwise coordinate x/L at 50, 90, and 120 km/h.
For the baseline configuration,
Figure 11a shows a pronounced negative C
P peak near x/L ≈ 0.23, with values ranging approximately from −2.1 to −2.6, depending on vehicle speed. Downstream of this location, the pressure-coefficient partially recovered but remained predominantly negative.
For the deflector-equipped configuration,
Figure 11b shows smoother C
P variations, with most values lying approximately between 0 and −0.3. The pronounced negative peak observed in the baseline configuration was substantially attenuated at all three analyzed speeds.
The results presented above quantify the effects of the front deflector on the aerodynamic loads, local flow variables, and propulsion-power demand. The following section discusses the physical mechanisms underlying these changes, particularly the flow reorganization at the cab–box transition and the resulting modifications in drag, lift, and power requirements.
4. Discussion
The results show that the front deflector produces a consistent aerodynamic benefit over the entire investigated speed range. Rather than acting only as a local attachment, the deflector modifies the flow path between the cab and the cargo box, thereby altering the pressure distribution, aerodynamic loads, and required propulsion power. The following subsections discuss the physical mechanisms associated with these changes, compare the findings with previous studies, and identify the main practical implications and limitations of the numerical approach.
4.1. Global Aerodynamic Performance
The reduction in drag obtained with the front deflector remained nearly constant throughout the 50–120 km/h range, as reflected by the relatively stable difference in CD between the two configurations. This behavior indicates that the deflector primarily modifies the overall pressure-drag mechanism rather than producing a benefit restricted to a single operating speed. For a bluff-body vehicle such as a box truck, aerodynamic resistance is strongly influenced by pressure differences between the frontal and downstream regions. The lower CD values obtained with the deflector are therefore consistent with a more favorable redistribution of surface pressure and a reduction in pressure-related losses.
The reduction in drag directly affected the required propulsion power. Because the total tractive force includes both rolling resistance and aerodynamic drag, the corresponding power demand comprises a component approximately proportional to vehicle speed and an aerodynamic component that increases approximately with the cube of speed. Consequently, the relative benefit of the deflector became more evident at the upper end of the investigated range, where aerodynamic drag represented a larger fraction of the total resistance to motion.
The deflector also produced a substantial reduction in positive lift. Because the calculated lift remained positive, the result should not be interpreted as the generation of aerodynamic downforce, but rather as a reduction in aerodynamic unloading. In other words, the upward force acting on the vehicle was reduced, slightly increasing the effective normal load on the tires. Nevertheless, the magnitude of this change is small relative to the vehicle weight; therefore, no direct conclusion regarding handling or tire adhesion can be established from the present steady-state aerodynamic analysis alone.
4.2. Local Flow Reorganization
The local velocity and pressure values recorded at P1–P3 indicate that the deflector alters the flow field differently depending on the position around the vehicle. At P1, located near the frontal region, the pressure response changed only slightly between configurations, suggesting that the main stagnation behavior at the vehicle front was not substantially modified.
The most pronounced differences occurred near P2, at the cab–box transition. In this region, the deflector produced a marked decrease in local velocity and changed the static pressure from positive to negative values. These simultaneous changes should not be interpreted through a simplified Bernoulli relationship. P2 represents only a local numerical sampling point and may lie within a region influenced by recirculation, geometry-induced suction, or displacement of the principal external flow. Therefore, the variations at P2 are better interpreted as indicators of local flow reorganization rather than as direct proof of the complete drag-reduction mechanism.
At P3, the lower velocity values obtained with the deflector indicate that the upstream modification of the flow also affects the downstream region. However, because a single monitoring point cannot fully characterize the wake structure, these values should be interpreted together with the pressure contours, surface CP distributions, and integrated aerodynamic forces.
Surface-Pressure Mechanism
The surface pressure-coefficient distributions provide a broader interpretation of the aerodynamic mechanism than the isolated monitoring points. In the baseline configuration, the pronounced negative CP peak near the cab–box transition indicates a strong pressure disturbance associated with the abrupt geometric change between the cab roof and the cargo body. Such a feature is characteristic of a region where the flow is rapidly redirected and may experience strong adverse pressure gradients.
With the deflector, the CP distributions become smoother and the sharp negative peak is markedly attenuated. This behavior suggests smoother flow redirection at the cab–box transition and lower pressure losses in the separated-flow region, consistent with the reductions in drag and lift.
Nevertheless, the available evidence does not fully quantify flow separation or wake recirculation. A more detailed assessment would require velocity vectors, streamlines, wall-shear-stress distributions, vorticity contours, or transient analysis. Therefore, the pressure-coefficient results indicate flow reorganization but do not provide a complete characterization of the separated-flow topology.
Overall, the aerodynamic benefit of the deflector is attributed primarily to the modification of the cab–box transition flow, which produces a more gradual pressure variation and a more favorable distribution of aerodynamic loads. This mechanism is consistent with the reductions observed in drag coefficient, lift coefficient, and required propulsion power.
4.3. Comparison with Previous Studies
The drag reduction obtained in the present study is within the range reported for aerodynamic add-on devices applied to trucks and other large road vehicles. Previous studies have shown that cab-mounted deflectors, roof fairings, rear extensions, and other flow-control devices can reduce aerodynamic resistance by modifying pressure gradients and wake development [
1,
5,
14,
16]. The present results therefore agree with the general trend reported in the literature (see
Table 6), although the exact magnitude of the improvement depends strongly on vehicle geometry, deflector shape, Reynolds number, yaw angle, ground treatment, and turbulence-model selection.
The average reduction in CD obtained here is comparable with the improvements reported for several truck and bus configurations equipped with external aerodynamic devices. However, direct numerical comparison should be made cautiously because some studies report drag-force reduction, others report drag-coefficient reduction, and others infer fuel-consumption benefits. These quantities are related but not equivalent.
A specific contribution of the present work is the simultaneous evaluation of drag, lift, and required propulsion power over a broad speed range. While many studies focus on drag coefficient at a single operating condition, the present analysis links aerodynamic modification to the mechanical power required to overcome road-load resistance. Including lift also provides insight into the vertical aerodynamic response, although full vehicle-dynamics effects are beyond the scope of this study.
4.4. Engineering Implications
From an engineering perspective, the results indicate that a front deflector can provide a consistent reduction in aerodynamic resistance without requiring major modification of the vehicle body. The benefit becomes increasingly relevant at higher speeds, where aerodynamic drag contributes more strongly to total propulsion-power demand.
The reduction in required propulsion power should not be interpreted directly as an equivalent reduction in fuel consumption, because engine efficiency, transmission losses, driving cycle, road gradient, vehicle loading, and operating strategy were not included. Nevertheless, the lower wheel-level power requirement indicates a clear potential for reducing energy consumption under comparable operating conditions.
The results also show that the deflector modifies the positive lift acting on the vehicle. Although the effect is small relative to vehicle weight, it demonstrates that aerodynamic add-on devices can influence not only drag but also the vertical load distribution. This aspect should be considered in future optimization studies, particularly when deflector geometry is varied.
4.5. Study Limitations and Future Research Directions
This study was conducted using steady-state CFD simulations under zero-yaw conditions, providing a suitable framework for comparing the aerodynamic behavior of the baseline and deflector-equipped configurations. However, this approach does not account for transient flow effects, crosswind conditions, or unsteady vortex dynamics that can occur during real-world driving conditions.
Furthermore, the road surface was modeled as a stationary wall and the wheels as non-rotating. Although these assumptions reduce computational complexity and are common in comparative aerodynamic studies, they may affect the absolute values of drag, lift, and near-ground flow. Therefore, the results should be interpreted mainly in terms of relative differences between configurations rather than as a complete representation of real road conditions.
Future research should consider moving-ground conditions [
19], wheel rotation [
20,
21], crosswinds [
22,
23], different vehicle load states, and optimization of the deflector angle, height, and position [
24]. Wind-tunnel or on-road validation would strengthen the findings and better relate the numerical results to real-world energy-consumption benefits [
5].
5. Conclusions
CFD simulations of the Chevrolet NQR 1015 medium-duty truck over the 50–120 km/h range showed the expected increase in aerodynamic drag with vehicle speed. The aerodynamic contribution to the required propulsion power increased approximately with the cube of speed, whereas the total tractive-power demand also included the rolling-resistance contribution. Mesh characterization and grid-independence assessment supported the numerical consistency of the observed trends.
The front deflector produced consistent aerodynamic improvements under the modeled conditions. Mean drag force decreased by 14.2%, while the mean drag coefficient decreased by 14.1%. These reductions lowered the mean total tractive force and reduced the mean required tractive power from 53.86 to 50.39 kW, corresponding to a 6.4% reduction. The maximum power saving reached 8.1% at 120 km/h, indicating that the benefit becomes more pronounced as aerodynamic resistance accounts for a larger fraction of the total road load.
The deflector also reduced the positive vertical aerodynamic load. Mean lift force decreased by 67.9%, and the mean lift coefficient decreased by 73.5%. Because lift remained positive, this result represents a reduction in aerodynamic unloading rather than the generation of downforce. However, the change was small relative to the vehicle weight, and no direct conclusions regarding handling or tire adhesion can be drawn from the present steady-state aerodynamic analysis alone.
The pressure, velocity, and surface pressure-coefficient results suggest that the primary aerodynamic mechanism is associated with flow reorganization at the transition between the cabin and the box. The deflector promotes a smoother flow redirection, attenuates suction peaks, and suggests lower pressure losses associated with the separated flow and wake regions.
Future work should include experimental validation through wind-tunnel or road measurements, along with simulations incorporating moving ground, rotating wheels, transient flow effects, and crosswind. Additional geometric optimization of the deflector angle and position is also recommended to further improve the balance between drag reduction, lift behavior, and propulsion-power demand.