1. Introduction
Automotive seat pressure sensing provides a non-invasive modality for occupant state recognition and adaptive seat functions in intelligent cockpits. Because the seat pressure distribution reflects the contact load between the occupant and the seat, it can provide physically interpretable information for weight-related occupant sensing tasks [
1]. Variations in body weight, body shape, and sitting posture alter the spatial distribution and statistical characteristics of seat pressure signals, making pressure-based occupant weight classification relevant to in-vehicle perception and personalization applications [
2]. In particular, occupant weight class can provide a useful input for personalized seat adjustment, comfort-related optimization, and occupant-adaptive cockpit functions, which is consistent with the increasing use of pressure-based intelligent seat systems for in-cabin behavior and state recognition [
3].
However, the pressure response after seating is not immediately stationary. Soft seat materials exhibit viscoelastic behavior, and the seat–occupant contact interface can continue to redistribute after the occupant sits down [
4]. Under sustained loading, creep-induced deformation may further lead to temporal drift in the measured pressure response, causing the pressure state of the same occupant to vary across decision times [
5]. For short-term occupant weight classification, such time-dependent feature shifts may make the classifier sensitive to the sampling time and reduce the consistency of classification results [
6,
7]. In practical vehicle cabins, posture adjustments, seat adjustments, driving duration, and road-induced disturbances may further change the contact state and return the system to a non-stationary condition [
8,
9]. Therefore, automotive seat pressure signals should not be treated simply as steady inputs for early occupant weight classification.
Previous studies have demonstrated that seat pressure information can be used for sitting posture classification, occupant state recognition, and human parameter estimation in general seat and smart seat scenarios [
10,
11,
12]. Pressure sensor arrays combined with machine learning have also provided practical representations for seated posture monitoring [
13]. In automotive applications, pressure and load sensing embedded in the seat have also been used for occupant related tasks. Existing studies have reported body pressure analysis on car seats using supervised learning and seat load sensing for occupant position and posture monitoring [
14,
15,
16]. Seat-embedded sensing has also been investigated for occupancy detection and classification [
17,
18]. These studies show that automotive seat pressure signals contain information related to occupant state and body characteristics. Nevertheless, most existing work emphasizes sensor layout, feature extraction, classification feasibility, or occupancy-related tasks, while the temporal stability of pressure features during early decision windows has received less attention [
19].
Temporal drift is a known issue in flexible pressure sensors, pressure-sensitive mats, and soft contact interfaces, where sustained loading can induce hysteresis, relaxation, and time-dependent drift because of material viscoelasticity [
20,
21]. Viscoelastic relaxation and creep models for piezoresistive sensors support the use of exponential-type functions to describe short-term creep-related responses [
22]. However, an automotive seat pressure sensing system is not an isolated sensor material. Its measured response is affected by the coupled seat–occupant interface, including contact redistribution, posture variation, and vehicle-related disturbances [
23]. Time-dependent sagging of low-density polyurethane foam in automotive seat cushions indicates that seat cushion creep is essentially a deformation process of soft seat materials [
24], and embedded pressure sensors in urethane foam may also be affected by foam-related stress transmission, stress dispersion, and non-uniform deformation around the sensing element [
25]. In this study, temporal drift is interpreted primarily as a deformation-related pressure response of the seat–occupant system, and drift compensation is examined in the context of automotive seat-pressure-based occupant classification.
For intelligent cockpit and adaptive seat applications, the reliability of occupant weight classification depends not only on classification accuracy at a selected decision time but also on output stability across early decision windows. However, quantitative studies on creep-induced temporal drift and its compensation in short-term occupant weight classification remain limited. In many pressure-based classification studies, temporal variation is mainly handled through filtering, denoising, or fixed-window selection, whereas systematic feature shifts across adjacent decision windows are rarely modeled explicitly.
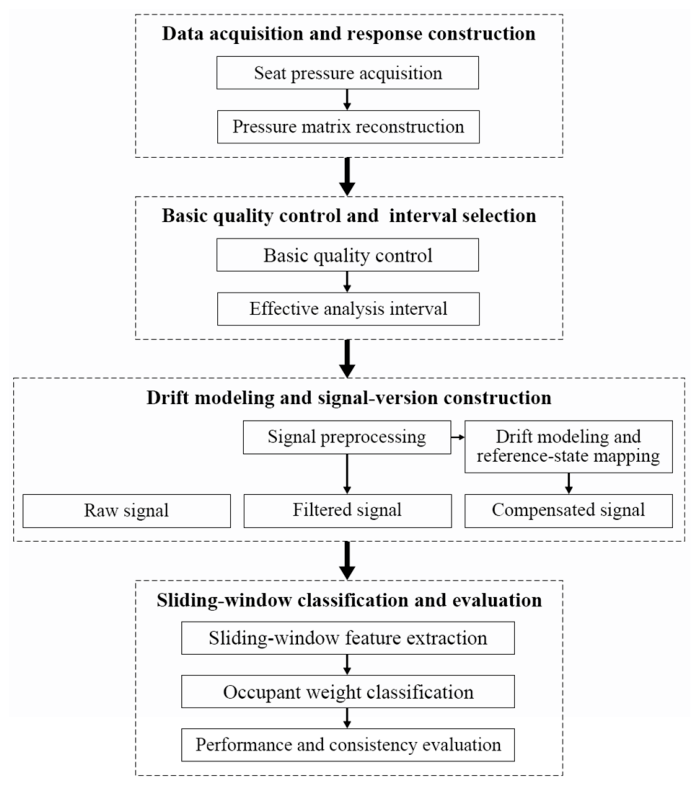
To address this issue, this study investigates creep-induced temporal drift in automotive seat cushion pressure signals and its effect on short-term occupant weight classification. A single-exponential model is used to characterize the short-term pressure evolution after seating, and a reference-state mapping method is developed to compensate for temporal drift across decision windows. Raw, filtered, and compensated signals are then compared using a sliding-window classification task in terms of classification performance and prediction consistency. The overall workflow of this study is summarized in
Figure 1.
The main contributions of this study are threefold. First, it formulates the problem of creep-induced temporal drift in automotive seat pressure sensing for short-term occupant weight classification. Second, it develops a reference state mapping method based on single-exponential drift modeling to improve temporal feature comparability. Third, it introduces a stability-oriented evaluation framework that combines conventional classification metrics with cross-window prediction consistency.
2. Materials and Methods
2.1. Participants and Experimental Protocol
A controlled seated experiment was conducted using an automotive seat equipped with an embedded pressure sensing system. The customized integrated seat pressure-sensing platform was provided by Yanfeng International Automotive Technology Co., Ltd. (Shanghai, China).
Table 1 summarizes the participant and data acquisition information. A total of 30 adult participants were recruited, with body weights ranging from 45 to 94 kg and heights ranging from 155 to 187 cm. Each participant completed 3 repeated trials, and each trial lasted 20 s, resulting in 90 pressure records in total. Before data collection, all participants were informed of the experimental procedure and signed an informed consent form, a safety agreement, and a confidentiality agreement.
During the experiment, participants sat naturally on the test seat with both feet placed on the floor and were instructed to avoid large body movements. A 5 min interval was maintained between consecutive trials, during which the participant left the seat and the seat remained unloaded. Before each trial, the pressure sensing system was reinitialized and zero-calibrated under unloaded conditions. The unloading interval and zero-calibration were used to reduce residual effects between consecutive trials and reset the unloaded sensing baseline. The experiment was conducted under controlled laboratory conditions, with the seat position, sensing equipment, and test procedure kept consistent across trials. Seat pressure signals were continuously acquired at 5 Hz.
2.2. Seat Pressure Sensing and Cumulative Cushion Pressure Response
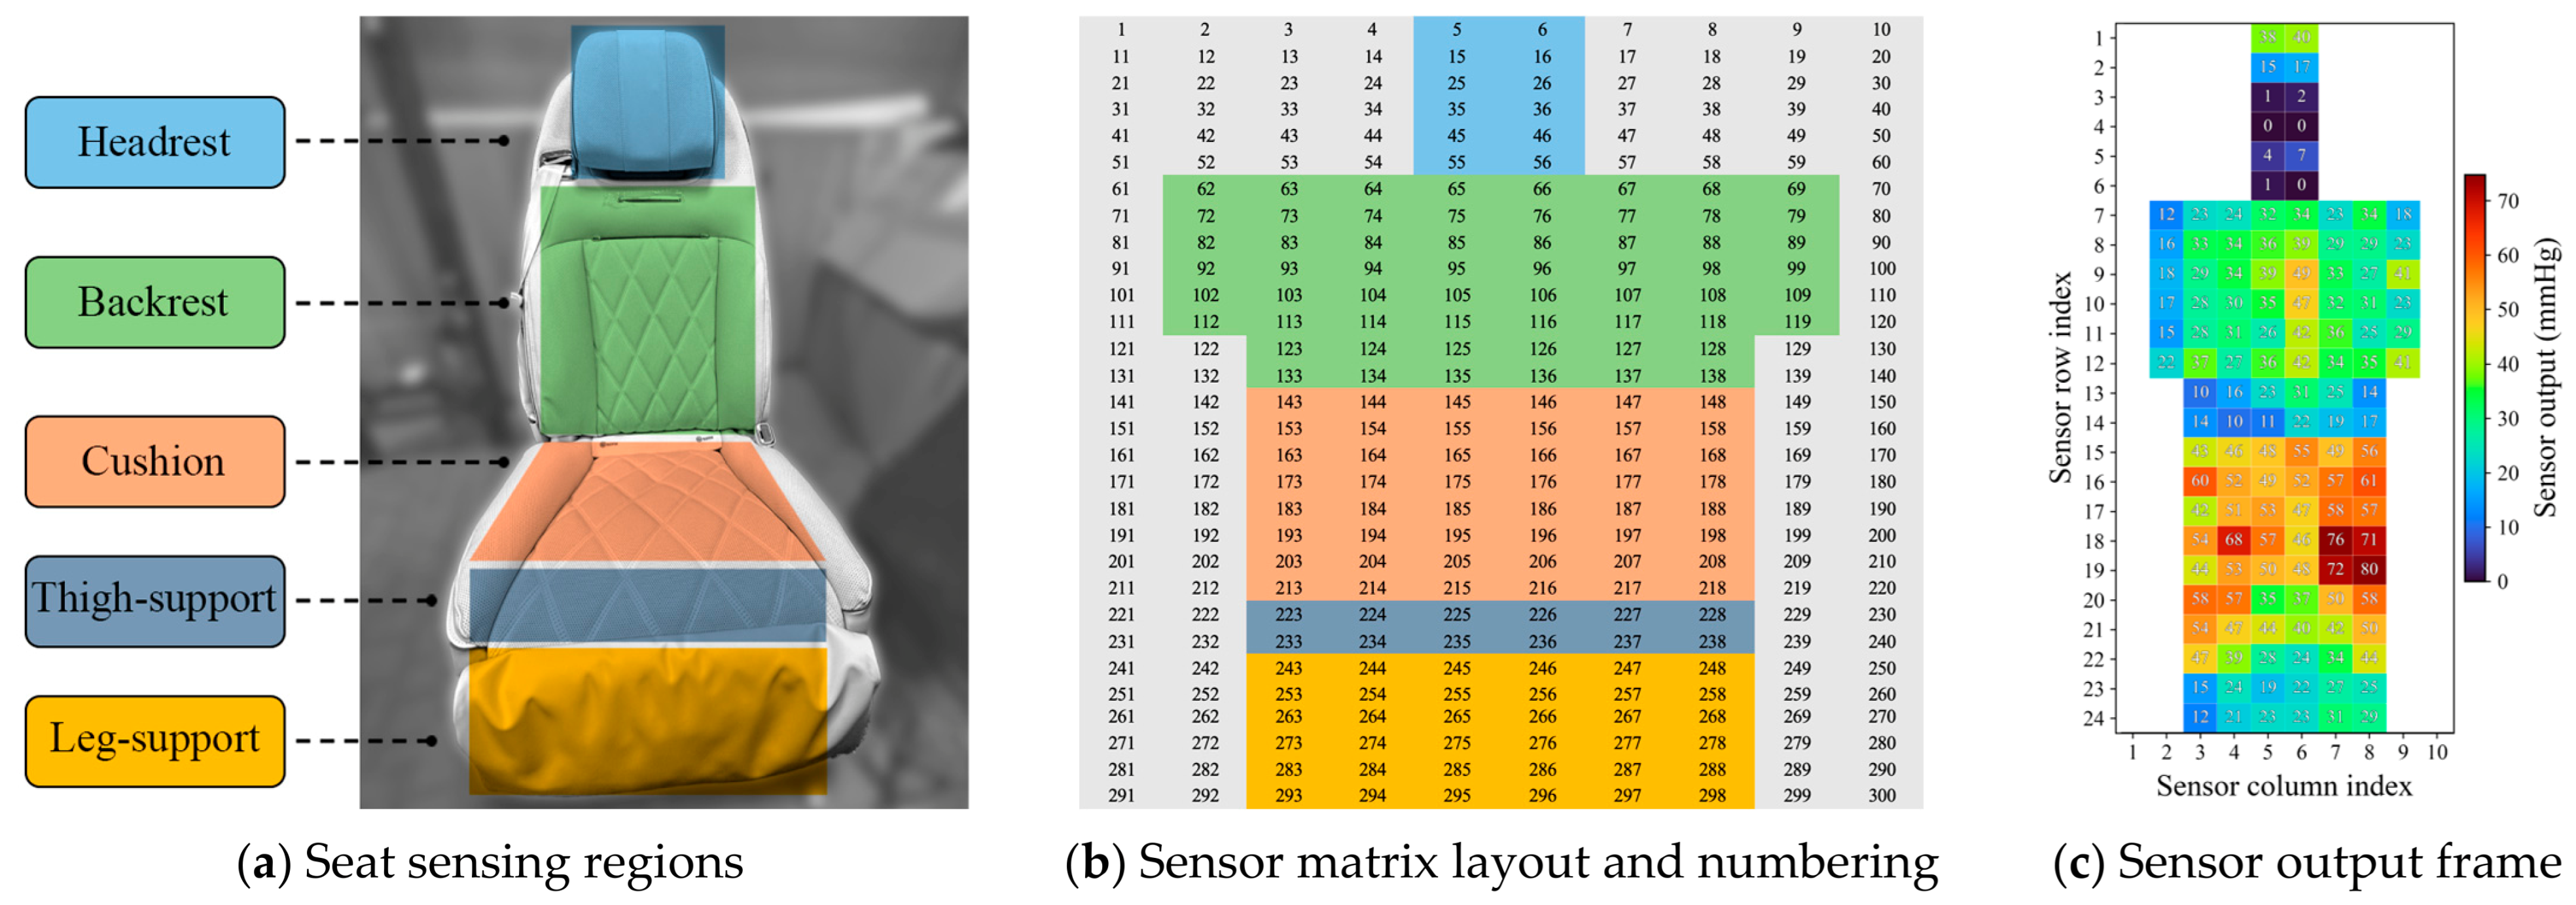
The test seat was equipped with an embedded flexible pressure-sensing array composed of discrete sensing units distributed over the headrest, backrest, cushion, thigh-support, and leg-support regions (
Figure 2a). Each sensing unit measured the local normal contact pressure at its corresponding position and provided a calibrated pressure output in mmHg. For spatial representation, the sensing units were mapped to a unified 30 × 10 matrix coordinate system with predefined row and column indices (
Figure 2b). In this matrix, colored cells denote installed sensing units, whereas blank cells indicate non-sensing positions retained as placeholders.
At each sampling instant, the sensor outputs were reconstructed according to this matrix coordinate system to form a 2D sensor-output frame (
Figure 2c). Under the upright seated posture used in this experiment, the leg-support region was masked in the reconstructed frame and excluded from the subsequent analysis. The unified frame represents the spatial and temporal variation of seat contact pressure, with installed units containing sensor outputs and placeholder positions having no physical output.
Because the cushion region is more directly related to the vertical load transmitted by the occupant, whereas the backrest and other supporting regions are more affected by posture and local contact conditions [
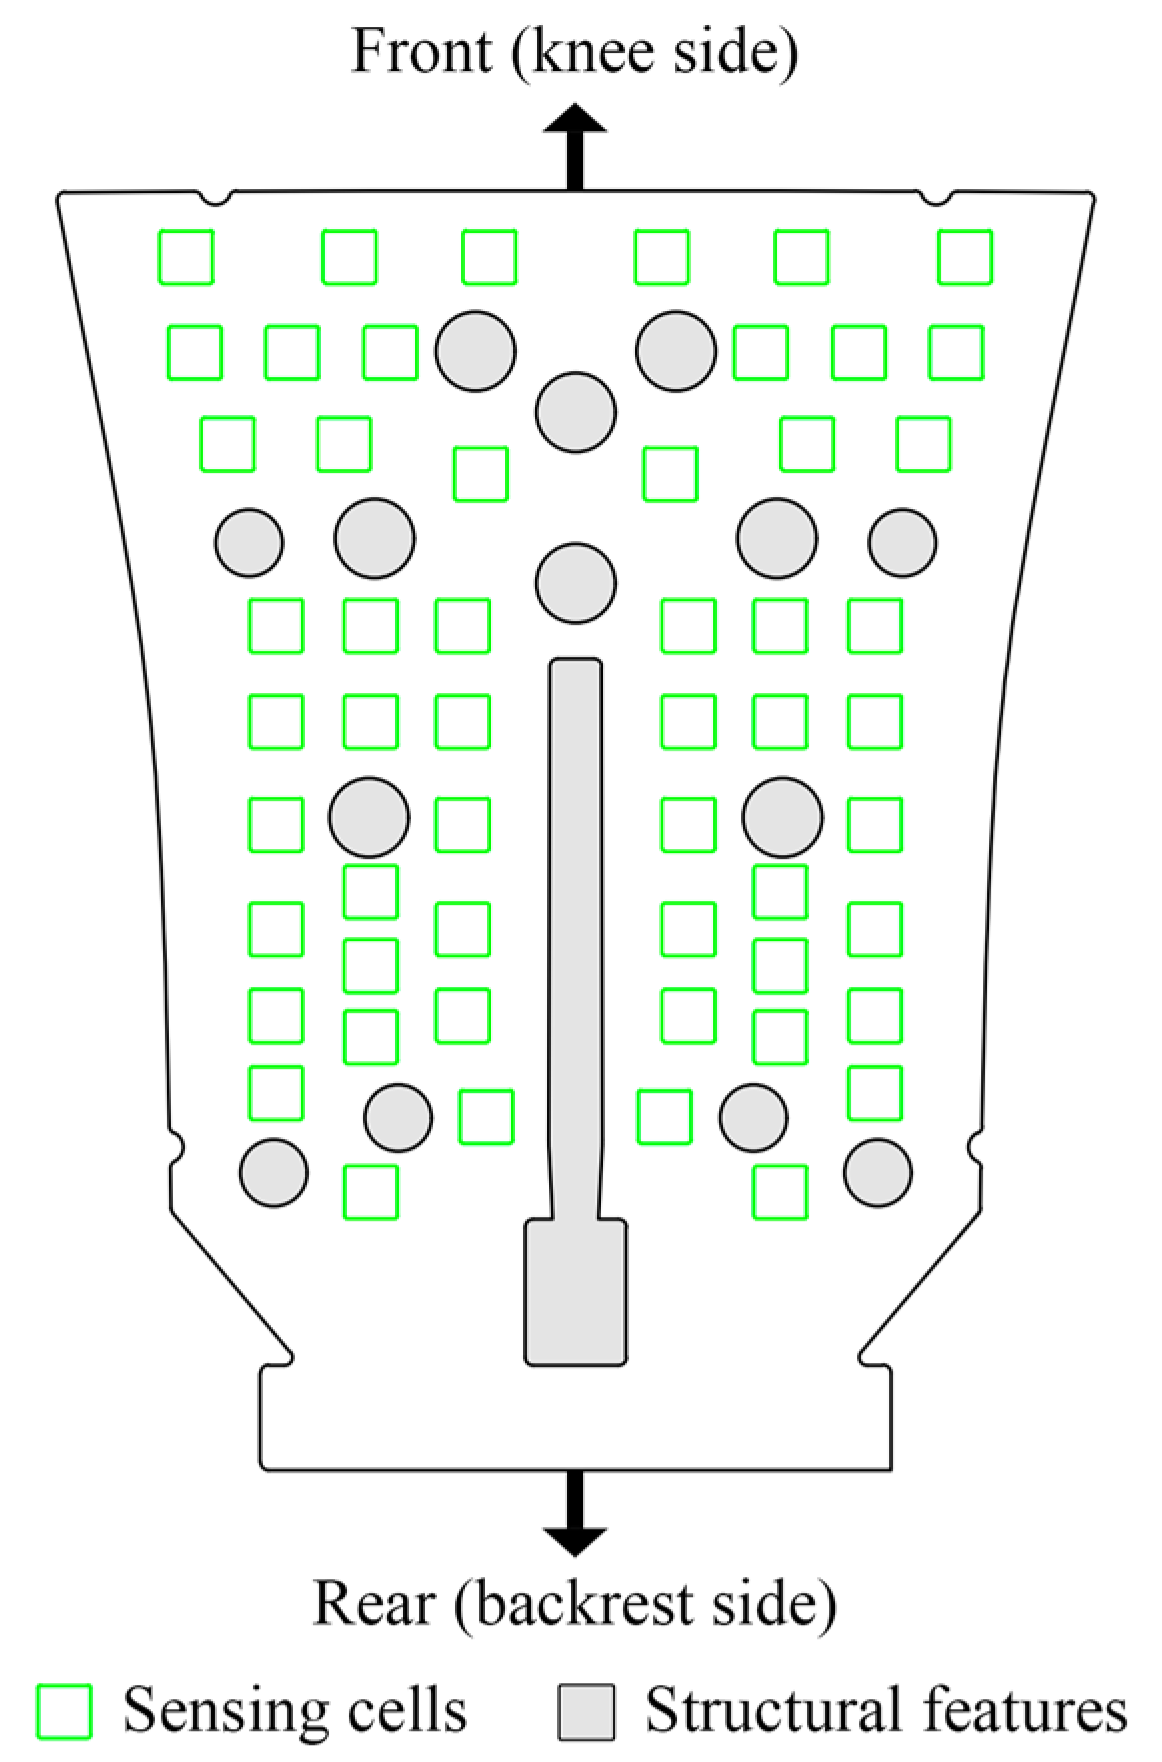
26], this study focused on cushion pressure signals for weight-related analysis. The physical layout of the cushion sensing units is shown in
Figure 3; for data processing, this region was mapped to an 8 × 6 submatrix comprising 48 sensing units.
The cumulative cushion pressure response,
, was calculated as:
where
is the output of the i-th sensing unit in the cushion region at time
, and
is the set of active cushion sensing units with positive outputs.
was used as an aggregated statistical measure of the cushion contact response (unit: mmHg). Because it is calculated as the sum of sensing-unit outputs, it should be interpreted in the native output scale of the pressure sensing system rather than as a direct physical pressure, force, or load measurement.
2.3. Signal Preprocessing and Analysis Window Selection
The recorded pressure signals were first screened for data completeness, signal continuity, and suitability for short-term temporal analysis. A record was excluded if it contained severe missing data, insufficient duration, sensing system abnormalities, or dominant motion disturbances rather than gradual pressure evolution. This basic quality control step was applied before model fitting and classification analysis.
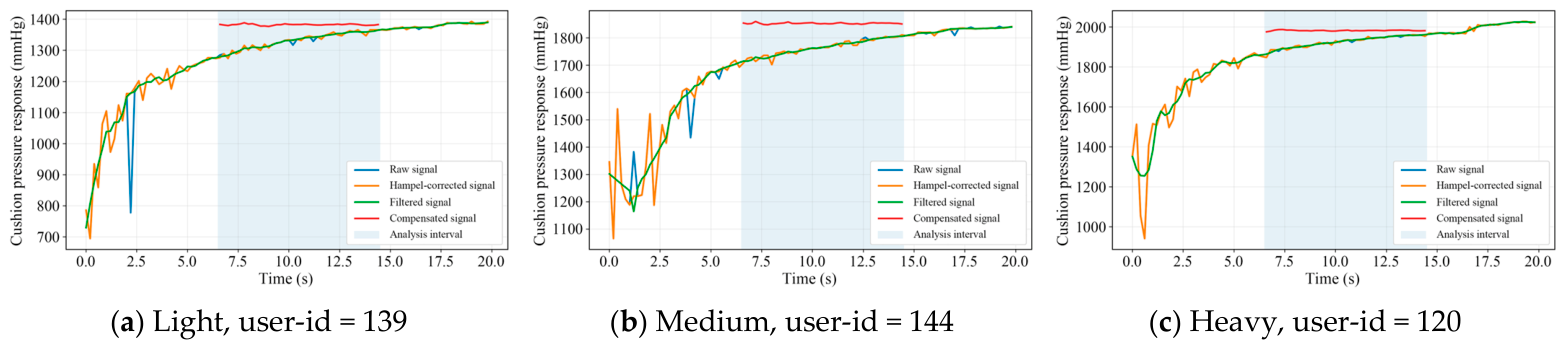
After basic quality control, missing values were filled using linear interpolation to preserve the continuity of the pressure time series. A Hampel filter with a window size of 5 frames was then applied to suppress isolated outliers by comparing each sample with the local median and replacing samples exceeding 3.0 times the local robust standard deviation. The signal was further smoothed using a Savitzky–Golay filter with a window length of 9 frames and a polynomial order of 2. This filter performs local polynomial fitting within a moving window and was selected to reduce high-frequency fluctuations while preserving the gradual temporal trend required for drift modeling. This preprocessing sequence reduced missing-value discontinuities, isolated spikes, local sensing jumps, and high-frequency fluctuations without removing the slow evolution of the cushion pressure signal.
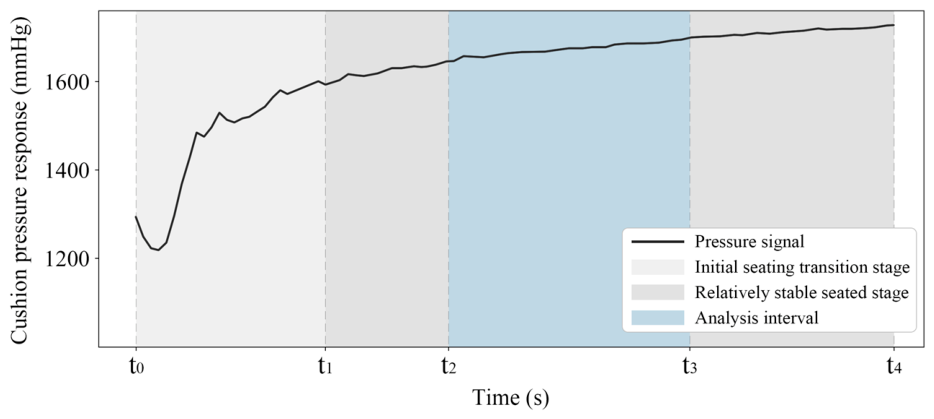
Each pressure record was divided into an initial seating transition stage and a relatively stable seated stage.
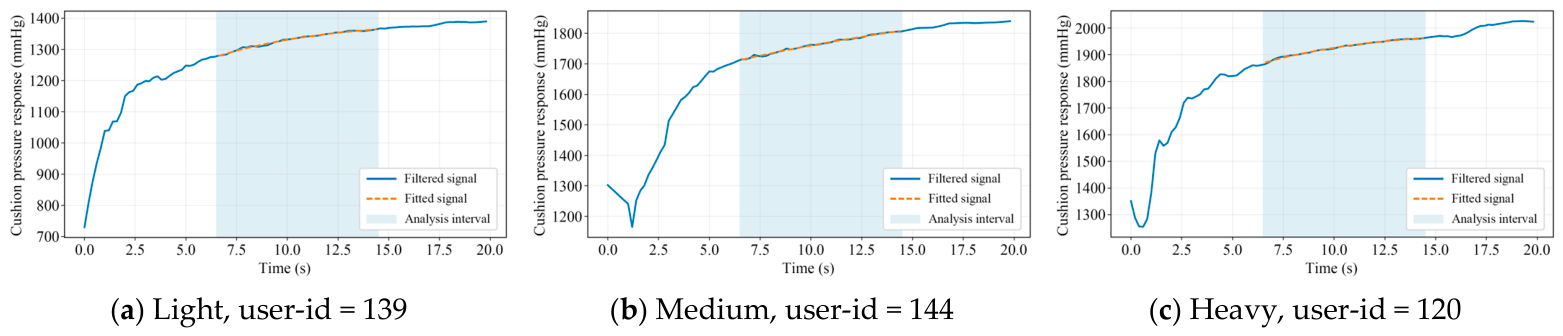
Figure 4 illustrates this segmentation using an exemplary original pressure time series. The effective analysis interval was defined as the
–
segment within the relatively stable seated stage, corresponding to the 6.5–14.5 s period after seating. All subsequent quantitative analyses, including drift-model fitting, reference-state mapping, and sliding-window classification, were conducted within this interval. The selected interval avoids the strong non-stationary transition immediately after seating while retaining sufficient temporal length to characterize the gradual evolution of the cushion pressure signal.
2.4. Creep-Induced Drift Model
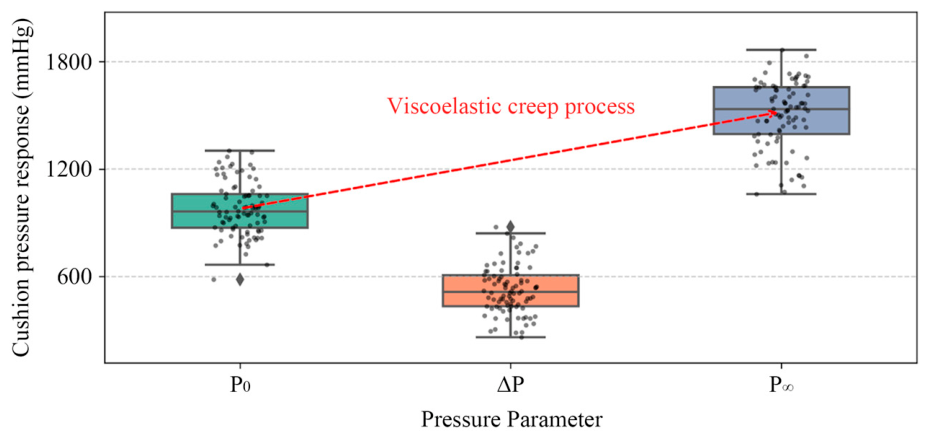
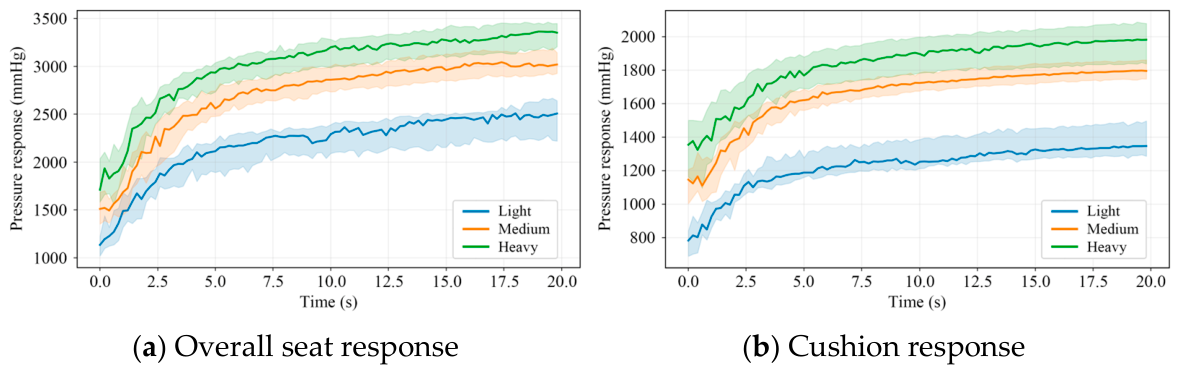
Figure 5 schematically illustrates the creep-induced temporal drift of the cushion pressure signal over the full 0–20 s pressure record after seating. Within this short-term observation window, the pressure response generally increased with a progressively decreasing rate of change, indicating a saturating temporal drift pattern at the contact interface. This behavior is consistent with previous modeling of human–seat interface pressure and relaxation responses in flexible sensing systems, where exponential-type formulations have been used to describe time-dependent pressure evolution [
27,
28]. Accordingly, the single-exponential model was adopted as a compact engineering representation of the dominant drift component. Compared with linear or polynomial formulations, the exponential form captures both the initial rapid change and the subsequent gradual stabilization with a small number of interpretable parameters, while avoiding the additional parameterization and potential fitting instability associated with multi-exponential or higher-order temporal models given the limited record length of the present study.
For the preprocessed cumulative cushion pressure response
within the effective analysis interval, the time axis was shifted to the beginning of this interval so that
. The fitted signal was expressed as:
where
is the model prediction,
represents the equivalent initial pressure response at the beginning of the fitting interval,
represents the additional drift amplitude within the short-term evolution, and
is the time constant describing the rate at which the signal approaches a relatively stable state.
The model parameters were estimated using nonlinear least squares. The initial value of was set according to the signal value at the beginning of the fitting interval, was initialized using the difference between the end and beginning values of the interval, and the initial value of was set to 3.0 s. Parameter bounds were applied to improve fitting robustness and physical plausibility.
The single-exponential model was fitted independently to each pressure record. Fitting quality was evaluated at the record level using the coefficient of determination , mean absolute error (MAE), and root mean square error (RMSE). Records with insufficient data points, fitting failure, unreasonable parameter estimates, or were excluded from the subsequent compensation and classification analysis.
2.5. Reference State Mapping Compensation
A reference state mapping method was developed to reduce temporal feature shifts across decision windows. Rather than reconstructing a true steady-state pressure value, the method used the fitted single-exponential model to estimate the time-dependent drift component and map observations from different decision times to a unified reference state. This model-based correction is consistent with recent compensation strategies for viscoelasticity-induced creep drift in soft force and pressure sensing systems [
29,
30].
This step required the fitted pressure evolution to be evaluated at both the observation time and the reference time in the original record time coordinate. The fitted model was therefore expressed as:
where
denotes the time after seating in the original record,
denotes the start of the fitting interval,
is the estimated pressure response at
,
is the additional change related to short-term drift within the fitting interval, and
is the time constant.
For an observation time
and a reference time
, the model-estimated drift component relative to the reference time is defined as:
The compensated cushion pressure response is then calculated as:
where
is the observed pressure response and
is the pressure response mapped to the reference state. The reference time was set to 20 s, corresponding to the end of each trial. This time point was available for all records and was close to the late stage of the short-term response. It was used as a common external reference and should not be interpreted as a true steady-state condition.
2.6. Sliding-Window Occupant Weight Classification
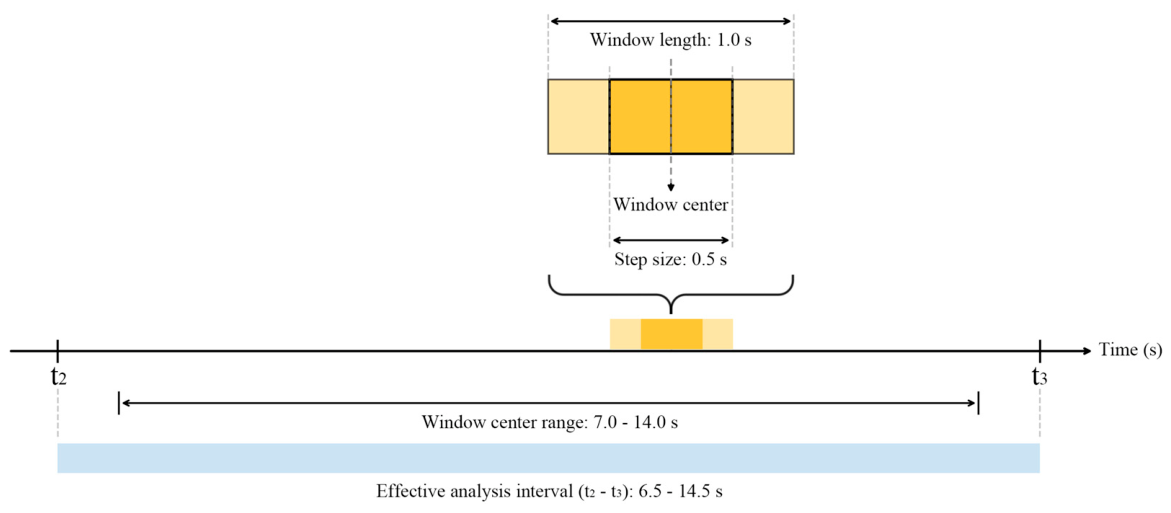
A sliding-window strategy was used to construct decision samples within the
–
effective analysis interval (
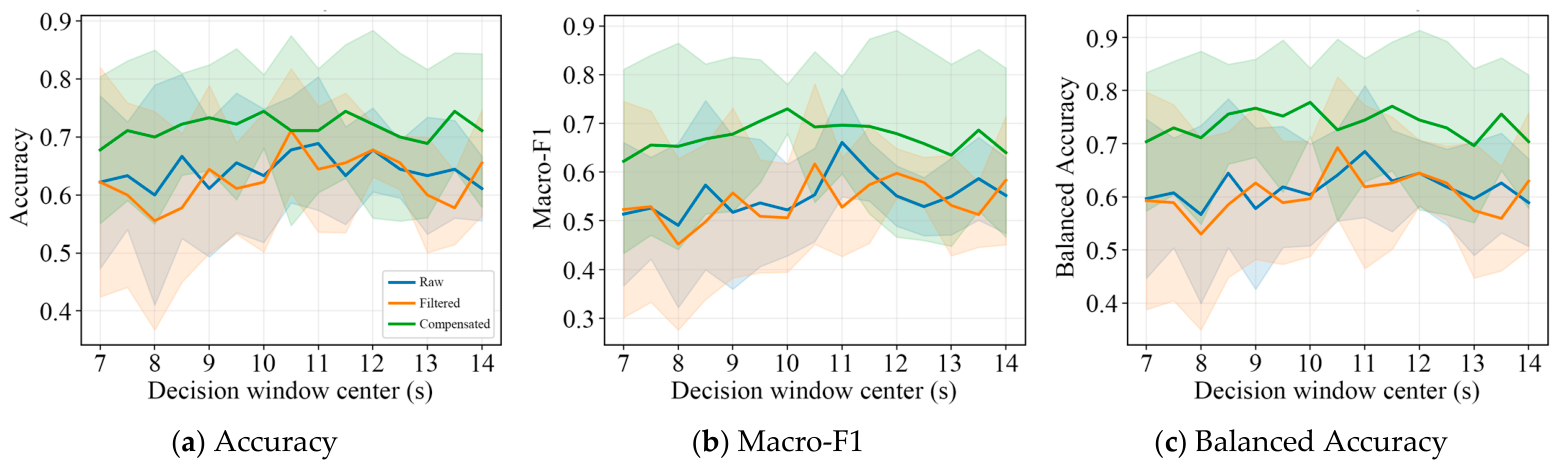
Figure 6). Consecutive decision windows were generated with a window length of 1.0 s and a step size of 0.5 s, with each window fully contained within the 6.5–14.5 s interval. This setting produced window centers from 7.0 to 14.0 s and allowed classification performance to be evaluated at different decision times.
For each sliding decision window, a low-dimensional feature vector was extracted from the cumulative cushion pressure response, including the mean, standard deviation, and range within the 1.0 s window. These features, respectively, characterized the average response level, the within-window fluctuation, and the local amplitude variation. The same windowing and feature-extraction procedure was applied to the raw, filtered, and compensated signals, ensuring that the three signal versions were compared using the same load-related input representation.
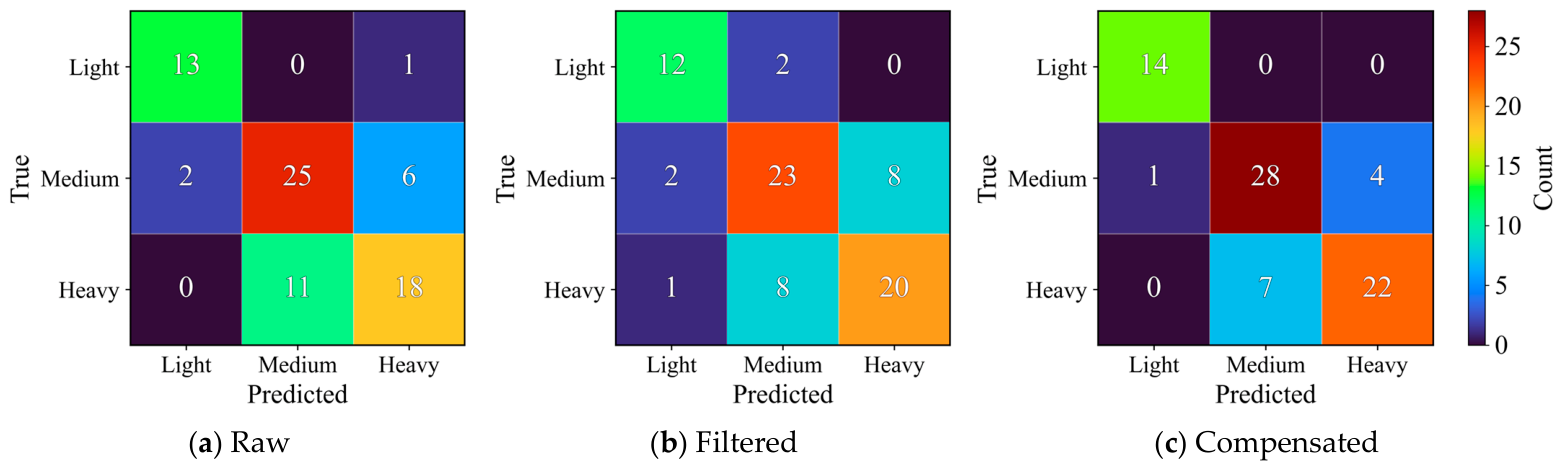
Participant body weights were divided into three classes using 1D K-means clustering. The cluster centers were sorted in ascending order and assigned to the light-, medium-, and heavy-weight classes, respectively. This data-driven grouping strategy was used to derive class boundaries from the observed body-weight distribution of the present sample, instead of applying predefined weight thresholds. The resulting fixed ordinal labels were then used for subsequent classification, confusion matrix analysis, and balanced accuracy calculation.
A random forest classifier was used as a validation model to evaluate whether drift compensation improved the separability and temporal stability of the extracted window-level pressure features. Random forest was selected as a robust validation model for small tabular datasets, with the ability to capture nonlinear relationships between the extracted statistical pressure features and weight classes. The number of trees was set to 300, the number of candidate features considered at each split was determined using the square-root rule, and class weights were set to be balanced, reducing the influence of class imbalance.
Model evaluation was performed using 5-fold GroupKFold cross-validation, with participant ID used as the grouping variable. Participants were divided into five folds; in each run, four folds were used for training and the remaining fold was used for testing until each fold had served once as the test set. GroupKFold kept all records from the same participant in the same fold, thereby preventing participant-level overlap between the training and test sets. This strategy was adopted to reduce subject-level data leakage and to provide a stricter estimate of classification performance under the limited sample size.
2.7. Performance and Consistency Metrics
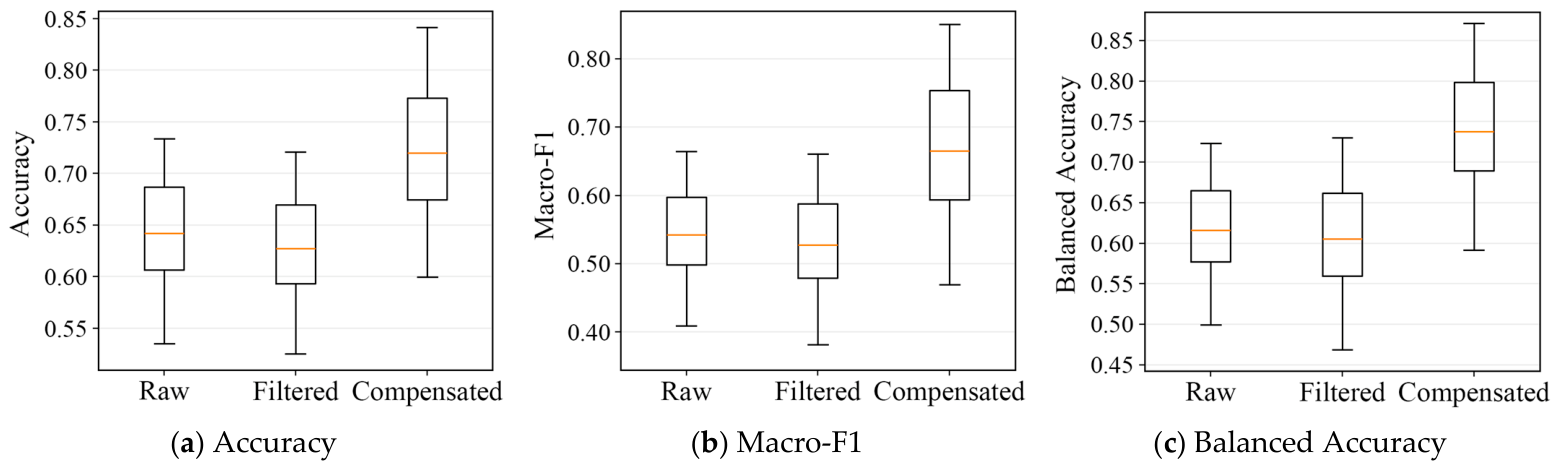
Classification performance was evaluated using accuracy, macro-averaged F1 score (Macro-F1), and balanced accuracy. Accuracy measures the overall proportion of correctly classified samples, Macro-F1 evaluates class-balanced F1 performance by assigning equal weight to each class, and balanced accuracy reflects the mean recall across classes. These metrics were calculated for each fold of the GroupKFold cross-validation and summarized using mean and standard deviation.
Paired statistical comparisons were further conducted using the fold-level metrics, as the three signal versions were evaluated with identical GroupKFold partitions. For each metric, the compensated signal was compared with the raw and filtered signals using two-sided paired t-tests at a significance level of 0.05. Given the limited number of folds, the statistical results were interpreted as supplementary evidence together with the mean performance differences.
Prediction consistency across sliding decision windows was analyzed at the record level to evaluate decision-time sensitivity. Let
denote the retained record index and
denote the sliding decision window index, where
is the number of retained records used for consistency analysis and
is the number of sliding decision windows for each record. The predicted class sequence for record
was defined as:
where
denotes the predicted class of record
in window
, and
is the set of weight classes. For class
, the number of sliding decision windows of record, s, predicted as class
, was defined as:
where
is the indicator function.
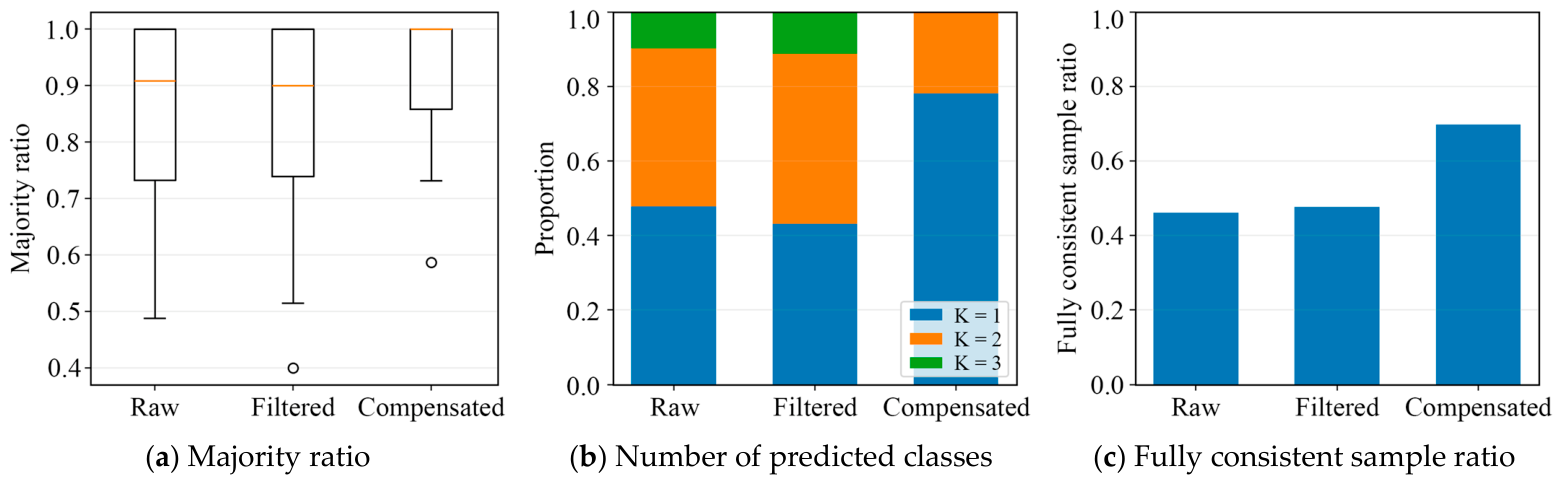
The majority ratio was defined as:
A higher indicates that the predicted classes are more concentrated across sliding decision windows.
The number of predicted classes for record
was defined as:
where
denotes the cardinality of the set. For the 3-class classification task in this study,
. A lower
indicates higher prediction consistency across sliding decision windows.
A record was considered fully consistent if all decision windows produced the same predicted class, corresponding to
. The fully consistent sample ratio was calculated as:
where
is the number of fully consistent records.
For each signal version, the mean majority ratio and the mean number of predicted classes across the retained records were calculated as:
These metrics , and were used together to summarize overall prediction stability across sliding decision windows.
Data processing, analysis, and visualization were performed using custom Python scripts in Python 3.13.5 with NumPy 2.1.3, SciPy 1.15.3, pandas 2.2.3, scikit-learn 1.6.1, and Matplotlib 3.10.0.
4. Discussion
4.1. Temporal Drift in Seat Pressure Sensing
The results indicate that cushion pressure signals still exhibited measurable temporal evolution after the initial seating transition was excluded. The persistence of gradual pressure changes within the analysis interval suggests that early occupant weight classification should not rely on the assumption of a fully steady pressure input. This behavior is more consistent with viscoelastic cushion deformation and contact redistribution at the seat–occupant interface than with a simple electronic delay.
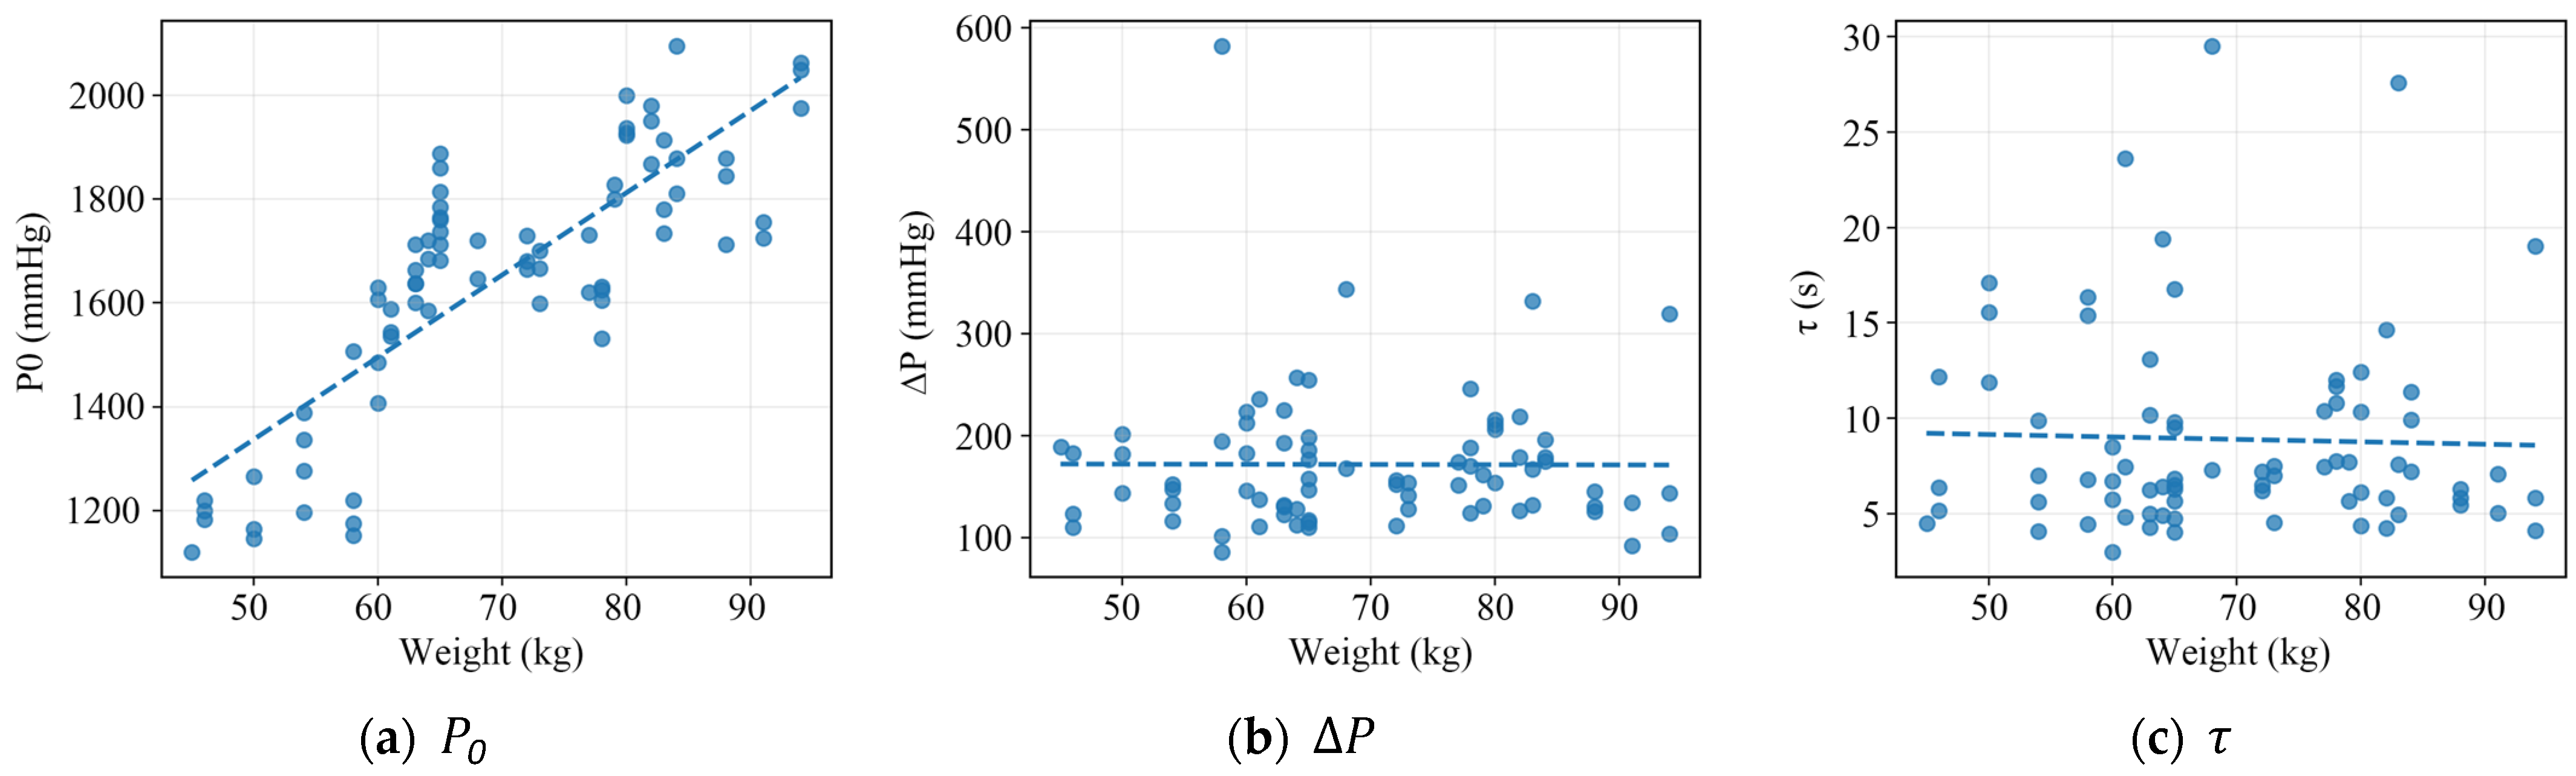
The fitted parameters further support a distinction between load-related and drift-related information. was strongly associated with body weight and mainly reflected the load component transmitted to the cushion. In contrast, and primarily described the magnitude and rate of short-term evolution. Therefore, the fitted model should be interpreted as a drift-correction component for estimating the temporal change superimposed on the load-related cushion response.
4.2. Role of Drift Compensation
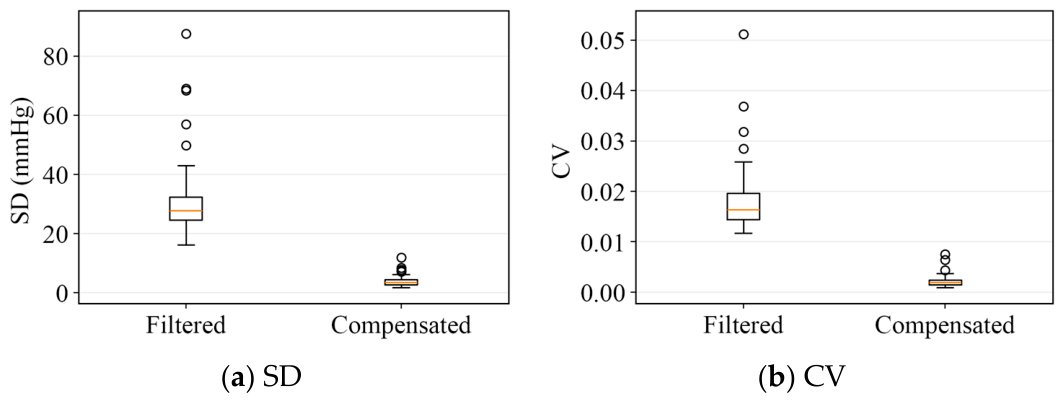
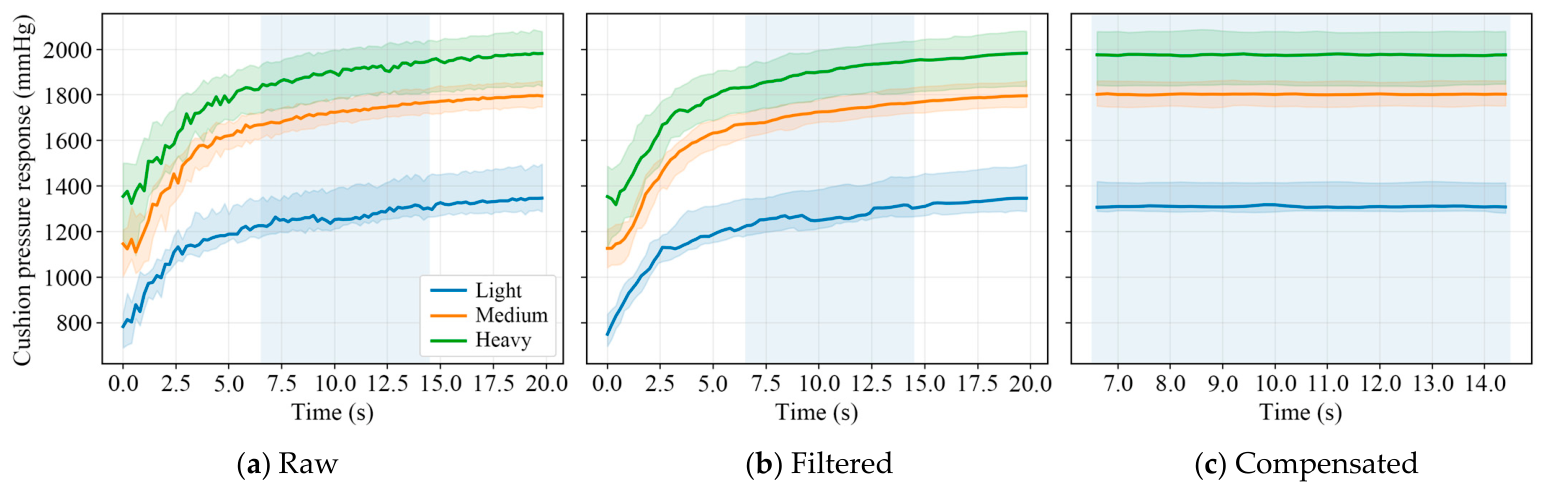
The comparison among raw, filtered, and compensated signals indicates that preprocessing and drift compensation targeted different components of signal variation. Conventional preprocessing reduced local outliers and high-frequency fluctuations, but it could not correct the systematic temporal shift within the analysis interval. Consequently, the filtered signals showed classification performance broadly comparable to that of the raw signals, suggesting that local noise reduction alone was insufficient to improve feature comparability.
The compensation based on reference-state mapping reduced this remaining shift by aligning observations from different decision times to a common temporal reference. By correcting the drift-related component rather than suppressing the overall pressure response, it improved the comparability of pressure features across decision windows while preserving the load-related separation among weight classes. This provided a more stable input representation for occupant weight classification.
4.3. Classification Stability and Vehicle Applications
The classification results indicate that drift compensation improved the reliability of window-level pressure features for occupant weight classification. The larger gains in Macro-F1 and balanced accuracy suggest that the improvement was not limited to the overall correct classification rate, but also reflected better class-balanced recognition. This finding indicates that the classification ambiguity observed in the raw signals was partly attributable to systematic temporal shifts in the pressure features.
The consistency analysis further extends this interpretation from single-window performance to temporal robustness across decision windows. After compensation, the predicted classes became less dependent on the choice of decision window, indicating that the compensation reduced the influence of decision time on classifier output. For intelligent cockpit and adaptive seat applications, this robustness is important because an occupant-recognition module should provide stable early decisions across neighboring windows rather than rely on a single selected decision time. These results highlight the importance of stable cross-window feature representation in short-term occupant classification using seat pressure sensing.
4.4. Limitations and Future Work
This study has several limitations. First, the dataset was limited to 30 participants and 90 pressure records of 20 s each, and the final analysis was based on records that met the fitting-quality criteria. The experiment was conducted under controlled static seated conditions, without evaluating the potential effects of vehicle-induced vibrations, posture changes, or seat adjustments on the seat pressure response. In addition, the compensation analysis used the 20 s endpoint as a fixed reference, while alternative reference-time settings remain to be examined. Therefore, the results should be interpreted as an initial validation of the proposed compensation framework rather than as evidence for population-level generalization or practical in-vehicle performance. Future work should validate the method using larger participant groups under more realistic and diverse conditions.
Second, repeated seated measurements with human participants were used to reflect the seating process, pressure distribution, and short-term contact changes relevant to occupant weight classification. However, this design did not separately characterize the material-level creep behavior of the cushion foam or isolate sensor-related responses under controlled loading. Future work could incorporate fixed-load or dummy-based tests to further examine repeatability, recovery behavior, and material- or sensor-related contributions of the seat–sensor system.
Finally, the classification analysis used low-dimensional statistical features extracted from the cumulative cushion pressure response, which may not fully capture the spatial pressure distribution within the cushion matrix. In addition, as the random forest classifier was used primarily as a validation model, the current evaluation did not include a comprehensive comparison of classifier architectures. Future studies should evaluate regional or matrix-level pressure features, deep learning or temporal learning baselines supported by larger datasets, and lightweight online models for occupant-adaptive seat applications.
5. Conclusions
This study examined creep-induced temporal drift in automotive seat cushion pressure signals and its influence on short-term occupant weight classification. A single-exponential model was used to characterize the short-term pressure evolution after seating, and a reference-state mapping method was proposed to compensate for temporal drift across sliding decision windows. The framework was evaluated using seat cushion pressure records from 30 participants.
The results showed that the cushion pressure response continued to evolve within the selected analysis interval, indicating that early occupant weight classification should not assume a fully steady pressure input. The fitted parameters indicated that mainly reflected body-weight-related load information, whereas and were more closely associated with short-term drift behavior. Compared with raw signals, compensated signals improved accuracy, Macro-F1, and balanced accuracy by 13.1%, 22.7%, and 17.9%, respectively. Prediction consistency across sliding windows was also improved.
These findings indicate that reference-state mapping can improve the temporal comparability of automotive seat pressure features and reduce decision-time sensitivity under controlled seated conditions. The proposed framework provides an interpretable compensation approach for seat-pressure-based occupant weight classification and may support more stable pressure feature representation for occupant state recognition and adaptive seat functions in intelligent cockpits. Future work should validate the method with broader participant distributions, more realistic in-vehicle conditions, and online implementation scenarios.