1. Introduction
As the arterial system of regional economic integration, high-density expressway networks facilitate the rapid movement of passengers and freight, but they also remain strongly dependent on fossil-fuel-based transport activity. In the post-pandemic period, the recovery of inter-city travel and logistics has further increased the pressure to decouple transport growth from carbon emissions. For rapidly industrializing regions, the challenge is no longer limited to identifying major emission sources. It also lies in reducing emissions from large-scale transport infrastructure systems without weakening their basic service function. In China, this issue has become more urgent under the “Dual Carbon” agenda and the 14th Five-Year Plan, which emphasize green and low-carbon transport development, transport modernization, and the continued expansion of new energy vehicles (NEVs) and related infrastructure [
1,
2]. At the same time, NEV ownership in China has continued to rise rapidly, reaching 31.4 million by the end of 2024 [
3]. These developments make it necessary to examine which mitigation pathway can deliver more effective carbon reduction in expressway systems under continued traffic growth.
Current research on carbon emissions focuses on identifying key drivers and developing forecasting methodologies. Regarding influencing factors, studies analyze transportation emissions from multiple angles, including industrial linkages and supply-demand dynamics [
4], the role of electric vehicles and socioeconomic variables [
5], and the direct impact of subsidy policies [
6]. The perspective extends to industrial synergy, where green innovation contributes to coordinated pollution and carbon reduction through structural upgrading [
7], and to resource efficiency under carbon-emission constraints [
8]. However, the existing literature still shows two limitations in relation to the expressway sector. First, many studies discuss transport decarbonization at the national or urban scale, while relatively few focus specifically on expressway systems, where long-distance freight concentration and network dependence are more pronounced. Second, although the carbon-reduction effect of NEVs has been widely discussed, fewer studies directly compare this technological pathway with transport structure adjustment within a unified dynamic framework. This limits our understanding of which policy lever plays the dominant role in the expressway context.
Methodologically, research has evolved from data-driven prediction to complex system simulation. Hybrid models such as neural network–gray systems show promise for simultaneous energy and carbon forecasting [
9]. However, for evaluating long-term policies and multi-factor interactions, system dynamics (SD) is particularly suitable because it can represent feedback loops and time delays within integrated systems. SD models have been used to simulate national carbon trajectories [
10], assess agricultural resource nexus strategies [
11], evaluate urban transport policies such as carbon taxes [
12], and support community energy planning [
13]. Compared with static accounting or purely data-fitting models, SD offers a clear advantage for tracing the dynamic effects of policy intervention and structural change over time.
To address these nonlinear dynamics, SD provides a suitable framework for expressway carbon-emission analysis. Unlike linear extrapolation, SD can capture endogenous feedbacks among socioeconomic growth, traffic demand, technology change, energy consumption, and carbon emissions. Although SD has been applied to transport and carbon studies in China and elsewhere, few studies have directly compared the effects of transport structure adjustment, such as shifting freight to rail or waterway, and technological substitution, such as fleet electrification, within one unified framework. This gap is especially relevant in China, where current transport policies promote modal coordination, low-carbon freight development, and the expansion of NEVs and charging infrastructure [
1,
2,
3]. In the present study, the technological substitution pathway is represented by the increasing penetration of NEVs in passenger and freight transport on expressways, with the model calibrated using electricity-consumption parameters and grid-emission factors. This treatment keeps the modeled pathway consistent with the broader policy category of NEVs while matching the parameter setting of the empirical model. In China’s policy framework, NEVs generally include battery electric vehicles (BEVs), plug-in hybrid electric vehicles (PHEVs), and fuel-cell vehicles (FCVs). In the present study, the technological substitution pathway is modeled in aggregated form through rising NEV penetration on expressways, rather than separately simulating individual technology routes.
Against this background, this study develops an evolutionary SD model for the Guangdong Provincial Expressway Network. Guangdong is a suitable case for three reasons. First, it is one of China’s most economically active and freight-intensive provinces, and its expressway system carries substantial passenger and freight traffic. Second, the province has continued to expand its expressway network and targeted 12,000 km of expressway in operation by the end of the 14th Five-Year Plan period [
14]. Third, Guangdong has relatively strong conditions for transport electrification. Shenzhen, for example, has shown rapid growth in the NEV sector and has continued to expand charging infrastructure, including facilities related to fast charging and expressway service areas [
15,
16]. These features make Guangdong an informative case for examining expressway carbon emissions under simultaneous socioeconomic growth and decarbonization pressure. The purpose of this case study is not to claim simple statistical representativeness, but to provide analytical evidence for regions in China and elsewhere that share similar characteristics, including dense expressway networks, strong logistics demand, and improving electrification conditions.
Using multi-source empirical data, this study simulates expressway carbon-emission trajectories through 2035 to address three questions: how Guangdong’s expressway emissions will evolve under continued socioeconomic growth; whether transport structure adjustment or vehicle electrification yields a larger mitigation effect; and whether their combination produces only additive effects or a stronger integrated reduction outcome. The study makes three main contributions. First, it develops an expressway-oriented dynamic framework linking socioeconomic development, traffic activity, vehicle technology composition, energy consumption, and carbon emissions. Second, it quantifies the relative mitigation roles of transport structure adjustment and fleet electrification within a consistent scenario system. Third, it provides policy-relevant evidence for regions seeking to reduce expressway emissions under continued traffic growth. In this way, the study extends the literature from identifying general drivers of transport emissions to comparing the effectiveness of major decarbonization pathways in an expressway context.
2. Materials and Methods
2.1. Modeling Framework and Variable System
To analyze the long-term evolution of carbon emissions from expressway traffic, this study constructs an integrated system dynamics (SD) model in Vensim PLE for the Guangdong Provincial Expressway Network over the period 2016–2035. The model links three subsystems: the socioeconomic subsystem, the expressway traffic-flow subsystem, and the energy–emission subsystem. The socioeconomic subsystem describes the macro-level drivers of transport demand, including GDP, industrial structure, population, and per capita GDP. The traffic-flow subsystem converts these drivers into expressway passenger and freight activity, mainly represented by passenger transport mileage, freight transport mileage, freight turnover, NEV share in passenger transport, NEV share in freight transport, and the transport structure adjustment coefficient. The energy–emission subsystem further translates transport activity into energy use and carbon emissions through vehicle energy-consumption parameters and corresponding emission factors.
The model follows a clear causal chain. Socioeconomic growth drives passenger and freight demand on expressways. This demand determines the scale of transport activity, which in turn affects total energy use and carbon emissions. Within this process, two mitigation pathways are explicitly represented. The first is transport structure adjustment, which reduces the amount of freight activity remaining on expressways by shifting part of it to other transport modes. The second is technological substitution, which reduces the average carbon intensity of expressway traffic through the increasing penetration of NEVs in passenger and freight transport. On this basis, the SD framework captures the joint evolution of economic growth, traffic expansion, fleet transition, and carbon emissions over time.
The stock–flow structure is organized around three main feedback loops. The first is an economic-driven freight growth loop, in which GDP growth stimulates industrial output and freight demand, thereby increasing expressway freight turnover, energy consumption, and carbon emissions. The second is an income-driven passenger travel loop, in which higher per capita income increases passenger mobility and expressway passenger mileage. The third is a technological decoupling loop, in which a rising NEV share reduces the average carbon intensity of expressway traffic and offsets part of the emission growth caused by increasing transport demand.
The data used in the model mainly include Guangdong expressway toll data, Guangdong Statistical Yearbook data, and technical parameters of energy consumption and carbon-emission intensity derived from relevant studies and national standards. Based on the analytical framework above, the variables included in the three subsystems are identified and organized in sequence.
Socioeconomic variables constitute the basic driving force of the expressway traffic carbon-emission system. They mainly include regional gross domestic product (GDP), industrial structure, population, and related indicators reflecting macroeconomic development and demographic conditions. The specific variables and their definitions are presented in
Table 1.
- 2.
Highway Traffic Flow Subsystem
The variable indicators of the highway traffic flow subsystem include highway passenger traffic volume, highway freight mileage, highway freight turnover, proportion of new energy passenger vehicles, proportion of new energy freight vehicles, transportation structure adjustment coefficient, etc. The specific variables and their definitions are shown in
Table 2.
- 3.
Energy Consumption and Emission Subsystem
The energy–emission subsystem translates traffic activity into energy use and carbon emissions. Its variables mainly include unit energy consumption of conventional and new energy freight vehicles, unit energy consumption of conventional and new energy passenger vehicles, average energy consumption per passenger and freight transport unit, total energy consumption of expressway traffic, carbon-emission factors of gasoline, diesel, and electricity, and total
emissions from expressway traffic. The specific variables and their definitions are listed in
Table 3.
The model structure is implemented in Vensim PLE and is defined through a set of stock–flow relationships and causal linkages among the three subsystems.
2.2. Carbon-Emission Accounting and Empirical Calibration
Based on the variable definitions in
Table 3, total annual carbon emissions from expressway traffic are calculated by aggregating passenger- and freight-related emissions under different vehicle technology compositions. The total emission equation is written as follows:
where
denotes total carbon emissions from expressway traffic in year
;
denotes adjusted transport activity of category
;
denotes the share of NEVs in category
;
and
denote unit fuel and electricity consumption, respectively; and
and
denote the corresponding carbon-emission factors for fossil fuel and electricity. Here,
, where
represents passenger transport and
represents freight transport on expressways. Specifically,
and
denote adjusted passenger and freight transport mileage, respectively. The definitions of all variables in Equation (1) are summarized in
Table 4.
To operationalize Equation (1), the model requires energy-consumption parameters, carbon-emission factors, and standard-coal conversion coefficients. These parameters were calibrated using Guangdong-related empirical data, the Guangdong Statistical Yearbook, relevant studies, and national standards. The main technical parameters used in the model are summarized in
Table 5.
To calibrate the dynamic relationship between the socioeconomic subsystem and the traffic-flow subsystem, a linear regression model was used to estimate the traffic–economy elasticity. Based on historical GDP and expressway traffic data from Guangdong Province during 2016–2021, the fitted relationship is expressed as:
where
denotes expressway traffic activity in year
, and
denotes gross domestic product in year
. The estimated equation indicates a strong linear relationship between regional economic growth and expressway traffic demand.
To represent the technological substitution pathway, the growth trajectory of NEV penetration on expressways was estimated using an exponential function based on monthly toll data from May 2020 to January 2023. The fitted relationship is expressed as:
where
denotes the estimated NEV penetration rate at time
, and
denotes the time index. The estimated relationships from Equations (2) and (3) are then embedded into the SD model as the key behavioral mechanisms linking economic growth, traffic demand, and fleet transition.
In the present model, freight activity in Equation (1) is operationalized as freight transport mileage, while freight turnover is retained as a traffic-system variable for system representation and model validation.
2.3. Scenario Design, Model Boundary, and Assumptions
To compare the carbon-reduction effects of different policy pathways, four scenarios are defined in this study. Scenario S1 (Business-as-Usual) assumes that population, economic activity, and traffic demand evolve according to historical trends without additional carbon-mitigation intervention. Scenario S2 (NEV Growth) assumes a continued increase in the share of NEVs in passenger and freight transport on expressways under existing policy incentives. Scenario S3 (Transport Structure Adjustment) simulates a 5% reduction in expressway freight activity, represented in the model as a reduction in freight transport mileage relative to the baseline. Scenario S4 (Combined Scenario) applies both NEV growth and transport structure adjustment simultaneously. These four scenarios provide a unified basis for comparing the independent and combined effects of the two mitigation pathways.
The model boundary is defined in three respects. First, the spatial boundary is limited to the Guangdong Provincial Expressway Network. Second, the temporal boundary covers the period from 2016 to 2035, including both historical calibration and future simulation. Third, the emission boundary is limited to operational energy-related emissions from expressway traffic. For conventional vehicles, this refers to fuel-combustion-related emissions during expressway operation. For NEVs, this refers to electricity-related emissions associated with operational electricity use, calculated through the grid emission factor. Therefore, the study does not conduct a full life-cycle assessment and does not include emissions from vehicle manufacturing, battery production, road construction, or infrastructure construction.
Other pollutants, such as and PM, are excluded from the present analysis. In addition, to focus on medium- and long-term structural trends, the model does not explicitly simulate low-probability external shocks such as pandemics or extreme weather events. This assumption is consistent with the purpose of the study, which is to evaluate the long-term comparative effectiveness of transport structure adjustment and technological substitution in reducing expressway carbon emissions. The model is therefore intended to describe structural evolution rather than short-term disturbance processes.
3. Results
3.1. Parameter Estimation and NEV Penetration Trajectory
The model was calibrated using Guangdong data from 2016 to 2021. To quantify the relationship between socioeconomic development and expressway traffic demand, a linear regression model was used to estimate the traffic–economy elasticity described in Equation (2). The estimation results show a strong fit, with and a mean absolute percentage error (MAPE) of 5.7%. This result indicates that GDP growth provides a reliable demand-side basis for simulating the evolution of expressway traffic activity in Guangdong. The estimated relationship was therefore embedded into the system dynamics model as the main linkage between socioeconomic growth and transport demand.
The technological substitution pathway was calibrated using monthly toll data from May 2020 to January 2023. The observed trajectory of NEV penetration on expressways shows a clear upward trend, although short-term fluctuations are present in several months. On this basis, an exponential growth function was used to characterize the diffusion path of NEVs. The fitted curve achieved an of 0.94, indicating that the long-term increase in NEV penetration can be reasonably represented within the current modeling framework.
The predicted NEV proportions from 2026 to 2035 are reported in
Table 6. The results show that the predicted NEV proportion increases from 0.271 in 2026 to 0.977 in 2035, indicating a rapid expansion of NEV adoption on Guangdong expressways. This upward trajectory provides the key parameter basis for the technological substitution scenario in the subsequent carbon-emission simulation.
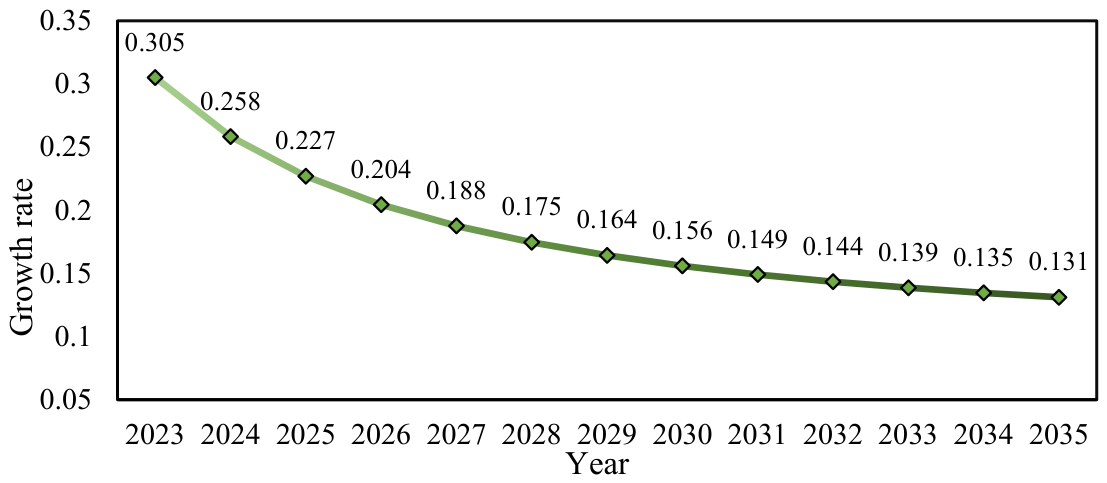
While
Table 6 presents the projected level of NEV penetration,
Figure 1 shows the corresponding annual growth rate implied by the fitted trajectory. The figure indicates that the annual growth rate gradually declines over the simulation period. This does not mean that NEV penetration decreases. Rather, it indicates that the speed of increase slows as the predicted NEV share approaches a high penetration level.
As shown in
Figure 1, NEV penetration continues to rise throughout the simulation period, while its annual growth rate gradually declines. Combined with
Table 6, this pattern suggests that NEV adoption on Guangdong expressways enters a high-growth but gradually maturing diffusion stage. The projected NEV share reaches 0.977 by 2035. This value should be interpreted as an optimistic upper-bound scenario rather than a conservative forecast, as it assumes continued strong policy support, sustained vehicle electrification, and substantial improvement in charging infrastructure capacity. Therefore, this high penetration level mainly reflects the potential maximum contribution of technological substitution to expressway carbon mitigation under favorable policy and infrastructure conditions.
3.2. Model Validation
To assess the reliability of the proposed system dynamics model, this study compares the simulated values with the observed values over the historical calibration period from 2016 to 2021. The validation focuses on two dimensions of system performance: the socioeconomic subsystem and the expressway traffic-flow subsystem. For each variable, the comparison reports the observed value, the modeled value, the percentage deviation, and the mean absolute percentage error (MAPE), so as to evaluate how well the model reproduces the historical evolution of the main system variables. The validation results are summarized in
Table 7.
For the socioeconomic subsystem, the model reproduces the historical evolution of GDP and per capita GDP with relatively small deviations. The MAPE values are 2.33% for GDP and 3.63% for per capita GDP, indicating that the macro-level development trend is well captured by the model. For the traffic-flow subsystem, the simulated values also match the observed values closely. The MAPE values are 1.04% for freight turnover and 2.22% for freight mileage, showing that the model provides a reliable representation of freight-related activity on the expressway network.
Taken together, the validation results indicate that the model has a satisfactory level of explanatory and predictive consistency for the main structural variables. This provides an acceptable basis for using the calibrated SD model to simulate future carbon-emission trajectories under alternative policy scenarios.
3.3. Scenario Simulation Results
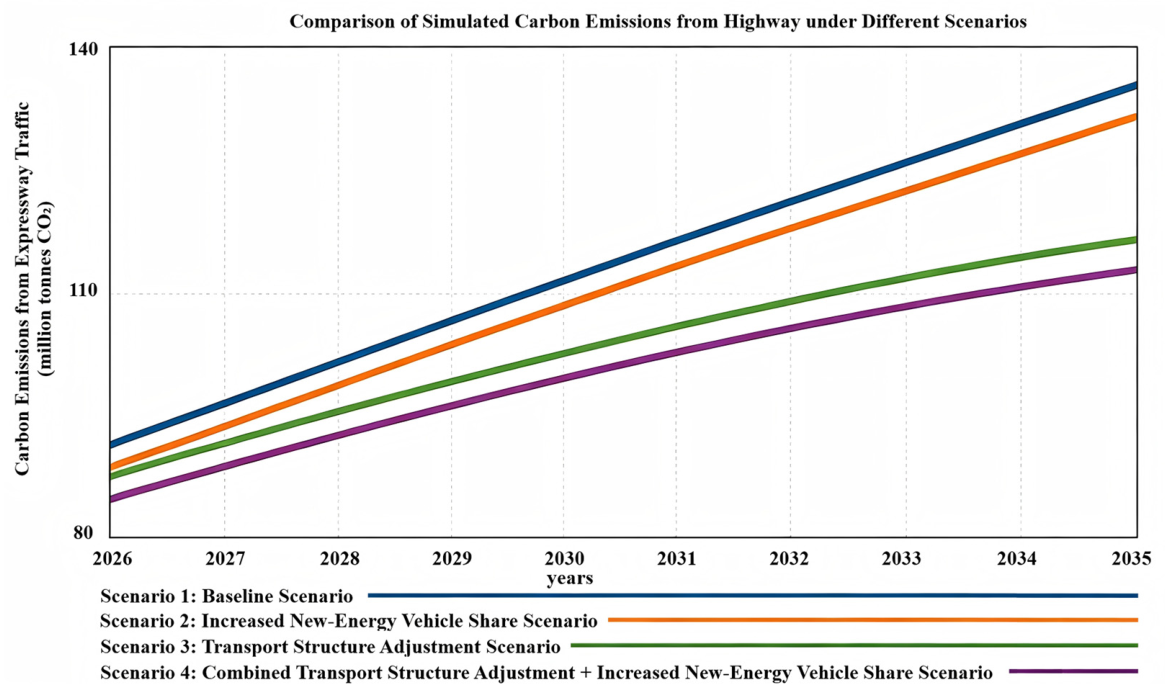
Based on the calibrated model, four scenarios were simulated to 2035: Business-as-Usual (S1), NEV Growth (S2), Transport Structure Adjustment (S3), and the Combined Scenario (S4). The simulation results reveal clear differences in carbon-reduction performance across the four scenarios.
Under the Business-as-Usual scenario (S1), carbon emissions continue to grow with the expansion of socioeconomic activity and expressway transport demand. This trajectory reflects the baseline tendency of the system when no additional mitigation measures are introduced. Under the NEV Growth scenario (S2), the emission trajectory remains upward in the early stage, but the overall level is consistently lower than that under S1, indicating that technological substitution can effectively reduce the carbon intensity of expressway activity. By 2035, the cumulative reduction relative to the baseline reaches 14.73%, showing that the expansion of NEVs plays a substantial role in restraining emission growth.
The Transport Structure Adjustment scenario (S3) also produces a reduction in emissions, but the effect is much smaller. Under the assumption of a 5% reduction in expressway freight activity, represented in the model as freight mileage, the carbon-reduction effect by 2035 is only 2.41% relative to the baseline. This indicates that, within the current setting, moderate modal transfer alone has limited influence on the overall trajectory of expressway emissions. The Combined Scenario (S4), which simultaneously applies NEV growth and transport structure adjustment, achieves the largest reduction, reaching 18.06% by 2035. This result confirms that the two pathways are complementary, although their contributions are not symmetric.
Figure 2 further shows that the four scenarios can be grouped into two broad trajectory patterns. First, S1 and S2 follow relatively similar directional paths, as both scenarios are driven by continued growth in population, economic activity, and transport demand. Their difference lies in carbon intensity: under S2, the increasing penetration of NEVs lowers the average emissions associated with each unit of expressway activity, causing the S2 trajectory to remain consistently below S1. This means that technological substitution does not reverse the growth trend of transport demand itself, but it does significantly weaken the translation of traffic growth into emission growth.
Second, S3 and S4 also follow similar directional paths because both incorporate the effect of transport structure adjustment on freight activity. In both cases, part of the original road-based freight demand is removed from the expressway system, which lowers the overall activity base relative to S1 and S2. However, S4 remains clearly below S3 throughout the simulation period because it combines this activity-side reduction with the technology-side effect of NEV penetration. In other words, transport structure adjustment changes the scale of freight activity, whereas NEV growth changes the carbon intensity of both passenger and freight activity. Their joint implementation therefore produces the lowest emission path among all scenarios.
These results suggest that the two mitigation pathways affect the expressway carbon-emission system through different mechanisms. Transport structure adjustment acts mainly by compressing part of freight activity on expressways, while NEV growth acts by reducing emissions per unit of transport activity. Within the parameter setting adopted in this study, the technological pathway contributes the larger share of total emission reduction, whereas transport structure adjustment plays a supplementary role. The combined scenario yields the strongest reduction because it addresses both activity scale and activity-specific carbon intensity simultaneously.
4. Discussion
4.1. Relative Mitigation Effects of Technological Substitution and Transport Structure Adjustment
The scenario results reveal a clear asymmetry in the mitigation effects of the two pathways considered in this study. Under the current parameter setting, the NEV Growth scenario produces a much larger reduction in expressway carbon emissions than the Transport Structure Adjustment scenario. By 2035, the reduction under S2 reaches 14.73% relative to the baseline, whereas the reduction under S3 is only 2.41%. This result indicates that, in the Guangdong expressway context, technological substitution plays a more decisive role than moderate structural adjustment in controlling carbon emissions.
This difference is closely related to the way the two policy pathways operate within the system. Transport structure adjustment acts mainly on the activity side of the model. In the present study, its effect is represented by a 5% reduction in expressway freight activity, operationalized in the model as freight mileage. This mechanism reduces only part of the freight activity remaining in the highway system and does not directly affect passenger activity or the energy intensity of the residual traffic. As a result, its influence on the overall emission trajectory is limited. By contrast, NEV growth acts on the carbon-intensity side of the system. A higher NEV share reduces the average emissions associated with each unit of passenger and freight transport activity, allowing it to affect a broader part of the system over time.
This finding is also broadly consistent with the existing literature, although the analytical focus differs across studies. Tao et al. [
5] examined the relationship between electric vehicles and carbon emissions from a macro-level perspective, while Cai et al. [
6] evaluated the carbon effects of NEV subsidies using city-level evidence from China. In a related national study, Amin et al. [
21] showed that energy transition contributes to reducing carbon emissions in China, whereas natural resource abundance is positively associated with environmental pressure. Compared with these studies, the present study does not focus on national-level determinants, urban policy effects, or econometric estimation of broad energy–environment relationships. Instead, it contributes by embedding transport structure adjustment and NEV penetration within a unified expressway-specific system dynamics framework, thereby allowing a direct comparison of the relative mitigation roles of activity-side adjustment and carbon-intensity-side technological substitution.
4.2. Interpretation of Scenario Trajectories and the Integrated Decarbonization Pathway
The trajectories shown in
Figure 2 further clarify how the two pathways affect the system through different mechanisms. First, S1 and S2 follow relatively similar directional trends. In both scenarios, the system remains driven by continued socioeconomic growth and rising transport demand. The difference is that S2 introduces a gradual decline in the average carbon intensity of expressway traffic through increasing NEV penetration. This is why the S2 curve remains below the S1 curve throughout the simulation period, while still broadly following the same growth-oriented direction. In other words, technological substitution does not eliminate the expansion of transport demand, but it weakens the degree to which traffic growth is converted into carbon-emission growth.
Second, S3 and S4 also follow similar directional patterns because both scenarios incorporate the effect of transport structure adjustment on freight activity. In both cases, part of the original road-based freight demand is removed from the expressway system, leading to a lower activity base than under S1 and S2. However, S4 remains consistently below S3 because it combines activity-side adjustment with technology-side decarbonization. This means that the integrated pathway reduces emissions through two channels at the same time: it lowers the amount of freight activity remaining on expressways and reduces the carbon intensity of the passenger and freight activity that still occurs.
The combined scenario achieves the largest reduction, reaching 18.06% by 2035. This result confirms that the two pathways are complementary, but not symmetric in contribution. The main reduction still comes from technological substitution, while transport structure adjustment provides an additional but smaller contribution. Therefore, the integrated pathway should not be understood as evidence that both policy tools are equally powerful. Rather, it indicates that the most effective decarbonization path for the expressway system is one in which electrification serves as the dominant driver and structural adjustment plays a supporting role.
4.3. Policy Implications for Expressway Decarbonization in Guangdong
The results have several policy implications for Guangdong and other highway-oriented regions facing similar decarbonization pressure. First, the findings suggest that expressway decarbonization should place greater emphasis on accelerating the deployment and use of NEVs, especially in segments with high traffic intensity and strong operational continuity. Under the current model setting, NEV growth delivers the largest standalone reduction in emissions. This means that infrastructure expansion, vehicle replacement incentives, and operational convenience for NEV use are likely to be more effective than relying primarily on modest structural transfer of freight activity.
Second, infrastructure policy should focus not only on general charging availability but also on the operational suitability of electrified expressway transport. For passenger vehicles, this means improving charging convenience and service quality at expressway service areas and intercity travel nodes. For freight vehicles, it implies prioritizing high-capacity charging support and corridor-oriented infrastructure deployment in areas with stable logistics demand. Since the emission-reduction effect of NEVs in this study is realized through electricity-related operational emissions, the practical effectiveness of this pathway also depends on whether charging access and energy supply conditions can support large-scale fleet transition.
Third, transport structure adjustment remains relevant, but its role should be understood more precisely. The simulation results do not imply that modal shift is unimportant. Instead, they suggest that, under a moderate adjustment scenario, its direct contribution to expressway carbon reduction is limited relative to electrification. Therefore, policies related to rail–waterway substitution and multimodal freight coordination should be implemented in a more targeted manner, focusing on cargo types and corridors that are genuinely suitable for transfer. A broad expectation that modest modal adjustment alone can substantially reduce expressway emissions would not be supported by the current results.
Fourth, because the combined scenario performs best, policy design should avoid treating electrification and structure adjustment as substitutes. A more realistic strategy is to establish a layered policy framework in which electrification is the principal pathway for reducing activity-related carbon intensity, while structural adjustment is used selectively to relieve the most emission-intensive segments of road freight demand. This combined approach is more consistent with the dynamic characteristics of expressway systems under continued traffic growth.
4.4. Limitations and Future Research
Several limitations should be noted. First, the study focuses on operational energy-related emissions from expressway traffic and does not conduct a full life-cycle assessment. Emissions from vehicle manufacturing, battery production, road construction, and infrastructure construction are not included. Second, the technological substitution pathway is represented in aggregate form through rising NEV penetration and electricity-related emission factors. It does not further distinguish among different NEV technology routes in the simulation framework. Third, the model excludes low-probability external shocks, such as pandemics and extreme weather events, in order to focus on long-term structural evolution. As a result, the simulated trajectories should be interpreted as medium- to long-term trend outcomes rather than short-term forecasts under disturbance conditions.
In addition, the empirical calibration is based on Guangdong data and the specific operating conditions of the provincial expressway network. Although the case is analytically informative, the quantitative results should not be transferred mechanically to regions with very different traffic structures, energy systems, or policy environments. Future research may extend the current framework in at least three directions. The first is to incorporate a more detailed treatment of different NEV technology routes and charging conditions. The second is to combine the current emission model with economic cost analysis so that mitigation effectiveness and implementation feasibility can be evaluated simultaneously. The third is to test the framework in other regional expressway systems, thereby improving the external comparability of the results.
5. Conclusions
This study developed a system dynamics model to analyze the carbon-emission trajectory of the Guangdong Provincial Expressway Network from 2016 to 2035. By integrating socioeconomic growth, expressway traffic activity, vehicle technology composition, energy use, and carbon emissions within one unified framework, the study compared the mitigation effects of transport structure adjustment and technological substitution through increasing new energy vehicle (NEV) penetration. The results show that, under continued socioeconomic growth, expressway carbon emissions in Guangdong remain under clear upward pressure in the baseline scenario. Compared with the baseline, the NEV Growth scenario reduces emissions by 14.73% by 2035, whereas the Transport Structure Adjustment scenario reduces emissions by only 2.41%. The Combined Scenario achieves the largest reduction, reaching 18.06%, indicating that electrification is the dominant mitigation pathway, while structural adjustment provides an additional but smaller contribution.
These findings suggest that expressway decarbonization in Guangdong should place greater emphasis on NEV deployment and supporting infrastructure while treating transport structure adjustment as a supplementary pathway rather than the primary driver of emission reduction. At the same time, this study is limited to operational energy-related emissions from expressway traffic and does not include full life-cycle emissions such as vehicle manufacturing, battery production, or infrastructure construction. Future research may further incorporate cost analysis, distinguish among different NEV technology pathways, and test the framework in other regional expressway systems.