Article

Optimization of the Ignition System Diagnostics Methodology

Department of mechatronics and electronics, Faculty of Electrical Engineering and Information Technologies, University of Zilina, 010 01 Zilina, Slovakia
*
Author to whom correspondence should be addressed.
Vehicles 2026, 8(4), 71; https://doi.org/10.3390/vehicles8040071
Submission received: 26 January 2026 / Revised: 13 March 2026 / Accepted: 19 March 2026 / Published: 1 April 2026

Abstract

Regular inspection of ignition systems in internal combustion engine (ICE) vehicles is essential as these checks influence both engine performance and emission levels. While emission testing is mandatory for road vehicles, many industrial combustion devices remain outside routine emission control. During standard service procedures such as oil changes, the ignition system can be evaluated using electronic diagnostic tools, which are commonly available in licensed service stations. These measurements provide valuable insight into the spark plug condition—a critical factor affecting ignition quality and emission formation. This article presents the design of a diagnostic system based on an oscilloscope equipped with voltage and current probes. Experimental data were obtained directly from test vehicles and include waveform records of electrical quantities, revealing clearly distinguishable differences in component behavior. The proposed system enables rapid and accurate spark plug condition assessment under various operating states. Results confirm that the selected diagnostic approach can identify characteristic variations in ignition components, thereby improving fault detection accuracy. This study introduces an innovative, non-intrusive diagnostic method applicable to the development of modern automotive tools. Overall, this work contributes to enhancing the reliability, efficiency, and emission performance of internal combustion engines.

1. Introduction

For a comprehensive understanding of this subject, it is essential to first outline the operating principles of internal combustion engines and the mechanisms through which they generate harmful emissions affecting the environment. The reliability and efficiency of internal combustion engines (ICEs) are strongly influenced by the performance of ignition systems [1], which has led to extensive research on diagnostic techniques for these components. Traditional diagnostic methods, such as visual inspection and spark plug resistance measurement, remain widely used but are limited in their ability to detect early-stage degradation or intermittent faults [2].
Recent studies have highlighted the advantages of waveform analysis using oscilloscopes for ignition system diagnostics. Oscilloscopes provide detailed insight into voltage and current signals during the ignition process, enabling the detection of abnormalities in coil saturation, spark duration, and combustion quality [3]. For example, PicoScope-based systems have become popular in automotive workshops due to their ability to capture high-resolution ignition waveforms and correlate them with engine operating conditions. The analysis of primary and secondary ignition waveforms allows technicians to identify issues such as worn spark plugs, incorrect gaps, and coil faults without intrusive disassembly [4]. This is a significant advantage in modern vehicles with complex mechanical arrangements of ICE and engine compartment components.
Contemporary gasoline engines are generally classified into two categories: two-stroke and four-stroke. Two-stroke engines, due to their relatively simple design, are commonly applied in small motorcycles, handheld power equipment such as chainsaws and lawnmowers, older vehicles, and compact power generators up to approximately 2 kW [5,6,7]. In contrast, four-stroke engines are mechanically more complex and are widely employed in automobiles, motorcycles, and marine vessels, as well as in lawnmowers, power stations, and even aircraft. With regard to emissions, two-stroke engines tend to produce higher pollutant levels because their lubrication relies on oil mixed directly with the fuel. This oil does not combust entirely, leading to significant hydrocarbon emissions and visible smoke [8,9]. Four-stroke engines utilize a separate lubrication system with oil stored in an oil sump, allowing for cleaner and more complete combustion. When combined with modern aftertreatment technologies such as catalytic converters, diesel particulate filters, and selective catalytic reduction with AdBlue, four-stroke engines exhibit considerably higher environmental compatibility [10,11].
Emissions generated during the combustion of the fuel–air mixture primarily include carbon dioxide (CO2), carbon monoxide (CO), hydrocarbons (HC), nitrogen oxides (NOx), and water vapor (H2O). Carbon dioxide is the dominant product of gasoline combustion. Although it is not directly toxic to humans, it is a greenhouse gas that contributes to global warming and the depletion of the ozone layer. Carbon monoxide is formed as a result of incomplete combustion; it is colorless, highly poisonous, and binds strongly to hemoglobin in the blood. Hydrocarbons represent essentially unburned fuel residues that contribute to the formation of ground-level ozone and photochemical smog. Nitrogen oxides are produced under high combustion temperatures, where they irritate the respiratory system and significantly degrade air quality [12,13,14].
National legislation mandates periodic technical and emissions inspections for all road vehicles and trailers that are registered and possess a license plate number. These inspections do not apply to unregistered vehicles, certain agricultural and forestry machinery, historic vehicles, military and emergency service vehicles, or other specialized single-purpose machines that are not commonly operated, such as heavy construction equipment. Beyond vehicles designed for the transport of passengers or goods, a wide range of machines rely on gasoline engines as their primary source of power [15]. These engines also produce emissions; however, such machines are neither subject to inspection nor covered by any regulatory monitoring. The number of gasoline-powered machines that fall outside the scope of emissions inspections is several times higher than the number of vehicles that are included within this regulated category (European Commission) [16,17].
Ignition is implemented using one or multiple ignition coils that generate sufficiently high voltage to create a spark discharge, thereby igniting the fuel–air mixture. The voltage required typically reaches several tens of kilovolts. The measurement of such high-amplitude waveforms is not typically feasible with standard equipment; therefore, in our work, we designed a voltage divider to enable signal acquisition. Commercial devices capable of measuring such high voltages are generally expensive and not readily available for testing every ignition system [18,19,20,21,22]. Also, probes for such high voltage typically have limited accuracy and perform slowly in the measurement of quick actions such as the ignition of a spark. Malfunctioning ignition can also be identified without specialized instrumentation as it manifests through observable symptoms such as engine vibrations, irregular misfiring, excessive smoke, or noticeable odor. The electrical control unit (ECU) of an engine can detect total failure of ignition, but it cannot detect the partial ignition of a mixture; thus, analysis of electrical quantities is necessary.
Advanced signal processing techniques have further improved diagnostic accuracy. Wavelet and Fourier transforms have been applied to ignition voltage signals to extract fault-related features that are not easily visible in the time domain [23,24]. These methods enhance the detection of subtle variations in waveform patterns, supporting predictive maintenance strategies. Additionally, model-based diagnostic approaches and machine learning algorithms have been explored to automate fault classification and reduce reliance on manual interpretation [25].
Non-intrusive diagnostic techniques are gaining prominence due to their ability to monitor engine components without physical intervention. Laser-based optical diagnostics, such as laser-induced fluorescence (LIF), have been employed to study in-cylinder combustion phenomena, offering complementary insights into ignition behavior and pollutant formation [26]. Similarly, recent work has demonstrated the feasibility of using spark plugs as sensors, enabling the real-time monitoring of gap wear and breakdown voltage through non-contact measurements [27].
This study underscores the growing importance of integrating oscilloscope-based diagnostics with advanced signal processing and sensor technologies in modern automotive maintenance. Such integration offers significant benefits, including enhanced fault detection accuracy, reduced operational costs, and improved compliance with increasingly stringent emission regulations. Despite these advantages, this research identifies persistent challenges in standardizing diagnostic methodologies and achieving cost-effective implementation for routine service environments. Addressing these gaps is essential for enabling widespread adoption and unlocking the full potential of non-intrusive diagnostic approaches in the development of next-generation automotive systems.

2. Materials and Methods

Historically, interpreting ignition has often been qualitative. A researcher might point to a spike in a pressure trace and say, “There’s the ignition point.” While technically true, this approach lacks the physically grounded rigor required for predictive modeling.
To move from “looking at lines” to “understanding physics,” we must correlate the measured waveforms with the fundamental conservation equations of fluid dynamics and chemical kinetics. A sufficiently quantitative interpretation starts with the energy equation. We aren’t just looking for a “jump” in the signal; we are looking for the point where the chemical heat release rate Qchem exceeds the heat loss rate Qloss to the surroundings.
ρ C p d T d t = Q c h e m Q l o s s
where ρ is the mass per unit volume, Cp is specific heat capacity, and dT/dt is temperature gradient.
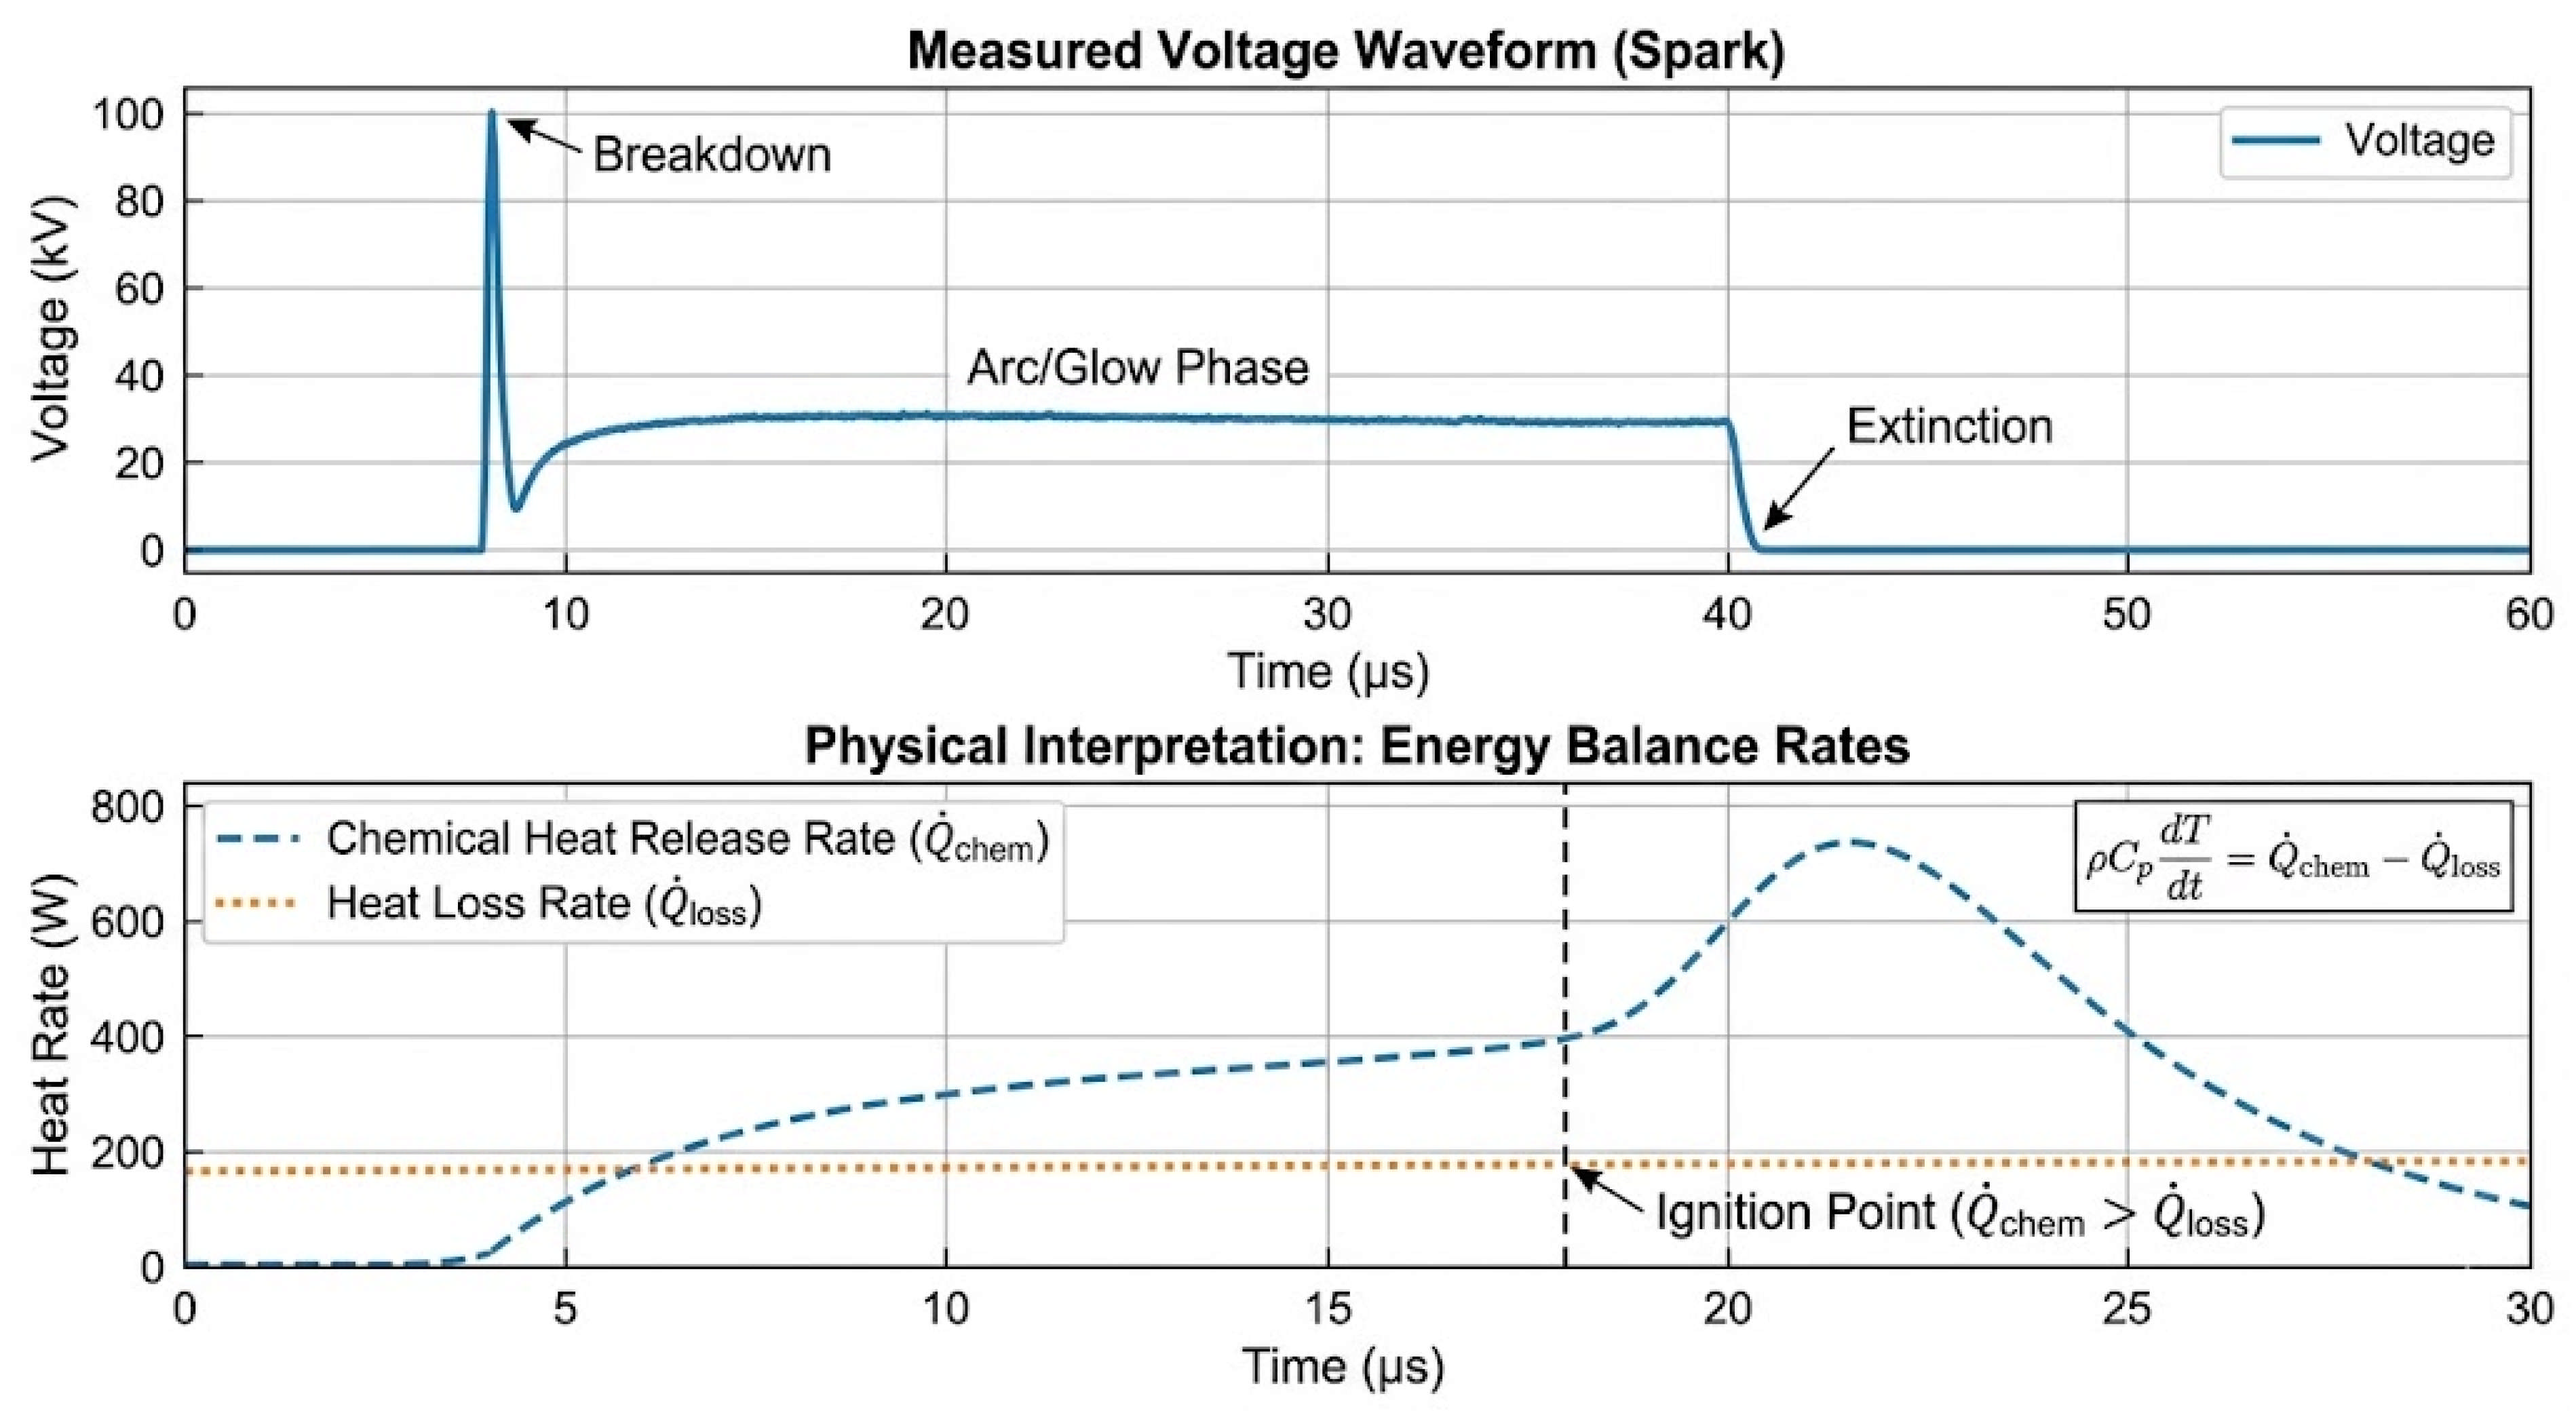
When we analyze a waveform (Figure 1), for example, a pressure trace in a rapid compression machine, we are essentially performing an inverse problem to solve for these terms.
To provide a “physically grounded” interpretation, we must break the waveform into distinct phases that correspond to actual physical phenomena:
  • The Induction Period (Flat Part): The subtle slope before the main spike. This represents the radical pool buildup (chain-branching reactions) where the temperature rise is minimal, but the chemical “engine” is priming. Qchem is roughly equal to Qloss.
  • The Thermal Runaway: The steep vertical rise. Quantitatively, this is where the Arrhenius dependence of the reaction rate becomes dominant. Qchem begins to significantly ou Qloss.
  • The Post-Flame Oscillation: Often dismissed as noise, these ripples can represent acoustic coupling or pressure waves reflecting off chamber walls, providing data on the speed of sound in the burnt gas. Qchem increases exponentially, causing sharp vertical spikes in the voltage waveform.
A robust numerical characterization of ignition requires extracting specific parameters from measured waveforms to bridge the gap between raw data and physical mechanisms. Key temporal metrics like the ignition delay time τ and arc duration define the chemical induction window, while energetic values such as the breakdown voltage Vb and total deposited energy  E = 0 t V . I d t quantify the plasma’s ability to overcome the mixture’s thermal inertia. By analyzing rate-based descriptors like the peak heat release rate Qmax and maximum pressure rise dP/dtmax, researchers can pinpoint the precise moment of thermal runaway—mathematically defined as the point where the acceleration of temperature becomes autonomous.
A diagnostic procedure is only “physically grounded” if it uses the voltage waveform to solve the inverse energy balance problem. By measuring the area under the voltage–current curve (Energy) and comparing it to the timing of the pressure rise (Response), the diagnostic system can decide if the ignition system is operating within the required safety margins for a specific fuel–air ratio in real-time.
In our study, we aimed to maximize data acquisition. This means that all measurable quantities at the ignition coil are collected as observation points. Based on experimental results, these parameters provide valuable insights into the diagnostic condition of the spark plug, which plays a decisive role in the combustion process.
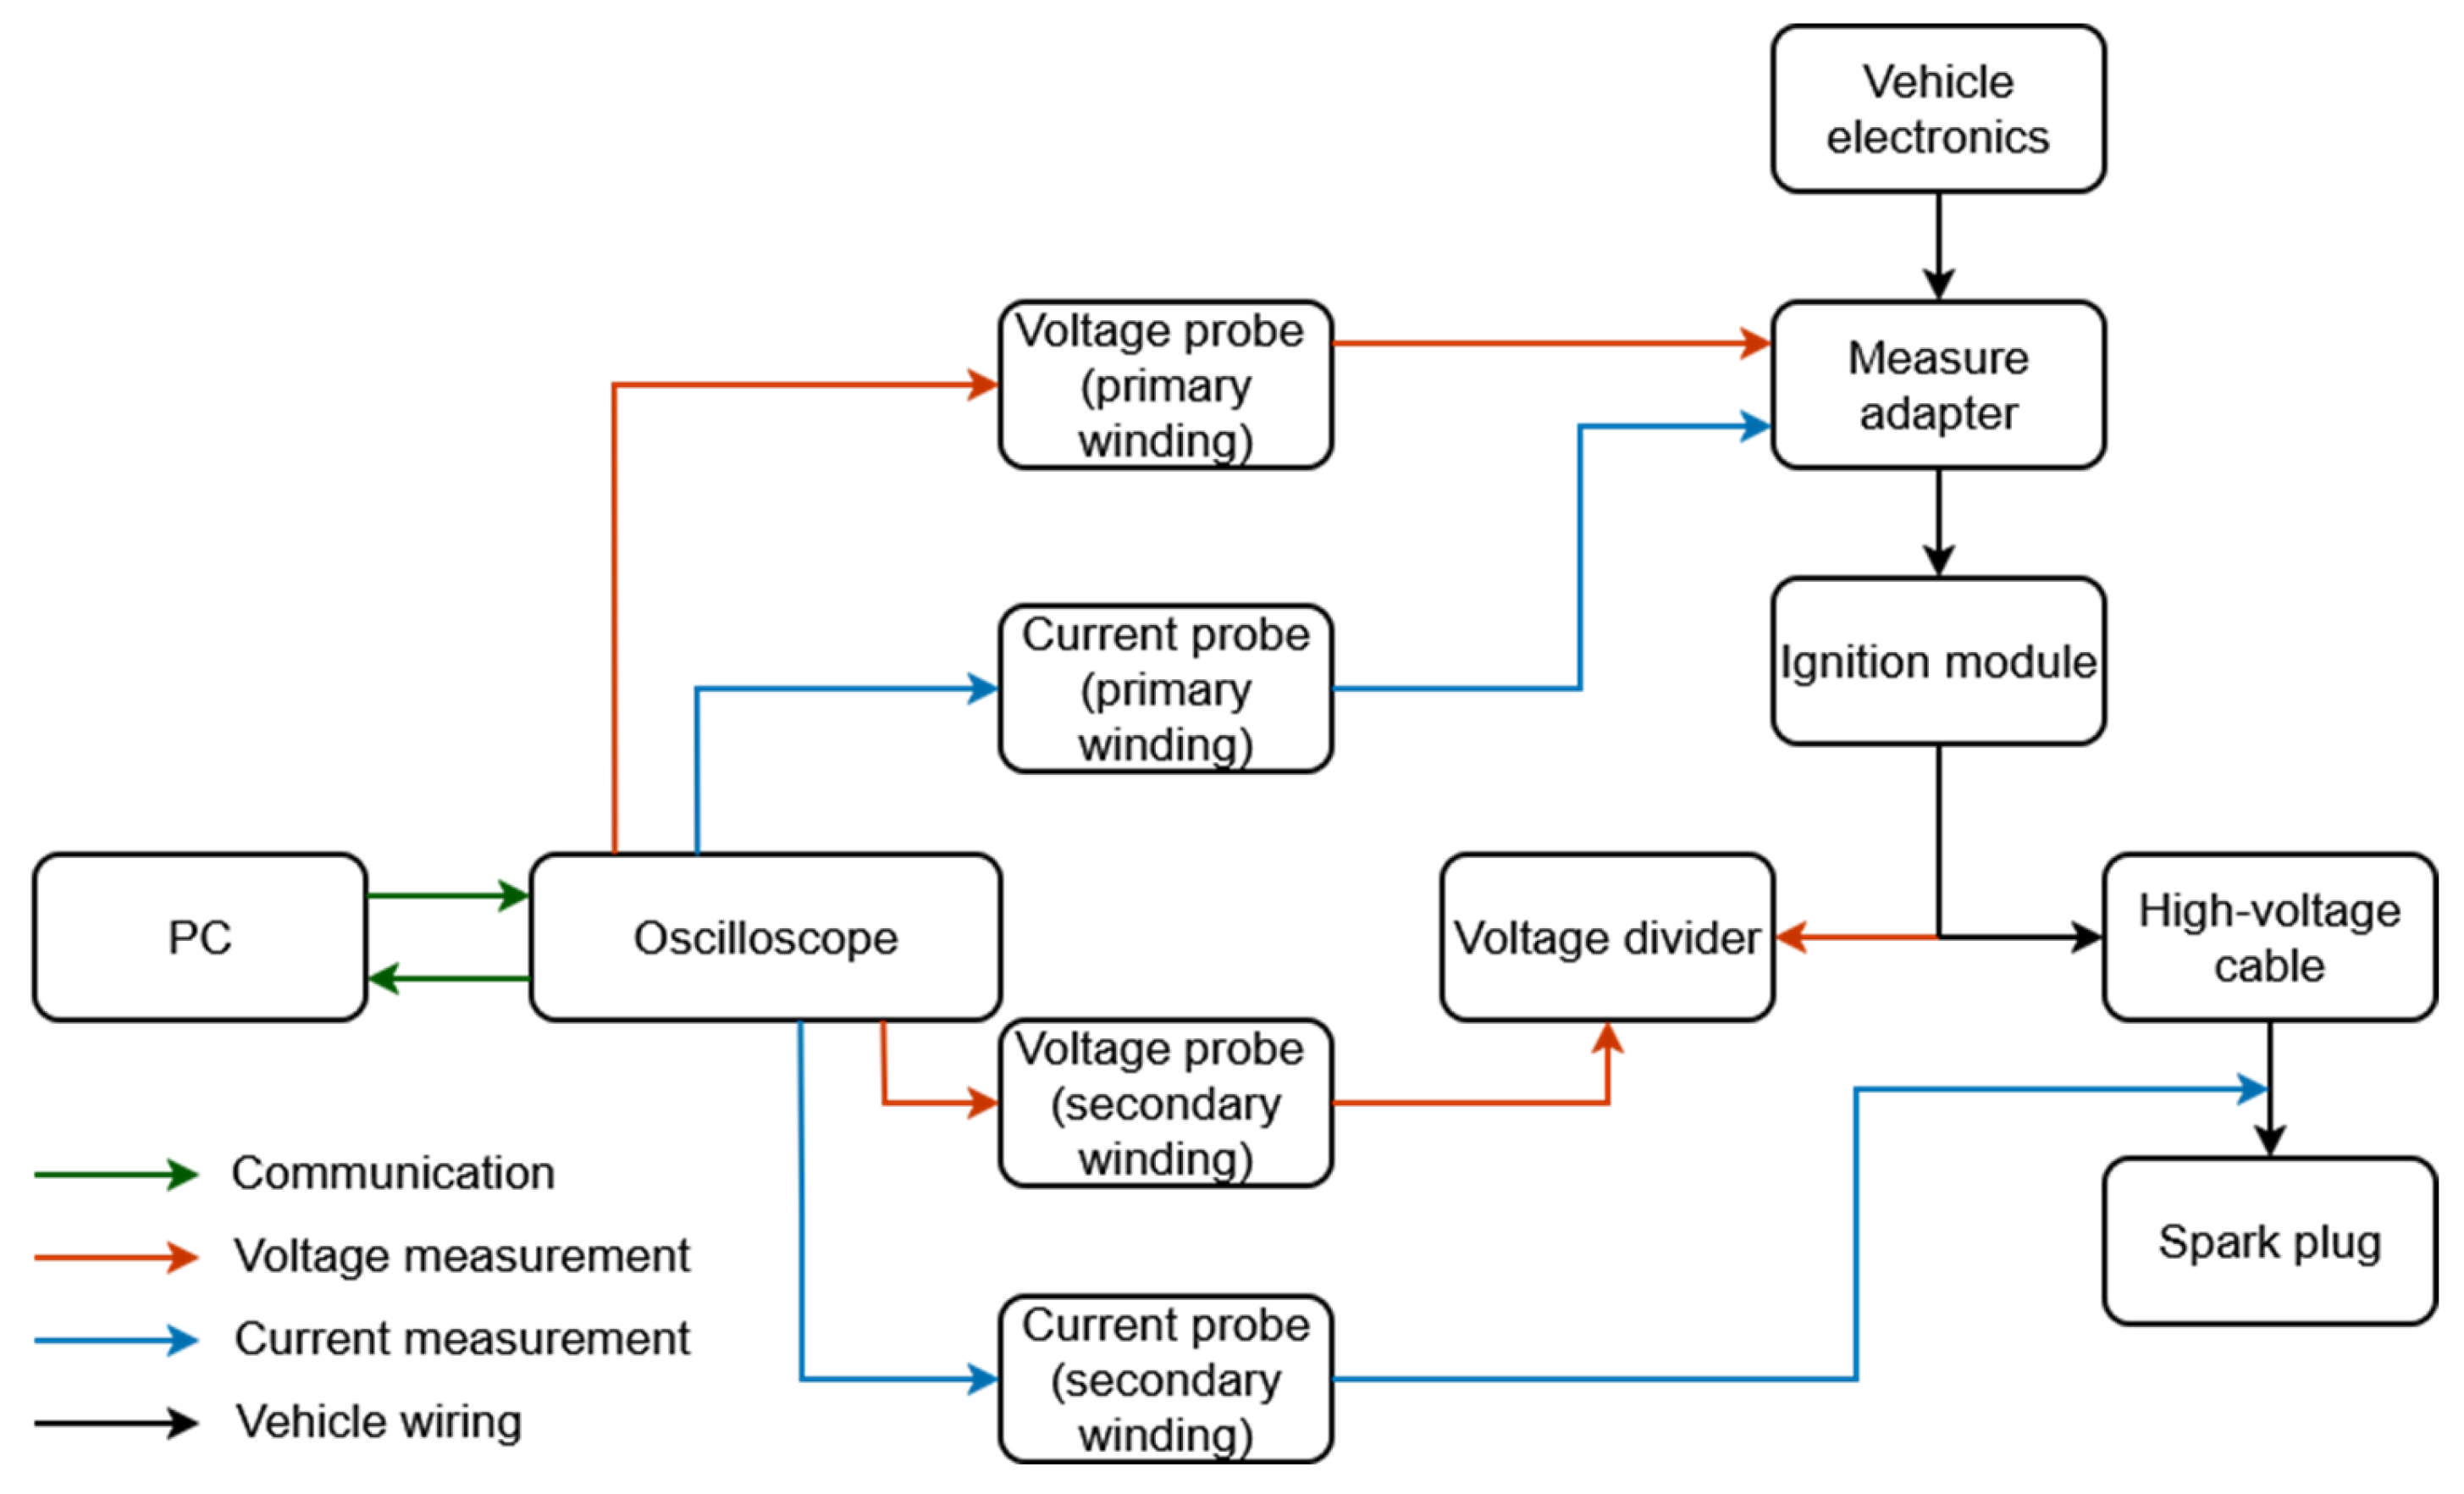
The measurable electrical quantities in the ignition system (Figure 2) include voltage at the primary winding of the ignition coil, current at the primary winding, voltage at the secondary winding, and current at the secondary winding. The term “ignition coil” is a simplification; technically, this component is a transformer with a very high turns ratio, converting approximately 12 V on the primary side into a range of 20 kV to 50 kV on the secondary side, depending on engine properties like the compression ratio or the injected fuel mixture. This specific category (20–50 kV) is a type of coil-on-plug. Other voltage categories and types of ignition coils also exist, but they are not included within the scope of this paper.
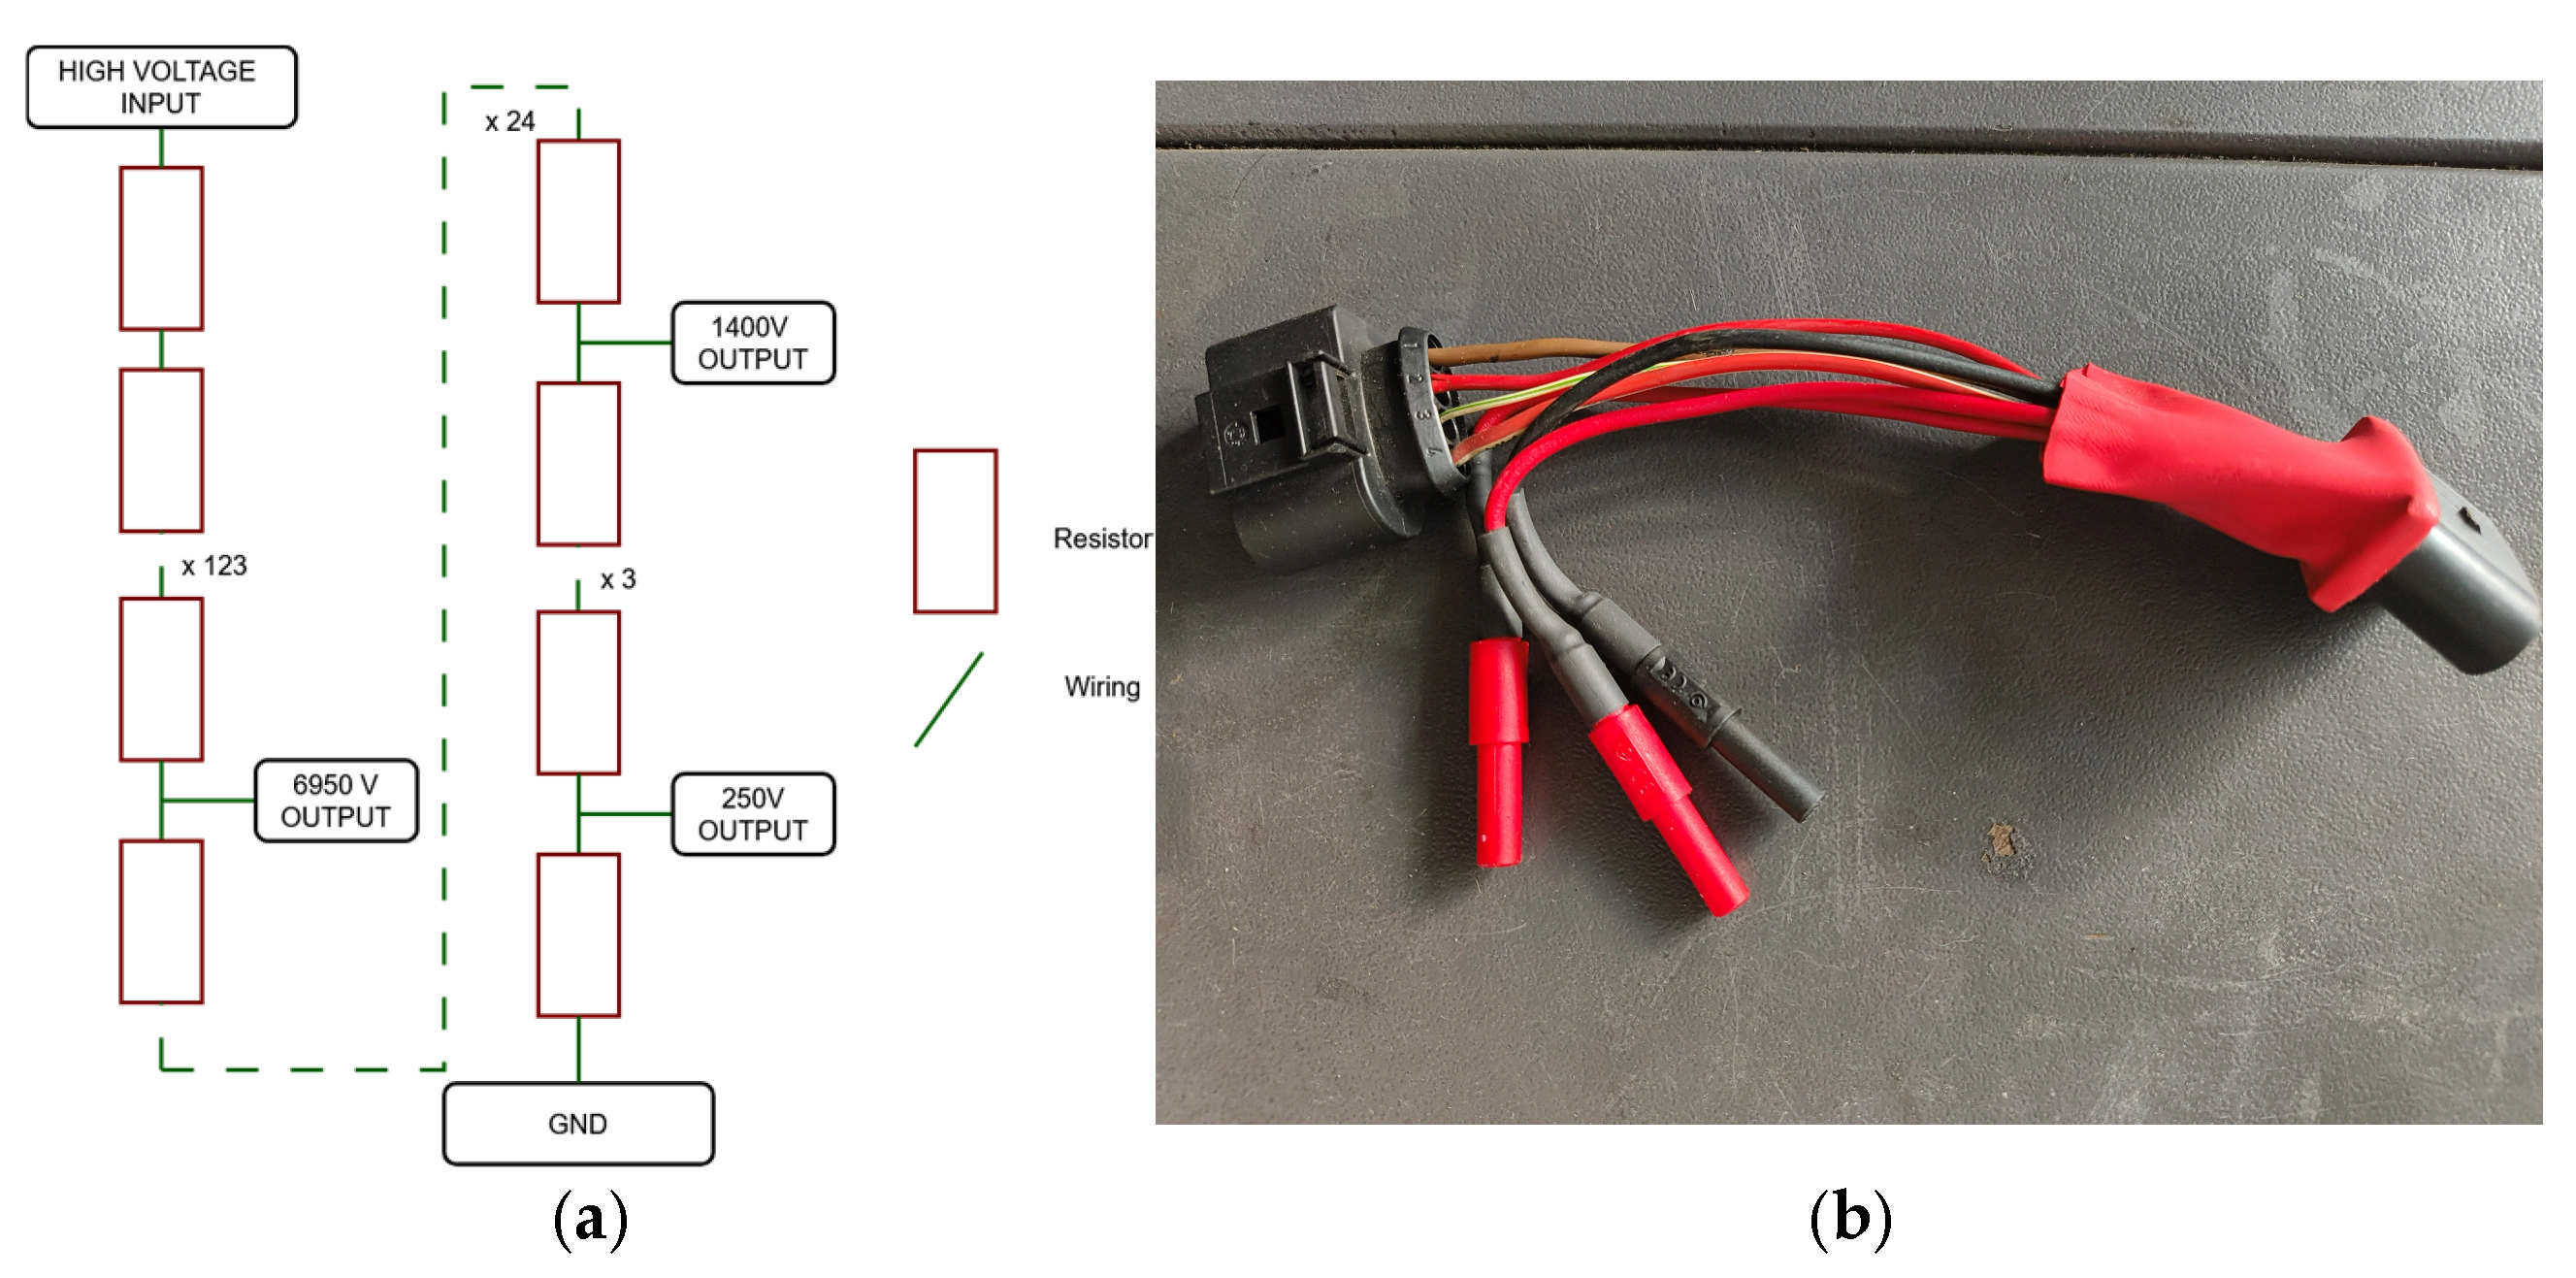
Based on the previous facts, for the measurements purposes, a high-voltage voltage divider was designed (Figure 3a) to accommodate the actual voltage conditions and to enable acquisition of the waveforms characterizing the operating state of the spark plug. A voltage divider is used to allow for the use of a fast voltage probe with lower voltage. The voltage divider was created with 150 SMD resistor pieces with a case 1206 voltage rating of up to 200 V, which can be overloaded to 400 V. This means that the voltage divider has voltage ratings of up to 30 kV, which can be overloaded up to 60 kV. The voltage divider has three taps, so it is possible to use voltage probes with lower voltage ratings. Additionally, a custom adapter was developed to facilitate the measurement of primary quantities and to improve overall convenience (Figure 3b).
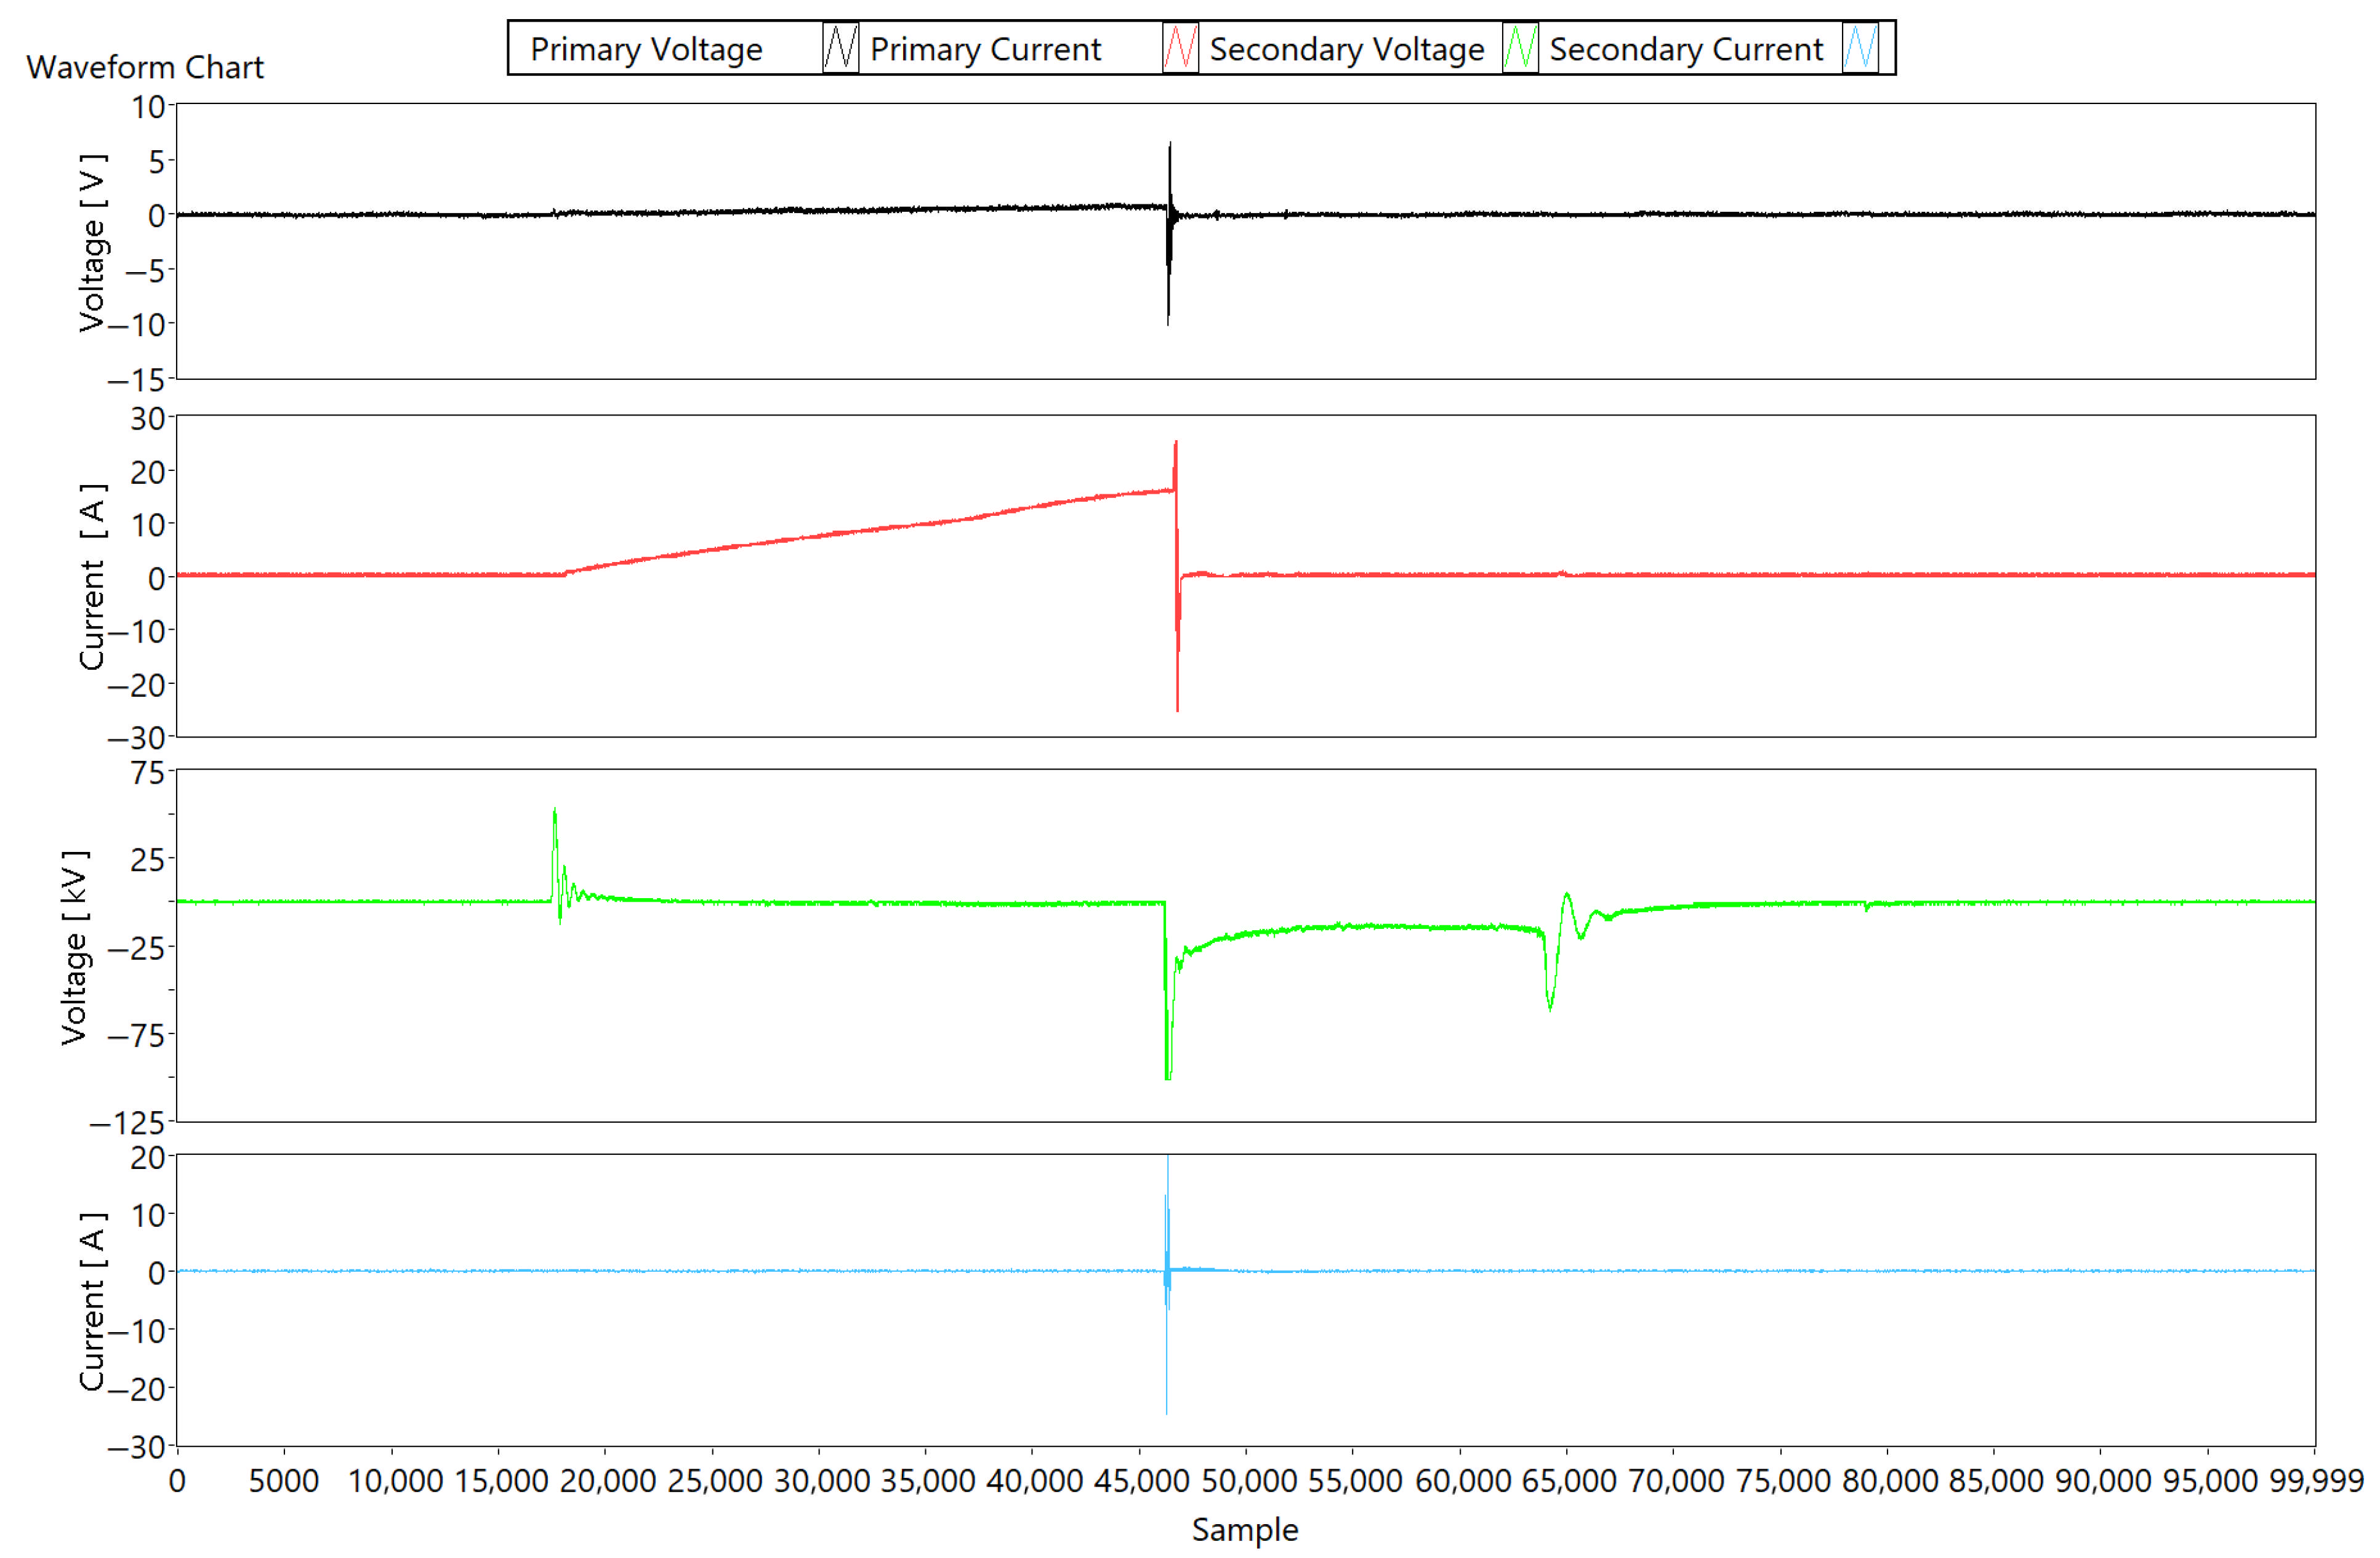
In Figure 4, the ignition process can be divided into three distinct phases:
  • Coil saturation period;
  • Spark discharge;
  • Combustion of the fuel–air mixture.
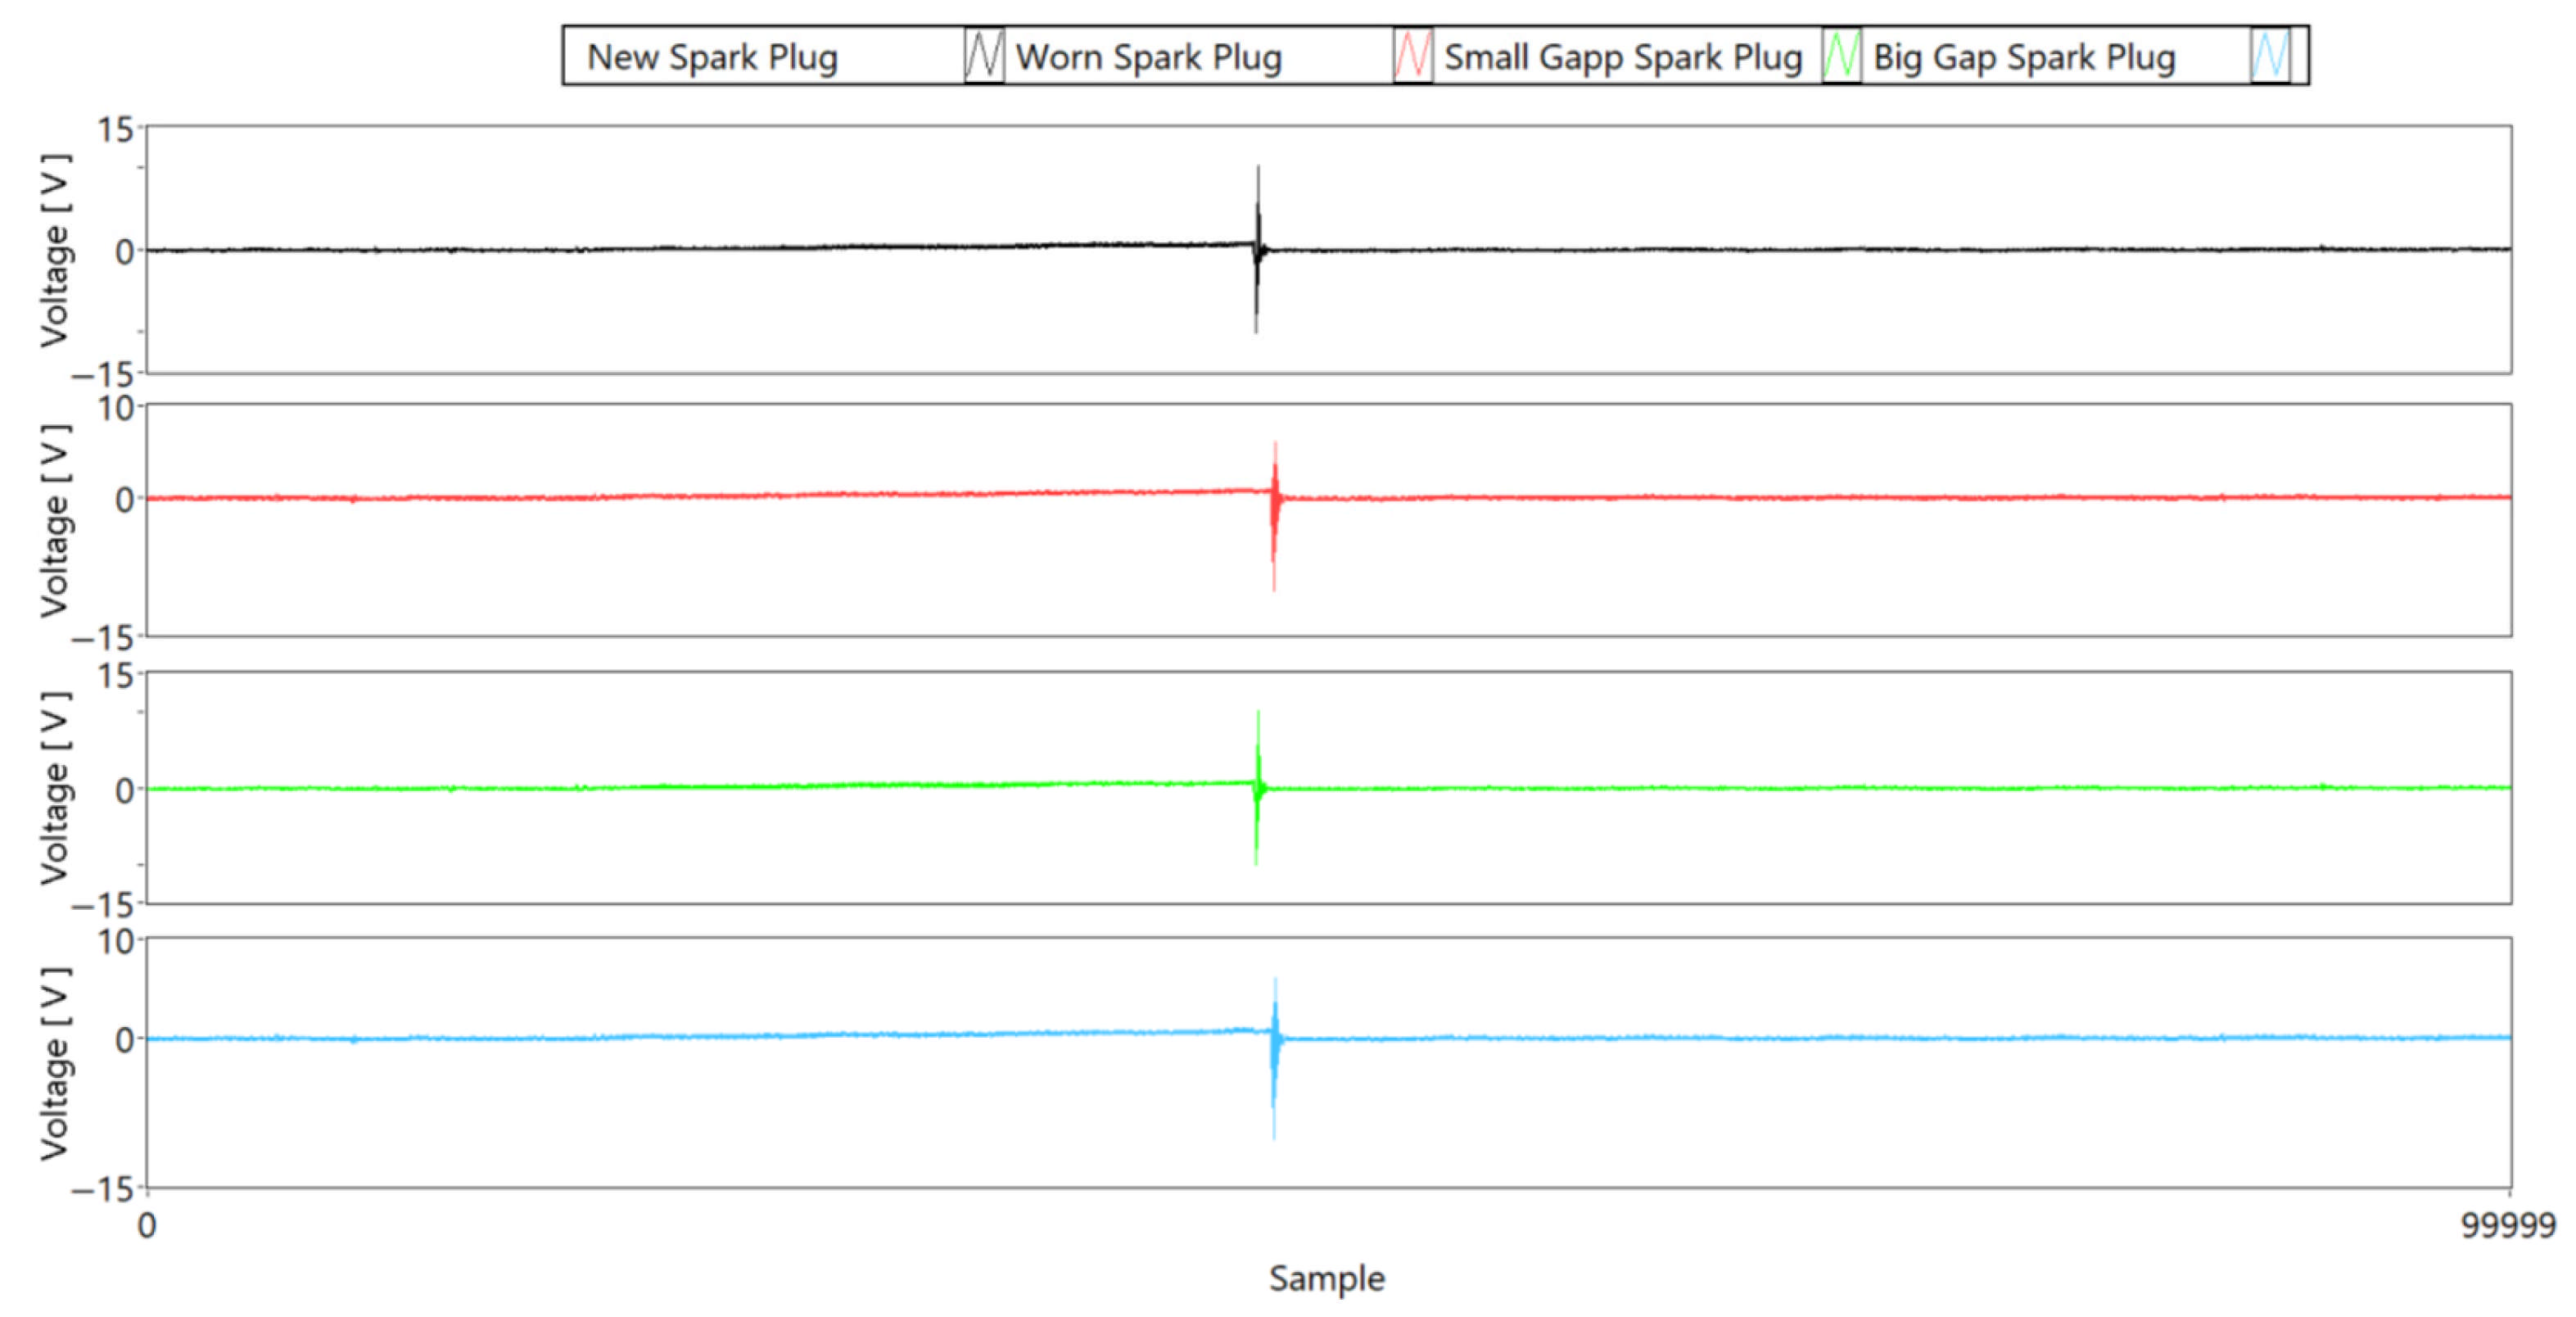
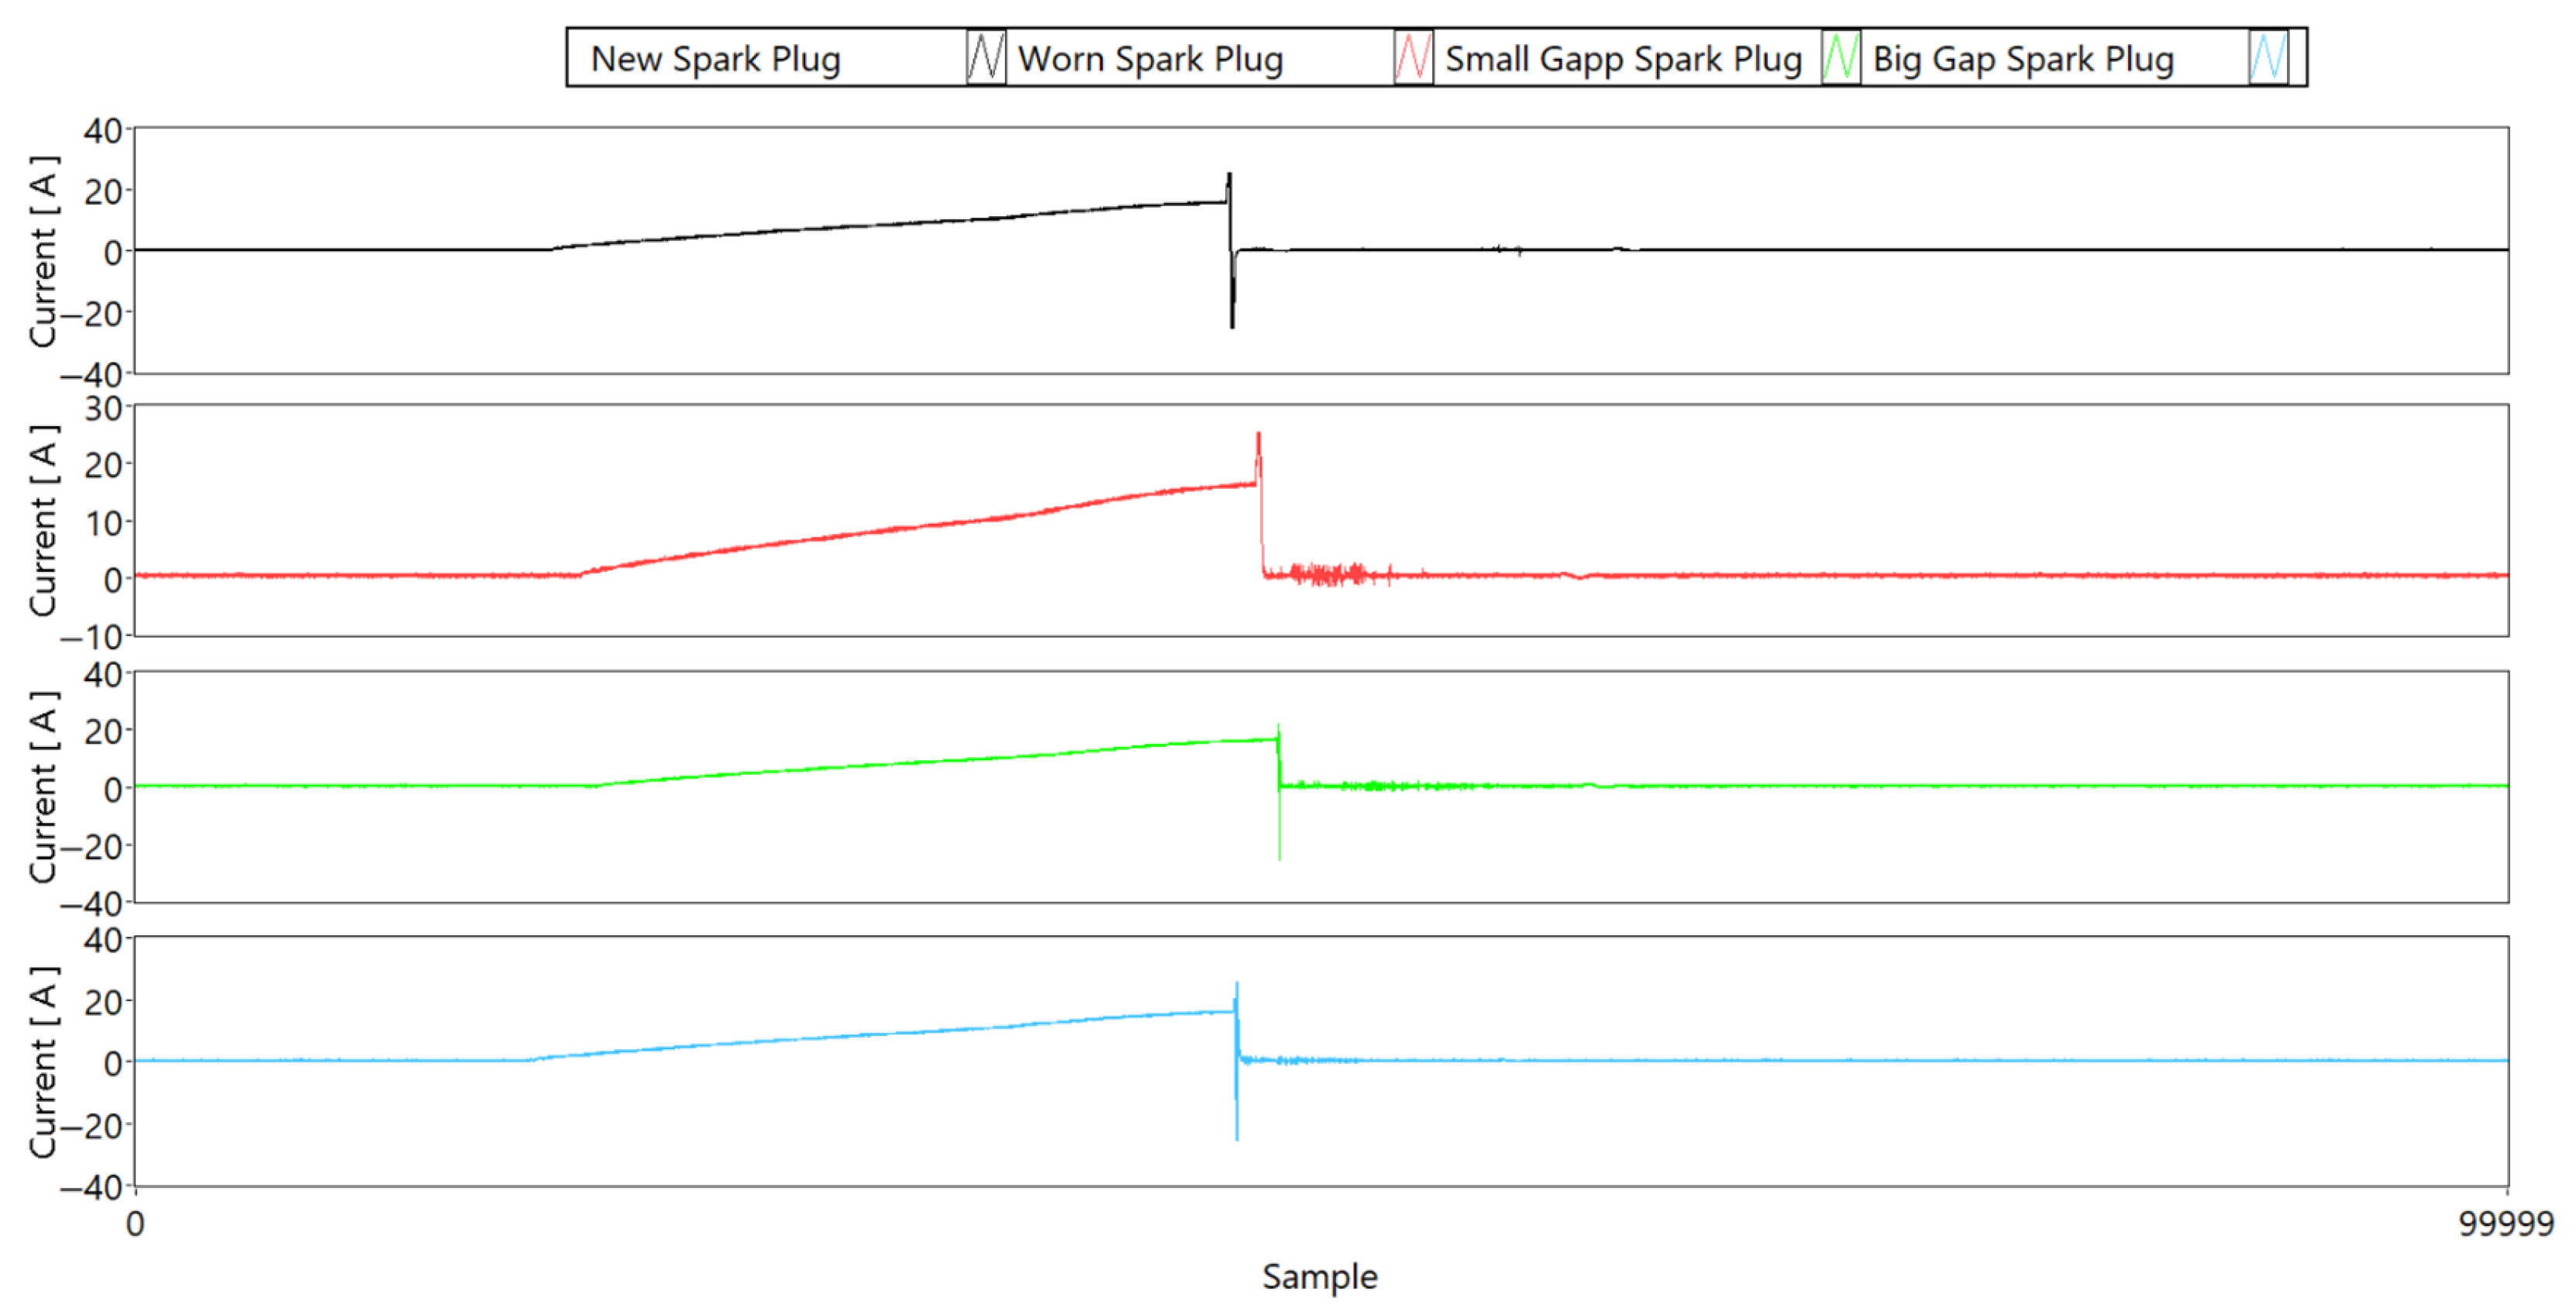
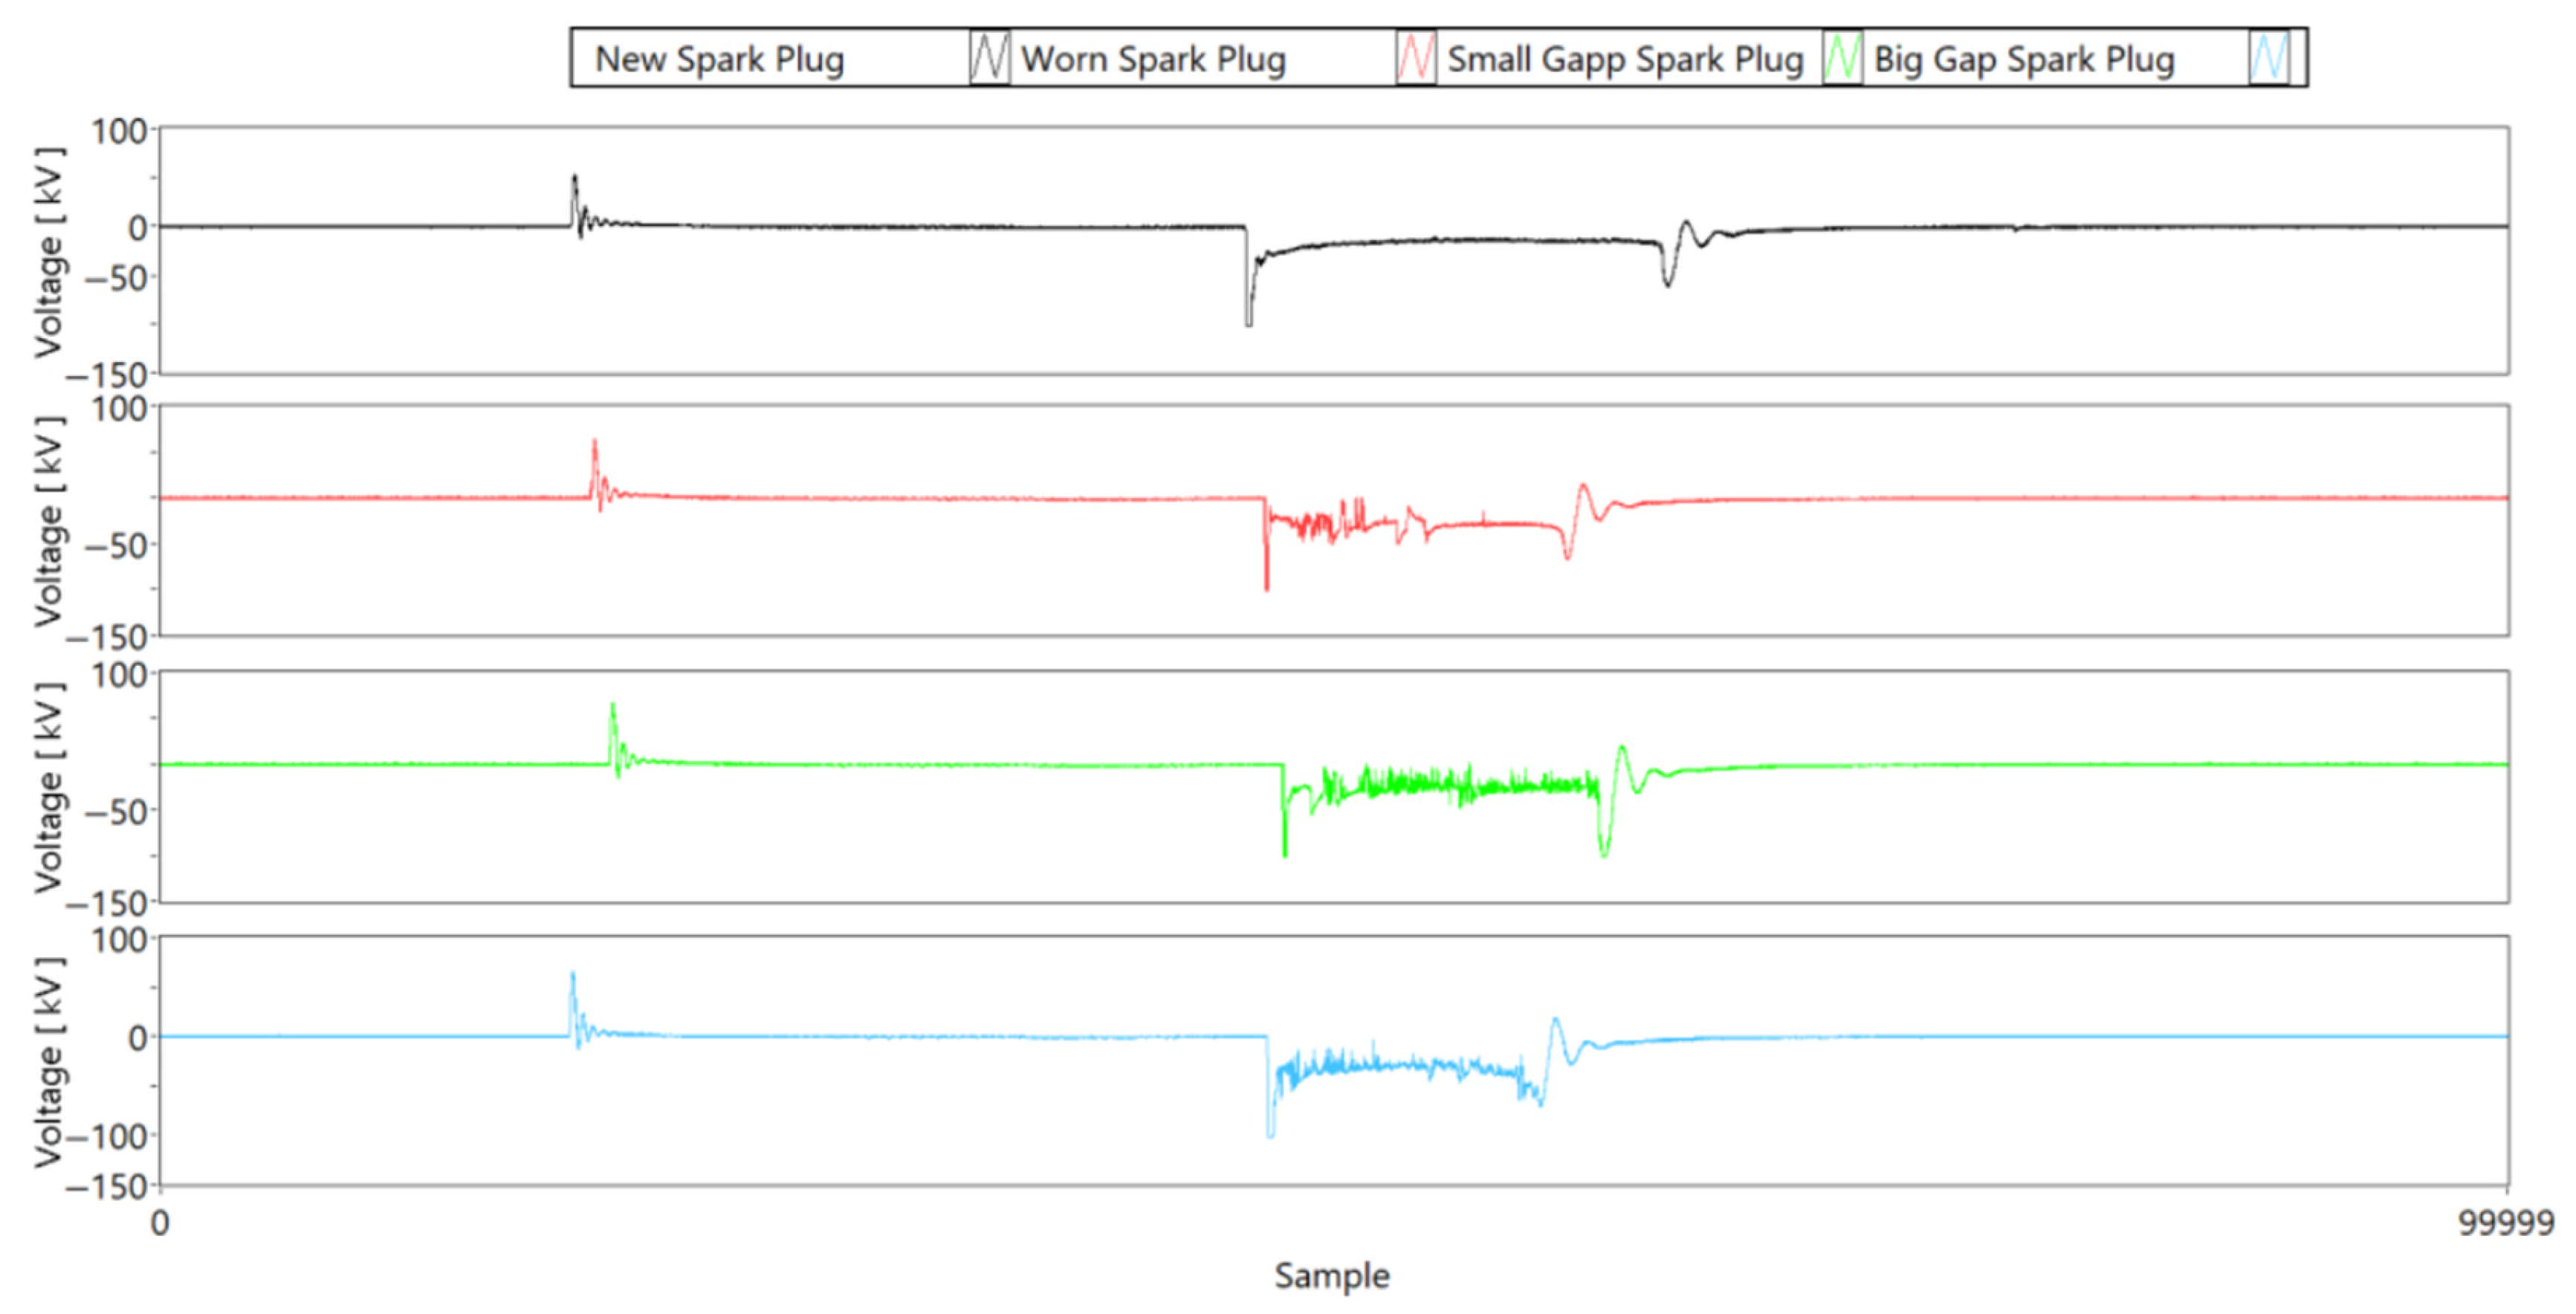
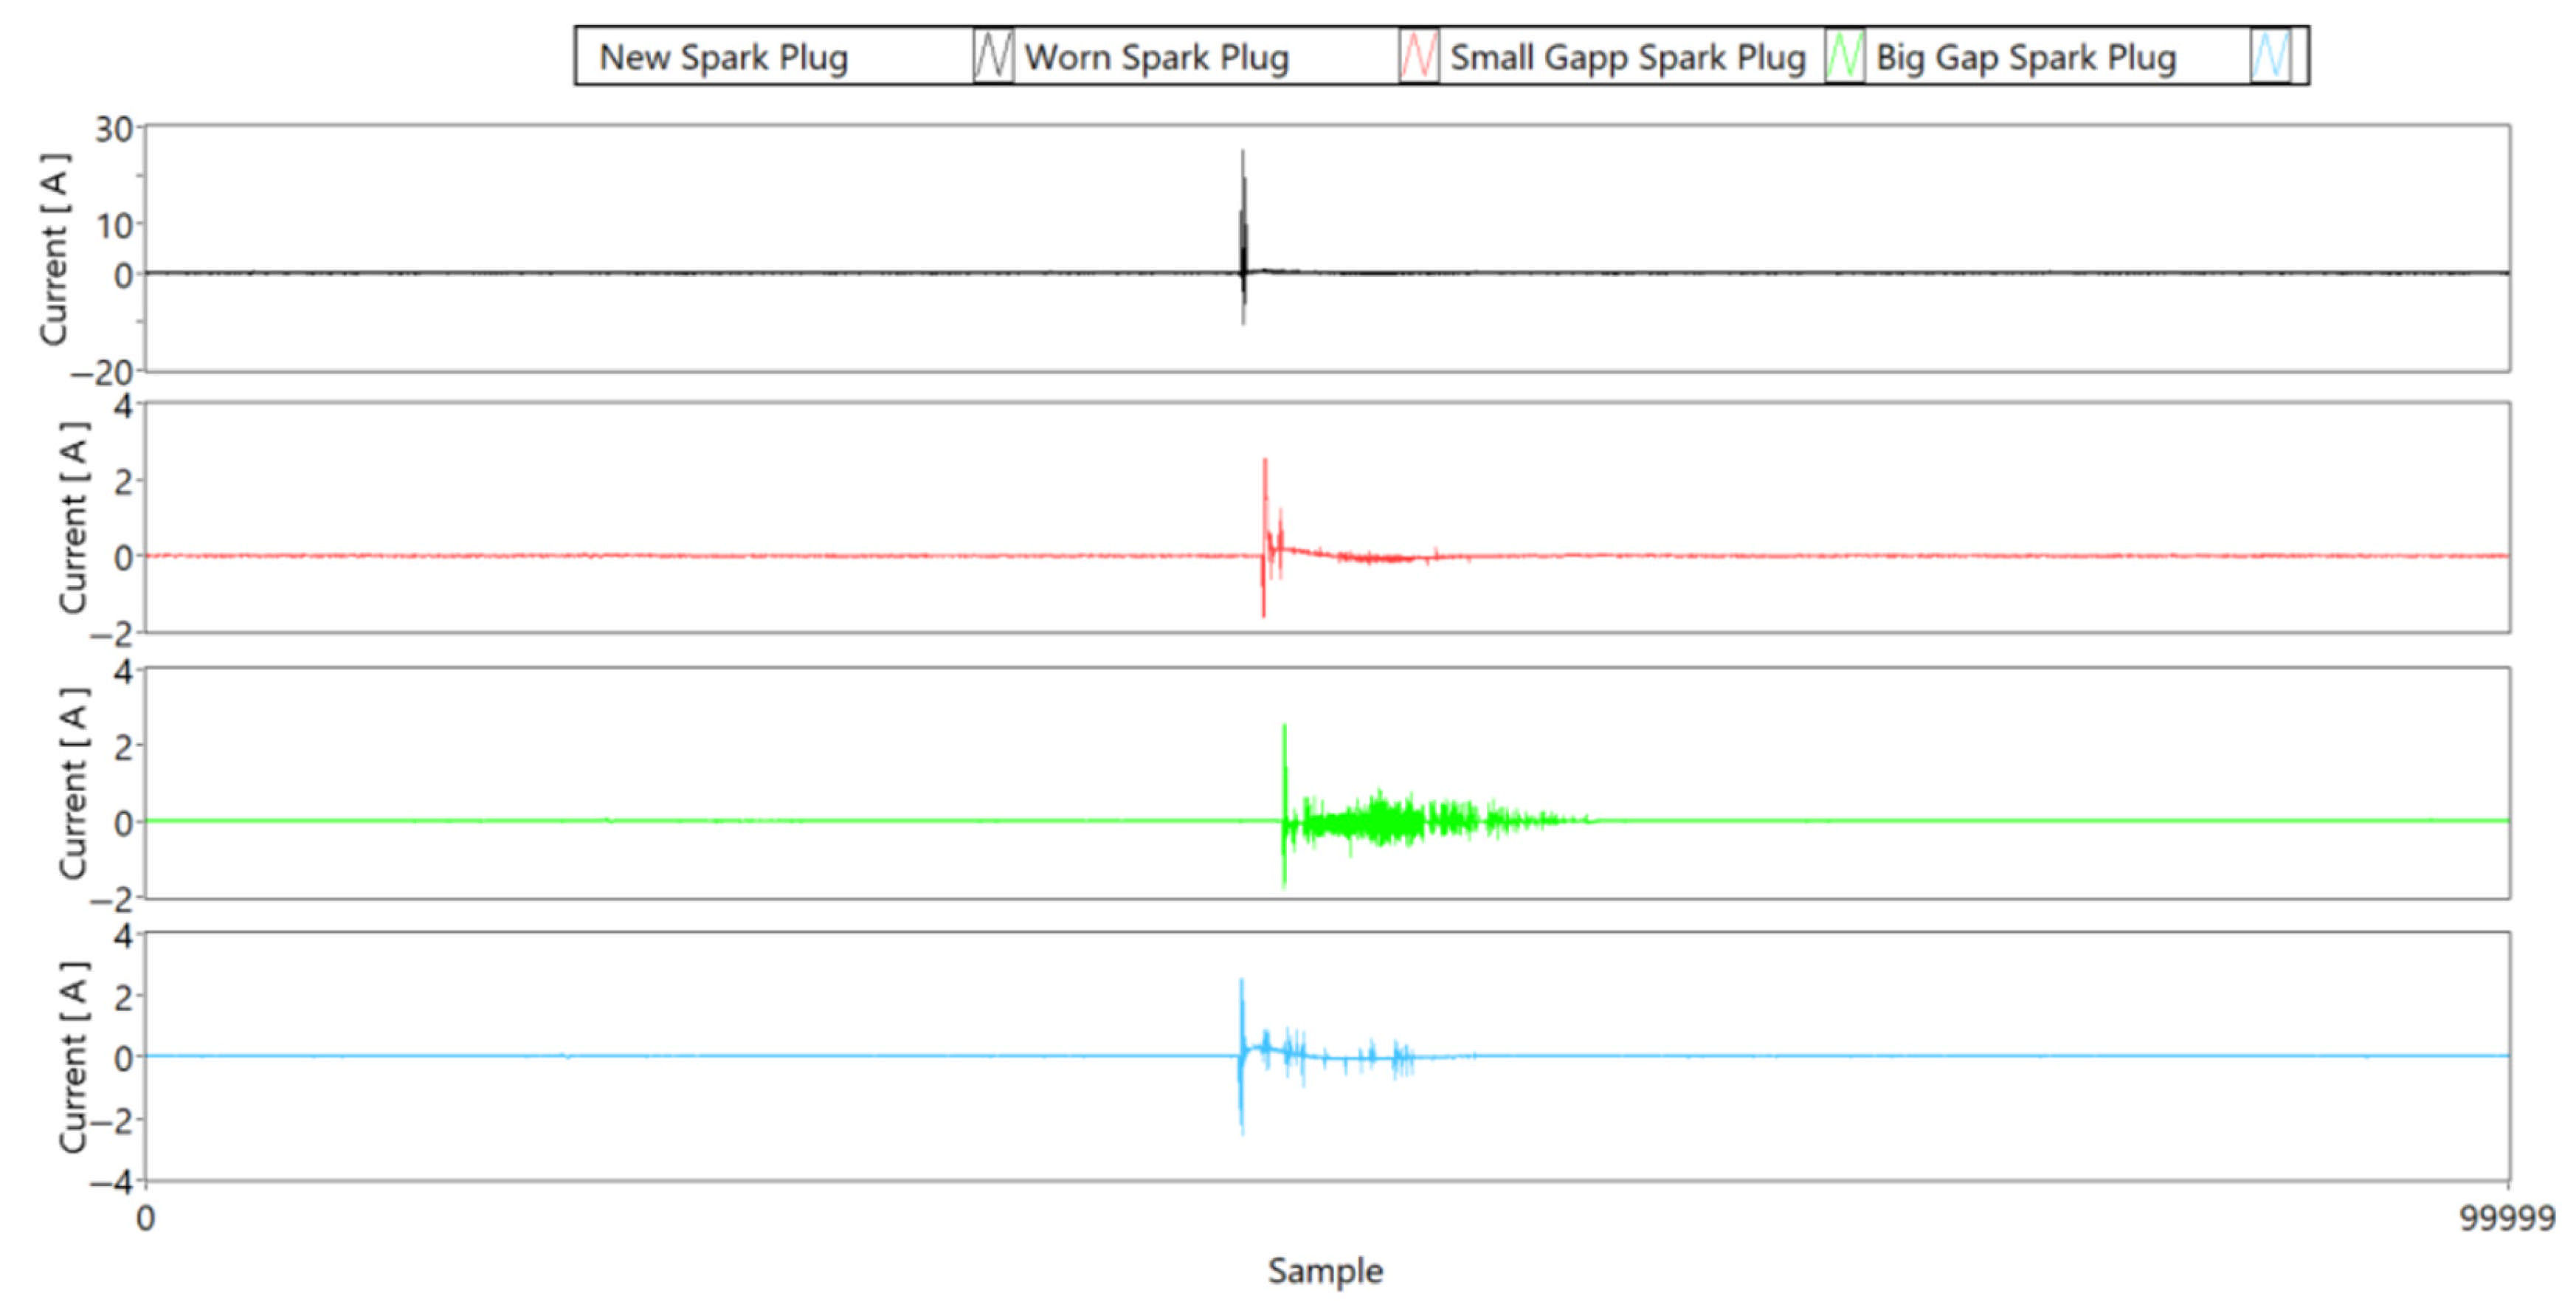
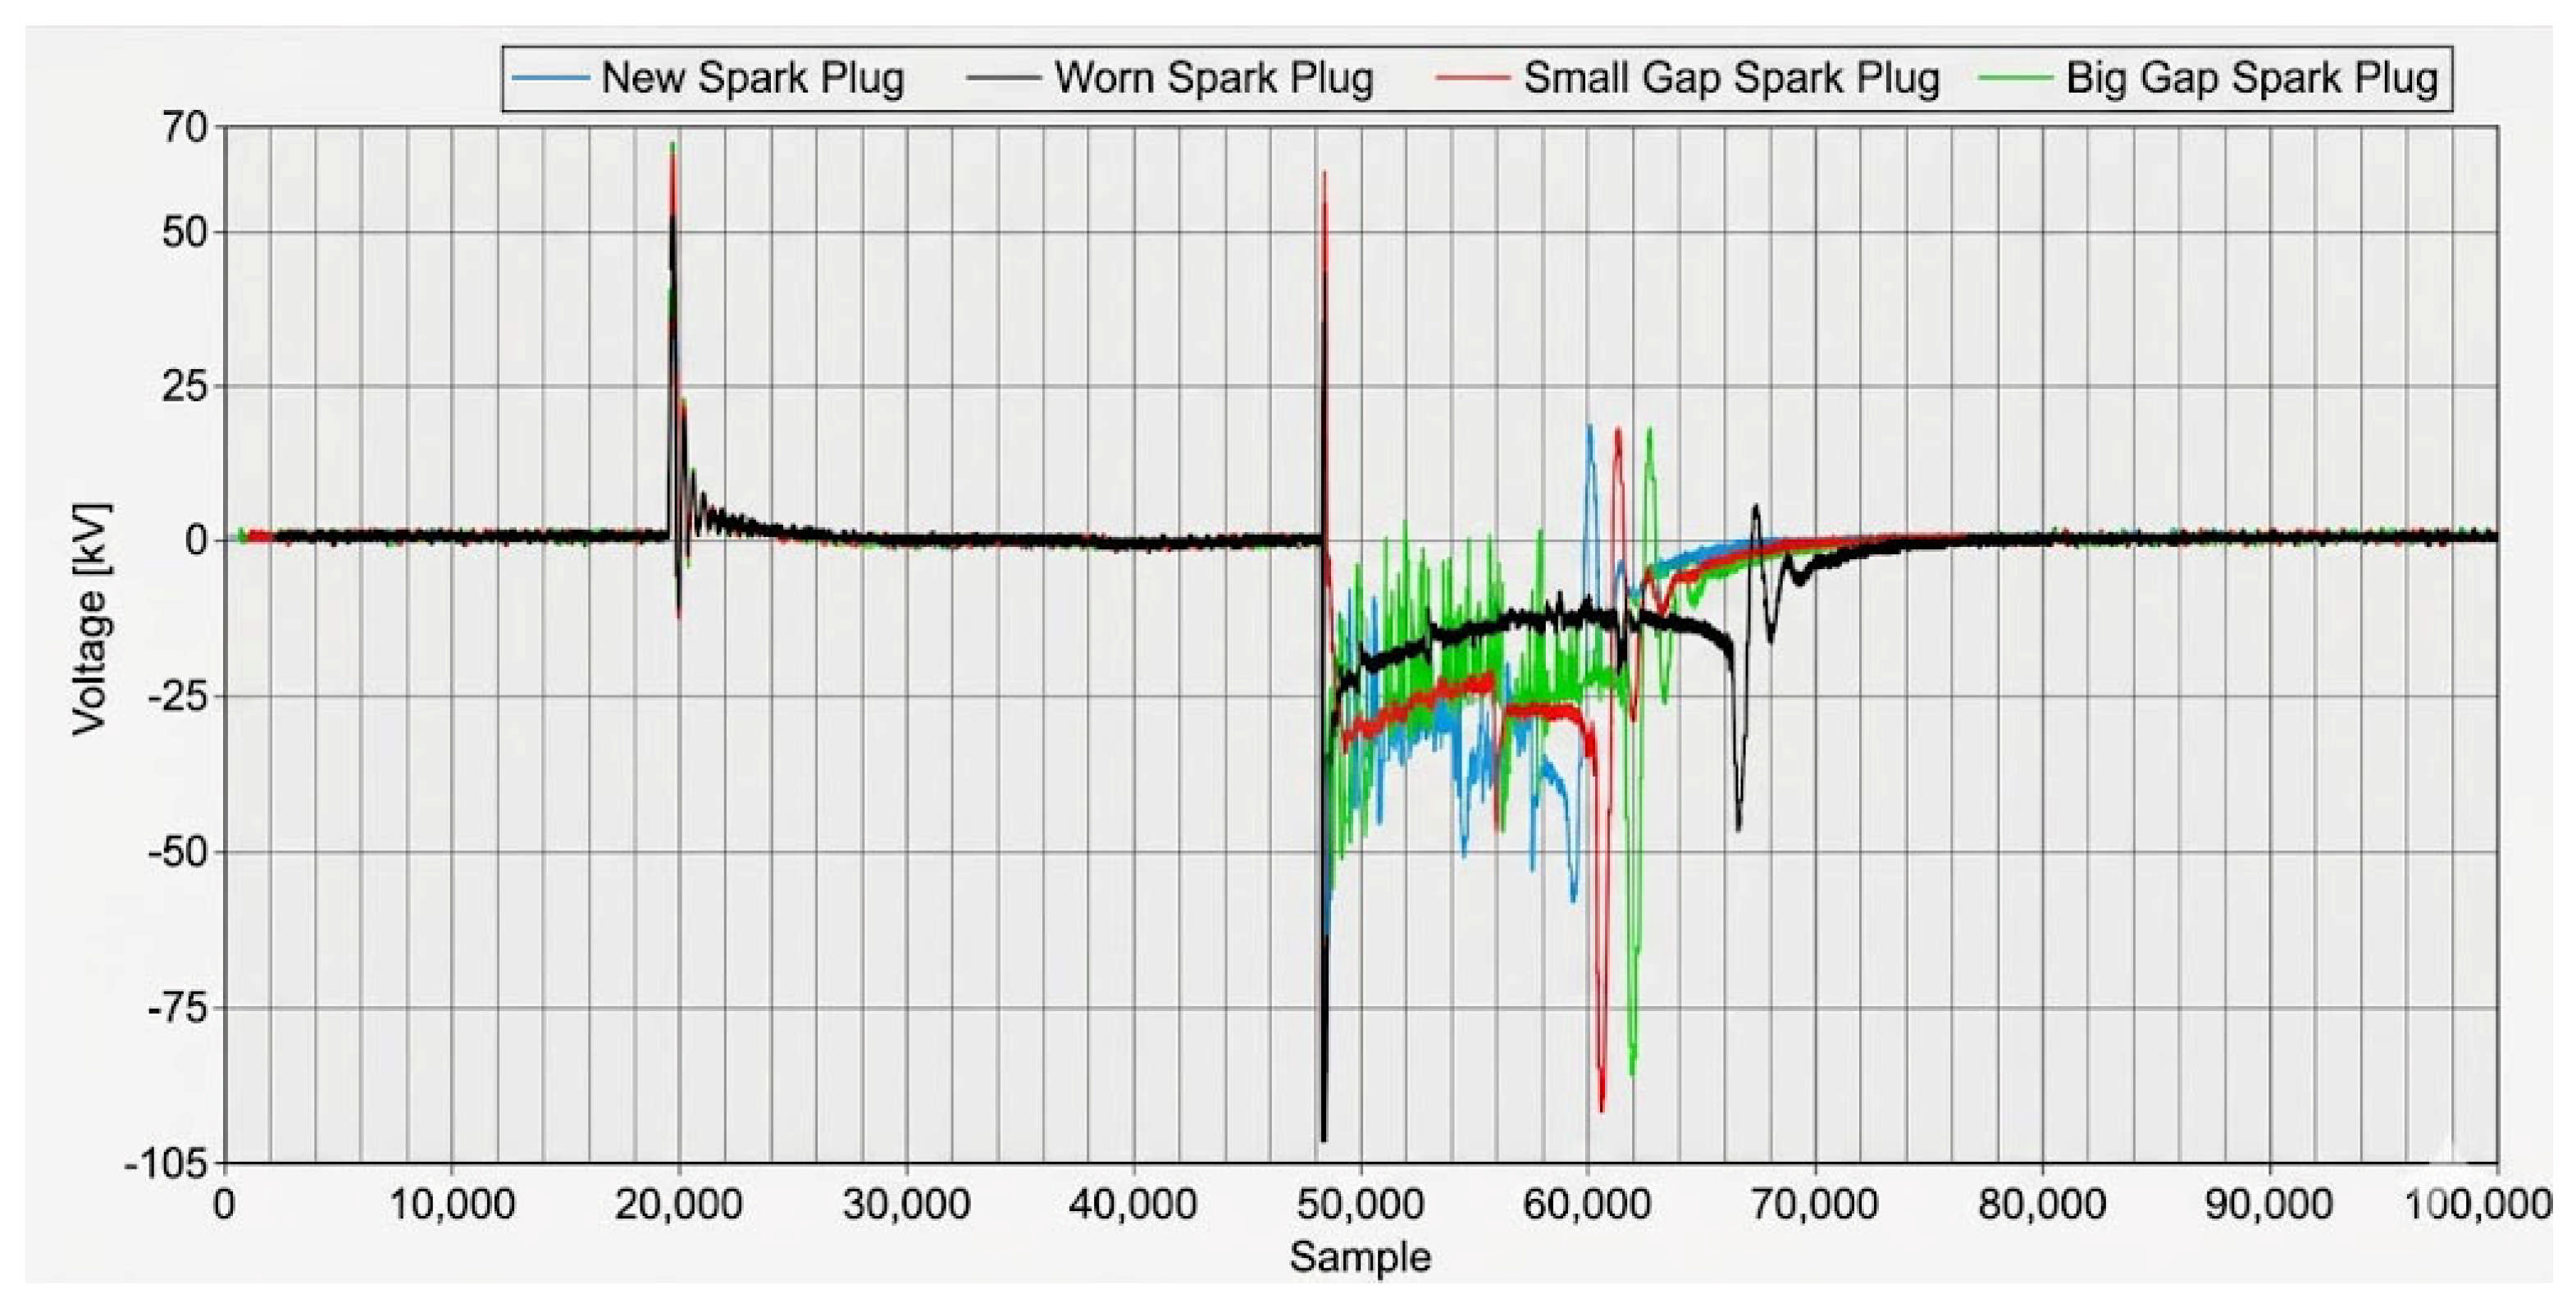
During first phase, voltage is applied to the primary side of the ignition coil. In this phase, the primary current rises; thus, energy is stored within the magnetic circuit of the ignition coil. Once the energy reaches the required level, the primary voltage is cut off, which is then followed by the next phase. During the next phase, the stored energy is transferred to the spark plug, which causes spark discharge. This is followed by the last phase, where the fuel–air mixture is ignited by the spark discharge. The overall comparisons of all the measured quantities under the experimental conditions is presented in Figure 5, Figure 6, Figure 7 and Figure 8. The spark plug condition associated with each measurement is indicated at the beginning of each row.
A preliminary inspection reveals that the primary-side quantities exhibit only minor variations across the tested conditions. This limited differentiation can be attributed to the fact that the primary circuit operates under relatively stable electrical parameters, governed by the ignition system’s control logic and the coil’s inductive characteristics. These factors constrain the dynamic range of primary current and voltage, resulting in waveforms that are largely invariant with respect to changes in the spark plug condition. Consequently, these signals lack the discriminative features necessary for robust automatic classification.
In contrast, the secondary-side quantities are directly influenced by the breakdown and discharge processes occurring at the spark gap. Variations in spark plug wear, electrode geometry, and gap resistance significantly affect the voltage and current profiles in the secondary circuit. These differences manifest as measurable changes in waveform amplitude, duration, and transient behavior, providing a richer feature space for condition assessment. For this reason, the subsequent analysis focuses exclusively on secondary-side quantities, where the physical phenomena offer higher sensitivity to the examined conditions.
For the purposes of this study, four spark plug conditions are considered:
(a)
New, without mechanical damage;
(b)
Worn, without mechanical damage;
(c)
Mechanically damaged with increased electrode gap;
(d)
Mechanically damaged with reduced electrode gap.
For the purposes of waveform identification process automation, a dedicated algorithm was developed and implemented within the LabVIEW environment. The algorithm integrates two key components:
  • Stationarity-based segmentation of acquired signals during ignition;
  • Classification using the k-nearest neighbors (kNN) approach.
The stationarity detection step isolates segments of the signal exhibiting stable statistical properties, which is essential for reducing noise and improving feature consistency. This ensures that subsequent analysis focuses on regions that accurately represent the underlying physical process.
For the classification stage, the kNN algorithm requires the construction of a feature vector composed of descriptors that capture the essential characteristics of the waveform. The essential features were obtained in the time domain of the acquired signals, and feature vectors of 10 elements were constructed.
Collectively, these features provide a robust multidimensional representation of the signal, enabling accurate pattern recognition and reliable classification across varying operating conditions. Selected features must be sufficiently different for each classification class and similar within each class. After a series of pilot experiments, we selected these features:
Secondary Voltage
  • A—Number of samples from the start of the first non-stationary segment to the end of the second non-stationary segment.
  • B—Number of samples between the end of the first non-stationary segment and the start of the second non-stationary segment.
  • C—Variance within the first non-stationary segment.
  • D—Variance within the second non-stationary segment.
  • E—Cross-correlation of the first non-stationary segment with a zero-valued reference signal.
  • F—Cross-correlation of the second non-stationary segment with a zero-valued reference signal.
Secondary Current
  • G—Variance within the non-stationary segment.
  • H—Cross-correlation of the non-stationary segment with a zero-valued reference signal.
  • I—Maximum value within the non-stationary segment.
  • J—Minimum value within the non-stationary segment.
An example of feature vector can be found in Table 1.
Measurements were performed on vehicles equipped with internal combustion engines, specifically a Volkswagen Touareg 4.2 V8 and a Volkswagen Passat 1.8T I4. The proposed methodology is applicable to any vehicle or device utilizing a gasoline internal combustion engine with a coil-on-plug ignition system, a technology that has become increasingly prevalent due to its high efficiency.

3. Experimental Results and Verification

One of the principal outcomes of this study is the capability to diagnose engine operating conditions based on measurable ignition parameters, specifically the secondary voltage (spark-over voltage at the spark plug) and the corresponding secondary current.
In our classification process, we used four classification classes corresponding to the conditions and properties of spark plugs: 1—normal (new); 2—used (worn); 3—with bigger gap; 4—with smaller gap. Within the training process, we used 200 representative 10-element feature vectors for each class. For classification accuracy assessment, we used 200 other signals for each degradation. For the classification process, we analyzed the influence of setting the k parameter (i.e., the number of nearest neighbors) on the total accuracy of the classification process. The results can be found in Table 2.
Table 2 shows the results of the kNN classification process with different response codes, which can be understood as four numbers, where the first number describes how many signals fall into the new spark plug category, the second number describes how many signals fall into the old spark plug category, the third number describes how many signals fall into the spark plug category with a smaller electrode gap, and the fourth number describes how many signals fall into the spark plug category with an increased electrode gap. The best results were achieved when k was equal to 15. This led to improved accuracy for the new spark plug class, with a 56.5% success rate, and the used spark plug class achieved a 80,5% success rate, the small gap spark plug achieved a 84% success rate, and the big gap spark plug class achieved a 50% success rate (Table 3). These results may not appear very accurate; however, note that in the worst case, the result would be 25%. Such a case would lead to a total classification failure because the signals could be transmitted via same part in all classes.
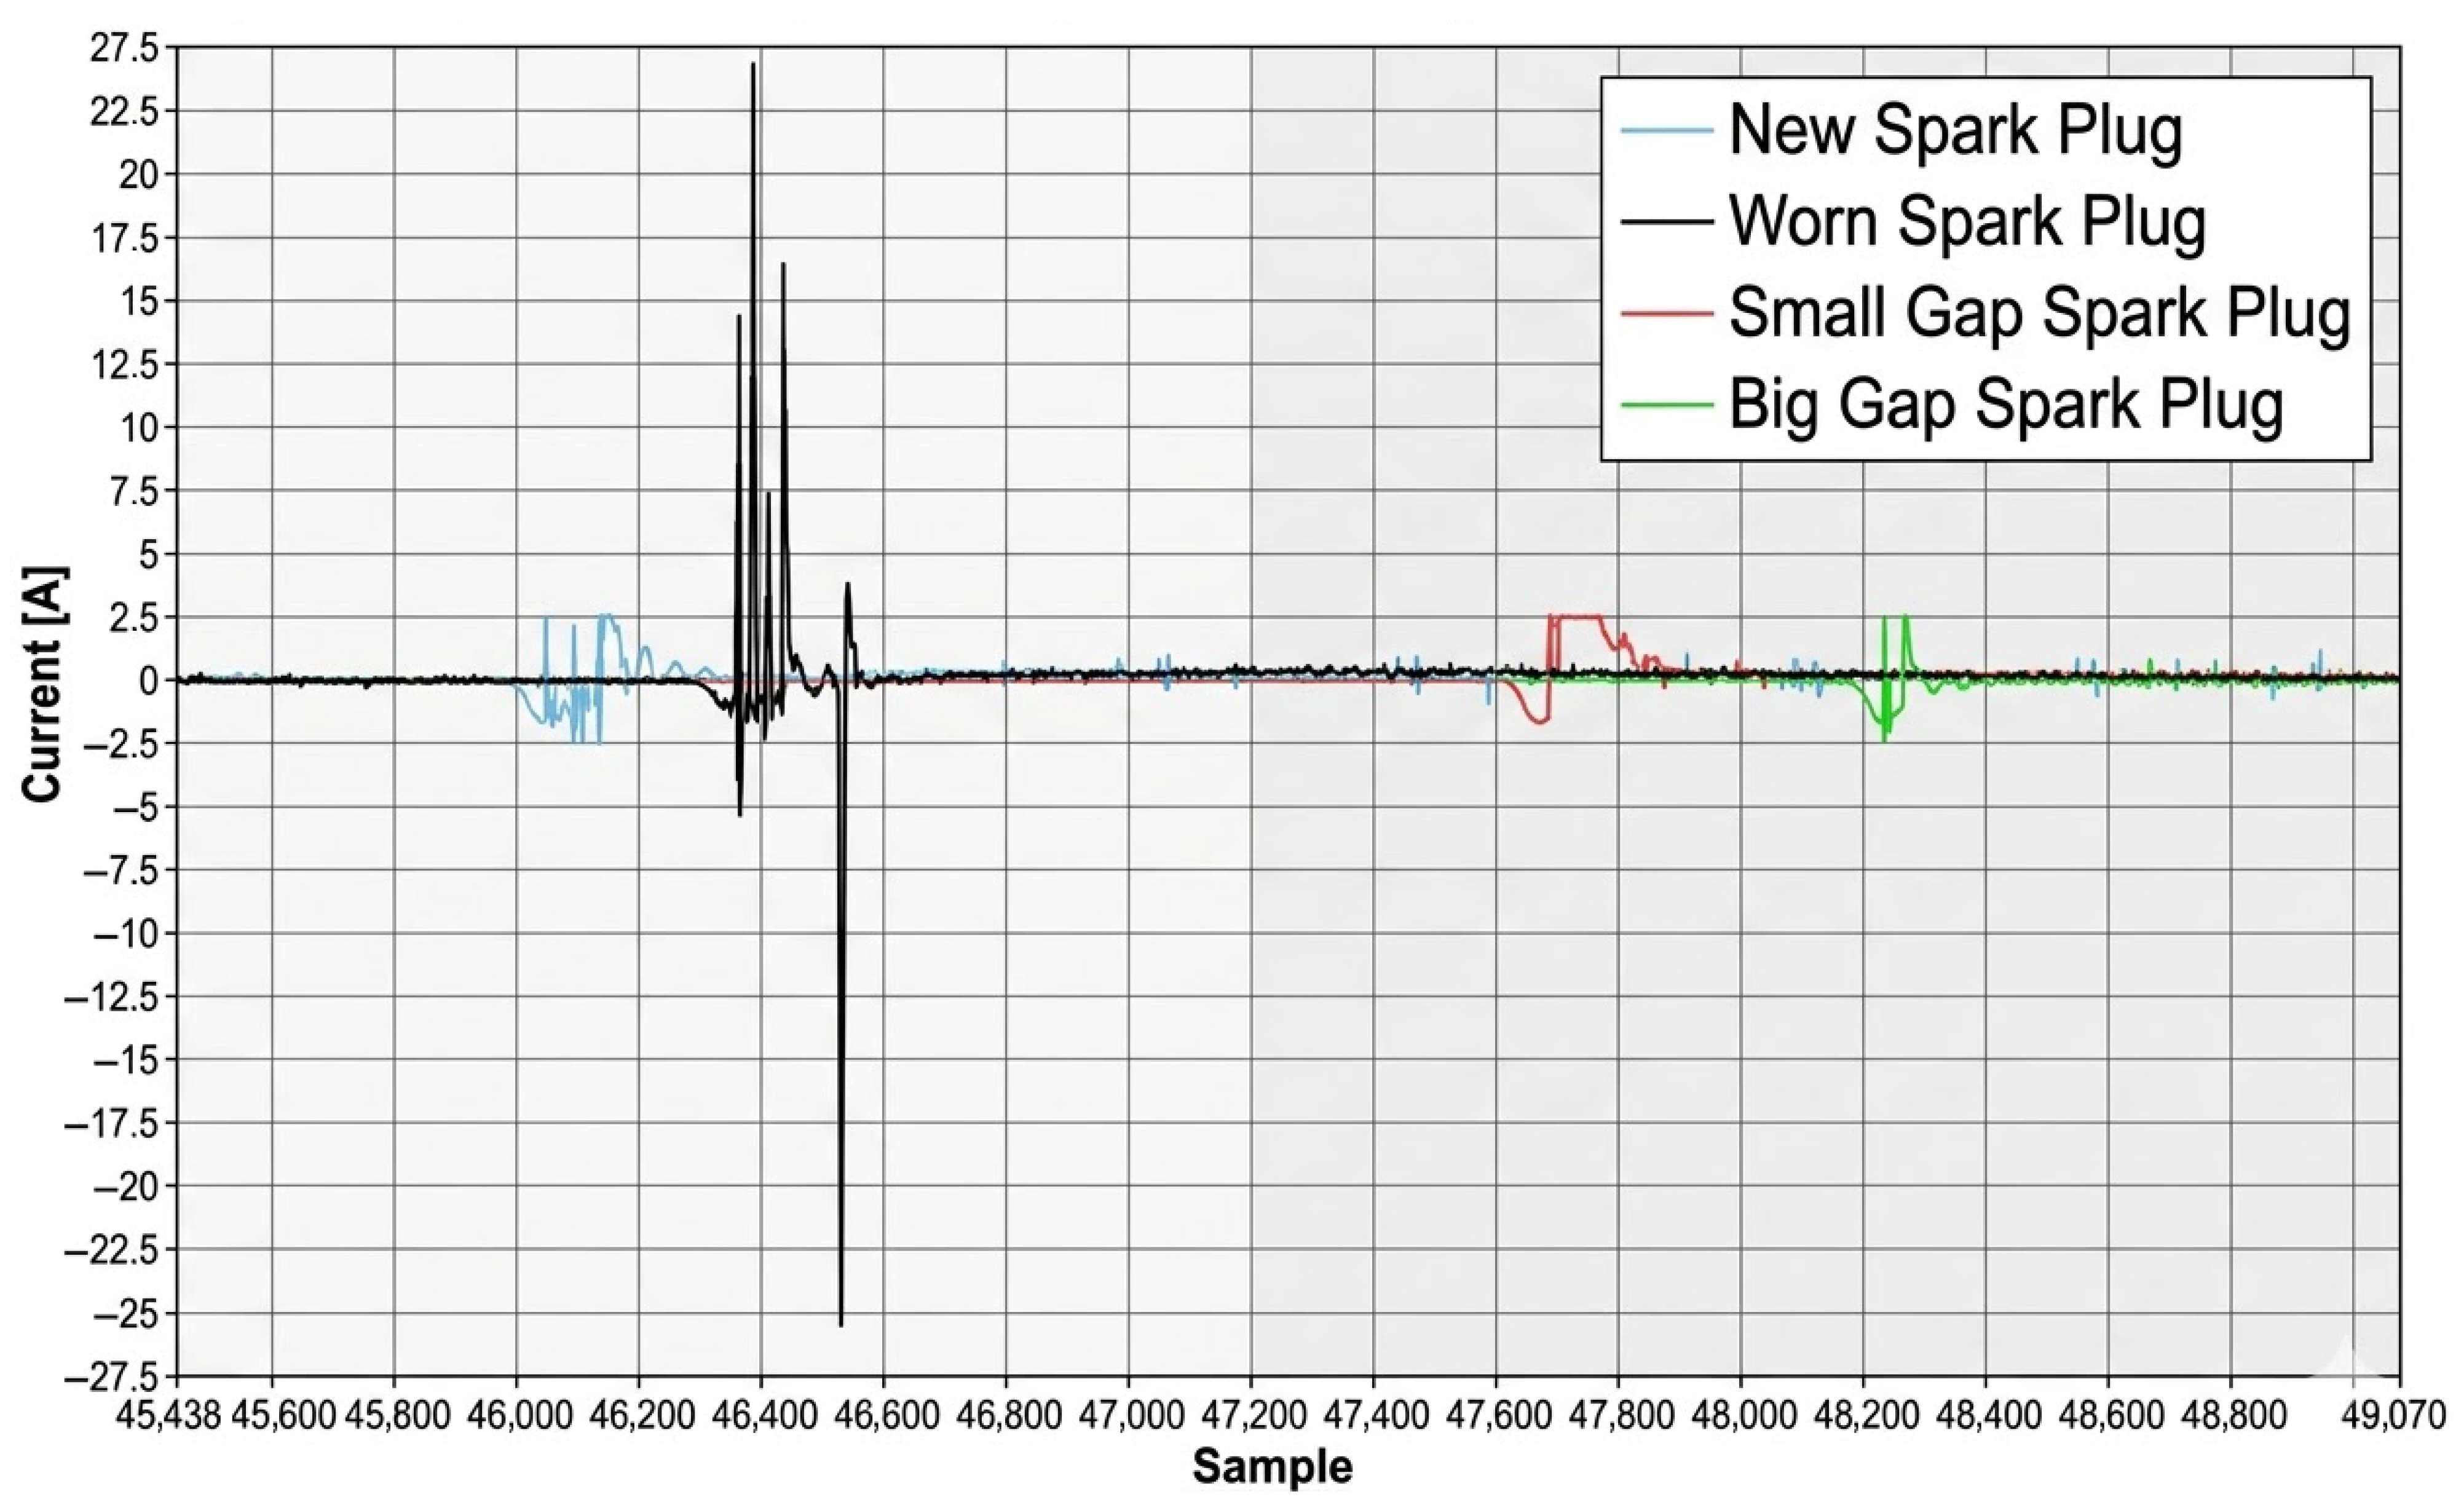
Figure 9 illustrates the respective secondary voltage waveforms, while Figure 10 illustrates the respective secondary current waveforms for different spark conditions. For clarity, the traces are color-coded: the red trace represents the reference signal obtained with a new spark plug, while deviations indicate specific fault conditions; green corresponds to electrode wear; black corresponds to mechanical damage characterized by an increased electrode gap; and blue corresponds to mechanical damage characterized by a reduced gap. Each of these non-standard states is classified by the diagnostic algorithm as non-compliant, a condition that directly contributes to elevated exhaust emissions.
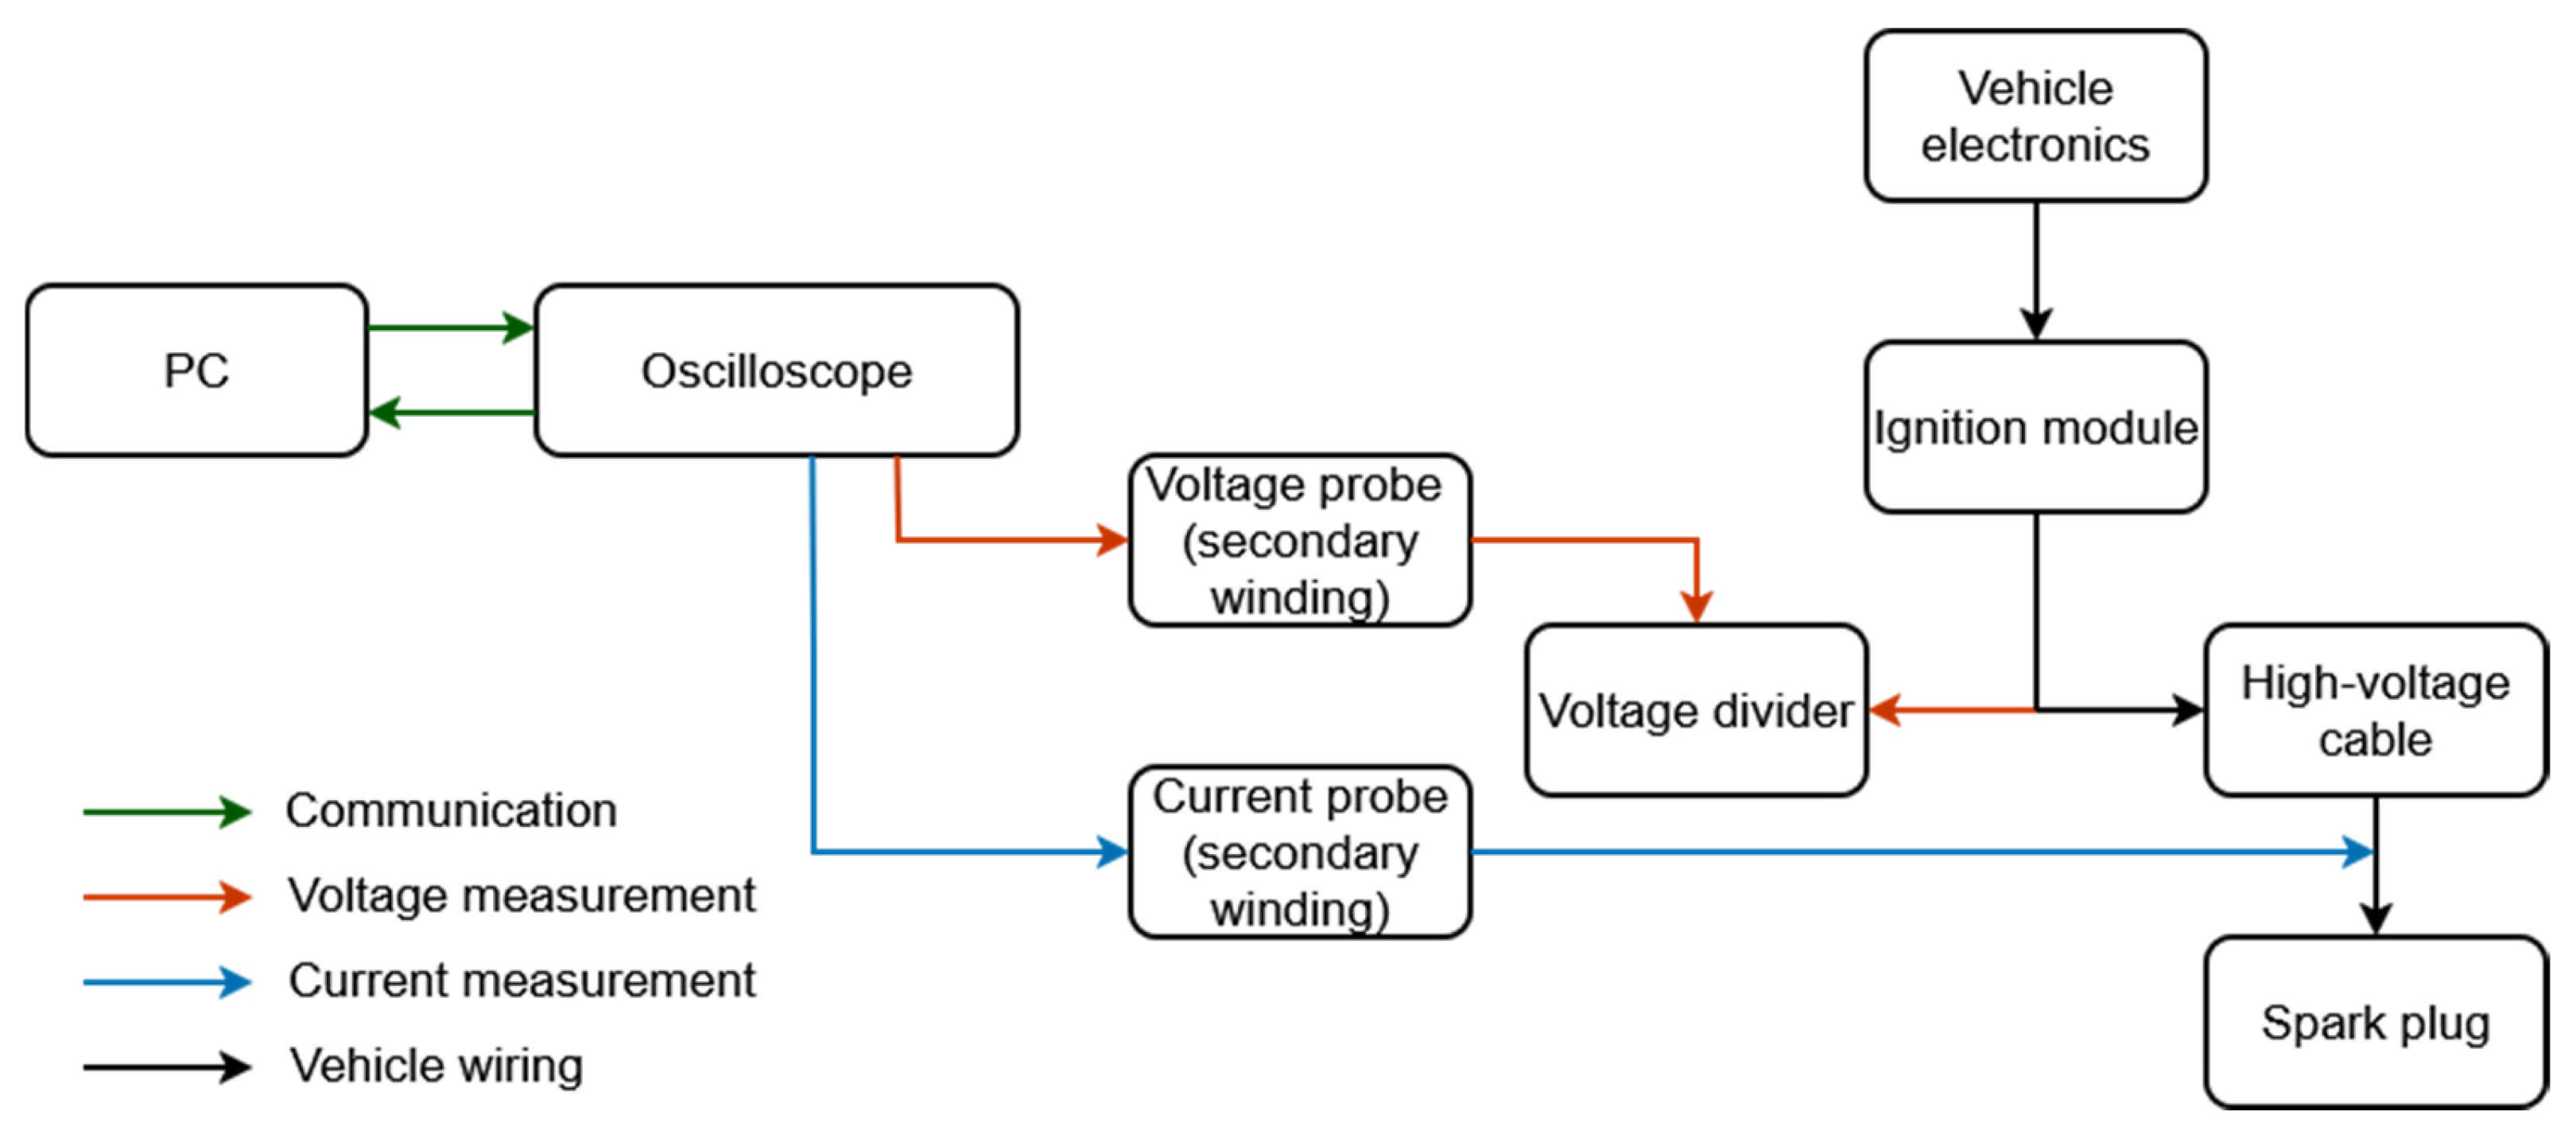
To streamline and optimize the diagnostic methodology, parameters identified as non-informative were systematically excluded from the measurement process. This refinement significantly reduces instrumentation requirements, enabling the procedure to be implemented using only a two-channel oscilloscope (Figure 11). Consequently, the approach becomes more practical and accessible for a wider range of service workshops without compromising diagnostic reliability (Figure 12).
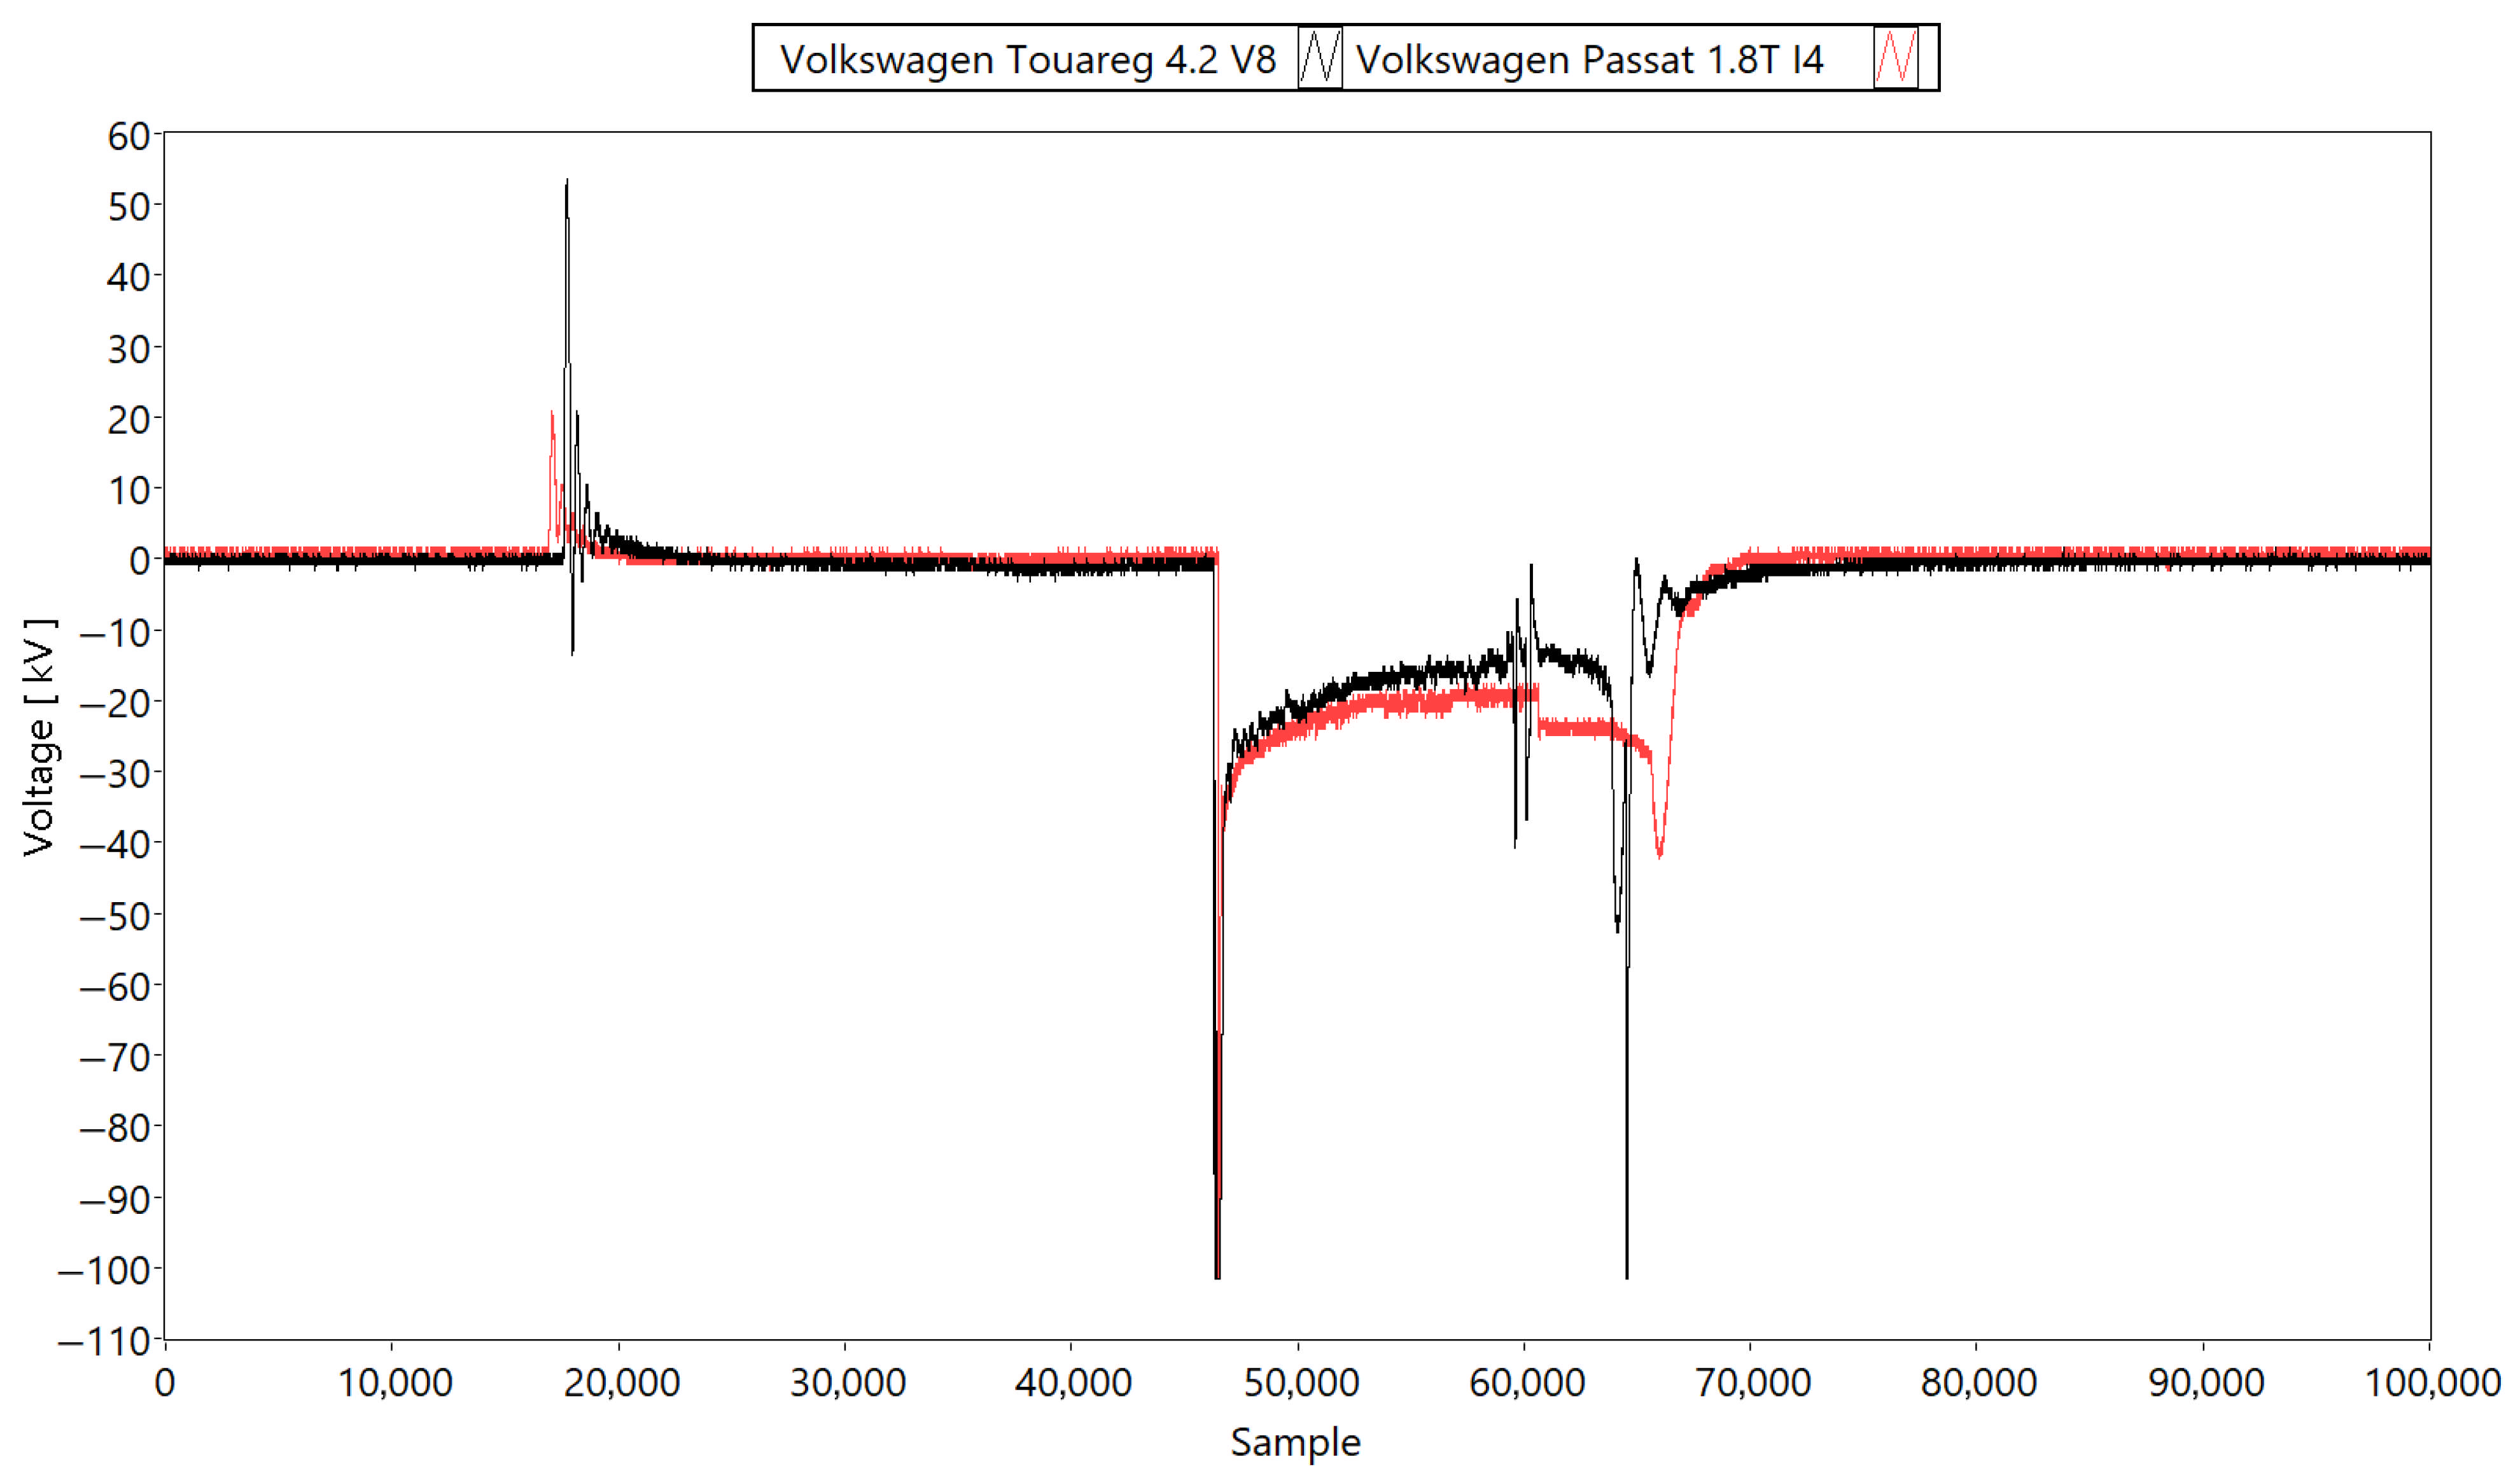
The use of the custom-built adapter remains optional; however, it is included in the block diagram for convenience as it facilitates cable extension and improves accessibility to the ignition module. A critical finding of this study is that reliable measurements for any engine require the development of a dedicated dataset for each engine type, encompassing all considered spark plug conditions. This step is essential for the accurate determination of the current operating state as significant variations in voltage waveforms can occur even when identical ignition modules are employed, as demonstrated in Figure 12.

4. Conclusions

The principal outcome of this research is the validation of a reliable, non-invasive diagnostic methodology for identifying specific spark plug fault conditions, including electrode wear and mechanical damage resulting in altered electrode gaps, analyzing only the secondary ignition voltage and current waveforms. Crucially, this study demonstrated that each non-compliant state, classified by the diagnostic algorithm, directly correlates with conditions that elevate exhaust emissions. A relatively simple kNN classification algorithm demonstrates sufficient classification accuracy, making the usage of advanced AI algorithms (neural networks) unnecessary. The kNN algorithm can easily be implemented into ECUs to extend the diagnostic possibilities inside a vehicle. Furthermore, the diagnostic procedure was significantly streamlined by systematically excluding non-informative parameters, thereby reducing the instrumentation requirements to only a two-channel oscilloscope. This refinement enhances the method’s practicality and accessibility for general service workshops. While the proposed methodology is robust, a critical finding is the necessity of developing dedicated reference datasets for each engine type to account for inherent variations in voltage waveforms, even when identical ignition modules are used, which is essential for ensuring the accuracy and widespread applicability of the diagnostic procedure.

Author Contributions

Conceptualization, M.F.; Methodology, M.D.; Software, M.D.; Validation, D.K. and M.F.; Formal analysis, M.N.; Resources, M.N.; Data curation, M.N. and M.F.; Writing—original draft, M.N. and M.F.; Writing—review & editing, M.D., D.K. and M.F.; Visualization, D.K.; Supervision, M.D.; Funding acquisition, M.F. All authors have read and agreed to the published version of the manuscript.

Funding

The authors would like to thank the National grant agency Vega for project funding (VEGA 1/0563/23).

Data Availability Statement

The original contributions presented in this study are included in the article. Further inquiries can be directed to the corresponding author.

Acknowledgments

This project was supported by the VEGA 1/0563/23 grant: Research and development of visual inspection algorithms for manufacturing process-quality-increasing power semiconductor modules.

Conflicts of Interest

The authors declare no conflicts of interest.

References

  1. NGK Spark Plugs. How to Read a Spark Plug. NGK Technical Resources. Available online: https://ngksparkplugs.com/en/resources/read-spark-plug (accessed on 1 October 2025).
  2. Kucera, J.; Novak, M.; Horak, P. Analysis of the Automotive Ignition System for Various Conditions. J. Automot. Eng. 2021, 45, 210–218. [Google Scholar] [CrossRef]
  3. Liu, T.; Nie, J.; Chen, X.; Mao, L. Research on Fault Diagnosis Method of Automobile Engine Based on GA-BP Algorithm. In Proceedings of the 2024 IEEE 7th International Electrical and Energy Conference (CIEEC), Harbin, China, 10–12 May 2024; pp. 2290–2297. [Google Scholar] [CrossRef]
  4. Petrovsky, S.V.; Kozlovsky, V.N.; Kritsky, A.V.; Grishchenko, A.G.; Sidorov, B.N. On-Board Intelligent Information System for Diagnosing Faults in The Ignition System of a Passenger Car. In Proceedings of the 2021 Intelligent Technologies and Electronic Devices in Vehicle and Road Transport Complex (TIRVED), Moscow, Russia, 11–12 November 2021; pp. 1–5. [Google Scholar] [CrossRef]
  5. Luft, S.; Skrzek, T. Effect of the exhaust gas recirculation ratio and the energy share of the gaseous fuel on basic operating parameters and exhaust emissions in a dual-fuel compression ignition engine operating on natural gas. In Proceedings of the 2018 XI International Science-Technical Conference Automotive Safety, Casta, Slovakia, 18–20 April 2018; pp. 1–6. [Google Scholar] [CrossRef]
  6. Shi, Q.; Hu, Y.; Yan, G. A Novel Fault Diagnosis Algorithm for the Fuel Injection System of Marine Two-Stroke Diesel Engine. In Proceedings of the 2022 7th International Conference on Power and Renewable Energy (ICPRE), Shanghai, China, 23–26 September 2022; pp. 407–412. [Google Scholar] [CrossRef]
  7. Biryuk, V.V.; Zakharov, M.O.; Gorshkalev, A.A.; Larin, V.L. Development of a Methodology for Calculating the Working Process of a Small-Size Two-Stroke Internal Combustion Engine. In Proceedings of the 2021 International Scientific and Technical Engine Conference (EC), Samara, Russia, 23–25 June 2021; pp. 1–7. [Google Scholar] [CrossRef]
  8. Matti Maricq, M. Engine, aftertreatment, fuel quality and non-tailpipe achievements to lower gasoline vehicle PM emissions: Literature review and future prospects. Sci. Total Environ. 2023, 866, 161225. [Google Scholar] [CrossRef] [PubMed]
  9. Subbotin, M.V.; Park, S.; Kojic, A.; Ahmed, J.; Chaturvedi, N.; Cook, D. Smooth switching between 2-stroke and 4-stroke modes of HCCI operation. In Proceedings of the 2009 American Control Conference, St. Louis, MO, USA, 10–12 June 2009; pp. 2051–2056. [Google Scholar] [CrossRef]
  10. Trimech, A.; Bouzir, A.; Benammou, S. Road Transport and Environmental Sustainability: A Bibliometric Analysis. In Proceedings of the 2025 16th International Conference on Logistics and Supply Chain Management (LOGISTIQUA), Casablanca, Morocco, 28–30 May 2025; pp. 1–8. [Google Scholar] [CrossRef]
  11. Mathisen, S.; Löffler, K.; Barani, M.; Belsnes, M.M. Energy and Climate Plans in Energy System Modelling Scenarios. In Proceedings of the 2025 21st International Conference on the European Energy Market (EEM), Lisbon, Portugal, 10–12 June 2025; pp. 1–6. [Google Scholar] [CrossRef]
  12. Ajayi, S.A.; Adams, C.A.; Dumedah, G.; Nnene, O.A.; Ibili, F. On-road vehicular traffic emissions inventory and air quality on major roadways in Lagos City. Afr. Transp. Stud. 2025, 3, 100034. [Google Scholar] [CrossRef]
  13. Winkler, S.L.; Anderson, J.E.; Garza, L.; Ruona, W.C.; Vogt, R.; Wallington, J. Vehicle criteria pollutant (PM, NOx, CO, HCs) emissions: How low should we go? npj Clim. Atmos. Sci. 2018, 1, 26. [Google Scholar] [CrossRef]
  14. Poliak, M.; Loman, M.; Stovička, R. Emission Inspections of Vehicles in Operation—Case Study for Slovakia. Vehicles 2025, 7, 51. [Google Scholar] [CrossRef]
  15. Warguła, Ł.; Kadirov, A.; Aimukhanov, D.; Ulbrich, D.; Kaczmarzyk, P.; Bąk, D.; Wieczorek, B. Ecological Paradox in the Reuse of Internal Combustion Engines from Scrapped Vehicles for Electric Power Generation—Circular Economy Potential Versus Emission Certification Barriers. Sustainability 2025, 17, 10435. [Google Scholar] [CrossRef]
  16. Solaani, Z.; Aloui, F.; Gheith, R. Study of an Internal Combustion Engine Fueled Partially with Green Hydrogen via the Recovery of its Exhaust Gases. In Proceedings of the 2023 14th International Renewable Energy Congress (IREC), Sousse, Tunisia, 16–18 December 2023; pp. 1–6. [Google Scholar] [CrossRef]
  17. Ogunjide, S.B.; Zhong, W.; Pachiannan, T.; Zhu, Y.; He, Z.; Wang, Q. A review of combustion, performance and emissions characteristics of diesel engines fueled with n-pentanol blends for agricultural use. Results Eng. 2025, 27, 106768. [Google Scholar] [CrossRef]
  18. Han, Z.; Liu, X.; Jiang, S. Fault Diagnosis of Electronic Ignition System of Automobile Engine Based on Wavelet Transform. In Advances in Mechanical and Electronic Engineering; Jin, D., Lin, S., Eds.; Lecture Notes in Electrical Engineering; Springer: Berlin/Heidelberg, Germany, 2012; Volume 176. [Google Scholar] [CrossRef]
  19. Obayd, M.; Zemmouri, A.; Barodi, A.; Benbrahim, M. Advanced Diagnostic Techniques for Automotive Systems: Innovations and AI-Driven Approaches. In Proceedings of the 2nd International Conference on Aeronautical Sciences, Engineering and Technology; El Mokhi, C., Hachimi, H., Hmina, N., Addaim, A., Eds.; Lecture Notes in Networks and Systems; Springer: Cham, Switzerland, 2025; Volume 1555. [Google Scholar] [CrossRef]
  20. Papadopoulos, P.M.; Lymperopoulos, G.; Polycarpou, M.M.; Ioannou, P. Distributed Diagnosis of Sensor and Actuator Faults in Air Handling Units in Multi-Zone Buildings: A Model-Based Approach. Energy Build. 2022, 256, 111709. [Google Scholar] [CrossRef]
  21. Kučera, M.; Gutten, M.; Korenčiak, D.; Kúdelčík, J. Using the Spark Plug as a Sensor for Analyzing the State of the Combustion System. Sensors 2025, 25, 4198. [Google Scholar] [CrossRef] [PubMed]
  22. Więcławski, K.; Mączak, J.; Szczurowski, K. Electric Current Waveform of the Injector as a Source of Diagnostic Information. Sensors 2020, 20, 4151. [Google Scholar] [CrossRef] [PubMed]
  23. Arias, A.S.; Albites, F.A.; Limaylla, J.F.; Sotelo, A.C. Design and Construction of a Dynamic Equipment for Diagnosis of Electronic Ignition Devices of Internal Combustion Engines. In Proceedings of the 2024 10th International Conference on Automation, Robotics and Applications (ICARA), Athens, Greece, 22–24 February 2024; pp. 206–209. [Google Scholar] [CrossRef]
  24. Fowler, D.S.; Bryans, J.; Cheah, M.; Wooderson, P.; Shaikh, S.A. A Method for Constructing Automotive Cybersecurity Tests, a CAN Fuzz Testing Example. In Proceedings of the 2019 IEEE 19th International Conference on Software Quality, Reliability and Security Companion (QRS-C), Sofia, Bulgaria, 22–26 July 2019; pp. 1–8. [Google Scholar] [CrossRef]
  25. Hu, J.; Huang, T.; Zhou, J.; Zeng, J. Electronic Systems Diagnosis Fault in Gasoline Engines Based on Multi-Information Fusion. Sensors 2018, 18, 2917. [Google Scholar] [CrossRef] [PubMed]
  26. Kubis, M.; Beno, P.; Sebok, M.; Korenciak, D.; Gutten, M. Diagnosis of the ignition system for various conditions. In Proceedings of the 2020 ELEKTRO, Taormina, Italy, 25–28 May 2020. [Google Scholar] [CrossRef]
  27. Martinez-Boggio, S.; Lacava, P.T.; de Carvalho, F.S.; Curto-Risso, P. Combustion Diagnosis in a Spark-Ignition Engine Fueled with Syngas at Different CO/H2 and Diluent Ratios. Gases 2024, 4, 97–116. [Google Scholar] [CrossRef]
Figure 1. Reference waveform for the ignition phenomena.
Vehicles 08 00071 g001
Figure 2. Block diagram of the original measurement set-up.
Vehicles 08 00071 g002
Figure 3. (a) High-voltage resistor divider for measurement adoption. (b) Custom adapter for original cable work and measuring module.
Vehicles 08 00071 g003
Figure 4. Example of the ignition time waveforms (primary voltage—black trace; secondary voltage—red trace; primary current—green trace; secondary current—blue trace).
Vehicles 08 00071 g004
Figure 5. Comparison of waveforms of the selected variables (primary voltage) for various spark plug conditions.
Vehicles 08 00071 g005
Figure 6. Comparison of waveforms of the selected variables (primary current) for various spark plug conditions.
Vehicles 08 00071 g006
Figure 7. Comparison of waveforms of the selected variables (secondary voltage) for various spark plug conditions.
Vehicles 08 00071 g007
Figure 8. Comparison of waveforms of the selected variables (secondary current) for various spark plug conditions.
Vehicles 08 00071 g008
Figure 9. Secondary voltage waveforms for different spark plug conditions.
Vehicles 08 00071 g009
Figure 10. Secondary current waveforms for different spark plug conditions.
Vehicles 08 00071 g010
Figure 11. Block diagram of the modified measurement set-up.
Vehicles 08 00071 g011
Figure 12. Comparison of secondary voltage on different cars.
Vehicles 08 00071 g012
Table 1. Example of feature vector.
ABCDEFGHIJ
14,40013,100686,284238,404−0.7680.7780.405−0.0225557−10.042
Table 2. Results of the classification process.
kNNNewUsedSmall GapBig Gap
3116-57-25-219-159-0-2220-6-174-015-83-0-103
598-62-38-219-160-0-2320-5-175-011-85-2-102
798-62-36-418-159-0-2324-3-173-011-88-2-99
994-66-34-618-160-0-2219-3-175-311-87-2-100
1196-71-22-1118-158-0-2416-4-175-59-87-2-102
13109-70-3-1818-161-0-2118-6-170-611-88-2-99
15113-69-0-1817-161-0-2221-5-168-610-88-2-100
17109-72-1-1815-165-0-2020-6-168-67-94-2-97
19105-76-1-1815-165-0-2016-9-168-77-92-2-99
21106-75-1-1814-168-0-1815-11-168-66-94-2-98
23101-80-1-1813-170-0-1717-9-168-66-93-2-99
Table 3. Accuracy of classification.
NewUsedSmall GapBig Gap
Accuracy56.50%80.50%84.00%50.00%
Max113/200161/200168/200100/200
Disclaimer/Publisher’s Note: The statements, opinions and data contained in all publications are solely those of the individual author(s) and contributor(s) and not of MDPI and/or the editor(s). MDPI and/or the editor(s) disclaim responsibility for any injury to people or property resulting from any ideas, methods, instructions or products referred to in the content.