Abstract
Passenger safety remains a primary goal in vehicle engineering, requiring the development of advanced passive safety systems to reduce injuries during collisions. Impact attenuators (particularly for race cars) are a crucial component for the safety of the driver. The impact of the impact attenuator (IA) is demonstrated by the behavior of a seat-belted dummy in a frontal collision with a rigid wall. The aim of this paper is to confirm the qualities of water as a damping agent in the manufacturing of the IA. To reach a conclusion, a theoretical model is used and experimental tests are performed. Once the loads operating on the dummy have been identified, it is confirmed that they fall within the range that the existing requirements recommend. The car is viewed as a structure with a seat-belt-fastened dummy and an impact attenuator. Research is being conducted on a new water-based impact attenuator technology. A frontal collision of the car–dummy assembly was taken into consideration when analyzing the dummy’s behavior in accordance with the criteria. A simulation program was used to calculate the accelerations at various points on the mannequin’s body as well as the force that manifested on the seat belts. So, the good qualities of IAs using water are revealed and support designers in their efforts to obtain better shock behavior. In the simulation, the variation of internal energy accumulated by the vehicle, displacements and velocities of various points on the chassis, as well as the accelerations of the vehicle and the occupant were determined. In the experiment, the vehicle velocities for both test cases were established and used in the simulation, and the accelerations of the vehicle and dummy were measured. The assessment was carried out by comparing experimental and simulation data, focusing on acceleration values recorded on both the dummy and the vehicle. Evaluation criteria such as HIC and ThAC were applied to determine the severity of the impact and the effectiveness of the proposed water-based attenuator.
1. Introduction
One of the main goals of vehicle engineering is passenger safety. Furthermore, considering the advancements made in the automotive sector, the significance of this element necessitates the use of extra knowledge in production, which may be acquired through research focused on passenger safety and the creation of different safety systems. The most basic are undoubtedly the passive safety systems, which are crucial in minimizing harm or injury to both pedestrians and car occupants in the event of an accident.
Airbags of all types, electronic stability control (ESC), traction control, anti-lock braking systems (ABSs), seat belts, and collision protection systems are examples of passive safety systems. The safety belt was the first straightforward and reasonably priced safety component that saw a remarkable advancement in the sector. The performance of many studies and research projects aimed at enhancing the positive variations and functionality of these passive safety components was obviously influenced by the introduction of safety belts [1,2,3].
The belt’s function has been shown to be extremely significant, particularly for individuals who are overweight. To ascertain the function of the safety belt, assessments were conducted from a biomechanical perspective [4]. An 80 kg dummy was used in the experimental assessments. It has been discovered that a force over 1000 N causes the belt to bend or fold, reducing its function.
The impact attenuator (IA) is the element that will be examined in this paper. The IA can be integrated into the bumper or placed independently. It serves as shock absorption and mitigation and is a crucial component of contemporary cars in the form of a front bumper.
A comparable goal is sought in [5]. Due to the high cost of attenuator materials, the paper investigated substitute materials such as old food and drink cans. A nonlinear finite element approach was employed in the study to calculate the number of impacts on the attenuator structures. The primary factors that were taken into consideration were the impact velocity and the thickness of the recipients. According to the analysis’s findings, the average attenuator energy for a 1 mm thick can was 16,000 J, which was more than the recommended amount of 7350 J (in accordance with the Society of Students Automotive Engineers’ FSAE regulations) with an acceleration of no more than 20 g on average and 40 g maximum. Static compression was used in [6] to manufacture and test an impact attenuator. Plastic slices and firm polyurethane foam were used to fill the interior wall of the prototype, which was constructed from a prismatic aluminum alloy. A standard classic used polyurethane impact attenuator absorbs up to 6380 Joules of energy. The absorbed energy for the impact attenuator under study in the paper is 8800 Joules. The suggested method fulfills the requirement that the absorbed energy in this instance be greater than 7350 Joules for the Formula Student competition. Through numerical methods, an attempt is made in [7] to determine a design that has the best kinetic energy absorption capacity among the different models that are currently in use. The impact attenuator material consists of zirconium G350 and aluminum. In order to ascertain the deformation that takes place and the absorbed energies, the simulation was run via collision with a rigid wall. Interesting and low-cost solutions for EA are offered in [8,9,10,11,12]. Experimental verifications in tests conducted according to standards have validated the solutions proposed by the researchers of [13,14,15,16]. The behavior of a roll cage fitted to a SUPRA racing car is examined in [17]. An enhanced design solution is suggested in light of the research conducted to guarantee safety in the case of a front, rear, or side impact. The software used was ANSYS 18.1. Naturally, the materials used to make IAs have a significant impact on how they behave in the event of a shock. For instance, a CFRP composite was investigated in [18] with the goal of applying it to automotive engineering. A monocoque chassis was constructed using this material. This chassis was used on a car that participated in the Formula Student championship. The objective was to fulfill the safety standards established by Formula SAE. The Finite Element Method was used for analytical analysis, and the chassis’s dimensions and shape were optimized. Additional experimental confirmations in impact tests for a Formula Student vehicle are available in [19]. Ensuring a high rate of energy absorption during impact is the aim of an IA. The use of IAs as shock absorbers has medical considerations as well, as discussed in [20,21]. Several new aspects of IA computing and design are discussed in [22,23,24,25]. Various numerical methods have been developed for modeling automobile, driver, and IA systems [26,27,28,29]. IA design and optimization methods are presented in [30,31,32,33,34]. In shock situations, energy considerations are frequently applied. The concept of acceleration energy is relevant to the study of biological phenomena in addition to issues with abrupt changes in acceleration. Methods for calculating this energy are provided in [35,36]. Researchers and the automotive industry continue to be particularly interested in the goal of driver and passenger traffic safety. The results of recent studies in the topic are thus presented in the literature, e.g., [37,38,39]. Research has been conducted on the improvement of cellular solids’ energy absorption capacity in automotive applications as a safety precaution to safeguard passengers and the vehicle’s structure [40,41,42]. Two kinds of experimental testing were conducted in order to understand the honeycomb structure’s energy absorption mechanism. A straightforward compression test of the honeycomb structure alone is part of the first test. A fiberglass and honeycomb composite sandwich is put through a high-speed drop test as part of the second experimental test. The FEM model was used to calibrate the experimental data results. It was found that the outcomes of the experimental and FEM approaches were remarkably similar. Various issues related to the design of IAs are presented in [43,44,45].
Numerous factors that have an impact on the system’s overall behavior are not well understood. The forces loading the system can be quickly determined using a mathematical model that employs the Gibbs–Appell method. These forces are then employed in the FEM model [46,47,48,49,50]. A racing automobile used in Formula Student contests was designed, and its performance was calculated using the results obtained. The research did not address the issues of the biological repercussions of the accelerations that the driver or passenger experienced. Human muscles and soft-bodied animals served as the initial inspiration for the unique development of soft actuators. Because of their agility, adaptability, and versatility, they are used in a wide range of applications, including wearable technology, haptic devices, artificial muscles, and cutting-edge medical devices. However, synthetic models have not yet been able to perform on par with complicated biological systems. In the specialized literature, the opportunities and problems afforded by this soft actuator are extensively discussed [51,52].
The goal of this work is to ascertain the role of an IA and the pressures that a car driver faces during a frontal accident. Two distinct geometric variants were made for IAs using three different materials of different thicknesses. Thus, the effects of 24 IA changes on the dummy are investigated. The Finite Element Method (FEM) was used to model the entire system, including the driver, the automobile with the IA, and the four-point safety belt. The impact of the airbags was not considered because the study focuses on the early part of the accident, when demands are at their highest. Our aim was to find out if the gadget could provide sufficient safety in the case of an impact during a race.
2. Materials and Methods
In the event of an accident, an IA’s job is to absorb energy and transfer impact forces to the body structure. The IA’s job is to reduce these damages if the car is moving slowly, and to transfer the impact’s pressures to the body structure at high speeds without damaging it, hence saving the driver’s life.
In general, people are quite sensitive to different shock requirements from their surroundings. They are susceptible to acceleration, mechanical shocks, and shocks. Particularly strong shocks and accelerations that happen during an accident can have a detrimental effect on the driver’s or passengers’ health and, in certain situations, even result in death. Naturally, as the automotive industry has evolved over the past century, it has refined mechanisms to safeguard the occupants of the car. As a result, “dummy” or anthropomorphic test devices were created. They assisted in the creation of highly efficient safety measures and the modeling of numerous real-world scenarios. The advancement of software and calculating methods has made it possible to create virtual mannequins, from which many insightful findings and conclusions can be drawn.
From a kinematics perspective, dummies can be quite accurate and provide values for kinematic quantities—particularly accelerations—that are extremely close to reality. There are three types of dummies: “front impact dummies”, “side impact dummies”, and “aerospace dummies”. Customized mannequins for men, women, and children have been made for various scenarios and research.
A number of these dummies and their experimental behavior in the event of specific shocks are presented in the specialist literature. The investigations use a typical average-sized adult mannequin that is the average height and weight of an adult male in the United States. Therefore, it is possible to eliminate a significant drawback, which is the lack of a real human body to test systems and carry out studies to examine the effects of different circumstances. In such an experiment, the individual would undoubtedly suffer severe injuries or potentially die. Using corpses would be one approach, but the outcomes were unsatisfactory.
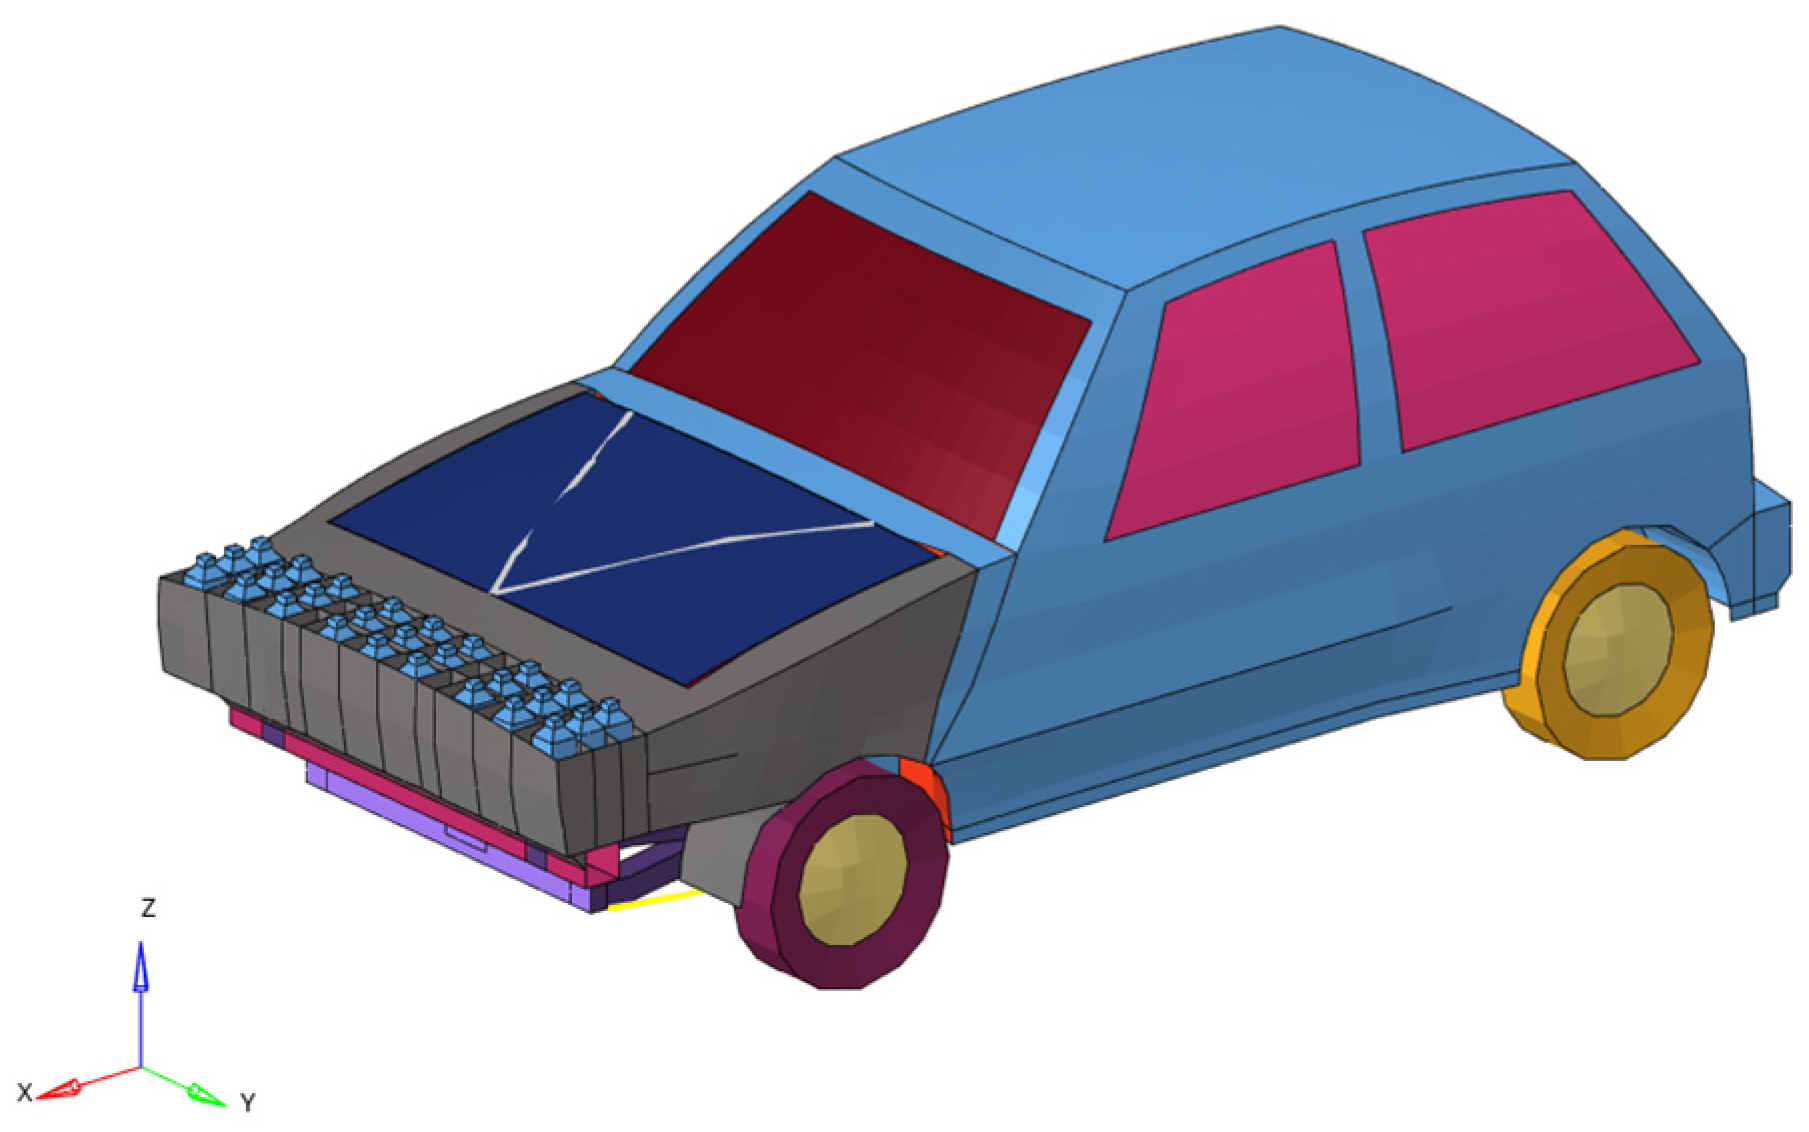
The car model adopted for this impact study taking into account the frontal damping system consisting of the set of water-based energy accumulators is presented below (Figure 1 and Figure 2).
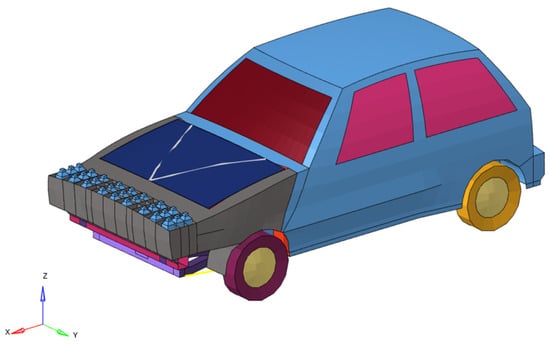
Figure 1.
The model of the car with a water impact absorber.
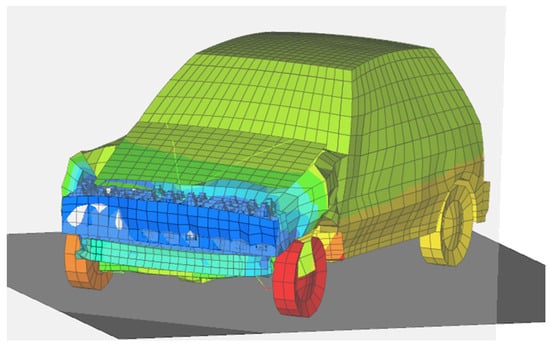
Figure 2.
Car equipped with an impact absorber and FEM model.
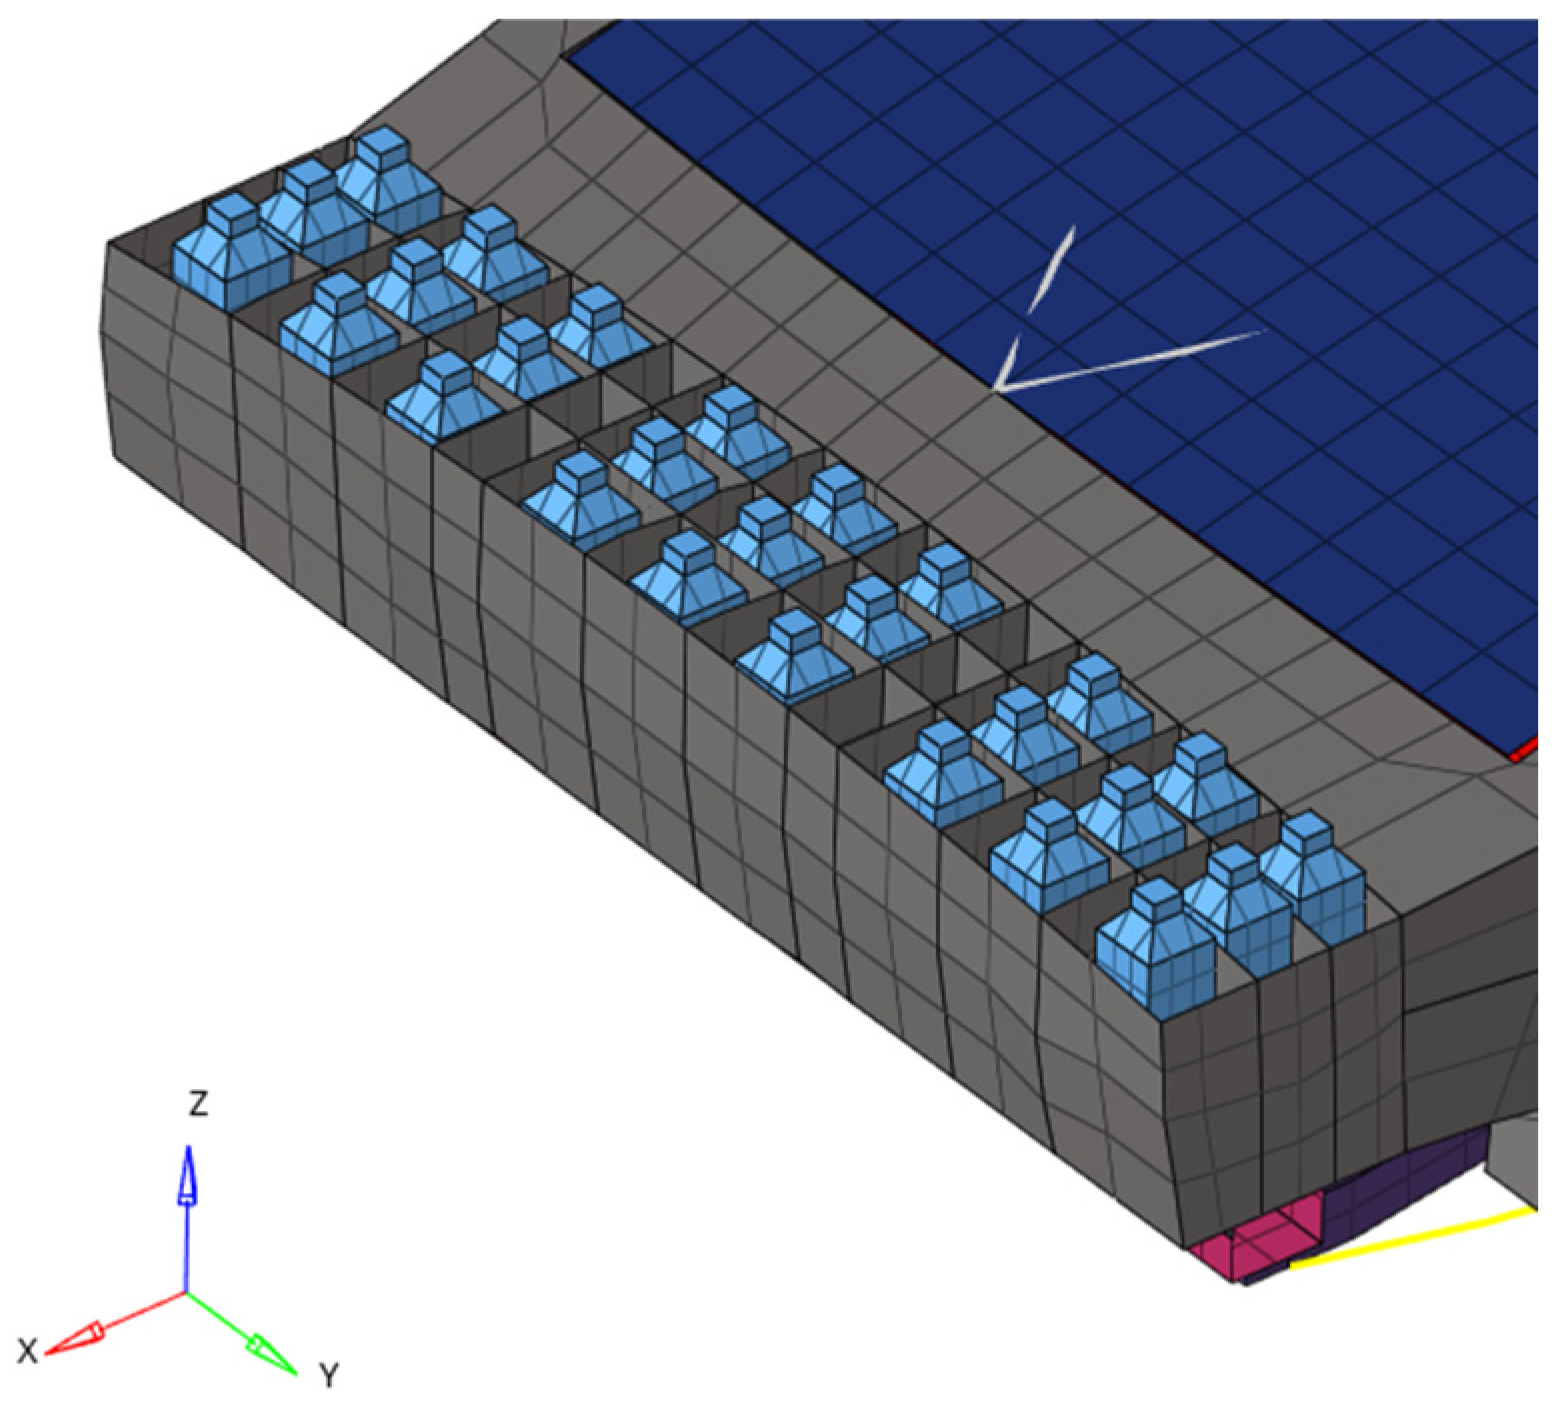
The system consists of a plastic frame (Figure 3) with dimensions of 1231 mm wide, 241 mm deep, and 160 mm high, and 45 plastic water containers (energy accumulators). The plugs (lids) have been drilled. FEM model is presented in Figure 4 and Figure 5.

Figure 3.
Solution for the impact absorber (detail).
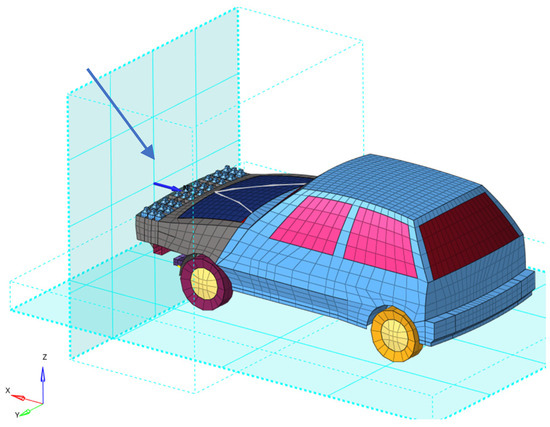
Figure 4.
Collision of the car with the vertical wall.
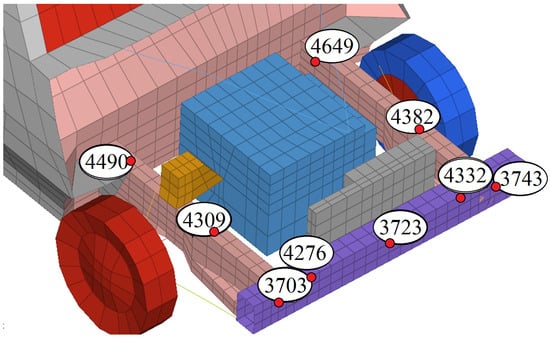
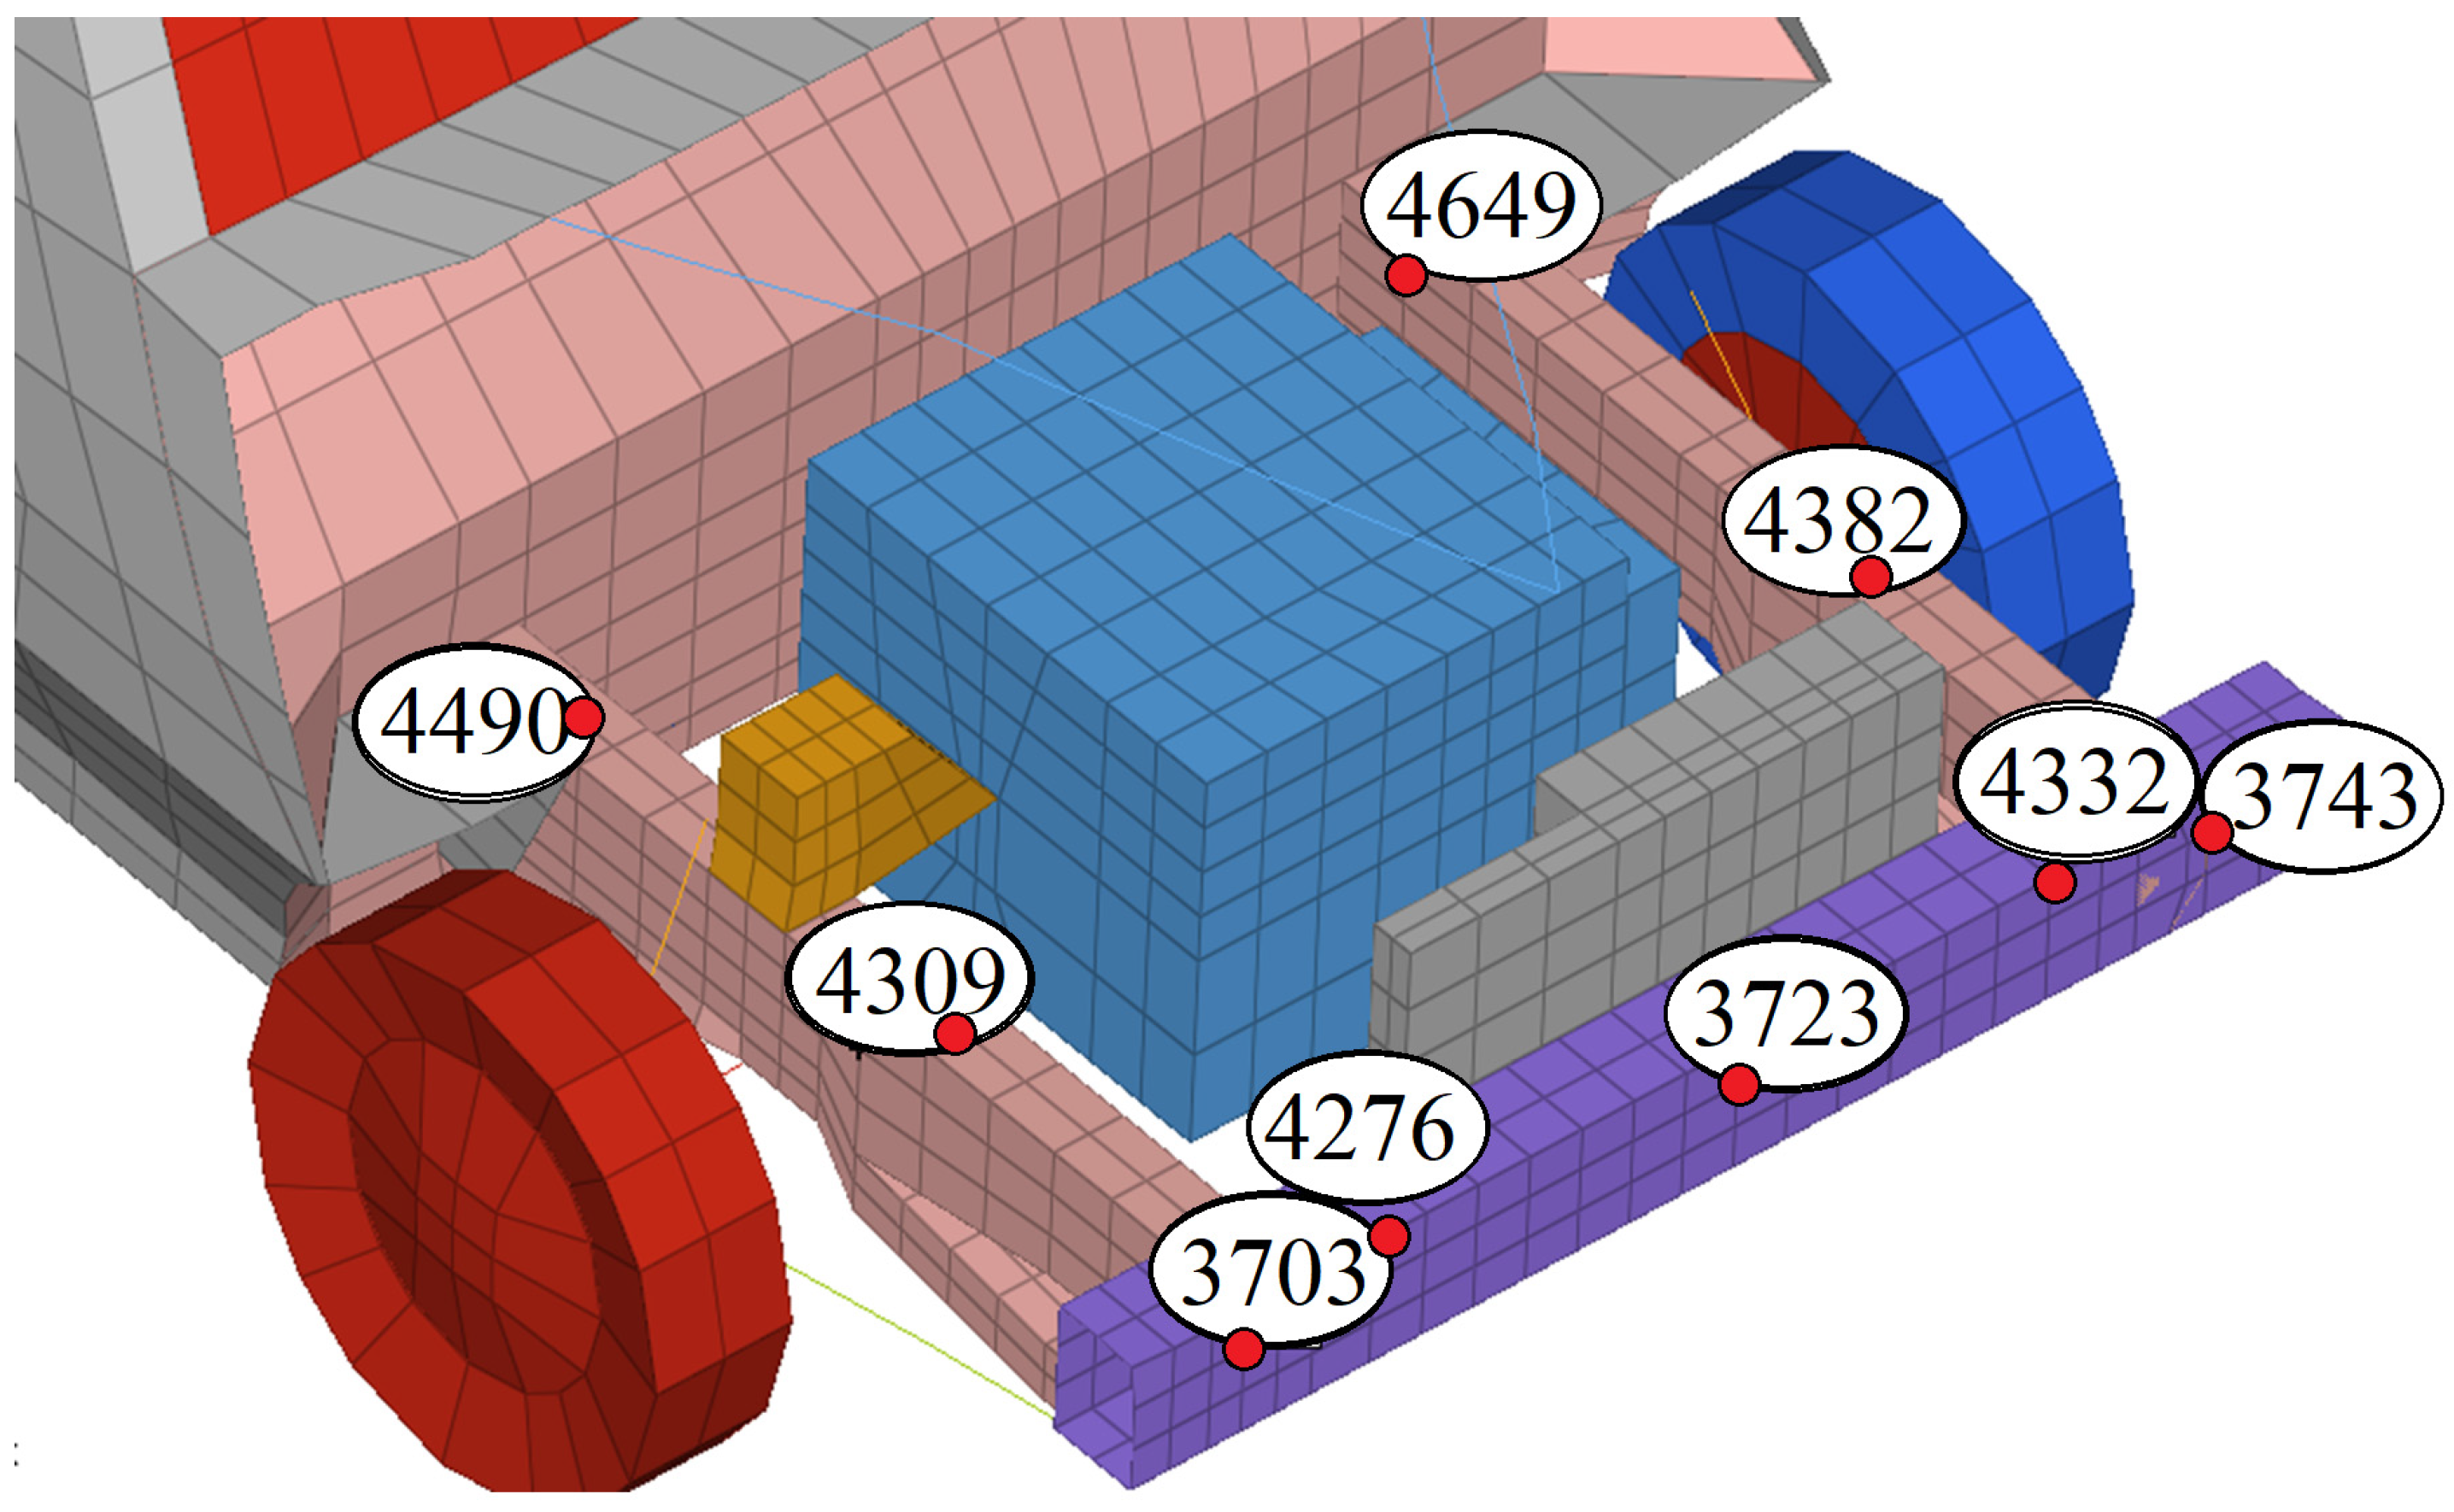
Figure 5.
Points analyzed in the study.
The system is examined using an FEM model created with Altair Hyperworks [46,47,48]. Using this model, several settings are used to observe how the dummy behaves in various scenarios that might arise. The RADIOSS solver from the Altair Hyperworks package was used to create the explicit analysis type. CQUAD4, a shell element with four corner nodes and six degrees of freedom, is the element type employed in this investigation. With the exception of the upper and lower arms of suspension that were simulated as CBAR elements, which have 1D elements with two end nodes and six degrees of freedom, these element types have been used for the majority of the model’s components. The document displays the materials used in the comparative analysis. Other results obtained in [52,53,54] were useful in the modeling of the entire structure.
The card image of the material used in the solver is M36_PLAS_TAB, and the FE simulation material for the IA was regarded as nonlinear in the model.
Additionally, the chassis was made of a nonlinear material that resembled a card image. The following categories of materials were taken into consideration for the remaining model components:
- For the dummy, M1_ELASTwas used.
- Nonlinear steel was used for arms suspension using M2-John-Zeril Card Image Material. John-Zeril: Nonlinear rubber for tires is regarded as the M2 card image. The material’s characteristics for the linear zone are 200 MPa for Young’s modulus and 0.49 for Poisson’s ratio. The plasticity zone was defined using a unitary hardening exponent.
Using an image card TYPE7, self-contact elements were used to make node-to-surface contact between the components.
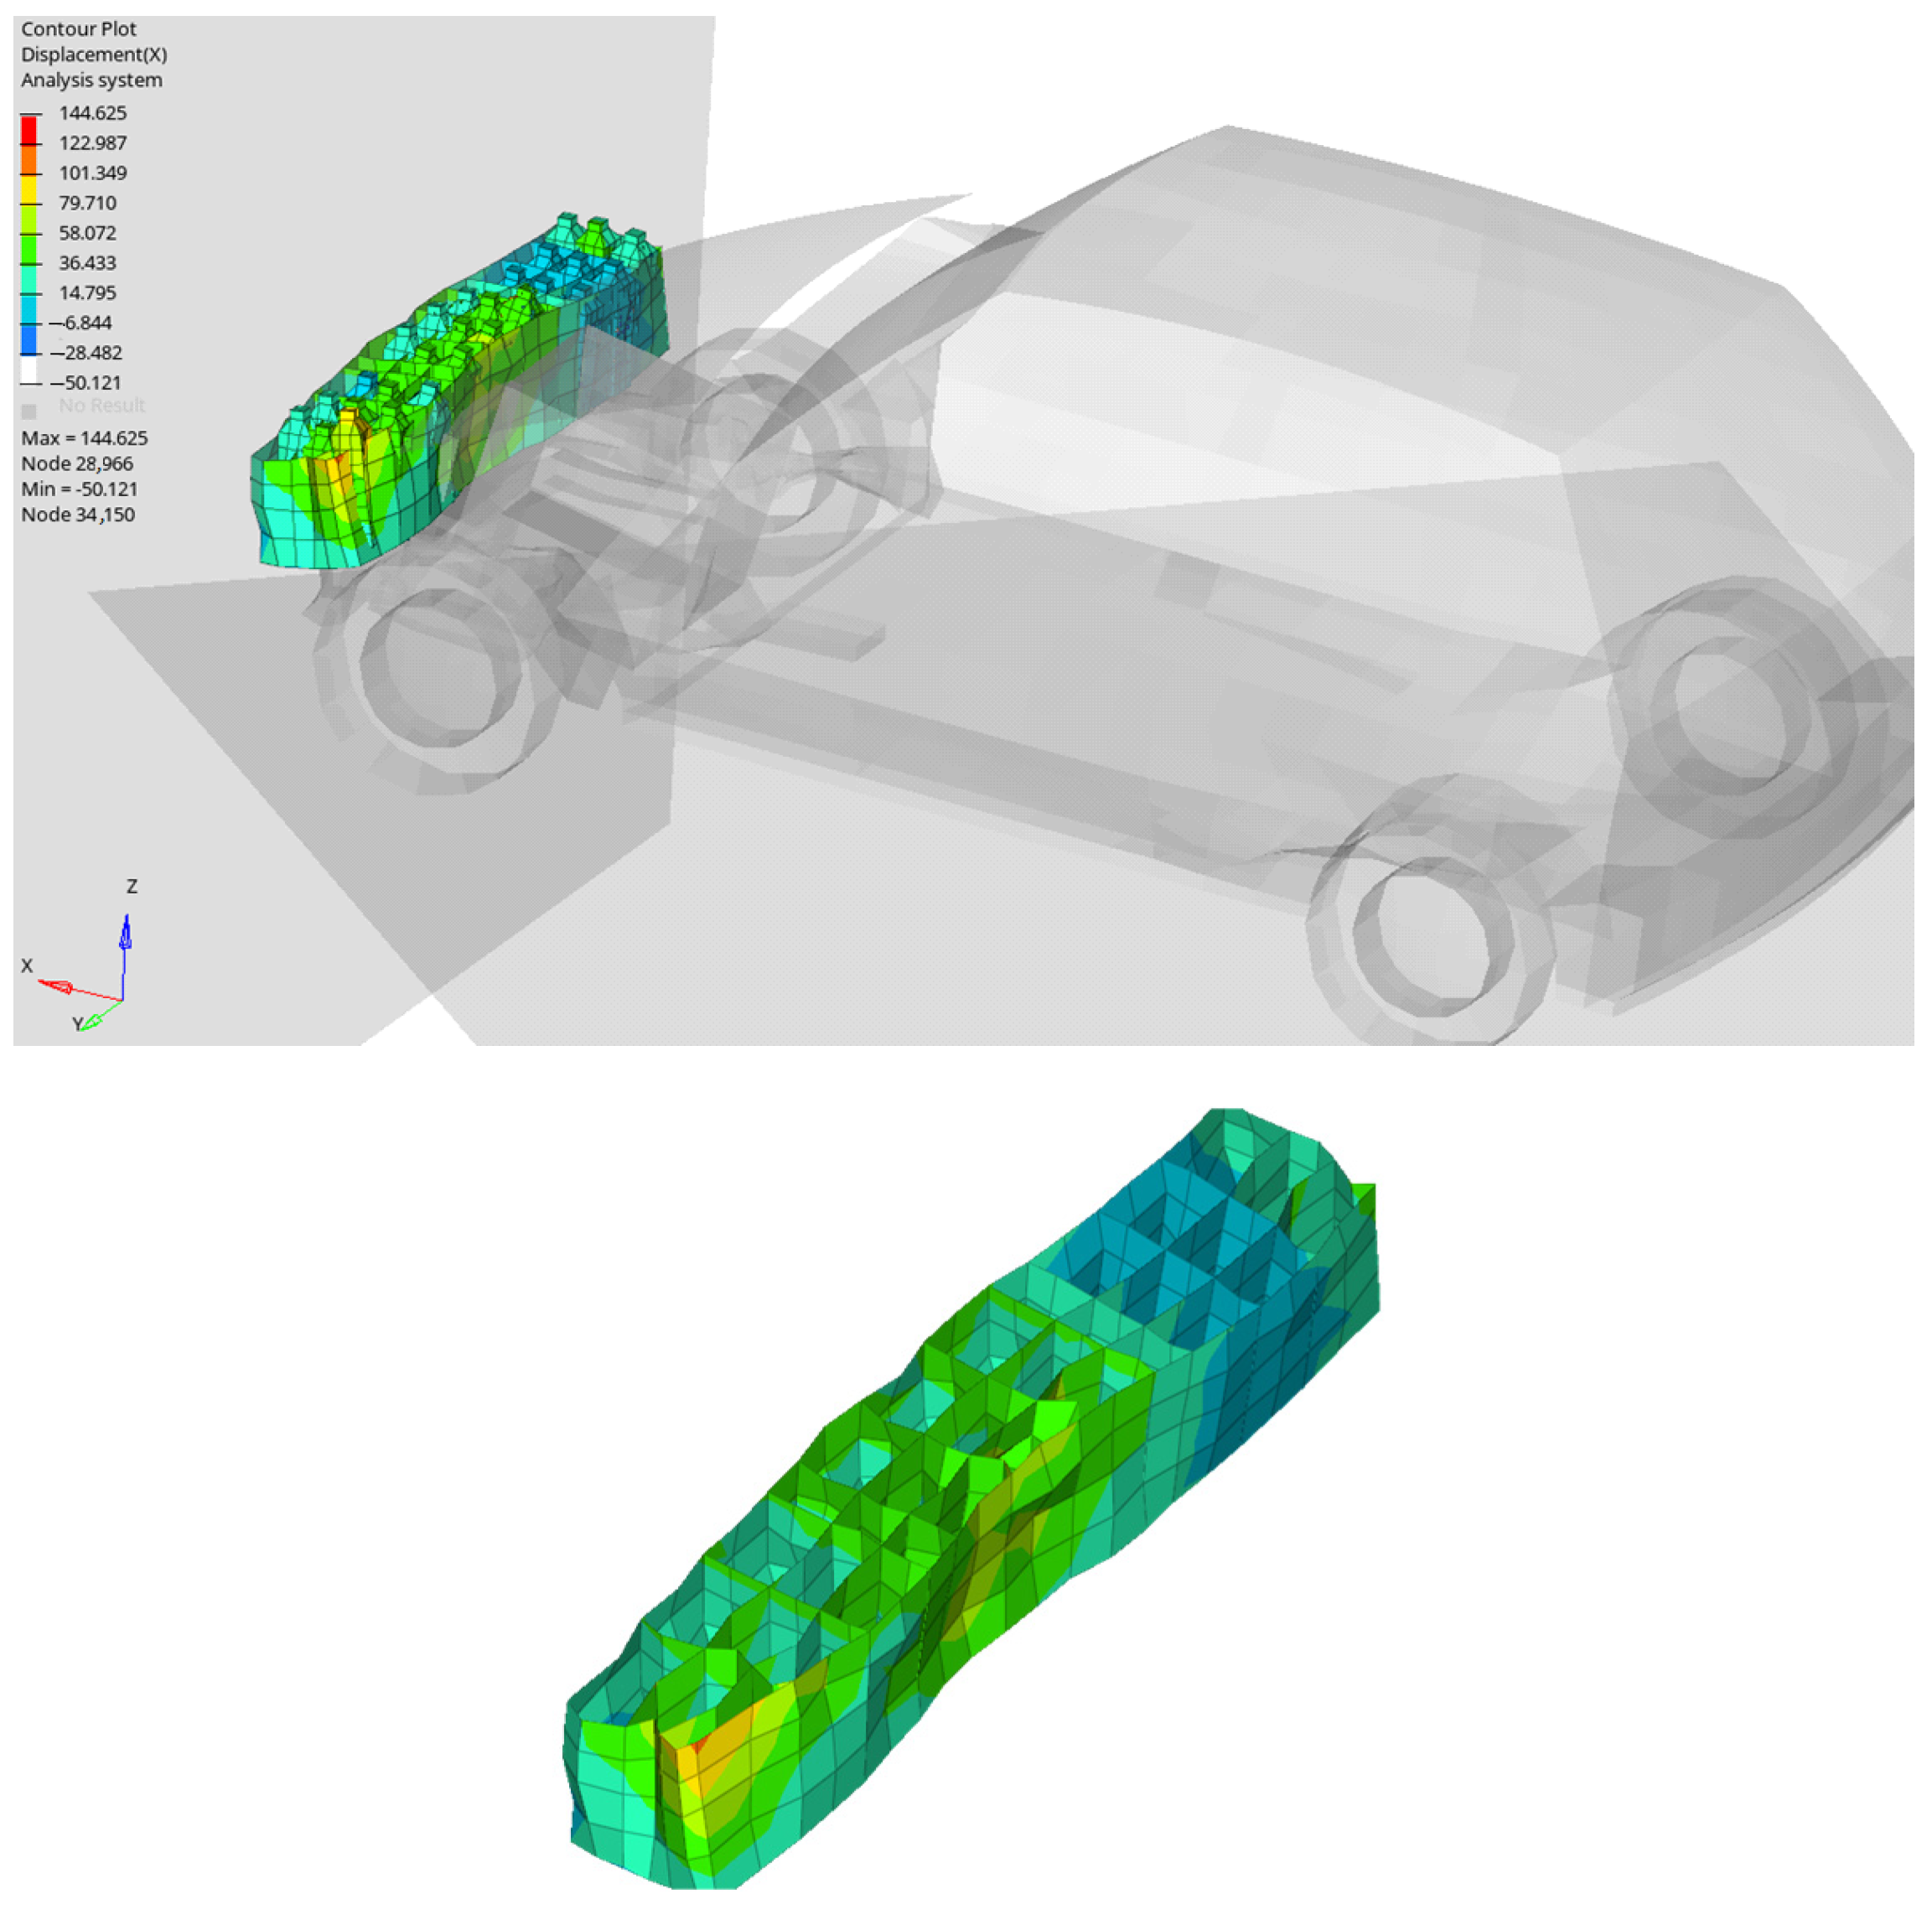
The results shown in the following section are derived from this intricate model, which simultaneously analyzes the structure’s deformability (Figure 6), the forces that manifest in the safety belt, and the accelerations of various dummy points. These results provide us with insights into the demands that arise in such a system. Information for the test conditions are taken from [55,56,57].

Figure 6.
The car after collision and IA (detail).
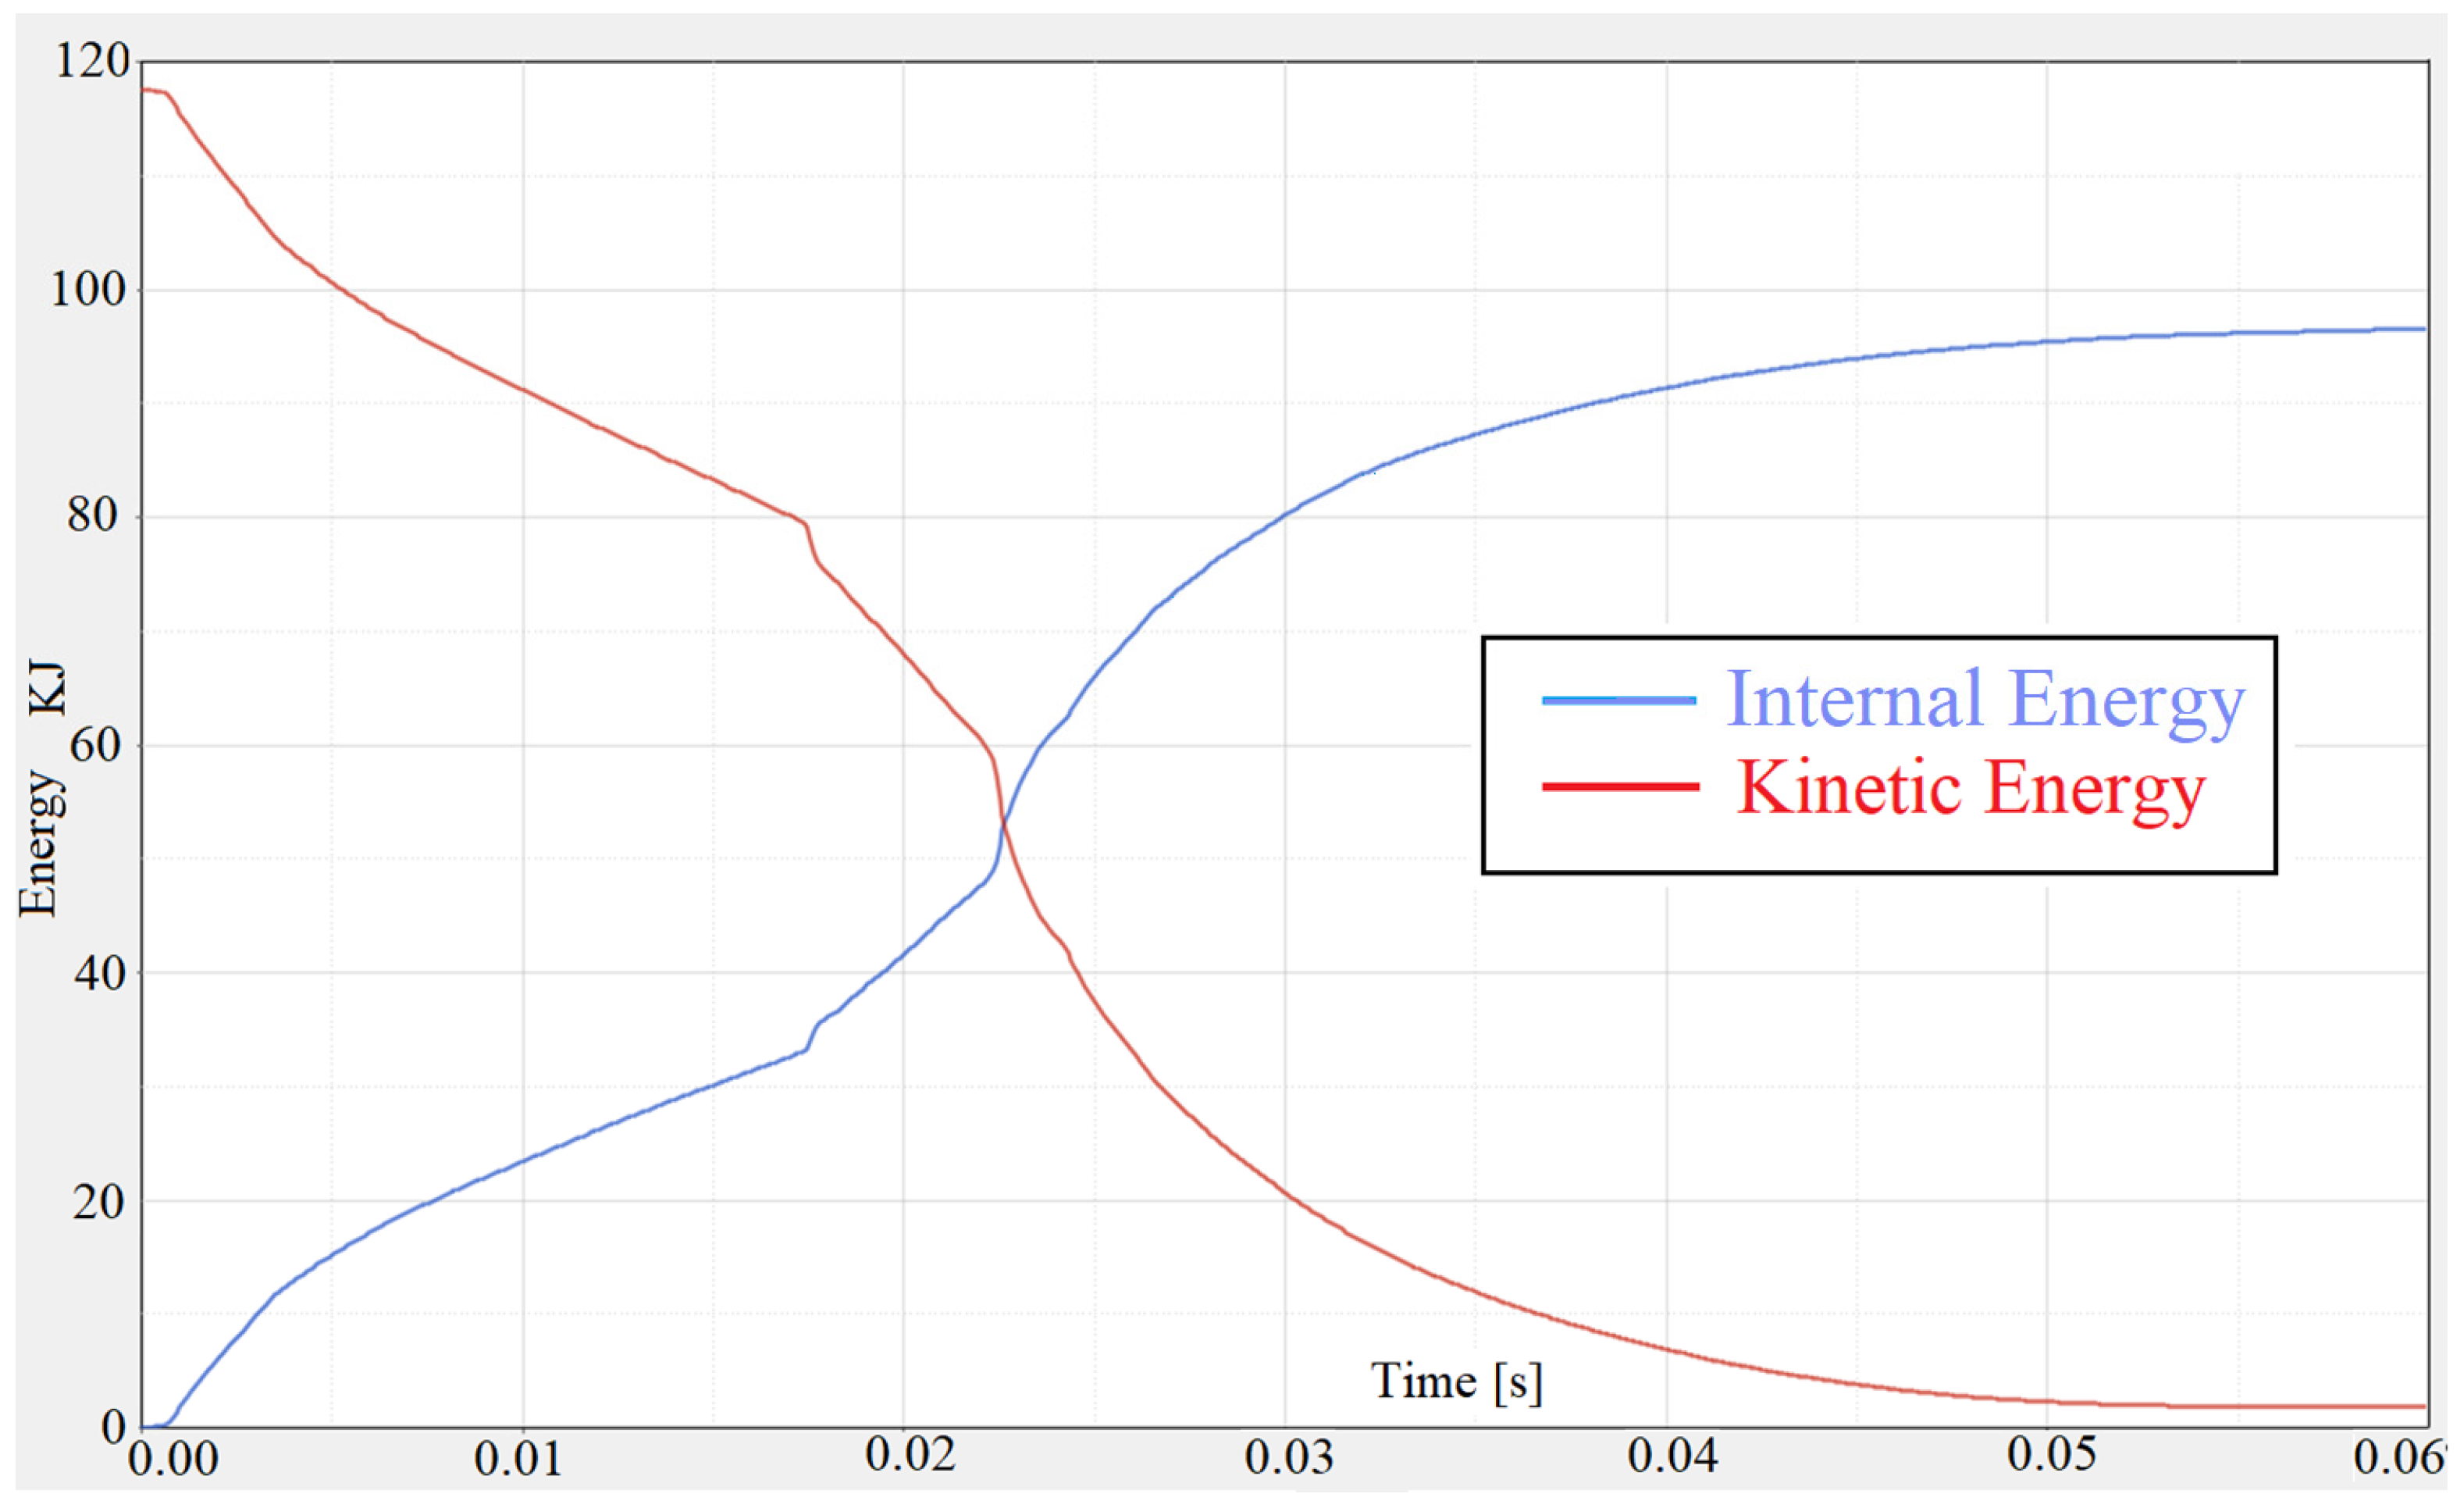
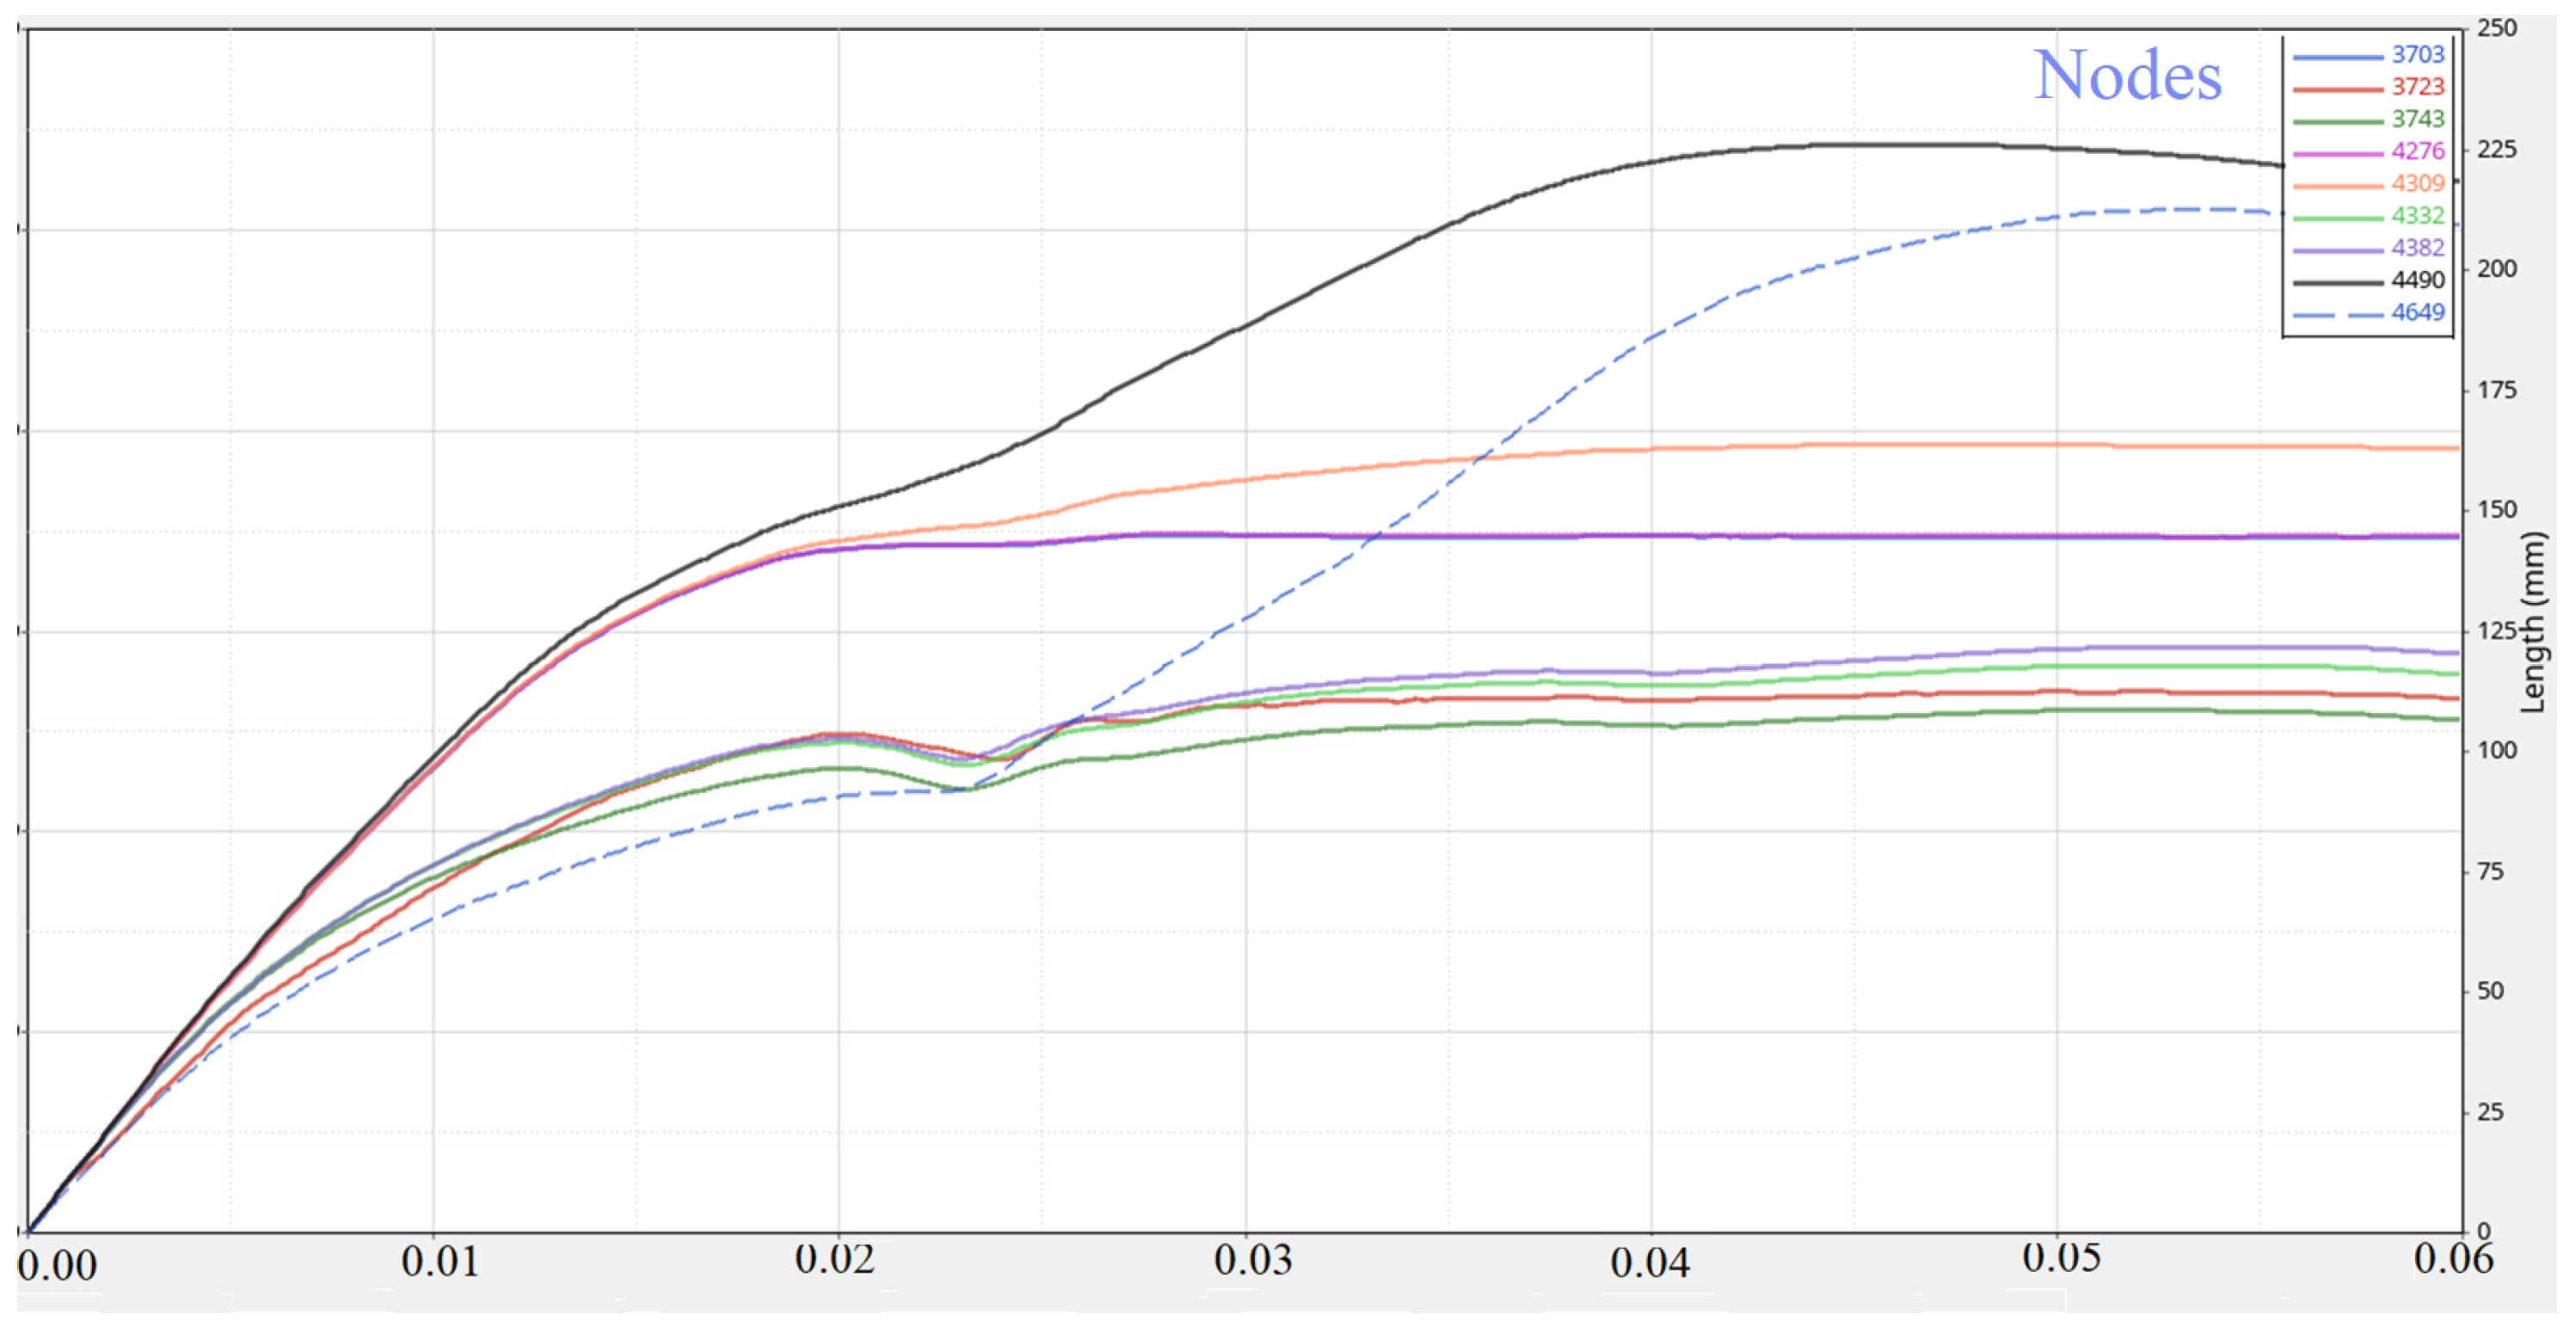
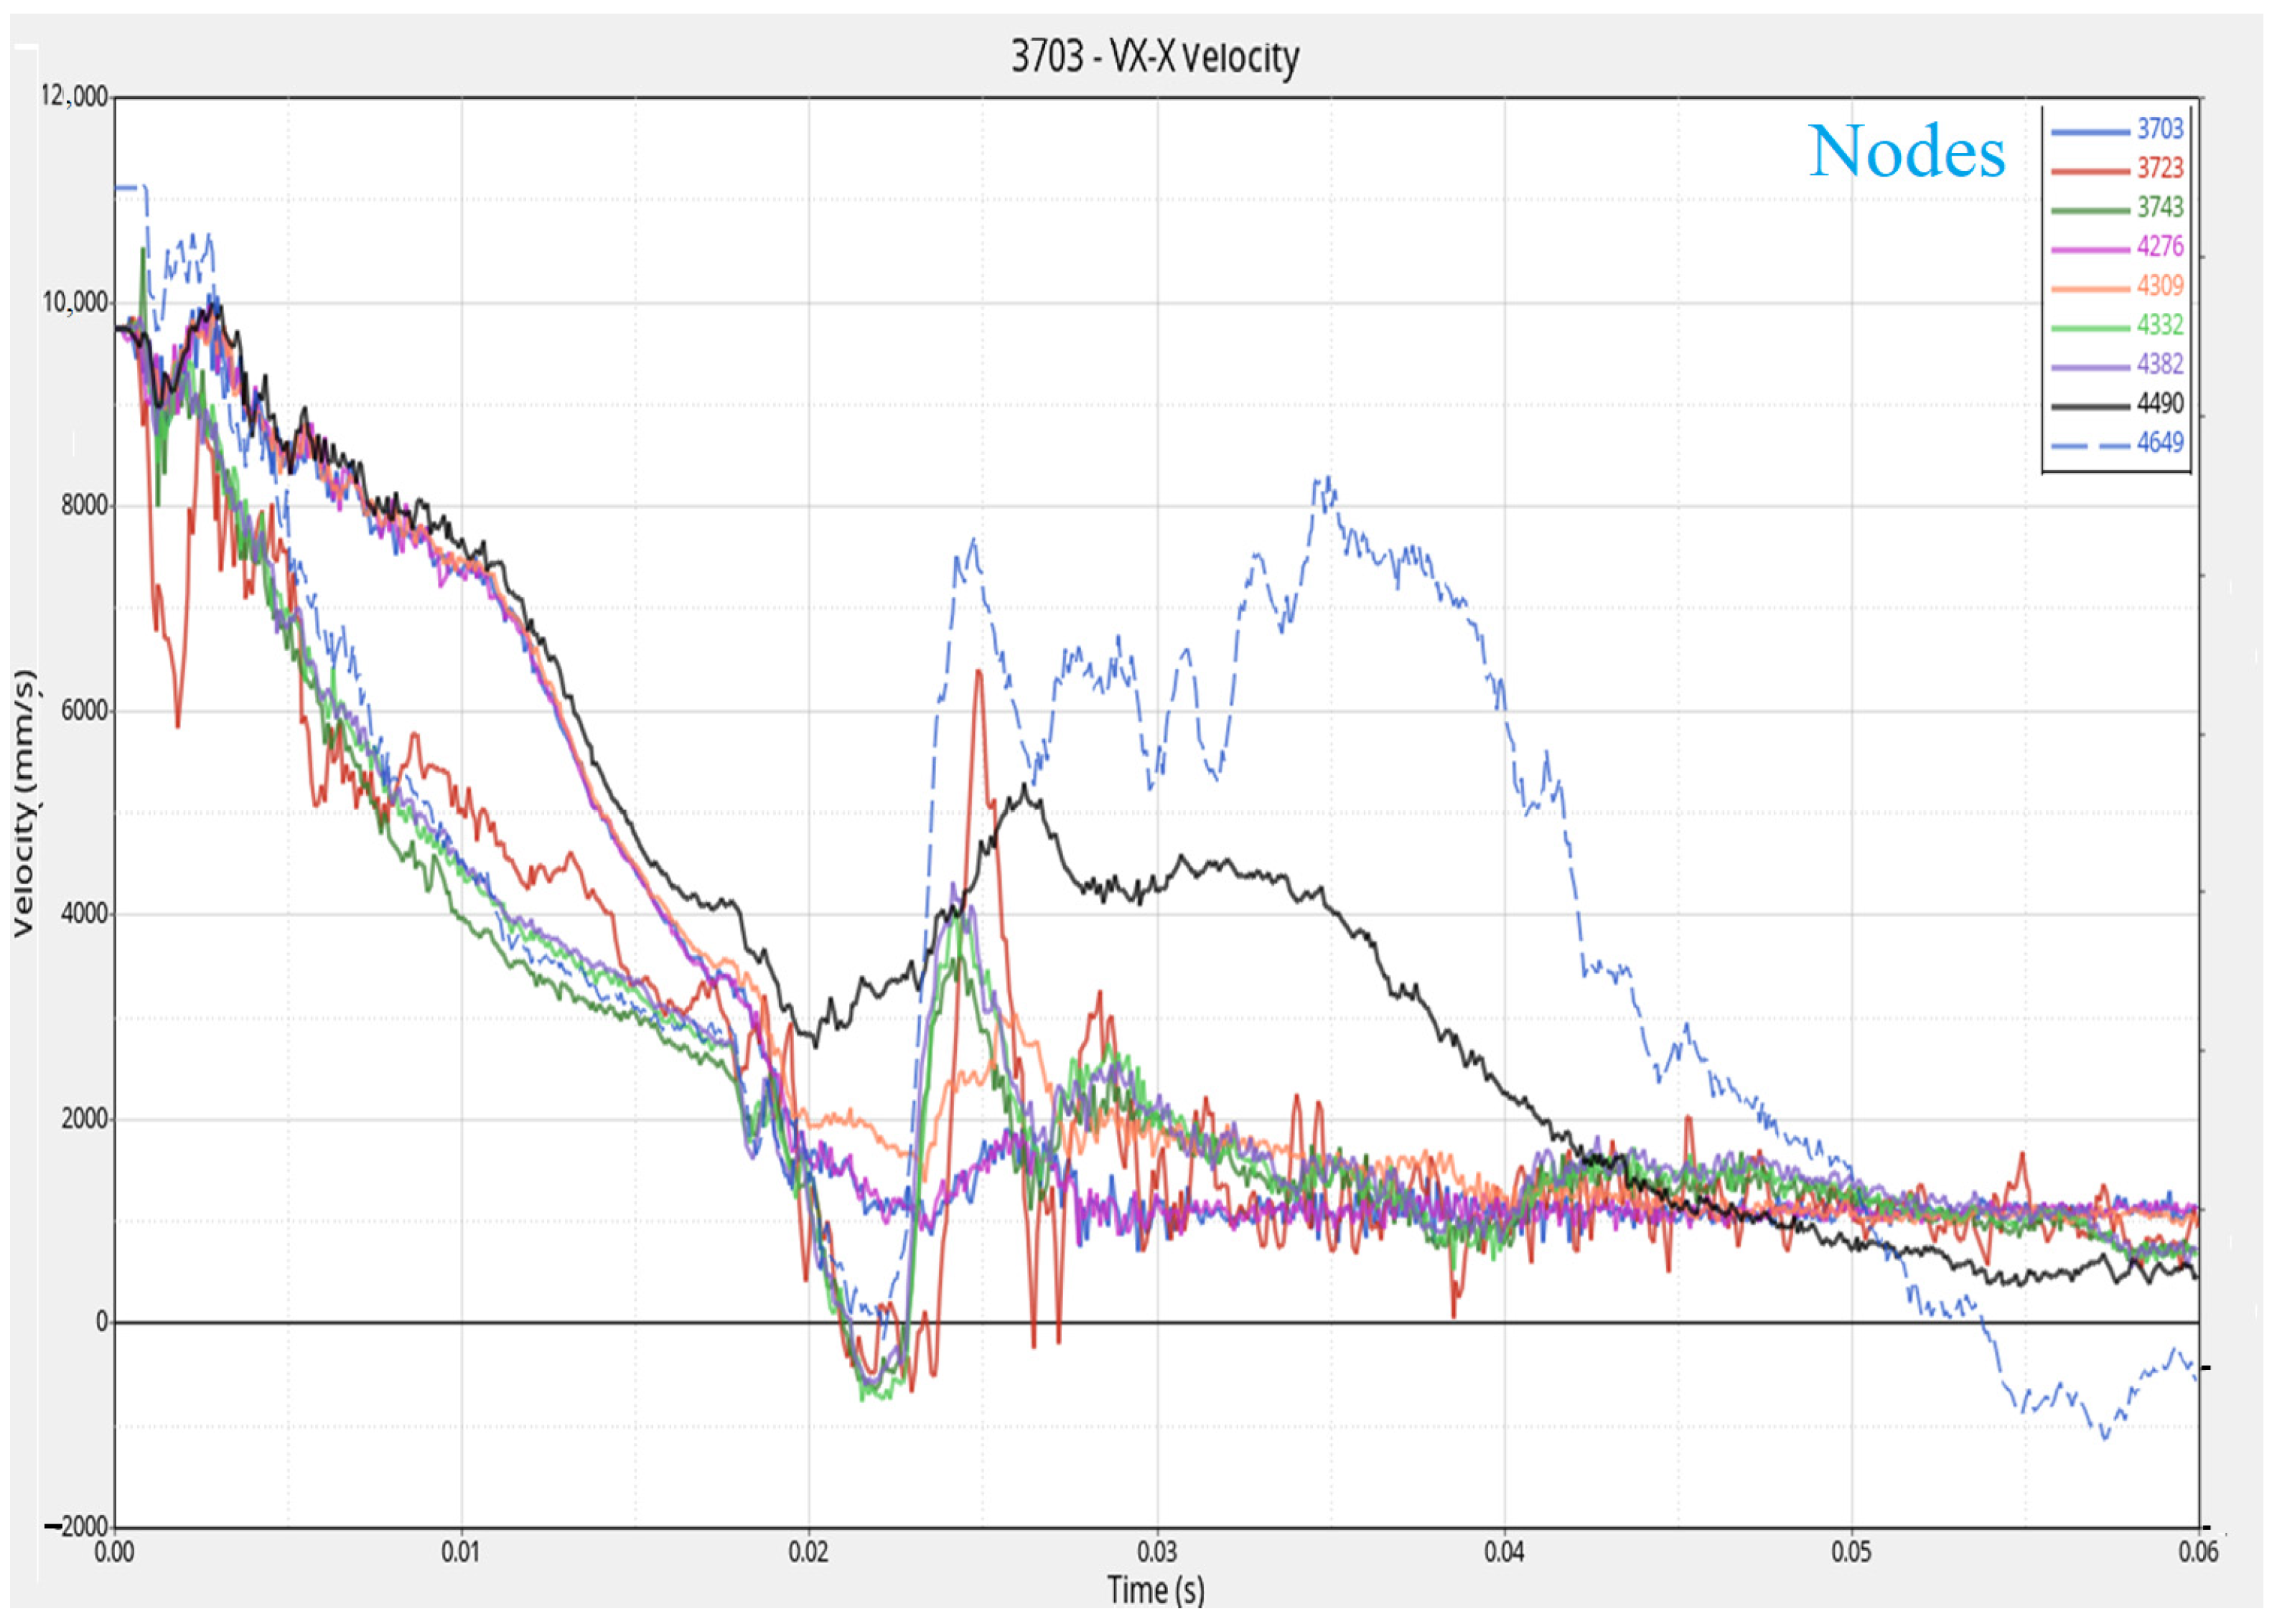
The velocity before the collision, in the case of the vehicle with damping, was 11.74440 m/s ≅ 42.28 km/h. The variation of the internal energy, displacements and velocities of different points on the chassis are presented in Figure 7, Figure 8 and Figure 9.
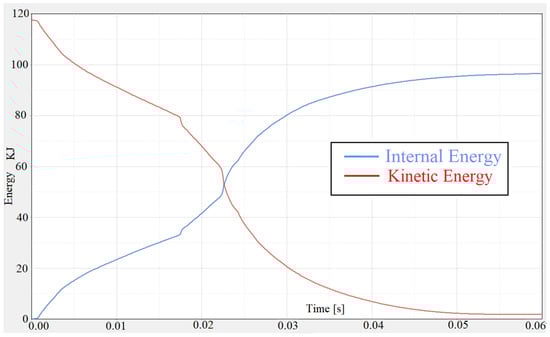
Figure 7.
The variation in the internal energy accumulated by the car.
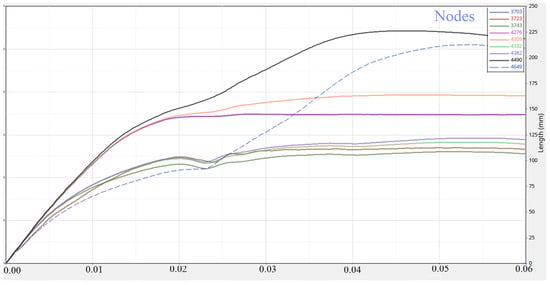
Figure 8.
Displacements of different points of the car.
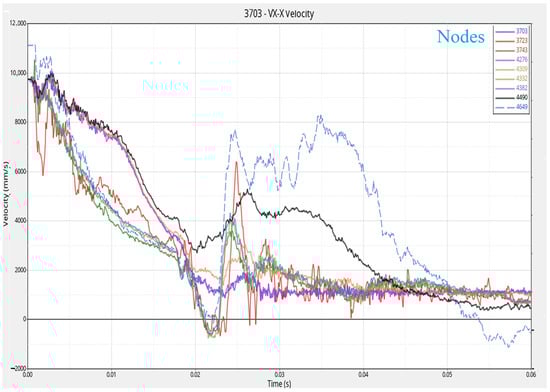
Figure 9.
Velocity of different points of the chassis.
3. Experimental Validation
Objectives and Experimental Testing
The main objective of the experimental testing is to improve and validate the technical solution that effectively manages the risk and severity of occupant injuries. For this purpose, a simulation of the impact between a vehicle and a rigid barrier is performed, in order to reproduce real collision conditions. Following the measurements, the kinematic parameters (displacement, speed, and acceleration) are acquired, and the severity of occupant injuries and the probability of injury occurrence are established. Based on all the data collected, the technical solution is validated through comparative analysis with the mathematical model and simulation in a virtual environment.
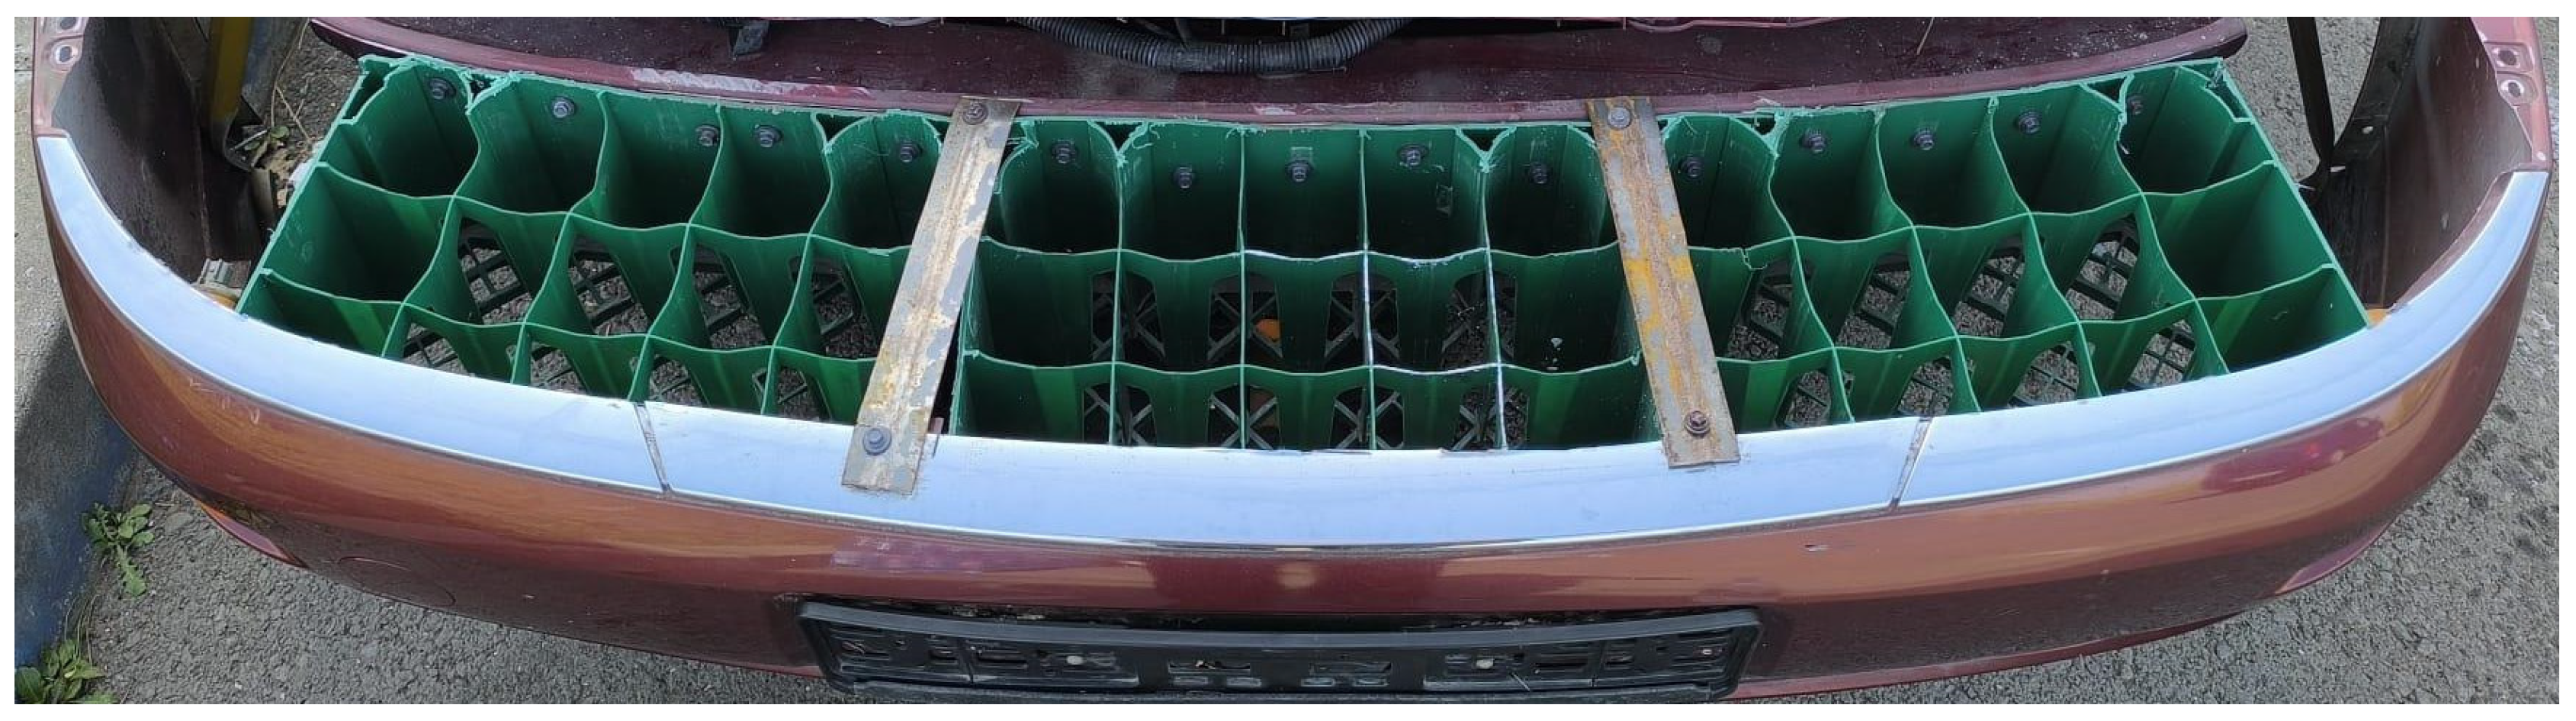
To carry out the tests, a test range is required, which exists at the Institute of Research and Development of Transilvania University in Brașov. A data acquisition system (PicDAQ) is used. A Hi Spec 5 high-speed camera is used to record video samples during the experimental tests. It is capable of filming at more than 1400 frames per second. The device provides high-resolution images of 1696 × 1710. A DJI Phantom 3 Standard drone (https://www.dji.com/global/support/product/phantom-3-standard, accessed on 9 July 2025) is used to capture panoramic images. It has a weight of 1216 g, a maximum take-off speed of 5 m/s, and a landing speed of 3 m/s. The drone has an operating temperature between 0 and 40 °C. Two DD1 Prototype anthropomorphic test devices are used in the experimental tests. The dummy has a total weight of 84.12 kg, the distribution being as follows: head 4.7 kg, neck 1.4 kg, upper torso 20 kg, and lower torso 12.6 kg, with the rest of the weight being distributed in the lower limbs. The damping system consists of a plastic frame (Figure 10 and Figure 11) with dimensions of 1230 mm wide, 230 mm deep, and 160 mm high, and 45 plastic water bottles.
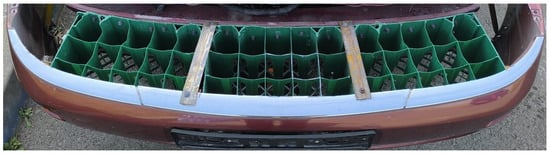
Figure 10.
Plastic frame of the damping system.
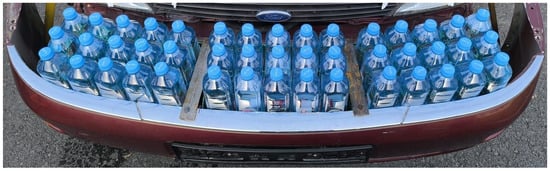
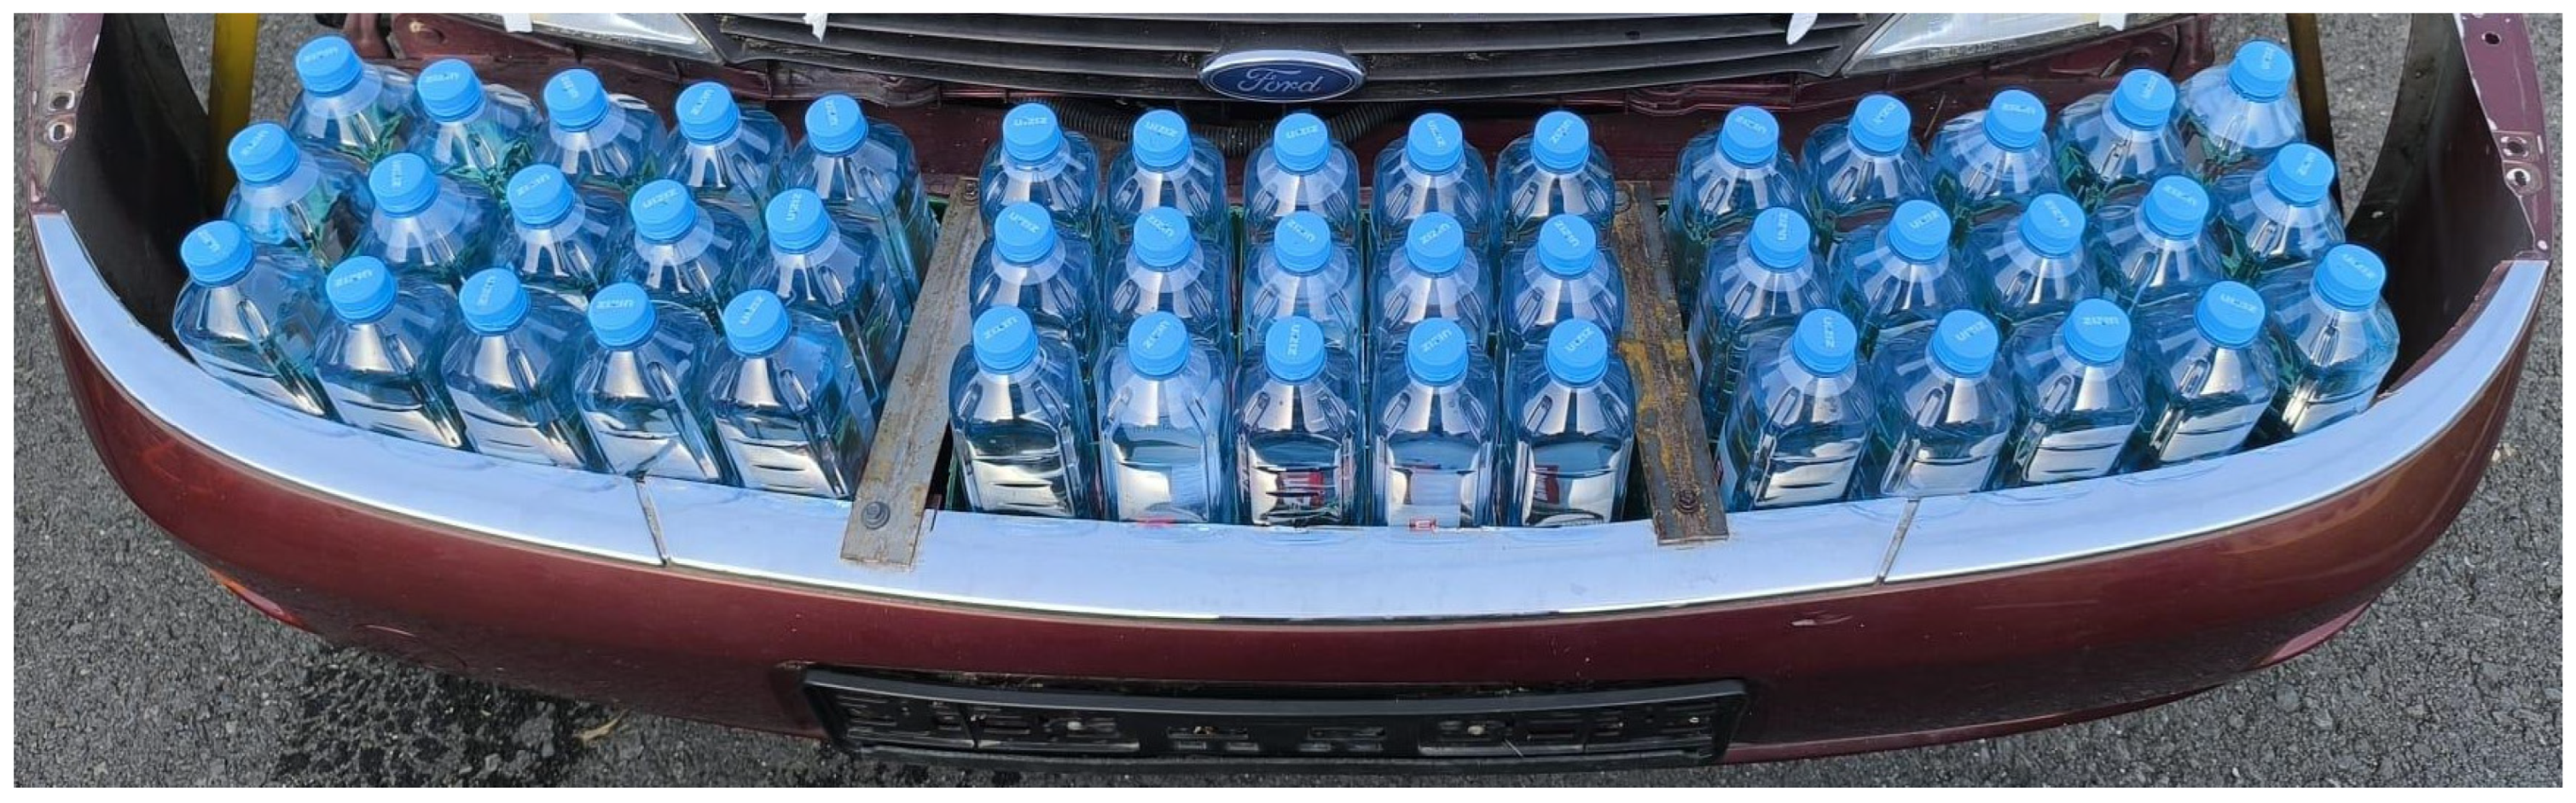
Figure 11.
Damping system.
By mounting the water bottles, the height of the cushioning system becomes 310 mm. The equipment is designed to reduce the displacement of the occupants and to mitigate injuries caused to them. The developed cushioning system is visible in Figure 11.
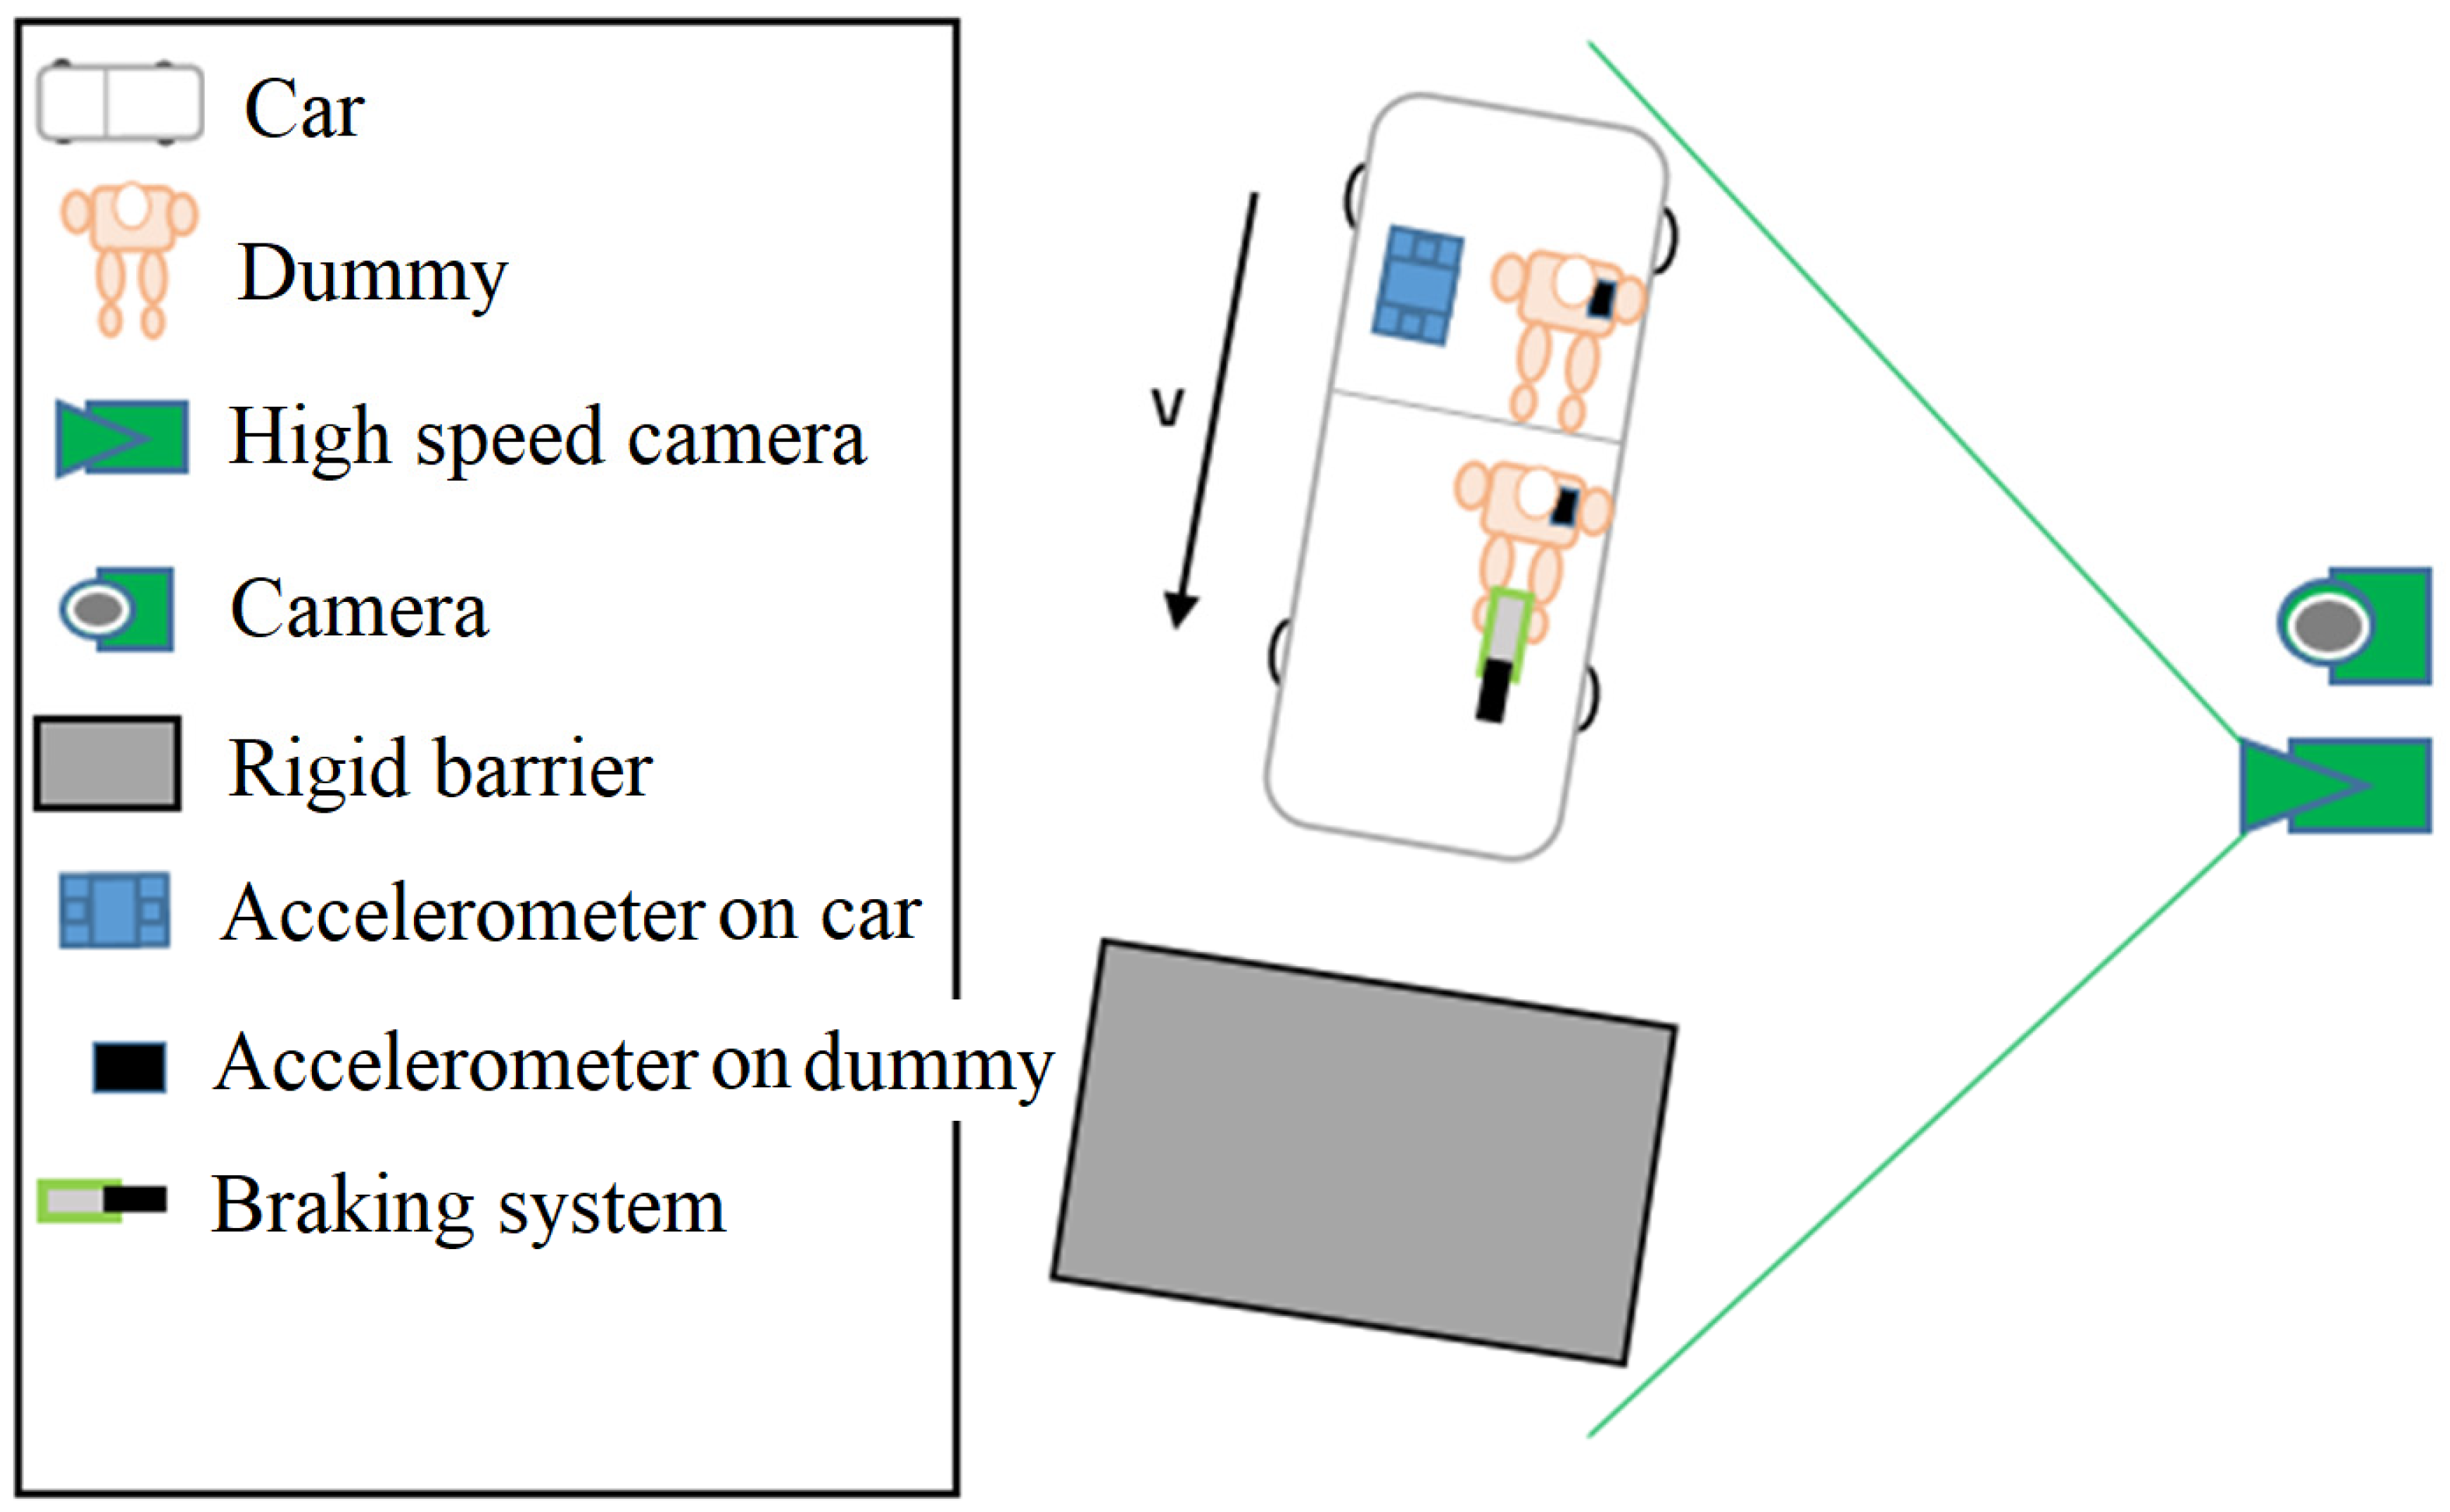
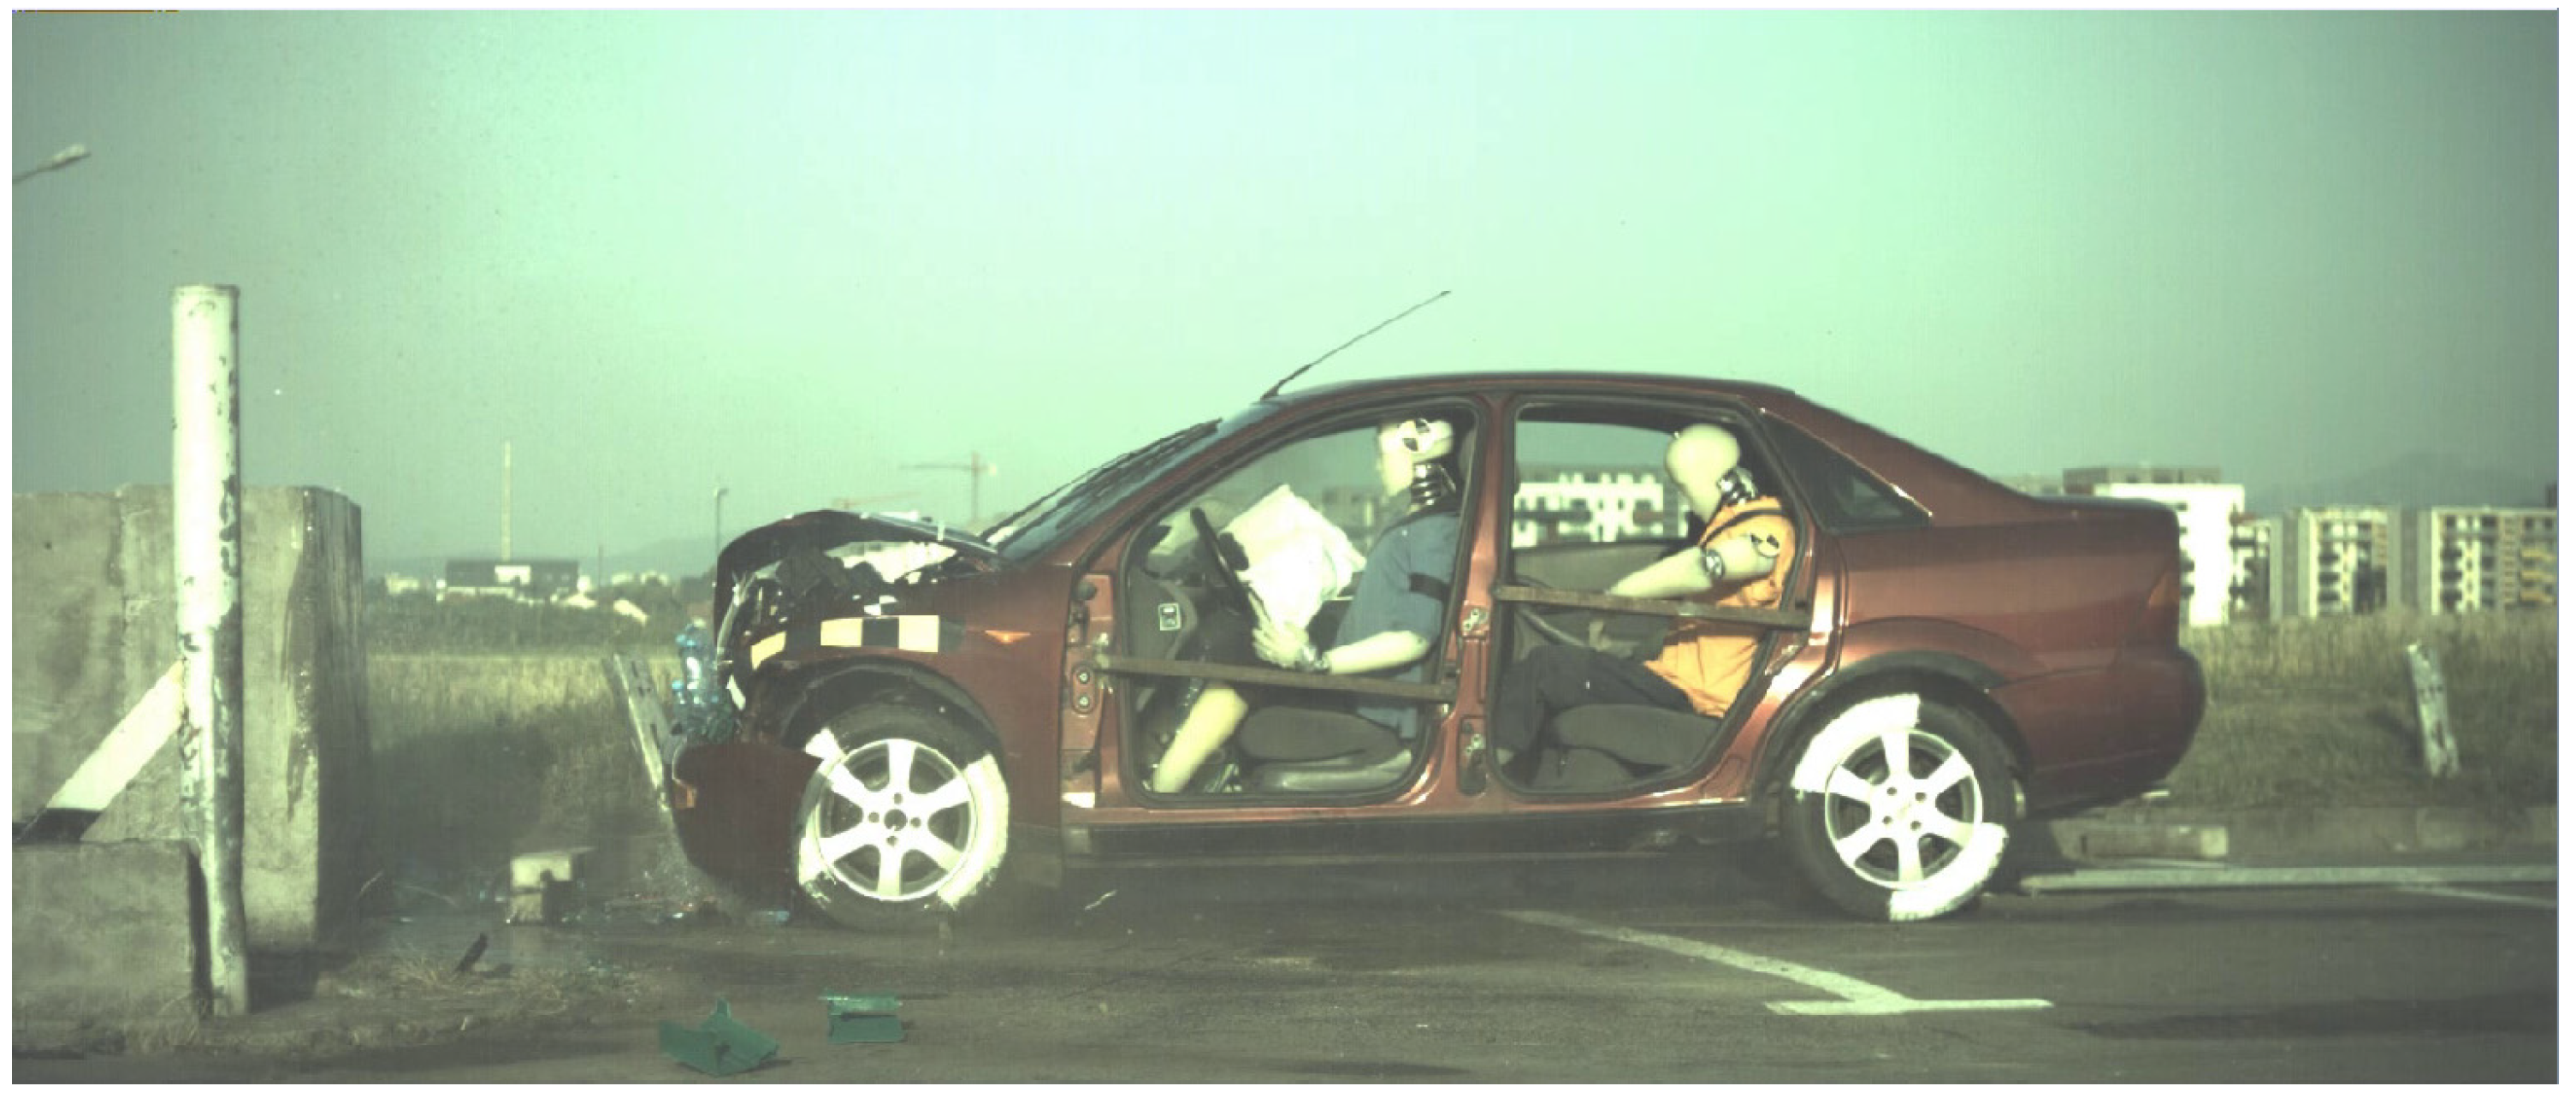
The first test scenario consisted of a frontal impact between a vehicle without an IA and a rigid barrier at a speed of approximately 42 km/h. This scenario is depicted in Figure 12.
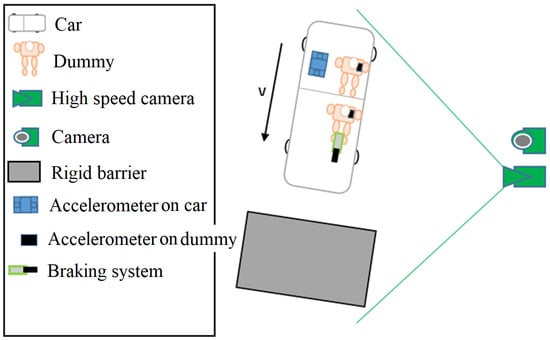
Figure 12.
Collision scenario without damping.
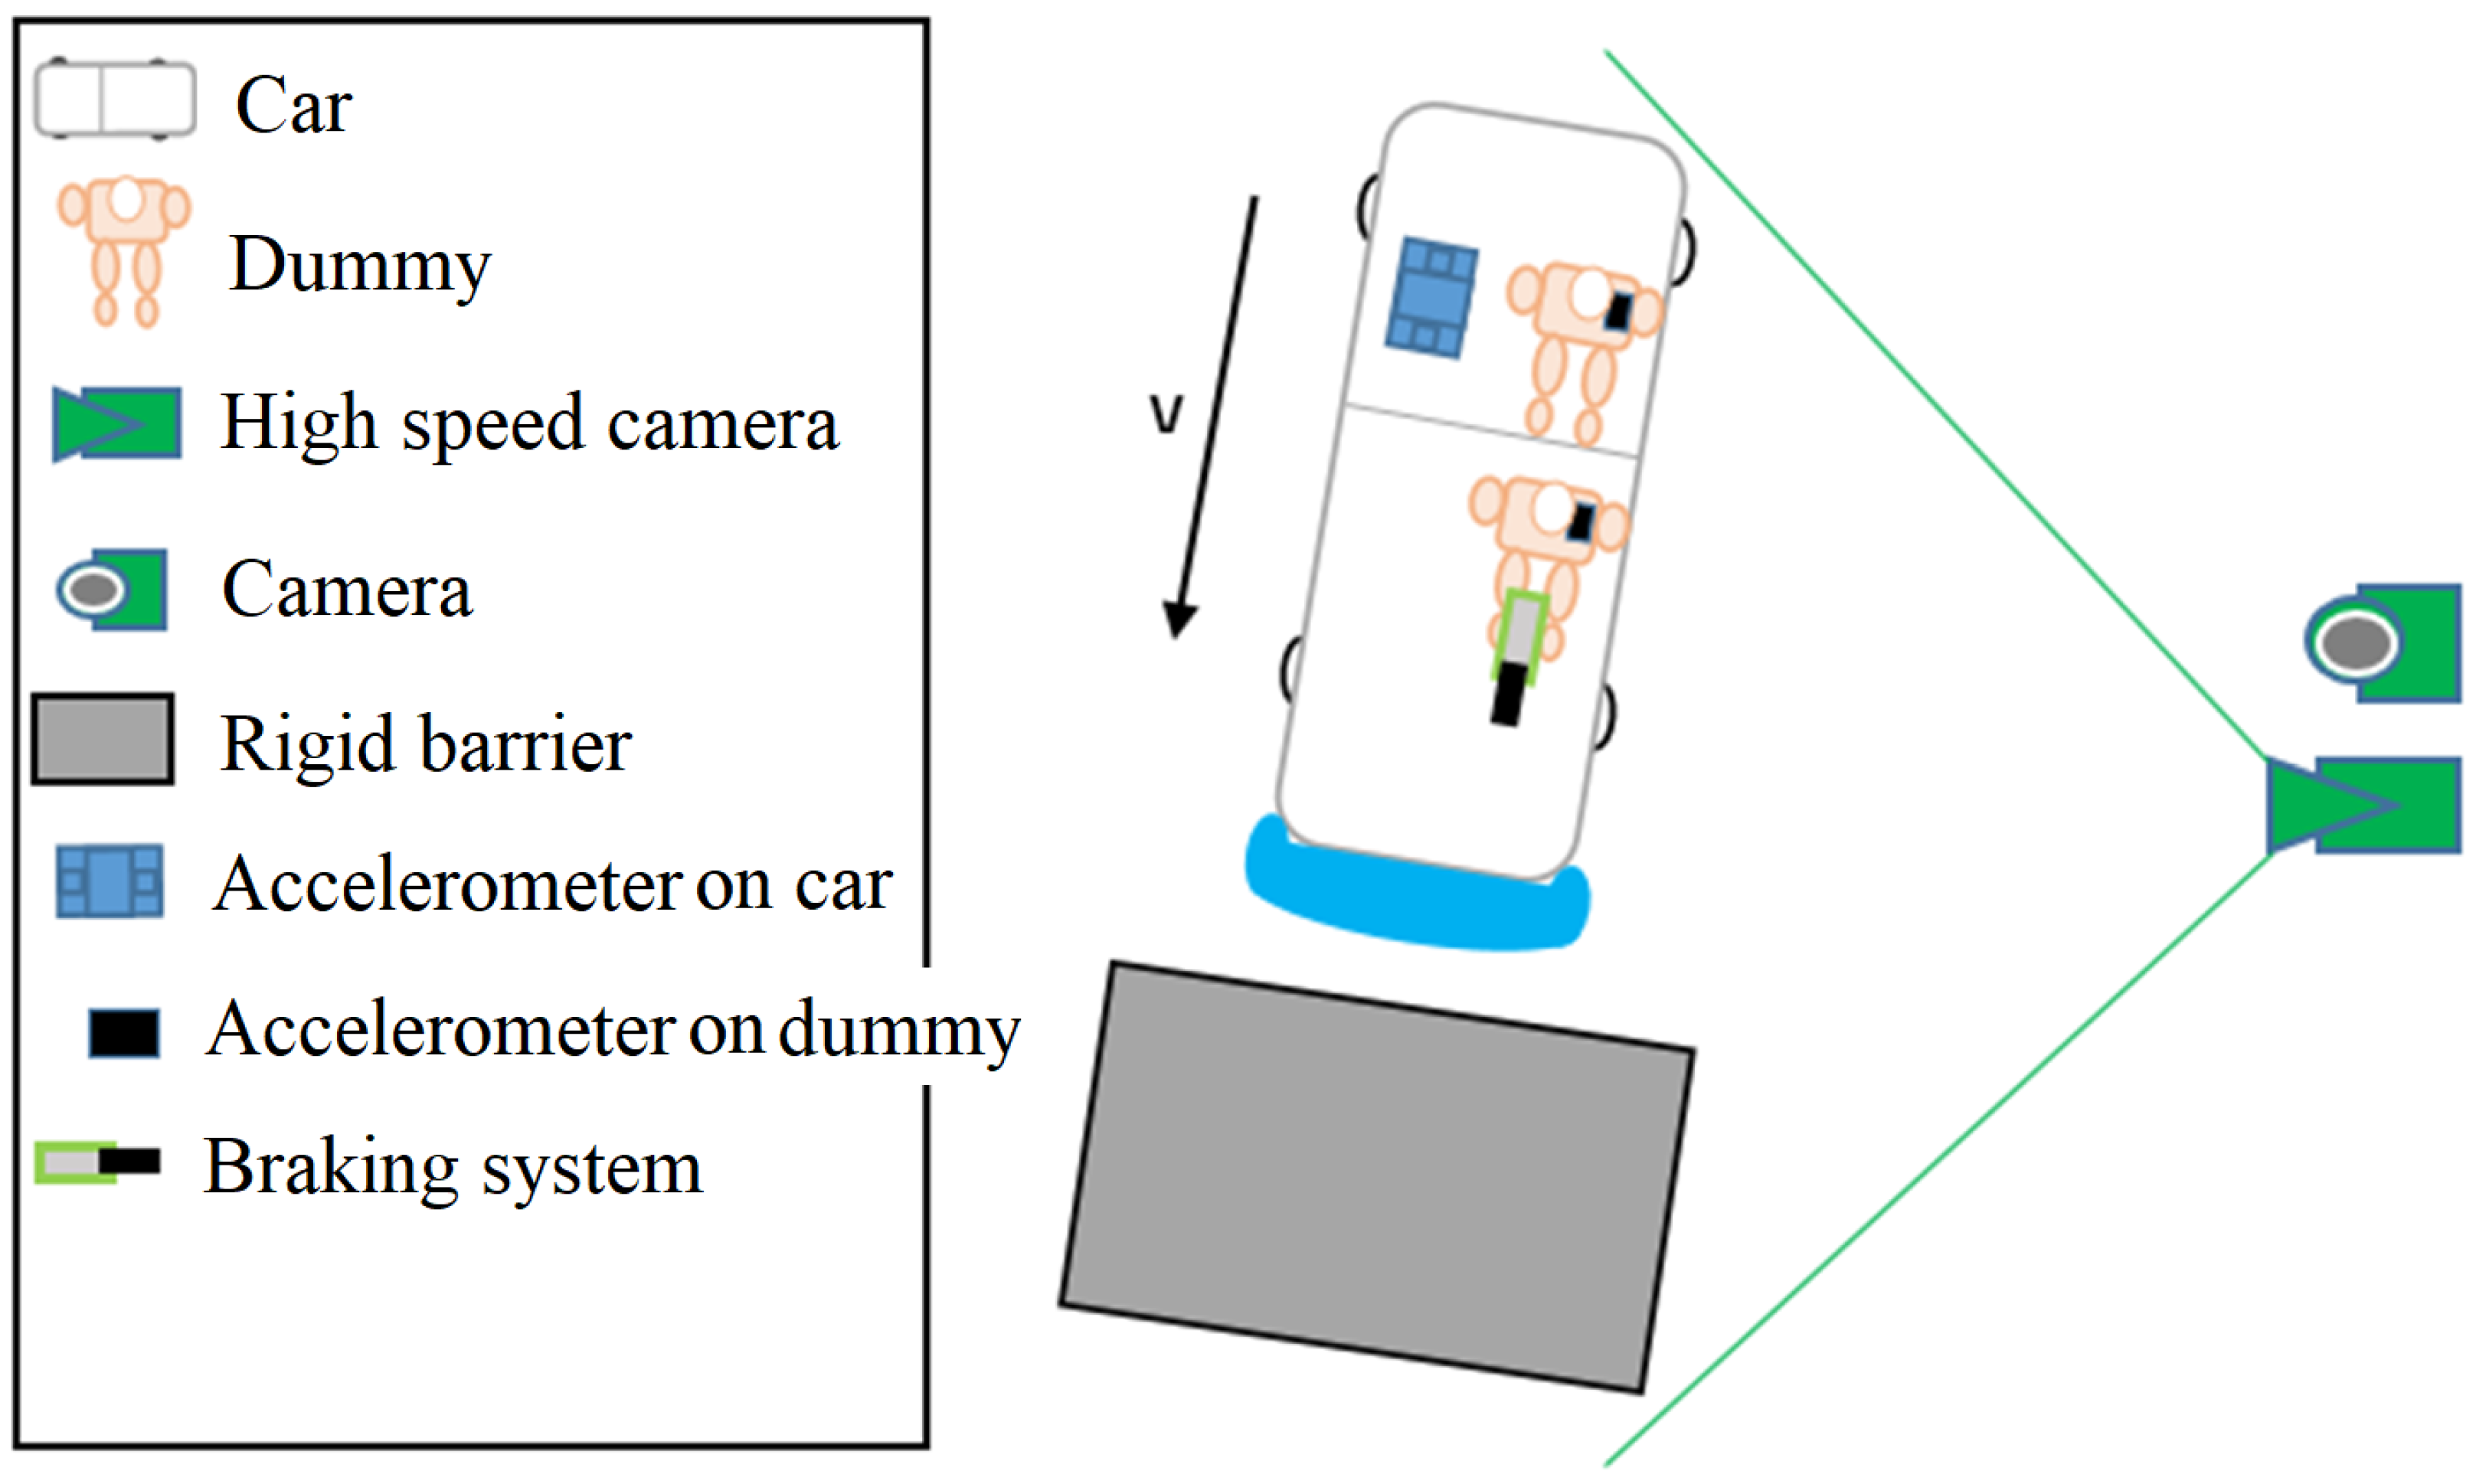
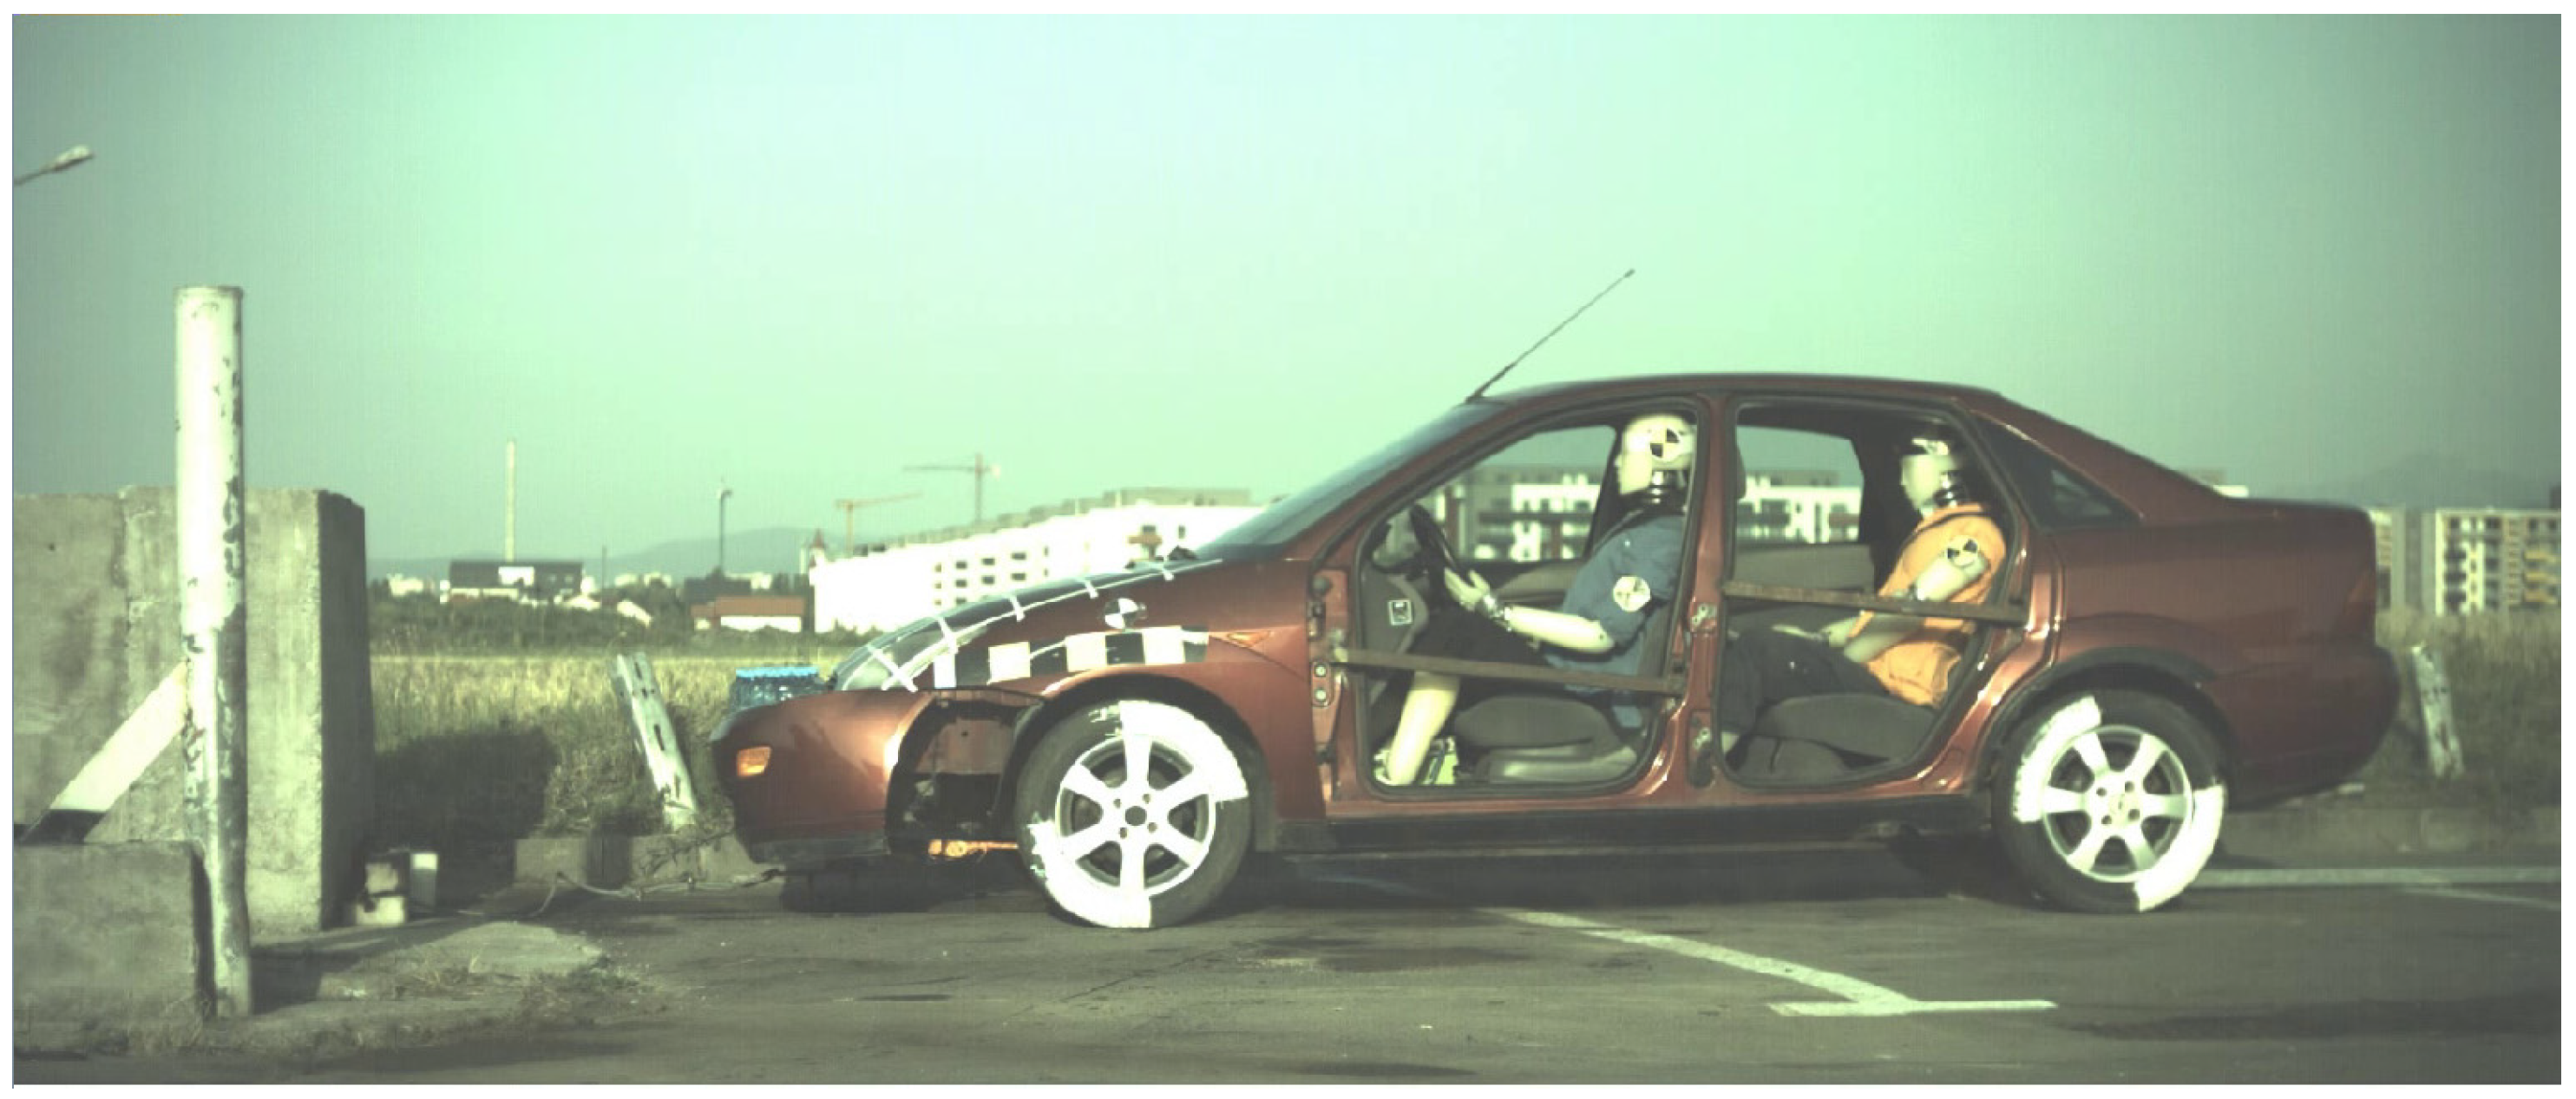
The second test scenario consisted of a frontal impact between a vehicle optimized with an adaptive damping system (IA) and a rigid barrier at a speed of approximately 42 km/h. This scenario is depicted in Figure 13.
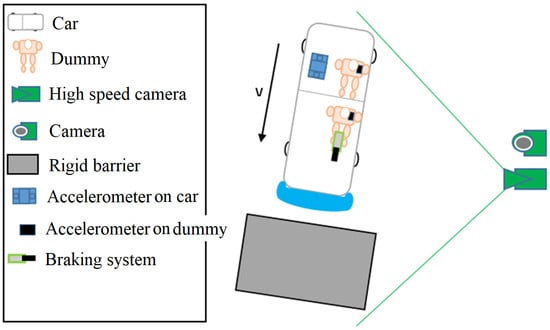
Figure 13.
Collision scenario with damping.
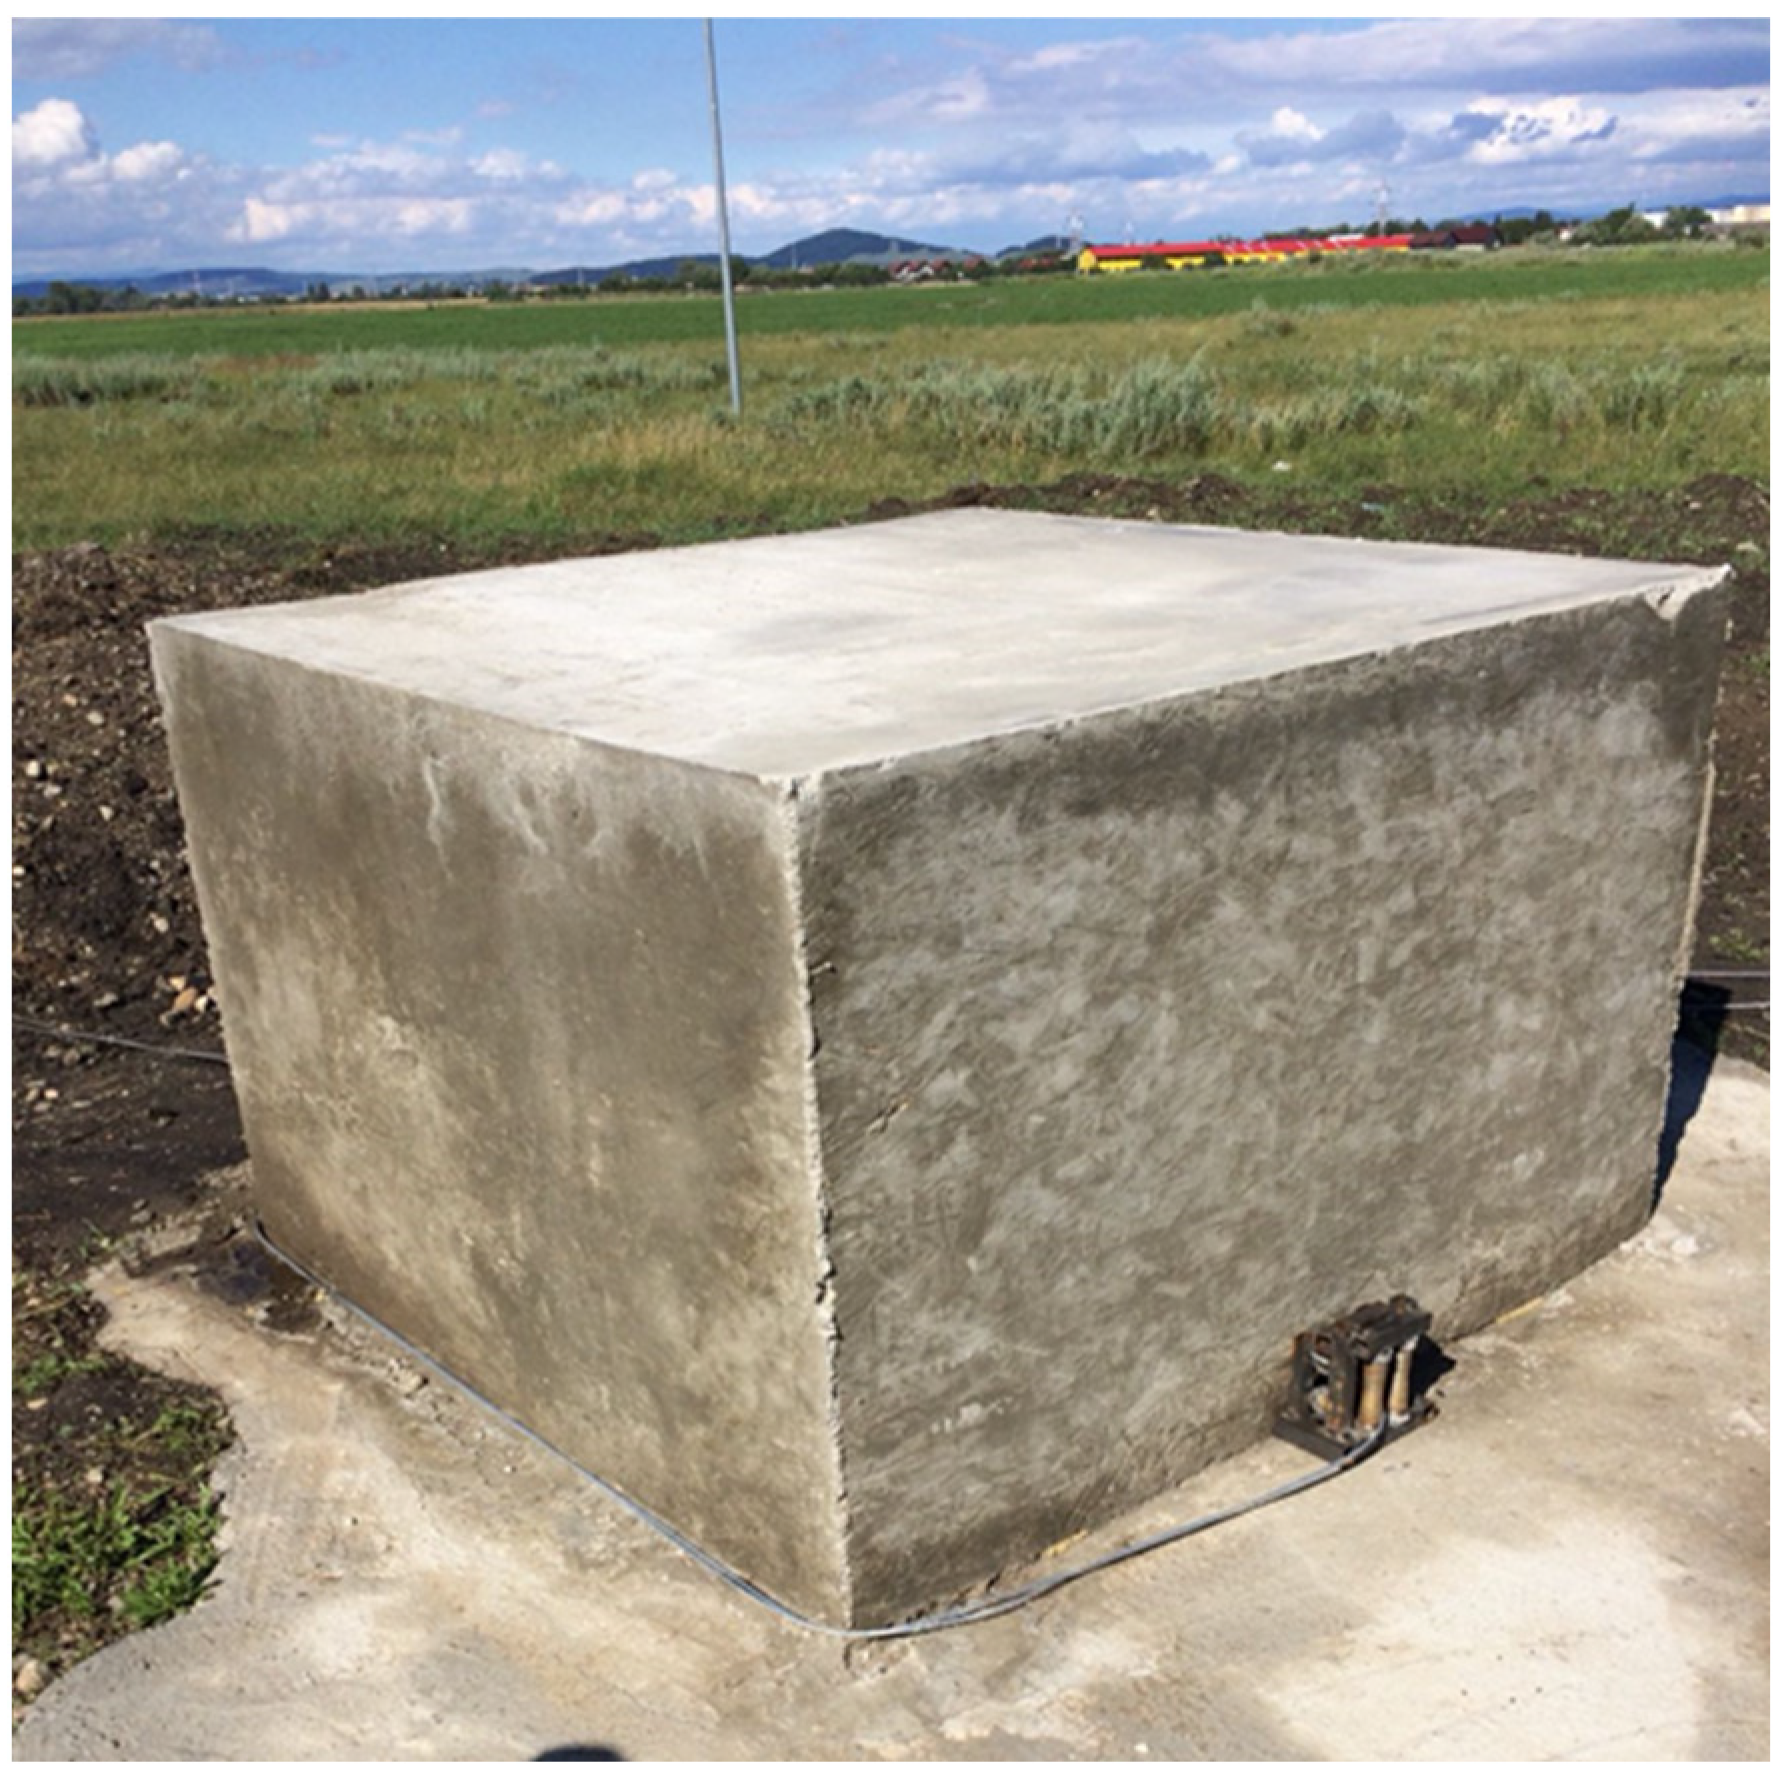
The rigid barrier is shown in Figure 14.
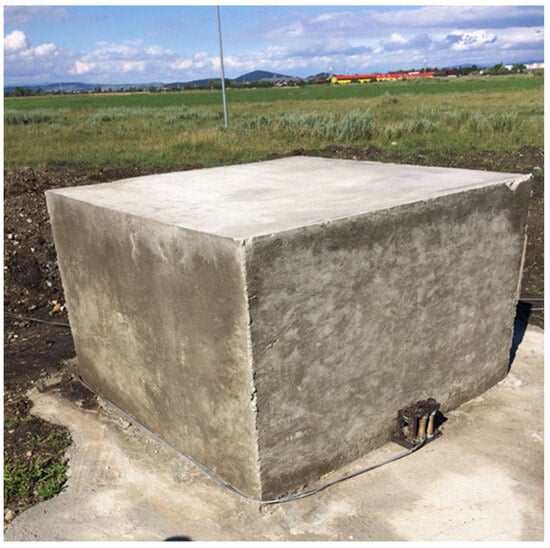
Figure 14.
The rigid barrier.
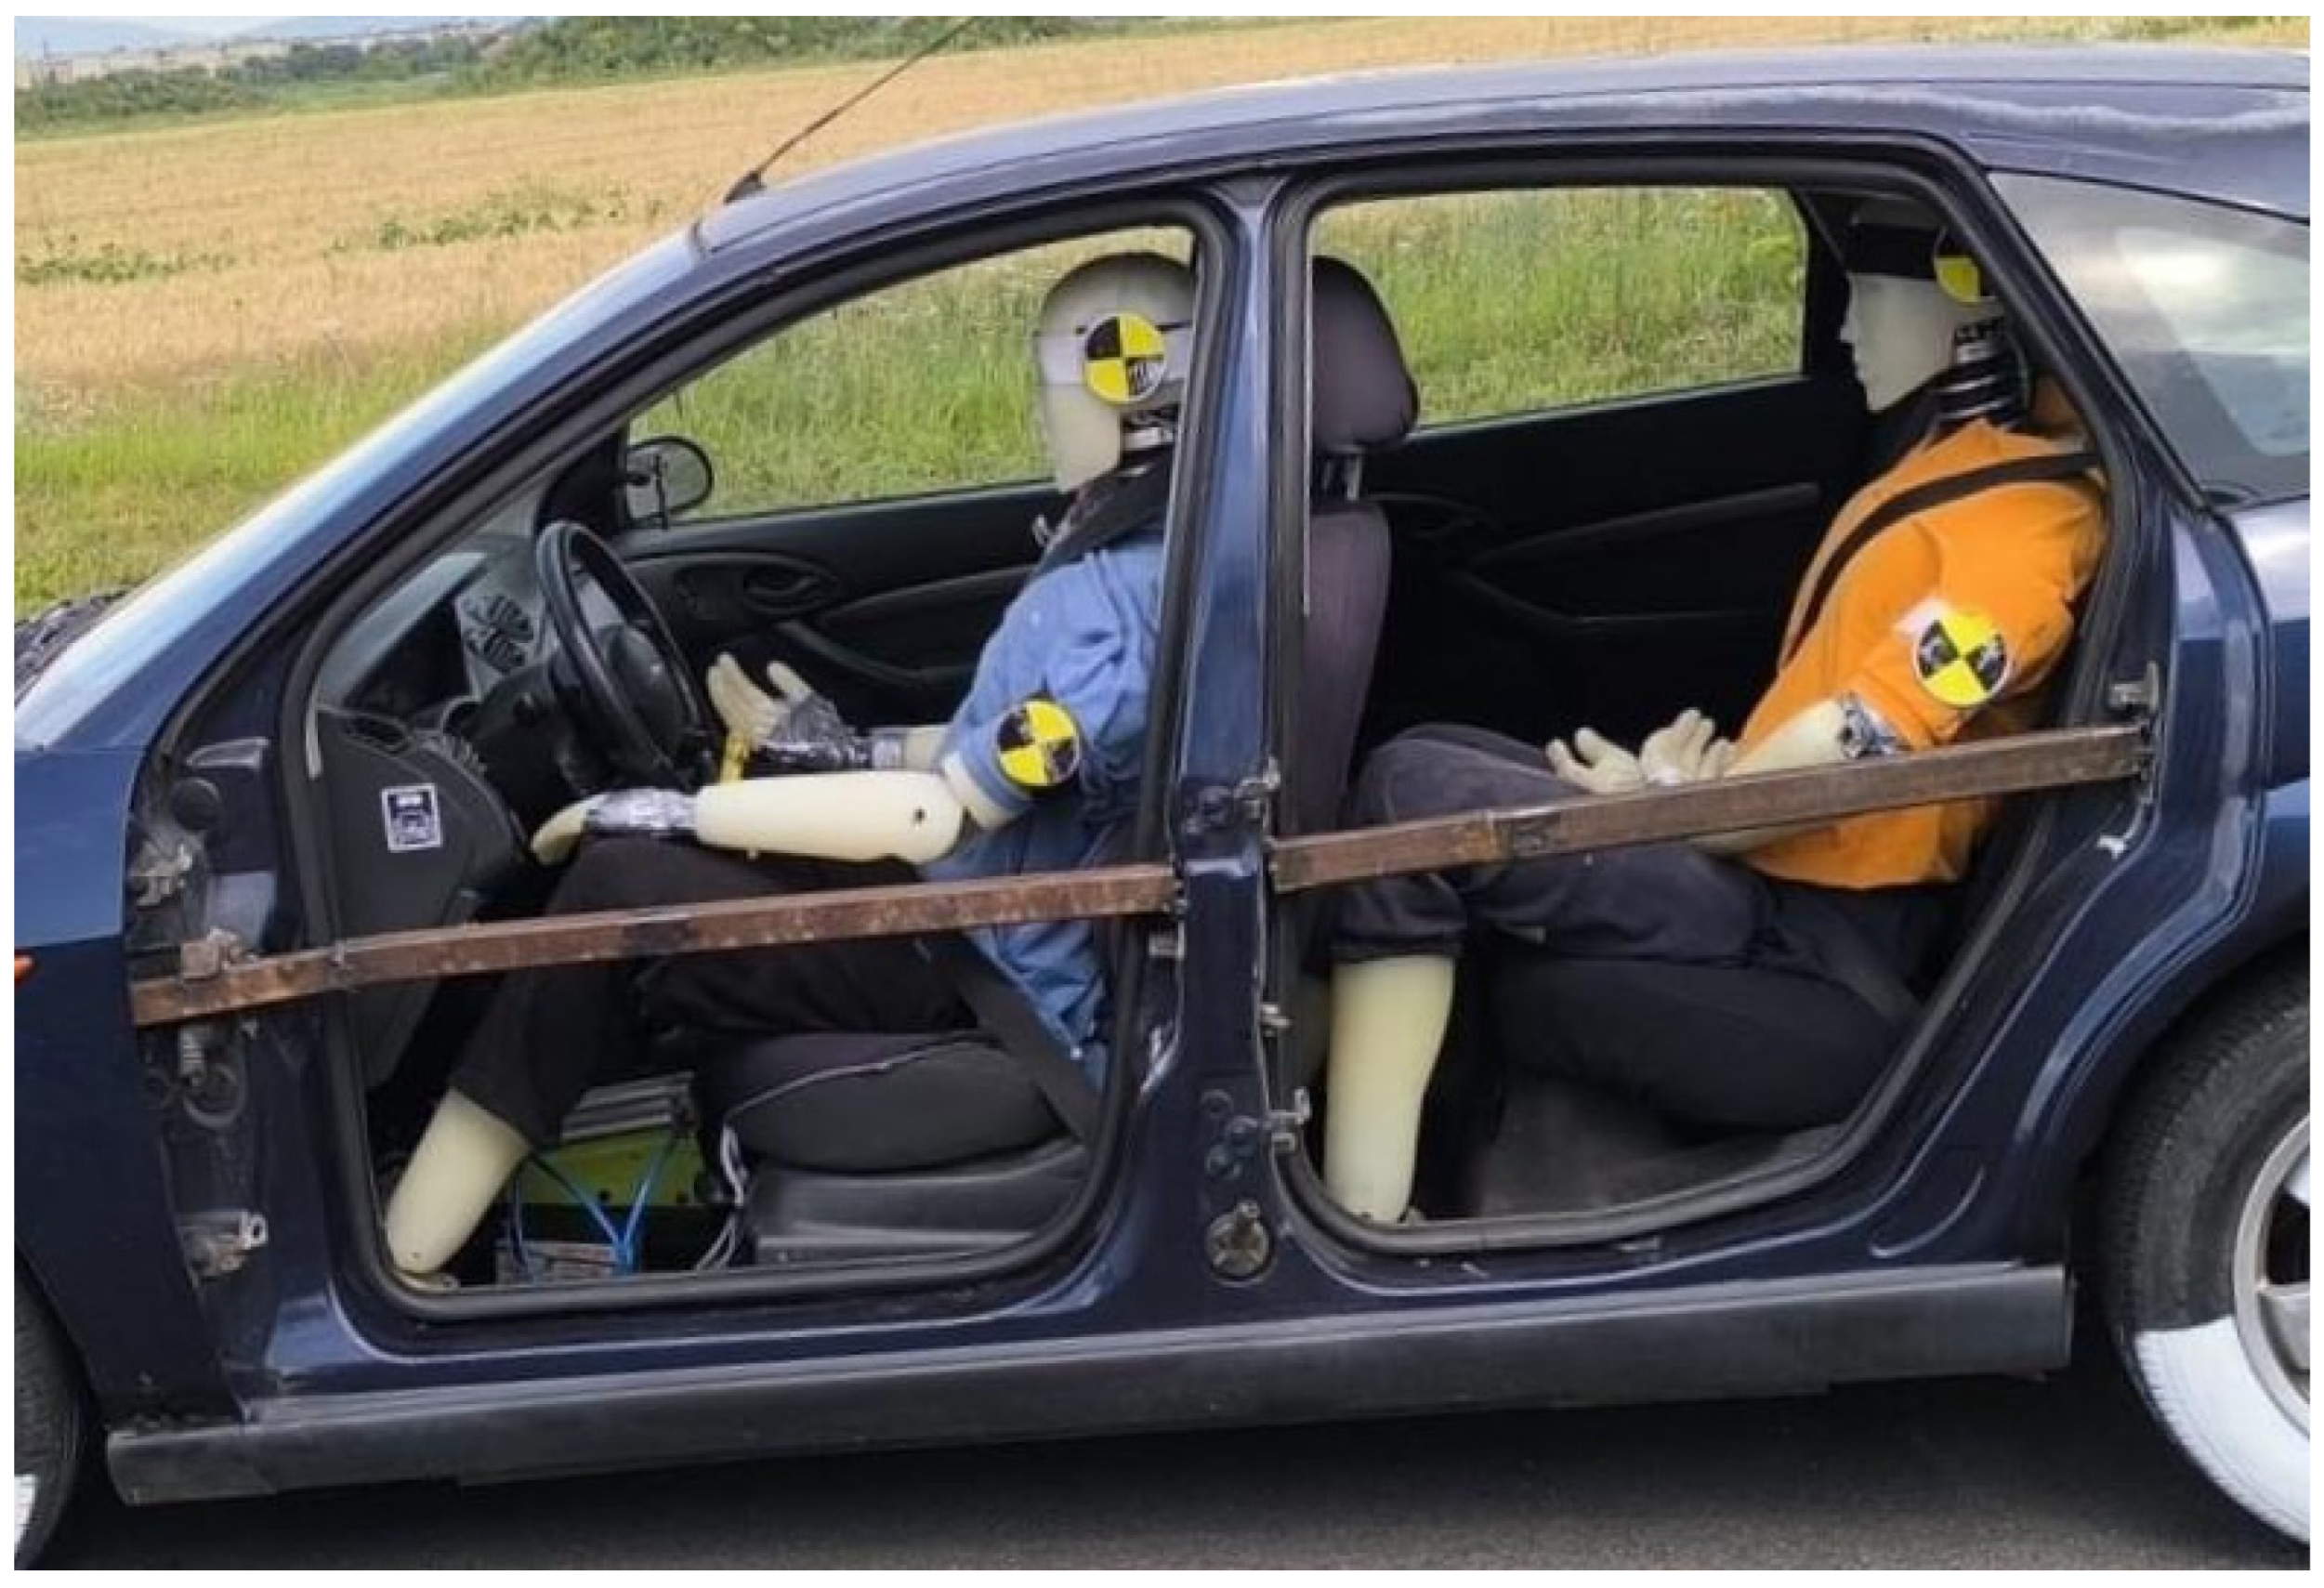
The brake system was installed sequentially, by installing the pneumatic cylinder for brake actuation on the front floor of the vehicle on the left side. The system installation was performed similarly for both vehicles. The acceleration parameters of the occupants were acquired with the PicDAQ 5 data acquisition platform. The dummies were positioned as in Figure 15.
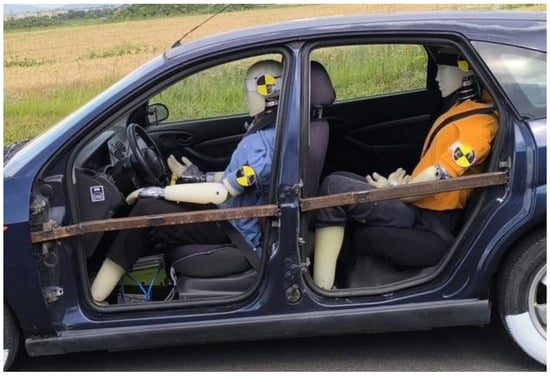
Figure 15.
Positioning the dummies in the vehicle without damping.
The vehicle moved forward, with two dummies installed, in the driver’s seat and the rear passenger’s seat, respectively. The dummies were equipped with three-point seat belts, and the vehicle was equipped with an airbag. The impact angle was 0°, and the collision speed was approx. 42 km/h. The vehicle was launched by a towing system. The impact was triggered at a speed of approx. 42 km/h, simulating a real accident scenario. The mass point A that will determine the variation in the displacement with respect to time will be applied to the circular reference at the front of the vehicle, thus determining the collision speed of the vehicle. Similarly, the mass points B and C, corresponding to the head and chest of the dummy positioned in the driver’s seat, will be used to analyze the variation in their speeds during the collision. Analogously, the mass points D and E, related to the rear passenger, will be defined to follow the dynamics of the dummy’s movement with respect to time, determining the specific speeds and contributing to a more detailed assessment of the biomechanical behavior of the occupants (Figure 16).
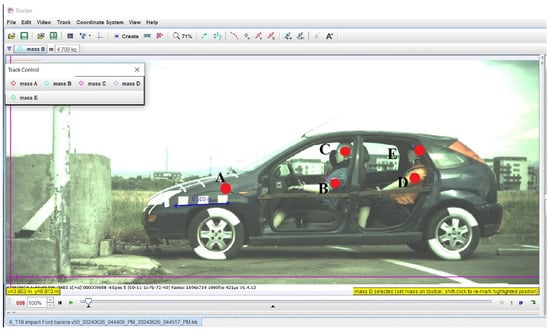
Figure 16.
Distribution of points where measurements were made.
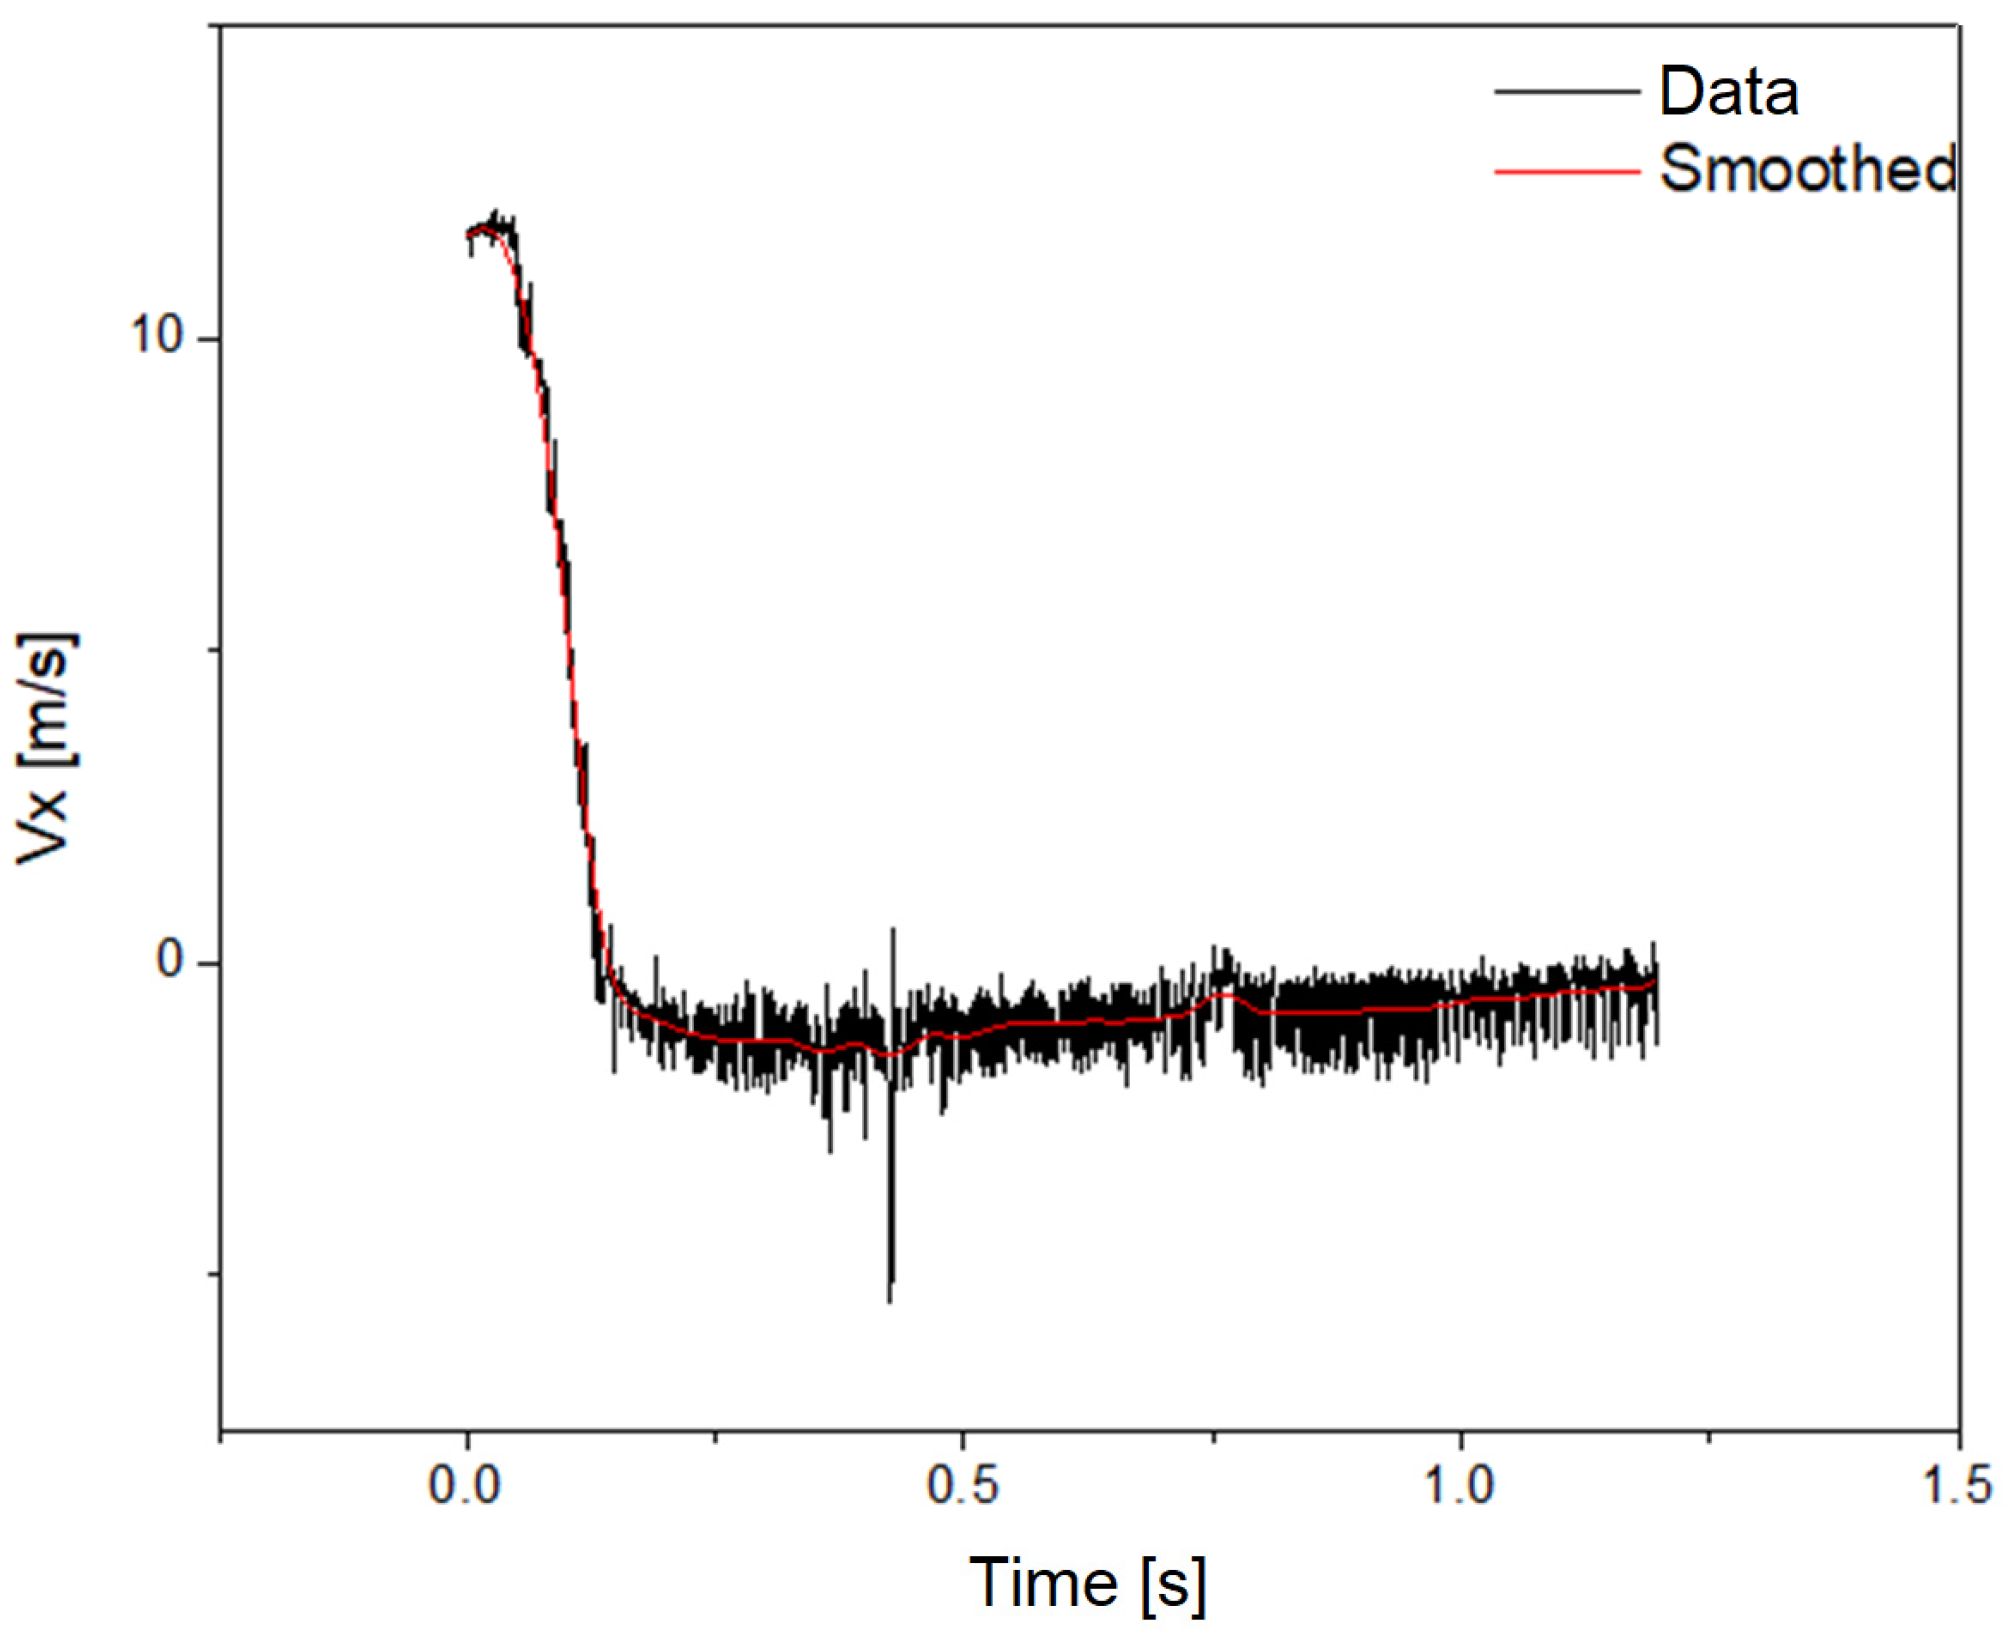
The calculated speed parameter is further processed using the Origin application. The corresponding speed values along the X axis are important; therefore, the vehicle speed along the Y axis was neglected. The raw data were filtered using an FFT filter. The speed parameter along the X axis was processed using the Origin 2020v4 software application, with an FFT filter (Figure 17).
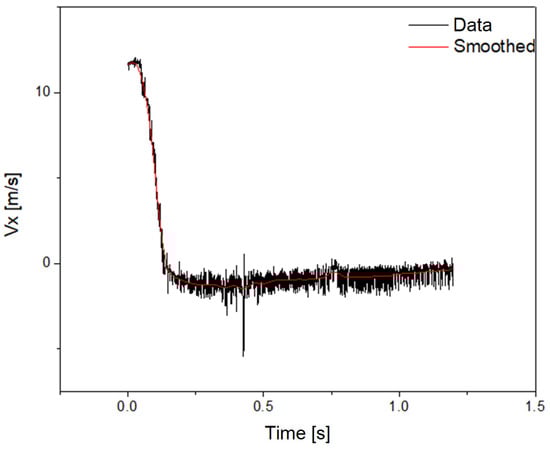
Figure 17.
The graph overlaying measured speeds with filtered speeds.
The speed before the collision, in the case of the vehicle with damping, was 11.74440 m/s ≅ 42.28 km/h. The speed parameter was processed in Origin and entered into Microsoft Excel, thus generating a graph displaying the variation in speed in relation to time for the vehicle (Figure 18).
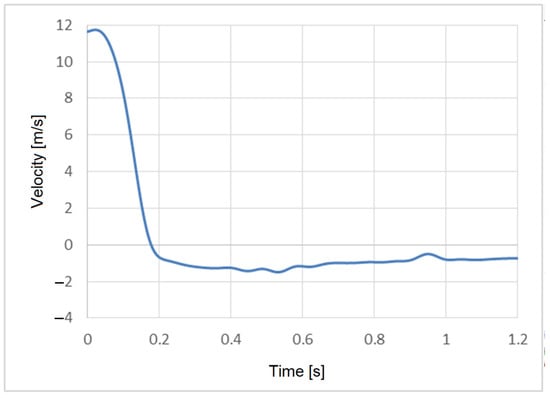
Figure 18.
Vehicle speed variation with an IA.
Similarly, head and chest velocities were analyzed for the driver and rear passenger, taking into account the main direction of movement (on the X axis).

Figure 19.
Pre-impact phase.
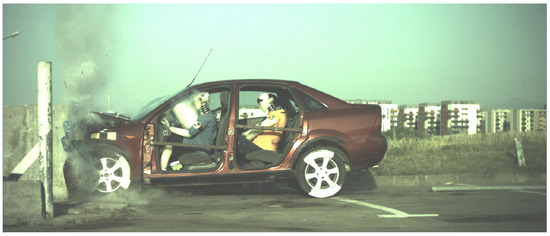
Figure 20.
Impact phase.
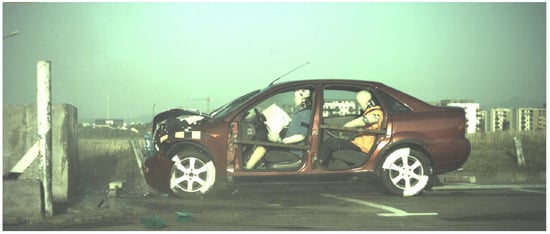
Figure 21.
Post-impact phase.
Rigorous implementation of a test program ensures that vehicles are subjected to detailed and accurate assessments, reflecting real frontal impact scenarios. Through careful verification and calibration of equipment, meticulous preparation of vehicles, and correct simulation of occupants, essential data for improving automotive safety are obtained. The results of these tests significantly contribute to the development and optimization of protective systems, having a direct impact on increasing road safety for all road users.
The described accidentology experiment provides a detailed and accurate understanding of the behavior of vehicles and occupants during a collision. Rigorous preparation procedures, including checking the straight-line trajectory and using the braking system in the preliminary test, ensured controlled and reproducible test conditions.
Within the experimental research methodology, procedures were essential for eliminating uncontrolled variables and reducing the risk of errors. Creating controlled and reproducible test conditions is the foundation on which subsequent analyses will be based. These preliminary measures ensured that the experiment was carried out according to plan, allowing the obtention of reliable data that will contribute to the detailed understanding of the phenomena studied.
Acceleration data were filtered according to the SAE J211-1 [58]: CFC 60 was applied for the vehicle, CFC 1000 for head acceleration, and CFC 180 for thorax acceleration.
Thus, this section emphasizes the need for a rigorous methodology in experimental research, highlighting the preparatory stages as fundamental for the validity and success of the entire experiment.
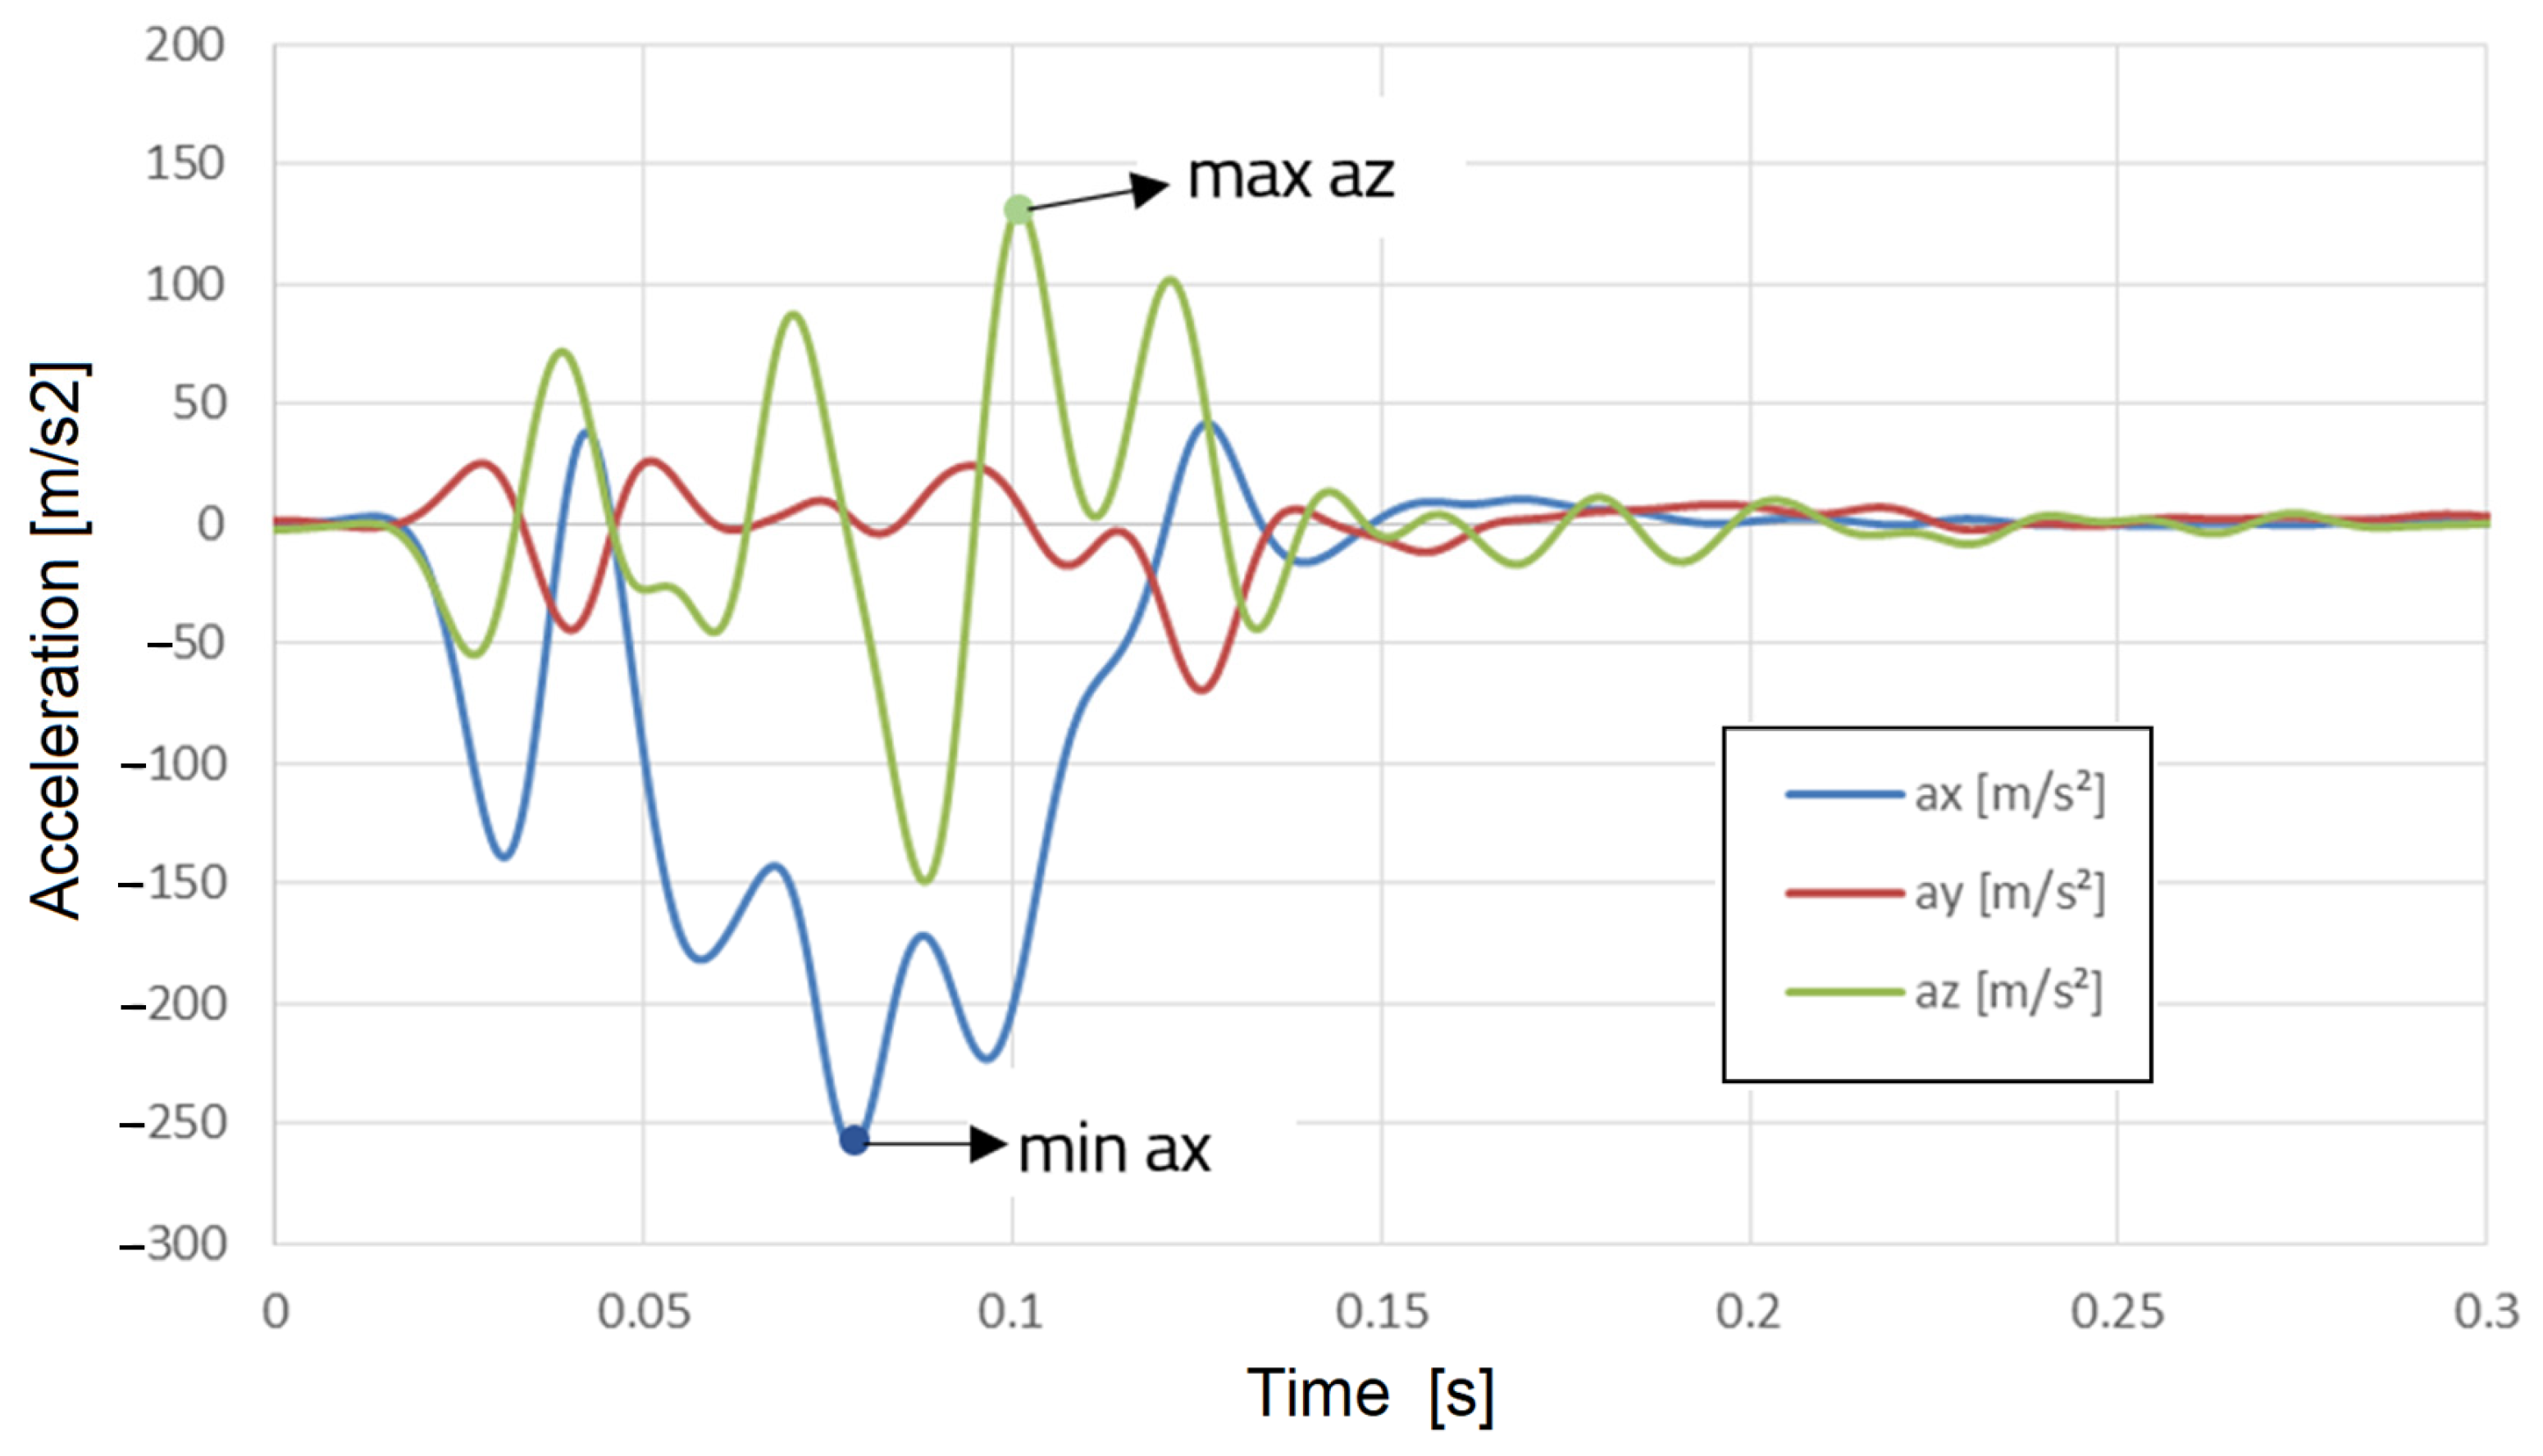
Figure 22.
Accelerations of point A in the three directions X, Y, and Z.
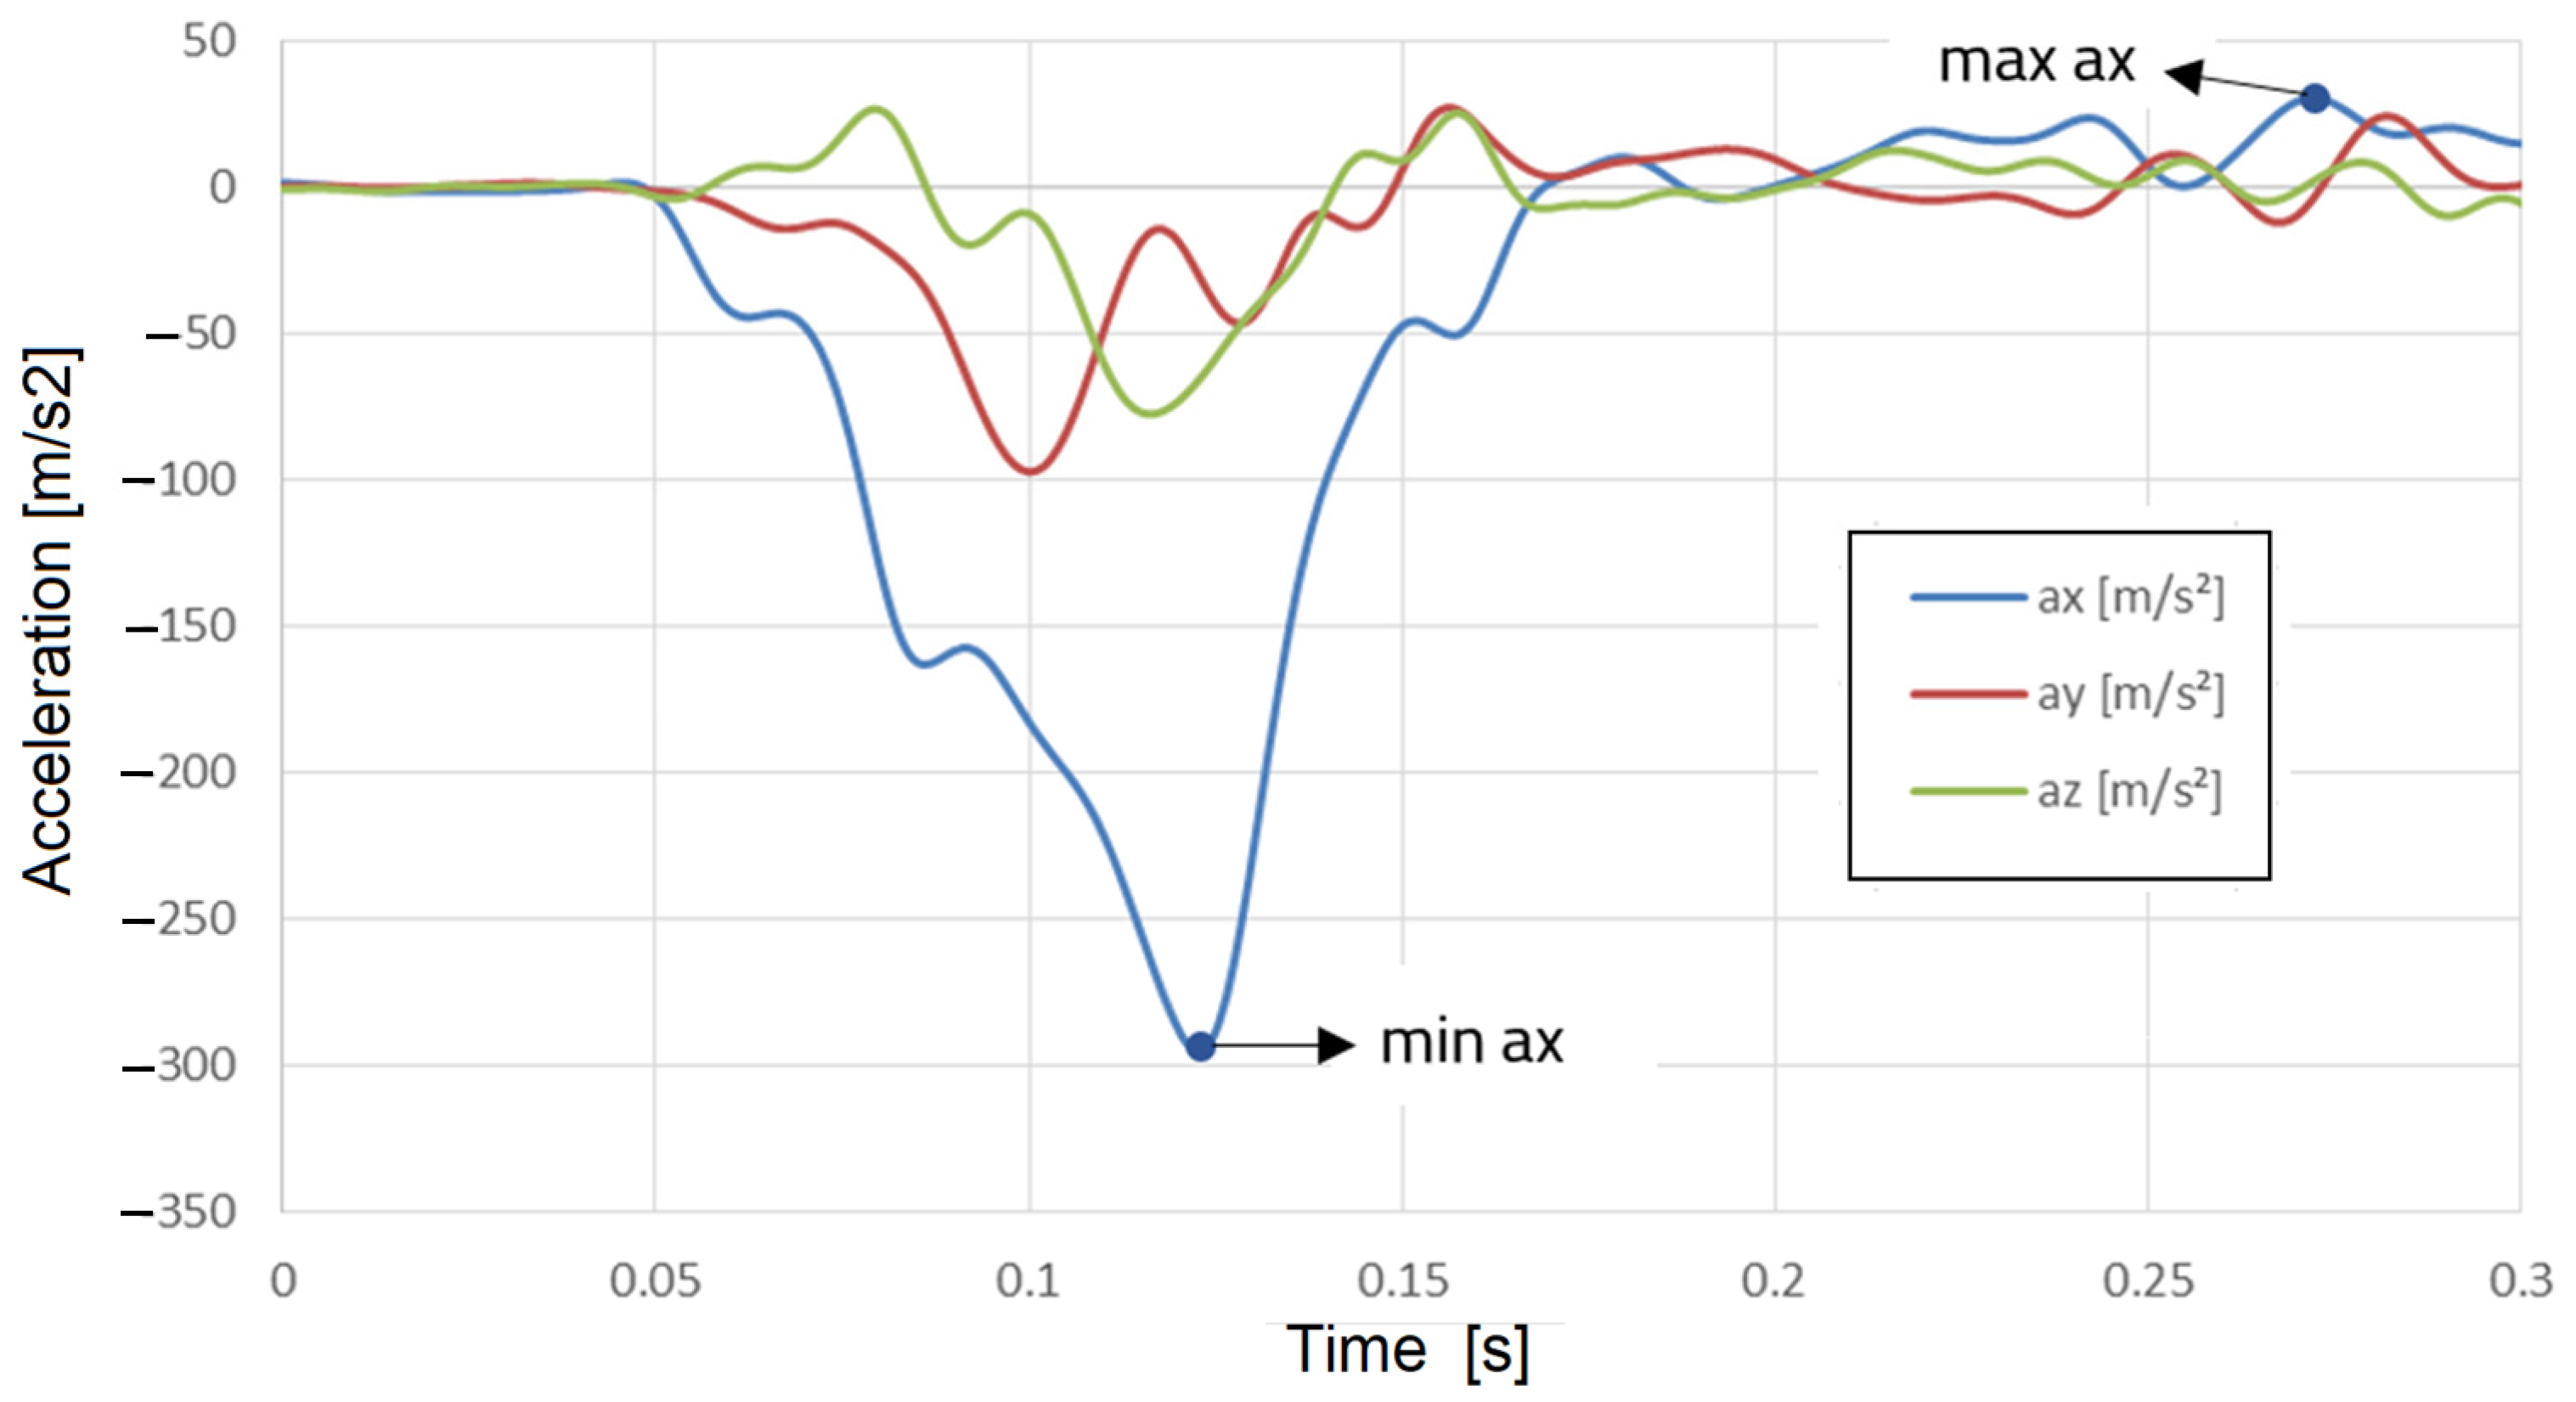
Figure 23.
Acceleration of the head (point C) in the three directions X, Y, and Z.
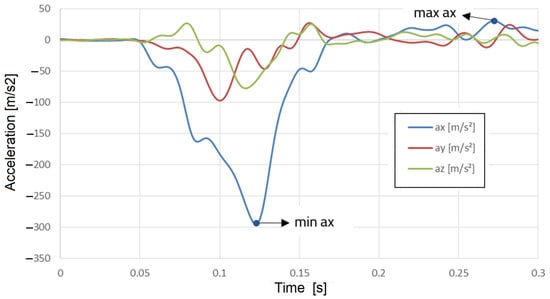
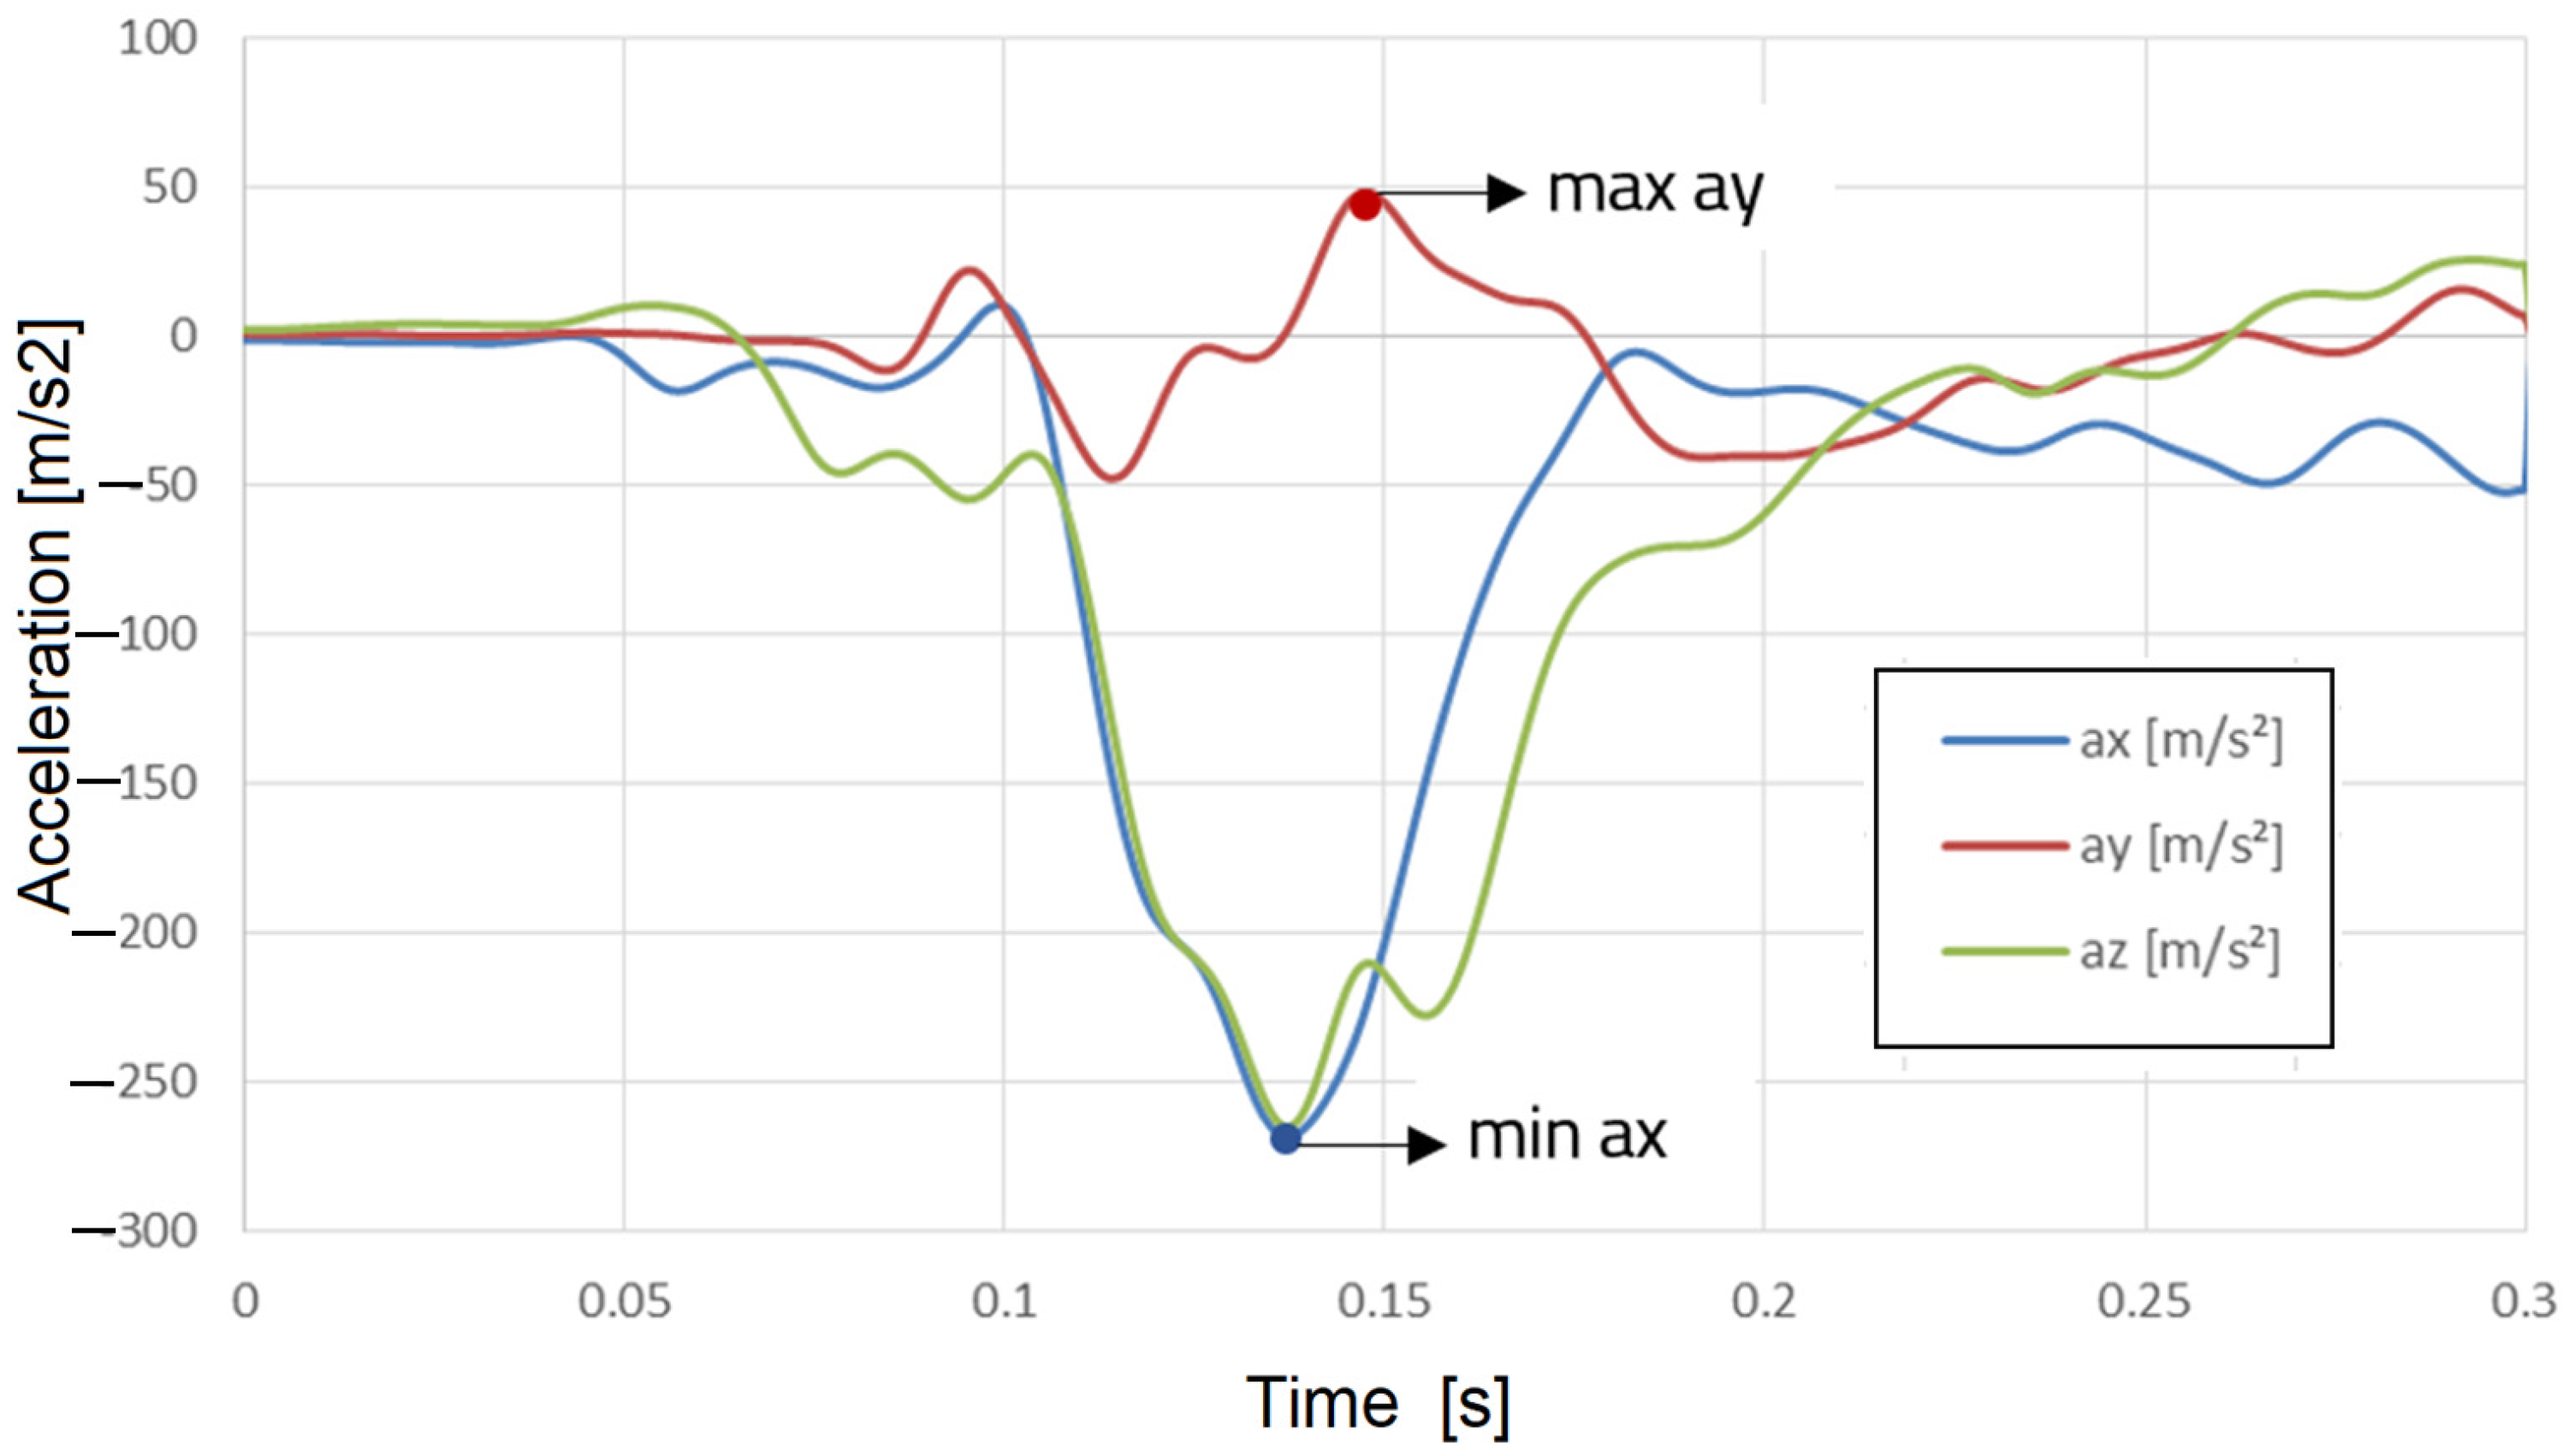
Figure 24.
Acceleration of the thorax (point B) in the three directions X, Y, and Z.
A comparison between the studied cases are presented in Table 1.

Table 1.
Comparison between the accelerations.
4. Discussion
The assessment of occupant safety in the event of a frontal impact is important for the development of modern vehicles. In this context, injury criteria such as the Head Injury Criterion (HIC) and the Thorax Acceptability Criterion (ThAC) are used to quantify the risk of severe head and thorax injuries during a crash or in an experimental test simulating a crash. These criteria provide information on the effectiveness of the safety systems (e.g., airbag and three-point seat belt) and the shock absorption systems (e.g., bumper) in protecting the vehicle occupants.
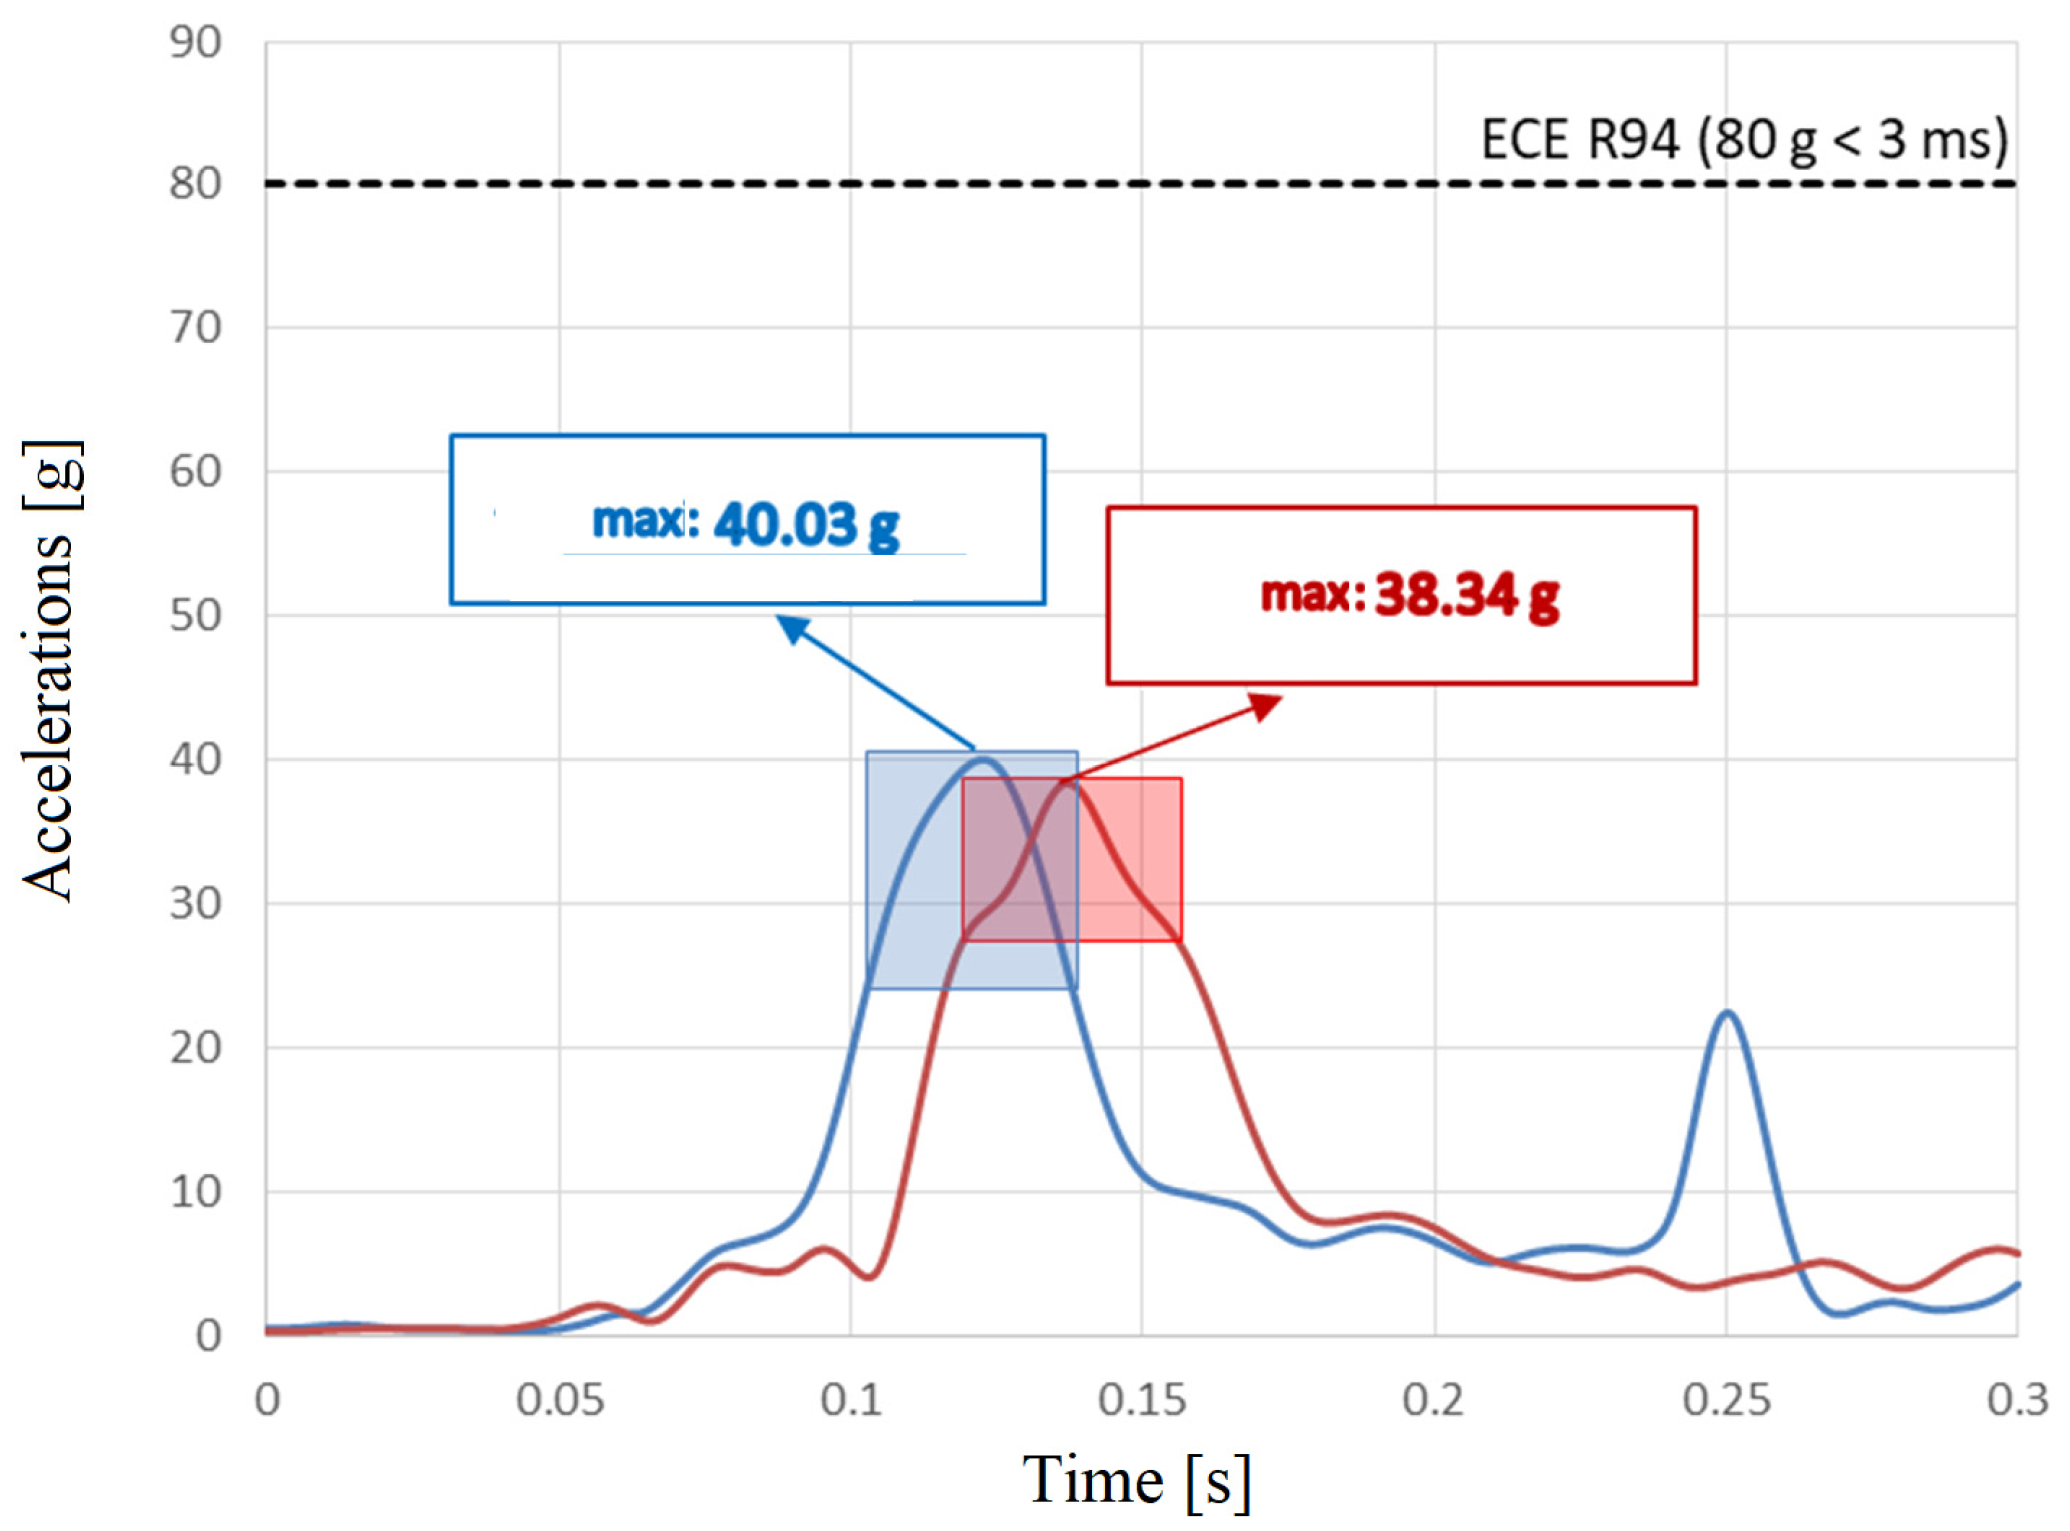
HIC 36 is a critical indicator for assessing the risk of head injuries calculated in a 36 ms range. In Figure 25, the variations in acceleration measured at the driver’s head for the two experimental tests (max. 40.03 g for test 1 and 38.34 g for test 2) are illustrated, which do not exceed the limit of 80 g for a duration of 3 ms according to UNECE R94. The 36 ms range is marked on the diagrams.
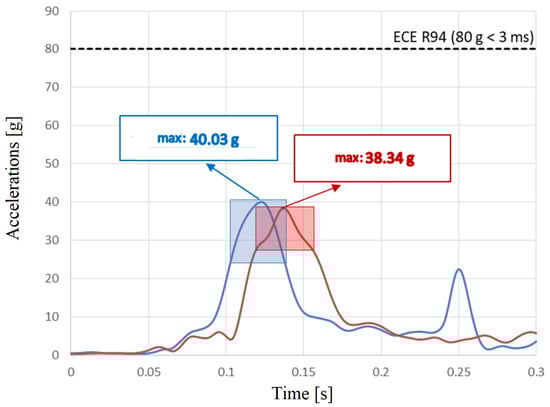
Figure 25.
Head acceleration (driver).
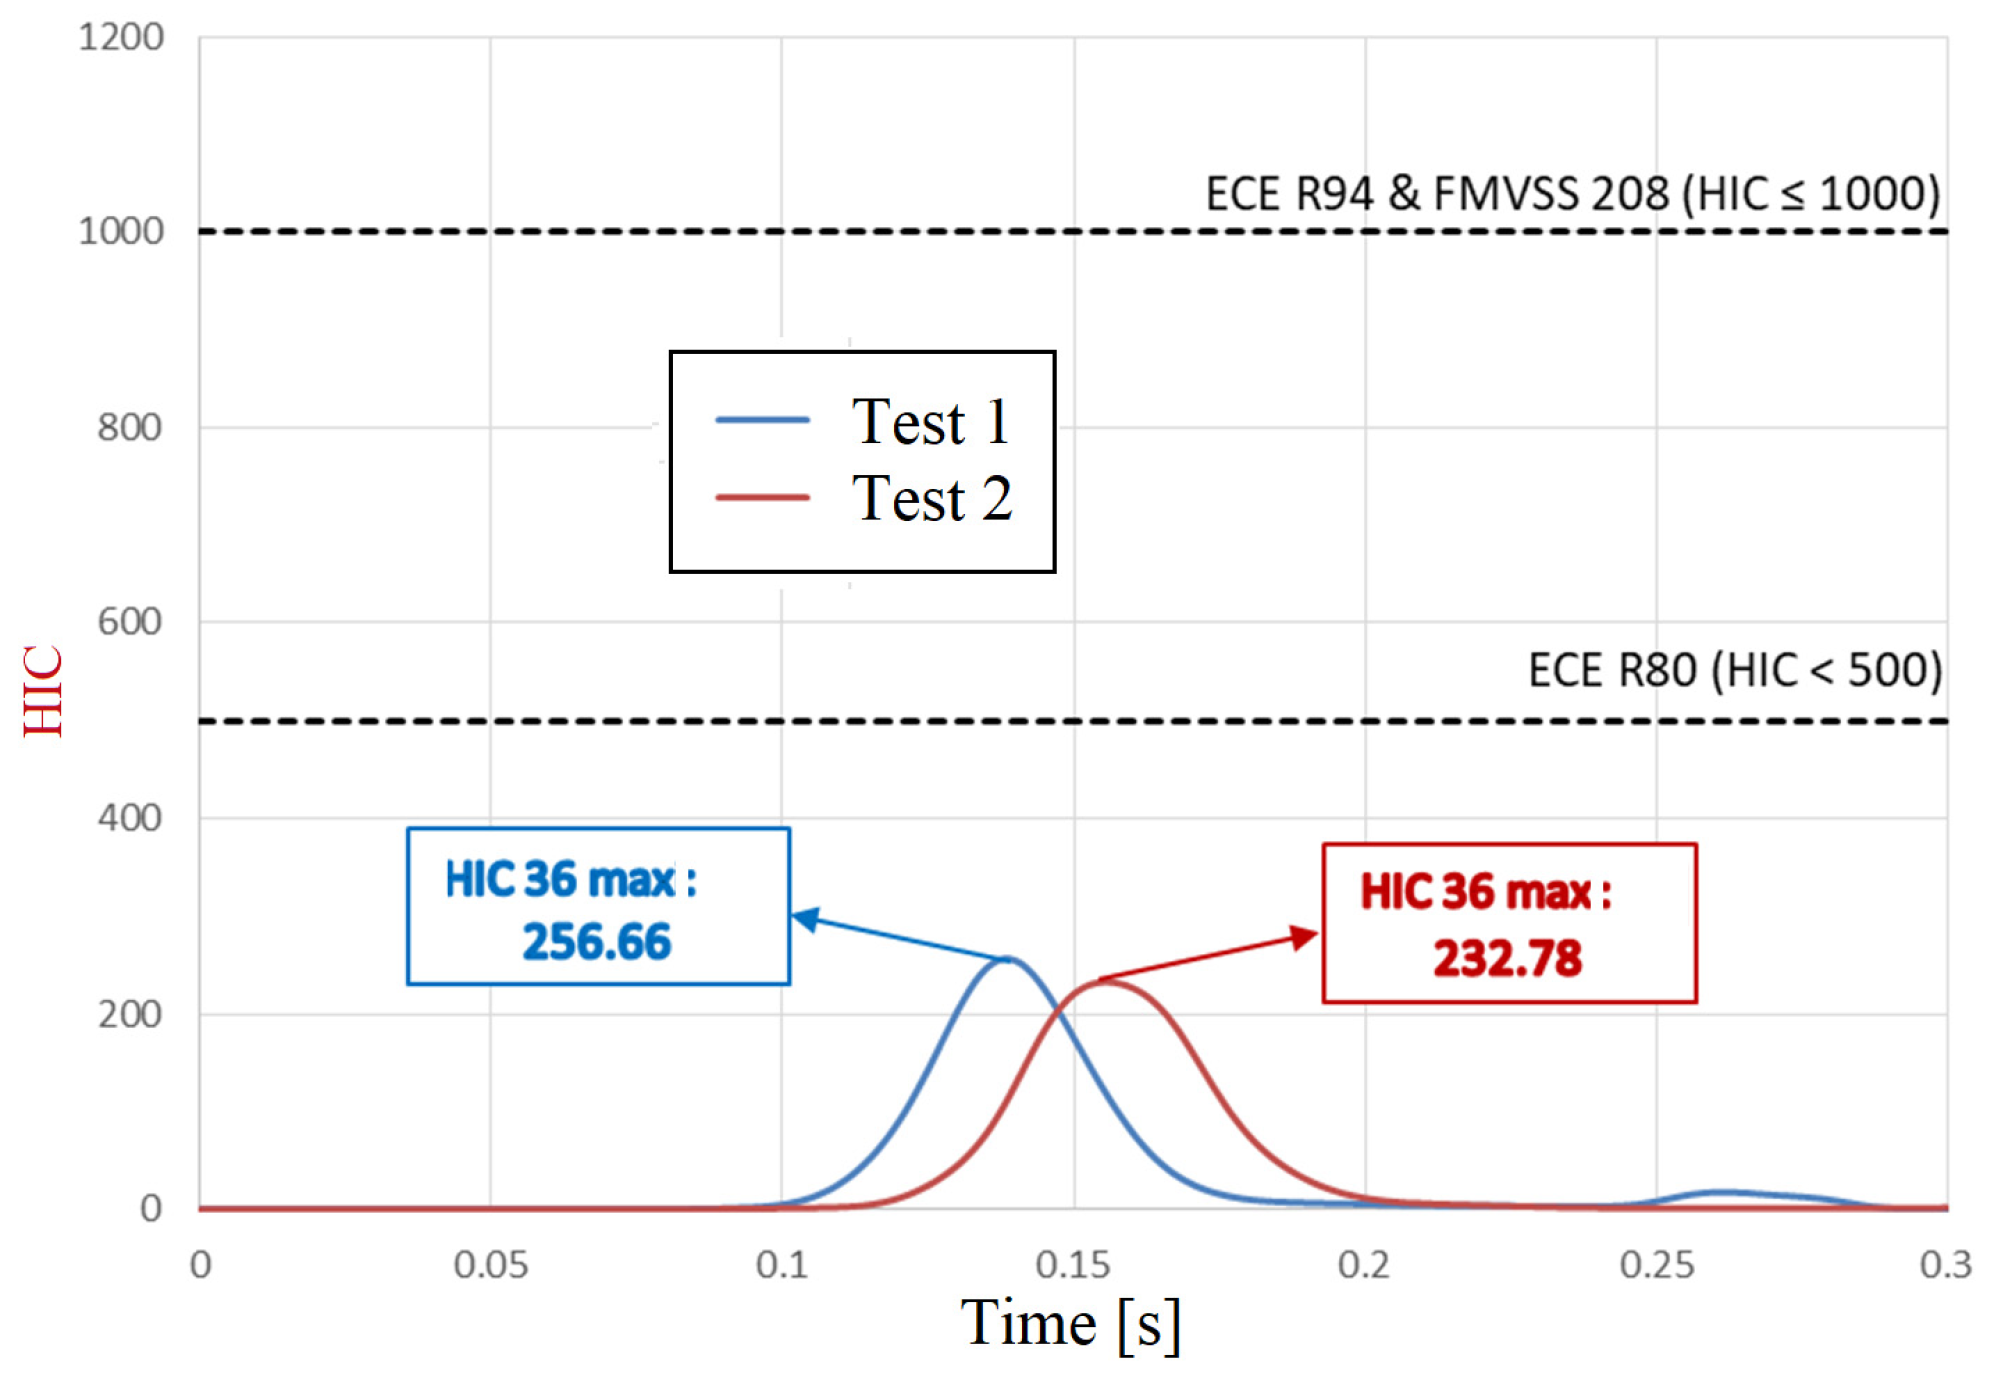
Figure 26 shows the evolution of HIC 36 over time for the driver. The maximum values obtained (256.66 for test 1 and 232.78 for test 2) comply with both the UNECE R80 requirements (HIC < 500) and the upper limits imposed by UNECE R94 and FMVSS 208 (HIC ≤ 1000).

Figure 26.
Evolution of HIC 36 over time for the driver.
In Figure 27, the resulting accelerations at the head of the dummy (passenger) are shown, including maximum values of 52.72 g for test 1 and 38.45 g for test 2. These are below the 80 g limit specified by UNECE R94. The 36 ms time domain, relevant for the HIC calculation, is highlighted in the same graph.
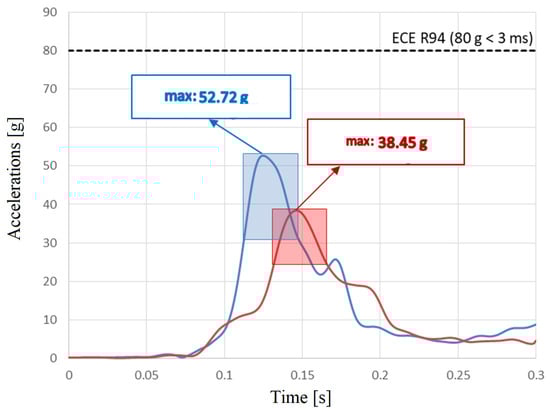
Figure 27.
Head acceleration (passenger).
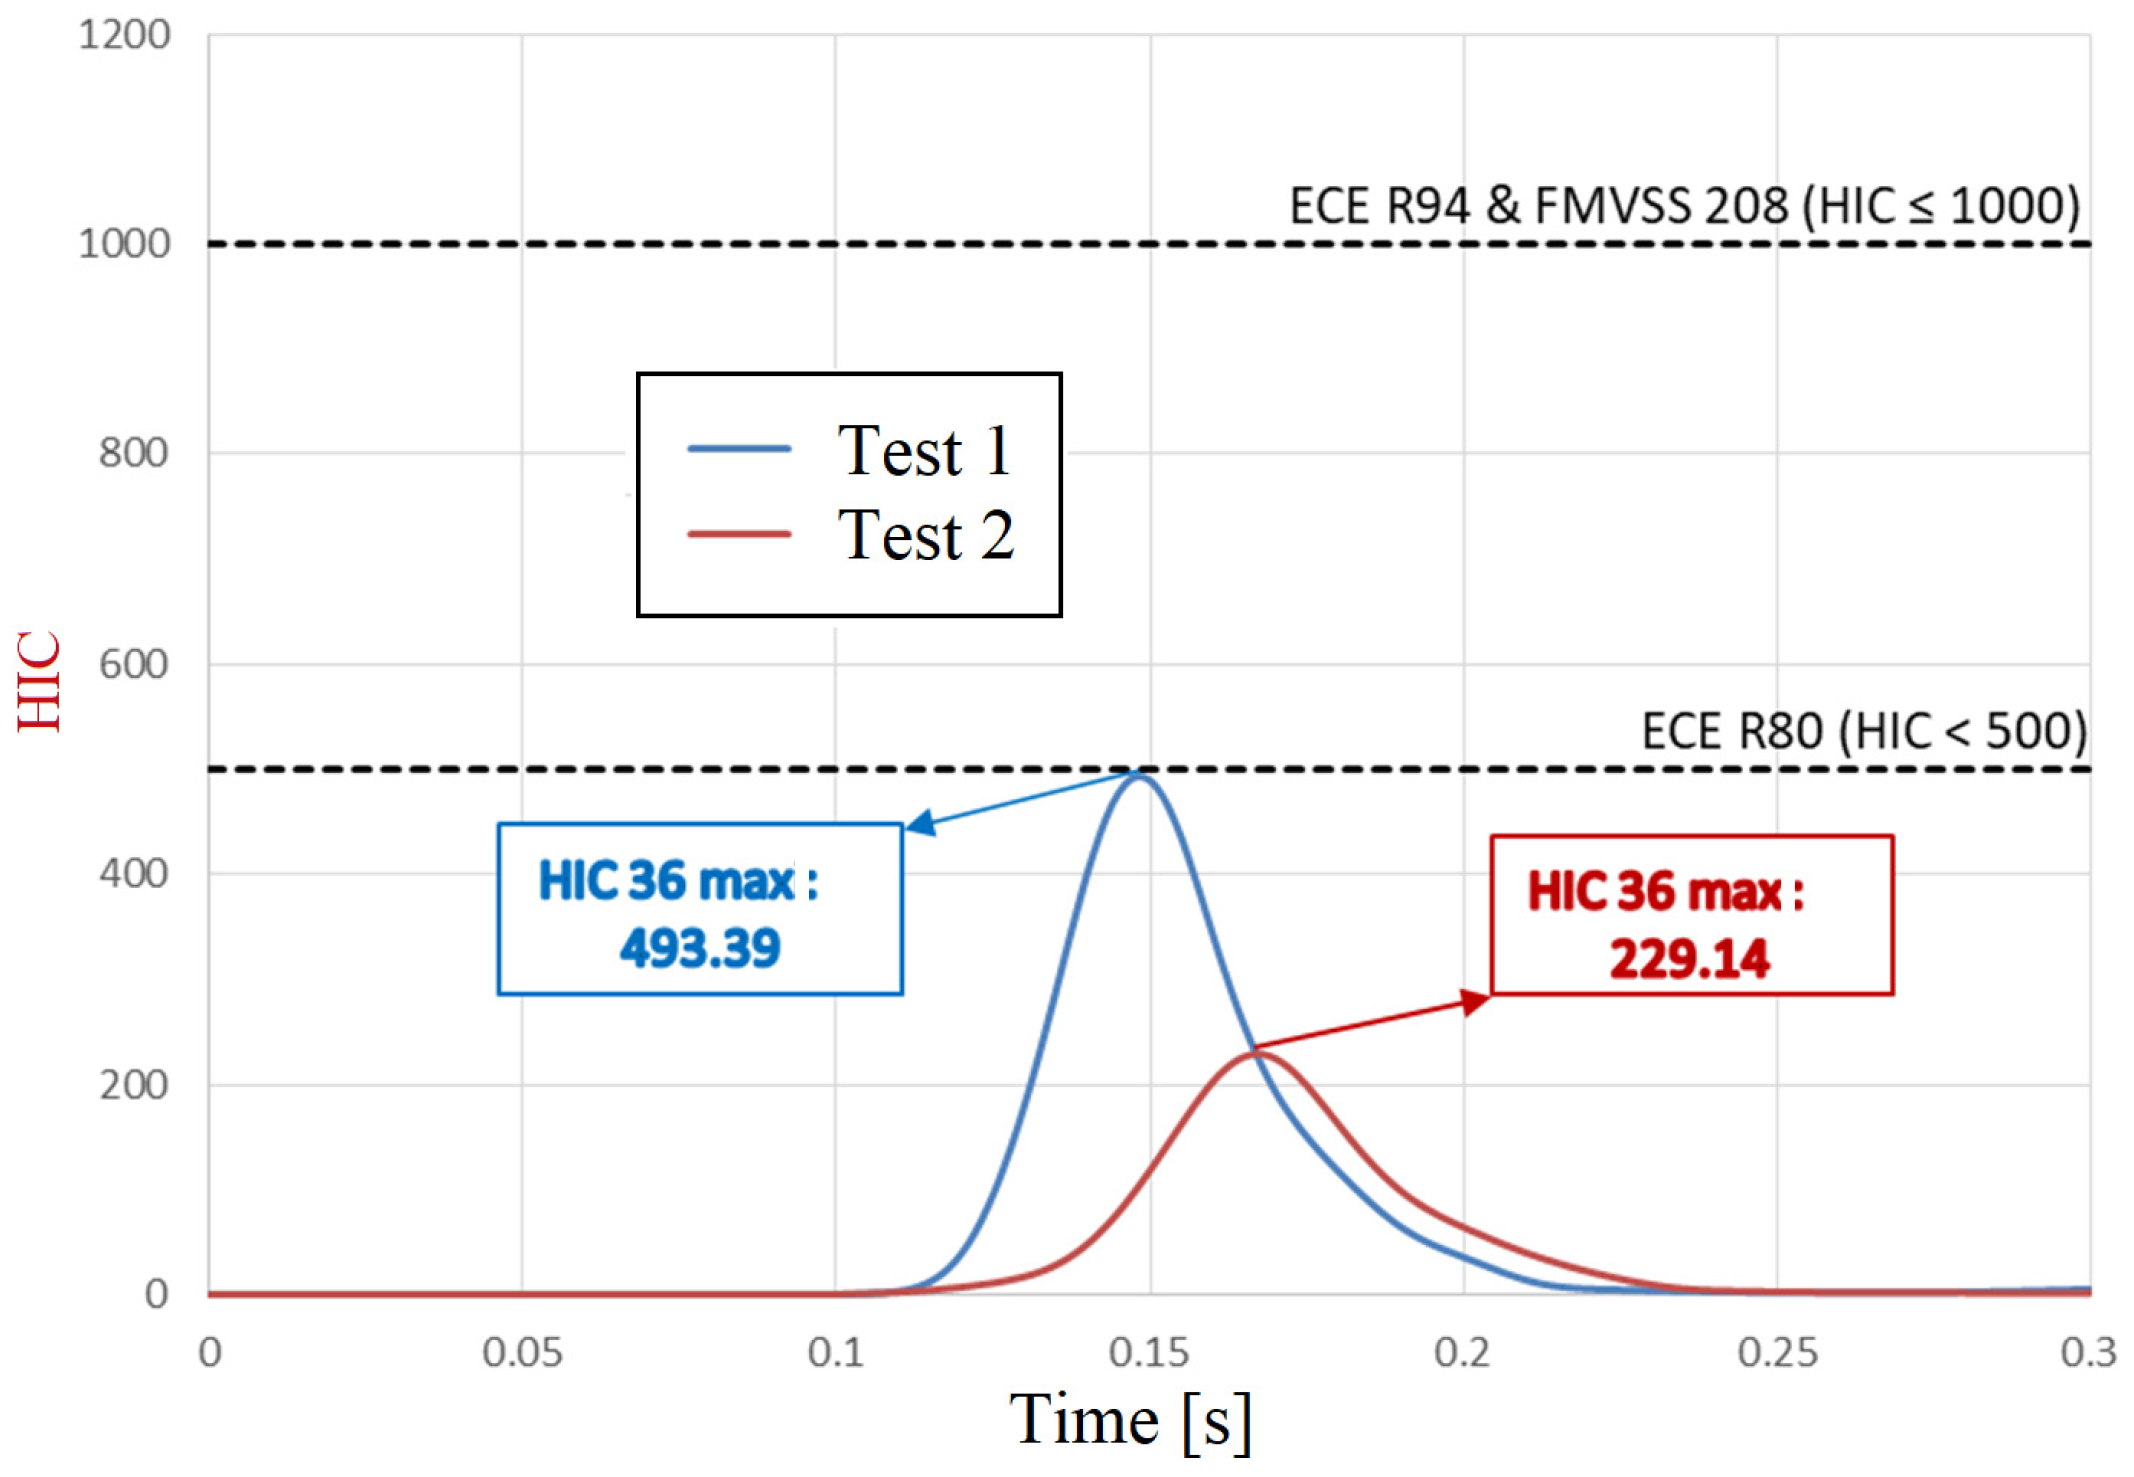
In the case of the passenger, the HIC 36 evolution graph, shown in Figure 28, highlights the maximum values of the HIC criterion (493.39 for test 1 and 229.14 for test 2). Compliance with the biomechanical limits is confirmed by the fact that the calculated values are below 500 according to UNECE R80 and do not exceed 1000, in accordance with UNECE R94 and FMVSS 208.
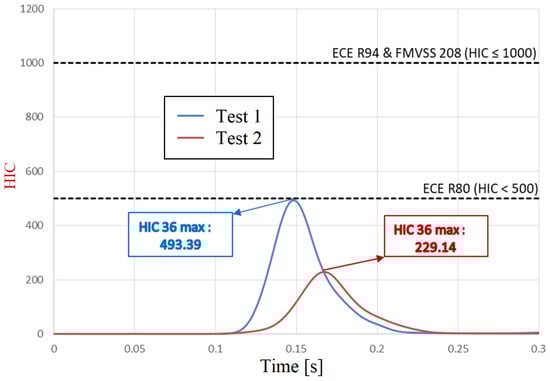
Figure 28.
Evolution of HIC 36 over time for the passenger.
In the vehicle equipped with the damping system, the HIC 36 value was slightly reduced for the driver (from 256.66 to 232.78) and significantly reduced for the rear passenger (from 493.39 to 229.14). The reduction was more pronounced for the passenger, who benefited from additional protection due to his more remote location in the vehicle during the experiment. The decrease in the risk of injury for the rear passenger, in terms of the HIC 36 values, demonstrates that the damping system is effective in protecting passengers in the rear seats of the vehicle. In the other situation, the system reduced the acceleration felt by the driver, and the HIC 36 value (232.78) approached that of the criterion calculated for the passenger (229.14). It follows that the risk of head injuries in the event of a frontal impact is similar for the front seat occupant as for the rear passenger when the vehicle is equipped with an additional cushioning system.
In the case of the driver, the values obtained in both experimental tests are correlated with an index between 0 and 1 on the AIS scale, which is associated with no risk or low severity of injuries. For the passenger, positioned in the back seat, in the first test the HIC value can be correlated with an index between 1 and 2, which represents low to moderate severity of injuries, and in the second test the attenuation of injuries due to the cushioning system is significant; the HIC value is correlated with an index between 0 and 1 on the AIS scale. For the driver, the probability of injury is 1.60% in the first test and 1.47% in the second test. In the case of the passenger, the probability of injury is 3.60% for the first test and 1.45% for the second test.
The Thorax Tolerance Criterion (ThAC), which assesses the risk of chest injury based on the acceleration felt and its duration, provided additional data on the effectiveness of the damping system. In this analysis, ThAC was calculated for a three-millisecond range.
Figure 29 shows the acceleration variations as a function of time at the chest level of the dummy positioned in the driver’s seat. The ThAC maximum values (38.02 g for test 1 and 30.92 g for test 2), corresponding to the maximum acceleration at the chest level and the critical ranges in which the resulting acceleration exceeds the 30 g limit, are marked on the graph. The duration of the exceedance is 24 ms for test 1 and 6 ms for test 2.
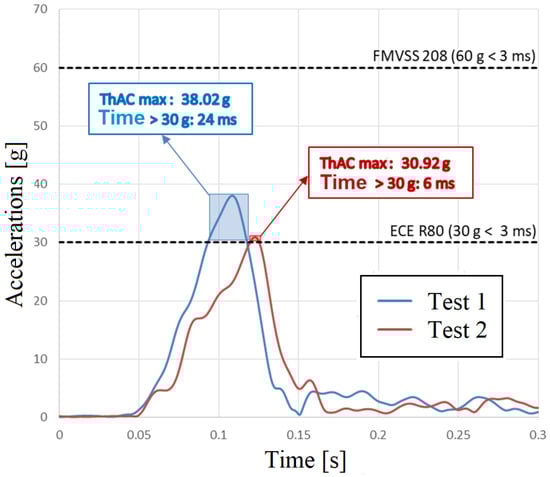
Figure 29.
Measured acceleration at the driver’s chest and ThAC value.
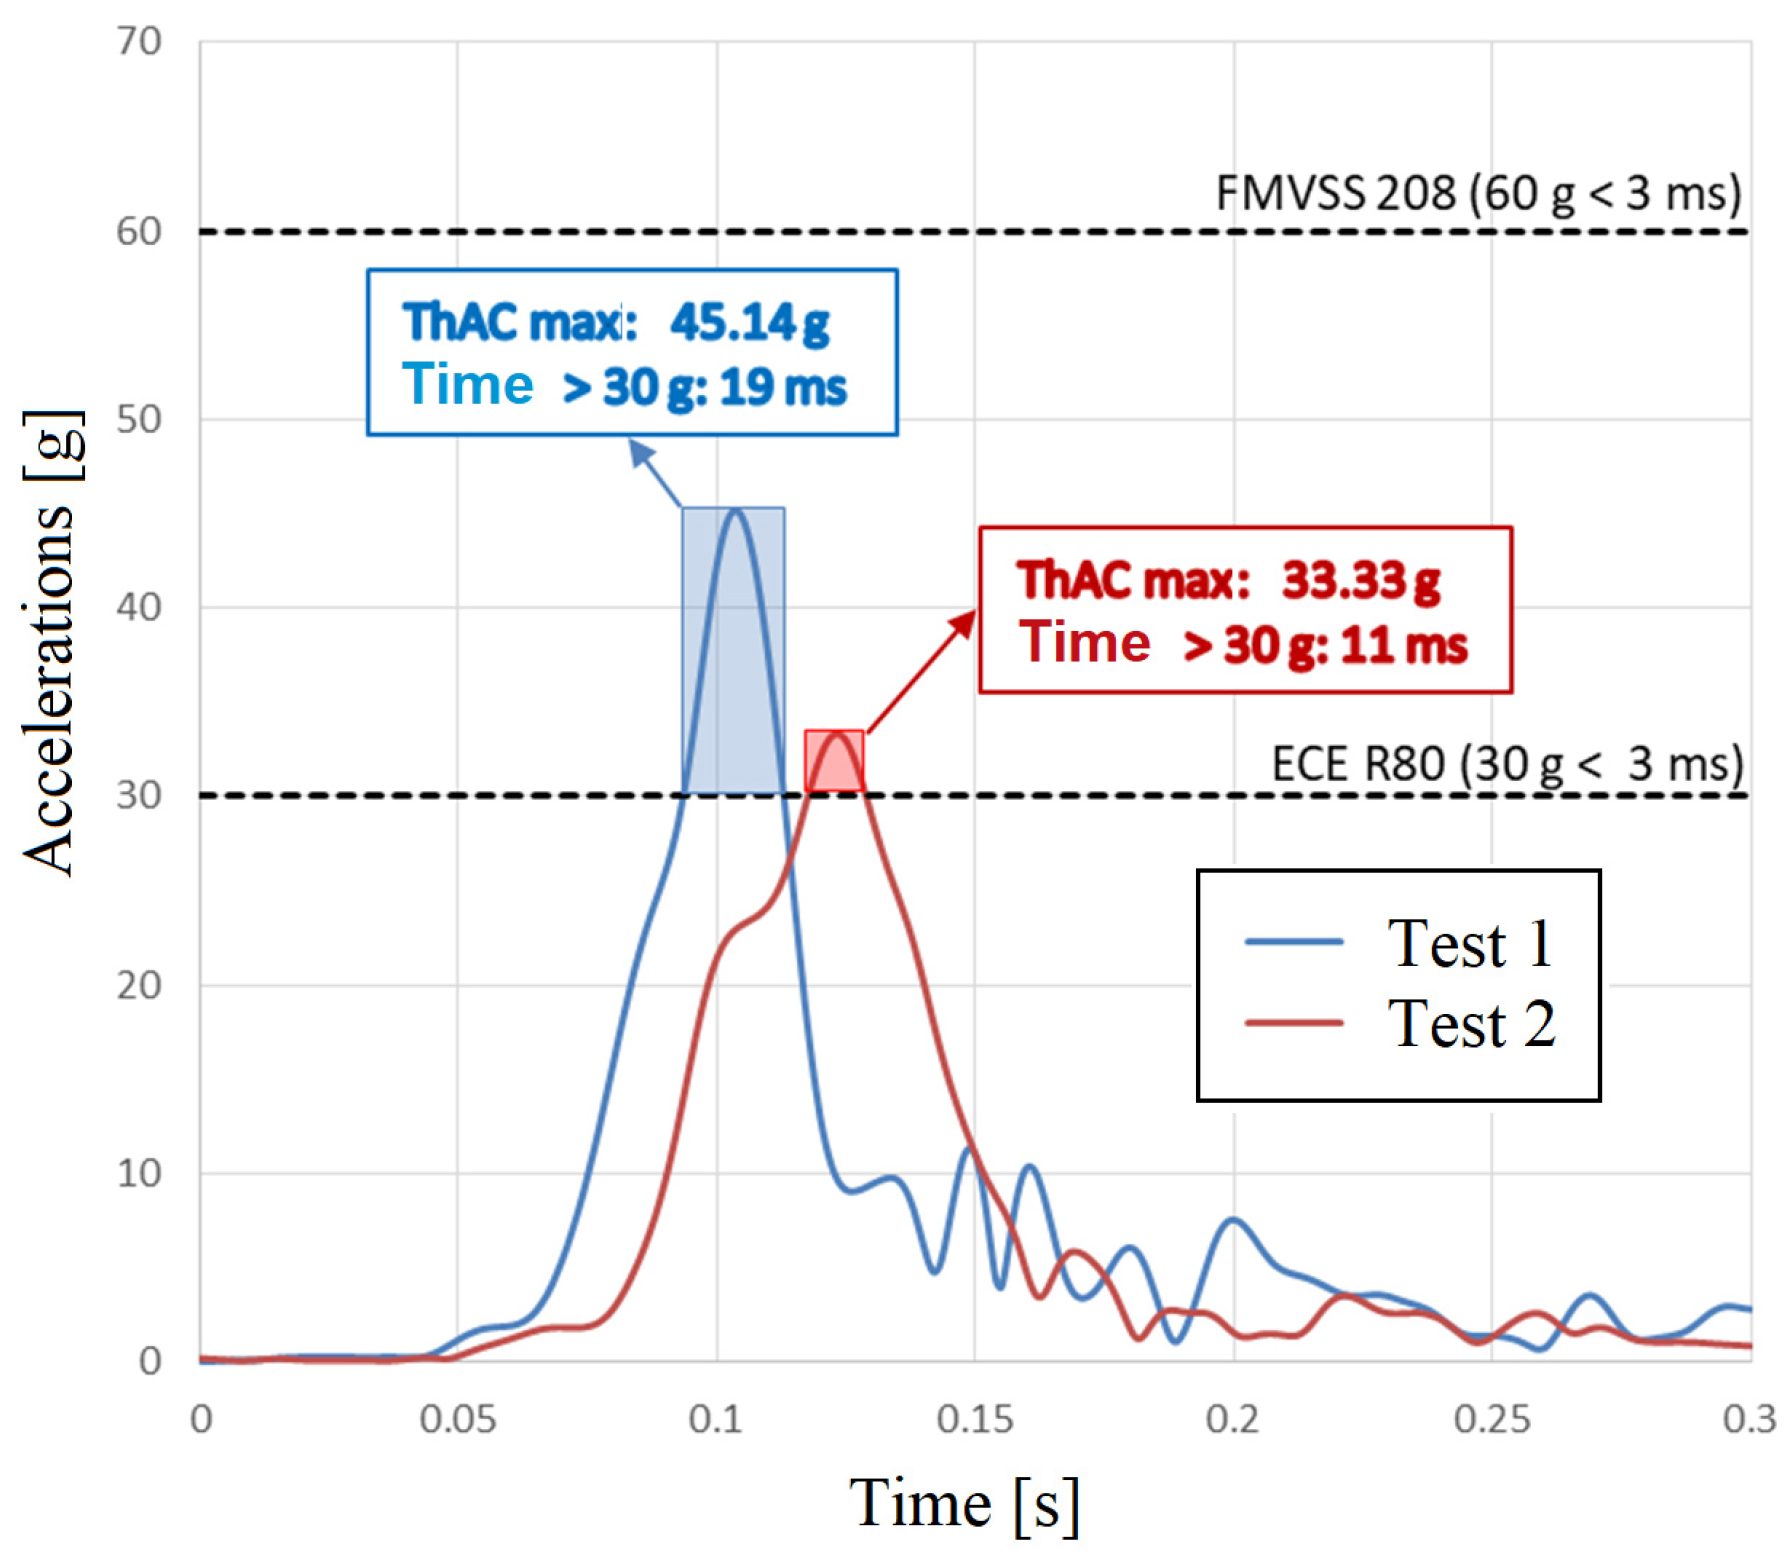
The calculated ThAC values do not meet the requirements of UNECE R80, which limits the duration of exceeding the 30 g threshold to 3 ms. They fall within the limits imposed by FMVSS 208, where an acceleration of up to 60 g is allowed for a maximum duration of 3 ms. In Figure 30, as in the case of the driver, the acceleration recorded at the chest level of the passenger dummy is represented as a function of time. The ThAC maximum values (45.14 g for test 1 and 33.33 g for test 2), corresponding to the maximum thoracic acceleration, are marked, as well as the time range in which the acceleration exceeds the 30 g threshold. In this case, the duration of exceedance is 19 ms for test 1 and 11 ms for test 2.

Figure 30.
Measured acceleration at the passenger’s chest and ThAC value.
The results obtained for both tests show that accelerations greater than 30 g exceed the maximum permissible duration of 3 ms specified in UNECE R80 but comply with the requirements of FMVSS 208, which allows accelerations of up to 60 g for durations less than 3 ms.
The analysis leads to the following conclusion: for the driver and passenger, the risk of injury was reduced in the case of the vehicle equipped with the additional damping system. For the driver, the ThAC value decreased from 38.02 g to 30.92 g, and for the passenger, the ThAC value decreased by 11.81 g. The reduction in the ThAC value was more obvious for the rear passenger. So, the damping system provides increased protection for the passengers in the rear seats of the vehicle. The probability of injury for the driver was 5.14% in the first test and 3.21% in the second, when the vehicle was equipped with additional damping. For the passenger, the probability of injury decreased from 8.15% in the first test to 3.77% in the second test.
5. Conclusions
The paper’s objective was to ascertain the loads that manifest and the conduct of a seat-belt-wearing passenger in a car with an IA at the front. In the main, the impact of the IA on potential damages in the event of a frontal collision was examined in the suggested solution. Additionally, the forces in the IA and seat belt were computed. FEM, a calculating technique that has demonstrated its efficacy and reliability in several real-world situations, was used. The forces that the system needed during the shock were calculated using the Gibbs–Appell method. The outcomes show how the car–driver–passenger system behaves and the goal of finding a solution that complies with the rules. Although the biological consequences, which are significant in these situations, were not examined because they were not the focus of the paper’s analysis, researchers in the relevant field can make use of this study’s findings. In order to give the racing car the best possible behavior in the event of a frontal encounter with a wall, a suitable design was thus put forth for this IA. In this way, it is certified that the IA functions correctly for the car type under study. The IA has been researched to find out how its presence affects a car’s occupants. In this instance, the IA is a distinct component that needs to be installed in the vehicle to guarantee the occupants’ protection in the event of an accident.
A broad research scope is provided by the work’s research and its findings. A study of this kind involves a large number of parameters, and the results are now insufficient but crucial for designers.
Author Contributions
Conceptualization, C.N. and A.C.; methodology, C.N., C.I., A.C., S.V., and B.C.B.; software, C.I. and B.C.B.; validation, C.N., C.I., A.C., S.V., and B.C.B.; formal analysis, C.N., C.I., A.C., S.V., and B.C.B.; investigation, C.N., C.I., and A.C.; resources, C.N., C.I., A.C., S.V., and B.C.B.; data curation, C.N. and C.I.; writing—original draft preparation, C.N.; writing—review and editing, A.C. and S.V.; visualization, C.N., C.I., A.C., S.V., and B.C.B.; supervision, C.N., C.I., A.C., S.V., and B.C.B.; project administration, C.N. and A.C.; funding acquisition, C.N., C.I., A.C., S.V., and B.C.B. All authors have read and agreed to the published version of the manuscript.
Funding
The APC was funded by Transylvania University of Brasov, HBS3926/2024.
Data Availability Statement
The original contributions presented in this study are included in the article. Further inquiries can be directed to the corresponding author.
Conflicts of Interest
The authors declare no conflicts of interest.
References
- Takimizu, Y. Retraction performance of motor vehicle seat belt. J. Jpn. Soc. Tribol. 1997, 42, 625–630. [Google Scholar]
- Yamagata, H.; Nishida, N.; Sakai, T. A radiographic and physical analysis of factors affecting seat belt position in sitting car seat. Sci. Rep. 2022, 12, 10732. [Google Scholar] [CrossRef] [PubMed]
- DeGaspari, J. ‘Smarter’ seat belt fiber. Mech. Eng. 2002, 124, 22–30. [Google Scholar]
- Vlase, S.; Itu, C.; Marin, M.; Öchsner, A.; Toderita-Santean, A. Response of safety belt webbing used for formula student race car in a frontal collision. Proc. Inst. Mech. Eng. Part L J. Mater.-Des. Appl. 2025, 239, 1063–1076. [Google Scholar] [CrossRef]
- Prasetya, L.W.; Prabowo, A.R.; Nordin, N.A.B. Design of crashworthy attenuator structures as a part of vehicle safety against impact: Application of waste aluminum can-based material. Theor. Appl. Mech. Lett. 2021, 11, 100235. [Google Scholar] [CrossRef]
- Imanullah, F.; Ubaidillah, P.; Wirawan, A.A. Experiment Evaluation of Impact Attenuator for a Racing Car Under Static Load. In Proceedings of the 3rd International Conference on Industrial, Mechanical, Electrical, and Chemical Engineering (ICIMECE), Surakarta, Indonesia, 13–14 September 2017; AIP Publishing: Melville, NY, USA, 2018. [Google Scholar]
- Sinaga, F.R.; Ubaidillah, D.; Idris, M.H. Numerical Simulation of several Impact Attenuator Design for a Formula Student Car. In Proceedings of the 3rd International Conference on Industrial, Mechanical, Electrical, and Chemical Engineering (ICIMECE), Surakarta, Indonesia, 13–14 September 2017; AIP Publishing: Melville, NY, USA, 2018; Volume 1931. [Google Scholar]
- Braghin, F.; Gottardi, D.; Tartaglia, M. Design and testing of the frontal impact attenuator for a Formula SAE vehicle. In Proceedings of the ASME International Design Engineering Technical Conferences/Computers and Information in Engineering Conference, Las Vegas, NV, USA, 4–7 September 2007; Volume 5, pp. 2051–2057. [Google Scholar]
- Kaya, D.; Özyurt, E. Design and optimization of impact attenuator for a Formula SAE racing car. Sigma J. Eng. Nat. Sci.-Sigma Muhendis. Ve Fen Bilim. Derg. 2022, 40, 390–401. [Google Scholar]
- Albak, E.I.; Solmaz, E.; Kaya, N.; Öztürk, F. Impact attenuator conceptual design using lightweight materials and meta-modeling technique. Mater. Test. 2019, 61, 621–626. [Google Scholar] [CrossRef]
- Prasetya, L.W.; Prabowo, A.R.; Adiputra, R. Crashworthy Examination of a Newly Proposed Impact Attenuator Design: Experimental Testing and Numerical Analysis. Model. Simul. Eng. 2021, 1, 1–20. [Google Scholar] [CrossRef]
- Montaleza, C.I.; Gallegos, J.W.; Arteaga, O. Design of an impact attenuator for passive safety on roads. Global Conference on Recent Advances in Sustainable Materials (GC-RASM). Mater. Today-Proc. 2022, 49, 2073–2080. [Google Scholar] [CrossRef]
- Coppola, L.; De Marco, B.; Timpone, F. Impact Attenuator Optimum Design for a FSAE Racing Car by Numerical and Experimental Crash Analysis. Int. J. Automot. Technol. 2020, 21, 1339–1348. [Google Scholar] [CrossRef]
- Vettorello, A.; Campo, G.A.; Giacalone, M. Numerical-Experimental Correlation of Dynamic Test of a Honeycomb Impact Attenuator for a Formula SAE Vehicle. Metals 2020, 10, 652. [Google Scholar] [CrossRef]
- Lufinka, A. Crash Test of the Student Racing Car Impact Attenuator. In Proceedings of the 58th International Conference of Machine Design Departments (ICMD 2017), Prague, Czech Republic, 6–8 September 2017; pp. 210–213. [Google Scholar]
- Fahland, J.; Hoff, C.; Brelin-Fornari, J. Evaluating Impact Attenuator Performance for a Formula SAE Vehicle. SAE Int. J. Passeng. Cars-Mech. Syst. 2011, 4, 836–847. [Google Scholar] [CrossRef]
- Karishma, P.; Venugopal, K.V.; Raju, I.R.K. Optimization and Impact Analysis of a Roll Cage Model. Int. Res. J. Eng. Technol. (IRJET) 2018, 5, 526–543. [Google Scholar]
- Kanketr, T.; Phongphinnittana, E.; Patamaprohm, B. Design of a CFRP composite monocoque: Simulation approach. In Proceedings of the 9th Thai-Society-of-Mechanical-Engineers International Conference on Mechanical Engineering (TSME-ICoME), Phuket, Thailand, 11–14 December 2018; IOP Conference Series-Materials Science and Engineering. Volume 501, p. 012014. [Google Scholar] [CrossRef]
- Hasan, A.; Lu, C.; Liu, W. Lightweight Design and Analysis of Steering Knuckle of Formula Student Car Using Topology Optimization Method. World Electr. Veh. J. 2023, 14, 233. [Google Scholar] [CrossRef]
- Kaul, A.; Abbas, A.; Smith, G.; Manjila, S.; Pace, J.; Steinmetz, M. A revolution in preventing fatal craniovertebral junction injuries: Lessons learned from the Head and Neck Support device in professional auto racing. J. Neurosurg.-Spine 2016, 25, 756–761. [Google Scholar] [CrossRef] [PubMed]
- Mihradi, S.; Golfianto, H.; Mahyuddin, A.I.; Dirgantara, T. Head Injury Analysis of Vehicle Occupant in Frontal Crash Simulation: Case Study of ITB’s Formula SAE Race Car. J. Eng. Technol. Sci. 2017, 49, 534–545. [Google Scholar] [CrossRef]
- Guegan, P.; Lebreton, D.; Pasco, F.; Othman, R.; Le Corre, S.; Poitou, A. Metallic energy-absorbing inserts for Formula One tyre barriers. Proc. Inst. Mech. Eng. Part D-J. Automob. Eng. 2008, 222, 699–704. [Google Scholar] [CrossRef]
- Davies, H.C.; Bryant, M.; Hope, M.; Meiller, C. Design, development, and manufacture of an aluminium honeycomb sandwich panel monocoque chassis for Formula Student competition. Proc. Inst. Mech. Eng. Part D-J. Automob. Eng. 2012, 226, 325–337. [Google Scholar] [CrossRef]
- Modrea, A.; Vlase, S.; Teodorescu-Draghicescu, H.; Mihalcica, M.; Calin, M.R.; Astalos, C. Properties of advanced new materials used in automotive engineering. Optoelectron. Adv. Mater.-Rapid Commun. 2013, 7, 452–455. [Google Scholar]
- Boria, S.; Pettinari, S.; Cosimi, G. Analytical and numerical analysis of composite impact attenuators. Compos. Struct. 2016, 156, 348–355. [Google Scholar] [CrossRef]
- Belingardi, G.; Obradovic, J. Design of the Impact Attenuator for a Formula Student Racing Car: Numerical Simulation of the Impact Crash Test. J. Serbian Soc. Comput. Mech. 2010, 4, 52–65. [Google Scholar]
- Itu, C.; Vlase, S. Impact Attenuator Design for Improvement of Racing Car Drivers’ Safety. Symmetry 2023, 15, 159. [Google Scholar] [CrossRef]
- Wheatley, G.; Zaeimi, M. Front impact attenuator design for a race car. Int. J. Crashworthiness 2022, 27, 466–475. [Google Scholar] [CrossRef]
- Castro, J.M.P.B.C.; Araujo, A.L.; Madeira, J.F.A. Design and multi-objective optimization of a composite impact attenuator for a Formula Student car. In Advances in Engineering Materials, Structures and Systems: Innovations, Mechanics and Applications; CRC Press: Boca Raton, FL, USA, 2019; pp. 498–503. [Google Scholar]
- Wang, J.H.; Xi, D.S.; Wang, S.C. Designing and Experiment study on Front Impact Attenuator for Formula SAE Racecar. Appl. Mech. Mech. Eng. 2011, 138–139, 33–37. [Google Scholar]
- Wang, J.F.; Yang, N.; Wang, B.M. Design and experimental verification of composite impact attenuator for racing vehicles. Compos. Struct. 2014, 141, 39–49. [Google Scholar] [CrossRef]
- Boria, S.; Pettinari, S. Mathematical design of electric vehicle impact attenuators: Metallic vs composite material. Compos. Struct. 2014, 115, 51–59. [Google Scholar] [CrossRef]
- Segade, A.; López-Campos, J.A.; Vilan, J.A. Finite Element Simulation for Analyzing the Design and Testing of an Energy Absorption System. Materials 2016, 9, 660. [Google Scholar] [CrossRef] [PubMed]
- Negrean, I. Formulations about Elastodynamics in Robotics. Acta Tech. Napoc. Ser. Appl. Math. Mech. Eng. 2019, 62, 237–250. [Google Scholar]
- Hassan, M.; Bruni, S. Experimental and numerical investigation of the possibilities for the structural health monitoring of railway axles based on acceleration measurements. Struct. Health Monit. Int. J. 2019, 18, 902–919. [Google Scholar] [CrossRef]
- Filben, T.M.; Pritchard, N.S.; Oravec, C.S.; Hile, C.W.; Bercaw, J.R.; Zoch, S.R.; Miller, L.E.; Bullock, G.S.; Flashman, L.A.; Miles, C.M.; et al. Pilot characterization of head kinematics in grassroots dirt track racing traffic injury prevention. Traffic Inj. Prev. 2022; in press. [Google Scholar] [CrossRef]
- Drage, T.; Lim, K.L.; Koh, J.E.H.; Gregory, D.; Brogle, C.; Braun, T. Integrated Modular Safety System Design for Intelligent Autonomous Vehicles. In Proceedings of the 2021 IEEE Intelligent Vehicles Symposium (IV), Nagoya, Japan, 11–17 July 2021; pp. 258–265. [Google Scholar] [CrossRef]
- Vlase, S.; Teodorescu, P.P. Elasto-Dynamics of a Solid with a General “RIGID” Motion using FEM Model. Part I. Theoretical Approach. Rom. J. Phys. 2013, 58, 872–881. [Google Scholar]
- Malik, P.; Lepsik, P. Design and Analysis of Honeycomb Based Impact Attenuator. Manuacturing Technol. 2020, 20, 639–645. [Google Scholar] [CrossRef]
- Yang, S.Y.; Choi, S.K.; Kim, N. Finite element analysis of honeycomb impact attenuator. Int. J. Mod. Phys. B 2008, 22, 1417–1422. [Google Scholar] [CrossRef]
- Venugopal, N.; Deshpande, A.M.; Dalir, H. Energy Absorption Enhancement for Multiple Impact Angles of a Rear Crash Attenuator. J. Fail. Anal. Prev. 2021, 21, 329–337. [Google Scholar] [CrossRef]
- Ghani, A.R.A.; Kasiran, R.; Adenan, M.S.; Mat, M.H.; Nasir, R.E.M.; Mohamad, M.F.; Wan Mohamed, W.A.N. Novel Design of Impact Attenuator for an ‘Eco Challenge’ Car. Regional Conference on Automotive Research (ReCAR). Trends Automot. Res. 2012, 165, 237–241. [Google Scholar]
- Wang, J.F.; Zhao, J.H.; Yang, W.F. Crash analysis of composite energy-absorbing cylindrical impact attenuator. J. Reinorced Plast. Compos. 2015, 34, 2006–2017. [Google Scholar] [CrossRef]
- Vlase, S.; Marin, M.; Scutaru, M.L. Maggi’s equations used in the finite element analysis of the multibody systems with elastic elements. Mathematics 2020, 8, 399. [Google Scholar] [CrossRef]
- Ursu-Fisher, N. Elements of Analytical Mechanics; House of Science Book Press: Cluj-Napoca, Romania, 2015. [Google Scholar]
- Vlase, S.; Teodorescu, P.P.; Itu, C.; Scutaru, M.L. Elasto-Dynamics of a Solid with a General “Rigid” Motion Using Fem Model. Part II. Analysis of a Double Cardan Joint. Rom. J. Phys. 2013, 58, 882–892. [Google Scholar]
- Vlase, S.; Negrean, I.; Marin, M.; Nastac, S. Kane’s Method-Based Simulation and Modeling Robots with Elastic Elements, Using Finite Element Method. Mathematics 2020, 8, 805. [Google Scholar] [CrossRef]
- (euroncap.com)-European New Car Assessment Programme (Euro NCAP), Frontal Impact Testing Protocol Version 6.0 August 2012. Available online: https://cdn.euroncap.com/media/1457/euro-ncap-frontal-protocol-version-60.pdf (accessed on 19 September 2024).
- Kallieris, D.; Rizzetti, A.; Mattern, R. 631995_10.pdf (ircobi.org)—The Biofidelity of Hybrid III Dummies, Institute of Legal Medicine University of Heidelberg. Available online: https://www.ircobi.org/wordpress/downloads/irc1995/pdf_files/1995_10.pdf (accessed on 29 September 2022).
- Fortuna, L.; Buscarino, A. Microrobots in Micromachines. Micromachines 2022, 13, 1207. [Google Scholar] [CrossRef] [PubMed]
- Bugaru, M.; Vasile, O. Modeling and Analysis of FBV Movements for Automotive Driveshafts in the PPR Region. Appl. Sci. 2022, 12, 3237. [Google Scholar] [CrossRef]
- Mare, I.C.; Negrean, I.; Vlase, S.; Modrea, A. Gibbs-Appell Equations used in Finite Element Analysis of Elastic Materials with Voids having a Plane Motion. Rom. J. Acoust. Vib. 2024, 21, 83–90. [Google Scholar]
- Scutaru, M.L.; Vlase, S. Some Properties of Motion Equations Describing the Nonlinear Dynamical Response of a Multibody System with Flexible Elements. J. Appl. Math. 2012, 628503. [Google Scholar] [CrossRef]
- NPRM_SID.pdf—Injury Criteria for Side Impact Dummies, May 2004, By Shashi Kuppa National Transportation Biomechanics Research Center National Highway Traffic Safety Administration. Available online: https://www.nhtsa.gov/sites/nhtsa.gov/files/criteria.pdf (accessed on 29 September 2022).
- Hybrid III 50th Male FE|Humanetics. Available online: https://www.humaneticsgroup.com/ (accessed on 25 September 2022).
- Li, X. Simulation System of Car Crash Test in C-NCAP Analysis Based on an Improved Apriori Algorithm. Phys. Procedia 2012, 25, 2066–2071. [Google Scholar] [CrossRef]
- Itu, C.; Toderita, A.; Melnic, L.-V.; Vlase, S. Effects of Seat Belts and Shock Absorbers on the Safety of Racing Car Drivers. Mathematics 2022, 10, 3593. [Google Scholar] [CrossRef]
- J211/1_202208; Instrumentation for Impact Test Part 1-Electronic Instrumentation. SAE International: Warrendale, PA, USA, 2022. Available online: https://www.sae.org/standards/content/j211/1_202208/ (accessed on 9 July 2025).


Disclaimer/Publisher’s Note: The statements, opinions and data contained in all publications are solely those of the individual author(s) and contributor(s) and not of MDPI and/or the editor(s). MDPI and/or the editor(s) disclaim responsibility for any injury to people or property resulting from any ideas, methods, instructions or products referred to in the content. |
© 2025 by the authors. Licensee MDPI, Basel, Switzerland. This article is an open access article distributed under the terms and conditions of the Creative Commons Attribution (CC BY) license (https://creativecommons.org/licenses/by/4.0/).