Abstract
This study investigates the knowledge, perception and trust in Advanced Driver Assistance Systems (ADAS) among drivers in Eastern Sicily, a Mediterranean region characterized by infrastructural and socio-economic differences. A structured survey (N = 961) was conducted to assess user attitudes towards eight key ADAS technologies using two validated indices: the Knowledge Index (KI) and the Importance Index (II). To capture user consistency, a normalized product (z(KI) × z(II)) was calculated for each technology. This composite metric enabled the identification of three latent dimensions through exploratory factor analysis: Emergency-Triggered Systems, Adaptive and Reactive Systems and Driver Vigilance and Stability Systems. The results show a clear discrepancy between perceived importance (56.6%) and actual knowledge (35.1%). Multivariate analyses show that direct experience with ADAS-equipped vehicles significantly increases both awareness and confidence. Age is inversely correlated with knowledge, while gender has only a marginal influence. The results are consistent with established acceptance models such as TAM and UTAUT, which emphasize the role of perceived usefulness and trust. The study presents an innovative integration of psychometric metrics and behavioral theory that provides a robust and scalable framework for assessing user readiness in evolving mobility contexts, particularly in regions facing infrastructural heterogeneity and cultural changes in travel behavior.
1. Introduction
The progressive integration of Advanced Driver Assistance Systems (ADAS) in modern vehicles represents one of the most revolutionary developments in the automotive sector in the last two decades. These technologies, which include Lane Keeping Assist (LKA), Adaptive Cruise Control (ACC), Blind Spot Detection (BSD) and Automatic Emergency Braking (AEB), are designed to support the driver during critical driving phases to increase both safety and driving comfort. Although these systems do not yet offer full vehicle autonomy, they represent an important intermediate step on the road to automated mobility and are usually classified as Level 1 or Level 2 according to the Society of Automotive Engineers (SAE) standard [1].
The introduction of ADAS has increased rapidly worldwide due to both technological innovation and regulatory pressure. The European Union has played a leading role in this development by introducing mandatory features such as Electronic Stability Control (ESC), Fatigue Warning Systems (FWS) and Intelligent Speed Assist (ISA) as part of broader road safety strategies [2]. These initiatives reflect the growing institutional recognition that reducing human error, which remains the leading cause of traffic accidents, requires not only behavioral measures but also technical solutions.
However, the availability of ADAS technologies and the existence of regulations mandating their integration do not automatically translate into effective or responsible use. A growing body of literature shows that there is often a significant discrepancy between the benefits perceived by users of ADAS and the actual understanding or confidence in these systems [3,4,5]. This discrepancy is particularly pronounced among users who have little experience with such technologies and can hinder both acceptance and safe operation. Direct, hands-on experience with vehicles equipped with ADAS has consistently been shown to be a key factor in awareness and acceptance. This underscores the notion that user engagement is fundamental to realizing the potential benefits of automation [6]. These challenges become even greater in socio-economically disadvantaged or infrastructurally underserved areas where the digitalization of transport systems is limited and access to modern vehicle technologies is uneven. In parts of southern Europe, for example, ADAS adoption may be hindered not only by individual factors such as age or education, but also by broader systemic issues such as affordability, political support, willingness to use infrastructure and cultural attitudes towards automation [7,8]. These structural and territorial inequalities raise critical questions about technological equity, the risk of unequal safety benefits and the feasibility of a truly inclusive transition to smart mobility. In this regard, the adoption and effective use of ADAS can also be interpreted through the lens of established behavioral acceptance models, such as the Technology Acceptance Model (TAM) and the Unified Theory of Acceptance and Use of Technology (UTAUT), which emphasize the influence of perceived usefulness, ease of use, and user trust on technology uptake [9,10]. These models offer a solid theoretical basis for interpreting variability in user behavior and for identifying potential barriers to the diffusion of intelligent driving technologies, especially in contexts with infrastructural or cultural limitations.
Against this backdrop, this study examines the level of knowledge, perception and trust in ADAS among drivers in southern Italy, with a particular focus on the eastern region of Sicily. This region is representative of other Mediterranean and semi-peripheral regions where the introduction of transportation innovations is often delayed due to economic, infrastructural and information deficits. Using a structured survey of a large and demographically diverse sample, this study analyzes users’ familiarity with eight key ADAS technologies and their perceived importance for road safety. Building on a previous study conducted in the same regional context that focused on average knowledge scores and perceived importance using descriptive and path analysis, this study extends the methodological approach by introducing composite indices, standardized measures, and exploratory factor analyses to uncover latent perception dimensions [11].
According to the existing literature, this study appears to be one of the first data-driven contributions in Italy to systematically investigate the intersection of ADAS awareness, user characteristics and territorial infrastructure challenges. The results provide valuable insights not only for automotive industry stakeholders and policy makers, but also for urban planners and mobility experts concerned with the integration of intelligent driving systems into broader strategies for sustainable and equitable transportation. This study builds on this foundation by presenting a structured methodological approach involving survey design, psychometric index construction, composite metrics for user consistency and multivariate analyses, including factor analysis, to uncover underlying perception patterns.
2. Literature Review
In recent years, the rapid development and integration of Advanced Driver Assistance Systems (ADAS) in modern vehicles has attracted the attention of the academic community. Researchers have looked in depth at the psychological, social and technical dimensions of user perception, trust, acceptance and interaction with these systems. These studies relate to different demographic groups, geographical regions and driving contexts and highlight both the opportunities and challenges associated with the increasing automation of driving.
One of the most extensively studied user groups is older drivers, who can often benefit most from ADAS due to age-related deterioration in cognition and reaction time. Several studies emphasize that although older drivers recognize the potential safety benefits of these systems, they still express doubts about their ease of use, reliability and overall trustworthiness [3,12]. These findings are echoed in experimental and survey-based studies showing that cognitive overload, unfamiliar user interfaces and inadequate feedback mechanisms can negatively influence acceptance among older users [13,14].
In the broader psychological and behavioral science literature, confidence, perceived usefulness, ease of use and previous experience are consistently identified as critical variables that influence intention to adopt or continue using ADAS [15,16]. Models such as the Unified Model of Driver Acceptance (UMDA) and the Technology Acceptance Model (TAM) have been applied to ADAS contexts and show strong correlations between user satisfaction and system simplicity, functionality and perceived safety improvement [17,18]. Another increasingly relevant topic is the transparency and explainability of systems. Users are more likely to trust ADAS if the system clearly communicates what it is doing, why it is acting and under what conditions it may fail. This concept, known as explainable automation, is central to promoting sustained engagement and reducing misuse or over-trust [19,20]. As Kong et al. (2024) point out, increasing explainability in human–automation interactions can significantly improve users’ mental models and compliance, especially in dynamic or ambiguous driving environments [21].
Driver training plays a crucial role when it comes to safely designing and internalizing the introduction of ADAS. Several studies criticize the inadequacy of conventional manuals and onboard tutorials and find that they are often ignored or poorly understood by users [22]. Innovative formats such as gamification training, driver coaching apps and scenario-based simulators have been proposed as more effective tools to promote learning and retention [23,24]. Cultural and regional differences have also been shown to be important factors in ADAS adoption. Research in developing countries has shown that infrastructural limitations, low income and lack of awareness are the main barriers [25,26]. At the same time, psychological acceptance is often influenced by local driving conditions, norms and traffic practices [27,28]. Privacy and data protection issues are becoming increasingly important with the introduction of Driver Monitoring Systems (DMS) and connected functions. Several studies report increased concerns regarding facial recognition, biometric tracking and data sharing with insurers or third parties [29,30]. These issues are particularly relevant in countries with weak data protection laws or low digital literacy. Technological adaptation and adaptability have been suggested as ways to improve uptake and reduce disengagement. For example, adapting warning thresholds and user interfaces to individual driving habits has been shown to increase driver satisfaction and reduce false alarms [31,32,33]. Demographic differences such as age, gender and socio-economic status also play an important role. Some studies show that women tend to favor safety features, while men often value comfort and performance [34,35,36]. Generational differences in digital literacy and trust in automation further complicate efforts to create inclusive systems. Finally, global overviews and national case studies help to place ADAS in a broader context of market development, regulation and societal readiness. Studies from China and the Middle East, for example, show the impact of government policies and public campaigns on accelerating adoption [37,38].
In summary, the literature clearly shows that the introduction of ADAS is not a purely technical challenge, but a multidimensional process characterized by user education, cognitive preferences, cultural expectations, political frameworks and trust. A holistic understanding of these factors is essential for the development of integrative, effective and scalable ADAS introduction strategies.
3. Materials and Methods
An online survey was conducted for the study to obtain a comprehensive overview of user attitudes towards ADAS. The survey was designed to move from the evaluation of specific ADAS devices to more general insights about ADAS. The data collected were structured not only to assess user knowledge and perceptions, but also to enable advanced statistical analyses, including correlation assessment, regression modeling, ANOVA and exploratory factor analysis.
In this approach, the survey was structured to capture respondents’ knowledge and evaluations of a range of different ADAS devices to provide aggregate conclusions reflecting the level of knowledge and importance attributed to the ADAS sector. The responses were further processed into composite indices, specifically the “Knowledge Index’ and “Importance Index”, which allowed for statistical comparison across different demographic and behavioral categories. These indices enabled a deeper analysis that went beyond simple descriptive statistics and led to inferential modeling and user segmentation.
It was found that a reliable assessment of users’ attitudes towards ADAS cannot be achieved by asking general questions about ADAS. General questions such as “What do you think of ADAS?”, “Do you know how ADAS works?” or “How important do you think ADAS is for road safety?” would likely lead to uncertain or uninformed responses, as many participants may have difficulty distinguishing among familiar devices, those they have only heard of and those that are completely unknown.
To counteract this, the survey was designed with specific questions on unique and identifiable ADAS—a strategy deemed most effective in obtaining accurate and informed responses. In addition, these structured responses were pre-processed to ensure consistency of numerical data entry and to enable their use in statistical analyses such as ANOVA, multiple regression and exploratory factor analysis. Converting the categorical responses into continuous numerical scales was a crucial step in preparing the dataset for advanced inferential techniques.
The ADAS included in the survey were selected based on the following criteria:
- High market penetration: ADAS has been available as an option/standard for at least eight years, including in mid-size cars.
- EU regulations: ADAS is required by EU regulation for newly registered vehicles from 2011.
The eight ADAS included are as follows:
- (1)
- ESC (Electronic Stability Control): Stabilizes the vehicle and prevents skidding by selectively applying the brakes and possibly adjusting the steering.
- (2)
- AEB (Automatic Emergency Braking): Activates when a collision is imminent to initiate emergency braking and mitigate or avoid rear-end collisions.
- (3)
- ACC (Adaptive Cruise Control): Uses radar to monitor the distance to the vehicle in front; adjusts the speed to maintain a minimum safe distance and brakes or stops if necessary.
- (4)
- LDW (Lane Departure Warning): Monitors the vehicle’s position on the road and warns if it crosses the lane.
- (5)
- LKA (Lane Keeping Assist): Helps to keep the vehicle in lane and corrects unintentional lane departure by applying steering torque.
- (6)
- BSD (Blind Spot Detection): Helps monitor blind spots and warns the driver of risks in areas not visible through the side mirrors.
- (7)
- FWS (Fatigue Warning System): Detects driver drowsiness using infrared cameras or sensors that monitor eyelid and steering behavior.
- (8)
- TPMS (Tire Pressure Monitoring System): Alerts the driver when tire pressure drops using pressure sensors.
The structured dataset derived from the survey responses was then processed through statistical validation techniques to ensure data integrity before inferential models were applied. This preparation allowed for a comprehensive examination of the factors influencing ADAS knowledge and perception, focusing on the observed statistical correlations.
3.1. Survey
The opinions of the participants were obtained through a structured survey of 40 questions aimed at systematically assessing the knowledge and perception of Advanced Driver Assistance Systems (ADAS). The collected responses were later processed and structured to enable advanced statistical modeling, including correlation analysis, multiple regression, ANOVA and exploratory factor analysis.
The survey was divided into four main categories. In Category 1 (Participant Characteristics), respondents provided basic demographic information by answering two questions about their age group (under 30, 30–40, 41–50 or over 50) and gender (male or female). These demographic variables were later used as predictors in statistical modeling to assess their influence on knowledge and perception of ADAS. A broader set of demographic and behavioral variables—including mode of travel, frequency of car use, annual mileage and recent vehicle purchases—is described in detail in Section 3.2 and summarized in Table 1.

Table 1.
Features of survey respondents.
Category 2 (Transportation Means) consisted of five questions about the respondent’s main mode of transport and vehicle use. Specifically, respondents were asked to indicate their main mode of transport (car, bicycle, public transport, motorbike/moped or pedestrian), frequency of car use (every day, almost every day, a few times a week or a few times a month) and average annual mileage (less than 5000 km, between 5000 and 10,000 km, between 10,000 and 20,000 km or more than 20,000 km). In addition, they were asked to indicate whether they had bought or rented a car in the last three years (purchase of a new car, purchase of a used car, car rental or no purchase/rental) and, if applicable, the manufacturer of the car they had bought or rented (Fiat, Mercedes, Opel, Renault, Toyota, Citroen, Peugeot, Seat, Volkswagen, Audi, BMW, Ford or other). These factors were included in the inferential analyses to assess their influence on ADAS awareness.
Category 3 (Road Safety) contained a single question asking participants to give their opinion on the main causes of road accidents (driver behavior, road conditions, vehicle condition or other). The purpose of this category was to investigate whether road safety concerns played a role in attitudes towards the introduction of ADAS.
Category 4 (ADAS) was the most extensive section and comprised 32 structured questions focusing on detailed assessments of the eight ADAS technologies described above. Respondents’ answers were summarized into two composite indices, the Knowledge Index and the Importance Index, to allow a numerical comparison of users’ knowledge and perceptions across different socio-demographic groups. Specifically, participants were asked four questions about each of the eight ADAS devices (Electronic Stability Control, Automatic Emergency Braking, Adaptive Cruise Control, Lane Departure Warning, Lane Keeping Assist, Blind Spot Detection, Fatigue Warning System and Tire Pressure Monitoring System):
- The first question, asked on a 5-point Likert scale, assessed respondents’ self-reported knowledge of each ADAS (1 = very poor; 2 = poor; 3 = acceptable; 4 = good; 5 = very good).
- The second question, also on a 5-point Likert scale, assessed the respondents’ perceived importance of each ADAS for improving road safety (1 = very poor; 2 = poor; 3 = acceptable; 4 = good; 5 = very good).
- The third question asked respondents whether their main vehicle was equipped with the respective ADAS (possible answers: I do not know, no or yes).
- The fourth question asked only respondents who already experience of had using vehicles equipped with the specific ADAS to rate their opinion of the ADAS (answer options: dangerous (as a source of confusion/distraction), not very useful/not useful or very useful (especially in terms of perceived increased safety)).
To increase clarity and minimize response bias, each ADAS-related question included both the device abbreviation and a brief functional description, as described in Section 3. In addition, categorical responses were converted into ordinal and nuclear variables to ensure compatibility with the inferential statistical procedures used in this study, such as ANOVA, regression modeling and factor analysis.
The questionnaire was tested in a pretest phase with 20 face-to-face interviews with university teachers and researchers from the University of Catania. This validation process was conducted to ensure the clarity, relevance and suitability of the survey items for the target audience. Feedback from the pre-test was used to refine the wording of the questions, improve consistency and remove any ambiguities.
The final survey was conducted online using Google Forms and was accessible through the website of the Department of Civil Engineering and Architecture of the University of Catania. Participants were recruited mainly through institutional and academic channels, including departmental websites and university mailing lists. While this recruitment strategy was effective in obtaining many responses, it resulted in a sample that tended to consist of younger and more educated individuals living in the local area. Before participating in the survey, respondents were explicitly informed that the survey was anonymous, and that no personal or sensitive data would be collected. Furthermore, the survey complied with all relevant data protection regulations, including Legislative Decree no. 196 of 30 June 2003 (Italian Data Protection Act) and the General Data Protection Regulation (EU 2016/679, GDPR).
The data collection lasted four months, during which the responses were systematically recorded and stored in a structured format suitable for statistical and machine learning applications. Incomplete or inconsistent responses, particularly in the ADAS-related sections, were excluded from the dataset to ensure the reliability of the data.
3.2. Participants
Participants in this study were recruited via the online survey described above, with an initial sample of 1408 respondents. The survey was designed to capture a wide range of demographic and behavioral factors related to ADAS awareness and use, allowing for subsequent inferential statistical analyses. Respondents who provided incomplete or inconsistent responses—particularly in Section 4, which focused on ADAS-related questions essential to the calculation of the Knowledge Index and Importance Index—were excluded. This data-cleaning process led to the removal of 447 cases (approximately 31.7% of the original sample), ensuring the validity and reliability of subsequent statistical modeling. This exclusion rate likely reflects varying levels of familiarity with ADAS and engagement with the survey content. Consequently, the final dataset comprised 961 valid responses, structured for use in regression modeling, correlation analyses and exploratory factor analyses.
The demographic and behavioral characteristics of the sample are summarized in Table 1, which provides an overview of the variables used in the subsequent analysis models. More than 80% of respondents were under the age of 40, indicating a predominantly young, university-affiliated sample—consistent with expectations for technology adoption studies. The gender distribution was balanced, with 55% male and 45% female participants, ensuring adequate representation for gender-specific comparative analyses.
The majority (57.5%) had not bought or leased a vehicle in the last three years, with the most frequently mentioned vehicle brands being Fiat (23.8%), Mercedes (7.8%) and Volkswagen (7.8%). Most respondents primarily used cars (85%) and reported using them daily or almost daily (80%), an important factor in understanding ADAS exposure and familiarity. Annual mileage was between 5000 and 20,000 km for 61% of respondents, a variable that was later included in multiple regression analyses to assess its influence on ADAS knowledge. When asked about the main cause of road accidents, almost 90% of respondents cited driver behavior, confirming the relevance of ADAS technologies in mitigating risks associated with human driving. This response variable was later used in exploratory analyses to determine whether attitudes towards ADAS correlate with safety perceptions.
The final dataset of 961 respondents was categorized into categorical and continuous variables so that it could be used in multiple statistical models. The sample characteristics shown in Table 1 were used as the basis for examining the relationships among demographic factors, driving behavior and ADAS awareness.
3.3. Analytical Framework and Index Computation
The analytical framework was carefully constructed to systematically explore the dynamic relationship between respondents’ familiarity with ADAS technologies and their subjective evaluation of the role of these systems in improving road safety. The need for such a structured approach arises from the inherent complexity of technological adoption behavior, which is influenced by a combination of cognitive, experiential and contextual factors. In particular, ADAS adoption is influenced not only by users’ technical knowledge, but also by their confidence in automation, perceived risks, previous driving experience and the influence of regulatory and market factors.
To understand familiarity with ADAS, both explicit knowledge (users’ ability to identify and describe specific ADAS functions) and implicit familiarity (users’ ability to recognize ADAS-assisted driving experiences in real-life scenarios) need to be captured. Conversely, the perceived importance of ADAS is characterized by individual safety concerns, knowledge of traffic accident statistics, advertising or educational content and previous positive and negative experiences with automated driving assistance. The challenge in developing this analytical framework is to quantify these subjective constructs in a way that enables rigorous statistical analysis and predictive modeling.
A structured methodology was, therefore, essential to ensure the validity and reliability of the measurements. This required the development of composite indices covering multiple dimensions of user knowledge and perception and allowing standardized comparisons between different respondent groups. This approach integrates quantitative survey methods and inferential statistical techniques to uncover meaningful trends in user attitudes. The framework also recognizes the existence of non-linear relationships in technology acceptance, where marginal increases in knowledge are not necessarily accompanied by proportional increases in perceived importance. The study applies standard statistical techniques such as correlation, regression, ANOVA and factor analysis to assess users’ ADAS knowledge and perception patterns. Furthermore, this framework provides an exploratory perspective on the societal and psychological barriers to ADAS adoption. By identifying the extent to which familiarity with these technologies influences trust and perceived benefits, the study provides insights into how information campaigns, training programs and policies might influence public attitudes towards intelligent vehicle systems. The methodology ensures that subjective assessments—which often lead to variability in studies of human behavior—are systematically structured to allow for generalizable findings while accounting for individual differences in perception and experience.
3.3.1. Definition and Computation of Indices
The assessment of ADAS knowledge and perceived importance required the formulation of two structured quantitative indices: the Knowledge Index (KI) and the Importance Index (II). These indices serve as key dependent variables in inferential statistical models. They facilitate hypothesis testing related to ADAS awareness determinants, enable comparative analyses between population subgroups and support predictive modeling. Furthermore, they enable the segmentation of user profiles and provide a systematic approach to analyze behavioral and attitudinal patterns towards ADAS technologies. By converting subjective responses into standardized measures, these indices improve the statistical reliability and interpretability of the dataset and ensure robustness in subsequent analyses.
The indices were derived from data collected in Category 4 (ADAS-related questions) of the survey. The AI was calculated based on responses to question 4.1, where participants rated their familiarity with each of the eight ADAS technologies on a 5-point Likert scale (1 = very poor, 5 = very good). To obtain a composite measure of knowledge, the individual ratings were aggregated and the average per respondent was calculated. This average was then normalized to control for variability between individuals and to ensure comparability across the sample.
Normalization was particularly important to compensate for potential self-assessment bias, where respondents might overestimate or underestimate their familiarity with ADAS technologies due to different baseline situations.
Similarly, II was constructed from the responses to question 4.2, which assessed the perceived importance of each ADAS technology for improving road safety using the same 5-point Likert scale. The average importance rating across the eight ADAS categories was calculated for each respondent and then standardized to allow for meaningful cross-sectional comparisons. This step ensured that differences in perception were interpreted consistently and allowed for a direct comparison between the constructs of knowledge and importance.
To facilitate inferential statistical analyses, both indices were divided into three ordinal categories:
- Low: scores falling predominantly in the ‘very poor” or “poor” range, reflecting either low familiarity with ADAS or a lack of perceived importance;
- Medium: scores in the “acceptable” range, indicating moderate knowledge or a neutral attitude towards the importance of ADAS;
- High: scores mainly in the “good” or “very good” range, indicating high familiarity and/or high perceived importance.
This classification framework was important to enable comparisons between subgroups and to ensure that patterns in knowledge and perceptions of ADAS could be systematically explored. The structured approach to categorization improved the validity of the statistical modeling by reducing the ambiguity of individual self-assessments and providing a consistent reference scale for subsequent analysis procedures.
The formulation of these indices provides a methodologically sound basis for the assessment of ADAS awareness and attitudes and ensures that the results can be generalized across different population groups.
By using standardized computational and classification techniques, this approach allows for a granular yet statistically rigorous examination of the cognitive and attitudinal dimensions that influence ADAS adoption and acceptance.
This classification framework was essential to enable subgroup comparisons and to systematically analyze the distribution of ADAS-related knowledge and perceptions across sociodemographic and behavioral segments. The division into ordinal categories made it possible to use the indices not only in descriptive statistics but also in inferential methods such as ANOVA, regression and correlation analyses to ensure consistency and comparability across respondent profiles.
By structuring the subjective ratings into a common quantitative reference scale, the categorization process also helped to reduce the interpretative ambiguity and inter-individual variability in self-ratings that are well-known limitations of survey-based perception studies.
As part of the index validation, the internal consistency of the two composite measures was formally assessed using Cronbach’s alpha, a widely accepted measure in psychometrics and the social sciences for assessing the reliability of scales with multiple items. The analysis was conducted using IBM SPSS Statistics (version 29) and applied to the entire set of valid observations (n = 961). Cronbach’s alpha estimates the degree of correlation between items assumed to measure a common latent dimension, in this case perceived familiarity (for KI) and perceived relevance (for II) in eight different ADAS technologies.
The interpretation of the resulting alpha coefficients follows established conventions: According to Nunnally and Bernstein (1978), alpha values above 0.70 are considered an indicator of acceptable reliability, while values above 0.80 reflect good internal consistency [39]. More recent guidelines categorize alpha values as follows [40]:
- ≥0.90 = Excellent
- 0.80–0.89 = Good
- 0.70–0.79 = Acceptable
- 0.60–0.69 = Questionable
- <0.60 = Poor
These benchmarks are used to ensure that the aggregated indices are both psychometrically valid and statistically robust.
3.3.2. Statistical Methods Applied
The statistical analysis in this study followed a multidimensional approach aimed at closely examining the relationships between the calculated indices, KI and II, and a range of demographic, behavioral, and vehicle-related factors. To ensure methodological and logical rigor, multiple inferential techniques were applied, each selected for its suitability to answer specific research questions. Below is a detailed breakdown of the statistical methods used.
3.4. Correlation Analysis
Correlation analysis was conducted to measure the strength and direction of the association between KI and II, providing insights into whether higher familiarity with ADAS corresponds to a higher perception of their importance in road safety.
- The Pearson correlation coefficient (r) was computed, quantifying the degree of linear relationship between these two continuous variables.
- The statistical significance of the correlation was assessed using p-values, with a significance threshold of p < 0.05.
- Confidence intervals were calculated to ensure robustness in estimating the correlation magnitude.
This method provided an initial exploratory insight into the interdependence of knowledge acquisition and attitudinal positioning toward ADAS technologies.
3.5. ANOVA (Analysis of Variance) and Post-Hoc Analysis
A one-way ANOVA was performed to determine whether significant differences exist in KI and II scores across predefined categorical variables. These included the following:
- Age groups (e.g., younger vs. older drivers);
- Gender (e.g., male vs. female differences in ADAS awareness and perception);
- Driving frequency (e.g., daily drivers vs. occasional drivers);
- Prior exposure to ADAS-equipped vehicles (e.g., users of ADAS-equipped cars vs. non-users).
Since ANOVA only determines whether significant differences exist among groups but does not specify which groups differ from each other, Tukey’s Honest Significant Difference (HSD) test was employed as a post hoc analysis to identify specific pairwise differences between subgroups.
To ensure the robustness of the ANOVA assumptions, Levene’s test was conducted to assess the homogeneity of variance across groups, and effect sizes (e.g., η2—eta squared) were reported to quantify the magnitude of differences.
3.6. Regression Modeling for Predictive Analysis
To identify predictors of ADAS knowledge and perceived importance, multiple linear regression models were developed. The purpose of regression analysis was to estimate the contribution of key independent variables to variations in KI and II, while accounting for potential confounding factors.
The independent variables included the following:
- Driving experience (years of active driving);
- Annual mileage (distance driven per year);
- ADAS-equipped vehicle ownership (binary variable: yes/no);
- Demographic variables (e.g., age, gender, education level).
A multiple linear regression model was employed to quantify the impact of each predictor while controlling for multicollinearity. Variance inflation factor (VIF) tests were conducted to ensure that collinearity among independent variables did not distort coefficient estimates.
Standard diagnostic tests, such as the Durbin–Watson statistic, were performed to check for autocorrelation in residuals, while residual normality tests (e.g., the Shapiro–Wilk test) ensured compliance with the assumptions of linear regression.
3.7. Factor Analysis
An exploratory factor analysis (EFA) was conducted to identify latent structures underlying users’ perception of eight ADAS. In this study, rather than analyzing knowledge and perceived importance separately, we constructed a composite indicator for each ADAS by integrating two key cognitive dimensions: KI and II. To do so, we adopted a normalized product approach, in which both indices were first standardized (z-scores), then combined multiplicatively to capture their joint contribution:
where z(KI) and z(II) are the standardized values (mean = 0; SD = 1) for each ADAS variable. The normalized product is conceptually meaningful: A positive value indicates agreement between the two dimensions (i.e., the system is both known and valued or unknown and not valued), while a negative value reflects cognitive dissonance (e.g., the system is known but not valued or valued despite low familiarity). The absolute value of the product reflects the strength of alignment or misalignment.
Based on these eight composite indices, we performed a Principal Component Analysis (PCA) as an extraction method, followed by orthogonal Varimax rotation to improve the interpretability and independence of the factors. PCA was chosen for its effectiveness in dimensionality reduction and its ability to detect latent clustering in multivariate structures. The number of components to be retained was determined using the Kaiser criterion, which recommends the retention of components with eigenvalues greater than 1. This rule assumes that each retained component should explain at least as much variance as a single original variable. In addition to the Kaiser rule, a Scree Plot was visually inspected to identify the “elbow point” at which the marginal contribution of subsequent components decreases noticeably. As a further visual aid, a threshold of 10% variance was drawn on the Scree Plot to highlight components that explain a significant proportion of the total variance. Although this threshold is not binding, it serves as a practical guide: Components explaining less than 10% are generally considered weak in exploratory contexts and are likely to be theoretically or statistically less robust [41].
For the interpretation of the factors, we assumed a minimum loading threshold of ±0.40, considering only loadings above this value as meaningful. This threshold is frequently used in exploratory research to ensure conceptual clarity and statistical relevance [42,43]. Loadings below this value were excluded from interpretation to obtain a robust and parsimonious factor structure. This procedure allowed us to uncover distinct and interrelated cognitive patterns in users’ representations of ADAS technologies.
4. Results
This section presents the empirical results of the study, which provides a comprehensive analysis of participants’ familiarity with ADAS and their perceived importance for road safety. The results are divided into five key analytical components: (1) descriptive and reliability analyses, showing the distribution, central tendencies, and internal consistency of KI and II; (2) correlational analyses to examine the relationship between knowledge and perceived importance; (3) inferential analyses using ANOVA and post hoc comparisons to assess the effects of demographic and behavioral variables; (4) multiple linear regression models to identify predictors of ADAS awareness and perception; and (5) exploratory factor analysis to uncover latent psychological dimensions underlying users’ attitudes towards different ADAS technologies. Together, these analyses provide a multi-layered understanding of the cognitive, experiential and demographic factors that influence the adoption and evaluation of ADAS.
4.1. Descriptive Analysis and Validation of Indices
The dataset includes responses from 961 participants, providing a comprehensive assessment of their familiarity with ADAS technologies, quantified KI and their perception of the importance of ADAS for road safety, captured by II. To enable a structured interpretation of the results, both indices were categorized into three levels: Low, Medium and High, allowing comparative analyses across different demographic and behavioral groups. The thresholds for these categories were defined as follows: Values from 1.0 to 2.5 were considered as Low, from 2.6 to 3.5 as Medium and from 3.6 to 5.0 as High. These thresholds were set to reflect meaningful variations in perception while ensuring statistical comparability.
Table 2 shows that the distribution of KI is relatively balanced, while II shows a clear tendency towards higher values. A total of 25.9% of respondents showed a low knowledge of ADAS, indicating a limited understanding of these technologies. The largest proportion of respondents, 39.0%, fell into the medium category, indicating that while there is some level of knowledge, it is not particularly deep. Finally, 35.1% of respondents had a high level of knowledge, indicating a strong familiarity with the features and benefits of ADAS. In absolute numbers, this corresponds to 249 participants in the low group, 375 in the medium group and 337 in the high knowledge group.
Table 2.
Distribution of KI and II levels.
In contrast, II shows a more skewed distribution. Only 1.87% of respondents rated ADAS as less important, which indicates that very few people consider these systems to be insignificant for road safety. A remarkable 41.5% of respondents fall into the middle category, meaning that they recognize ADAS as useful but perhaps not essential. The majority, 56.6%, attach a high importance to ADAS, underlining the widespread belief that these technologies play a crucial role in improving driving safety. In absolute terms, this means that 18 respondents belonged to the low importance group, 399 to the medium importance group and 544 to the high importance group.
These results suggest that while the general perception of the importance of ADAS is very positive, the level of knowledge varies greatly, and a significant proportion of respondents still do not have an in-depth understanding of these systems.
A more detailed examination of the data requires a statistical analysis of the two indices. Table 3 shows that the mean KI is 3.21 (±0.87), which confirms that respondents are, on average, moderately familiar with ADAS technologies. The mean of II is 3.78 (±0.92), indicating that respondents generally recognize ADAS as valuable for road safety. The higher mean of II compared to KI indicates that even respondents with lower levels of knowledge still perceive ADAS as important. A further analysis of the distribution characteristics shows that KI has a skewness of −0.21, while II has a skewness of −0.45. These negative skewness values indicate that responses tend to skew towards higher values, meaning fewer KI and II values at the lower end of the scale. In addition, the Kurtosis values (0.14 for KI and 0.37 for II) indicate a near normal distribution, with II having a slightly higher peak value, supporting the finding that respondents’ opinions on the importance of ADAS tend to be more homogeneous compared to their level of knowledge. As both the skewness and kurtosis values are within acceptable thresholds (±1), the distribution of the indices can be considered approximately normal, supporting the validity of the parametric tests in the subsequent analyses.
Table 3.
Descriptive statistics for KI and II.
In addition to these descriptive analyses, the internal consistency of the two indices was assessed by calculating Cronbach’s alpha to check whether the eight items included in each index (one per ADAS system) measured a coherent latent construct. The results yielded values of α = 0.89 for KI and α = 0.88 for the Importance Index, indicating high reliability in both cases. According to recognized psychometric procedures, alpha values above 0.80 are considered an expression of good internal consistency, which confirms that the items can be meaningfully aggregated into a single composite score. These results underpin the methodological soundness of the index-based approach and support its use in subsequent inferential analyses [38,39].
To understand how demographic factors influence knowledge and importance perceptions, mean KI and II scores were analyzed by age, gender and ownership of an ADAS-equipped vehicle. Table 4 shows that younger participants (aged <30 years) had significantly higher KI scores compared to older age groups. However, II remains relatively stable across the different age groups, suggesting that the perception of the importance of ADAS is not strongly age dependent. In terms of gender differences, men have slightly higher KI scores than women (3.27 vs. 3.16), although this difference is not particularly pronounced. However, both genders show a comparable perception of the importance of ADAS, with the II values for male and female participants being almost identical. The biggest difference is among owners of ADAS-equipped vehicles. Respondents who own a vehicle with ADAS scored significantly higher on both KI (3.55) and II (3.95) than non-owners (KI = 2.97, II = 3.65). This result strongly suggests that direct experience with ADAS has a positive influence on both knowledge and perceived importance. These observed differences are formally tested in Section 4.3 using ANOVA and post hoc analyses to assess their statistical significance.
Table 4.
Mean KI and II by demographic group.
The results show that although most respondents recognize ADAS as important for road safety, their actual level of knowledge varies. Younger respondents and ADAS vehicle owners are most familiar with these technologies, while gender has no significant impact on perceptions. These findings are important to identify knowledge gaps and develop customized education strategies to promote informed use of ADAS technologies. These findings serve as the basis for inferential analyses that examine the influence of demographic and behavioral factors on ADAS awareness using standard parametric methods such as ANOVA, regression and factor analysis.
4.2. Correlation Analysis
A correlation analysis was conducted to assess the strength and direction of the relationship between KI and II, which provides valuable insight into whether greater familiarity with ADAS is associated with an increased perception of their importance for road safety. Specifically, the Pearson correlation coefficient (r) was calculated to quantify the degree of linear relationship between the two indices.
Before the analysis was performed, the necessary assumptions for Pearson’s r were checked. Both KI and II exhibited near-normal distributions, as indicated by skewness and kurtosis values within ±1, and a review of the scatterplot confirmed a linear relationship between the two variables. These conditions support the appropriateness of the Pearson correlation method.
Table 5 shows the results of the analysis. The calculated correlation coefficient was r = 0.699, indicating a strong and statistically significant positive relationship (p < 0.001) between KI and II. According to Cohen’s guidelines, this value represents a large effect size, indicating that respondents who know more about ADAS also consider them to be more important for road safety. The 95% confidence interval for the correlation [0.627; 0.771] further supports the robustness of this result. The strength of this relationship is illustrated in the correlation matrix shown in Table 6.
Table 5.
Pearson correlation between KI and II.
Table 6.
Correlation matrix for KI and II.
To visualize the relationship, Figure 1 shows a scatterplot of KI and II, along with the fitted regression line. The plot clearly illustrates the positive linear relationship between the two variables, with a dense cluster of dots around higher KI and II values. Each dot represents one of the 961 respondents included in the final dataset.
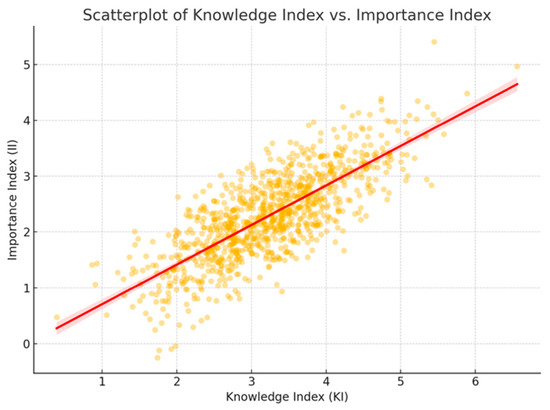
Figure 1.
Scatterplot illustrating the linear relationship between KI and II. Circles = data points; red line = linear regression.
Overall, the correlation analysis confirms that the increasing familiarity of users with ADAS is strongly associated with a higher perceived importance of these technologies. This relationship suggests that targeted information campaigns and hands-on experience with ADAS-equipped vehicles can significantly improve user attitudes, trust and, ultimately, acceptance of the technology. These findings provide empirical support for policy and industry efforts to bridge the gap between the availability and informed use of vehicle safety technologies.
4.3. ANOVA (Analysis of Variance) and Post Hoc Analysis
To determine whether demographic and behavioral factors had a significant impact on ADAS knowledge and perceived importance, a series of separate one-way ANOVA tests were KI and II. Each categorical variable was analyzed independently as a grouping factor. The factors included the following:
- Age Group (<30, 30–40, 41–50 or >50)
- Gender (Male, Female)
- Driving Frequency (Daily or Occasional)
- ADAS Experience (Yes or No)
Before performing the ANOVA tests, the assumptions of normality and homogeneity of variance were checked. Normality was assessed by visually inspecting the residual distributions and examining the skewness and kurtosis values, supporting the use of parametric analysis. Homogeneity of variance was assessed using Levene’s test, with no significant violation found for any of the variables (all p > 0.05), confirming the ANOVA results (Table 7).
Table 7.
Levene’s test results for homogeneity of variance.
ANOVA tests were carried out following the verification of the assumptions. The squared Eta values (η2) shown correspond to the classic η2, as this is a one-way analysis. The results are summarized in Table 8.
Table 8.
ANOVA results for KI and II.
The results showed the following:
- Age group had no significant effect on either index (p > 0.10).
- Gender was significant for KI (p = 0.043), with males reporting slightly more knowledge, but not for II.
- Driving frequency was significant for both KI and II, suggesting that drivers who drive daily are more familiar with ADAS and attach greater importance to it.
- ADAS experience was not significant for KI (p = 0.096) but highly significant for II (p < 0.001), suggesting that users of ADAS-equipped vehicles perceive these systems as more important for safety.
Tukey’s Honest Significant Difference (HSD) tests were only conducted for the predictors that showed significant effects in the ANOVA (p < 0.05), namely, driving frequency and ADAS experience, and only in relation to II. The results are shown in Table 9.
Table 9.
Tukey HSD results—II.
The Tukey tests confirm this:
- Drivers who drive daily rate ADAS as significantly more important than occasional drivers.
- Users of vehicles equipped with ADAS rate the importance of ADAS significantly higher than non-users.
While the effect sizes (η2) for these comparisons are small (all < 0.02), they are still meaningful in practice and reflect consistent trends in user perceptions between the groups. Following Cohen’s guidelines (η2 = 0.01 small, 0.06 medium and 0.14 large), the observed effects are small but noteworthy.
These results are consistent with previous research on technology acceptance, which emphasizes the role of direct experience and frequency of use in building trust and perceived usefulness.
In summary, the ANOVA and post hoc analyses show the following:
- Gender and driving frequency are modestly associated with differences in ADAS knowledge.
- Previous ADAS experience plays a significant role in perceived usefulness.
- Age group has no significant effect on either index.
These results emphasize the importance of real-world exposure and frequent driving experience to increase both awareness and confidence in ADAS technologies. Outreach and education programs should prioritize drivers who drive less frequently or have never used ADAS-equipped vehicles.
4.4. Regression Modeling for Predictive Analysis
Multiple linear regression analysis was performed to identify the main predictors influencing KI and II, with the aim of estimating the contribution of demographic and behavioral variables while controlling for potential confounding effects. The independent variables included driving experience (years of active driving), annual mileage (distance traveled per year), ownership of an ADAS-equipped vehicle (binary variable: yes/no), age and gender. Two separate regression models were developed: one for KI and one for II. The results provide valuable insights into how these factors influence knowledge and perception of ADAS.
Prior to running the regression models, standard diagnostic tests were conducted to verify the underlying assumptions. Normality of the residuals was assessed using the Shapiro–Wilk test and visually confirmed by Q-Q plots, both of which confirmed the normal distribution of the residuals. The Q-Q plots for both models showed that the residuals were approximately aligned along the diagonal reference line, indicating that the deviations from normality were minimal and non-systematic (Figure 2). This is a visual confirmation of the robustness of the normality assumption. Homoscedasticity was tested using residual plots and formally assessed using the Breusch–Pagan test, which, again, found no significant heteroscedasticity (p > 0.05). These diagnostics confirm that the regression assumptions were fulfilled.
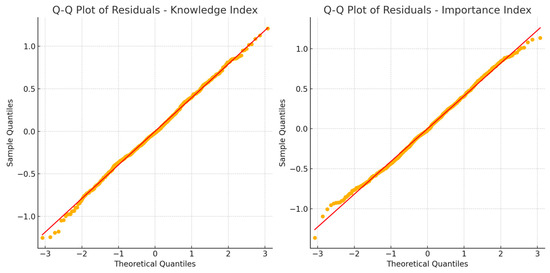
Figure 2.
Q-Q Plots of Residuals for KI and II. Circles = standardized residuals; red line = reference line for normal distribution.
For the KI model, the regression analysis revealed that driving experience, annual mileage and ADAS ownership were significant predictors of knowledge (Table 10). More specifically, driving experience had a positive and statistically significant coefficient, indicating that individuals with more years of active driving experience tended to have more knowledge about ADAS technologies. Similarly, annual mileage was positively correlated with KI, suggesting that drivers who drive more miles per year are more likely to be familiar with ADAS. However, the most meaningful variable was ADAS ownership, which showed a strong positive correlation with KI, confirming that people who own ADAS-equipped vehicles are significantly more knowledgeable about these systems.
Table 10.
Regression results for KI.
The regression coefficient for ADAS ownership in KI model was 0.477 (p < 0.001), meaning that owning a vehicle with ADAS increases KI by an average of 0.48 points, holding all other factors constant. This coefficient is larger than those of the other independent variables, suggesting that direct experience with ADAS is the most important factor in determining users’ knowledge of these systems.
On the other hand, age had a negative coefficient, indicating that younger individuals have higher levels of ADAS knowledge compared to older drivers. Gender had a minor influence, with men having slightly higher KI scores, although this difference was not statistically significant.
The overall explanatory power of the model was considerable with an R2 of 0.42, meaning that 42% of the variance in KI scores was explained by the predictor variables.
Model II showed similar trends, but with some differences in the strength of the predictors (Table 11). ADAS ownership was again the strongest predictor, suggesting that people who use ADAS-equipped vehicles perceive them as significantly more important for road safety. The regression coefficient for ADAS ownership in the II model was 0.784 (p < 0.001), confirming that people who own an ADAS-equipped vehicle tend to place a significantly higher importance on these systems, with an estimated increase of 0.78 points in II. While driving experience and annual mileage were positively associated with II, their effects were less pronounced compared to KI, suggesting that direct exposure to ADAS has a greater impact on perceived importance than mere driving frequency. Age was also negatively correlated with II, underlining the idea that younger participants tend to attribute greater importance to ADAS than older drivers. Gender had a minor influence, with men being slightly less likely to perceive ADAS as important for road safety than women, although this result was not statistically significant.
Table 11.
Regression results for II.
The II model also showed strong predictive power with an R2 of 0.47, meaning that 47% of the variance in perceived importance was explained by the variables included.
Diagnostic tests were performed to ensure the robustness of these results. Variance inflation factor (VIF) analysis confirmed that the VIF of each predictor was below 1.2 (Table 12). Furthermore, inspection of the zero-order Pearson correlation matrix (Table 13) revealed that the strongest bivariate association—between age and driving experience—was r = 0.66 (p < 0.001), well below the pragmatic threshold of 0.80 [44]; all other correlations were |r| < 0.30. Finally, the maximum Condition Index was 8.7, well below the frequently cited—caution range of 10–15, again confirming that multicollinearity is not problematic [45].
Table 12.
VIF results—multicollinearity Test.
Table 13.
Zero-order Pearson correlation matrix of predictors (N = 961).
Testing the normality of the residuals with the Shapiro–Wilk test confirmed that the residuals were normally distributed and confirmed the assumptions of the regression model. These results were visually confirmed by the Q-Q plots of the residuals for both models, which showed a linear alignment with only minimal deviations, confirming the assumption of normally distributed residuals (Figure 2). Visual inspection of the residuals also confirmed homoscedasticity and normality.
It is important to note that, given the cross-sectional nature of the data, these results reflect associations rather than causal relationships. Although the regression coefficients indicate the direction and strength of the associations, no definitive causal conclusions can be drawn.
The implications of these results are significant. The strong relationship between ADAS ownership and both KI and II suggests that first-hand experience with ADAS plays an important role in forming users’ awareness and perceptions. This demonstrates the importance of familiarizing consumers with ADAS through training programs, test drives and real-world demonstrations. The negative correlation between age and both indices suggests that younger generations are more receptive to ADAS, suggesting that targeted awareness campaigns for older drivers could be beneficial. The small influence of gender suggests that men and women perceive ADAS in a similar way, confirming the assumption that ADAS acceptance is largely uniform across demographic groups.
These findings provide a solid basis for future policy recommendations, particularly for promoting the uptake of ADAS among low-information user groups. The strong correlation between experience and knowledge emphasizes the need for proactive educational initiatives to bridge the gap between technological availability and user ignorance. Future studies could extend this analysis by including additional behavioral factors, psychological influences or cross-national comparisons to better understand the global landscape of ADAS adoption and use.
4.5. Factor Analysis
The suitability of the dataset for the factor analysis was initially tested using standard diagnostic tests. The Kaiser–Meyer–Olkin (KMO) measure for the appropriateness of the sample yielded a value of 0.74, which, according to Kaiser’s (1974) classification, means a medium to good degree of appropriateness. This result confirms that the correlation structure between the variables is strong enough to justify the use of exploratory factor techniques, thus reducing the risk of inferring unstable or uninterpretable components. In addition, Bartlett’s test for sphericity was highly significant (χ2 = 2756.34, df = 28, p < 0.001), providing additional support for factorability by rejecting the null hypothesis that the correlation matrix is an identity matrix. Together, these two indicators suggest that the data matrix is statistically well-conditioned for dimensionality reduction and latent structure detection.
Principal Component Analysis (PCA) was applied to a set of eight composite indices, each calculated as the product of standardized knowledge and importance scores (z(KI) × z(II)) associated with individual ADAS technologies. This approach was chosen to capture not only the additive influence of familiarity and perceived usefulness but also their interaction, allowing for the identification of systems where cognitive alignment or dissonance plays a pivotal role in shaping perception. The PCA revealed a three-factor solution, in accordance with Kaiser’s criterion (eigenvalues > 1), leaving only components that explained more variance than a single standardized variable.
As shown in Table 14, the three extracted factors cumulatively explained 60.61% of the total variance, which is generally considered acceptable in psychological and perceptual research involving technological constructs. The first component alone explained 27.33% of the variance, followed by the second with 20.53% and the third with 12.75%. Although the subsequent components (PC4 and PC5) explained a non-negligible proportion of the variance, they did not reach the Kaiser threshold and were, therefore, excluded.
Table 14.
Explained variance by principal components.
The Scree Plot (Figure 3) further confirmed this structure and showed a visible “elbow” after the third component, an inflection point typically interpreted as a boundary for meaningful dimensional contributions. In addition, a variance threshold of 10% was visually marked on the plot to highlight components with low explanatory power.
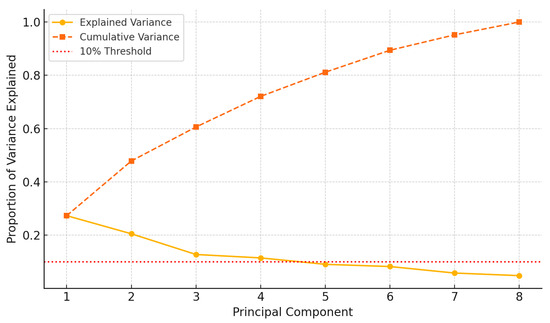
Figure 3.
Scree Plot of Principal Component Analysis.
After factor extraction, Varimax rotation was performed to maximize the variance of the squared loadings within each factor and to improve the interpretability of the results. Only factor loadings ≥ |0.40| were considered significant. The matrix of rotated factor loadings is shown in Table 15.
Table 15.
Rotated factor loadings.
Each factor groups together systems with similar functional profiles and perceptual signatures, enabling a reconstruction of the cognitive space in which users perceive ADAS technologies.
Factor 1, labeled “Emergency-Triggered Systems”, includes three ADAS—TPMS (−0.55), BSD (−0.51) and ESC (−0.46)—all of which have a significant negative loading. These technologies are generally passive under normal conditions and are activated autonomously in response to certain risk situations. Their background function and low importance to the user interface likely contribute to a form of unawareness. Despite their technical importance, users may experience these systems as vague, unnoticed or “invisible”,” which can lead to underappreciation or weak cognitive representation.
Factor 2, labeled “Adaptive and Reactive Systems”, is defined by two systems: ACC (−0.73) and AEB (−0.47). These technologies work by continuously monitoring external conditions and can intervene dynamically by adjusting speed or braking behavior autonomously. The moderately strong negative loadings indicate that these systems may be perceived with some suspicion or discomfort. The user may not fully understand the logic of their activation or may feel left out of the decision-making process, especially if the interventions are perceived as sudden or not directly initiated by the driver. These findings are consistent with broader concerns in human–automation interactions, particularly in relation to trust, predictability and perceived control.
Factor 3, labeled “Vehicle Stability and Driver Vigilance Systems”, includes LKA (+0.66), FWS (+0.56) and LDW (+0.48), all of which show a strong positive correlation. These systems provide direct and consistent feedback that supports lateral positioning and attention monitoring, facilitating cognition. Actively engaging the driver through visual, tactile or auditory cues likely increases transparency and strengthens the sense of cooperation. The positive loadings indicate that users not only recognize these systems but also integrate them meaningfully into their driving routine and associate them with increased safety and assistance while driving.
Overall, the factor analysis reveals three latent dimensions that reflect not only technical taxonomies (e.g., active vs. passive systems), but rather cognitive and experiential patterns based on users’ lived interactions with the technology. These results suggest that the perceptions of ADAS is shaped by factors such as visibility, perceived autonomy and emotional well-being. This provides valuable insights for designers, engineers and communication specialists who want to improve the usability and acceptance of systems.
5. Discussion
The results of this study make a significant contribution to the growing body of research addressing public perceptions, awareness and acceptance of ADAS. By using composite indices validated through internal consistency analysis and derived from standardized aggregation of responses on eight ADAS technologies, this study provided a multidimensional and psychometrically sound assessment of users’ familiarity and perceived importance. These indices, in conjunction with inferential modeling techniques, provide a robust framework for examining users’ cognitive and behavioral engagement with ADAS.
The results reveal several important dynamics related to how end users cognitively, behaviorally and affectively use these technologies. Most notably, there is a significant gap between the perceived importance of ADAS and users’ actual knowledge of these systems. While more than half of respondents (56.6%) rated ADAS as very important for road safety, only 35.1% showed a correspondingly high level of familiarity with these technologies. This discrepancy between perceived value and operational understanding has been noted in previous studies and remains a critical barrier to the safe and effective use of ADAS [3].
The strong positive correlation (r = 0.699, p < 0.001) between KI and II reinforces the idea that greater familiarity with ADAS is directly associated with a higher appreciation of their contribution to road safety. However, these results argue against the idea that a high perception of importance automatically leads to appropriate use or better understanding. This has significant implications: Users might overestimate the capabilities of ADAS or operate them incorrectly based on false assumptions, as found in several behavioral studies [4,46].
From a demographic perspective, the data show that age is inversely correlated with KI and II, suggesting that younger users are better informed and more inclined to place a value on these technologies. This is consistent with broader patterns in the technology adoption literature, which often finds that younger cohorts are more open to and better utilize digital tools [4]. These findings are also consistent with previous work on older road users, which emphasized the extent to which age-related physical and perceptual limitations influence people’s experiences of mobility systems and their perceived safety [47,48]. This supports the idea that age should not only be understood as a demographic variable, but also as a proxy for differentiated risk profiles and design expectations in different mobility contexts.
Nevertheless, the ANOVA results indicate that age alone is not a statistically significant discriminator, suggesting that other variables, such as experience with ADAS-equipped vehicles, may exert a stronger influence. Indeed, ADAS ownership proved to be the strongest predictor in both regression models, increasing KI by almost 0.48 points and II by 0.78 points when all other variables were held constant. This supports the assertion that direct, hands-on experience is an important component of technology internalization and confidence building [49].
Interestingly, although the gender differences in perceived importance were not pronounced, males showed a slightly higher level of knowledge. This is consistent with previous findings from international studies which suggest that men often have a better (though not necessarily more accurate) understanding of vehicle technologies [44]. However, given the small effect size, this statement is more sociocultural than cognitive and should be interpreted with caution.
One of the most convincing findings is that frequent drivers and ADAS owners not only show higher familiarity but also a stronger correspondence between perceived usefulness and technological confidence [49].
Furthermore, the exploratory factor analysis conducted with composite indices calculated as the normalized product of user knowledge and perceived importance provides a more nuanced view of how ADAS technologies are mentally represented. The analysis identified three latent dimensions: (1) Emergency-Triggered Systems, characterized by low visibility and passive activation (TPMS, BSD, ESC); (2) Adaptive and Reactive Systems associated with automatic interventions that may cause skepticism or discomfort (ACC, AEB); and (3) Vehicle Stability and Driver Vigilance Systems, which provide continuous support and are perceived positively due to their clarity and intuitive feedback (LKA, FWS and LDW).
These three factors do not just follow technical classifications, such as active or passive systems, but rather reflect cognitive and experiential patterns based on how users interact with automation in everyday life. Factors such as trust, emotional well-being and perceived autonomy prove to be key dimensions.
These results are consistent with established theoretical models of technology acceptance, such as the Technology Acceptance Model (TAM) and the Unified Theory of Acceptance and Use of Technology (UTAUT) [3]. In both models, trust and perceived usefulness are central determinants of user acceptance. The perceptual ambivalence observed in Factor 2 and the strong cognitive orientation found in Factor 3 are particularly consistent with the balance between control and confidence theorized in these models. Consequently, the results emphasize the need for communication strategies that are not only informative but also psychologically responsive and address the emotional and cognitive barriers to acceptance.
Targeted interventions could include simulated driving experiences to reduce the perceived opacity of automated systems, as well as clear feedback mechanisms to increase user confidence.
These results also confirm concerns raised in the recent literature about the lack of formal training or familiarization of ADAS users. Several studies emphasize that users typically learn by trial and error or by observing others, rather than through structured instruction [4,50]. This approach is not only inefficient but also potentially dangerous, especially as the level of automation increases and user complacency grows.
Finally, although the study is situated in a specific regional and demographic context, namely, primarily young adults working in academic institutions in southern Italy, its implications are generally applicable. Similar patterns of limited ADAS knowledge but high perceived importance were observed in North America, Northern Europe and Asia, suggesting a global challenge to match technological development with user preparation [8].
6. Conclusions
This study has shown that, while ADAS technologies are widely perceived as important for road safety, users’ knowledge of them remains incomplete and often superficial. This discrepancy suggests that trust in such systems is often based on general assumptions or external representations rather than on actual familiarity and use. Without adequate education, this can lead to unrealistic expectations or inappropriate use, ultimately undermining the safety benefits these systems are intended to provide.
Among the various socio-demographic and behavioral variables investigated, direct experience with ADAS-equipped vehicles emerged as the most influential factor in promoting both knowledge and confidence. Ownership or frequent use of such vehicles significantly increased awareness of how the systems work and of their actual contribution to driving safety. The composite indices developed—KI and II—provided a robust and internally consistent way of quantifying these cognitive and perceptual dimensions. Furthermore, the use of a normalized product between the two indices enabled an analysis of the alignment or divergence between familiarity and perceived importance among users.
It is important to acknowledge a key limitation of the sample: Participants were recruited primarily through institutional and academic channels, resulting in an overrepresentation of younger and more educated individuals residing in the local area. While this strategy ensured a large and informed respondent base, it also limited the generalizability of the results. The findings must, therefore, be interpreted as reflecting a specific demographic and territorial context.
In this context—Eastern Sicily—where transport infrastructure is often outdated and digitalization remains incomplete—the introduction of ADAS should be considered part of a broader transition towards smarter and more sustainable mobility. However, the effectiveness of such innovation depends not only on the availability of technology but also on user readiness and systemic improvements, including infrastructure upgrades, coherent public policies and reliable digital connectivity. ADAS technologies need to be integrated into a holistic ecosystem comprising regulatory, infrastructural and behavioral components.
The factor analysis conducted revealed three latent dimensions of ADAS perception, which reflect not only technical classifications but also psychological and experiential patterns: (1) systems activated in emergencies, (2) reactive systems that may provoke skepticism and (3) systems supporting vigilance and stability, typically perceived as intuitive and trustworthy.
These findings are consistent with established models of technology acceptance (TAM and UTAUT), which highlight the central role of perceived usefulness and trust. They also underscore the need for targeted strategies to improve user familiarity—especially in population segments less accustomed to advanced vehicle technologies. Public and private stakeholders should invest in accessible tools such as test drives, simulations and interactive learning platforms, particularly aimed at occasional or older drivers.
Future research should address current sample limitations by including more geographically and demographically diverse populations and exploring the psychological and cultural factors that influence user attitudes toward automation. A multidimensional approach, combining behavioral, contextual and cognitive variables, will be essential to effectively guide the integration of ADAS into real-world mobility systems and ensure that their safety potential is fully realized.
Author Contributions
Conceptualization, N.D. and S.L.; methodology, N.D. and S.L.; software, N.D. and S.L.; validation, S.L.; formal analysis, N.D.; investigation, N.D. and S.L.; resources, N.D. and S.L.; data curation, S.L.; writing—original draft preparation, N.D. and S.L.; writing—review and editing, N.D. and S.L.; visualization, N.D.; supervision, S.L.; Funding acquisition, SL. All authors have read and agreed to the published version of the manuscript.
Funding
This work was carried out as part of the project “SICURI—Strade Intelligenti per CondUcenti che impiegano smaRt vehIcles” (prot. no. 267490 of 10 July 2024), funded by the PIAno di InCEntivi per la Ricerca di Ateneo 2024/2026 (PIA.CE.RI 2024/2026)—Linea di Intervento 1 “Progetti di ricerca collaborativa” of the University of Catania.
Institutional Review Board Statement
Not applicable to this study because effects on humans are essentially nonexistent.
Informed Consent Statement
Not applicable to this study because no subjects were involved in the research trials.
Data Availability Statement
The original contributions presented in this study are included in the article. Further inquiries can be directed to the corresponding author.
Conflicts of Interest
The authors declare no conflicts of interest.
References
- Martin-Gasulla, M.; Elefteriadou, L. Traffic Management with Autonomous and Connected Vehicles at Single-Lane Roundabouts. Transp. Res. Part C Emerg. Technol. 2021, 125, 102964. [Google Scholar] [CrossRef]
- European Commission. Advanced Driver Assistance Systems: Traffic Safety Synthesis Report. Eur. Road Saf. Obs. 2018. Available online: https://road-safety.transport.ec.europa.eu/system/files/2021-07/ersosynthesis2018-adas.pdf (accessed on 28 February 2025).
- Wood, J.M.; Henry, E.; Kaye, S.; Black, A.A.; Glaser, S.; Anstey, K.J.; Rakotonirainy, A. Exploring Perceptions of Advanced Driver Assistance Systems (ADAS) in Older Drivers with Age-Related Declines. Transp. Res. Part F Traffic Psychol. Behav. 2024, 100, 419–430. [Google Scholar] [CrossRef]
- Le Page, S.; Millar, J.; Bronson, K.; Rismani, S.; Moon, A. Driver Perceptions of Advanced Driver Assistance Systems and Safe-ty. arXiv 2019. [Google Scholar] [CrossRef]
- Choi, J.K.; Ji, Y.G. Investigating the Importance of Trust on Adopting an Autonomous Vehicle. Int. J. Hum. Comput. Interact. 2015, 31, 692–702. [Google Scholar] [CrossRef]
- Payre, W.; Cestac, J.; Delhomme, P. Intention to Use a Fully Automated Car: Attitudes and A Priori Acceptability. Transp. Res. Part F Traffic Psychol. Behav. 2014, 27, 252–263. [Google Scholar] [CrossRef]
- Van Acker, V.; Witlox, F. Car Ownership as a Mediator Between Lifestyle and Travel Behavior. Transp. Res. Part A Policy Pract. 2010, 44, 739–753. [Google Scholar] [CrossRef]
- Marchau, V.; Wiethoff, M.; Penttinen, M.; Molin, E. Stated Preferences of European Drivers Regarding Advanced Driver Assistance Systems (ADAS). Eur. J. Transp. Infrastruct. Res. 2001, 1, 291–308. [Google Scholar] [CrossRef]
- Davis, F.D. Perceived Usefulness, Perceived Ease of Use, and User Acceptance of Information Technology. MIS Q. 1989, 13, 319–340. [Google Scholar] [CrossRef]
- Venkatesh, V.; Morris, M.G.; Davis, G.B.; Davis, F.D. User Acceptance of Information Technology: Toward a Unified View. MIS Q. 2003, 27, 425–478. [Google Scholar] [CrossRef]
- Leonardi, S.; Distefano, N. Exploring Knowledge and Perceptions of Advanced Driver Assistance Systems (ADAS): Results of a Southern Italian Survey. Transp. Res. Interdiscip. Perspect. 2025, 31, 101426. [Google Scholar] [CrossRef]
- Biassoni, F.; Gnerre, M. Understanding Elderly Drivers’ Perception of Advanced Driver Assistance Systems: A Systematic Review of Perceived Risks, Trust, Ease of Use, and Usefulness. Geriatrics 2024, 9, 144. [Google Scholar] [CrossRef]
- Hansen, A.; Kiely, K.; Attuquayefio, T.; Hosking, D.; Regan, M.; Eramudugolla, R.; Ross, L.A.; Anstey, K.J. Assessment of the Application of Technology Acceptance Measures to Older Drivers’ Acceptance of Advanced Driver-Assistance Systems. Appl. Ergon. 2025, 125, 104474. [Google Scholar] [CrossRef]
- Villavicencio, L.I.; Kelley-Baker, T. Older Drivers and Advanced Driver Assistance Systems. AAA Found. Traffic Saf. 2020. Available online: https://aaafoundation.org/wp-content/uploads/2020/12/20-1327-AAAFTS_LongRoad-ADAS-FINAL.pdf (accessed on 4 March 2025).
- Xiao, H.; Chiu, W.; Shen, S. Understanding Individuals’ Continuance Intention to Use ADAS: An Integrated PLS-SEM and NCA Approach. Systems 2024, 12, 589. [Google Scholar] [CrossRef]
- Khattak, M.W.; Brijs, K.; Tran, T.M.; Trinh, T.A.; Vu, A.T.; Brijs, T. Acceptance Towards ADAS: A Validation of the UMDA Using SEM. Transp. Res. Part F 2024, 105, 284–305. [Google Scholar] [CrossRef]
- Schwindt-Drews, S.; Storms, K.; Peters, S.; Abendroth, B. Acceptance and Trust: Drivers’ First Contact with Released Automated Vehicles. arXiv 2023. [Google Scholar] [CrossRef]
- Yang, Y.; Kim, M.-Y. Promoting Sustainable Transportation: How People Trust and Accept Autonomous Vehicles—Focusing on the Different Levels of Collaboration Between Human Drivers and Artificial Intelligence. Sustainability 2025, 17, 125. [Google Scholar] [CrossRef]
- Zhang, T.; Li, W.; Huang, W.; Ma, L. Critical Roles of Explainability in Shaping Perception, Trust, and Acceptance of AVs. Int. J. Ind. Ergon. 2024, 100, 103568. [Google Scholar] [CrossRef]
- Diao, J.; Tang, R.; Gu, Y.; Tian, S.; Jiang, Z. Cognitive-Digital-Twin-Based Driving Assistance. IEEE Robot. Autom. Lett. 2023, 8, 5188–5195. [Google Scholar] [CrossRef]
- Kong, X.; Xing, Y.; Tsourdos, A.; Wang, Z.; Guo, W.; Perrusquia, A.; Wikander, A. Explainable Interface for Human-Autonomy Teaming: A Survey. arXiv 2024. [Google Scholar] [CrossRef]
- Oviedo-Trespalacios, O.; Tichon, J.; King, M. Is a Flick-Through Enough? A Content Analysis of ADAS Owner’s Manuals. Transp. Res. Part F 2021, 16, e0252688. [Google Scholar] [CrossRef]
- Pai, G.; Hungund, A.P.; Widrow, S.; Radadiya, J.; Pradhan, A.K. Users’ Perception of Training Approaches for ADAS. Proc. HFES Annu. Meet. 2021, 65, 279–283. [Google Scholar] [CrossRef]
- Orlovska, J.; Wickman, C.; Söderberg, R.; Bark, D.; Carlsson, C.; Gustavsson, P. Design and Implementation of Driver Coach Application for Pilot Assist: A First Validation Study. Transp. Res. Interdiscip. Perspect. 2024, 25, 101130. [Google Scholar] [CrossRef]
- Sule, S.Y.; Bitrus, E.; Solomon, Y. The Impact of ADAS on Road Safety in Nigeria. Asian J. Sci. Technol. Eng. Art. 2024, 2, 784–795. [Google Scholar] [CrossRef]
- Taourarti, I.; Choudhary, A.; Paswan, V.K.; Kumar, A.; Ramaswamy, A.; Ibanez-Guzman, J.; Monsuez, B.; Tapus, A. Estimating Complexity for Perception-Based ADAS in Unstructured Road Environments. In 2024 IEEE Intelligent Vehicles Symposium; IEEE: Piscataway, NJ, USA, 2024; pp. 305–310. [Google Scholar] [CrossRef]
- Dharshan, M.; Chakaliyawala, I.T. A Study on AI Special Reference to ADAS and Autopilot in Indian Automobile Industry. J. Dev. Econ. Manag. Res. Stud. 2023, 11, 151–159. [Google Scholar] [CrossRef]
- Sitinjak, C.; Simić, V.; Pamučar, D. Psychological Factors Shaping Public Acceptance of AVs in Indonesia. J. Transp. Health 2024, 34, 101726. [Google Scholar] [CrossRef]
- Chu, Y.; Yuan, Z.; Liu, P. Privacy Concern and Acceptability of Driver Monitoring Systems. Emerg. Technol. Future Work 2023, 117, 195–205. [Google Scholar] [CrossRef]
- Smyth, J.; Chen, H.; Donzella, V.; Woodman, R. Public Acceptance of Driver State Monitoring for Automated Vehicles: Applying the UTAUT Framework. Transp. Res. Part F 2021, 83, 179–191. [Google Scholar] [CrossRef]
- Wang, C.; Sun, Q.; Guo, Y.; Fu, R.; Yuan, W. Improving the User Acceptability of Advanced Driver Assistance Systems Based on Different Driving Styles: A Case Study of Lane Change Warning Systems. IEEE Trans. Intell. Transp. Syst. 2020, 21, 4196–4208. [Google Scholar] [CrossRef]
- Wang, Y.; Ota, N.; Debernard, S.; Popieul, J.-C. ADAS Evolution: LSTM-Driven Autonomous Adaptation to Individual Driver Preferences. IFAC Pap. 2024, 58, 230–235. [Google Scholar] [CrossRef]
- Neumann, T. Analysis of Advanced Driver-Assistance Systems for Safe and Comfortable Driving of Motor Vehicles. Sensors 2024, 24, 6223. [Google Scholar] [CrossRef]
- Deiana, F.; Jackson, J.; Periago, C.; Castro, E. Assessing Driver Engagement in Assisted Driving. AHFE Int. 2024, 159, 2127–2139. [Google Scholar] [CrossRef]
- Drożyner, P.; Mikołajczak, P. Drivers’ Confidence in ADAS Technologies. Tech. Sci. 2024, 27. [Google Scholar] [CrossRef]
- Afshari, A.; Azadnia, A.; Ghasemzadeh, M.; Yazdani, S.; Razzaghi, A.; Daneshi, S.; Hushmandi, K. Driving Safer: A Look at How Men and Women Use Advanced Driver Assistance Systems. Russ. Open Med. J. 2024, 13, 1–9. [Google Scholar] [CrossRef]
- Li, X.; Lin, K.-Y.; Meng, M.; Li, X.; Li, L.; Hong, Y.; Chen, J. A Survey of ADAS Perceptions with Development in China. IEEE Trans. Intell. Transp. Syst. 2022, 23, 14188–14203. [Google Scholar] [CrossRef]
- Hafeez, F.; Mas’ud, A.A.; Al-Shammari, S.; Sheikh, U.U.; Alanazi, M.A.; Hamid, M.; Azhar, A. Autonomous Vehicles Perception, Acceptance, and Future Prospects in the GCC: An Analysis Using the UTAUT-Based Model. World Electr. Veh. J. 2024, 15, 186. [Google Scholar] [CrossRef]
- Nunnally, J.C.; Bernstein, I.H. Psychometric Theory, 3rd ed.; McGraw-Hill: New York, NY, USA, 1978. [Google Scholar]
- George, D.; Mallery, P. IBM SPSS Statistics 26 Step by Step: A Simple Guide and Reference, 16th ed.; Routledge: New York, NY, USA, 2019; p. 402. [Google Scholar] [CrossRef]
- Zwick, W.R.; Velicer, W.F. Comparison of five rules for determining the number of components to retain. Psychol. Bull. 1986, 99, 432–442. [Google Scholar] [CrossRef]
- Hair, J.F.; Black, W.C.; Babin, B.J.; Anderson, R.E. Multivariate Data Analysis, 8th ed.; Cengage Learning: Andover, UK, 2019. [Google Scholar]
- Tabachnick, B.G.; Fidell, L.S. Using Multivariate Statistics, 6th ed.; Pearson: Boston, MA, USA, 2013. [Google Scholar]
- Gujarati, D.N.; Porter, D.C. Basic Econometrics, 5th ed.; McGraw-Hill Education: New York, NY, USA, 2009; ISBN 978-0-071-27625-2.G. [Google Scholar]
- O’brien, R.M. A Caution Regarding Rules of Thumb for Variance Inflation Factors. Qual. Quant. 2007, 41, 673–690. [Google Scholar] [CrossRef]
- Pradhan, A.; Pulver, E.; Zakrajsek, J.; Bao, S.; Molnar, L. Perceived Safety Benefits, Concerns, and Utility of Advanced Driver Assistance Systems among Owners of ADAS-Equipped Vehicles. Traffic Inj. Prev. 2018, 19 (Suppl. S2), S135–S137. [Google Scholar] [CrossRef]
- Leonardi, S.; Distefano, N.; Pulvirenti, G. Identification of Road Safety Measures for Elderly Pedestrians Based on k-Means Clustering and Hierarchical Cluster Analysis. Arch. Transp. 2020, 56, 107–118. [Google Scholar] [CrossRef]
- Distefano, N.; Leonardi, S. Older Drivers’ Performance at Intersections: An Experimental Study in Italy. Civ. Eng. Archit. 2022, 10, 253–266. [Google Scholar] [CrossRef]
- Nylen, A.B.; Reyes, M.; Roe, C.A.; McGehee, D. Impacts on Driver Perceptions in Initial Exposure to ADAS Technologies. Transp. Res. Rec. 2019, 2673, 354–360. [Google Scholar] [CrossRef]
- Choy, E.; Patel, S.J.; Chaparro, A. Safety First: User Needs Analysis of Advanced Driver Assistance Systems (ADAS) to Determine Learning Preferences. Proc. Hum. Factors Ergon. Soc. 2022, 66, 1310–1314. [Google Scholar] [CrossRef]


Disclaimer/Publisher’s Note: The statements, opinions and data contained in all publications are solely those of the individual author(s) and contributor(s) and not of MDPI and/or the editor(s). MDPI and/or the editor(s) disclaim responsibility for any injury to people or property resulting from any ideas, methods, instructions or products referred to in the content. |
© 2025 by the authors. Licensee MDPI, Basel, Switzerland. This article is an open access article distributed under the terms and conditions of the Creative Commons Attribution (CC BY) license (https://creativecommons.org/licenses/by/4.0/).