1. Introduction
Driving simulators are sophisticated tools that are widely used to test and optimize vehicle performance such as handling [
1,
2], ride comfort [
3,
4,
5], and NVH [
6]. By creating virtual environments that replicate real-world driving conditions, driving simulators enable engineers to evaluate a vehicle’s dynamic behavior without the need for physical prototypes, not only accelerating the development cycle but also significantly reducing costs associated with building and testing different prototypes [
2]. In particular, NVH, unlike other vehicle performance, is highly dependent on the human subjective perception [
7]. Therefore, driving simulators that can provide drivers with motion, visual, and auditory feedback have a great potential for NVH development [
6].
In the traditional NVH development process, the physical prototype is required for benchmarking, target positioning, and fine-tuning of the NVH performance predicted by appropriate mathematical models. However, thanks to the realism and immersion provided by driving simulators, engineers, decision-makers, and customers can evaluate the NVH characteristics, even in an early design stage and without the need for a physical prototype, significantly enhancing efficiency in the development process [
8,
9].
NVH performance is described by multiple physical attributes, such as whole-body vibration, hand–arm vibration, structure- and air-borne noise, acting on a wide range of frequencies, typically up to 8000 Hz. However, most driving simulators usually are only able to properly reproduce a single attribute or a specific frequency range [
10]. Single-vibrator based simulators are typically used for investigating low-frequency vertical whole-body vibrations up to 20 Hz [
11,
12,
13,
14]. More sophisticated driving simulators based on Stewart platforms, and able to complex spatial motions, can accurately reproduce six Degrees-of-Freedom (DOF) vibrations in the 1–10 Hz frequency range and can be effectively used to evaluate whole-body vibration comfort [
3]. Noise evaluation is usually performed by resorting to desktop NVH simulators, which do not provide any motion feedback and are employed for tire/road or powertrain noise analysis, active sound design, and vehicle exterior sounds [
15,
16,
17].
Drivers interact with the vehicle at specific touch points, such as seat, pedal, and steering wheel. Such points are of paramount importance to provide the correct NVH feedback to the driver. For this reason, driving simulators often feature on-board shakers able to provide vibrations in the 20 to 200 Hz range. In [
18,
19], an electrodynamic shaker is connected to the steering shaft to reproduce the steering wheel vibration, while in [
20], an electric actuator is employed to provide steering haptic feedback. In [
21], a full-vehicle simulator employing multiple shakers to compensate for vibration responses at touch points is presented. One shaker at the seat back provides longitudinal excitation, two on the seat base generate lateral and vertical vibrations, one on the floor pan produces vertical vibrations, and two on the steering shaft deliver lateral and vertical excitation to the steering wheel.
However, despite the availability of vibration compensation for specific frequency bands, it is still difficult to perform simulations across the entire frequency spectrum, where motion, vibration, and sound are seamlessly integrated for a realistic experience. This is due to the difficulty in coordination and control between various actuators in different frequency ranges. In [
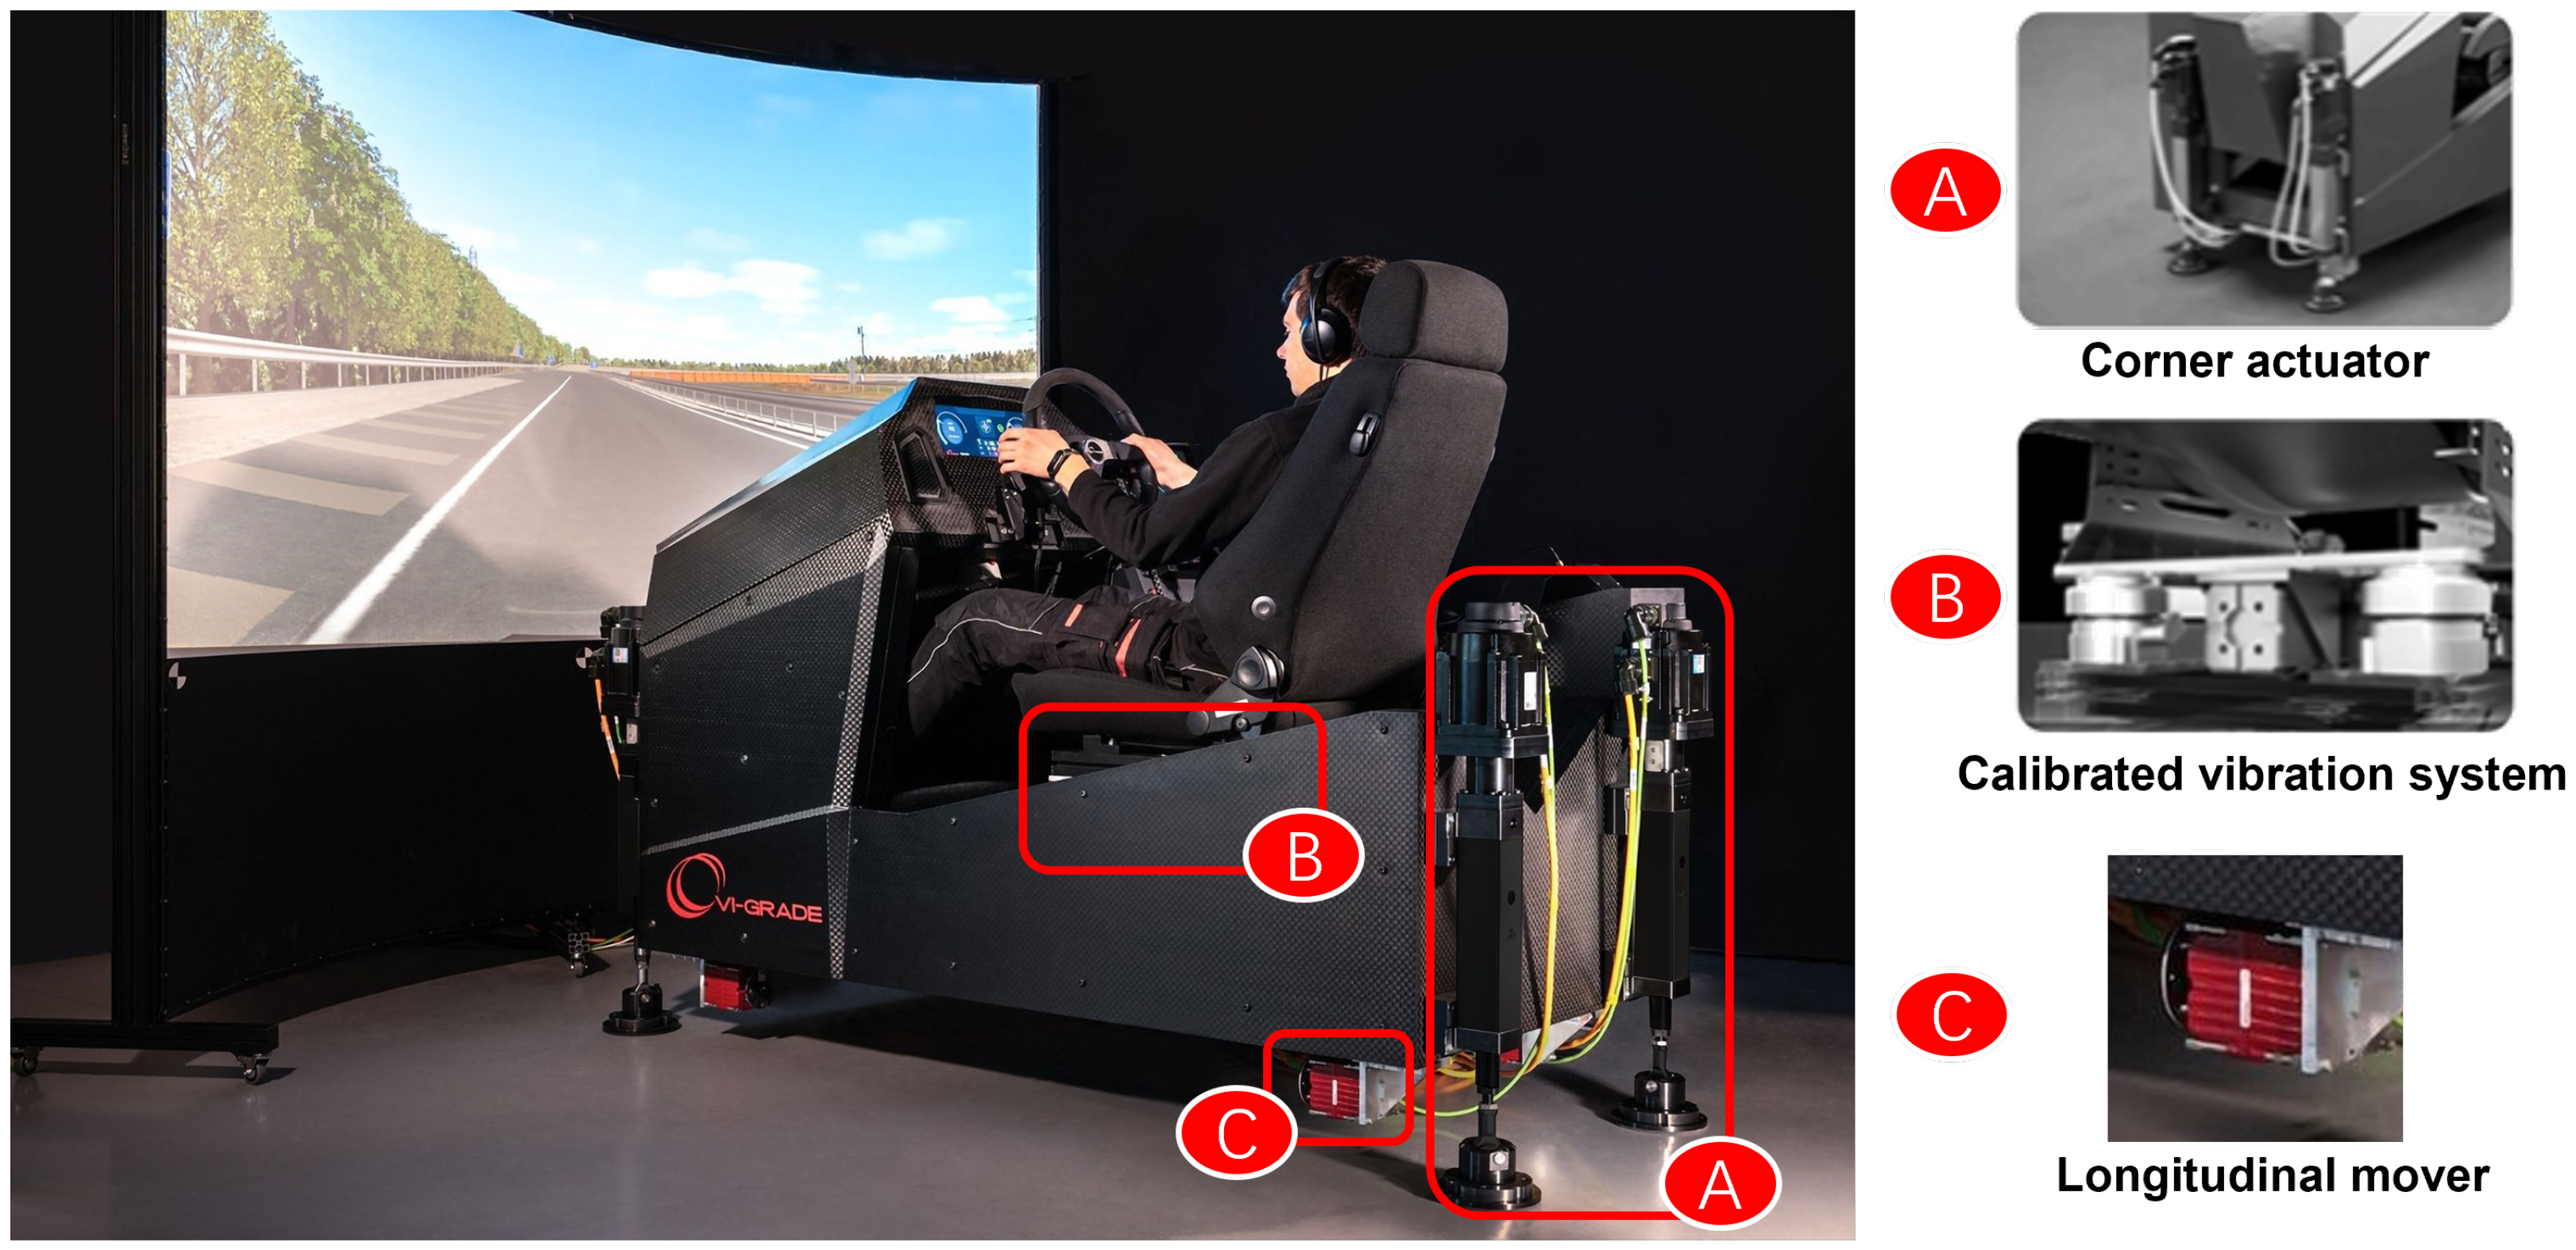
22], a compact full-spectrum simulator (FSS) is developed to integrate multiple actuators for a full-spectrum response in 0.5 Hz–20 kHz. Four corner actuators handle vehicle body motion in vertical, pitch, and roll, while four longitudinal movers compensate for high-frequency longitudinal vibrations. Three shakers located under the seat and four shaker acting at the steering wheel shaft provide tactile feedback at key touch points. Sound is delivered via headphones, speakers, or a subwoofer.
The coordination and control problems of the actuators in driving simulators limit the ability to achieve an accurate full-spectrum simulation. Optimizing the mechanical system is an effective way to reduce the coupling effect and control complexity. For complex mechanical systems like driving simulators, vibration crosstalk refers to the unintended propagation of vibrations from one part of the system to another through shared components or structural paths, leading to unintended vibration coupling [
23]. This results in energy transfer between different vibration modes or directions, causing unpredictable and harder-to-control system responses. To minimize the vibration crosstalk phenomenon, an effective and commonly used method is the proper setting of vibration isolators (such as positions, stiffness, loss angle, etc.), especially in powertrain mounting system design [
24,
25,
26,
27] and chassis vibration isolation [
28,
29,
30]. In [
26], the stiffness parameters of mounting system are optimized by using the genetic algorithm (GA), achieving over 10% improvement in vibration isolation by maximizing decoupling rates and ensuring a modal frequency difference of at least 0.5 Hz.
In this paper, the problem of crosstalk reduction is discussed with particular reference to the full-spectrum simulator presented in [
22]. The aim of the work is to reduce cross-directional responses to the input and ensure alignment between input and output directions for effective transmission to the target location. The comprehensive design process of the seat bushings to minimize the crosstalk in the seat vibration system of the considered full-spectrum simulator is described. Specifically, a flexible multibody dynamic model of the simulator is developed and validated through modal testing. Furthermore, a sensitivity analysis is performed on the seat bushing stiffness and position. The results reveal that the contribution of the bushing positions is minimal, leading to stiffness parameters being selected as the key design variables. To enhance optimization efficiency, a surrogate model based on the response surface methodology (RSM) [
31] is employed, replacing the physical model during the optimization process. To solve the multiobjective optimization problem, the weighted sum method [
32] is utilized.
The paper is organized as follows. Firstly,
Section 2 introduces the multibody model used throughout the paper. The model is validated by a modal test on the physical prototype. Then,
Section 3 defines the optimization problem and the optimization method used. In
Section 4, the result of the optimization is shown and discussed. Finally,
Section 5 concludes the paper.
3. Optimization of the Frequency Response of the Seat System
The optimization of the dynamic behaviour of the simulator aims to improve the performance of the driving simulator mainly by minimizing the vibration crosstalk. Excessive crosstalk degrades system accuracy and effectiveness by introducing noise and unwanted signal coupling, compromising signal integrity and separation.
To compute the transfer functions of the simulator, a sine sweep force input ranging from 10 to 100 Hz is applied at each of the three shakers acting on the mounting plate of the seat by using Hexagon Adams/Vibration module. As shown in
Figure 5, three shakers are installed between the two mounting plates of the seat. Each of the three shakers is aligned to one of the three directions of the reference system and is named as seat shaker
X, seat shaker
Y, or seat shaker
Z accordingly to its actual direction. The three shakers are positioned as shown in
Figure 5. Since the seat of the simulator can be replaced according to customer requirements, the vibration response at the center of the seat mounting plate is particularly critical. Thus, the output acceleration signals are measured at the top seat mounting plate’s center point, highlighted in
Figure 5 and indicated by the letter A. The accelerations of this point are measured along the three directions of the coordinate systems, i.e., in
X (longitudinal),
Y (lateral), and
Z (vertical) directions. These measured accelerations are then used to compute the transfer function between each seat shaker and point A. A total of nine transfer functions are considered. For each direction of the excitation force provided by the actuators, three transfer functions are computed, one in the same direction of the excitation and one for each of the two orthogonal directions. The two transfer functions along the orthogonal directions represent the crosstalk effects that have to be minimized. To obtain a consistent scale for all transfer functions, the transfer functions, referring to different output direction but pertaining to the same input direction, are normalized with respect to the maximum amplitude of the transfer function aligned with the input direction.
Figure 6 shows the normalized transfer functions referring to the three seat shaker inputs’ directions for the initial design of the simulator. The notation adopted in the figure is as follows. Each transfer function is indicated as
, where
i represents the input direction (
), and
j represents the output direction (
). For instance, the notation
represents the transfer function between the input force applied under the seat along the
X direction and the output acceleration measured at the seat mount in the
Y direction.
Figure 6b shows the three transfer functions in the case of excitation force along
Y. In this case, the transfer function referring to the
Y direction, i.e., aligned with the excitation direction, is significantly greater than the corresponding transfer functions for the other directions, exhibiting a low level of crosstalk in the whole considered frequency range from 10 to 100 Hz. For this excitation direction, the initial design has a limited crosstalk transmission of the vibration allowing for an adequate control of the desired vibration amplitude.
Conversely, a high level of crosstalk has been found when the excitation is given in the other two directions, i.e.,
X and
Z, as shown in
Figure 6a,c. The crosstalk is always between the directions
X and
Z, while the transfer functions referring to the acceleration in the
Y direction have smaller amplitude. In particular, when the input excitation force is given along the
X direction, the maximum crosstalk with respect to the acceleration in the
Z direction occurs in the frequency range between 20 and 40 Hz, while the crosstalk for the
Z input direction with respect to the acceleration in the
X direction shows its maximum values between 40 and 50 Hz.
In the following optimization, given the limited crosstalk value associated with the Y direction, most effort will be devoted to the crosstalk reduction in the other two directions.
3.1. Design Variables
For the optimization of the simulator’s frequency response, two sets of design variables are considered. The first set pertains to the mechanical properties of the rubber bushings, specifically stiffness and damping, while the second set refers to the positioning of the rubber bushings.
Stiffness and damping play a crucial role in the frequency response of rubber bushings. Also, these parameters in rubber are strongly dependent on the excitation frequency, amplitude, and preload [
33]. In the early concept design stage, the dynamic stiffness of bushings can be estimated by multiplying the static stiffness by a factor, the so-called dynamic stiffness coefficient, to provide a fast approximation within a limited frequency range [
7]. To reduce the model complexity, the dynamic stiffness [
7] can be defined as follows:
where
is the dynamic stiffness (N/mm),
the static stiffness (N/mm), and
is the dynamic stiffness coefficient, which ranges from 1.1 for soft, highly elastic natural rubber compounds to 2.5 for synthetic compounds with large stiffness [
7]. In this paper,
is considered constant and equal to 1.4, which is consistent with the initial design.
The damping characteristics of the bushing can be defined as a function of the dynamic stiffness defined in Equation (
1) as
where
r is the damping coefficient (Ns/mm) of the bushing, and
is the loss angle, which varies from 2° for soft natural rubber compounds to approximately 20° for butyl rubber compounds. For the bushings featuring highly elastic natural rubber compounds, the loss angle is between 3° and 6° [
7]. Consistent with the initial design,
is assumed equal to
.
is the reference working frequency.
According to Equations (
1) and (
2), both dynamic stiffness and damping can be expressed as a function of the static stiffness. Therefore, only front and rear bushings’ static stiffness in
X,
Y, and
Z directions are considered as design variables. To obtain a symmetric arrangement of the driving simulator, the stiffness of the corresponding bushings on the right and left side of the seat is considered equal. As a consequence, six design variables are considered for the stiffness of the bushings, three for the front bushings and three for the rear ones. To highlight the changes relative to the initial design, the stiffness-related design variables are determined by scaling the initial stiffness using a percentage factor. In the initial design, the front and rear bushings share the same stiffness. Thus, the stiffness of bushings for the optimization is defined as
where
K is the stiffness value after applying the design modification, and
is the initial stiffness value. Additionally,
represents the percentage scaling factor of the bushing stiffness.
The second set of design variables refers to the positioning of the bushings. In fact, the actual location of the bushing can modify the transfer functions and, in particular, reduce crosstalk [
34]. To describe the positioning of the bushings, the variation along the
X and
Y directions of the bushing distances with respect to the original design is considered. Also, to maintain a symmetric displacements of the bushings, the bushings on the right and left side of the seat are moved to remain symmetric with respect to the centre of the seat. As a result, two design variables are used to define the variation in the displacements of the bushings with respect to the initial design of the simulator.
The design variables and related feasible ranges are summarized in
Table 2.
3.2. Optimization Problem Definition
The objective is to reduce vibration crosstalk, ensuring that the force input in each direction primarily affects the acceleration output in the same direction, with minimal cross-coupling to other directions.
The effect of each input actuation with respect to each acceleration output is quantified as the mean value of the corresponding transfer function magnitude in the frequency range between 10 and 100 Hz. The optimization problem objective is to maximize this value computed for transfer functions with the same input and output directions and minimize the value computed for transfer functions with different input and output directions. Given that lateral seat vibrations are less critical for comfort and NVH assessment [
7,
35,
36], and due to the already low level of crosstalk associated with the seat shaker
Y input in the reference configuration, the transfer functions related to this input are excluded from the optimization process.
The multiobjective optimization problem is defined as follows:
where
is the mean magnitude of the transfer function, with
the input direction and
the output direction.
represents the design variables, and
is the feasible domain of the design variables. Additionally, although the response to the seat shaker
Y input is excluded from the optimization objective, the mean values of the transfer functions’ magnitude for the seat shaker
Y input are also calculated to monitor response changes throughout the optimization process.
3.3. Sensitivity Analysis
To investigate the sensitivity of the design variables on the system’s responses, a design of experiment (DOE) approach has been completed by using Hexagon Adams/Insight module. In total, 128 combinations of design variables are generated by using the Latin hypercube method within the feasible domain. Additionally, the responses (mean value of the transfer transfers’ magnitude) are computed.
In order to quantify the effect of each factor more intuitively, the main effect percentage [
37] is introduced as follows:
where
is the main effect percentage of the
i-th factor for the
j-th response.
is the main effect of the
i-th factor.
is the response with all factors at their average value. The main effect,
, is defined as the difference between responses with the maximum and minimum values of the factor
when other factors keep at their average values and reads
where
and
mean that the
i-th factor in the design variable vector
is set to its maximum and minimum value, respectively.
indicates that the other factors in
are set to their average values.
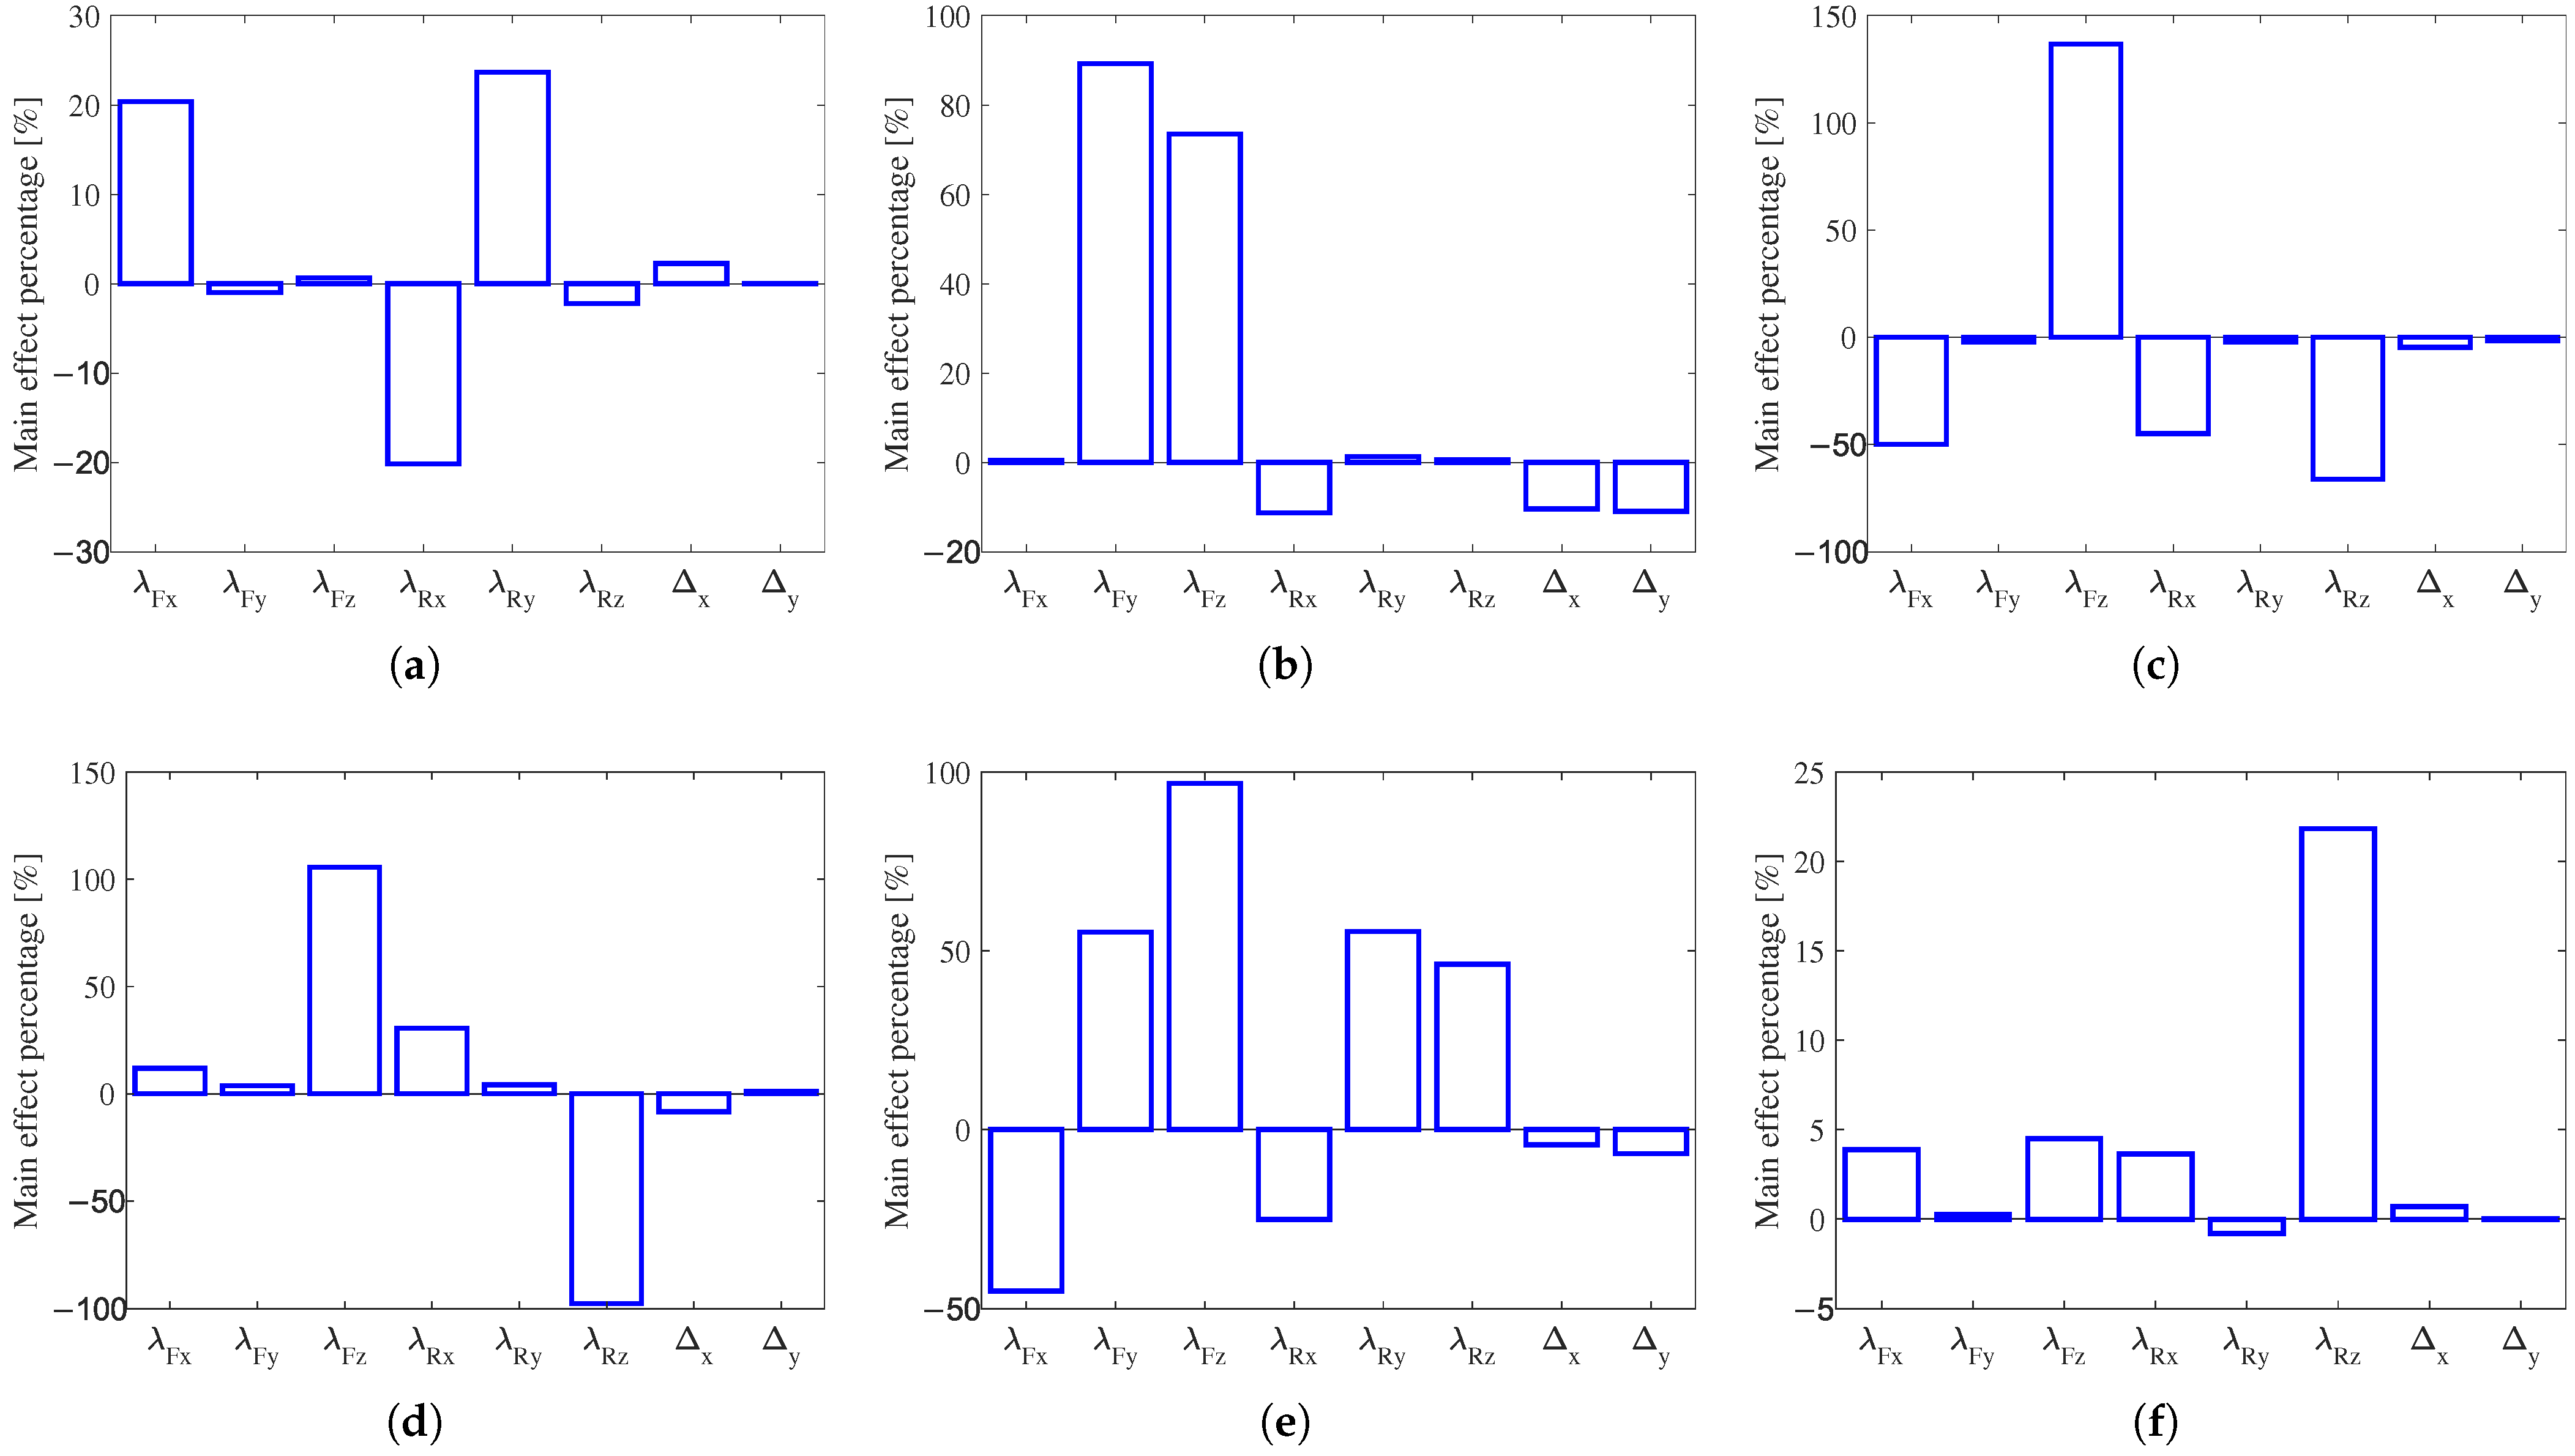
Figure 7 shows the main effect percentage for each design variable obtained from the sensitivity analysis. The result shows that the longitudinal distance change
and the lateral distance change
of the bushings exhibit relatively small mean effect percentages across all input–output configurations, indicating minimal contribution to the system’s dynamic response. In contrast, the stiffness parameters of bushings, particularly
,
, and
, demonstrate a significant impact on the dynamic response. Thus, only the stiffness parameters of seat bushings are considered as design variables for the following optimization.
3.4. System Optimization
The flexible multibody model of the simulator requires several minutes for the computation of the transfer functions for each set of design variables. As the optimization process requires a large number of simulation, to have an acceptable computational time, a surrogate model based on cubic response surface methodology (RSM) is employed to approximate the relationship between the inputs and outputs of the system. RSM is a mathematical method used to approximate the relationship between the response and multiple input variables through a polynomial model in complex systems or processes [
38]. For a system with input variable
and output
y, the general form of a cubic response surface model can be defined as follows:
where
,
,
,
,
,
, and
are coefficients of the polynomial, and
is the error term. Considering the six design variables of the considered optimization problem, a total of 84 coefficients are present in the surrogate model. These coefficients have been computed by a least squares approach using the data generated by the DOE analysis described in
Section 3.3.
In order to evaluate the accuracy of the response surface model, both the coefficient of determination (
) and the adjusted coefficient of determination (
) are computed [
39].
can be used for evaluating the fitting performance of the surrogate model and calculated as follows:
where
represents the actual response of the physical model,
the
i-th prediction of the surrogate model (i.e., the RSM model), and
the mean value of all n observed values
. However, since
can increase with the addition of more design variables, even if the new design variable is unrelated to the response, the adjusted R-square
is employed to provide a more reliable measure of the fitting model performance. This measure is particularly informative in the case of complex models as it introduces a penalty for adding non-informative variables [
39].
is calculated as follows
where
n is the total number of samples, and
p the number of design variables.
Table 3 shows the fitting performance of the created RSM model. For all six response, both
and
are greater than 0.9, indicating good accuracy of the surrogate model in representing the relationship between inputs and outputs.
The calibrated RSM model has been used for finding the optimal solution of the problem. Instead of the surrogate modeling, the optimization algorithm also plays an important role in improving the optimization efficiency. Multiobjective Evolutionary Algorithms (MOEAs), such as non-dominated sorting genetic algorithm II (NSGA-II) [
40] and the improved niche genetic algorithm (INGA) [
41], are effective methods to get a Pareto optimal set. However, this kind of algorithm requires numerous time-consuming simulations for individual evaluations in each generation, resulting in a time-consuming optimization. Another approach to solve the multiobjective optimization problem is to convert the multiobjective problem into a single-objective problem. In this way, the solution can be found at a reduced computational cost. Among the different available algorithms, such as the weighted sum [
32],
-constraint [
32], normal constraint [
42,
43], and problem decomposition method [
44], that can be used to reduce the optimization problem, in the following, the weighted sum method is used. This method provides a simple, flexible, and widely applicable multiobjective optimization solution that linearly combines multiple objectives into a single objective.
The weighted sum method allows decision-makers to easily explore trade-offs between objectives. The basic idea of this method is to transform multiple objectives optimization problems into a single-objective optimization problem by assigning different weights to each objective, according to the importance of the objective [
32]. Weight assignment to the different objective functions is the most critical phase of the approach. The weights are usually determined based on expert’s knowledge and judgment or user’s requirements.
By applying the weighted sum method, the optimization problem can be rewritten as follows:
where
is the weight for the
i-th objective function
.
The weights have been chosen to minimize the crosstalk between the
X and
Z directions, which are the most coupled as shown in
Figure 6. The chosen weights are reported in
Table 4. The minus sign of the weights for
and
in the table indicates that these functions have actually to be maximized.
4. Results and Discussion
To quantify the reduction in the crosstalk before and after optimization, the improvement percentage,
, is employed and defined as follows
where
and
are defined in Equation (
12) and represent the mean magnitude differences of the transfer function between the aligned direction (
) and the cross-direction (
) for the seat input in the
i direction computed for the initial design and for the optimal design, respectively.
Table 5 shows the values of the optimized design variables and the computed percentage improvement. The improvement has been computed by using the physical model. It shows that, with respect to the initial design, the crosstalk between the
X–
Z axes is significantly improved, with a 57.74% reduction for the acceleration along
Z when the excitation force is given along
X and 18.18% reduction for the acceleration along
X when the excitation force is given along
Z. If crosstalk in the
Y direction is considered, even though the transfer functions related to this direction were not included in the optimization process, only a small increase of 7.69% and 2.60% in the acceleration in the
Y direction can be observed when the excitation force is applied along the
X and
Z directions, respectively.
The transfer functions computed for the optimal values of the design variables are depicted in
Figure 8a–c. The figures show that the crosstalk has been significantly mitigated. After the optimization, in the no excitation direction, the value of the transfer functions of cross-directional vibrations exceed the value of the transfer function of the vibrations aligned with the input direction in the whole analyzed frequency range. In particular, when the exciting force in the
X direction is considered (
Figure 8a), the difference between the magnitudes of the transfer functions
and
has substantially increased compared with the initial design, resulting in the elimination of crosstalk across the entire frequency analysis range. If the excitation in the
Z direction is considered, a substantial improvement in the crosstalk reduction can be observed, too. Additionally, if
Figure 6b and
Figure 8b are compared, no significant worsening in the response to an excitation in the
Y direction can be observed, even if these transfer functions were not considered in the optimization process. While the improvement for the seat shaker
Z input is not as large as the one related to the seat shaker
X input, in this case, the crosstalk has been eliminated. Furthermore, the performance for the seat shaker
Y input remains consistently effective.
As shown in
Table 5, the optimal stiffness of the rear seat bushings is approximately double that of the front seat bushings, leading to a significant size difference. This difference can complicate the assembly and adjustment processes of the simulator and lead to a degradation of the expected NVH performances due to differences in the system geometry. To accommodate rear bushings with the required stiffness, the rear bushings layout has been modified. Specifically, at the rear, the number of bushings is increased to four and arranged in two rows of two. The layout of the bushing at the front has remained unchanged.
In order to verify the new layout, the flexible multibody model of the simulator has been updated to include two rows of bushings at the rear. To be consistent with the optimal design parameters, the stiffness in each direction of each of the rear bushing has been set to half of the optimal value, as reported in
Table 6. The corresponding improvement percentages are calculated and shown in
Table 6. Although the new layout achieve less improvement in minimizing crosstalk than the previous layout, it still shows a significant improvement compared with the initial design.
Figure 8d–f show the corresponding normalized transfer functions for the new layout.
By comparing the optimal design (
Figure 8a–c) with the new layout (
Figure 8d–f), it can be observed that the new layout, modified to accommodate bushings with the required stiffness, has a very small effect on the optimized transfer functions.
5. Conclusions
The paper presents a comprehensive design optimization method for improving the NVH performances of a compact full-spectrum driving simulator seat system. Specifically, to optimize the NVH performances of the driving simulator, the crosstalk, i.e., undesired vibration components in direction orthogonal to the actuators’ excitation directions, should be minimized. As the crosstalk is due to the structural coupling of the vibrations, an optimization procedure has been developed for its reduction.
A flexible multibody dynamics model of the simulator has been developed and validated through modal testing. Additionally, the flexible multibody model has been employed for performing a sensitivity analysis and to identify the key design variables of the system. From this analysis, the stiffness of the seat’s bushings has proven to be the most relevant design variable, while bushing positions have less effect on the performance optimization. An efficient optimization framework combining a cubic response surface surrogate model and weighted sum optimization algorithm was employed to solve the multiobjective optimization problem. The optimal design achieves a maximum improvement 57.74% in terms of vibration crosstalk reduction compared to the initial design. Furthermore, the condition where the cross-axial input–output response exceeds that of the coaxial input–output response has been eliminated across the entire analyzed frequency range. Additionally, due to a significant difference in optimal stiffness values between rear and front bushings, the rear bushing layout has been modified from two to four bushings to prevent assembly-related issues and potential NVH concerns. This revised layout not only effectively reduces crosstalk across various frequency ranges but also provides a smoother transfer function, enhancing the dynamic performance of the driving simulator compared to the original design. These improvements contribute to a more refined and realistic simulator seat vibration, enhancing its potential for ride comfort and NVH research and development.

 ,
, 


