Article

On-Board Smartphone-Based Road Hazard Detection with Cloud-Based Fusion

1
Department of Automotive Engineering, Clemson University, Clemson, SC 29634, USA
2
Computer Science, Physics and Engineering Department, Benedict College, Columbia, SC 29204, USA
*
Author to whom correspondence should be addressed.
Vehicles 2023, 5(2), 565-582; https://doi.org/10.3390/vehicles5020031
Submission received: 21 March 2023 / Revised: 29 April 2023 / Accepted: 5 May 2023 / Published: 11 May 2023

Abstract

:
Road hazards are one of the significant sources of fatalities in road accidents. The accurate estimation of road hazards can ensure safety and enhance the driving experience. Existing methods of road condition monitoring are time-consuming, expensive, inefficient, require much human effort, and need to be regularly updated. There is a need for a flexible, cost-effective, and efficient process to detect road conditions, especially road hazards. This work presents a new method to deal with road hazards using smartphones. Since most of the population drives cars with smartphones on board, we aim to leverage this to detect road hazards more flexibly, cost-effectively, and efficiently. This paper proposes a cloud-based deep-learning road hazard detection model based on a long short-term memory (LSTM) network to detect different types of road hazards from the motion data. To address the issue of large data requests for deep learning, this paper proposes to leverage both simulation data and experimental data for the learning process. To address the issue of misdetections from an individual smartphone, we propose a cloud-based fusion approach to further improve detection accuracy. The proposed approaches are validated by experimental tests, and the results demonstrate the effectiveness of road hazard detection.

Graphical Abstract

1. Introduction

Road hazards can result in significant injuries and fatalities, making them a major public health and safety concern worldwide. The NHTSA estimated that there were 42,915 fatalities in vehicle crashes in 2021, which is over a 10% increase from 2020 [1]. One of the major causes of road accidents in the U.S. is road hazards. Road hazards such as potholes, roadwork, vehicles that have been in an accident, and other unexpected obstacles lead to fatal incidents every year. Being aware of such road hazards can contribute to a decrease in accidents and an increase in safety, comfort, and fuel economy. Traditional techniques to monitor road surfaces include surveying techniques and profilometer measurements. Surveying is a traditional technique to monitor road surface conditions, wherein a technician walks down the road to assess road defects. Such a technique requires efforts by human inspection, is prone to human errors, has limited coverage, is time-consuming, and does not provide road defect data in real time. Another method is to use a profilometer to measure the road surface’s profile, roughness, and other characteristics by laser non-contact profilometers or physical sensor contact-based profilometers. The profilometer apparatus is costly and operated by qualified experts only.
Previously, researchers came up with different techniques for detecting road conditions smartly using different classification algorithms. Most of those attempts are based on signals from the motion of vehicles, such as speed and acceleration. For example, González et al. [2] used acceleration measurements from vehicles to detect the road surface’s roughness and classify the road’s profile. They proposed a method for the estimation of power spectral density to detect road damage levels using transfer functions and the relationship between vehicle acceleration and the road’s surface. Chen et al. [3] proposed a low-cost global positioning system (GPS) and a low-cost inertial measurement unit (IMU) sensor in a vehicle to analyze the power spectral density and classify the roughness of the road pavement. Lei et al. [4] proposed an IMU-based distributed sensor network to estimate road and traffic conditions. The use of vision-based techniques is another prominent trend in the current works. Li et al. [5] proposed a CNN-based network to detect different types of road conditions with information from a customized camera setup. Tsai et al. [6] discussed the various segmentation algorithms used to classify types of pavement distress. Llopis-Castello et al. [7] took into consideration the quantification of the type of distress experienced by a road, along with the identification and classification of the distress. Alipour et al. [8] proposed a deep, fully convolutional crack detection model (CrackPix) by transforming the fully linked layers of common image classification architectures into convolutional filters for dense predictions.
Although these recently developed methods for monitoring road conditions are far more practical than the conventional approaches, they still depend on specialized data collection devices; this restricts the scope of their uses. In order to enhance driving comfort and safety in the transportation system, it would be advantageous to continuously monitor road conditions if an effective and economical approach could be created. The use of smartphones has skyrocketed in recent years. Smartphones also feature an increasing amount of processing power and a wide range of sensors, including an accelerometer, gyroscope, magnetometer, GPS, and camera. Smartphones are the best devices for creating a mobile in-vehicle sensor network because of these features. Researchers have examined the potential of utilizing smartphones to monitor road conditions. Sattar et al. [9] studied how deep learning techniques, such as long short-term memory (LSTM) and convolutional neural networks (CNN), can be used to detect road features such as potholes or bumps from data collected from cyclists’ iPhones. Varona et al. [10] employed deep learning techniques and data from smartphones to recognize various types of road surfaces and potholes. Chatterjee et al. [11] examined what influences smartphone measurements in a moving vehicle the most and how that alters measurements of road roughness. Some cloud computing-based technologies have been used previously to monitor road conditions. Ramesh et al. [12] developed a cloud-computing-based road condition monitoring technique using motion and vision data from smartphones. Ameddah et al. [13] applied a similar cloud-based technique to detect road conditions with good precision in less time. Yuan et al. [14] used a cloud-based system to alert the end users of road conditions. Pham et al. [15] used a faster R-CNN for the vision-based detection of road damage. A few research works have shown that the usage of LSTM networks to predict time-series-based data has been effective. LSTM networks have been used in numerous studies to detect and predict patterns from time series data. For instance, Mahjoub et al. (2022) [16] used LSTM networks to anticipate energy consumption. Kapoor et al. (2020) [17] used an LSTM network to predict time-series-based complex patterns for the prediction of stock prices. Some research has suggested that LSTM models perform better than similar models, with a few using different machine learning models. Ma et al. (2022) [18] compared LSTM and an autoregressive integrated moving average model (ARIMA) to predict quality control patterns based on 24 pre-recorded QC items. LSTM outperformed ARIMA model. Poh et al. (2019) [19] compared LSTM and a hidden Markov model (HMM) to detect anomilies in daily activity sequences. Their results showed that LSTM outperforms the HMM.
However, despite the recent efforts focusing on road conditions, road hazards have not been well studied yet. Road hazards can be caused by bad road conditions, such as potholes, as well as some road events, such as roadwork, vehicles that have been involved in accidents, and other unexpected obstacles. In addition, sufficient acquisition of road hazard data is another challenge in conducting such a study, especially for deep-learning-based approaches, which usually require a large amount of data. Furthermore, the detection accuracy of an individual smartphone cannot always be 100% due to the sensing and vehicle position variations that occur when it passes through potential road hazards. Therefore, the objective and contribution of the current paper are to develop a technique to detect road hazards using smartphones that is data-abundant and cost-effective. The proposed method uses motion data from smartphones with a deep learning network based on LSTM to estimate potential road hazards. We propose to leverage both real-world vehicle data and simulated vehicle data to generate sufficient data with combined learning to address the issue of large data requests for deep learning. We also propose a cloud-based fusion approach to further improve the detection accuracy to address the issue of misdetections from an individual smartphone. The proposed approaches are validated and demonstrated through experimental results.

2. Materials and Methods

2.1. System Framework

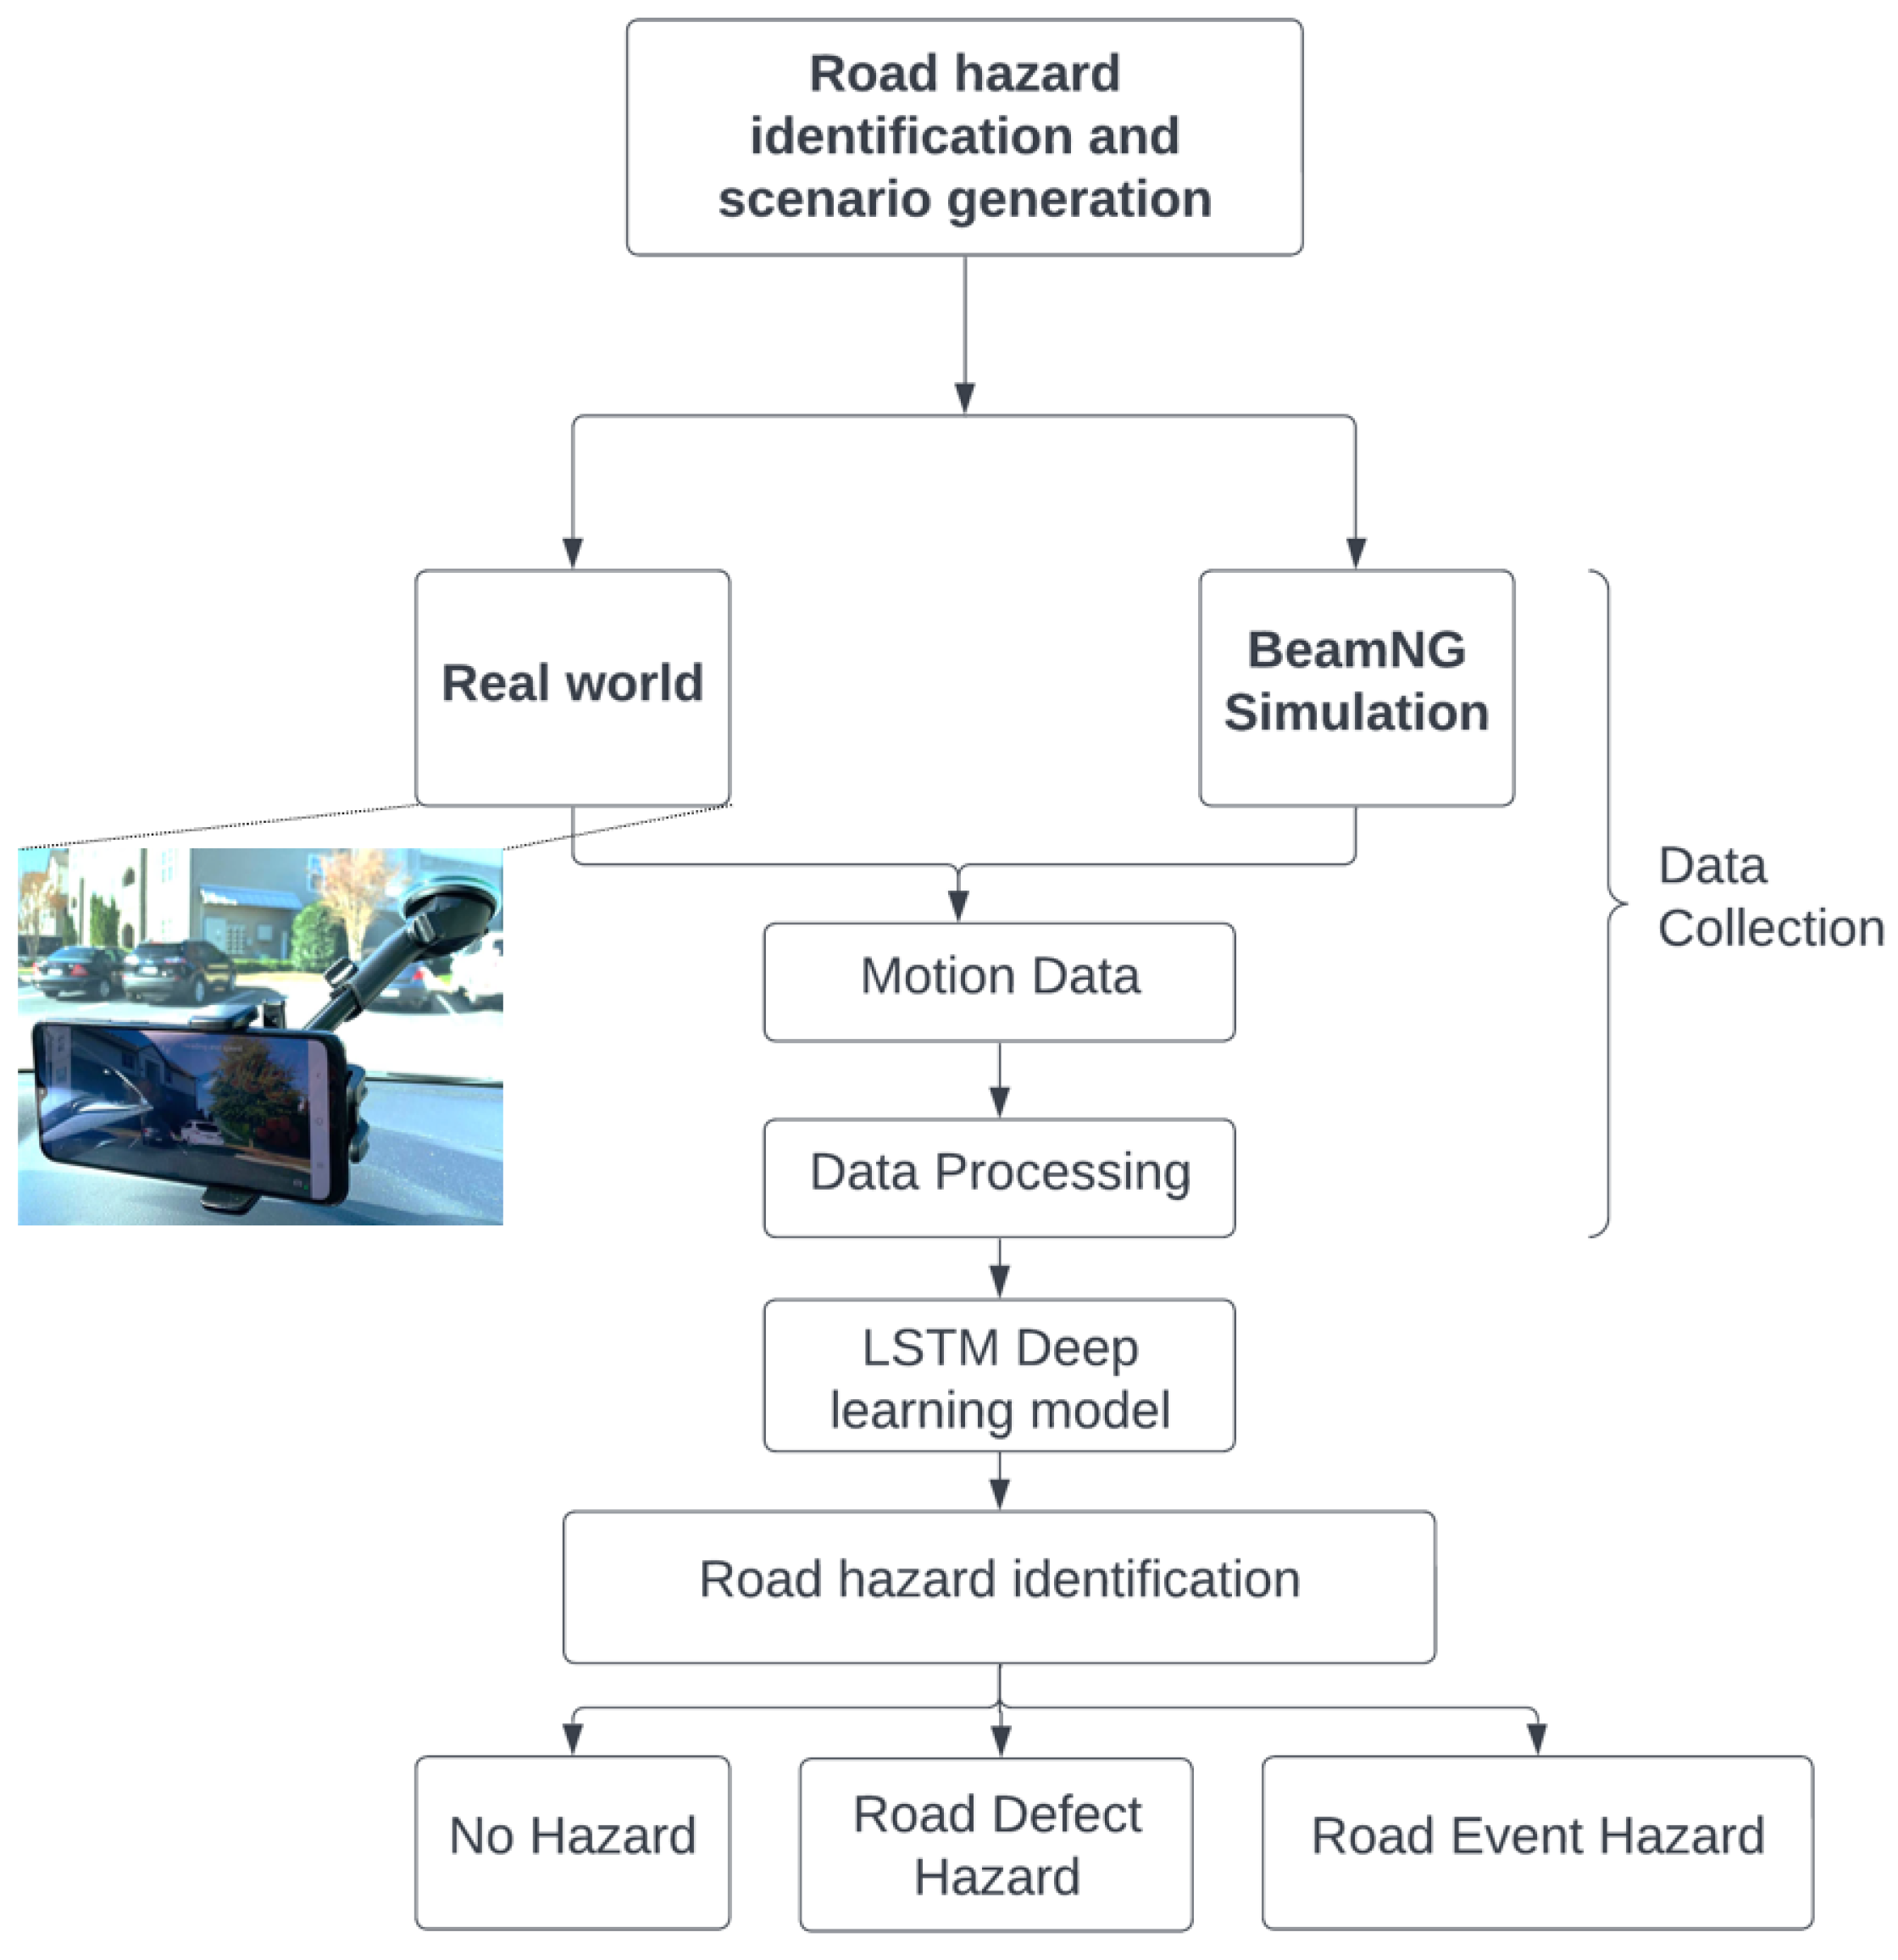
Smartphones, when mounted in a vehicle, can reflect the profile of a road when driven over it. Smartphone sensors, such as accelerometers, g-force sensors, gyroscopes, and magnetometers can record the motion of the vehicle, reflecting the road surface’s profile [
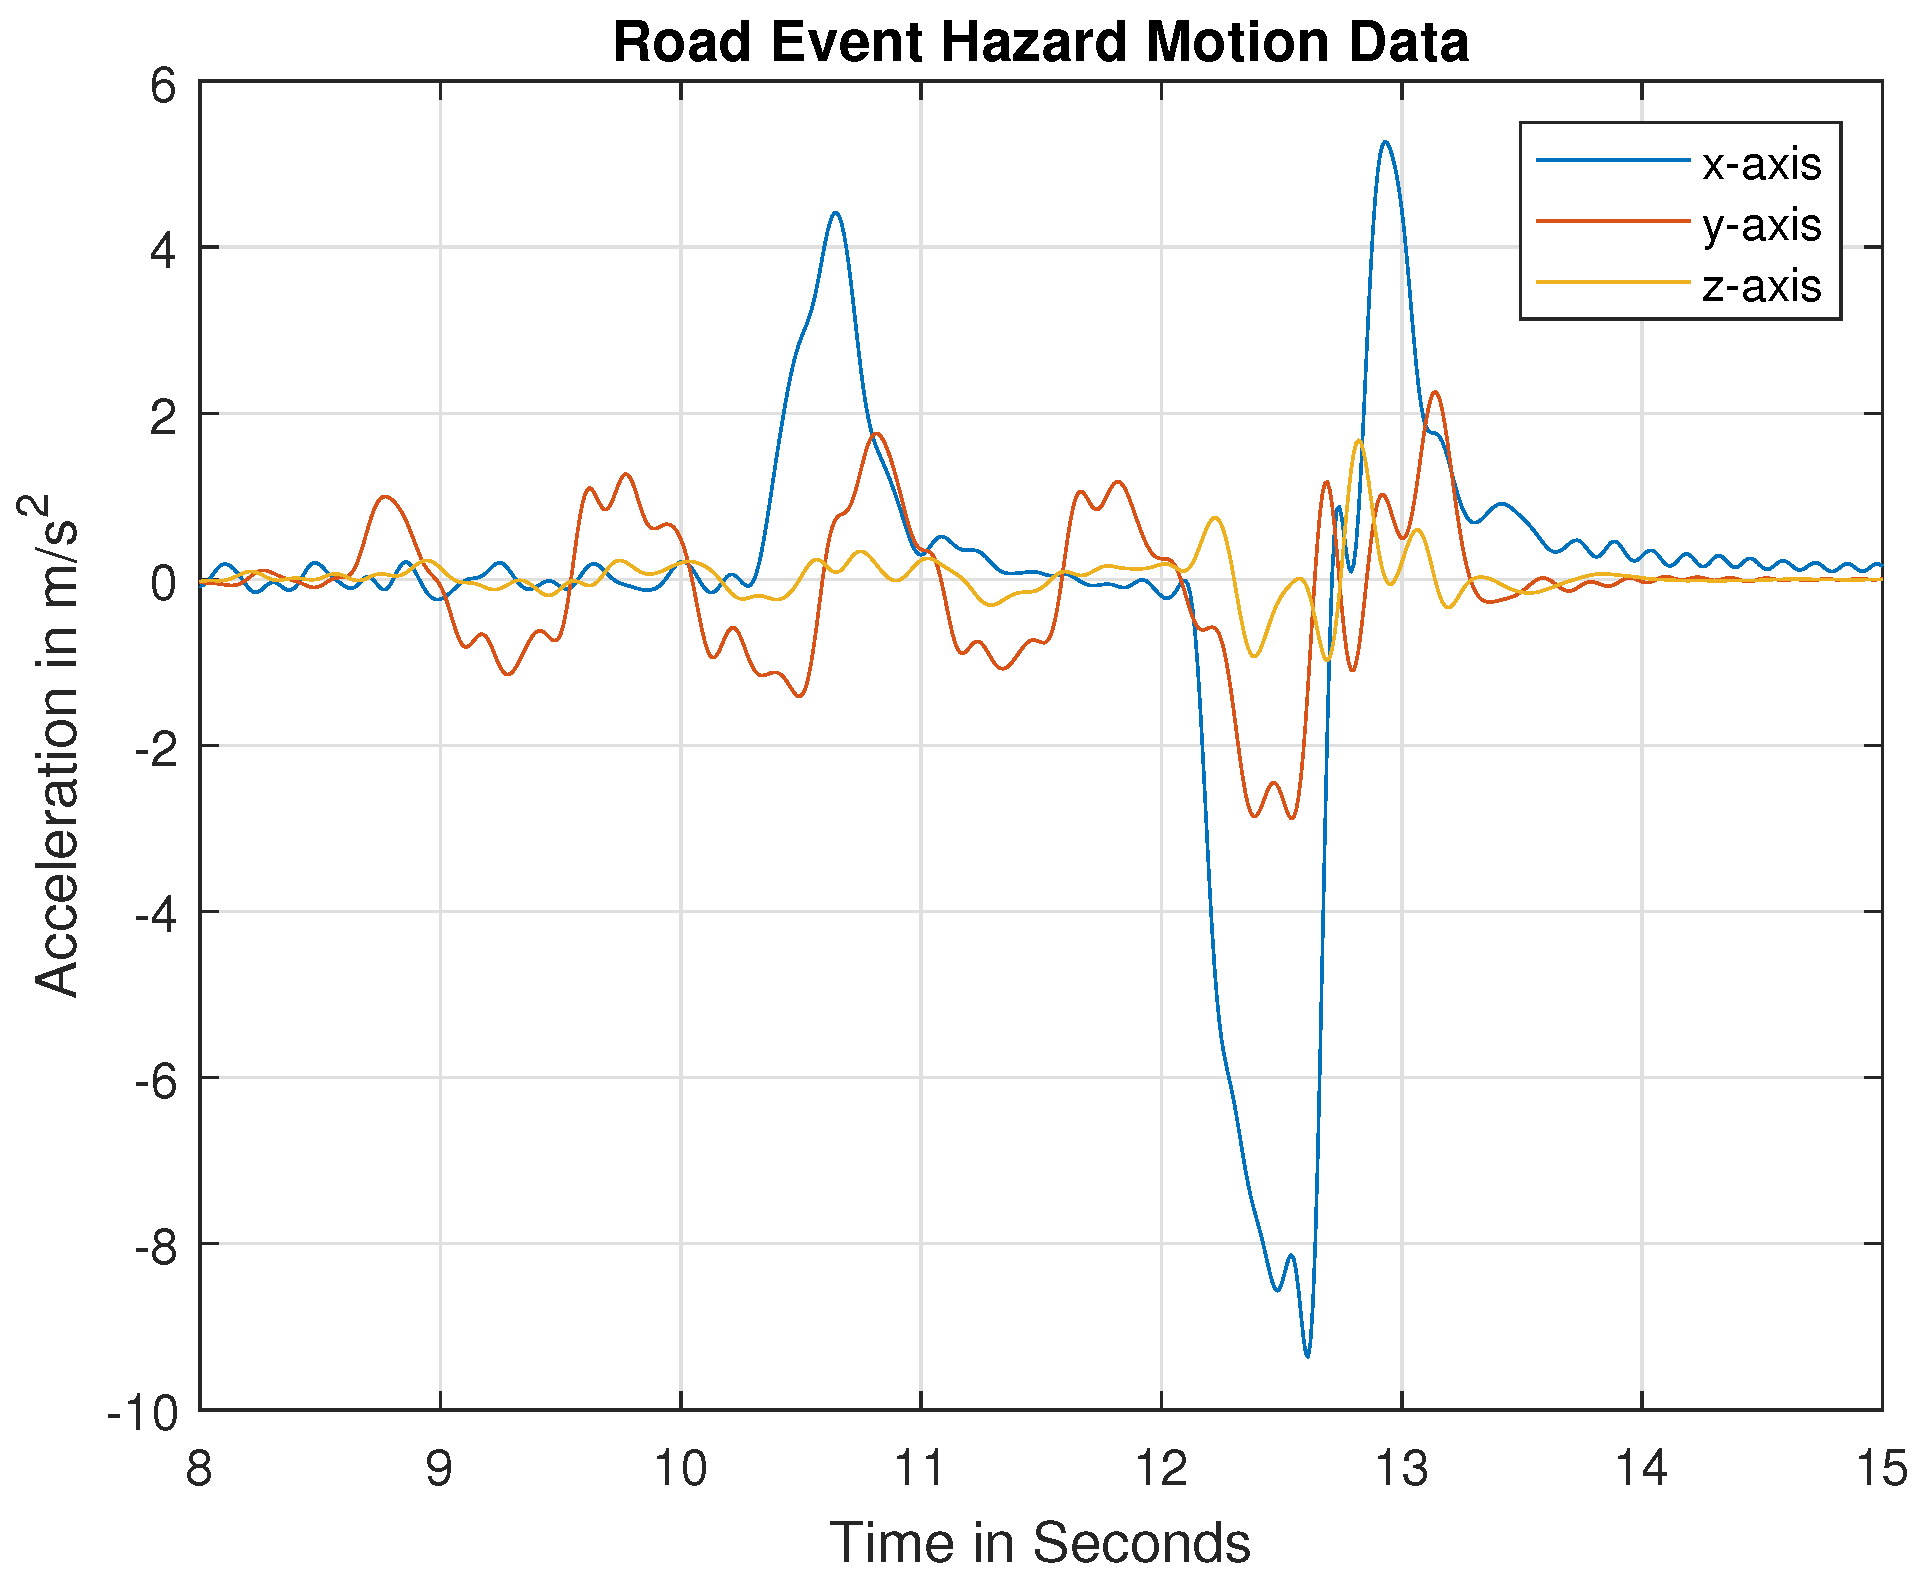
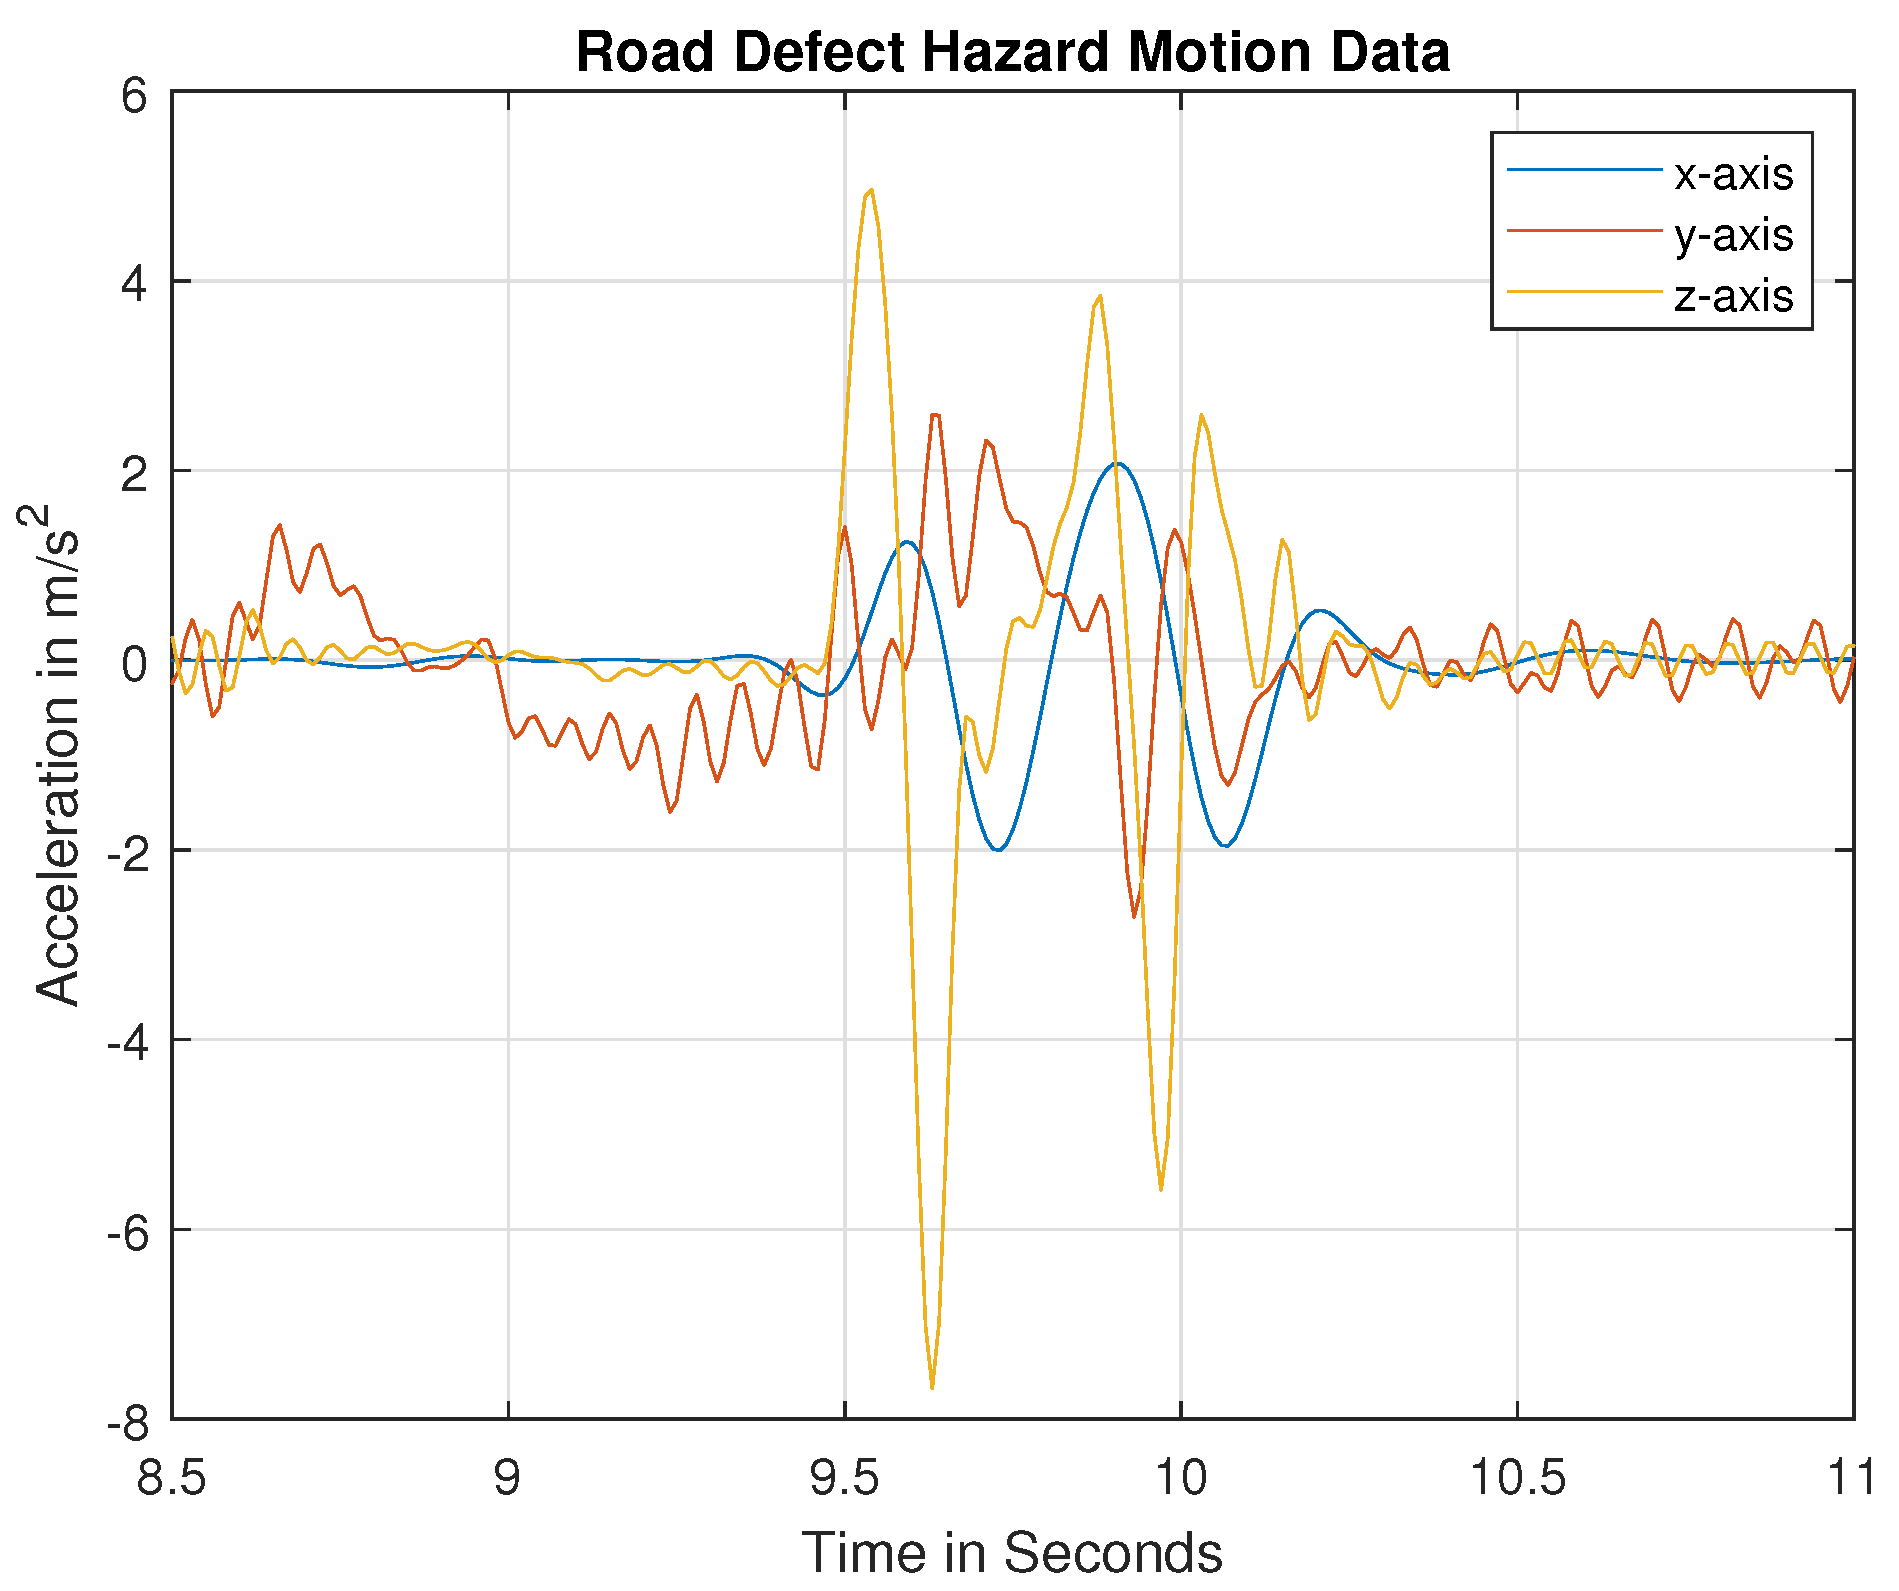
11]. Additionally, vehicle simulation platforms that employ soft-body physics, such as BeamNG Tech, have vehicle sensors such as g-force sensors and accelerometers. These sensors are used to generate a large number of road surface profiles. This paper uses these motion data to classify road hazards using a recurrent neural network (RNN) called long short-term memory (LSTM). This paper categorizes the road hazard conditions into three major situations, including “No Hazards”; “Road Defect Hazards”, which represents hazards caused by road defects, such as potholes and bumps vehicles could drive over; and “Road Event Hazards”, which represents hazards caused by road events such as roadwork, vehicles that have been involved in an accident, and other unexpected obstacles which vehicles have to avoid or dodge. Figure 1 represents the framework of the system of the road hazard detection process.

2.2. Data Acquisition

Generally, bumps or potholes represents a form of road damage to vehicles that occurs in the vertical direction, represented as vertical acceleration. During an obstacle avoidance course on the road, vehicles sway in a lateral direction to generate lateral acceleration with some torsional acceleration. Therefore, it is crucial to find the relationship between vertical vehicle acceleration, lateral acceleration, and the type of road damage. We collected historical data on the vertical, lateral, and torsional acceleration of vehicles over several sections of damaged roads to examine the type of road hazard in simulated and real-world scenarios. For real-world data, 3-axis acceleration data were measured from smartphones mounted on the dashboards or windshields of vehicles (see Figure 1). The MATLAB application, which ran on an Android smartphone, was used to collect the motion data. For the BeamNG Tech simulation platform, the g-force/acceleration sensor was used to measure the motion data.
The motion data from the real-world environment were gathered on numerous roadways in various cities located in South Carolina, USA, including Clemson, Greenville, Spartanburg, and Columbia. Multiple cars were used to collect the data from the MATLAB phone application. The MATLAB Android/iOS application has a sensor suite option that allows data, such as acceleration, magnetic field, angular velocity, orientation, and GPS position, to be recorded from different sensors. For our research, motion data with a sampling rate of 100 hertz were considered to classify different road hazards. Data were collected at various speeds, placements, and road inclinations and for different types of damage on the roads. For road defect hazards, acceleration data from potholes and bumps with varying widths and depths/heights were recorded. For road event hazards, acceleration data were collected considering obstacles of various sizes ahead of a vehicle. For this, the driver steered the vehicle to avoid hitting obstacles. These obstacles were generally vehicles involved in accidents, roadwork equipment, or any unexpected objects that the vehicle should avoid hitting. To recreate all common scenarios to enable machine models to detect hazards in real-time, as many diverse data labels as possible were collected with varying vehicle speeds and hazard sizes, different locations, and multiple smartphones.
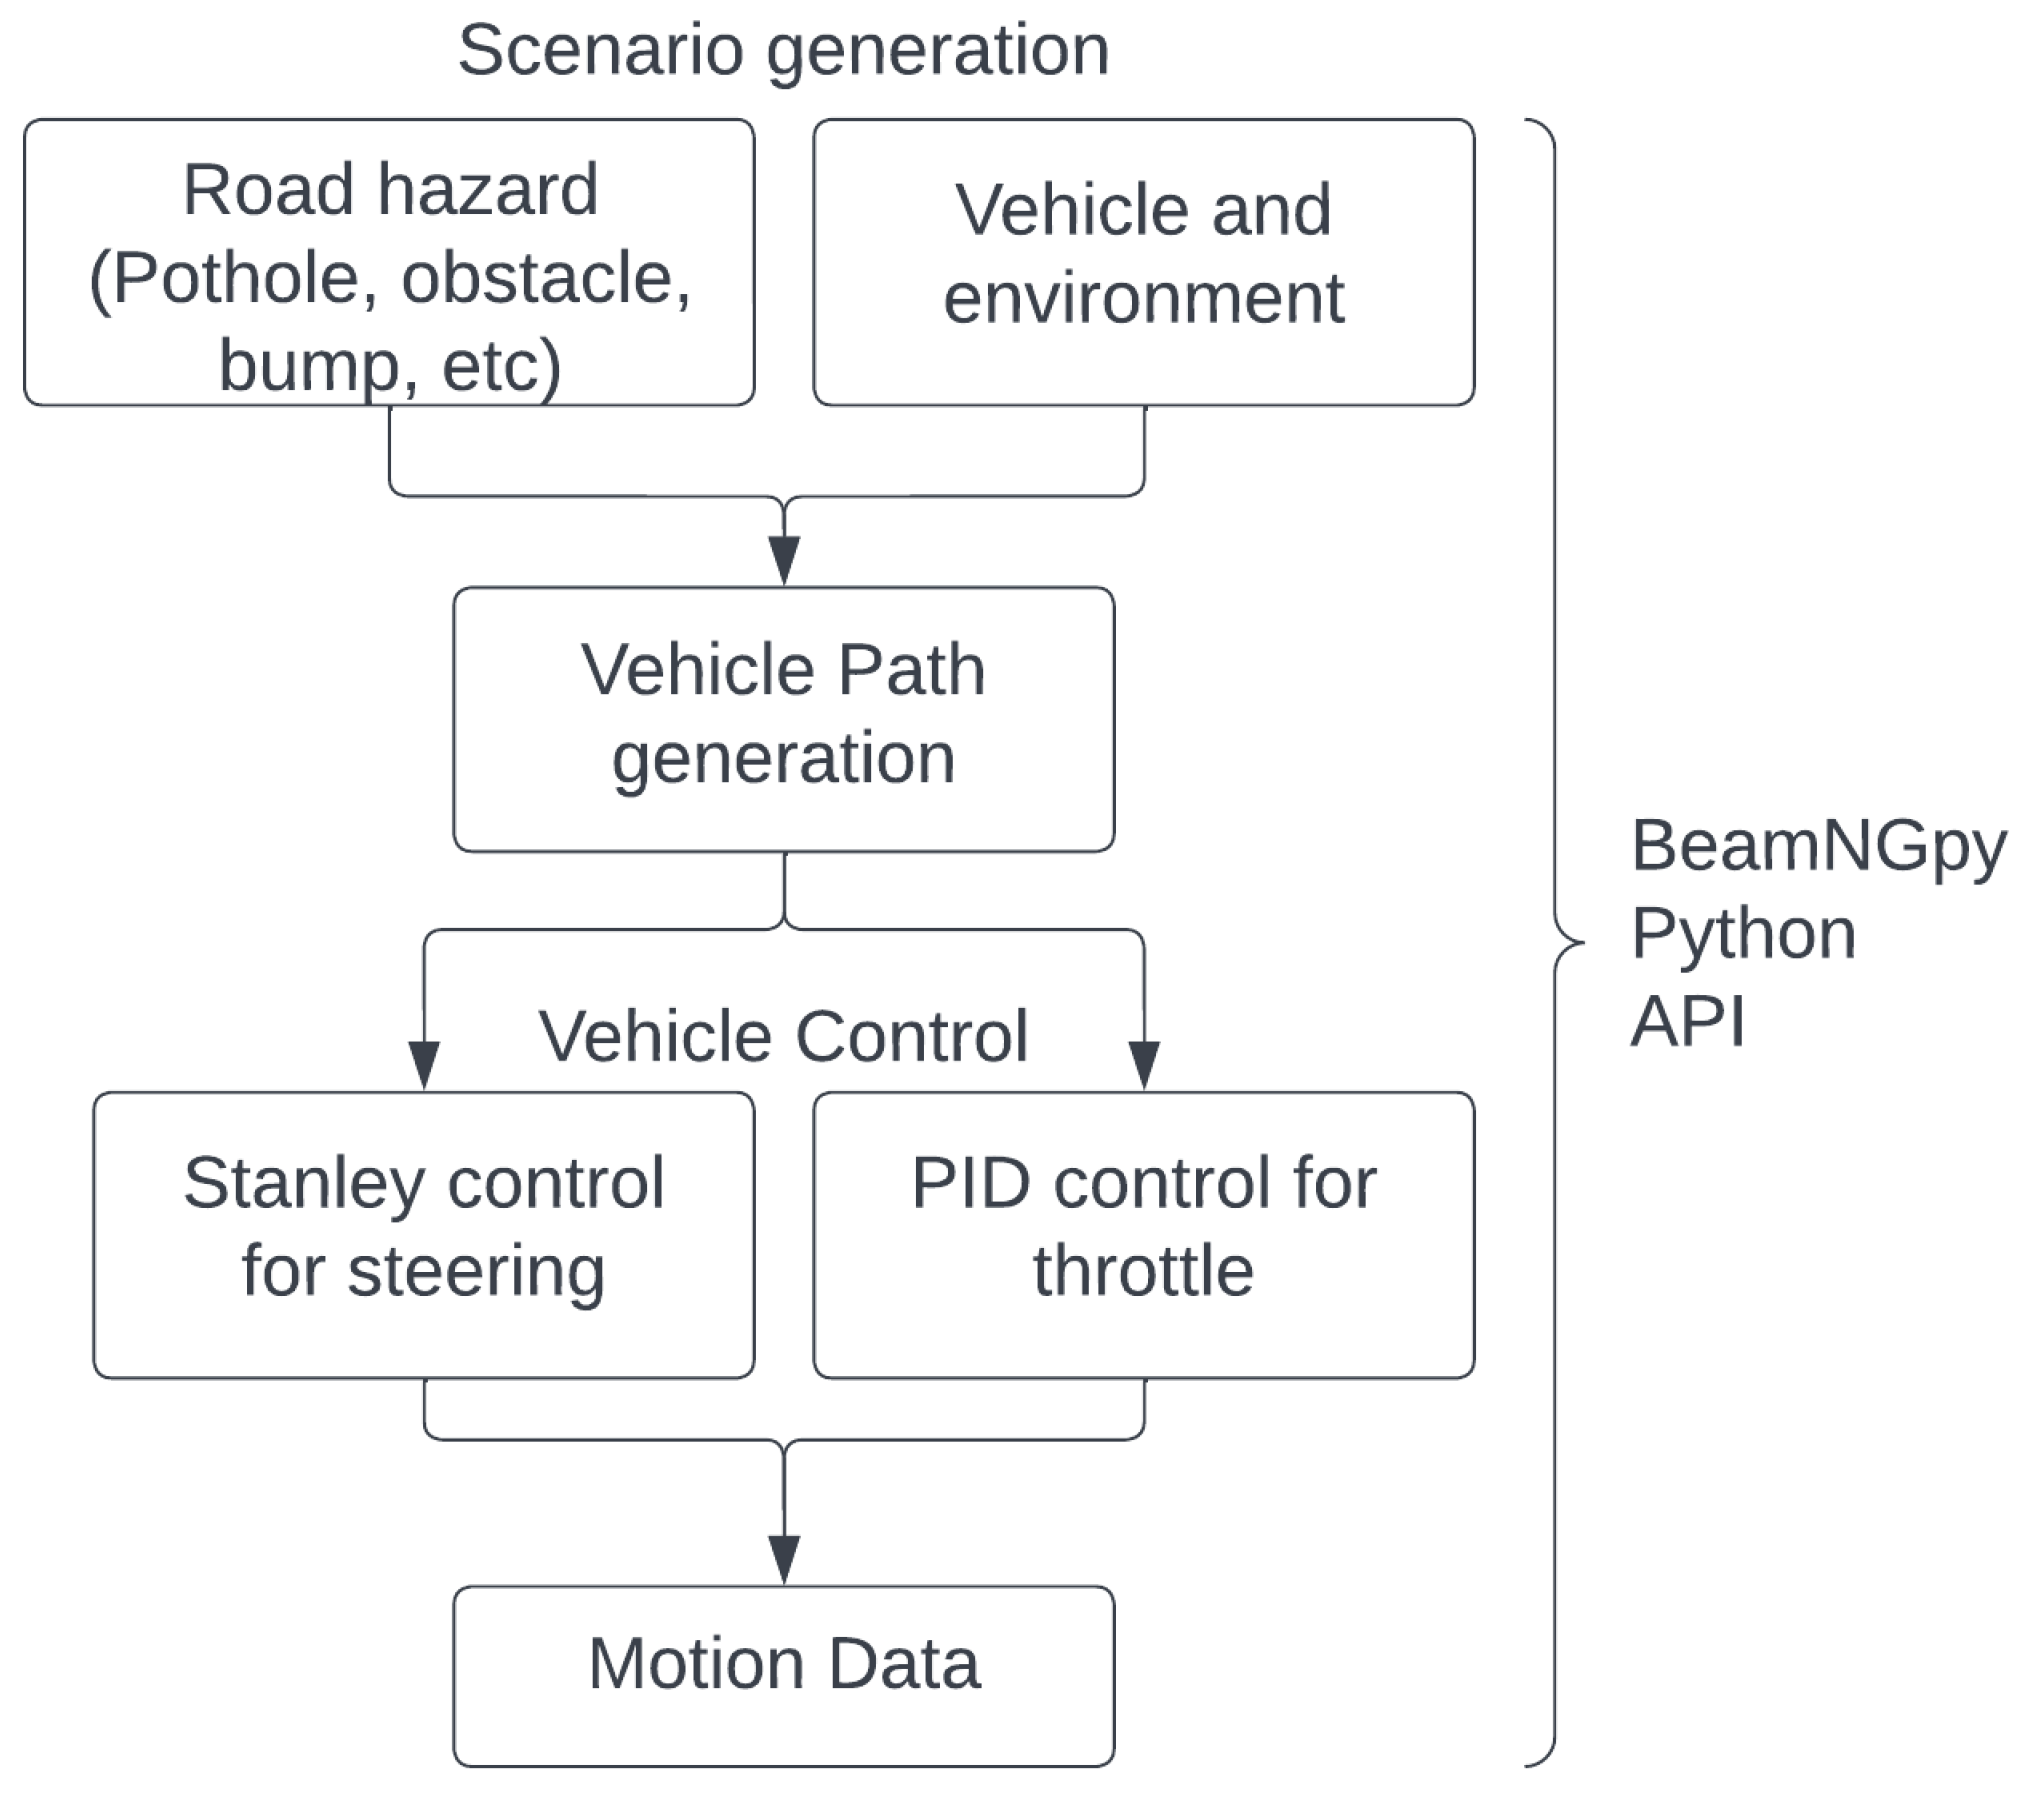
BeamNG is a high-fidelity soft-body vehicle simulation software that is authentic and provides realistic vehicle behavior [20]. In this paper, BeamNG Tech software was used to generate the required road hazard data; the data generation framework can be seen in 
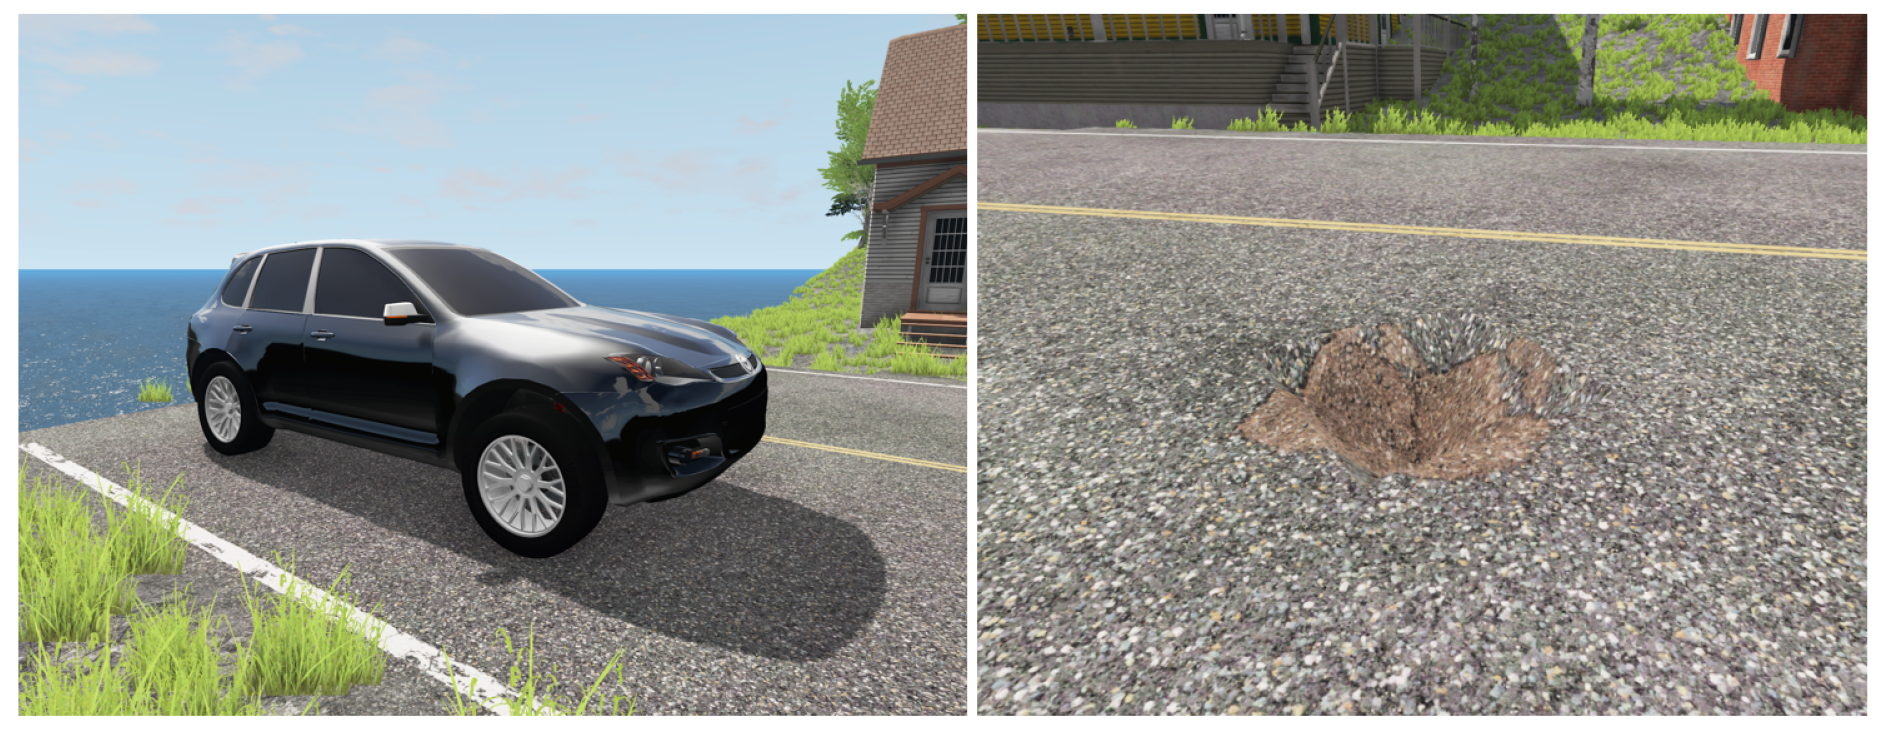
Figure 2. A custom environment was built with varying road hazard dimensions and scenarios. Data were collected from multiple vehicles built into the software, such as the Ibishu Pessima, a mid-sized sedan, and the Mazda CX7, a large-size vehicle. The motion data were recorded by the g-force/acceleration sensor mounted on the simulation vehicle and accessed through BeamNGpy (Python-based API). Indentations were made in the asphalt road with a constant width of 0.5 m and the depth ranging from 0.1 m to 0.5 m (refer to Figure 3). Multiple vehicles traveling at speeds ranging from 10 miles to 55 miles per hour went over these generated potholes to generate the motion data for potholes. For obstacle avoidance (dodge) road hazards, Stanley control was used to steer the simulated vehicle while tracking the pre-defined vehicle path. Scenarios were built to track the vehicle’s motion, avoiding different sizes of obstacles, with vehicle speeds ranging from 10 miles to 55 miles per hour. For both potholes and road hazards that must be dodged, a proportional, integral, and derivative (PID) control was used for throttle commands with smoothening to avoid jarring vehicle motion. The motion at a frequency of 100 hertz was collected in a text file and later used in the deep learning model.
Regarding the vehicle frame axes, the X-axis represents the lateral acceleration, the Y-axis represents the torsional acceleration, and the Z-axis represents the vertical acceleration of the vehicle for road event hazards or road defect hazards.

2.3. Data Processing

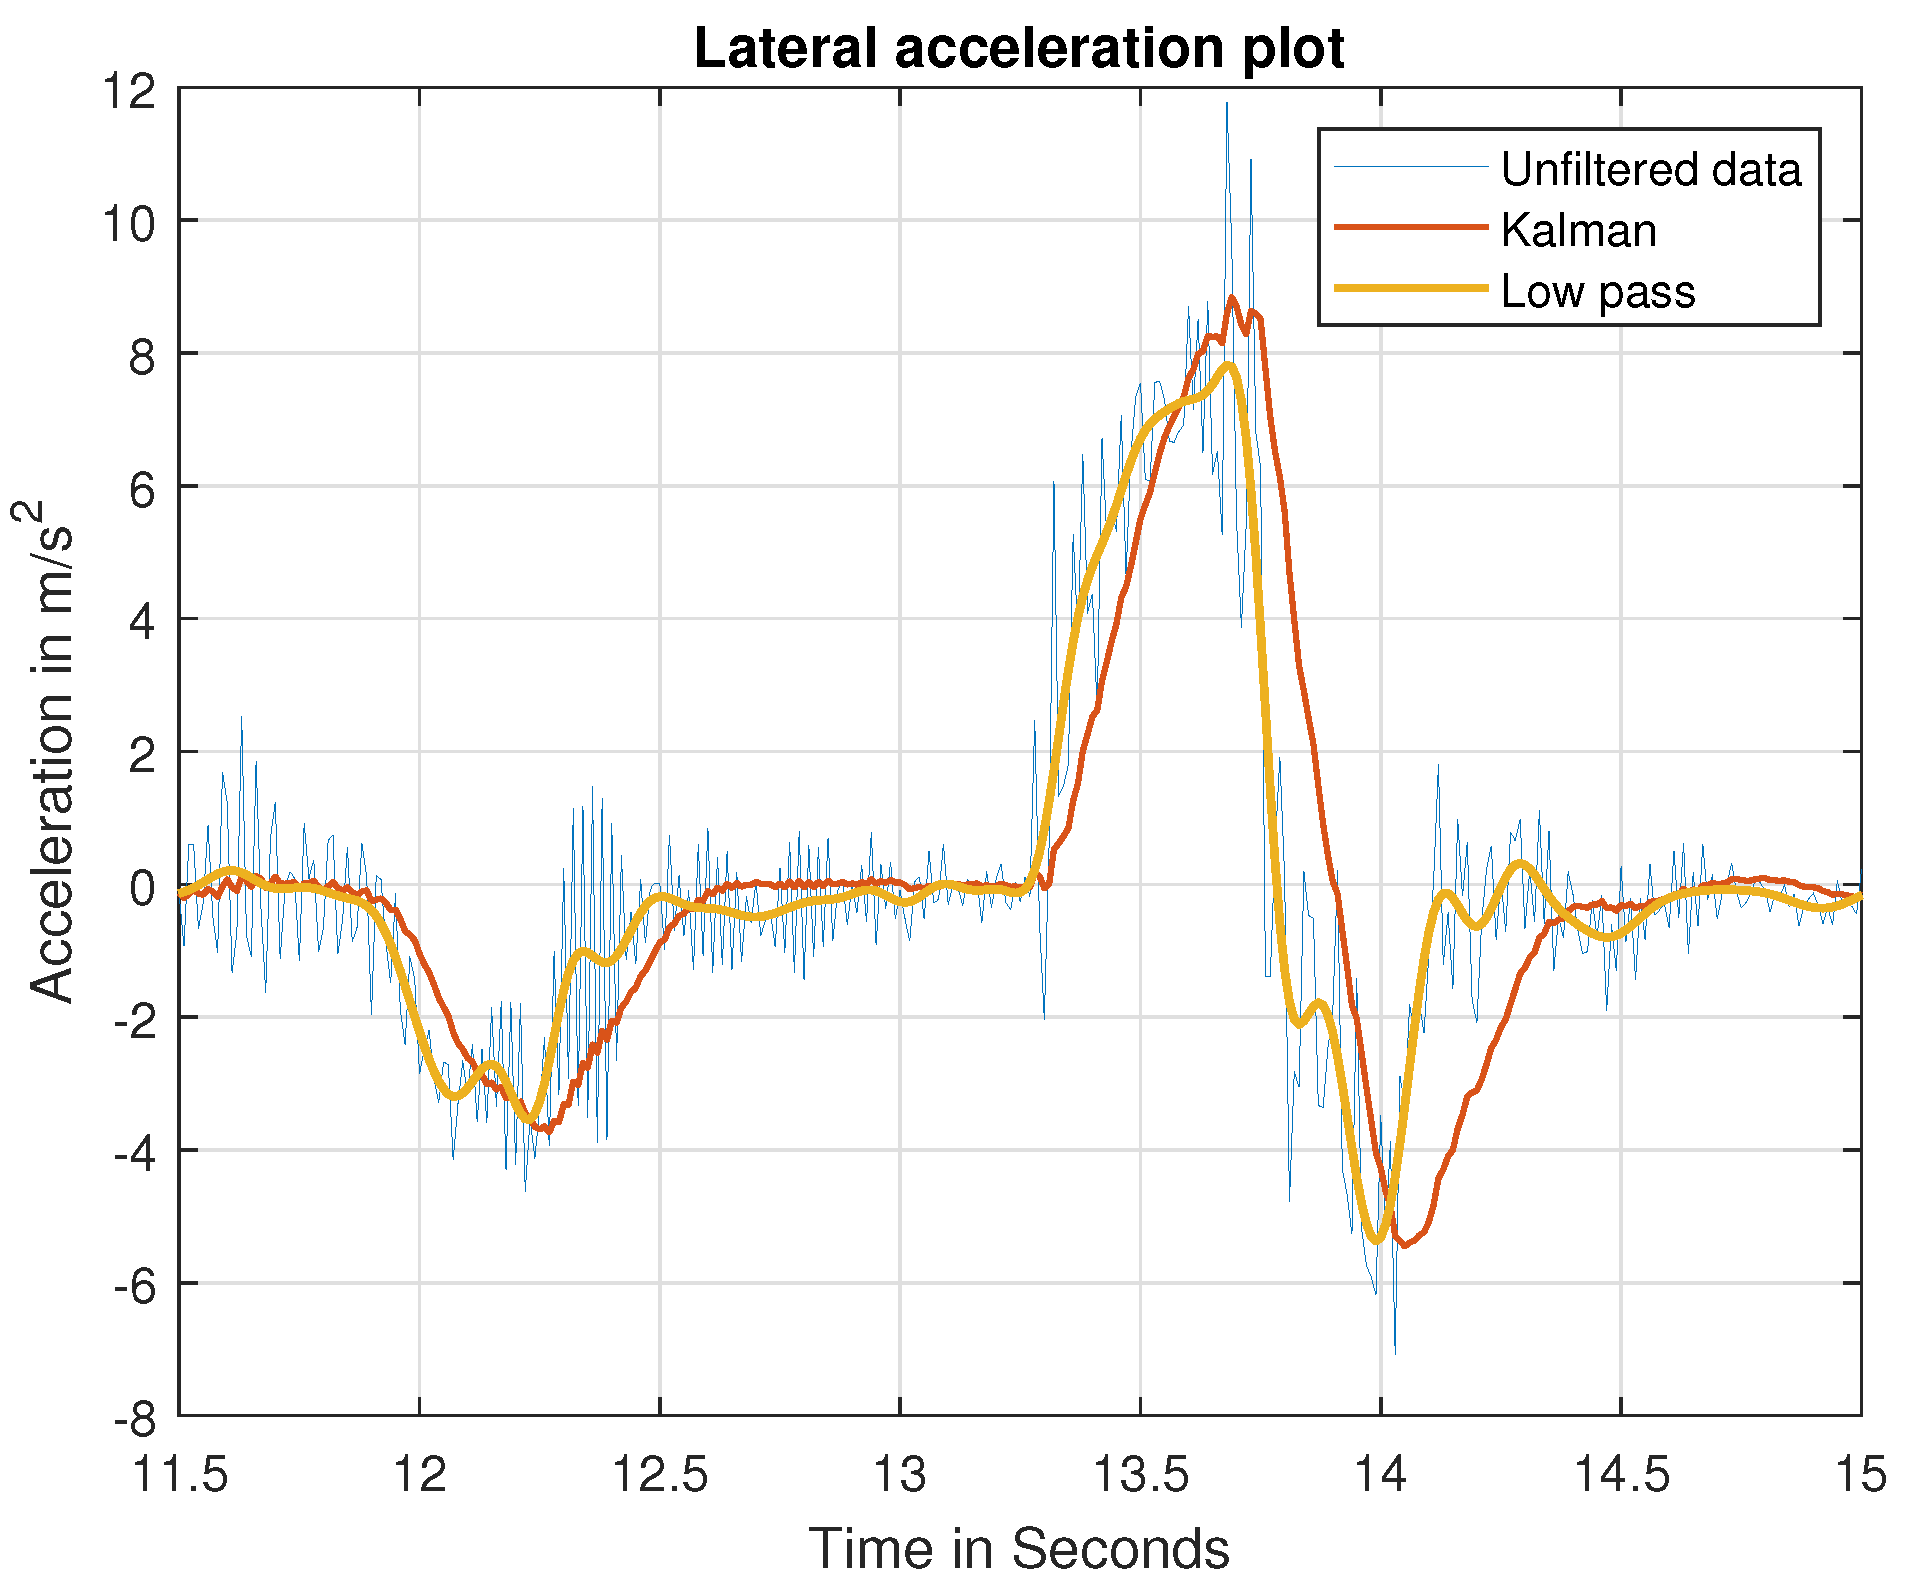
The accelerometer sensors in the smartphone and BeamNG provide motion data over time but have noise associated with them. To accurately identify the type of road hazard, data should be free of noise and must be filtered. Two different filtering techniques were explored in this research to eliminate the high-frequency noise, namely Kalman filtering and low-pass filtering. For Kalman filtering, different measurement noise covariance and dynamic noise covariance matrixes were tuned to eliminate the high-frequency noise [21]. For low-pass filtering, the band-pass frequency and sampling rate were tuned to eliminate the high-frequency noise [22].

2.4. Deep-Learning-Based Road Hazard Detection Model

As an essential tool, long short-term memory (LSTM) networks have an impressive performance when detecting the patterns in time series data because of their capacity to retain information over long periods of time. The LSTM network was chosen because it features feedback connections in contrast to traditional feed-forward neural networks. Both individual data points and complete data sequences, such as time series motion data, can be processed according to Ramesh et al. [12] and Sepp Hochreiter et al. [23]. Since a single motion data point cannot identify specific road surface conditions, this specialization is crucial for our strategy. Time-series data obtained from acceleration sensors generate certain patterns of different road hazards. An LSTM network is very suited to predict these road hazards based on time-series acceleration inputs.
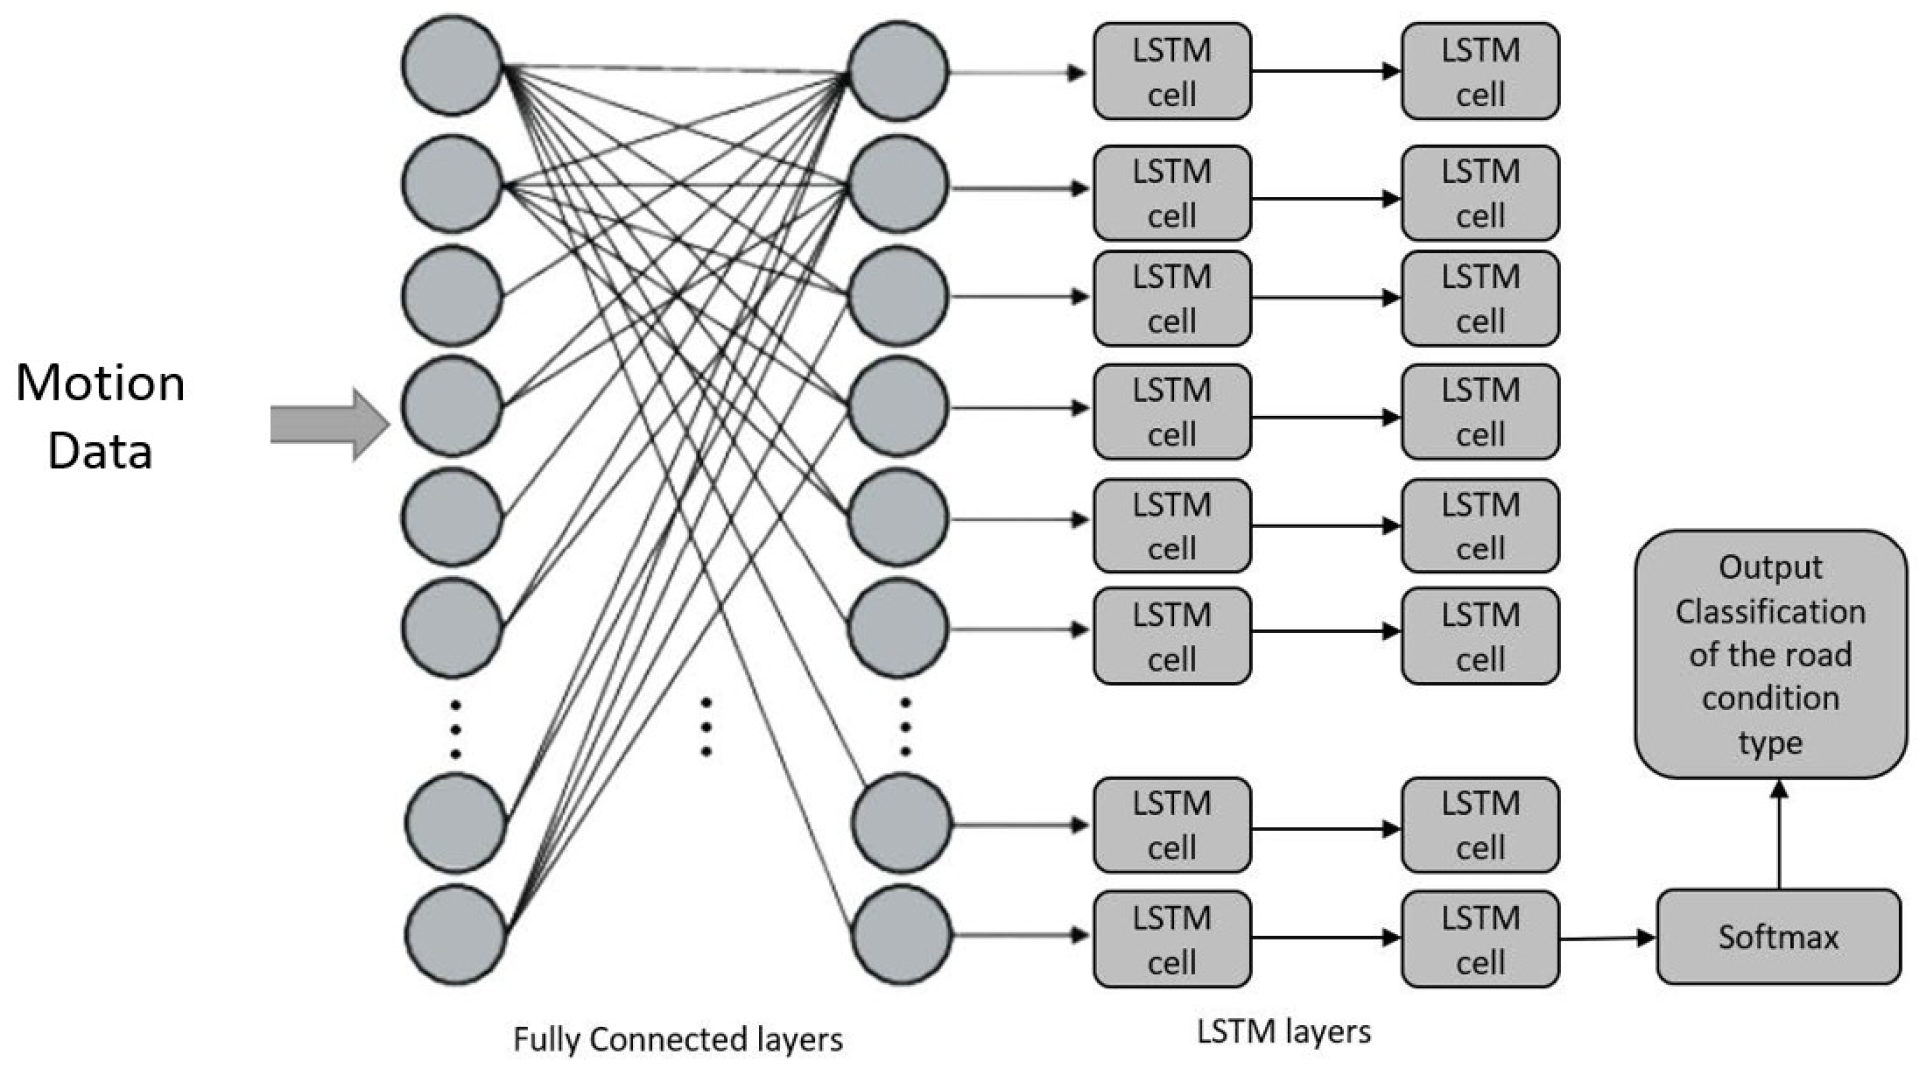
For this paper, motion data obtained from both the simulation and the real world are the inputs to the LSTM network. The suggested solution makes use of a stacking architecture made up of two completely connected layers, followed by two LSTM layers. The proposed architecture is depicted in Figure 4; 80 hidden units are the input size for the first completely connected layer, followed by another hidden layer. This is followed by two LSTM layers that each have 64 units layered on top of one another. The final cell’s output is extracted, and the softmax function is applied. This is the likelihood that each class will exist, according to the model. As in Figure 4, an LSTM unit is composed of a cell, an input gate, an output gate, and a forget gate. The cell remembers values across arbitrary time intervals, and the three gates regulate the flow of information into and out of the cell. The first gate, referred to as the forget gate, chooses which portion should be deleted from the cell state data. The input gate (second gate) chooses the data that will be included in the cell state. Last but not least, the output gate produces output data based on cell status, providing a classification of the road hazard and corresponding probabilities.

2.5. Heterogeneous Training Methods

Simulations do not represent the real world exactly. The LSTM model was tested on three heterogeneous training methods to validate the accuracy of simulation and real-world data for road hazard detection. The test–train data split was performed on a random basis. The three types of tests were as follows.

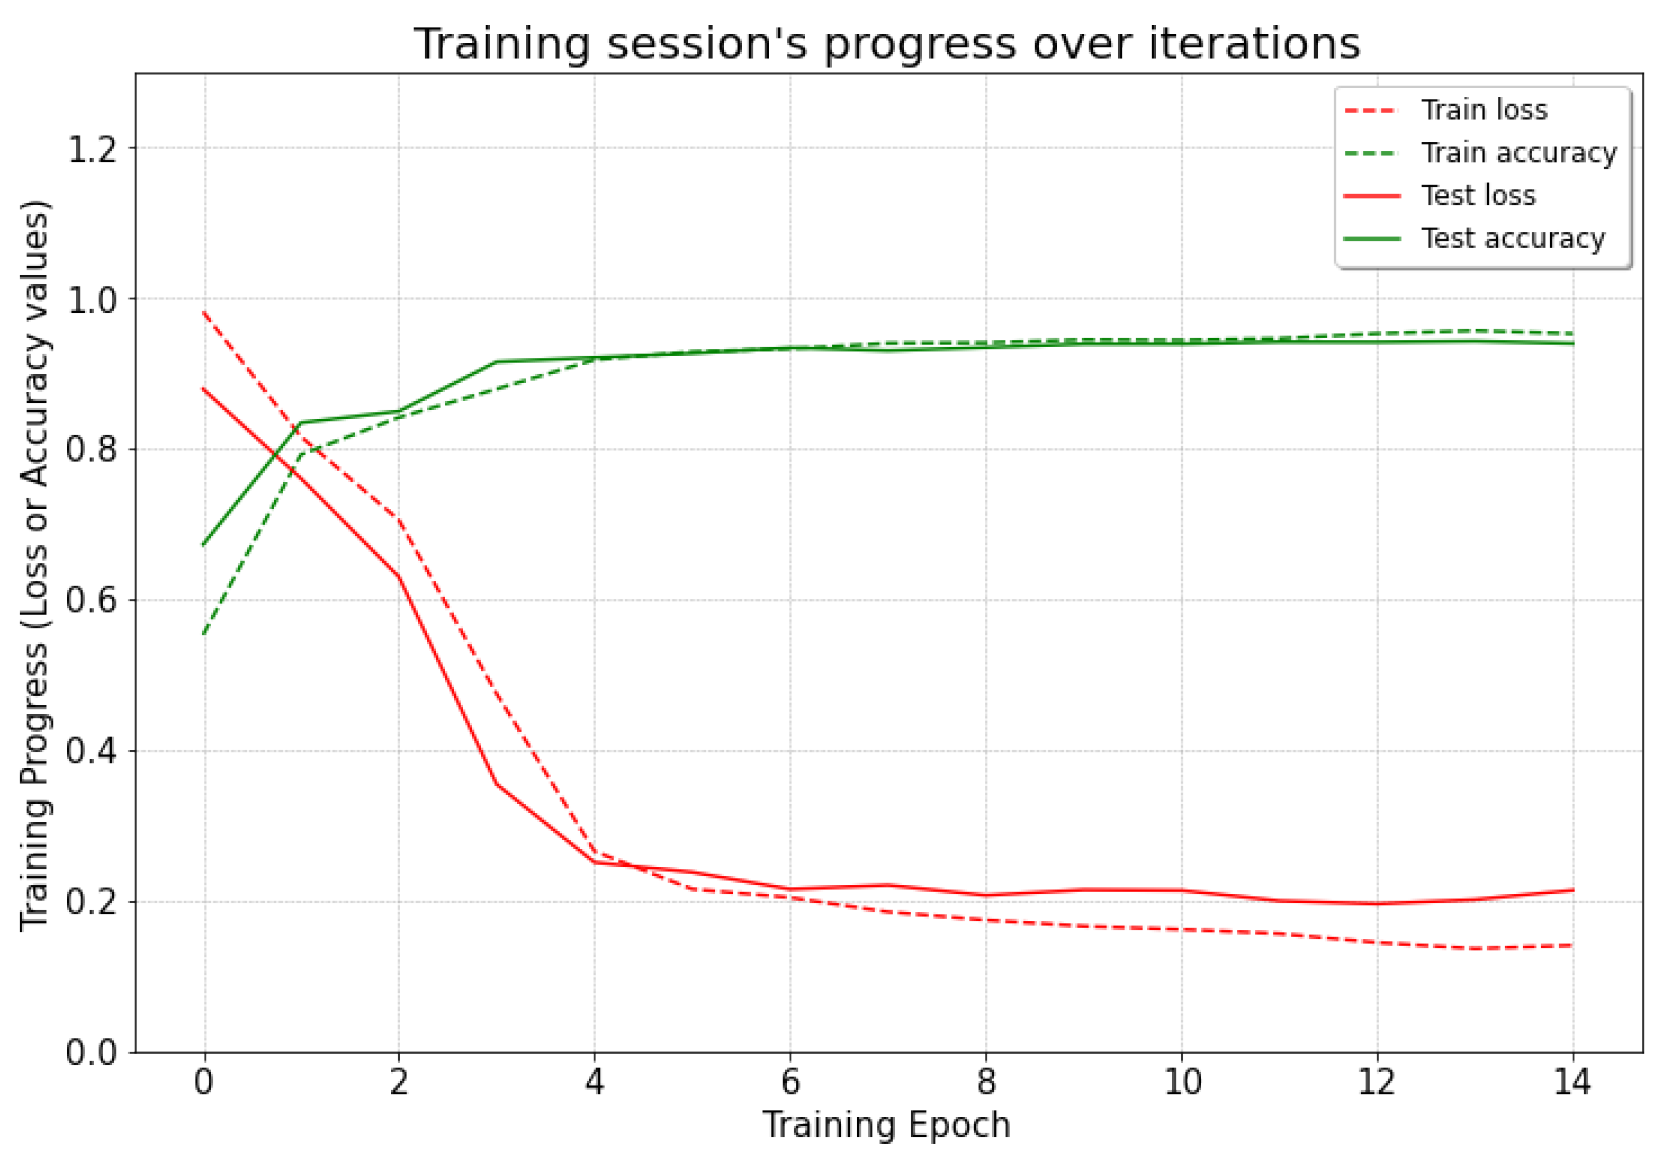
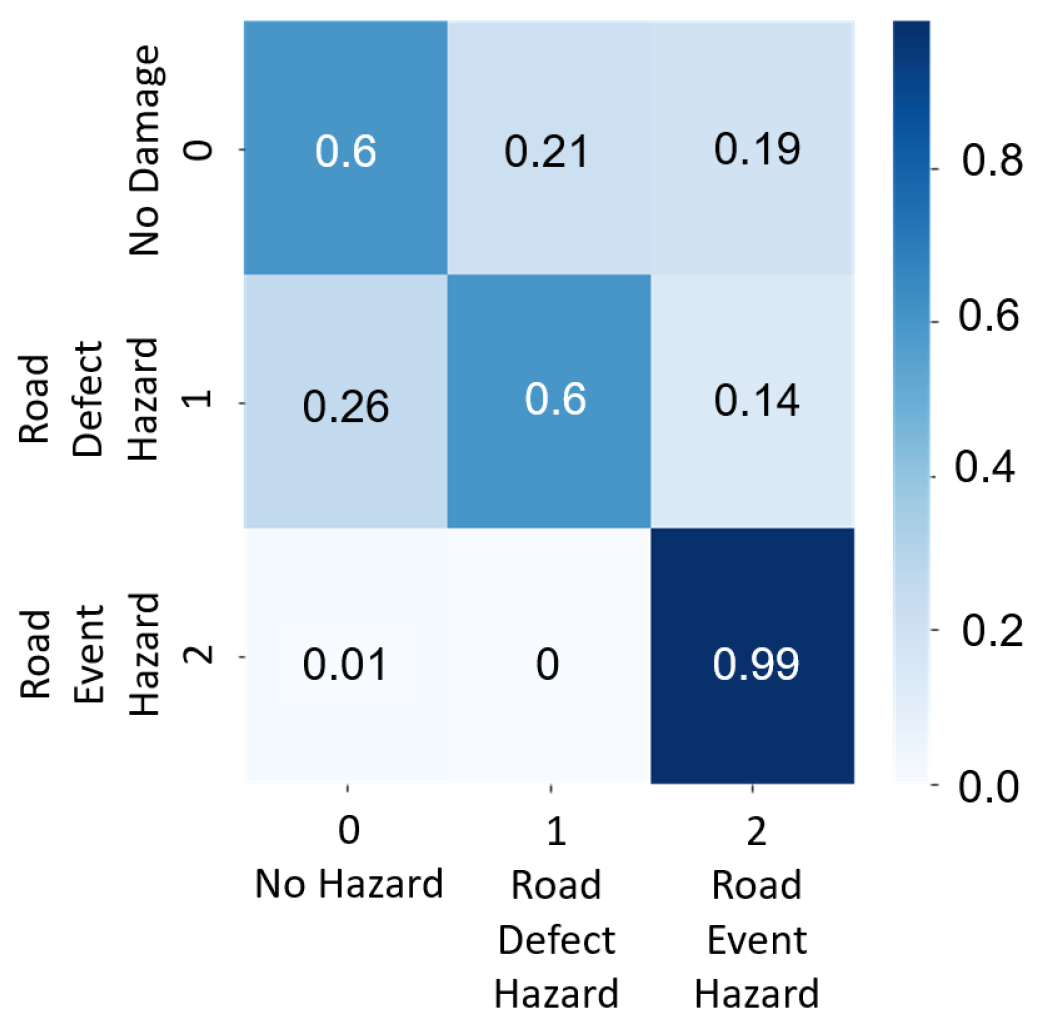
2.5.1. Test 1 (Simulation Only)

In this case, the road hazard data for training the LSTM model were only simulated data, and the testing data were also only simulated data. A total of 2008 simulated data labels were split into 1236 for training and 772 for testing.

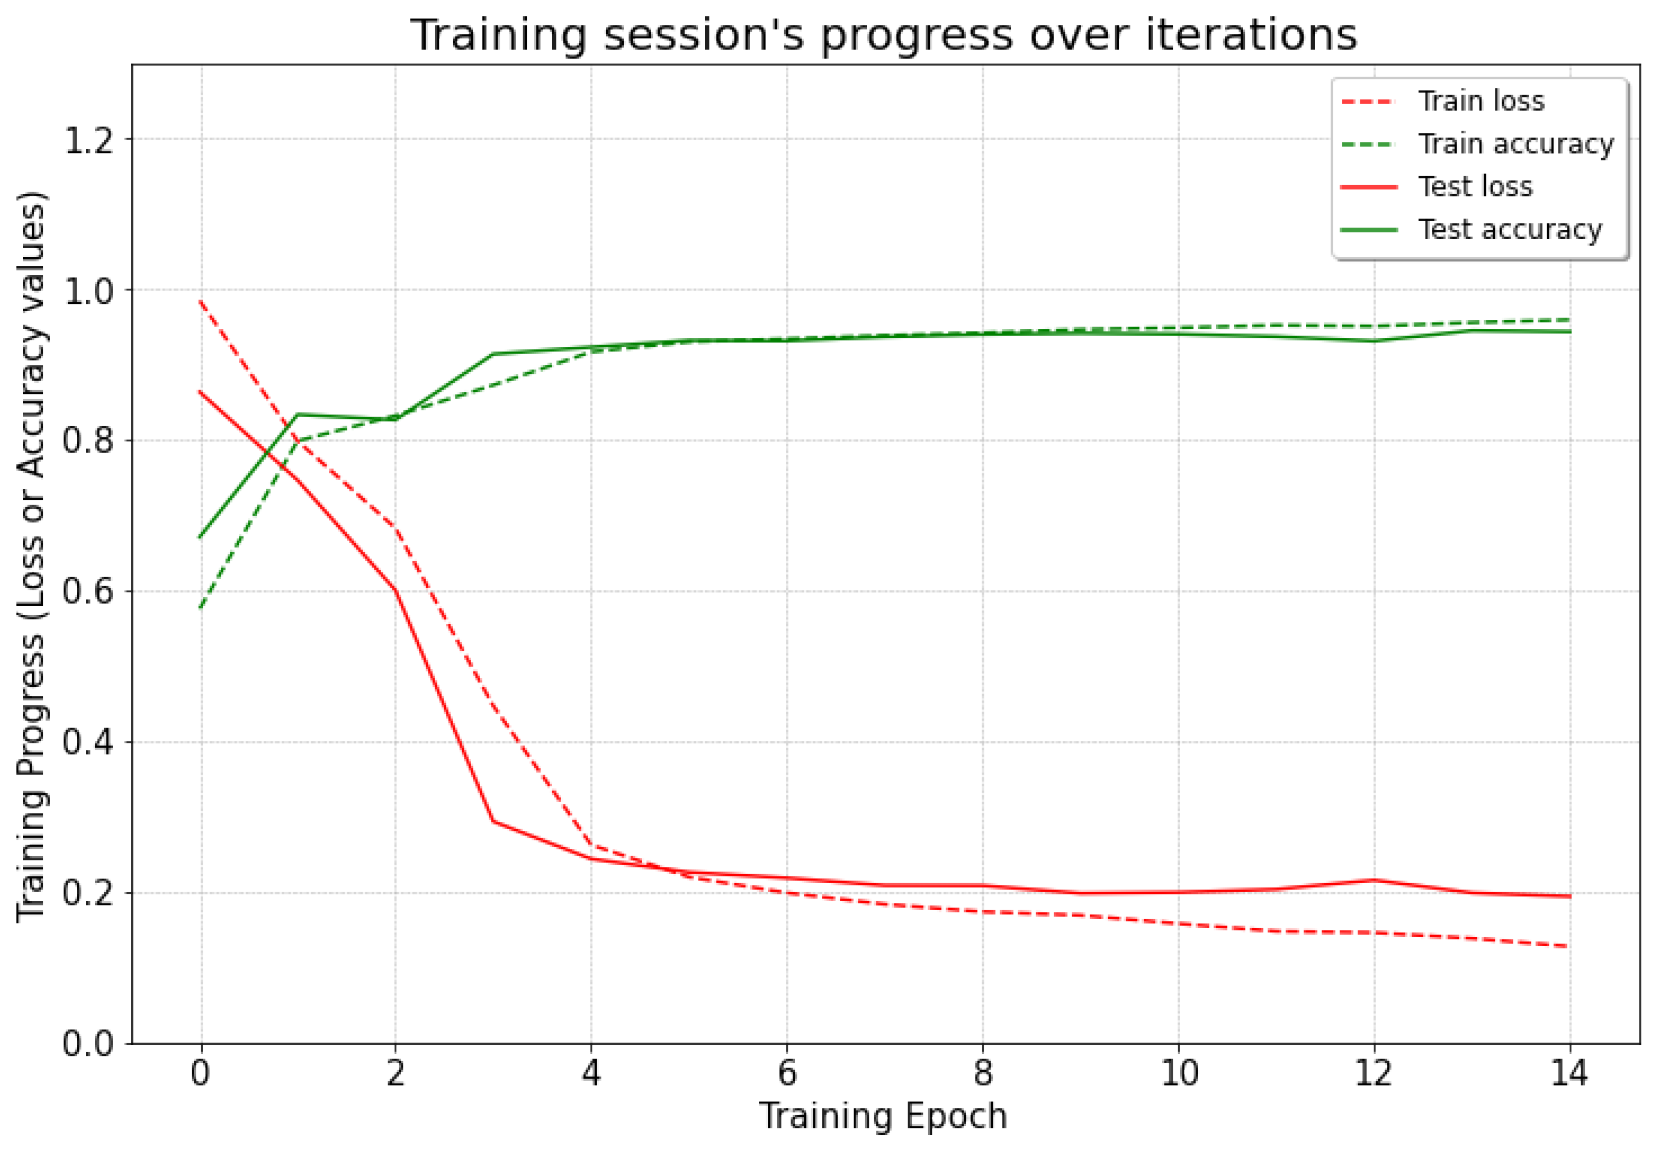
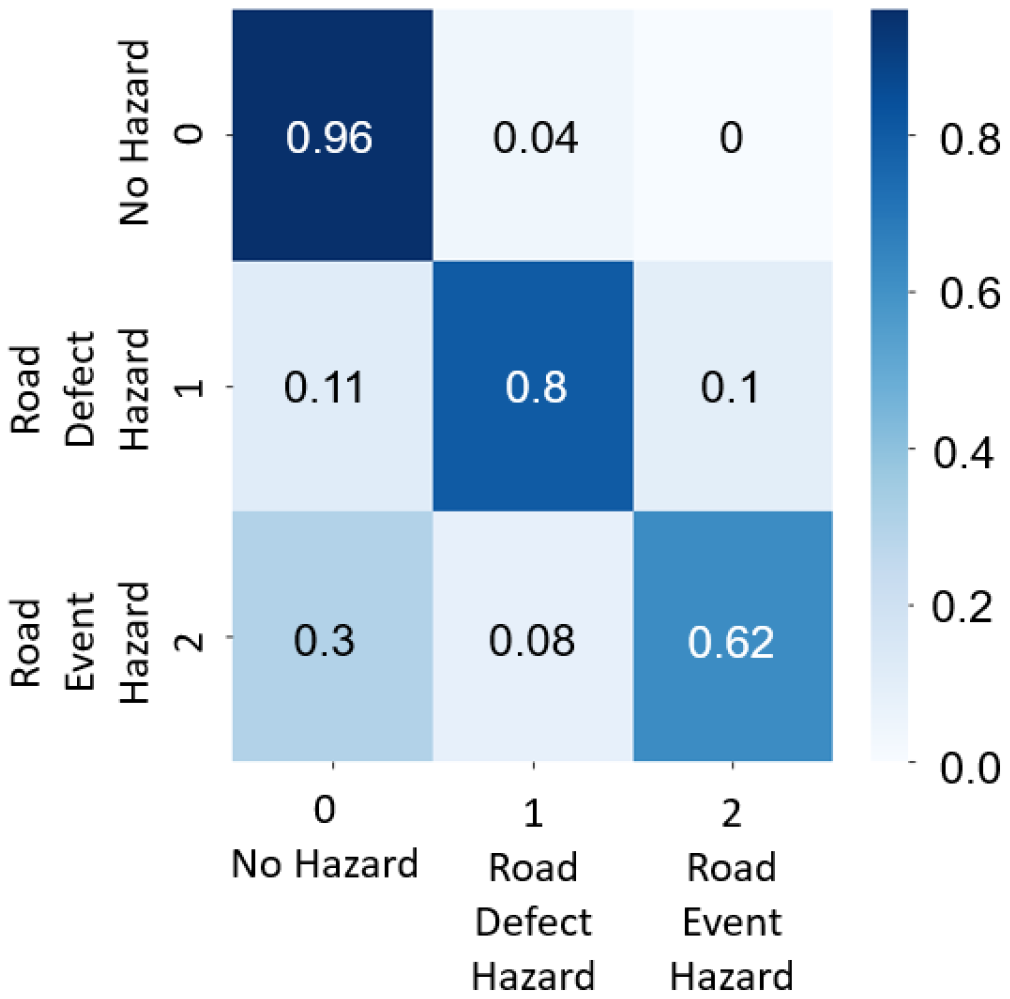
2.5.2. Test 2 (Simulation and Real, Separate)

In this case, the road hazard data for training the LSTM model were only simulated data, and the testing data were only real-world data. This test was performed to check the accuracy and correlation of simulated and real-world tests. A total of 2758 data labels were split into 2008 simulation-only data for training and 750 real-world data for testing.

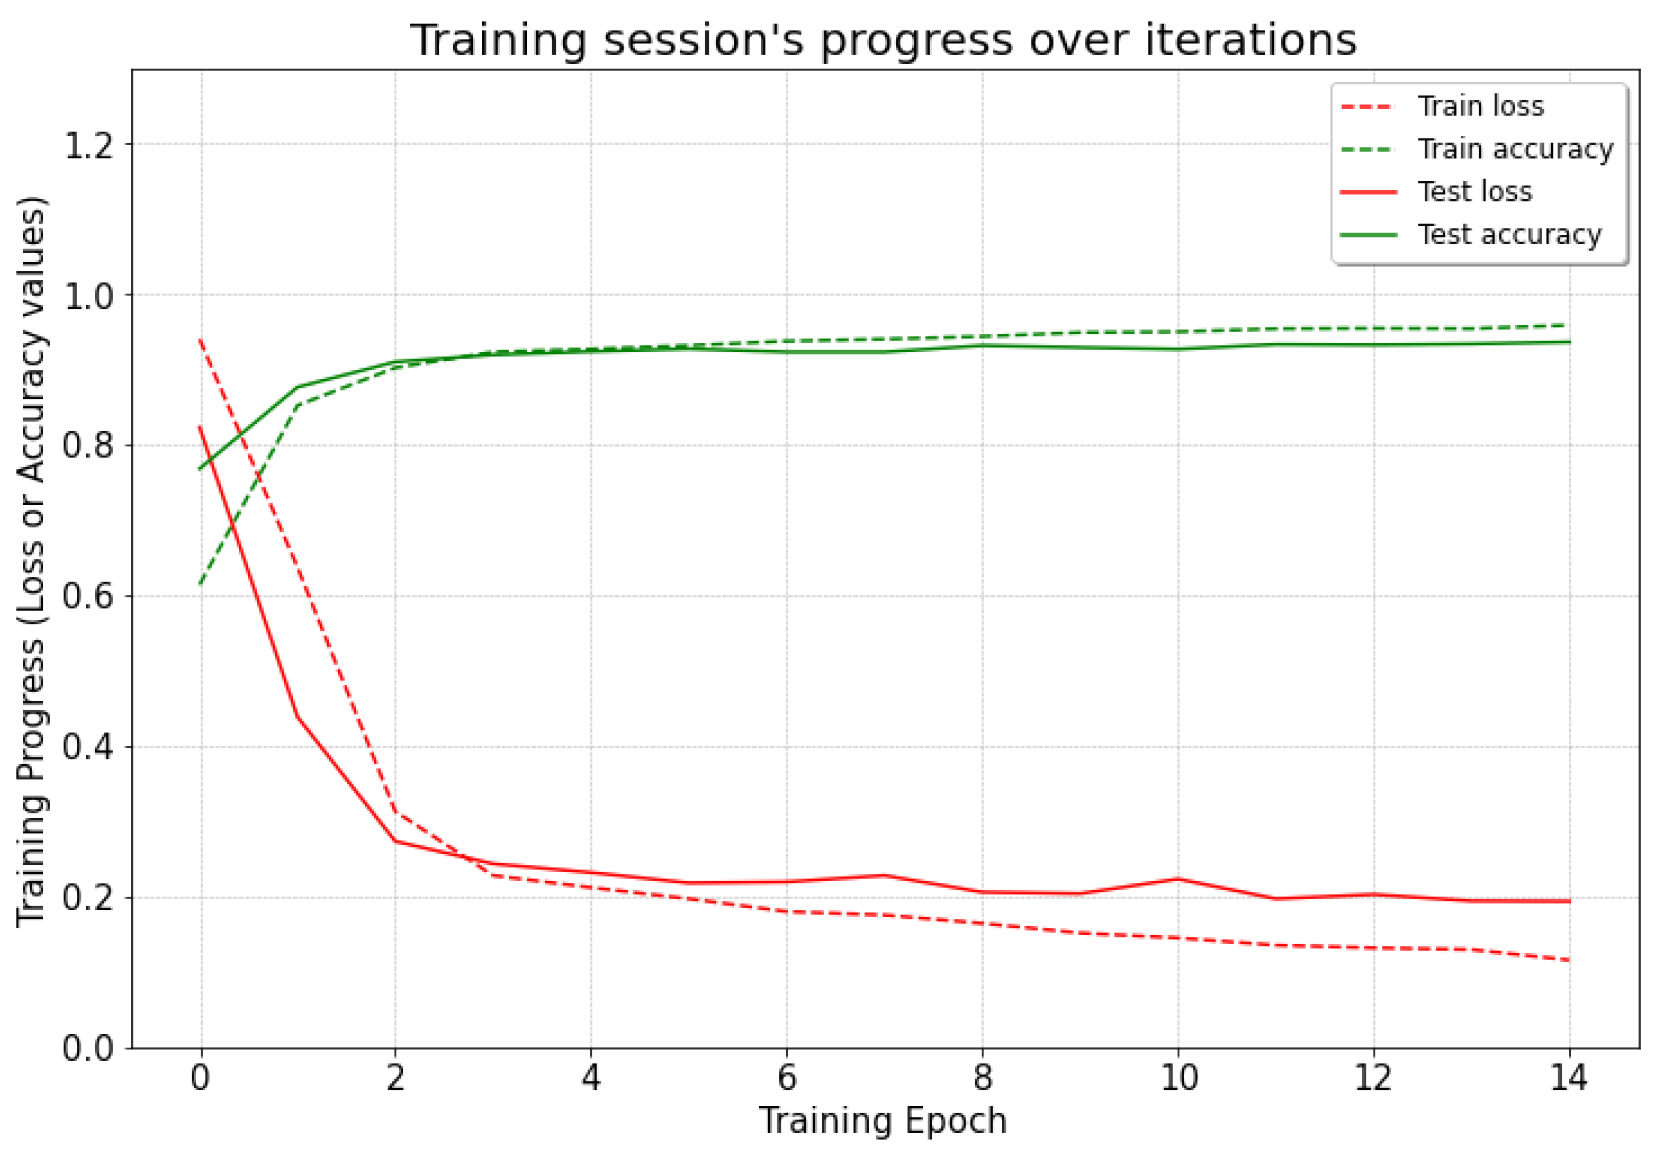
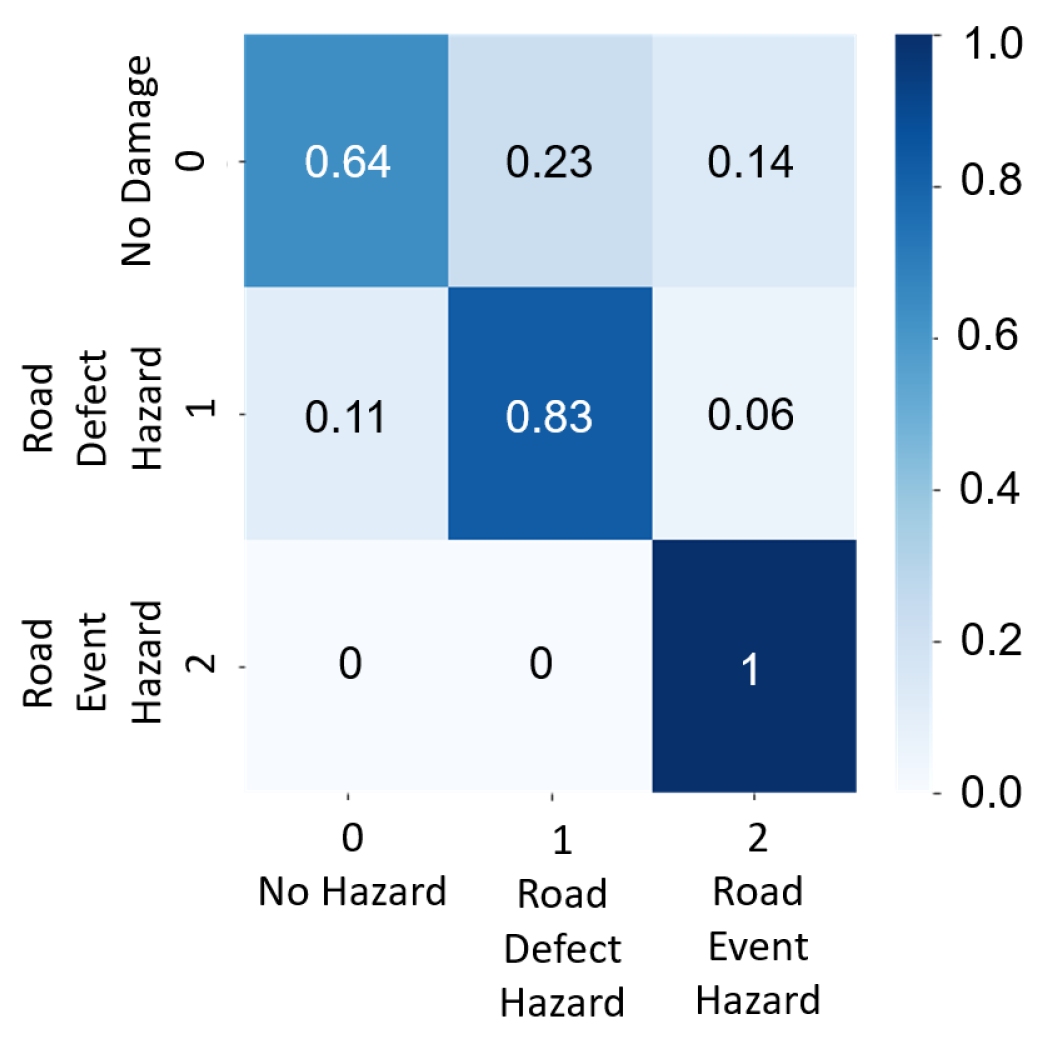
2.5.3. Test 3 (Simulation and Real Mixed)

In this case, the road hazard data for training the LSTM model were a mix of simulation data and real-world data, whereas the testing data were only real-world data. A total of 2758 data labels were split into 2211 mixed data for training and 547 real-world data for testing.

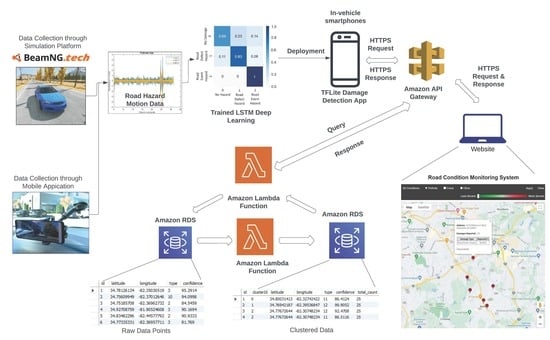
2.6. Cloud-Based Fusion

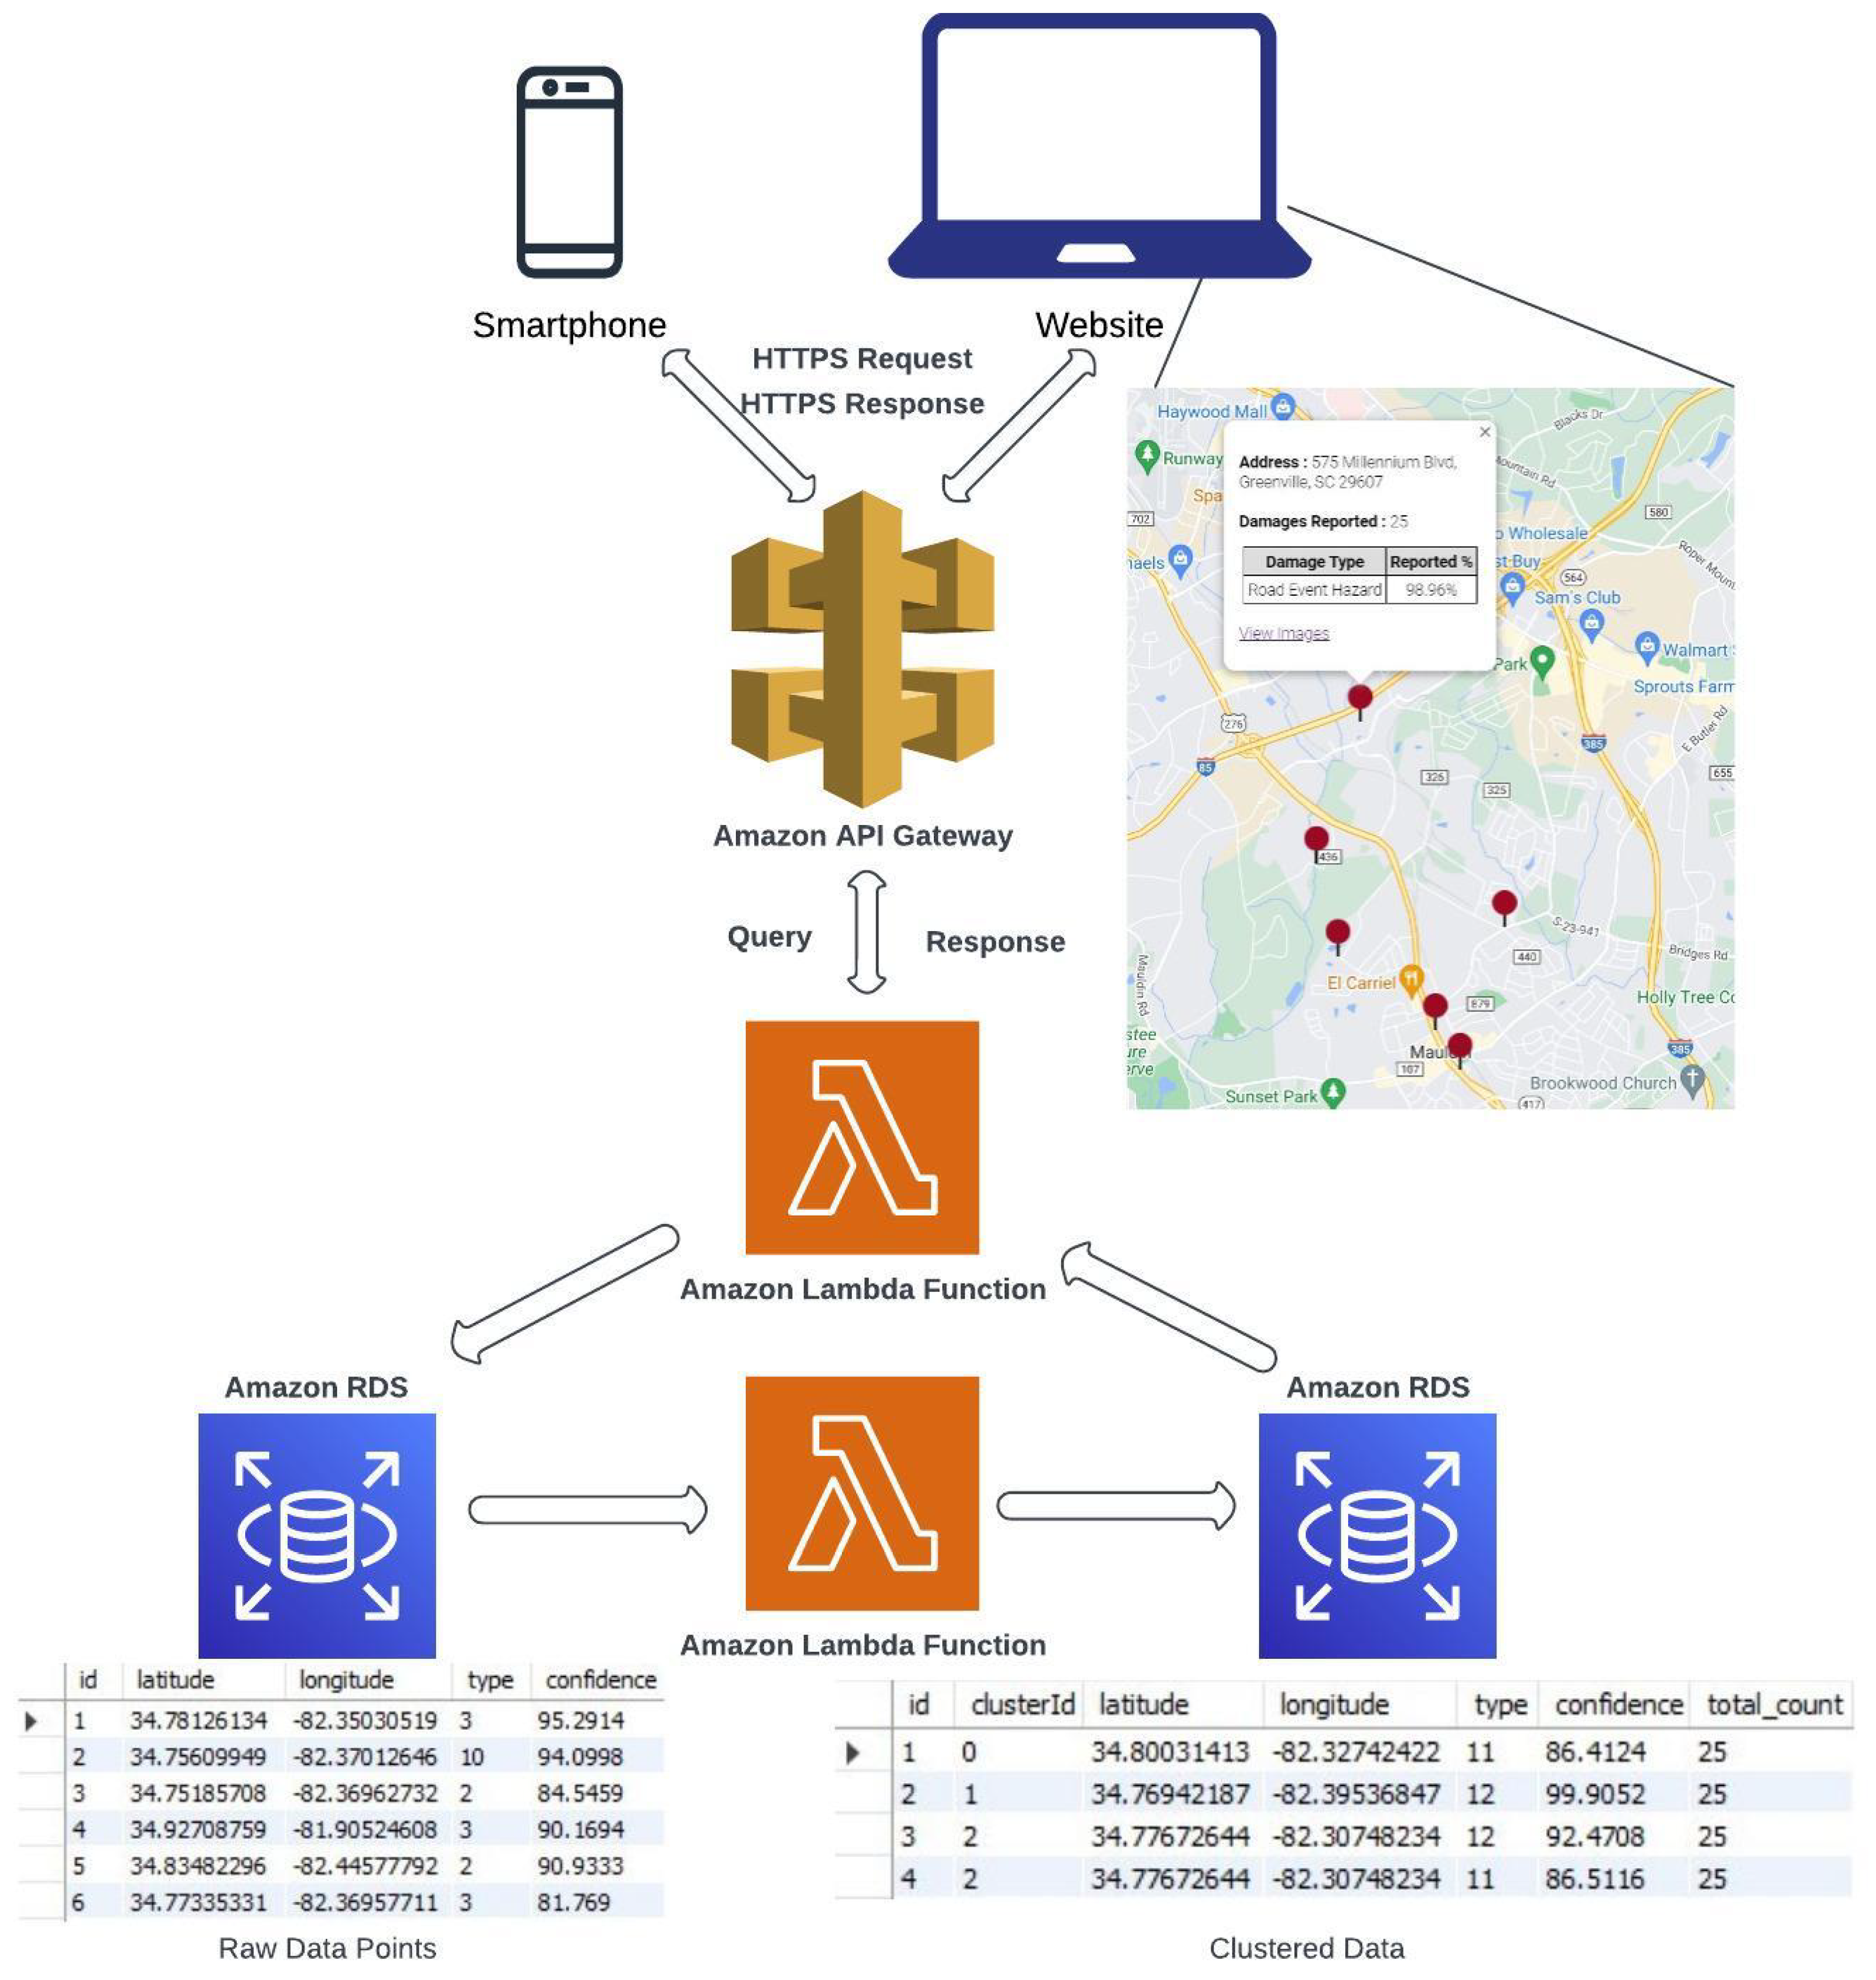
The motion-based road hazard data labels recorded by multiple vehicles at multiple locations were used to generate more reliable and accurate detection. For cloud-based fusion, the type of hazard, GPS locations of road hazard detection, and confidence were utilized. The recorded hazards were stored in a database through a relational database service (RDS) of the Amazon Web Services (AWS) cloud. The RDS contained the type of hazard, GPS coordinates, and confidence ratings. For multiple readings of road hazards detected by different vehicles at the same location, clustering was required to report the damages and was achieved by cloud-based fusion. The AWS lambda function posted the data from the AWS API gateway to the relational database. Raw road hazard detection data were populated and clustered to provide optimized results. Furthermore, the road hazard data were posted to the website through the AWS lambda and the API gateway functions.
Figure 5 gives an overview of the optimized clustering and cloud-based fusion approach. Due to various types of noise and environmental factors, road hazard detection at the same location will have slightly varying GPS coordinates. To consolidate these detections, k-means clustering, an unsupervised, non-deterministic, and iterative algorithm, was implemented. This clustering method has been proven effective in obtaining accurate results and has been used in many practical applications [24]. The k-means clustering algorithm showed effective results in [25,26] by converging to the local minimum. At first, k centers are randomly chosen by the algorithm, and each data point is assigned to the nearest k center calculated by the Euclidean distance. The first k clusters are created as a result. The algorithm recalculates new centers by averaging the data labels given to the initial centers after allocating data labels to k centers. Then, newly created centers are further recalculated and reassigned up until the criterion function is minimized or the algorithm loops a predetermined number of times.
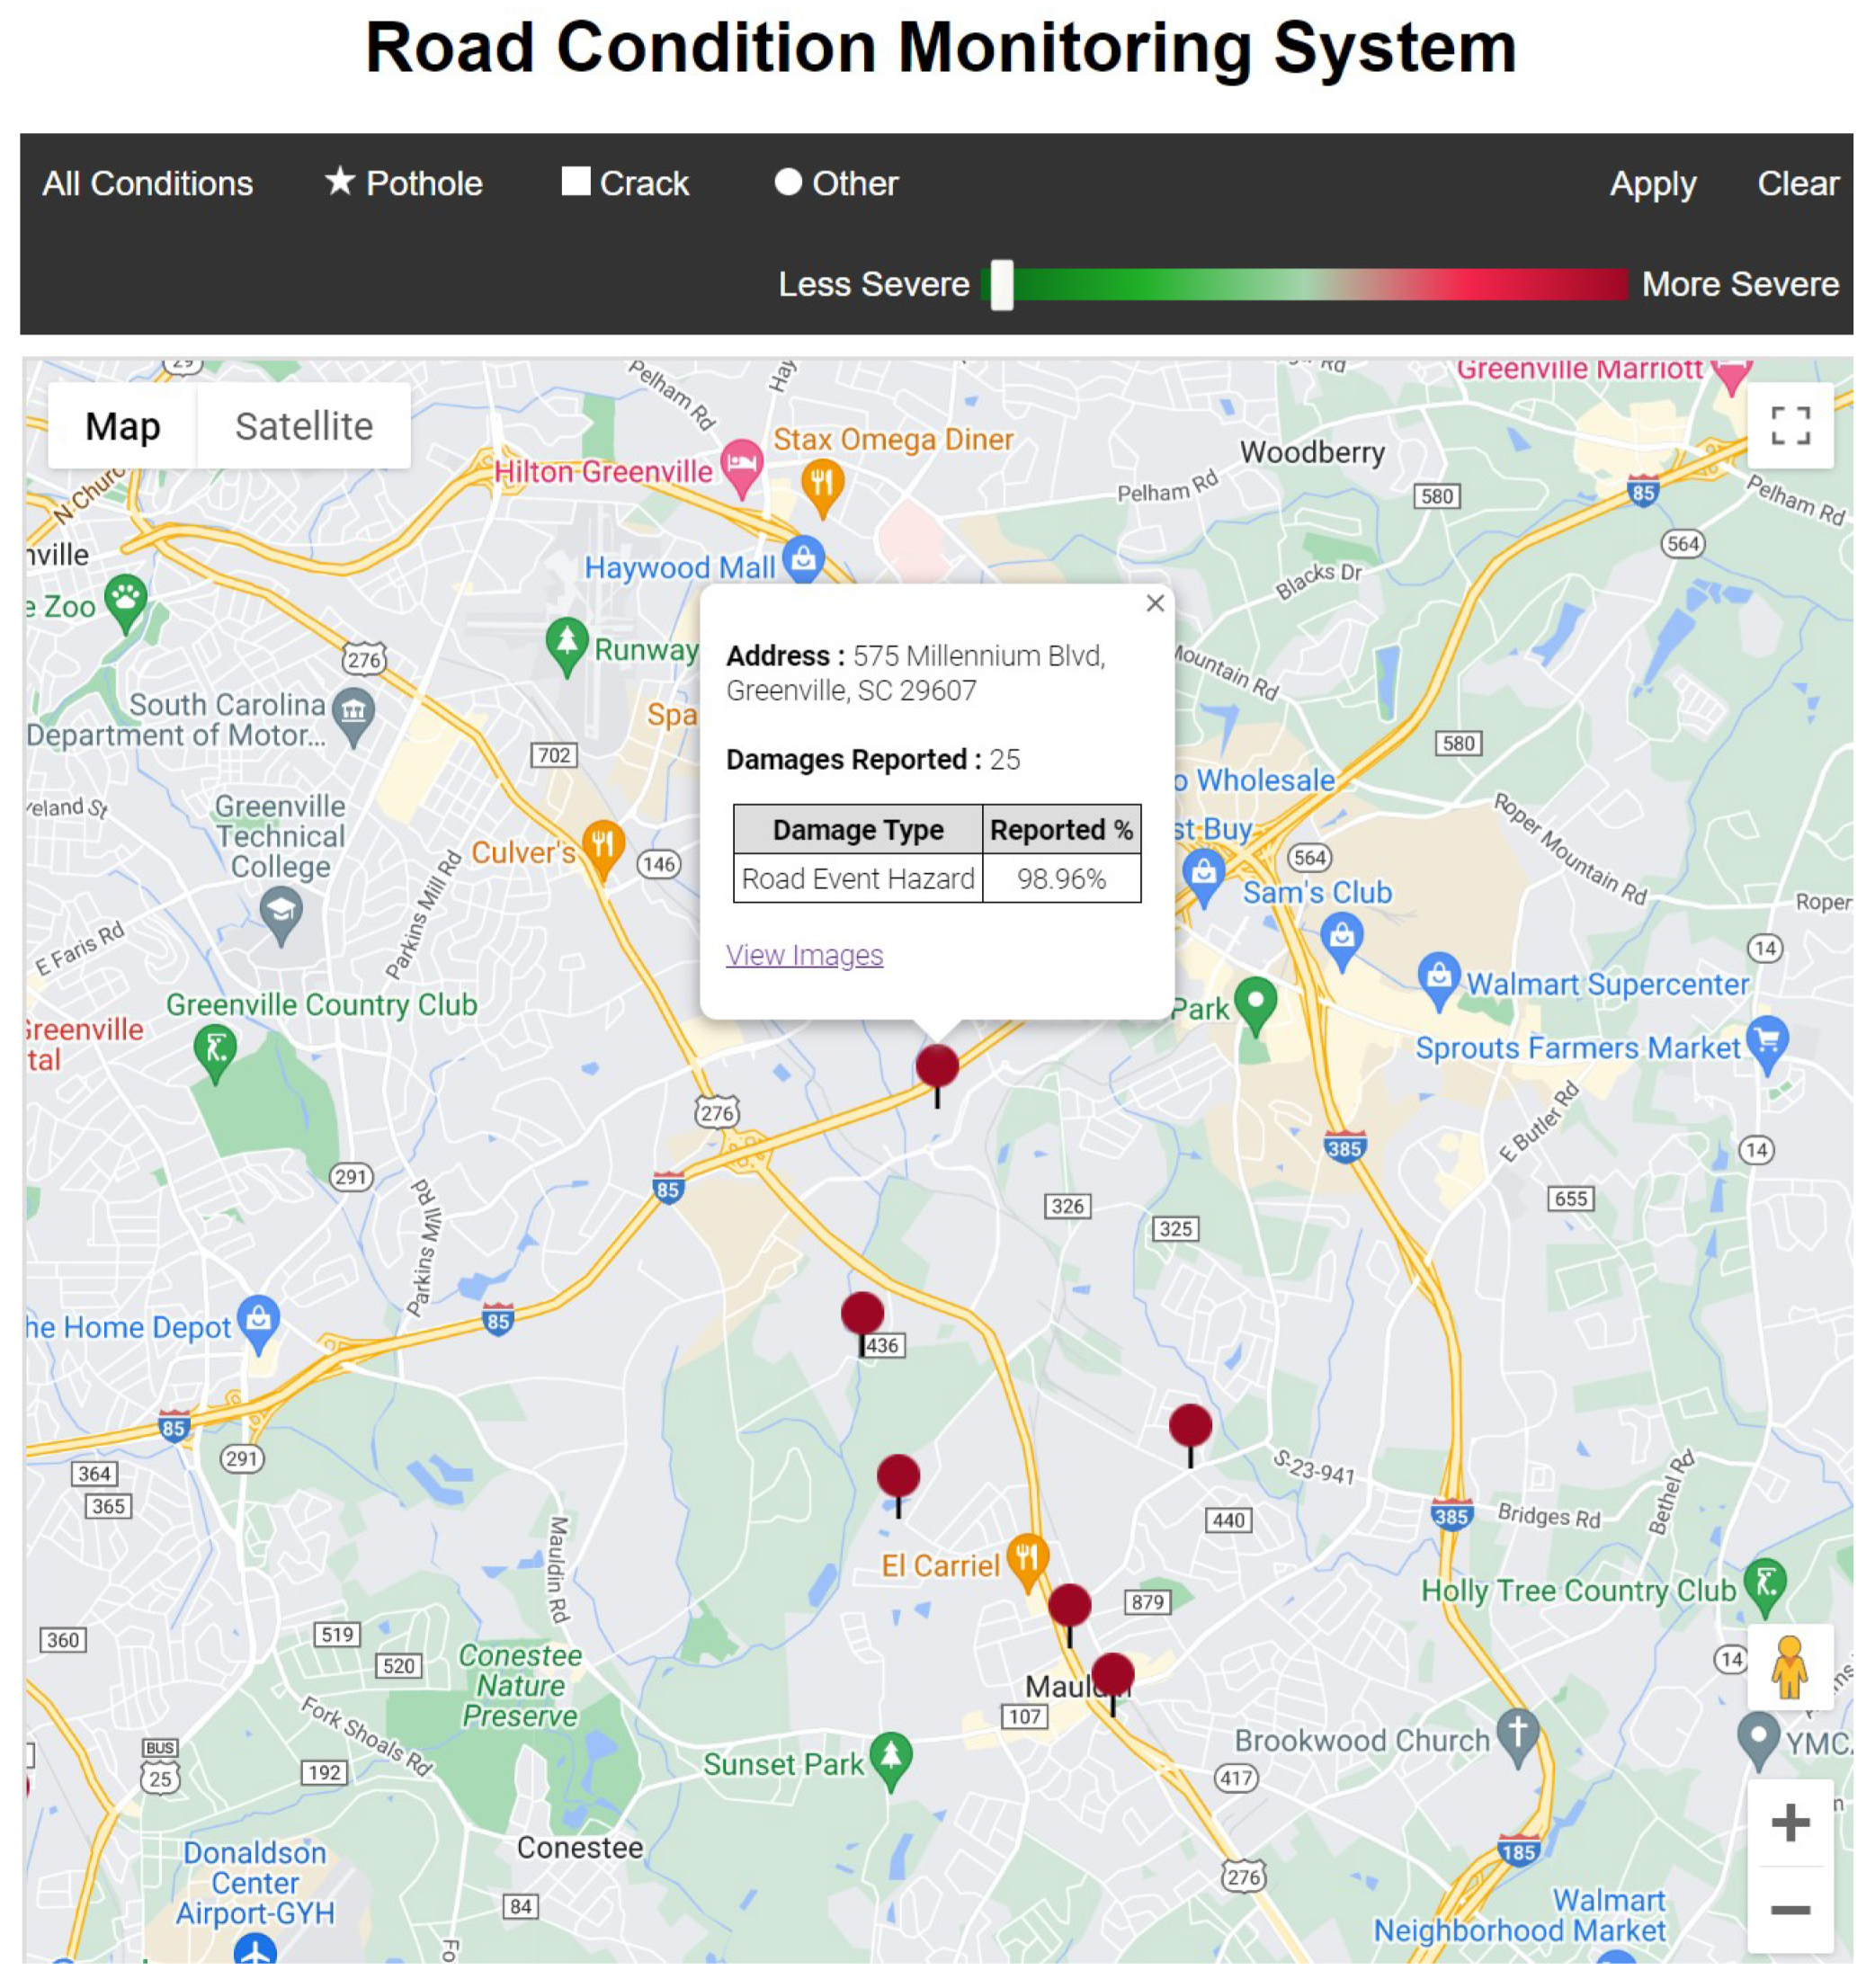
This paper considers only latitudes and longitudes from the data labels collected. Algorithm 1 represents the outline of k-means clustering. The initial value of k is considered to be 1; consequently, k-means clustering is performed on the dataset. The value of k increases until the average within-cluster sum of squares (WCSS) of the previous k and current k is less than or equal to 0.001, thus obtaining a final and optimum number of k clusters. WCSS is the average squared distance from every point inside a cluster to the centroid of the cluster. Each cluster represents the data labels that are nearest to one another and have a high probability of being close or at the exact location. Each cluster is allotted with a centroid latitude and longitude value of that cluster, type of hazard, average confidence of all the data labels in that cluster for each hazard type, the total count of the data labels in a cluster, and a cluster ID containing the top three hazard types based on decreasing average confidences, as shown in Figure 5. A web UI displays the cluster information on a map with its address, hazard type, total damages reported, and respective confidence.
Algorithm 1 Clustering Algorithm
  1:
for k in range(k_initial,k_maximum+1) do
  2:
      kmeans = k_clusters.fit(locations)
  3:
      centroids = kmeans.random_centers
  4:
      predict = kmeans.centroids
  5:
      for i in range(number of locations) do
  6:
            centroids = kmeans.random_centers
  7:
            WCSS = WCSS + (locations(i) − current_center(i)) 2
  8:
            if WCSS < 0.001 & k > 1 then
  9:
                  return WCSS, centroid, k, predict
  10:
          end if
  11:
     end for
  12:
end for
  13:
return WCSS, centroid, k, predict

2.7. Threshold-Based Road Hazard Detection Model

Regarding the types of road hazards, various acceleration inputs are generated by the smartphone in the vehicle. These types of road hazards can be recognized by different patterns or by setting a logic-based threshold value. For instance, if the vehicle hits a pothole or a bump, passengers experience a spike in vertical acceleration. If a vehicle tries to avoid obstacles by going sideways, passengers experience lateral acceleration. Threshold values are applied to 3-axis acceleration data to find sudden accelerations in the sensor data that can be identified as road hazards. The acceleration data are analyzed, and thresholds are determined in an iterative optimization manner to obtain the most effective method of detecting road hazards.

3. Experimental Results

3.1. Experimental Data Representation and Data Processing

This section represents the data information, which is introduced in Section 3.1.1, and the data processing, which is explained in Section 3.1.2.

3.1.1. Data Representation

Motion data from the BeamNG simulation and real-world smartphones were collected at a frequency of 100 hertz. Figure 6 and Figure 7 represent the motion of a vehicle when encountering road event hazards and road defect hazards, respectively. As observed for the road event hazards, the vehicle experiences high lateral acceleration from yaw movement when trying to avoid obstacles, accidents, etc., on the road. For a road defect hazard, vertical vehicle acceleration has a spike corresponding to pitch movement when going over potholes, bumps, etc., on the road. The data distribution used for this paper is presented in Table 1. A total of 2758 motion data labels from simulated and real-world tests were collected for three road hazards and were classified as having no hazards, road event hazards, and road defect hazards. Out of these, 2008 data labels were obtained from the BeamNG simulation software, and 750 data labels were obtained from real-world testing. These data labels were labeled as 0 for no hazard, 1 for a road defect hazard, and 2 for a road event hazard; they were then associated with their respective time stamp. All the data processing, namely labeling, and filtering, was performed on MATLAB R2021a software.
For the cloud-based fusion experiment, a total of 250 road hazard detections were used to evaluate the approach from 5 different locations, each with road event hazards and road defect hazards. The data were collected from 5 different smartphones mounted in 5 different vehicles. The GPS coordinates of each detection were recorded to be utilized for k-means clustering and cloud-based fusion.

3.1.2. Data Processing

Figure 8 represents the lateral acceleration plot over time in the road event hazard scenario with and without filtering. As observed, unfiltered data from simulation and smartphone sensors consists of high-frequency noise. Kalman-filtered motion data exhibit reduced noise with a slight delay in tracking the unfiltered motion data. Low-pass-filtered data eliminate high-frequency noise with good tracking of unfiltered motion data.

3.2. Experimental Results and Analysis

The LSTM model was trained and tested on the Google Colab platform with the TensorFlow2/Keras deep learning library. The tuned model parameters are mentioned in Table 2. These tuned parameters were the same for all three heterogeneous training methods mentioned in Section 2.5. The three features were no hazards, road defect hazards, and road event hazards. For model training, the time series labeled motion data were combined together, and 80 time step data were fed into the LSTM model. The LSTM road hazard detection model was deployed on the smartphone application. The real-time motion data were sent to a smartphone application with 0.8 s (80 time steps) for the rolling window. As observed from the motion data, the recorded road hazards showed a spike in the acceleration from about 0.8 to 1 s. Thus, based on the model training, the sensor data were labeled for 0.8 or 80 time steps, which created a sufficient pattern to detect road hazards. Table 3, Table 4 and Table 5 represent the LSTM training and testing accuracies for the three different tests performed and are explained in Section 3.2.1.

3.2.1. LSTM Model Training Results

Figure 9, Figure 10 and Figure 11 show training accuracies over the epochs for three test cases. The model’s performance on the validation dataset and testing dataset almost stopped improving and started to diverge from one another, and at that point, the training process was terminated. This shows that the model was trained prior to the emergence of an overfitting problem. The trained LSTM result for test 1, which consists of motion data from the simulation only, gives a training accuracy of 95.5%. Test 2, which consists of motion data from the simulation, gives a training accuracy of 96.1%, and test 3, which consists of motion data mixed from the simulation and real world, gives a training accuracy of 95.6% in classifying road hazards. For all the tests, the loss has a good learning rate with less decay and decreases with increasing training accuracy until the model is overtrained. Both the Kalman-filtered data and the low-pass-filtered data for each test provide very similar training accuracies, suggesting these techniques are viable for the noise reduction of sensor-based time series motion data.

3.2.2. LSTM Model Testing Results

Figure 12, Figure 13 and Figure 14 depict the confusion matrix of the LSTM model for the testing dataset only. Table 3, Table 4 and Table 5 provide accuracy results for the three different tests with two types of data filtering techniques each, namely the Kalman filter and the low-pass filter. Table 6, Table 7 and Table 8 provide class-based results for precision, recall, and F1 score for the three different tests.
For Test 1, where training and testing motion data were only from the simulation, Kalman-filtered data achieved 95.5% training accuracy and 97.8% testing accuracy. Low-pass-filtered motion data, on the other hand, yielded values of 94.5% for training accuracy and 97.3% for testing accuracy. The confusion matrix for road hazard class results can be seen in Figure 11. As observed, all three classes provide an accuracy of over 96%. Table 6 shows good class-based precision, recall, and F1 score. The results suggest a low number of false positives in the prediction of road hazards. This suggests that the simulation-only training and testing dataset is very similar, and the identification of road hazard patterns by the LSTM model is accurate.
For Test 2, where training motion data were only from the simulation and testing motion data were only real data, Kalman-filtered data achieved 96.1% training accuracy and 75.6% testing accuracy. Low-pass-filtered data, on the other hand, yielded values of 96.1% for training accuracy and 79.7% for testing accuracy. The confusion matrix for road hazard class results can be seen in Figure 13. As observed, the identification of road event hazards is 99%. In contrast, road defect hazards and no hazards had an accuracy of detection of 60%. Table 7 shows poor class-based precision, recall, and F1 score. The results suggest a low precision and recall in the prediction of no hazards and road defect hazards. The lower model testing accuracy seen here corresponds to a slightly low correlation between the simulation and the real world but is sufficient to validate the LSTM model. The road event hazard motion data from the simulation and the real world, when observed, are highly similar, thus resulting in high detection accuracy. To improve the accuracy of other classes, more test scenarios with varying potholes and multiple vehicles can be produced and validated.
For Test 3, where the training data are mixed with simulated and real-world data and testing data are only real-world data, Kalman-filtered data achieved 95.6% training accuracy and 89.6% testing accuracy. Low-pass-filtered data, on the other hand, yielded values of 94.6% for training accuracy and 89.0% for testing accuracy. The confusion matrix for road hazard class results can be seen in Figure 14. As observed, the identification of road defect hazards has a high accuracy of 83%, and the accuracy for road event hazards is approximately 100%. For no road hazards, the accuracy is 64%. Table 8 shows good class-based precision, recall, and F1 score. The results suggest a low number of false positives in road hazard prediction. The false detection of road hazards and no hazards is better than missing road hazard detections. The LSTM model parameters were tuned to increase recall and precision to predict road events and defect hazards. The improved test accuracy compared to Test 2 corresponds to the introduction of a small amount of real-world motion data to train the model. This suggests that the real-world motion data for the pothole and undamaged classes are slightly different from the simulated motion data. The accuracy can be further improved by training the model with more tests and training motion data.
Overall, the LSTM model performed better than similar models that have been used in research, including in [18,19]. The simulation-based motion data took less time to generate, with almost no cost involved. Moreover, the LSTM model trained with simulated and real motion data and tested with real motion data provided good road hazard detection accuracy, proving the legitimacy of the usage of simulated motion data. Although the real-world motion data are just a small portion of all the motion data collected, the model trained with the most simulated motion data provides good performance in real-data testing. Filtering techniques proved to be effective in reducing noise and detecting road hazards accurately. These filtering techniques can further be implemented in real time.

3.2.3. Cloud-Based Fusion Results

The LSTM training model used simulated and real-world data for cloud-based fusion. Table 9 shows the results obtained from the cloud-based fusion approach. The k-means clustering algorithm deployed on AWS lambda clustered 250 individual data labels into 9 clusters, each with a centroid latitude and longitude. The k-means algorithm also segregates the clusters by different types, with ‘11’ being road defect hazards and ‘12’ being road event hazards. The accuracy before fusion is more than 92% for all the data labels, indicating the good performance of the LSTM model. For each cluster, out of 25 total detections for the same hazard type, almost more than 23 were true detections. Thus, accuracy after cloud-based fusion is 100% for road hazard detection. The web page’s user interface (UI) for the clustering results, hazard classifications, and their confidence with respect to their locations is shown in Figure 15 as a screen capture. The website allows relevant authorities to see the road damage that people have reported using a mobile application.

3.2.4. Threshold-Based Model Testing Results

Based on the threshold model explained in Section 2.7, for the two tests mentioned in Section 2.5.1 with simulated data only and Section 2.5.3 with real-world data only, different thresholds were set to predict road hazards. When a vehicle is driven on roads with no damages or hazards, there is no spike in acceleration in the x, y, or z-axis. When a vehicle is driven over a bump or pothole (a road defect hazard), it experiences a major spike in vertical acceleration (z-axis) and a minor spike in x and y acceleration; see Figure 6. When a vehicle is driven suddenly around an obstacle or hazard (a road event hazard), it experiences lateral acceleration (x-axis) and a minor spike in the y and z-axis acceleration; see Figure 7. Thresholds were selected based on the information on different acceleration patterns caused by road hazards. An iterative process was established to change these thresholds to achieve the best prediction results.
Table 10 represents the prediction results obtained by the thresholding method. Test 1 includes the acceleration data obtained from only the simulation, and Test 2 includes only the data obtained from the real world. As observed, the accuracy in predicting road hazards based on simulation data is 82.25%, which is good; however, compared to the LSTM model, which achieved an accuracy of 97.8%, it is significantly reduced. The accuracy in predicting road hazards based on real data is 62.52%, which is poor compared to the LSTM model, which achieved a value of 89.6%. Figure 16 and Figure 17 are confusion matrices for thresholding tests 1 and 3, respectively.

4. Conclusions

This paper emphasises the problem of road surface monitoring for various detected road hazards. The method uses vehicle motion data from a simulation platform and the real world collected from smartphones. A deep-learning-based LSTM technique was trained for this task. A soft-body-physics-based simulation platform was explored to provide realistic vehicle behavior. The performance of the proposed method was proven in the simulation platform and real-world experiments. Cloud-based fusion techniques provided more accurate results, allowing the road hazards to be monitored with more reliability. The following areas of the work, however, could still use improvement. We can add more information to the dataset currently used for training the deep learning models. This work involves only motion-based data. In the future, vision-based and motion-based road hazard detection will be combined to provide better results. The current work does not provide information on the severity of the road hazards. In our future work, we will provide metrics to include the severity index for various road hazards. Moreover, we will classify road hazards based on sub-types of hazards, such as potholes, cracks, unpaved roads, bumps, etc. The current work involves gathering the data and testing it on the deep learning model. In our future work, we will further deploy a road hazard warning system on the smartphone application to the commuters traveling on the road in close proximity based on GPS-recorded road hazard data.

Author Contributions

Conceptualization, G.C. and Y.J.; Data curation, M.B.; Formal analysis, M.B.; Funding acquisition, G.C. and Y.J.; Methodology, M.B. and L.G.; Project administration, G.C. and Y.J.; Resources, G.C. and Y.J.; Software, M.B.; Supervision, L.G., G.C. and Y.J.; Validation, M.B.; Writing—original draft, M.B.; Writing—review and editing, Y.J. All authors have read and agreed to the published version of the manuscript.

Funding

This study is based upon work supported by the Center for Connected Multimodal Mobility (C2M2) (a US Department Transportation Tier 1 University Transportation Center) headquartered at Clemson University, Clemson, South Carolina, US. Any opinions, findings, conclusions, or recommendations expressed in this paper are those of the authors and do not necessarily reflect the views of the Center for Connected Multimodal Mobility, and the U.S. government assumes no liability for the contents or use thereof.

Institutional Review Board Statement

Not applicable.

Informed Consent Statement

Not applicable.

Data Availability Statement

Not applicable.

Conflicts of Interest

The authors declare no conflict of interest.

References

  1. Available online: https://www.nhtsa.gov/press-releases/early-estimate-2021-traffic-fatalities (accessed on 10 January 2023).
  2. González, A.; O’brien, E.J.; Li, Y.-Y.; Cashell, K. The use of vehicle acceleration measurements to estimate road roughness. Veh. Syst. Dyn. 2008, 46, 483–499. [Google Scholar] [CrossRef]
  3. Chen, K.; Lu, M.; Fan, X.; Wei, M.; Wu, J. Road condition monitoring using on-board Three-axis Accelerometer and GPS Sensor. In Proceedings of the 2011 6th International ICST Conference on Communications and Networking in China (CHINACOM), Harbin, China, 17–19 August 2011; pp. 1032–1037. [Google Scholar] [CrossRef]
  4. Lei, T.; Mohamed, A.A.; Claudel, C. An IMU-based traffic and road condition monitoring system. HardwareX 2018, 4, e00045. [Google Scholar] [CrossRef]
  5. Li, Y.; Liu, C.; Shen, Y.; Cao, J.; Yu, S.; Du, Y. RoadID: A Dedicated Deep Convolutional Neural Network for Multipavement Distress Detection. J. Transp. Eng. Part B Pavements 2021, 147, 04021057. [Google Scholar] [CrossRef]
  6. Tsai, Y.C.; Kaul, V.; Mersereau, R.M. Critical assessment of pavement distress segmentation methods. J. Transp. Eng. 2010, 136, 11–19. [Google Scholar] [CrossRef]
  7. Llopis-Castello, D.; Paredes, R.; Parreno-Lara, M.; Garcia-Segura, T.; Pellicer, E. Automatic Classification and Quantification of Basic Distresses on Urban Flexible Pavement through Convolutional Neural Networks. J. Transp. Eng. Part B Pavements 2021, 147, 04021063. [Google Scholar] [CrossRef]
  8. Alipour, M.; Harris, D.K.; Miller, G.R. Robust pixel-level crack detection using deep fully convolutional neural networks. J. Comput. Civ. Eng. 2019, 33, 04019040. [Google Scholar] [CrossRef]
  9. Sattar, S.; Li, S.; Chapman, M. Road surface monitoring using smartphone sensors: A review. Sensors 2018, 18, 3845. [Google Scholar] [CrossRef] [PubMed]
  10. Varona, B.; Monteserin, A.; Teyseyre, A. A deep learning approach to automatic road surface monitoring and pothole detection. Pers. Ubiquitous Comput. 2020, 24, 519–534. [Google Scholar] [CrossRef]
  11. Chatterjee, A.; Tsai, Y.C. Training and testing of smartphone-based pavement condition estimation models using 3d pavement data. J. Comput. Civ. Eng. 2020, 34, 04020043. [Google Scholar] [CrossRef]
  12. Ramesh, A.; Nikam, D.; Balachandran, V.N.; Guo, L.; Wang, R.; Hu, L.; Comert, G.; Jia, Y. Cloud-Based Collaborative Road-Damage Monitoring with Deep Learning and Smartphones. Sustainability 2022, 14, 8682. [Google Scholar] [CrossRef]
  13. Ameddah, M.A.; Das, B.; Almhana, J. Cloud-Assisted Real-Time Road Condition Monitoring System for Vehicles. In Proceedings of the 2018 IEEE Global Communications Conference (GLOBECOM), Abu Dhabi, United Arab Emirates, 9–13 December 2018; pp. 1–6. [Google Scholar] [CrossRef]
  14. Yuan, Y.; Islam, M.S.; Yuan, Y.; Wang, S.; Baker, T.; Kolbe, L.M. EcRD: Edge-Cloud Computing Framework for Smart Road Damage Detection and Warning. IEEE Internet Things J. 2021, 8, 12734–12747. [Google Scholar] [CrossRef]
  15. Pham, V.; Pham, C.; Dang, T. Road damage detection and classification with detectron2 and faster r-cnn. In Proceedings of the 2020 IEEE International Conference on Big Data (Big Data), Atlanta, GA, USA, 10–13 December 2020; pp. 5592–5601. [Google Scholar]
  16. Mahjoub, S.; Chrifi-Alaoui, L.; Marhic, B.; Delahoche, L.; Masson, J.-B.; Derbel, N. Prediction of energy consumption based on LSTM Artificial Neural Network. In Proceedings of the 2022 19th International Multi-Conference on Systems, Signals and Devices (SSD), Sétif, Algeria, 6–10 May 2022; pp. 521–526. [Google Scholar] [CrossRef]
  17. Kapoor, A.; Rastogi, V.; Kashyap, N. Forecasting Daily Close Prices of Stock Indices using LSTM. In Proceedings of the 2020 2nd International Conference on Advances in Computing, Communication Control and Networking (ICACCCN), Greater Noida, India, 18–19 December 2020; pp. 10–14. [Google Scholar] [CrossRef]
  18. Ma, M.; Liu, C.; Wei, R.; Liang, B.; Dai, J. Predicting machine’s performance record using the stacked long short-term memory (LSTM) neural networks. J. Appl. Clin. Med. Phys. 2022, 23, e13558. [Google Scholar] [CrossRef] [PubMed]
  19. Poh, S.-C.; Tan, Y.-F.; Guo, X.; Cheong, S.-N.; Ooi, C.-P.; Tan, W.-H. LSTM and HMM Comparison for Home Activity Anomaly Detection. In Proceedings of the 2019 IEEE 3rd Information Technology, Networking, Electronic and Automation Control Conference (ITNEC), Chengdu, China, 15–17 March 2019; pp. 1564–1568. [Google Scholar] [CrossRef]
  20. Maul, P.; Mueller, M.; Enkler, F.; Pigova, E.; Fischer, T.; Stamatogiannakis, L. BeamNG.tech Technical Paper. Available online: https://beamng.tech/blog/2021-06-21-beamng-tech-whitepaper/bng_technical_paper.pdf (accessed on 10 January 2023).
  21. Rio, A.; Alfian, M.; Sunardi, S. Noise Reduction in the Accelerometer and Gyroscope Sensor with the Kalman Filter Algorithm. J. Robot. Control (JRC) 2020, 2, 180–189. [Google Scholar] [CrossRef]
  22. Bondan, S.; Kitasuka, T.; Aritsugi, M. Vehicle Vibration Error Compensation on IMU-accelerometer Sensor Using Adaptive Filter and Low-pass Filter Approaches. J. Inf. Process. 2019, 27, 33–40. [Google Scholar]
  23. Hochreiter, S.; Schmidhuber, J. Long Short-Term Memory. Neural Comput. 1997, 9, 1735–1780. [Google Scholar] [CrossRef] [PubMed]
  24. Jain, A.K.; Murty, M.N.; Flynn, P.J. Data clustering: A review. ACM Comput. Surv. 1999, 31, 264–323. [Google Scholar] [CrossRef]
  25. Na, S.; Xumin, L.; Yong, G. Research on k-means Clustering Algorithm: An Improved k-means Clustering Algorithm. In Proceedings of the 2010 Third International Symposium on Intelligent Information Technology and Security Informatics, Ji’an, China, 2–4 April 2010; pp. 63–67. [Google Scholar] [CrossRef]
  26. Nazeer, K.A.A.; Sebastian, M.P. Improving the Accuracy and Efficiency of the k-means Clustering Algorithm. In Proceedings of the World Congress on Engineering 2009 Vol I WCE 2009, London, UK, 1–3 July 2009. [Google Scholar]
Figure 1. Road hazard detection system framework.
Vehicles 05 00031 g001
Figure 2. BeamNG simulation motion data generation framework.
Vehicles 05 00031 g002
Figure 3. BeamNG simulation environment and one example of potholes.
Vehicles 05 00031 g003
Figure 4. LSTM architecture for deep-learning-based road hazard detection.
Vehicles 05 00031 g004
Figure 5. Cloud -based fusion approach.
Vehicles 05 00031 g005
Figure 6. Vehicle motion data for road event hazards.
Vehicles 05 00031 g006
Figure 7. Vehicle motion data for road defect hazards.
Vehicles 05 00031 g007
Figure 8. Lateral acceleration motion data with and without filtering.
Vehicles 05 00031 g008
Figure 9. LSTM training accuracy and loss for simulation data only—Test 1.
Vehicles 05 00031 g009
Figure 10. LSTM training accuracy and loss for separated simulated and real data—Test 2.
Vehicles 05 00031 g010
Figure 11. LSTM training accuracy and loss for simulation and real mixed data—Test 3.
Vehicles 05 00031 g011
Figure 12. LSTM-based confusion matrix for Test 1 (simulation only) with Kalman-filtered data.
Vehicles 05 00031 g012
Figure 13. LSTM-based confusion matrix for Test 2 (separate simulated and real data) with low-pass-filtered data.
Vehicles 05 00031 g013
Figure 14. LSTM-based confusion matrix for Test 3 (mixed simulated and real data) with low-pass-filtered data.
Vehicles 05 00031 g014
Figure 15. Road hazard representation on web UI.
Vehicles 05 00031 g015
Figure 16. Threshold-based confusion matrix for Test 1 (simulation only).
Vehicles 05 00031 g016
Figure 17. Threshold-based confusion matrix for Test 3 (real data only).
Vehicles 05 00031 g017
Table 1. Motion data distribution.
Hazard TypeSimulationReal-WorldTotal
No hazard1091941185
Road defect hazard217278495
Road event hazard7003781078
Total20087502758
Table 2. LSTM tuning parameters.
Parameter NameParameter Used
Number of features3
Number of time steps80
Number of training epochs15
OptimizerAdam
Batch size512
Learning rate0.0025
Loss regularizationL2 loss 0.0015
Table 3. LSTM accuracy results for only simulation data—Test 1.
Training
Data
Testing
Data
Filter
Type
Training
Accuracy
Testing
Accuracy
SimulationSimulationKalman95.5%97.8%
SimulationSimulationLow-pass94.5%97.3%
Table 4. LSTM accuracy results for simulation and real separate data—Test 2.
Training
Data
Testing
Data
Filter
Type
Training
Accuracy
Testing
Accuracy
SimulationRealKalman96.1%75.6%
SimulationRealLow-pass95.2%79.7%
Table 5. LSTM accuracy results for simulation and real mixed data—Test 3.
Training DataTesting DataFilter TypeTraining AccuracyTesting Accuracy
Simulation + RealRealKalman95.6%89.6%
Simulation + RealRealLow-pass94.6%89.0%
Table 6. LSTM results for F1, precision, and recall for Test 1.
Hazard TypePrecisionRecallF1Total Count
No damage0.990.970.98418
Road Defect Hazard0.9910.9983
Road Event Hazard0.960.980.97271
Table 7. LSTM results for F1, precision, and recall for Test 2.
Hazard TypePrecisionRecallF1Total Count
No damage0.60.430.5131
Road Defect Hazard0.60.890.72186
Road Event Hazard0.990.870.93433
Table 8. LSTM results for F1, precision, and recall for Test 3.
Hazard TypePrecisionRecallF1Total Count
No damage0.640.650.6465
Road Defect Hazard0.830.920.87188
Road Event Hazard10.930.96294
Table 9. K-means clustering and cloud-based fusion results.
Cluster IDLatitudeLongitudeHazard TypeTotal CountTrue CountAccuracy before FusionAccuracy after Fusion
034.8003−82.327411252392%100%
134.7694−82.3954122525100%100%
234.7767−82.307512252496%100%
234.7767−82.307511252392%100%
334.7344−82.374411252080%100%
434.7521−82.298312252392%100%
534.7930−82.301311252496%100%
634.8166−82.3215122525100%100%
734.7896−82.3245122525100%100%
834.7813−82.310911252496%100%
Table 10. Threshold-based accuracy, F1, precision and recall results for simulation only (Test 1) and real data only (Test 3).
TestsHazard TypeAccuracyPrecisionRecallF1Total
Count
Test 1No damage 0.810.960.88411
SimulationRoad defect hazard82.25%0.650.790.7184
data onlyRoad event hazard 0.950.620.75277
Test 3No damage 0.370.740.4994
Real-worldRoad defect hazard62.93%0.810.50.62278
data onlyRoad event hazard 0.670.690.68378
Disclaimer/Publisher’s Note: The statements, opinions and data contained in all publications are solely those of the individual author(s) and contributor(s) and not of MDPI and/or the editor(s). MDPI and/or the editor(s) disclaim responsibility for any injury to people or property resulting from any ideas, methods, instructions or products referred to in the content.

