Article

Design of Fast Charging Station with Energy Management for eBuses

1
Faculty of Energy Systems and Nuclear Science, Ontario Tech University (UOIT), Oshawa, ON L1G 0C5, Canada
2
Faculty of Engineering and Applied Science, Ontario Tech University (UOIT), Oshawa, ON L1G 0C5, Canada
*
Author to whom correspondence should be addressed.
Vehicles 2021, 3(4), 807-820; https://doi.org/10.3390/vehicles3040048
Submission received: 22 October 2021 / Revised: 11 November 2021 / Accepted: 15 November 2021 / Published: 23 November 2021

Abstract

:
The popularity of the eBus has been increasing rapidly in recent years due to its low greenhouse gases (GHG) emissions and its low dependence on fossil fuels. This incremental use of the eBus increases the burden to the power grid for its charging. Charging eBus requires a high amount of power for a feasible amount of time. Therefore, developing a fast-charging station (FCS) integrated with Micro Energy Grid (MEG) and hybrid energy storage is crucial for charging eBuses. This paper presents a design of FCS for eBus that integrates MEG with hybrid energy storage with the energy management system. To reduce the dependency on the main utility grid, a hybrid micro energy grid based on a renewable source (i.e., PV) have been included. In addition, hybrid energy storage of batteries and flywheels has also been developed to mitigate the power demand of the fast-charging station during peak time. Furthermore, a multiple-input DC-DC converter has been developed for managing the DC power transfer between the common DC bus and the multiple energy sources. Finally, an energy management system and the controller has been designed to achieve an extensive performance from the fast charging station. MATLAB Simulink has been used for the simulation work of the overall design. Different test case scenarios are tested for evaluating the performance parameters of the proposed FCS and also for evaluating its performance.

1. Introduction

In today’s world, global warming is a major concern to focus on, which is the result of greenhouse gas emissions. Statistics show that the transportation sector is the contributor of 33.7% of the total emission [1]. Moreover, the conventional transport system requires a large amount of fossil fuel during its driving period. As our fossil fuel is limited and has been diminishing day by day, the usage of electric transport, such as Electric Vehicles (EVs), Electric Buses (eBuses), Electric Trucks (eTrucks), has been attractive to the mass population. As the number of eBuses is increasing day by day, another concern arises regarding its power demand and charging infrastructure. A fast-charging station for eBuses requires an enormous amount of power which is in the megawatt range for some cases [2]. This high amount of power demand creates pressure for the main grid during its peak operating hour. To reduce the grid power dependency, a renewable energy sources-based micro energy grid with an emergency backup storage system is a must.
The electrification of the transportation sector is happening rapidly in recent times. As per the Electric Power Research Institute (EPRS), by the next decade the electric transportation market will be increased by five times in Europe and up to 35% in US [3]. In the charging station, the transportation system is charged up by plugging in and the charging speed determines the charging time for the eBuses. The industry has categorized the charging levels into three levels based on this charging speed [4,5]. Level-I is a slow charging station that uses an onboard single-phase AC charger of 2 kW. An eBus charged from a level-I station for 1 h can travel around 8 km. This station takes up to 10 h to charge a battery fully. The level-II station uses both single and three-phase on-board AC chargers with a power rating of up to 20 kW and it requires more or less 6 h to charge from 0–100%. One hour charging from the level-II station will help a vehicle to travel up to 30 km. A level-III charging station, which is known as the fast-charging station, comprises an off-board DC charger with a power rating of 240 kW. This charging station takes only 15 to 30 min to charge a battery up to 80%; with that, a vehicle can travel up to 250 km.
As seen, a fast-charging station requires a huge amount of power, as well as a short charging period, and researchers and scientists are working hard to develop a charging station based on a renewable energy source with a storage system to reduce the dependency on the power grid and also for a backup system. In [6], the authors presented the improvement in the electrical demand curve as well as a profit of the fast-charging station by using a coordinate charging strategy. In [7], the authors adopted an intelligent charging strategy that helps to reduce the stress in the grid during peak time by utilizing the time of use price. A two-phase smart parking algorithm has been proposed in [8], which first optimizes the location and size of renewable energy sources installation and then optimizes the charging characteristics and, by this, they were able to enhance the voltage profile while reducing the power losses. A night-time charging methodology was also adopted in [9].
The effects of discontinuous charging of a level-III fast-charging station can be improved with by energy storage system (ESS). In [10], a battery energy storage system (BESS) is used to store energy produced by the RESs during the off-peak time. In [11], the authors demonstrated a Maximum Power Point Tracking (MPPT) method for the power tracking of wind and PV systems. Several studies have been carried out to achieve different objectives, such as profit maximization [12,13], cost reduction [14], power loss reduction [15,16], generation cost reduction [17], and so on.
Energy Management System [EMS] is the coordination of energy exchange between different facilities with the help of a control strategy. The design of EMS is challenging as the energy produced by the RESs is not consistent. Studies have been done related to a fast-charging station EMS with a battery storage system and PV generations. In [18,19], the authors developed a rule-based predictive controller to meet the requirements of EMS in a decentralised system. Support from the utility grid has been omitted in this study while neglecting the economic aspects.
In a hybrid power system, which is a combination of RESs and ESS, model predictive control (MPC) has been applied extensively as an EMS. An EMS system based on MPC has been developed in [20], where it has been applied for ultra-capacitor State of Charge (SoC) regulation. However, system cost has been neglected in this study while considering the short-term operation. An optimal scheduling approach based on online distributed MPC is designed in [21] for EVs charging. This technology reduces the cost of the charging station under-voltage and power flow constraints. A nonlinear MPC-based integrated powertrain and motion control for fuel cell/battery hybrid vehicles has been proposed in [22]. However, equipment and their replacement cost have been neglected in this study which limits its application.
To overcome those problems, a combined energy storage system (Battery + Flywheel) integrating renewable energy sources with an energy management system has been proposed in this paper. Batteries and flywheels are the most common energy storage technology available in industries. The flywheel is more applicable compared to the battery in fast charging technology due to its high frequent cycling and high power density. Maintaining the flywheel speed in the desired value as well as the DC link voltage is an important issue. To achieve this, a model reference adaptive control (MRAC) has been proposed in this paper to optimize the power sources operating in a fast-charging station.
The remaining paper is organized in the following manner. Section 2 describes the system configuration, Section 3 explains the proposed EMS system along with the control strategy, performance of the proposed system has been evaluated in Section 4 and, finally, the paper is concluded in Section 5.

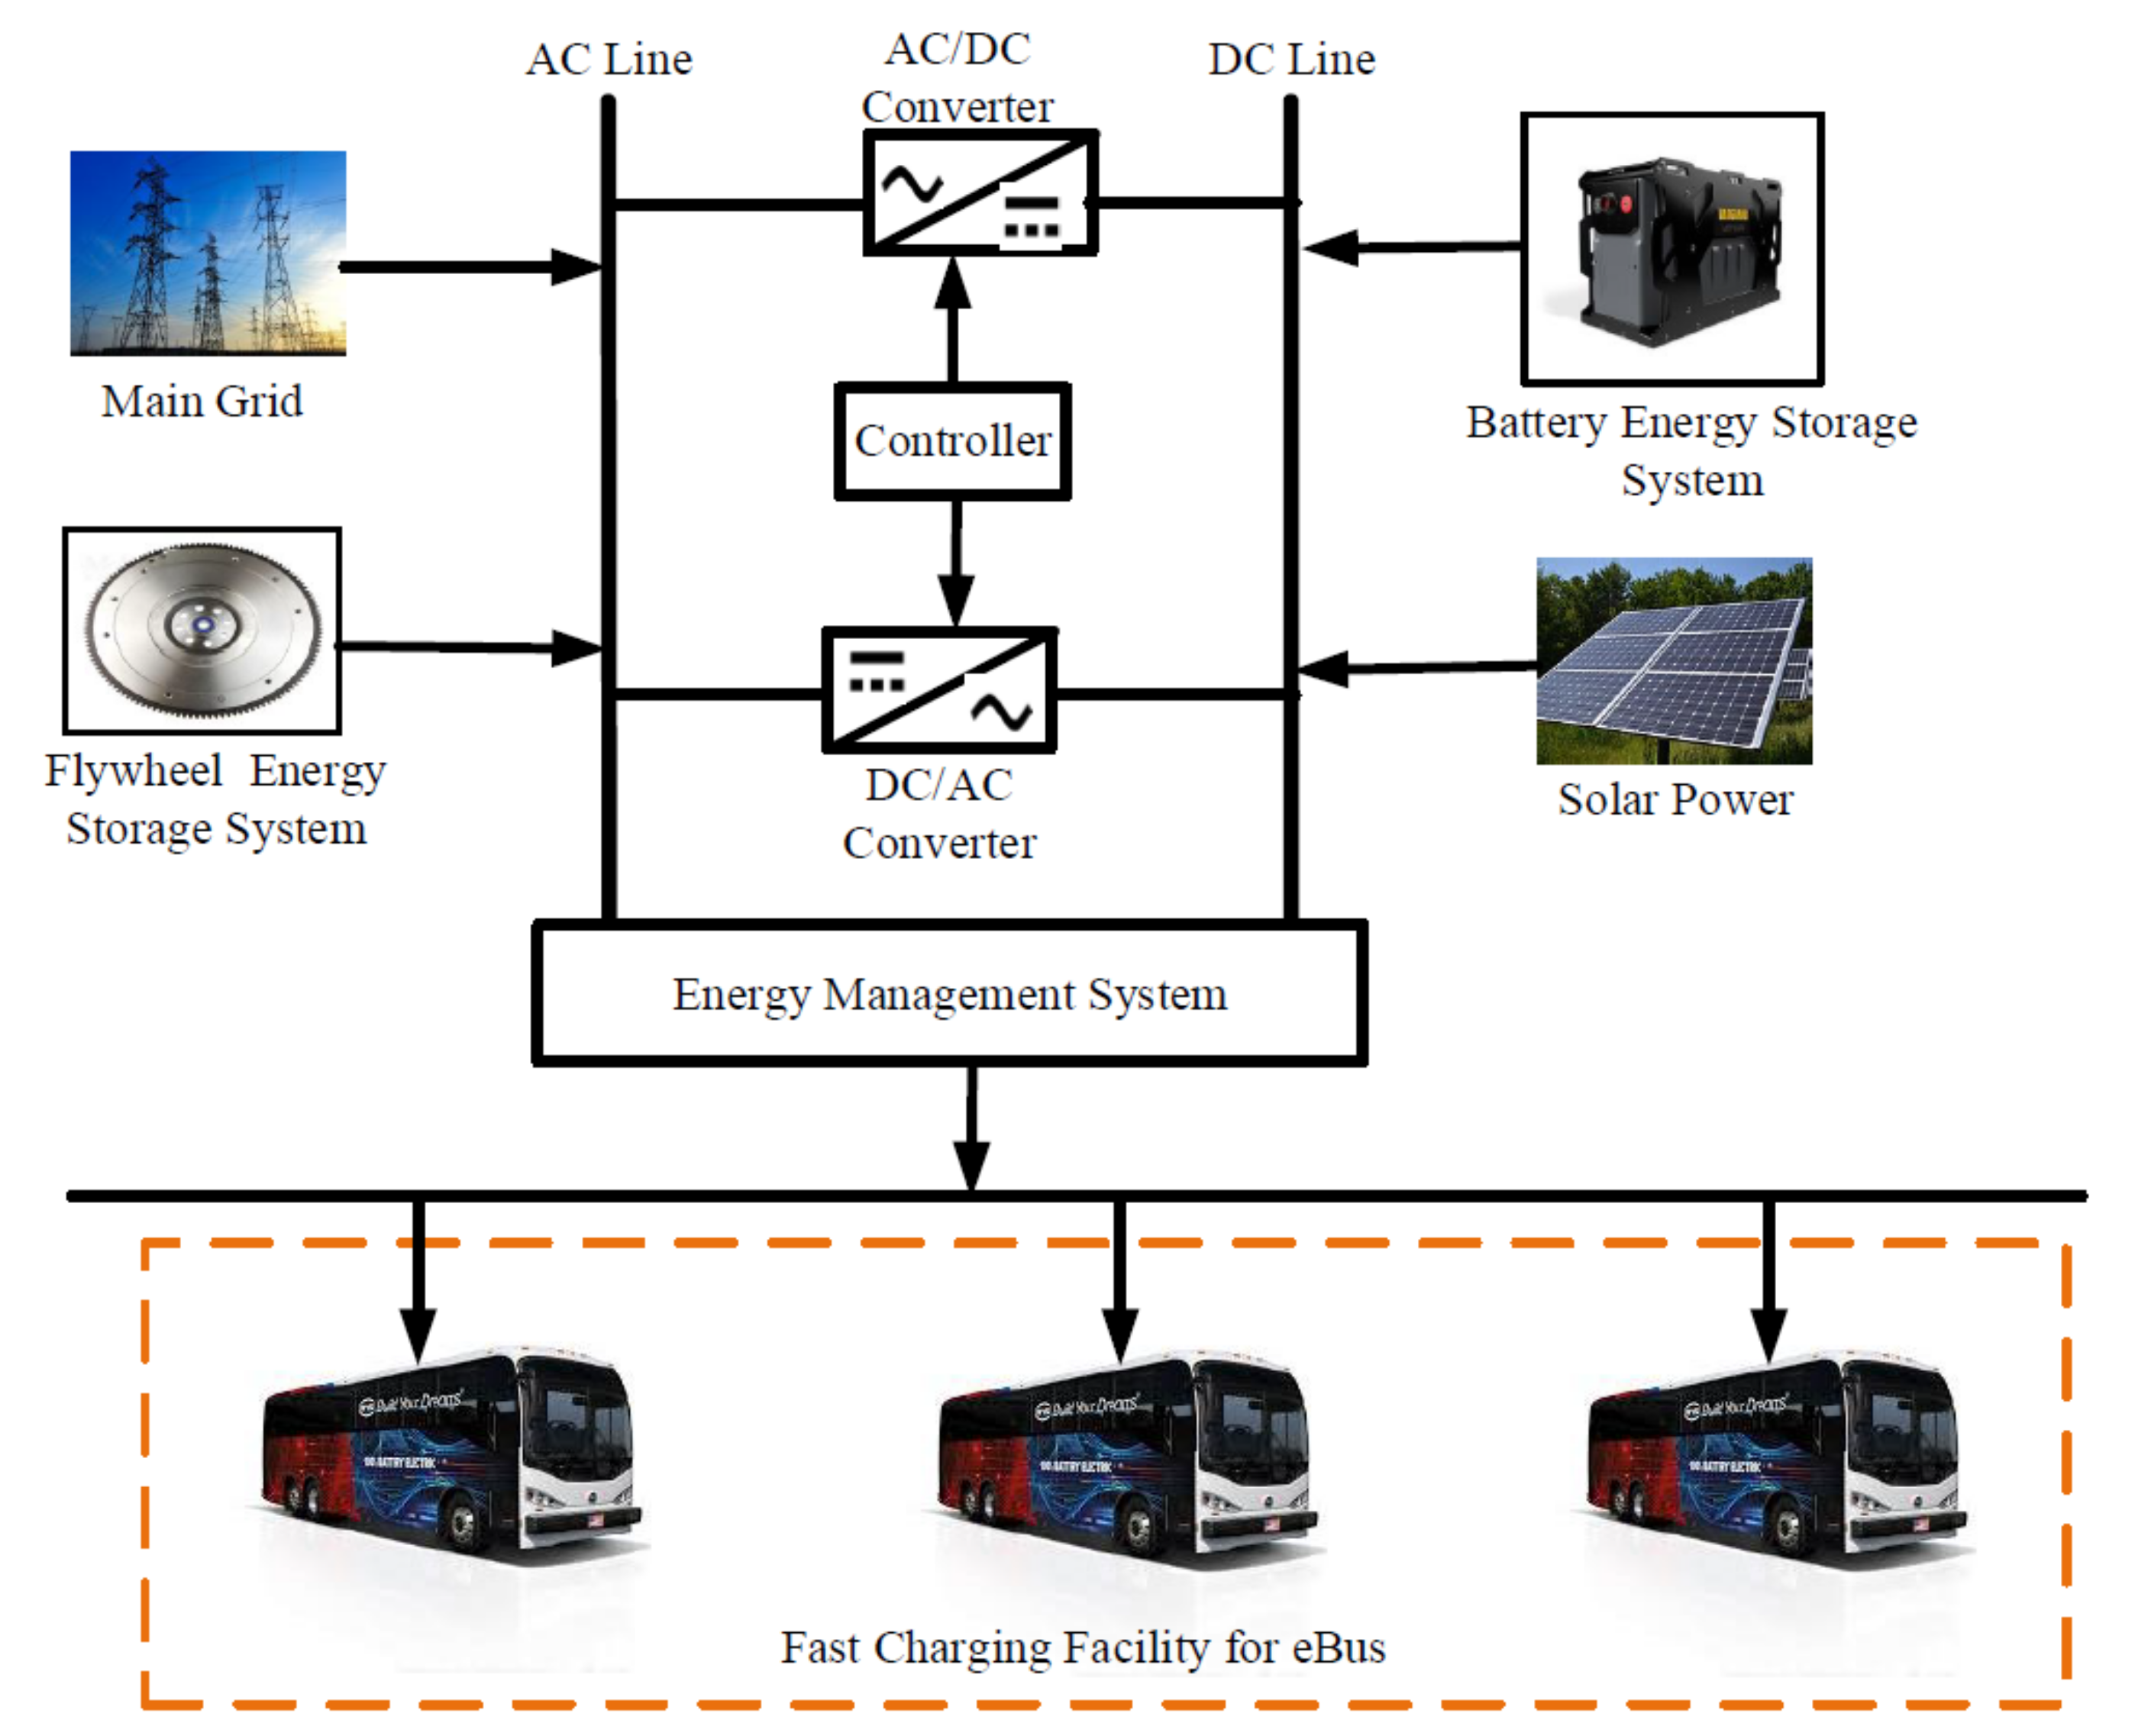
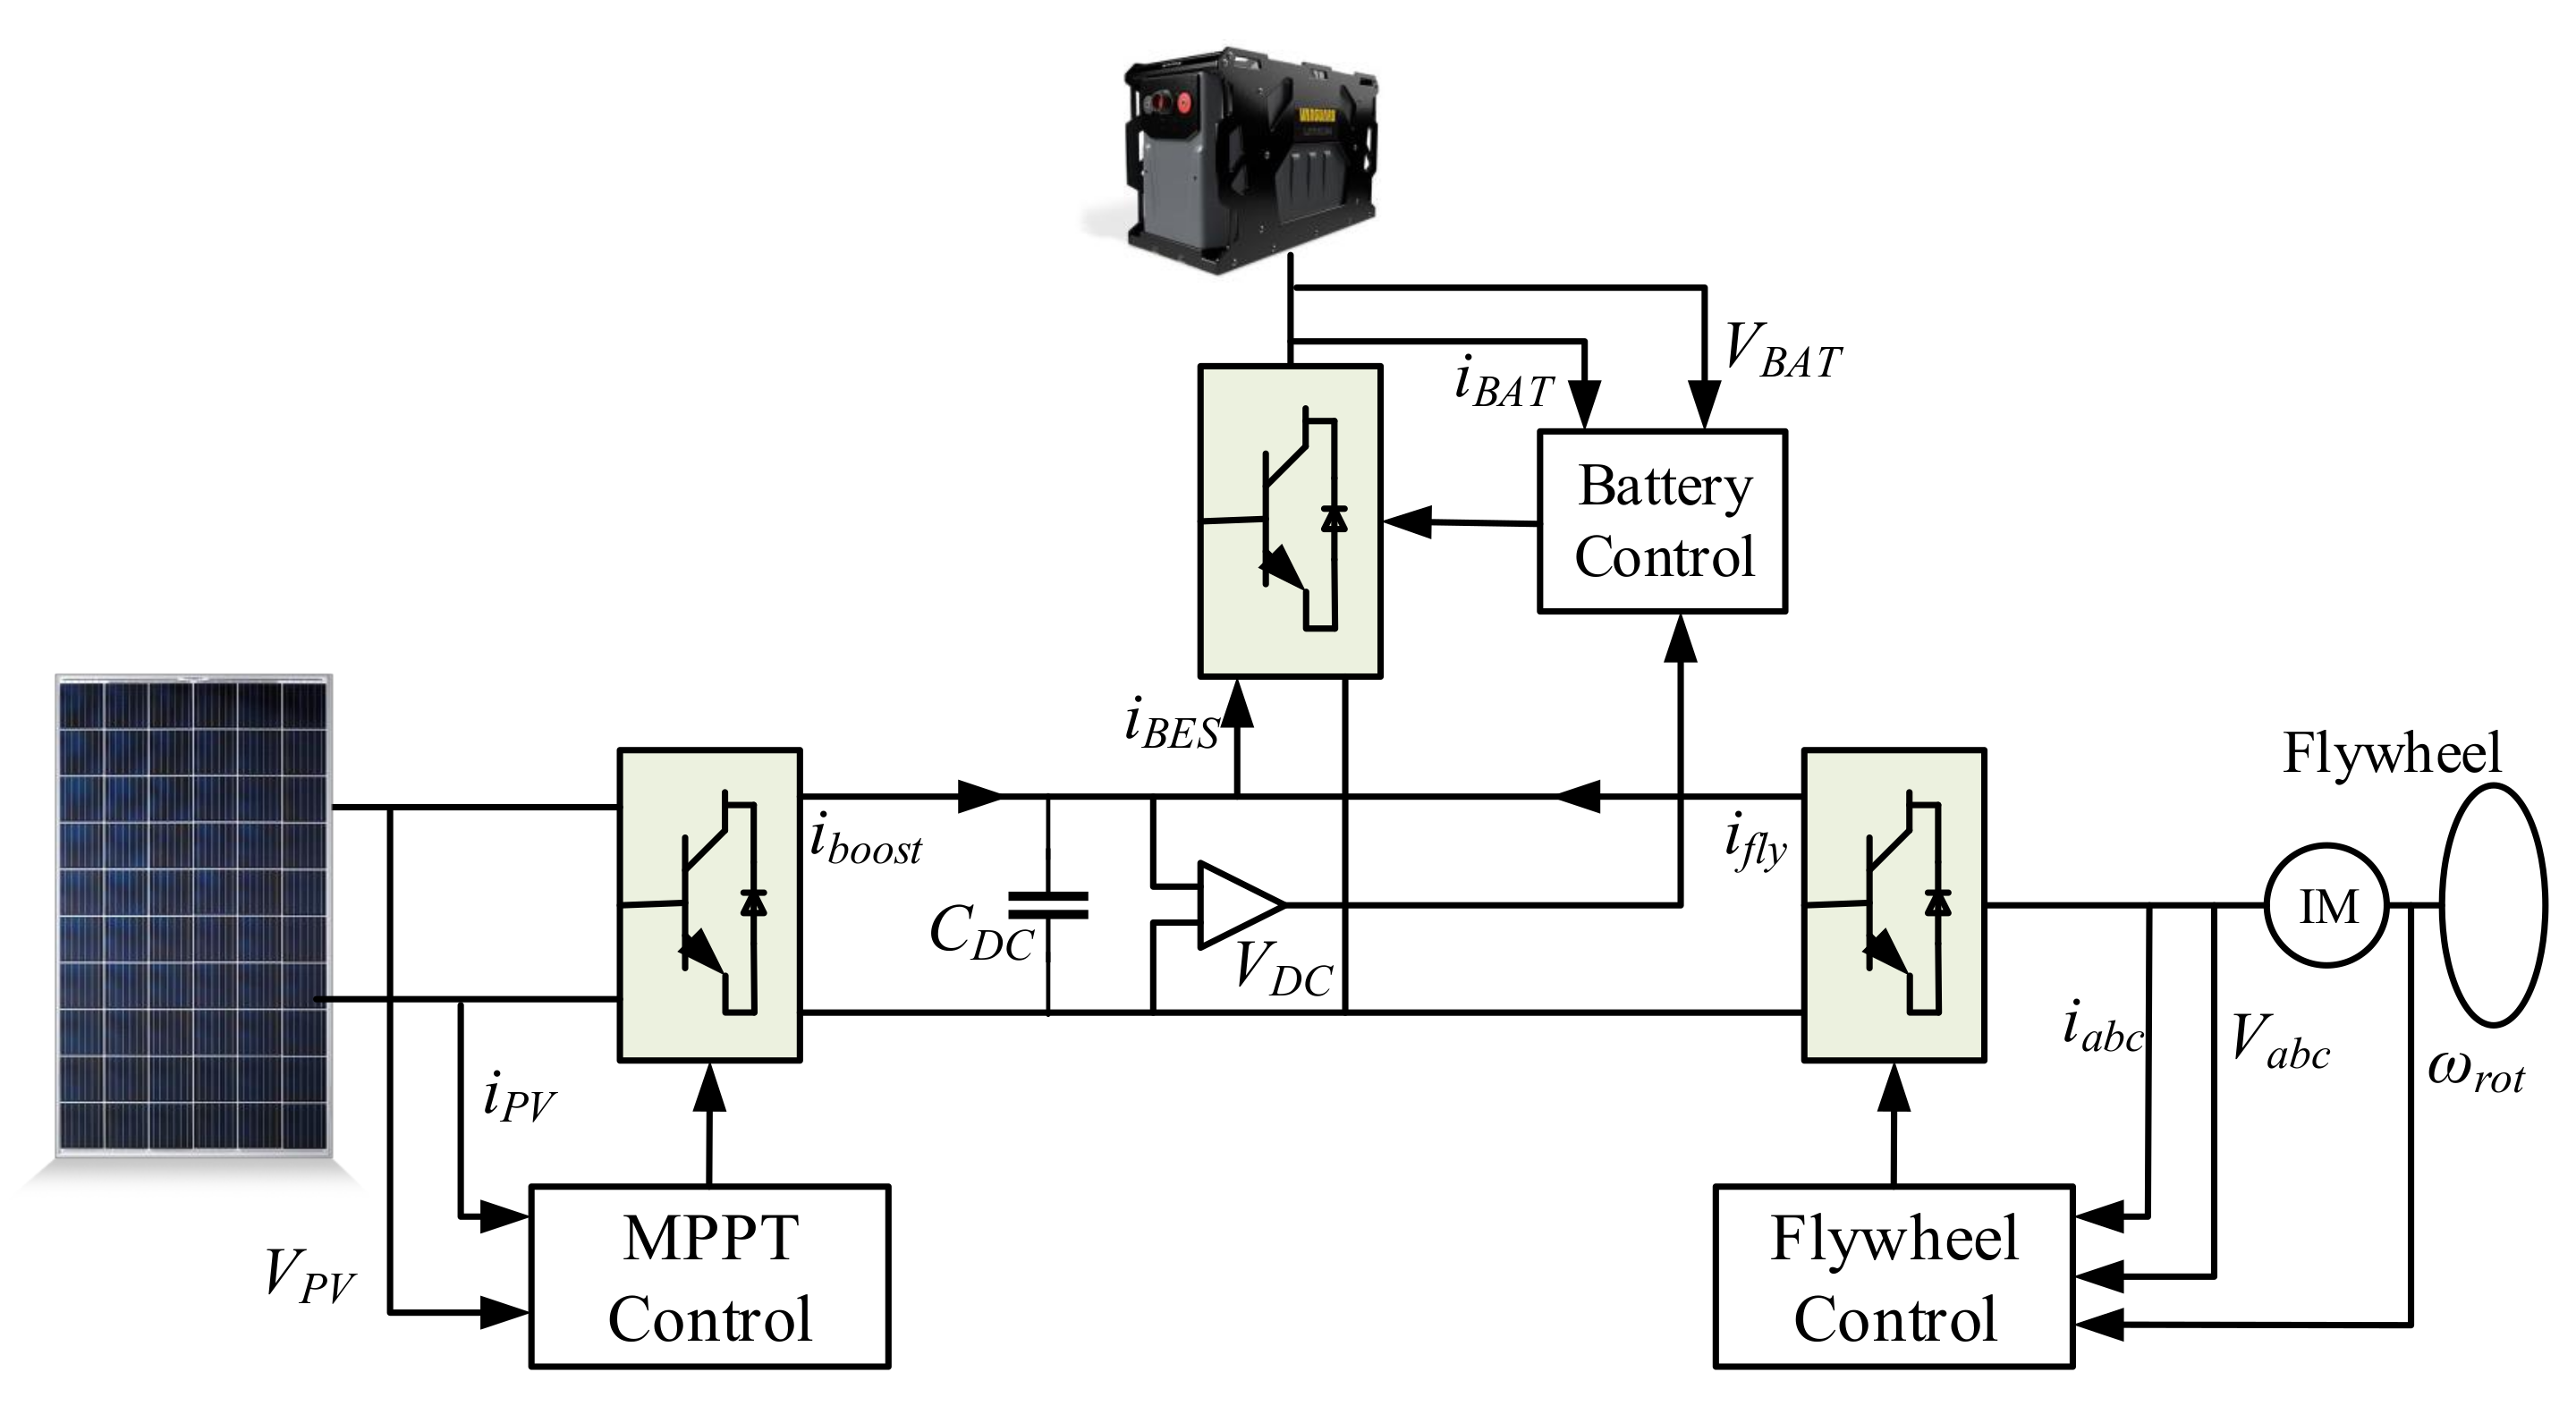
2. System Configuration
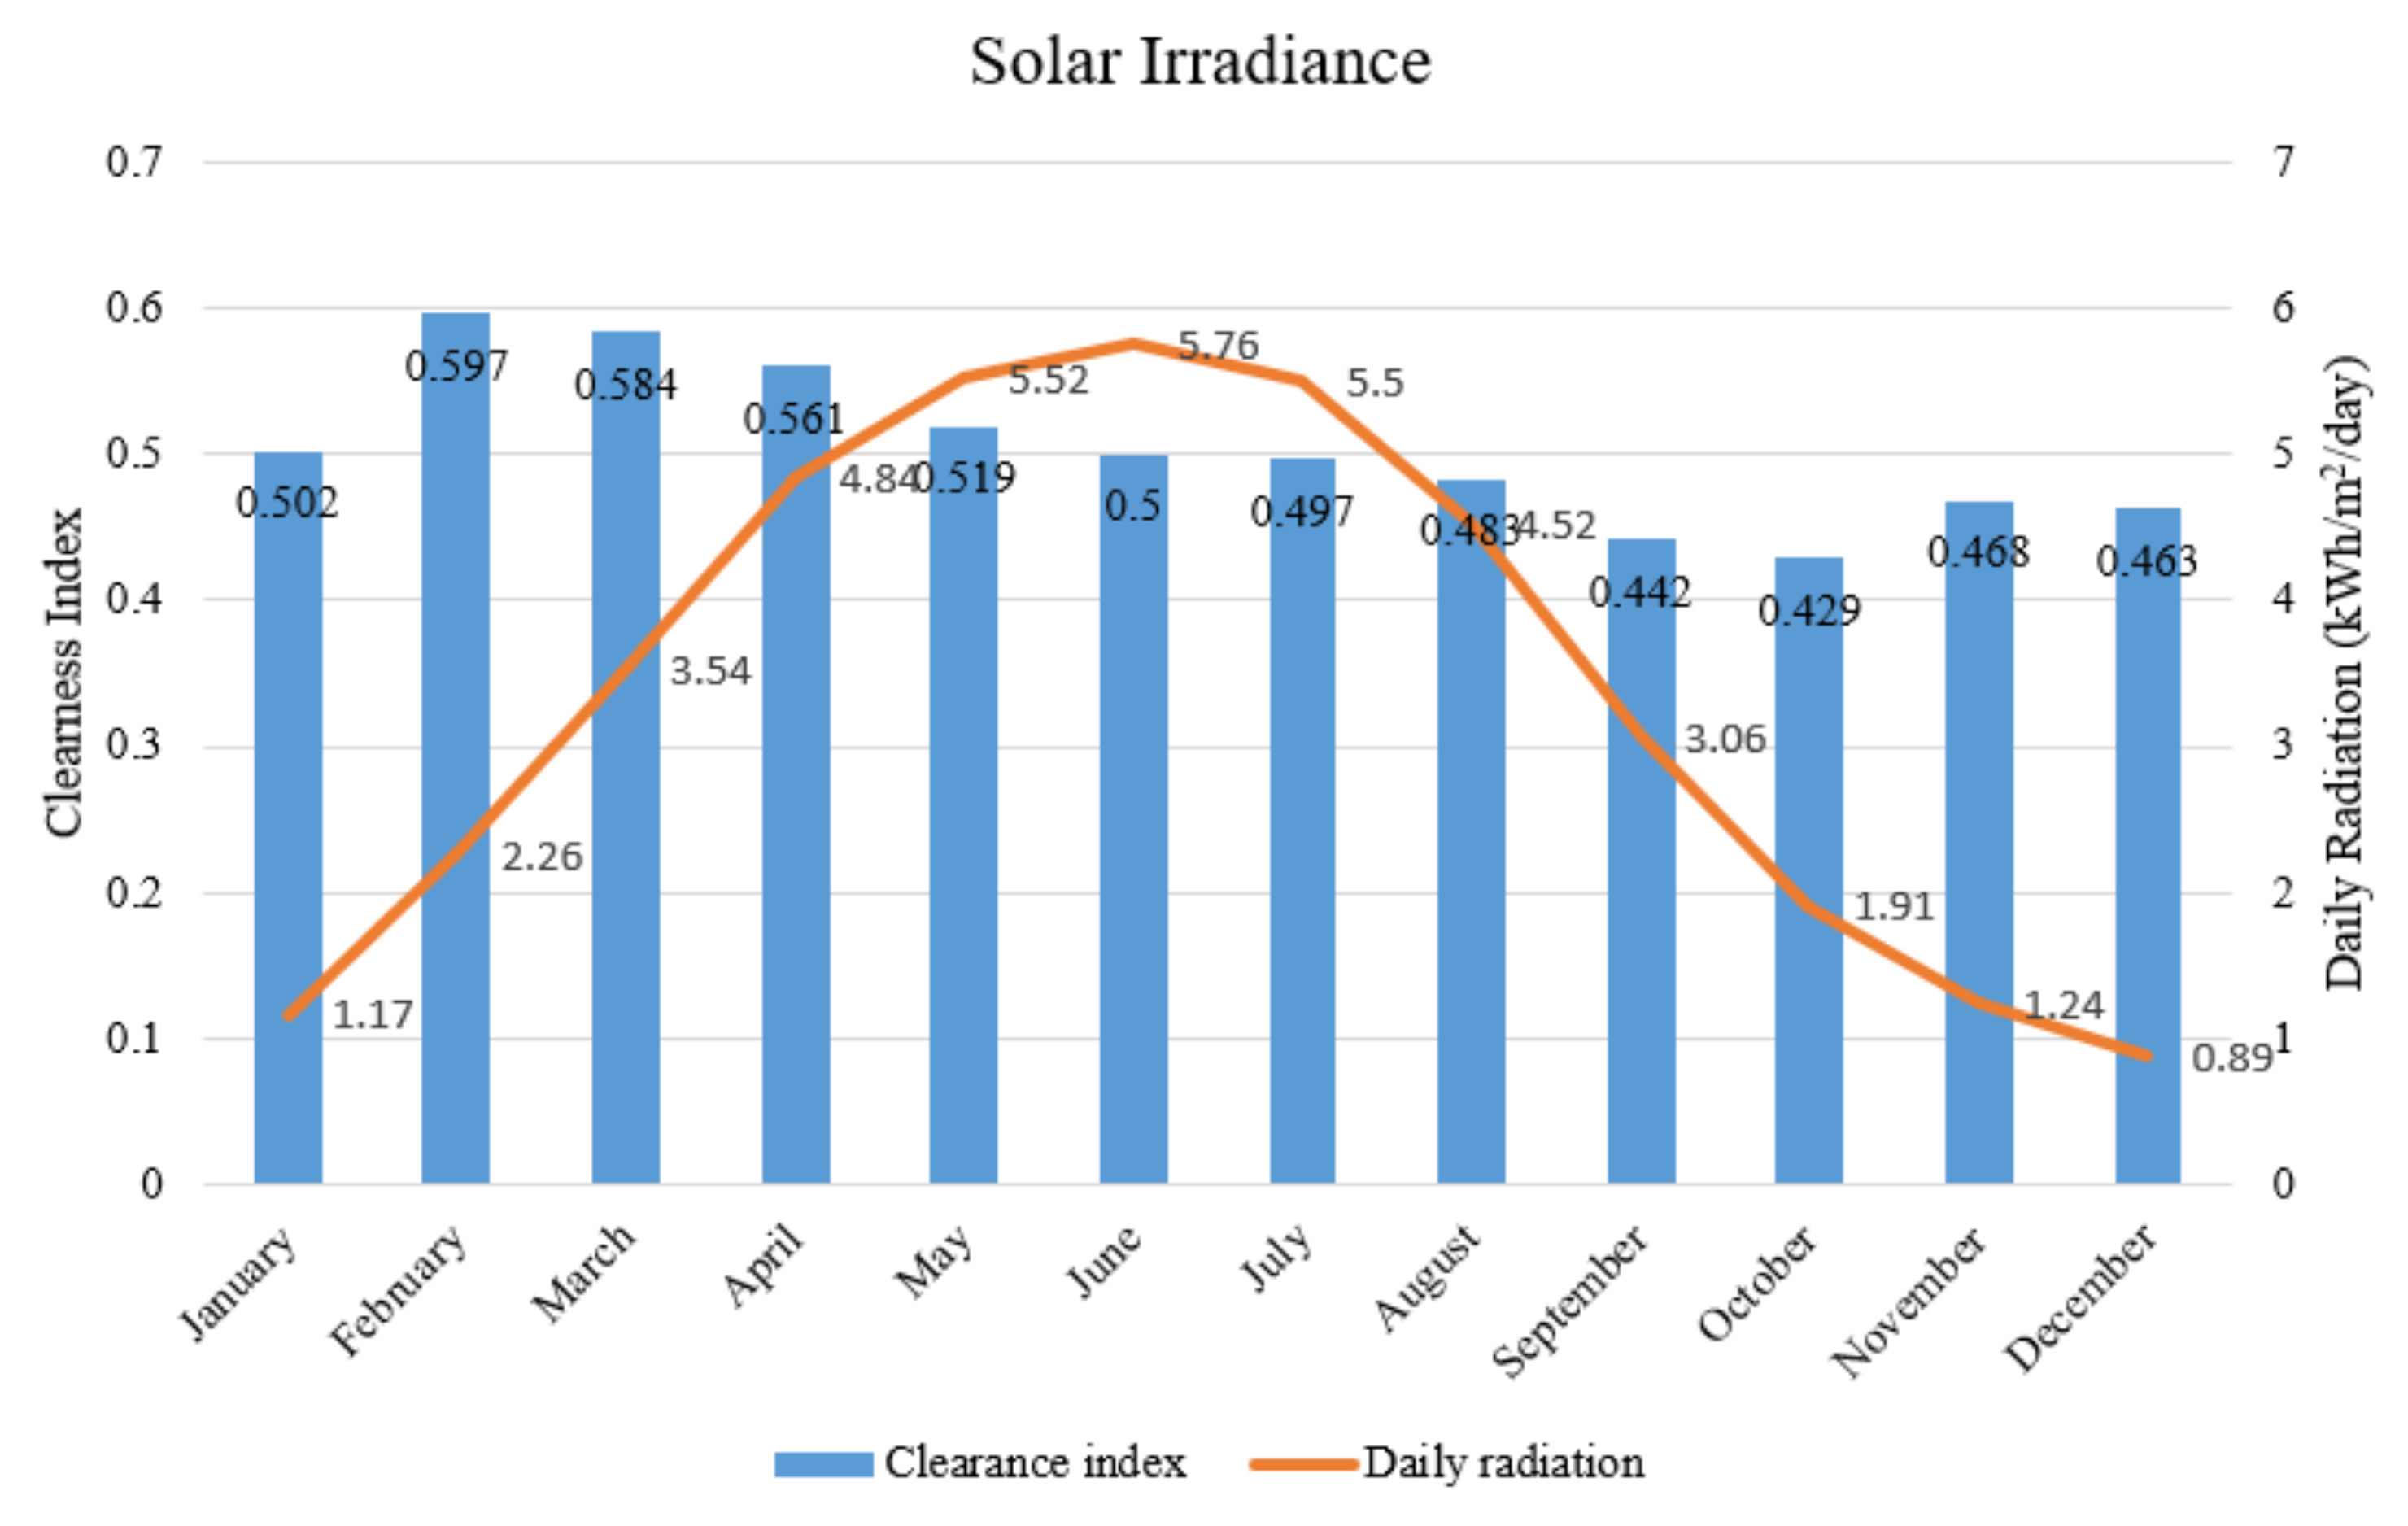
Figure 1 illustrates the proposed fast-charging station with an energy management system for eBuses. In this study, the battery specifications of a Volvo BZL eBus have been considered. This eBus uses lithium-ion batteries and their charging options include a combined charging system (CCS) with a maximum charge power of 150 kW located on the rear side of the bus, as well as rooftop charging with a maximum charge power of 300 kW that allows for fast charging and it requires 5–15 min to charge depending on the SoC of the battery. Considering these power requirements, a PV and flywheel energy storage system has been adopted. The 1Soltech 1STH-215-P module has been considered for PV power generation and a 50 × 50 combination allowed us to achieve maximum 500 kW power. Additionally, a 50 kW flywheel ESS has been modeled as a back up power source in terms of partial shedding effect for the solar system. As the installation and maintenance cost of a flywheel is higher than that of PV, solar energy has been considered the main power supplier in this study. The overall system consists of solar power as part of the micro energy grid, and a flywheel as part of the energy storage system, and an MRAC based control strategy as part of the energy management system. Each part of the system is described in the following sections.

2.1. Solar Power

The common form of renewable energy is solar power and this has been adopted in this study to produce power. Average solar global horizontal irradiance data have been collected from the NASA Surface meteorology and Solar Energy database every month. The following equation is used here to calculate the solar power output [23]:
P s o l a r = Y s o l a r f s o l a r H t H s t c [ 1 + α P ( T t T s t c ) ] ,
where Y s o l a r is the rated capacity of the PV array (kW), f s o l a r is the solar derating factor ( % ) , H t is the solar irradiance at current time (kW/m 2 ), H s t c is the solar irradiance at standard test condition (kW/m 2 ), α P is the temperatureco-efficient (%/ ° C), T t is the solar cell temperature at current time ( ° C), and T s t c is the solar cell temperature at standard test condition ( ° C). Figure 2 represents the clearness index and daily radiation of solar power. The design specifications of the PV module for this paper are described in Table 1.

2.2. Flywheel Storage System

Figure 3 represents the configuration of the flywheel storage system for the fast charging station. From this figure, the dynamics of the system corresponding to the DC-link capacitor can be derived as the following equation [24]:
C D C d V D C d t = i b o o s t + i f l y i B E S ,
where C D C denotes the value of the bus capacitor, i b o o s t is the current flowing from the PV panel boost converter, i f l y is the current flowing from the flywheel, and i B E S is the current extracted by the battery storage system. To simulate the operating behavior of a flywheel, and Induction Motor (IM) is used in this paper. The dynamic behavior of the IM can then be represented as follows:
i ˙ d i ˙ q = V D C σ L s d d d q + R s σ L s ω m R ω m R R s σ L s i d i q 1 σ L s 0 ω m R ψ r L 0 L r ,
where the inductance of the rotor and stator is represented by L r and L s , and the resistance of the rotor and stator is described by R r and R s , while mutual inductance is denoted by L 0 . d and q axis current is represented by i d and i q , flux rotational speed is by ω m R , rotor flux is by ψ r , and total leakage coefficient is by σ .
σ = 1 1 ( 1 + σ s ) ( 1 + σ r ) ,
where σ s and σ r is the leakage coefficient for stator and rotor, respectively. The flowing current from the flywheel towards the DC link can be expressed as follows:
i f l y = 1.5 ( v d i d + v q i q ) V D C .
Putting Equation (3) into Equation (5), the resulting linearized expression around V D C is determined as follows:
i f l y = 3 ( R s + ( L 0 / L r ) 2 R r ) i q + 1.5 ω r 0 L 0 2 i d L r + 1.5 σ L s i q s V D C ,
where ω r 0 is the instantaneous rotational speed. The flywheel swing equation utilizes the rotational speed change of the rotor and is expressed as follows:
j d ω r d t = T E T ;
here, j is the inertia of the flywheel, whereas, electrical torque is denoted as T E T and is defined as:
T E T = 3 p ( 1 σ ) L s i m R i q 2 ,
where p is the number of the pole pairs and i m R is the magnetizing current. The parameter used for IM to simulate flywheel is given in Table 2.

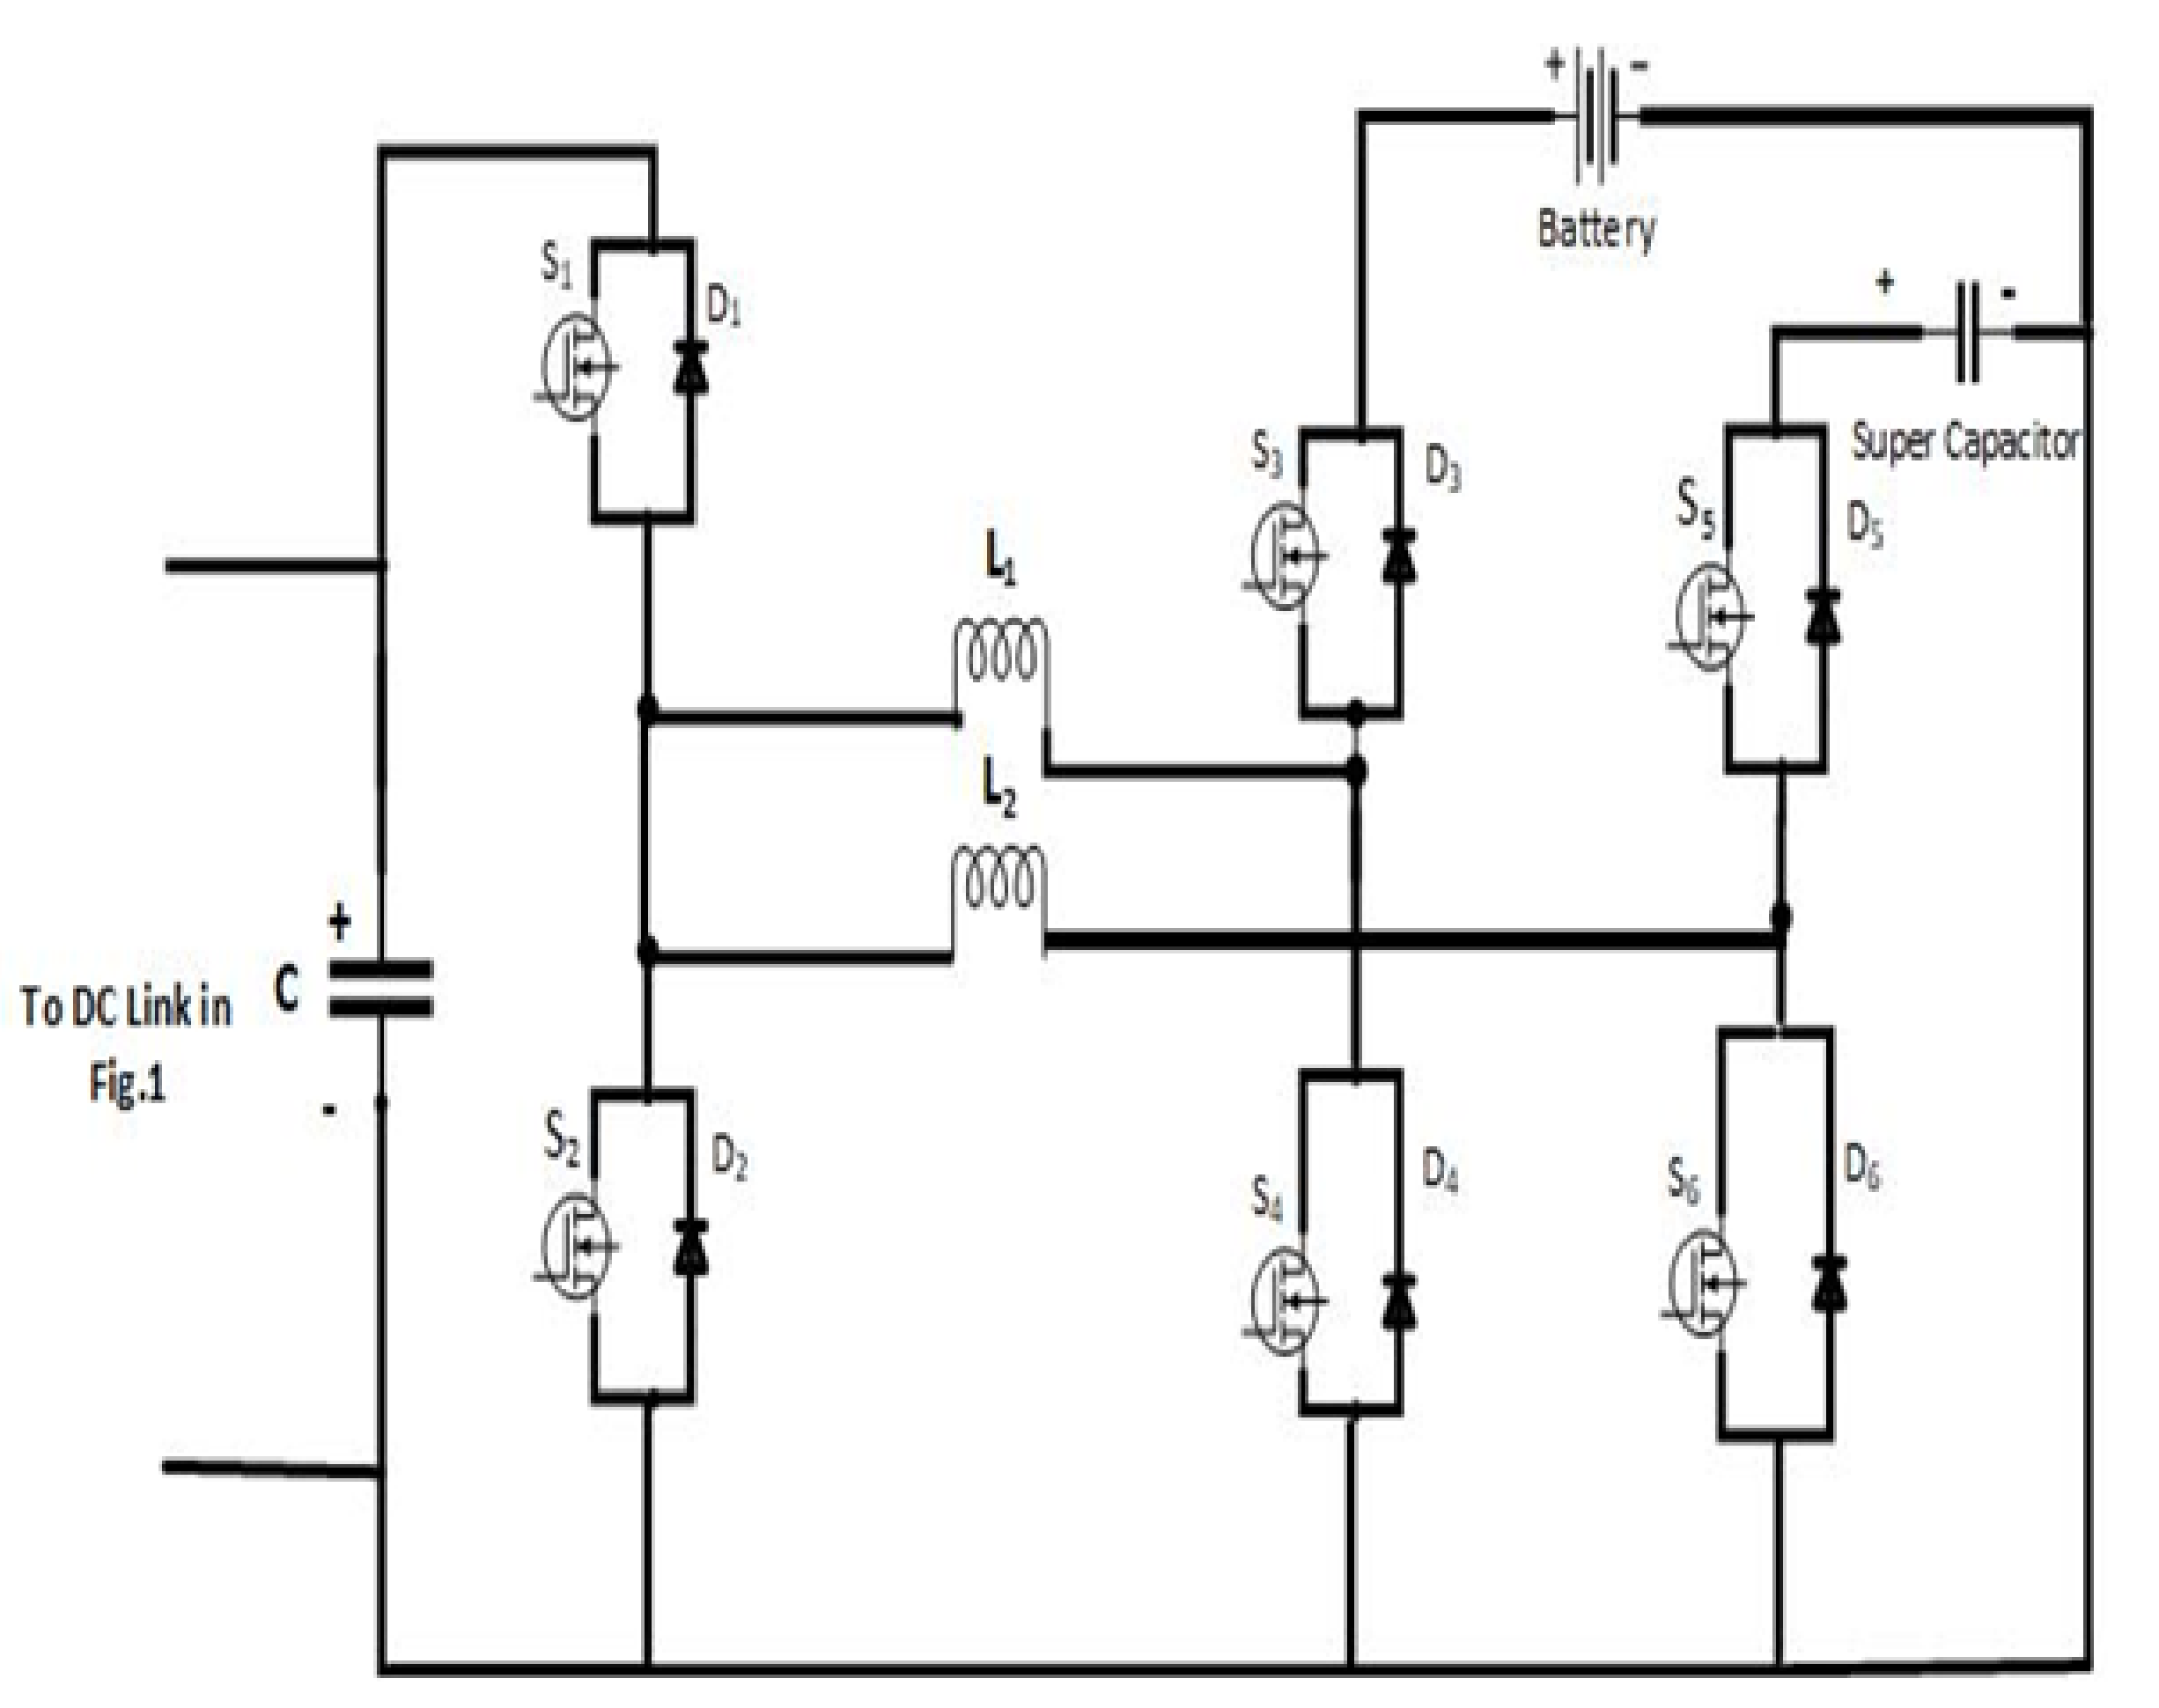
2.3. Multi Input Bidirectional DC/DC Converter

A modular non-isolated bidirectional DC-DC converter is designed so that the energy storage devices can be charged and discharged independently and simultaneously besides the power can be transferred between them using minimum power switches, so the energy sources and DC link can exchange the power bidirectional with more reliability and flexibility. The converter also has the advantage of modular design, so additional power sources can be commissioned by adding a pair of power switches with an inductor. In addition, the output voltage is not limited by the sum of the input source voltage. Matlab/Simulink is used to simulate the different operating scenarios of the converter. The proposed converter consists of six power switching MOSFETs, two inductors, and one capacitor. The schematic of the converter is shown in Figure 4.
Table 3 shows that the equations used to calculate the minimum values of inductors L 1 and L 2 in different operation modes of the converter and Table 4 shows the design specifications of the proposed converter.

3. Control Strategy for Energy Management System
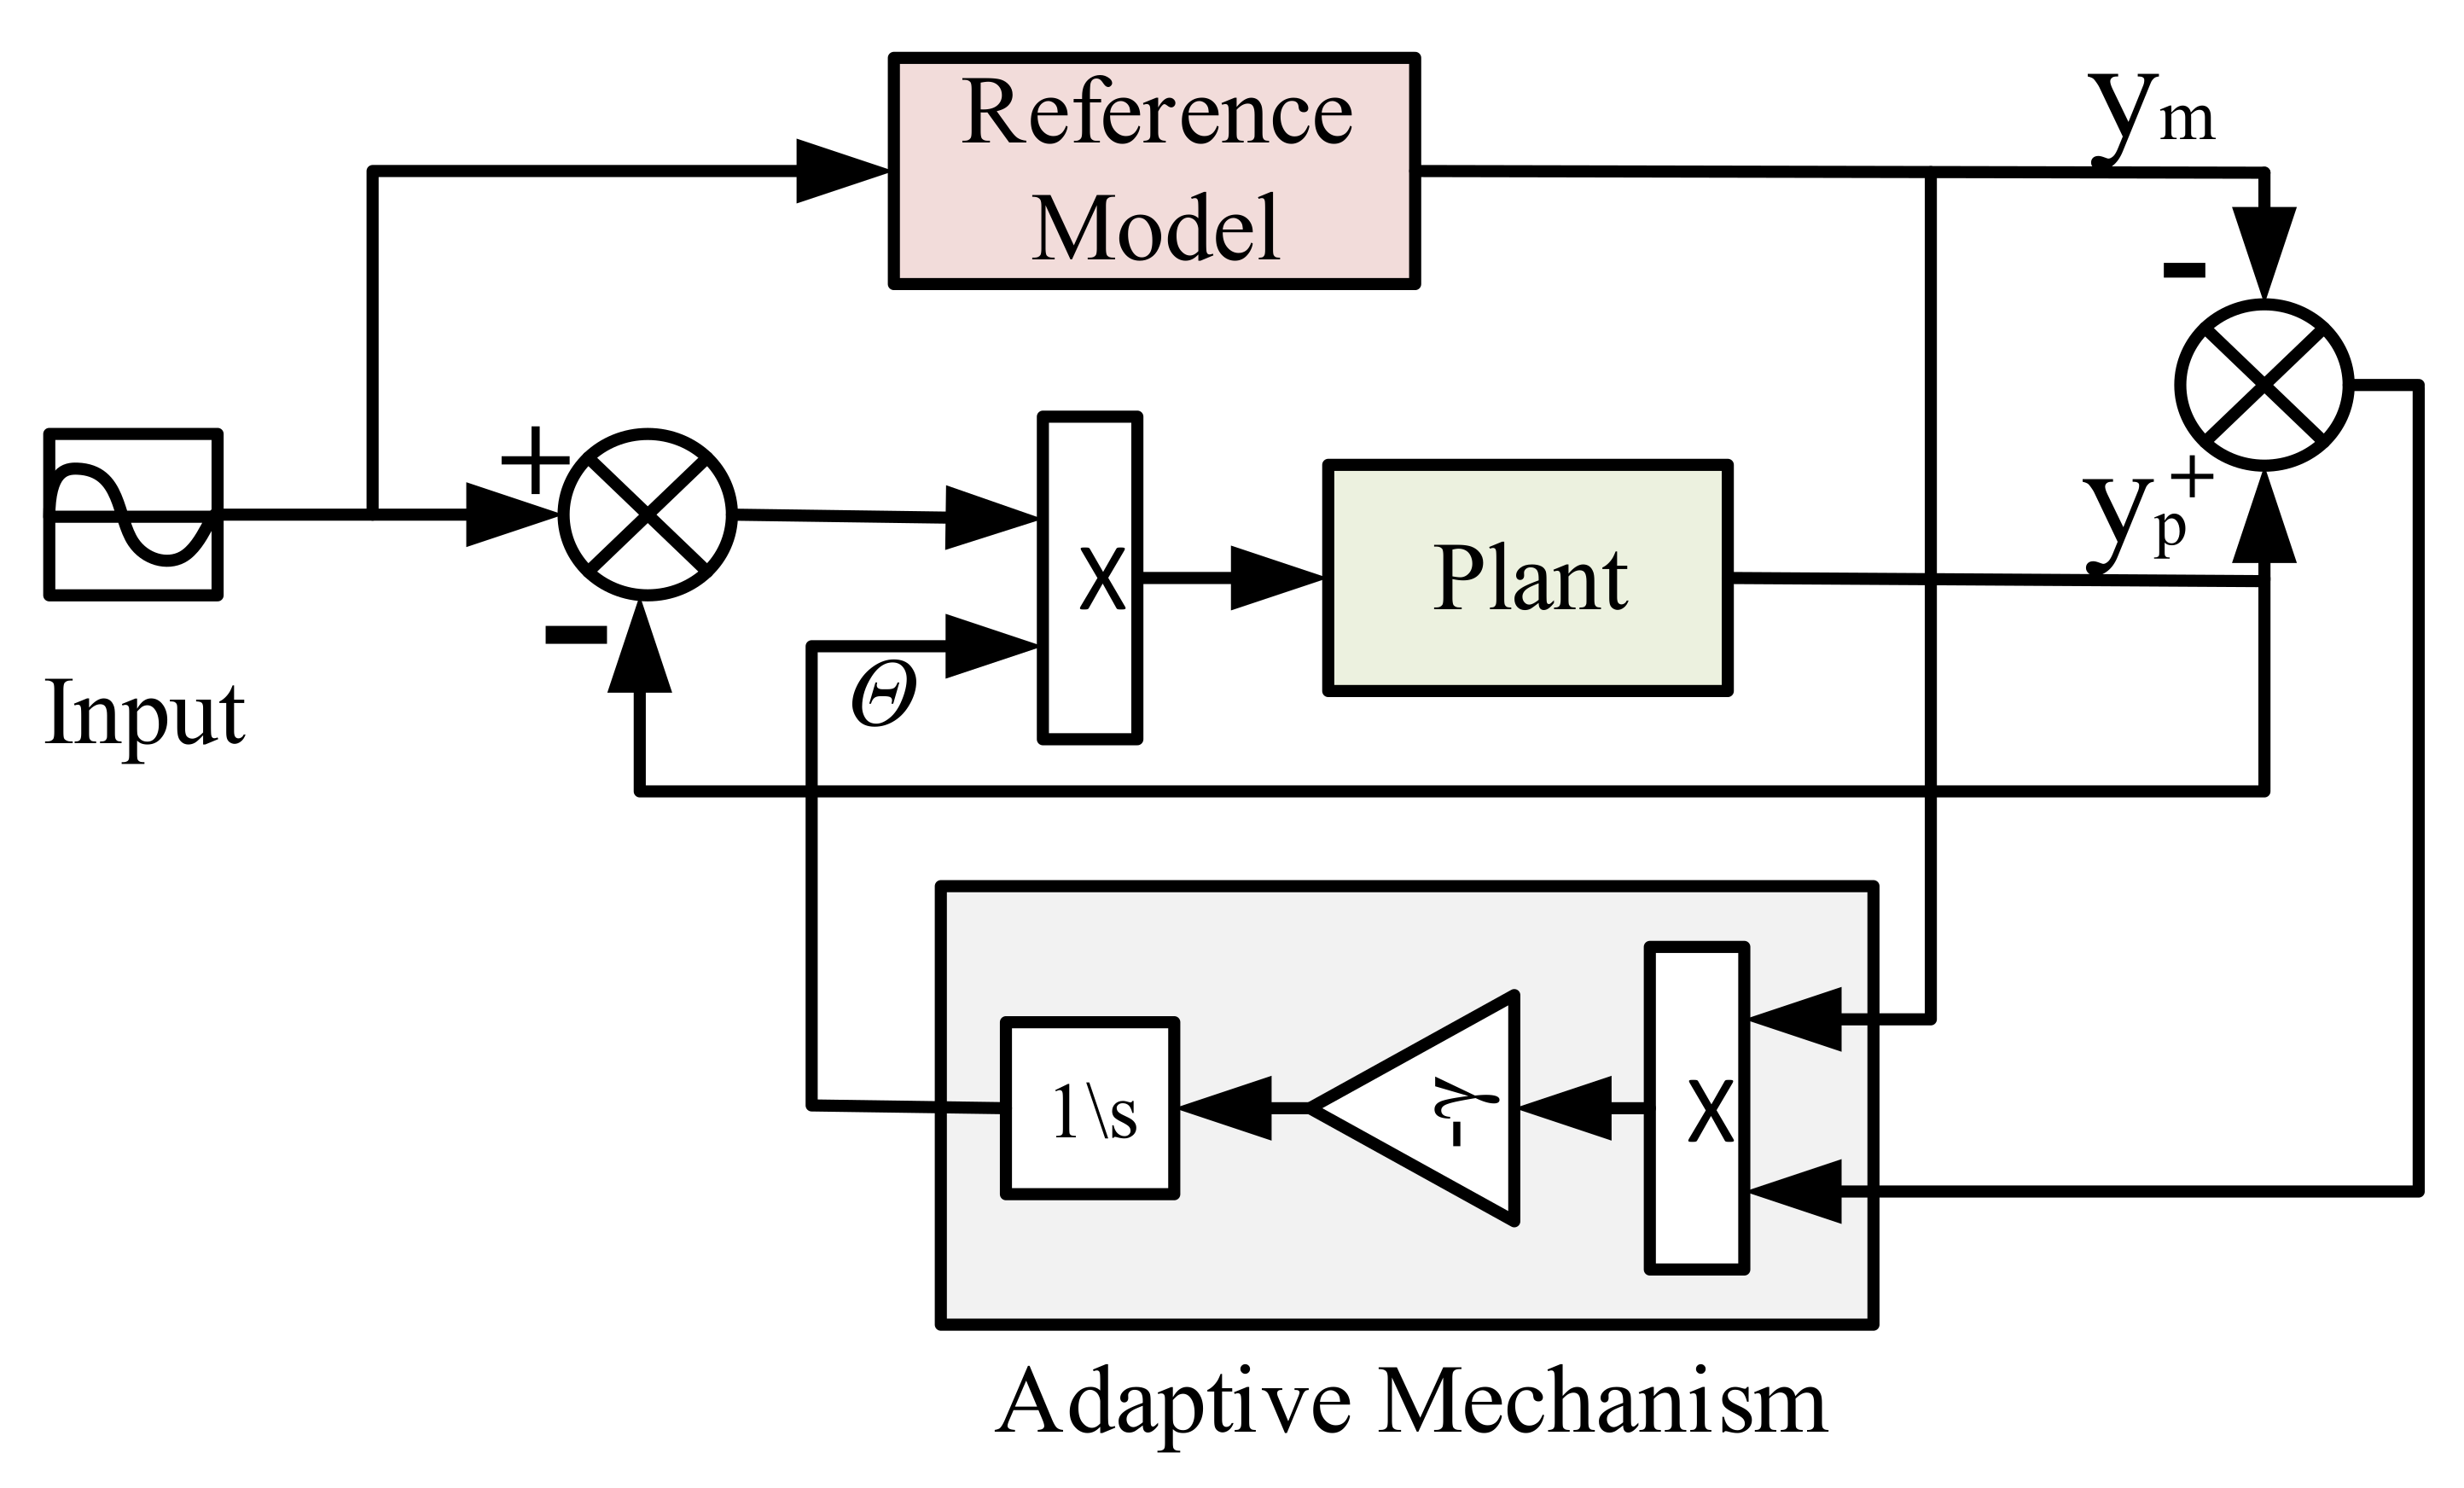
This section describes the design of the MRAC controller and DC/DC converter as part of the EMS system for a fast-charging station to achieve the controlled voltage, current, and speed from the flywheel as well as from the battery.

3.1. Design of MRAC

The diagram of the proposed controller is presented in Figure 5. The control strategy consists of four basic building blocks and they are the reference model, plant model, adaptive mechanism, and the control unit. The reference model is needed to determine the response that we desire whereas the controller, which is a collection of tuning parameters, provides the necessary signal to achieve the desired response from the plant. The adaptive mechanism provides the adaptable parameter Θ to the control unit for high tracking performance. MIT law is used in this paper to generate this adjustment mechanism. The equations associated with this design are from [25] as a reference.
By taking the difference of plant model ( y p ) and reference model ( y m ), the tracking error ( e ¯ ) can be obtained as follows:
e ¯ = y p y m .
An error cost function ( J ( Θ ) ) is formed by using (9) and the formula is given below:
J ( Θ ) = 1 2 e ¯ 2 ( Θ ) .
The adaptable parameter Θ is taken as proportional to the negative gradient of J, such that the cost function becomes zero.
d Θ d t = γ δ J δ Θ = γ e ¯ δ e ¯ δ Θ s i g n ( e ¯ ) ,
where
s i g n ( e ¯ ) = 1 , e ¯ > 0 0 , e ¯ = 0 1 , e ¯ < 0 .
A transfer function m G ( s ) is considered here for the plant, where m is an unknown parameter and G ( s ) is a second order known transfer function. The reference model transfer function is taken as m 0 G ( s ) , where m 0 is a known parameter. From (9),
e ¯ = y p y m = m G Θ U m 0 G U .
The update rule is,
δ e ¯ δ Θ = m G U = m m 0 y m .
From (11), the updated MIT rule is given below:
d Θ d t = γ m m 0 y m e ¯ = γ y m e ¯ .
Here, γ is the adaptation gain and it is considered a small positive amount.

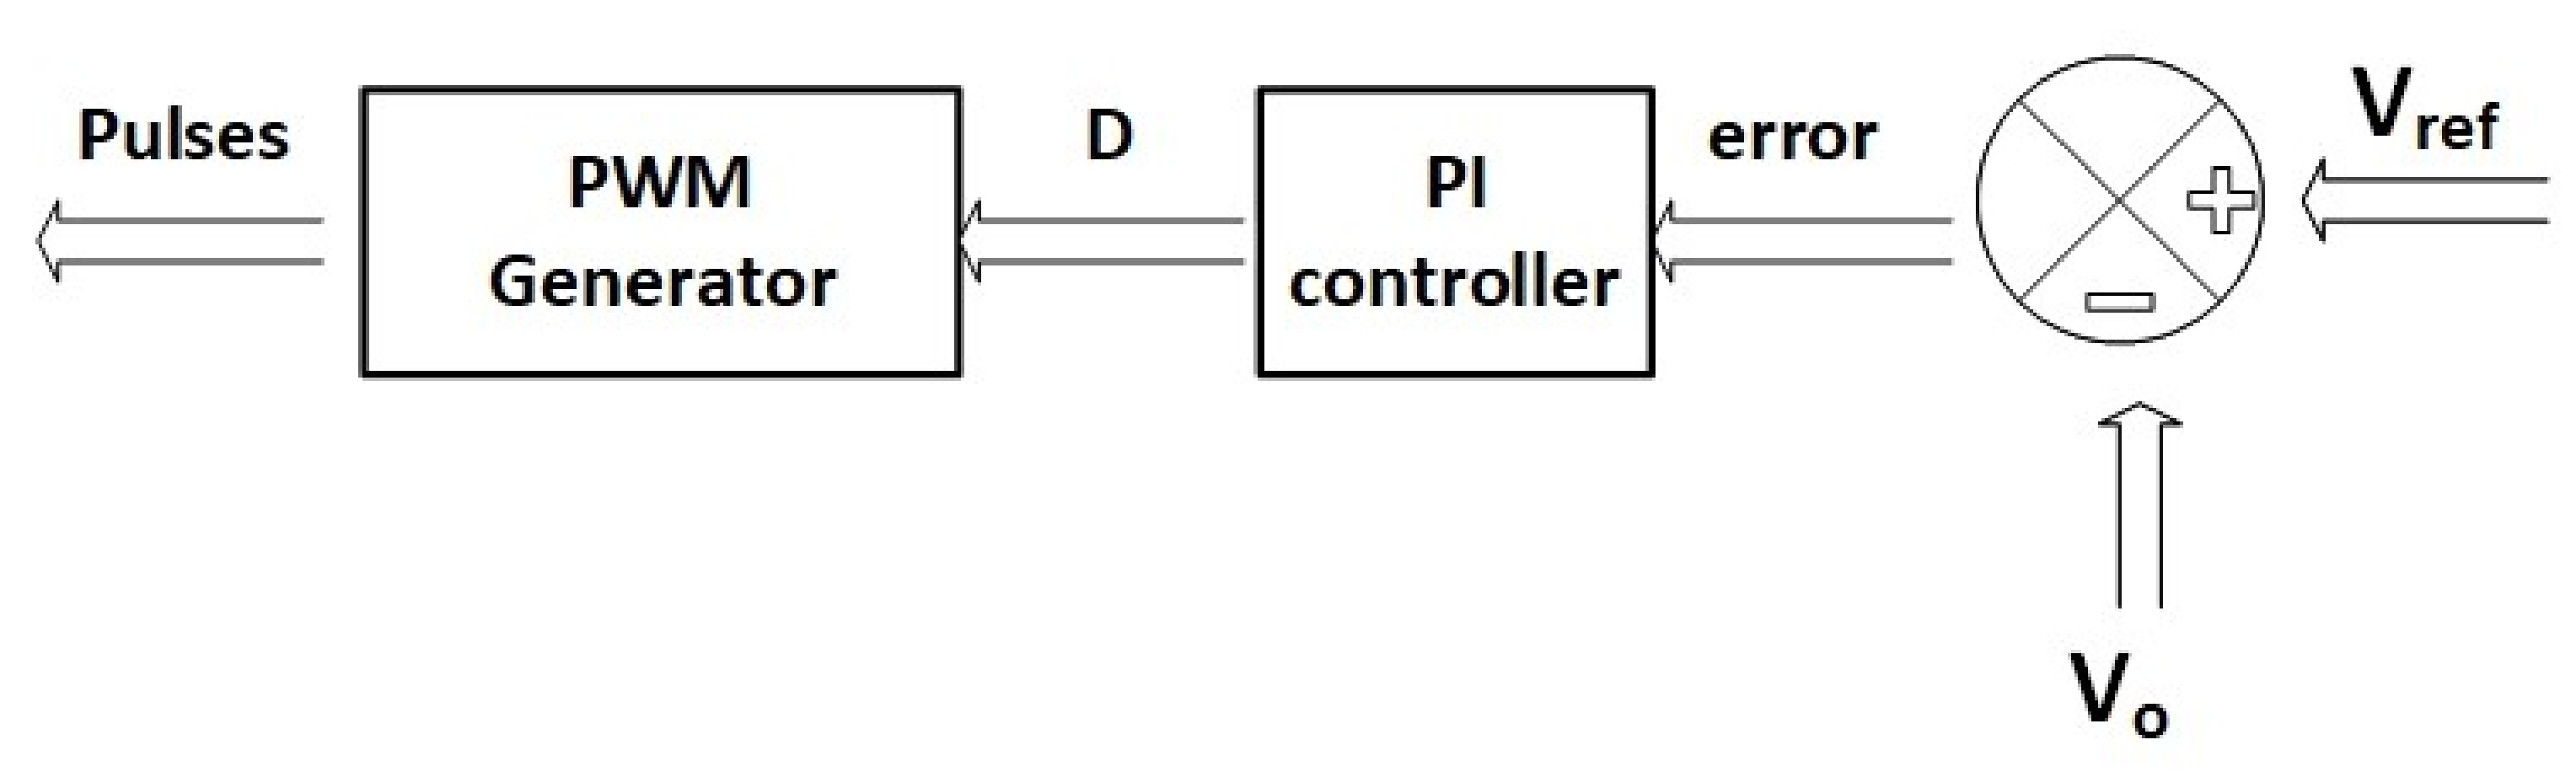
3.2. Converter Control

The proportional-integral (PI) controller was chosen to implement the control strategy of the converter as well as to control the output voltage of the DC link, which is connected to step down DC/DC converter, so by controlling the proposed converter in different operation modes by discharging from energy sources simultaneously or Individually we can control the output power of the charging electric vehicle. It is expected that the converter can charge the battery of the EV in power rate up to 15 kW. The PI controller has several advantages, such as feasibility, easy implementation, and its gains can be designed based upon the system parameters. As shown in Figure 6, the PI controller minimizes the error between the output voltage of the DC link and the reference voltage, which will be the desired DC-link voltage to determine the desired duty ratio for generating the pulses of the power switches in the different operation modes. The system is underdamped by regulating the value of the Integral coefficient K I = 0.3 and proportional coefficient K P = 0.001 to minimize the overshoot and the steady-state error.

4. Performance Evaluation

The effectiveness of the proposed strategy has been evaluated in this section. Figure 7 shows the step response and bode plot of the controller to determine its performance and stability. Figure 7a shows that the controller has a rise time of 0.048 s, settling time of 0.296 s, and an overshoot of 4.67%, which confirms the controller performance within the acceptable ranges. Figure 7b shows the bode plot of the system from where it can be seen that the closed-loop system is stable with a phase margin of 159 ( d e g ) . This control strategy has been implemented with the flywheel storage system to achieve an optimized performance of the hybrid system.

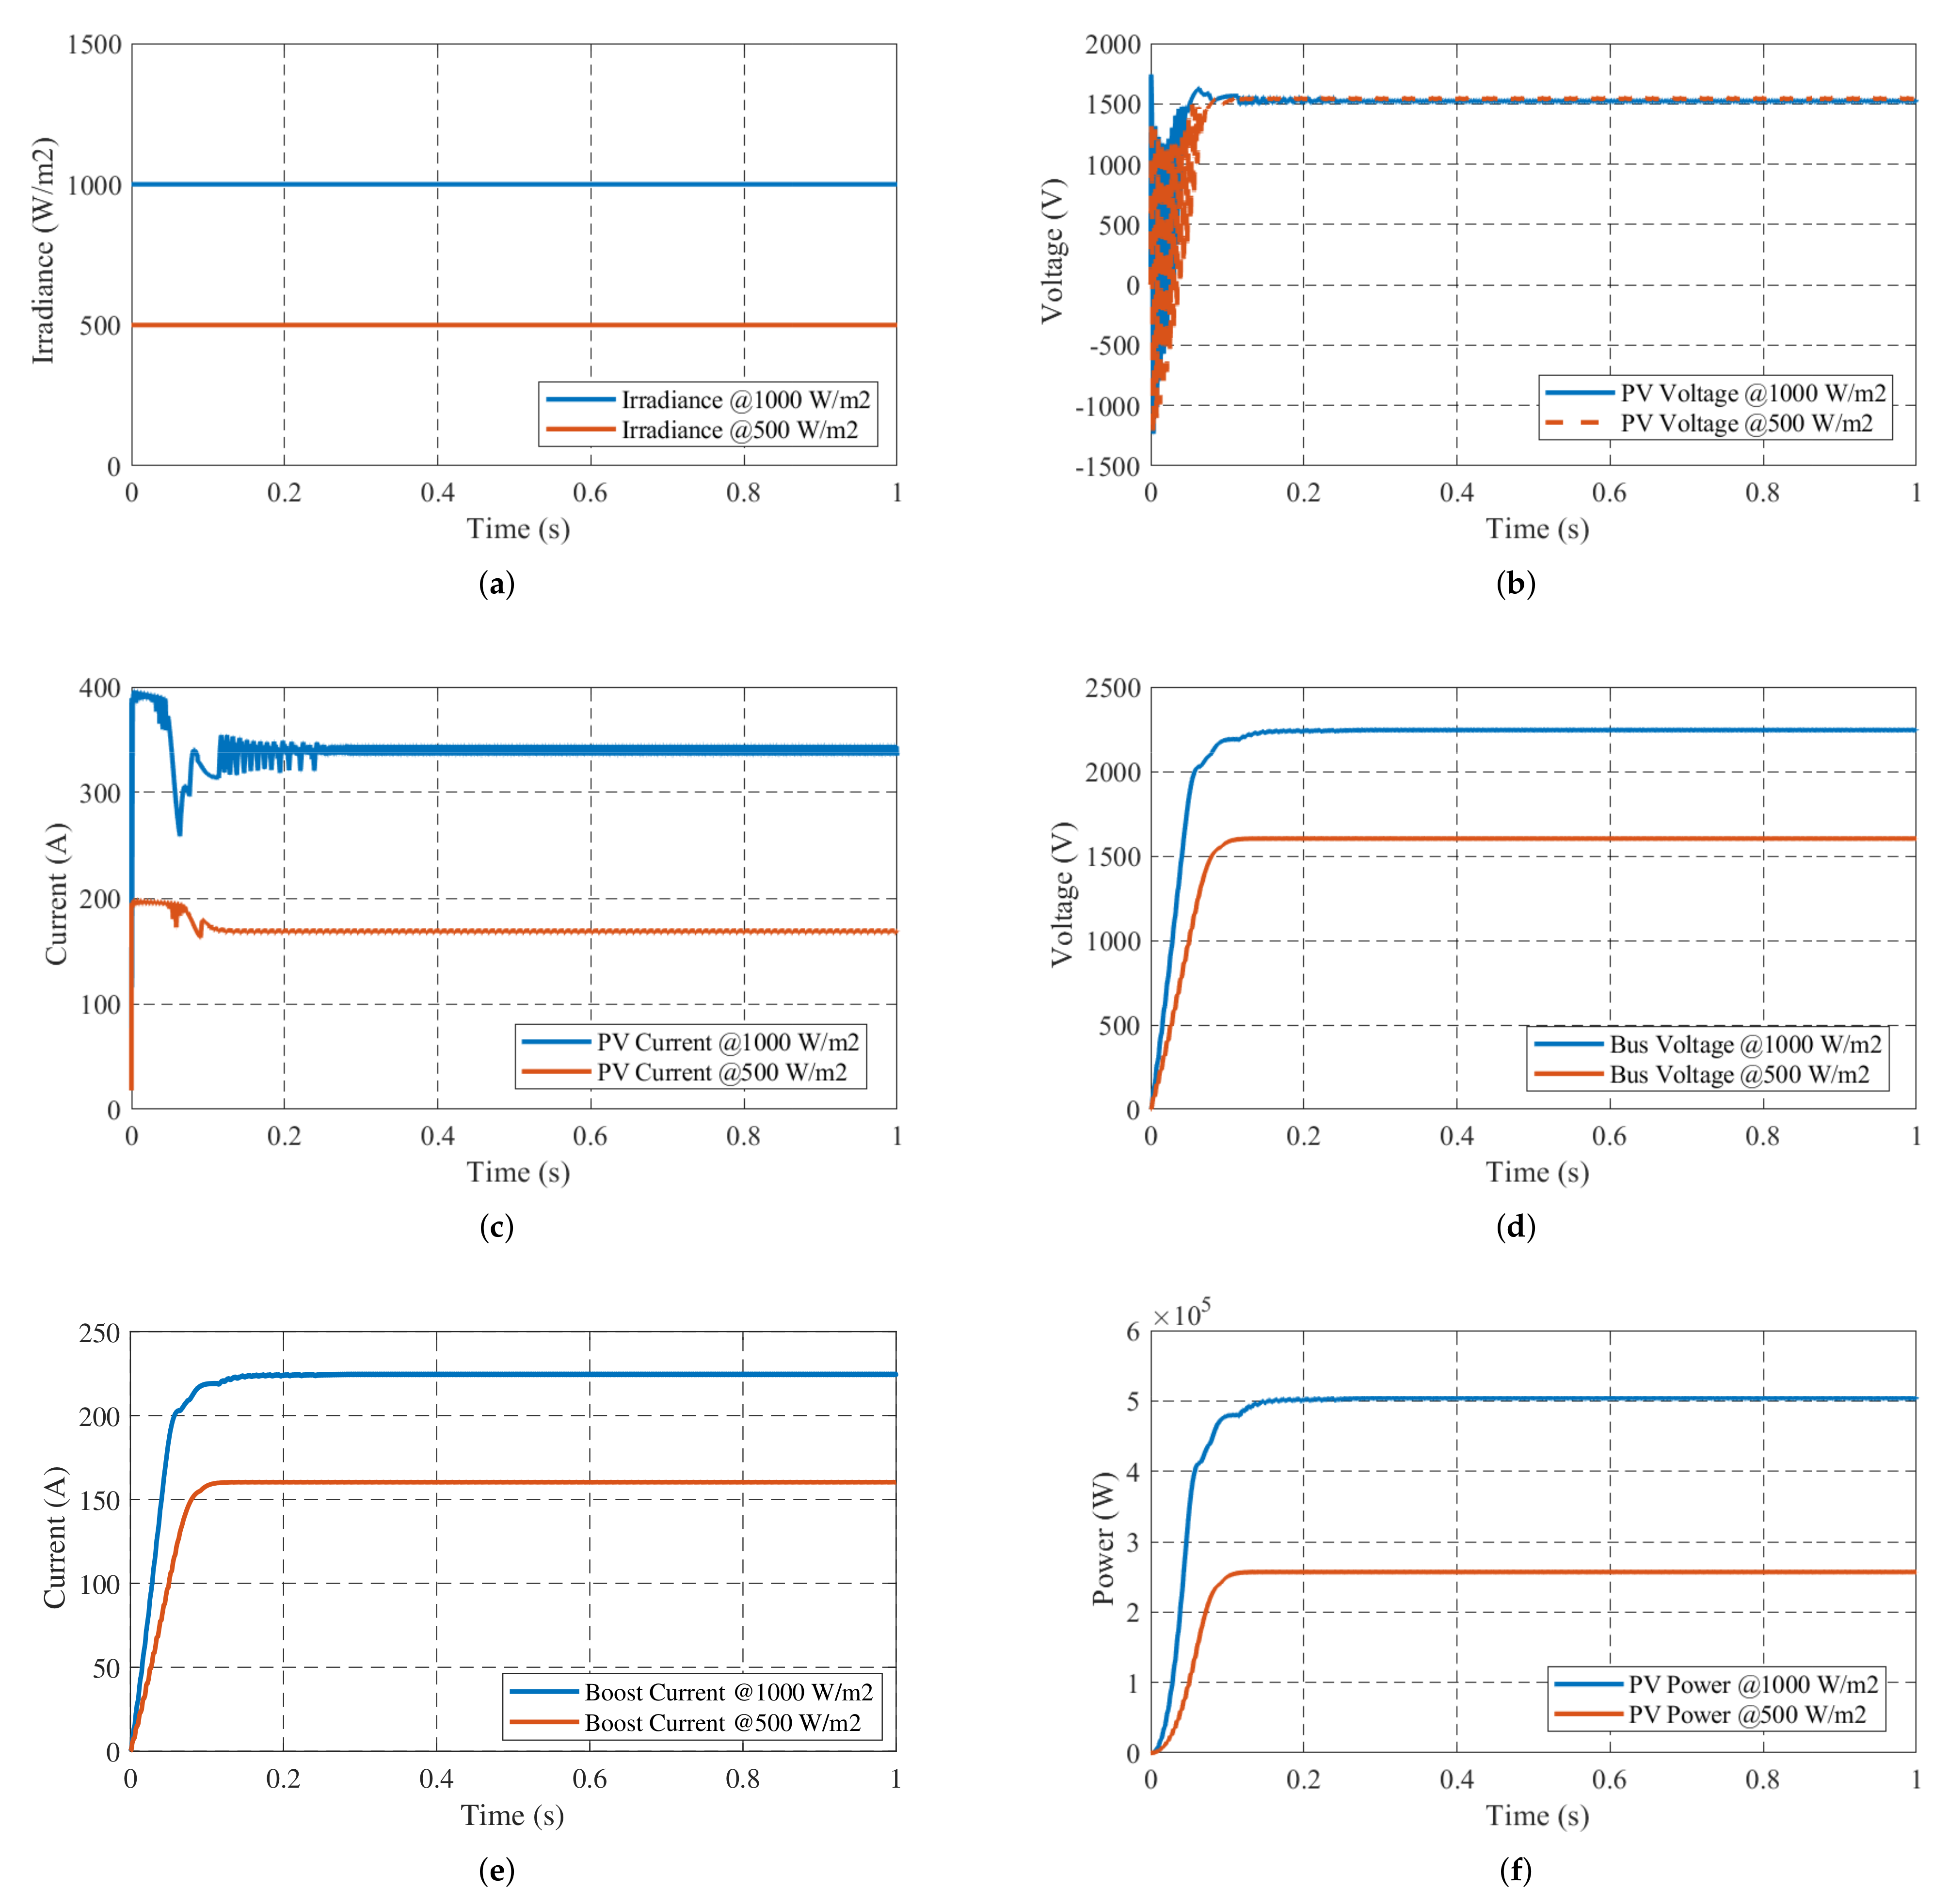
4.1. Solar Power Output

The solar system has been adopted as a renewable energy source in this study. The voltage, current, and power extracted from the PV system are presented in Figure 8. Maximum Power Point Tracking (MPPT) is used here to maximize the power extraction from the system. The amount of energy produced by the solar system depends on solar irradiance. In this study, different solar irradiance value has been considered to observe the partial shadow effect. Perturb and observation method is used to adjust the voltage and power extracted from the system. Figure 8a shows the two different irradiance values. Figure 8b shows the voltage output of the PV panel where it can be seen that the output voltage is almost identical for different panels, which ensures the effective operation of the MPPT control, while Figure 8c interprets the corresponding current from the PV. A boost converter is then used to increase the voltage output of the panel to charge the battery of the Volvo BZL eBus. A maximum charging power of 300 kW is needed to charge this bus within 15 min. Figure 8d demonstrates the bus voltage after boosting the PV output voltage at two different irradiance values while Figure 8e represents the current flowing through the boost converter. Figure 8f shows the output power extracted from the solar panel. From this figure, we can see that, when the irradiance value is 1000 W/m 2 , the energy source supplies around 500 kW of power, which is enough to charge an eBus in the fast charging facilities. However, when the irradiance value drops to 500 W/m 2 , the output power is around 250 kW, which is not enough for the fast charging of the eBus. The remaining power is then supplied from the flywheel storage system.

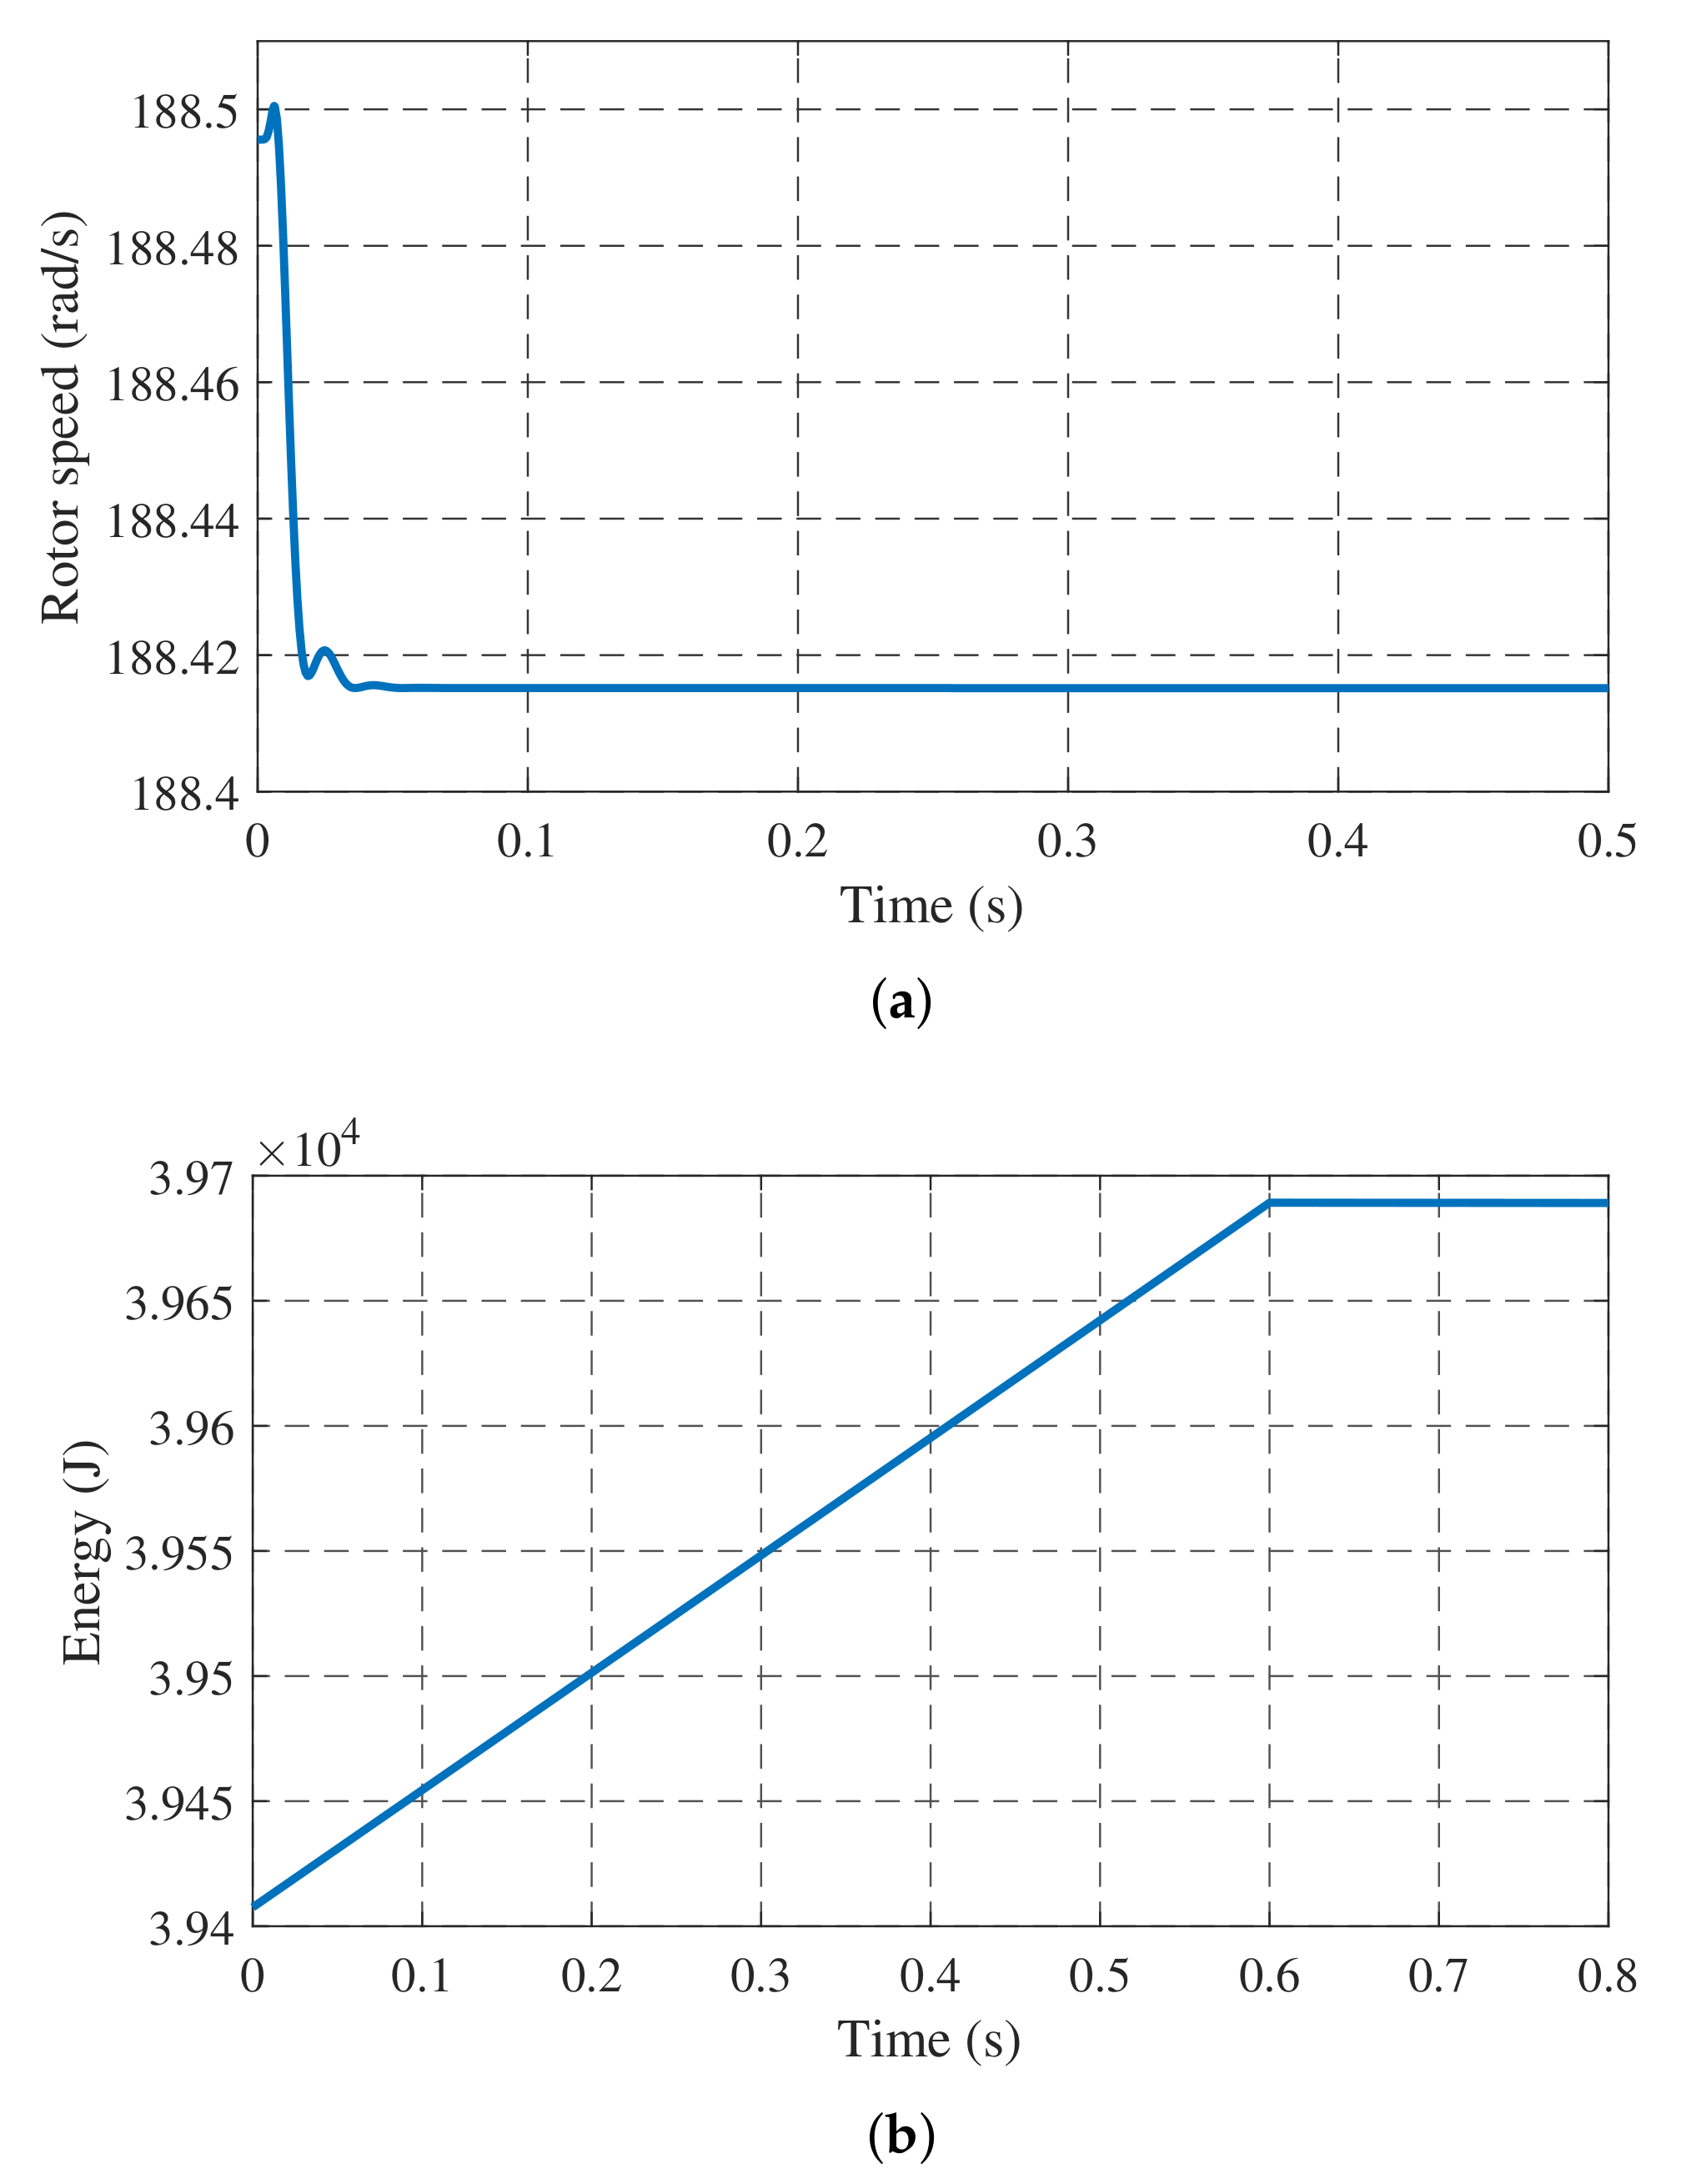
4.2. Flywheel Performance

A flywheel is used in this study as an energy storage system. When a load is applied across the flywheel, the rotor speed decreases, which results in poor performance during the discharge period. To overcome this problem, the proposed MRAC controller is used in the flywheel system to maintain a constant rotor speed of the flywheel. Figure 9a shows that the proposed control scheme enables the system to maintain a constant rotor speed of the flywheel, while Figure 9b presents the energy stored in the flywheel system during the charging mode. From Figure 9b, we can see that the flywheel can store 50 kW power during its charging period and this power can be discharged to the charging of eBus when the solar power cannot meet the power demand alone. This confirms the effectiveness of the energy management of the proposed system.

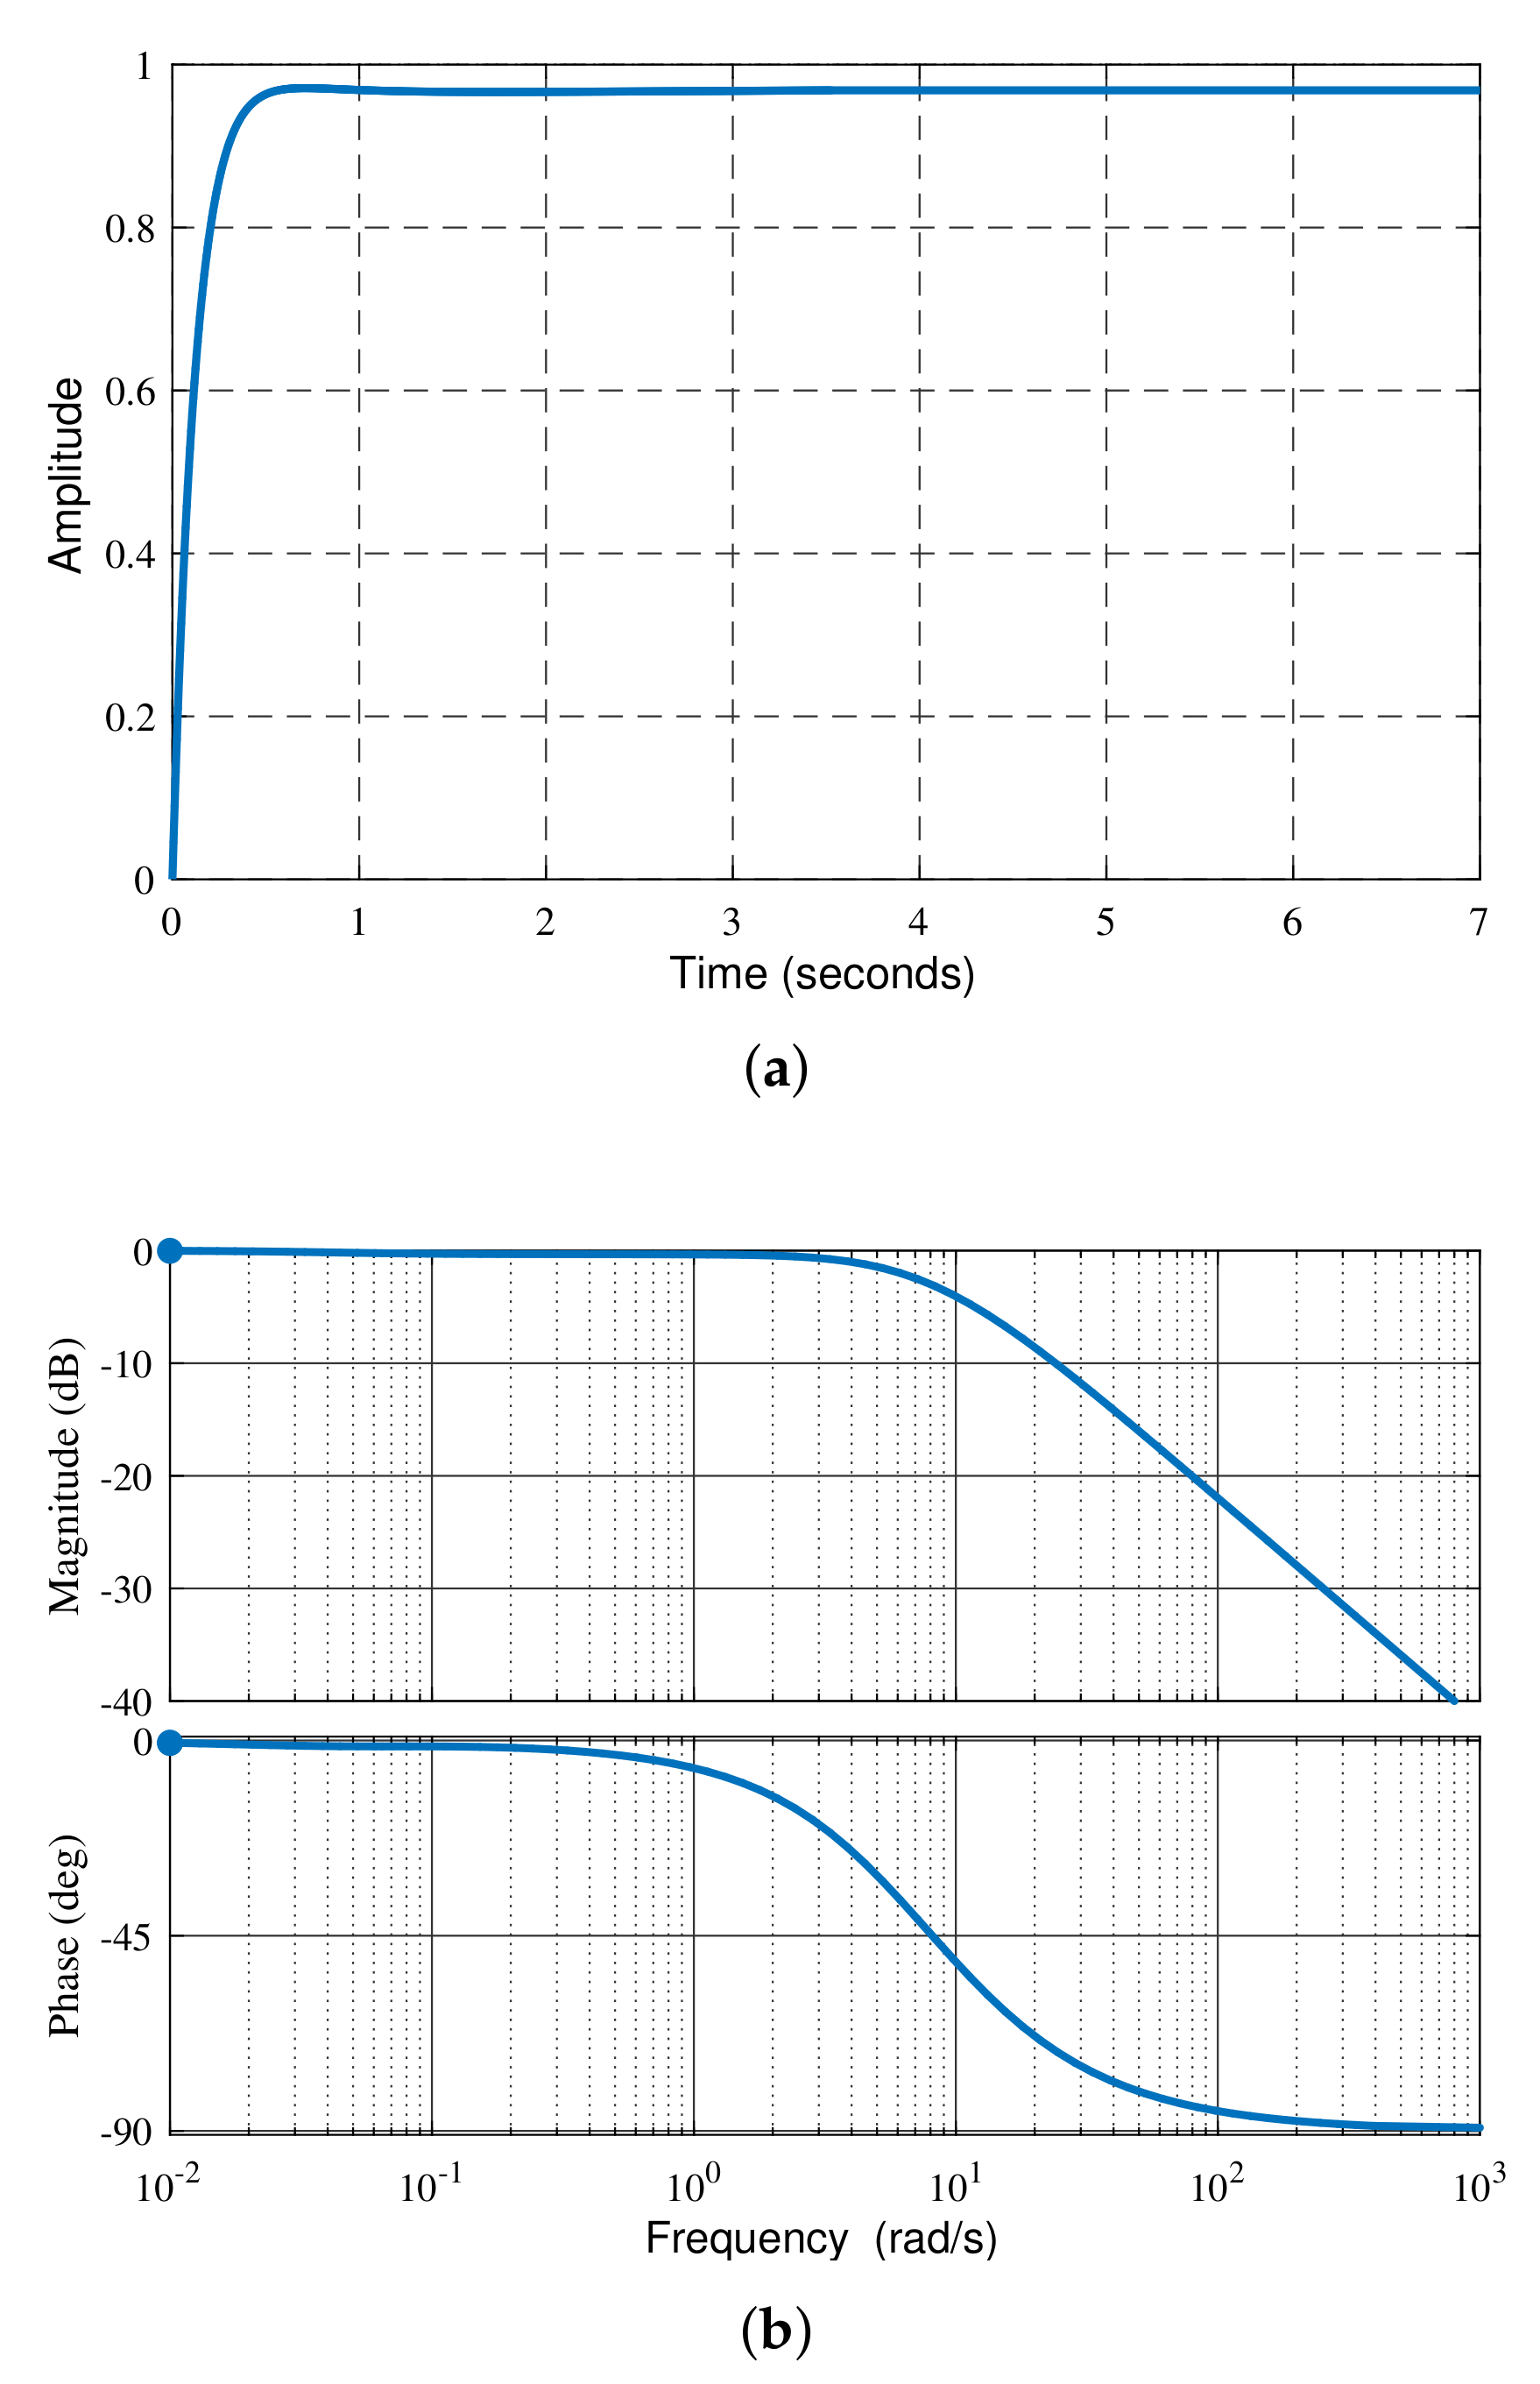
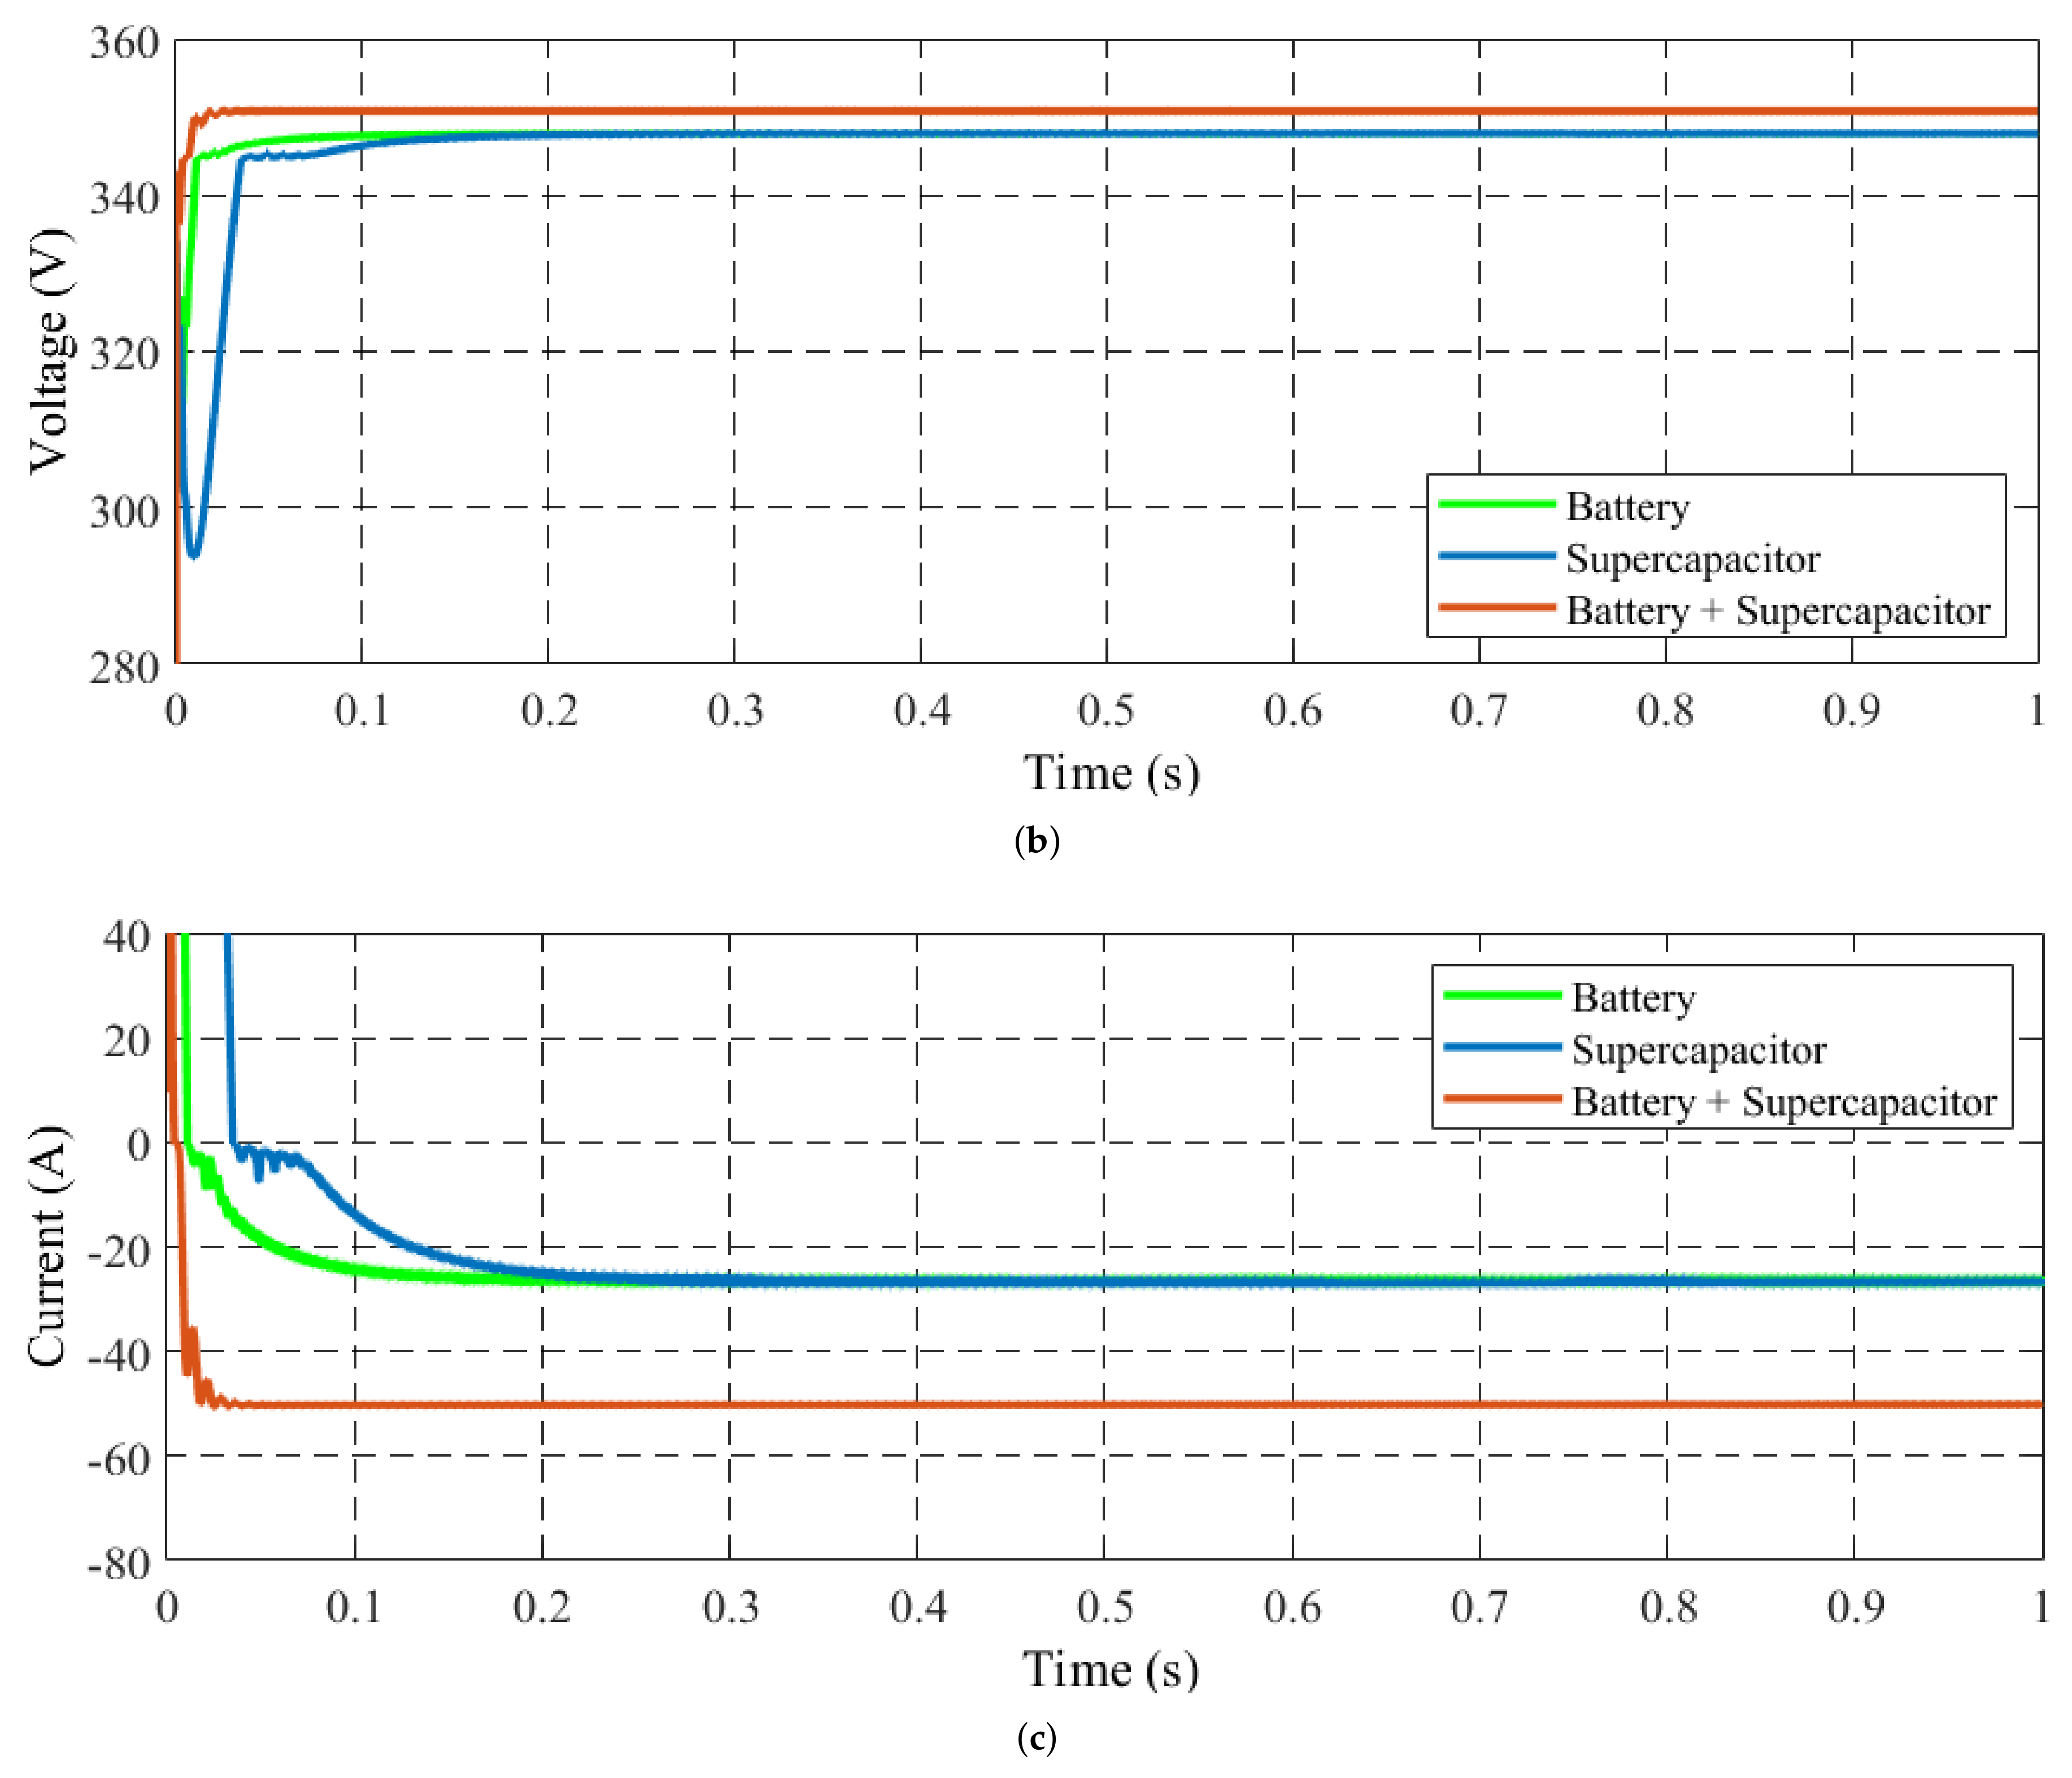
4.3. Proposed DC/DC Converter Performance

The proposed converter has been tested to charge a Nissan leaf battery (350 V, 60 Ah) individually and simultaneously from the energy sources. Figure 10 shows the battery successfully charge the Nissan leaf battery as shown in Figure the SOC of the battery increased. Similarly, the EV’s battery is charged from the supercapacitor with a current rate of more than 25 A as shown in the figure. To increase the charging rate, the EV’s battery is charged from both energy storage devices simultaneously, with a charging current of more than 15 A from each source.

5. Conclusions

This paper presents the design and simulation of a developed FCS for eBus. The proposed system integrates a hybrid energy storage system composed of a battery and a flywheel with MEG including a renewable energy system. The performance of the system has been evaluated based on different test case scenarios. A PV system has been designed as a renewable energy source to reduce the dependency of the fast-charging station on the main power grid. The MPPT control algorithm is used to extract the maximum power from the solar system while considering the partial effect. Then an induction motor-based flywheel has been designed to store the energy for the fast charging station. A control strategy has been developed later on to maintain a constant rotor speed of the flywheel to achieve an extensive performance of the energy management system. The analytical performance of the proposed system has been examined, which ensures the improved performance of the fast-charging station for eBuses. in addition, multiple sources and a bidirectional DC-DC converter have been designed and tested with different scenarios to validate the capabilities of managing multiple input sources like a flywheel, a battery, and a supercapacitor. The limitation of this study has been included—that we considered PV as the main power source to mitigate the power demand of a fast-charging station. The solar power generation varies with the solar irradiation and, if there is not enough irradiation, the system will not generate enough power. This problem can be overcome by using more power sources but this will make the energy management system more complex to design. The future scope of this study can be extended to integrate nuclear energy with the hybrid energy system to mitigate the intermittent problem of renewable energy sources and improved energy management systems.

Author Contributions

Conceptualization, H.A.G., Y.E., A.B.S., A.E. and A.A.; methodology, A.B.S., Y.E. and H.A.G.; software, A.B.S., A.E.; validation, H.A.G., A.B.S. and Y.E.; formal analysis, A.B.S., A.E. and Y.E.; investigation, A.B.S.; resources, A.B.S.; data curation, A.B.S.; writing—original draft preparation A.B.S.; writing—review and editing, A.B.S. and Y.E.; visualization, A.B.S.; supervision, H.A.G.; project administration, H.A.G.; funding acquisition, H.A.G. All authors have read and agreed to the published version of the manuscript.

Funding

This research is funded by Canadian Urban Transit Research Innovation Consortium (CUTRIC 215433).

Institutional Review Board Statement

Not applicable.

Informed Consent Statement

Not applicable.

Data Availability Statement

Not applicable.

Acknowledgments

This research is sponsored by Canadian Urban Transit Research Innovation Consortium (CUTRIC), MITACS, and The Natural Sciences and Engineering Research Council of Canada (NSERC).

Conflicts of Interest

The authors declare no conflict of interest.

References

  1. Tie, S.F.; Tan, C.W. A review of energy sources and energy management system in electric vehicles. Renew. Sustain. Energy Rev. 2013, 20, 82–102. [Google Scholar] [CrossRef]
  2. Clarke, A.D.; Makram, E.B. An Innovative Approach in Balancing Real Power Using Plug in Hybrid Electric Vehicles. J. Power Energy Eng. 2014, 2, 1. [Google Scholar] [CrossRef] [Green Version]
  3. Clement-Nyns, K.; Haesen, E.; Driesen, J. The impact of charging plug-in hybrid electric vehicles on a residential distribution grid. IEEE Trans. Power Syst. 2009, 25, 371–380. [Google Scholar] [CrossRef] [Green Version]
  4. Yilmaz, M.; Krein, P.T. Review of battery charger topologies, charging power levels, and infrastructure for plug-in electric and hybrid vehicles. IEEE Trans. Power Electron. 2012, 28, 2151–2169. [Google Scholar] [CrossRef]
  5. Abdussami, M.R.; Gabbar, H.A. Nuclear-Powered Hybrid Energy Storage-Based Fast Charging Station for Electrification Transportation. In Proceedings of the 2019 IEEE 7th International Conference on Smart Energy Grid Engineering (SEGE), Oshawa, ON, Canada, 12–14 August 2019; pp. 304–308. [Google Scholar]
  6. Xu, Z.; Hu, Z.; Song, Y.; Luo, Z.; Zhan, K.; Wu, J. Coordinated charging strategy for PEVs charging stations. In Proceedings of the 2012 IEEE Power and Energy Society General Meeting, San Diego, CA, USA, 22–26 July 2012; pp. 1–8. [Google Scholar]
  7. Cao, Y.; Tang, S.; Li, C.; Zhang, P.; Tan, Y.; Zhang, Z.; Li, J. An optimized EV charging model considering TOU price and SOC curve. IEEE Trans. Smart Grid 2011, 3, 388–393. [Google Scholar] [CrossRef]
  8. Fazelpour, F.; Vafaeipour, M.; Rahbari, O.; Rosen, M.A. Intelligent optimization to integrate a plug-in hybrid electric vehicle smart parking lot with renewable energy resources and enhance grid characteristics. Energy Convers. Manag. 2014, 77, 250–261. [Google Scholar] [CrossRef]
  9. Zhang, P.; Qian, K.; Zhou, C.; Stewart, B.G.; Hepburn, D.M. A methodology for optimization of power systems demand due to electric vehicle charging load. IEEE Trans. Power Syst. 2012, 27, 1628–1636. [Google Scholar] [CrossRef]
  10. Vermaak, H.J.; Kusakana, K. Design of a photovoltaic–wind charging station for small electric Tuk–tuk in DR Congo. Renew. Energy 2014, 67, 40–45. [Google Scholar] [CrossRef]
  11. Fathabadi, H. Novel wind powered electric vehicle charging station with vehicle-to-grid (V2G) connection capability. Energy Convers. Manag. 2017, 136, 229–239. [Google Scholar] [CrossRef]
  12. Hutson, C.; Venayagamoorthy, G.K.; Corzine, K.A. Intelligent scheduling of hybrid and electric vehicle storage capacity in a parking lot for profit maximization in grid power transactions. In Proceedings of the 2008 IEEE Energy 2030 Conference, Atlanta, GA, USA, 17–18 November 2008; pp. 1–8. [Google Scholar]
  13. Sortomme, E.; El-Sharkawi, M.A. Optimal charging strategies for unidirectional vehicle-to-grid. IEEE Trans. Smart Grid 2010, 2, 131–138. [Google Scholar] [CrossRef]
  14. Aswantara, I.K.A.; Ko, K.S.; Sung, D.K. A centralized EV charging scheme based on user satisfaction fairness and cost. In Proceedings of the 2013 IEEE Innovative Smart Grid Technologies-Asia (ISGT Asia), Bangalore, India, 10–13 November 2013; pp. 1–4. [Google Scholar]
  15. Acha, S.; Green, T.C.; Shah, N. Effects of optimised plug-in hybrid vehicle charging strategies on electric distribution network losses. In Proceedings of the IEEE PES T&D 2010, New Orleans, LA, USA, 19–22 April 2010; pp. 1–6. [Google Scholar]
  16. Huang, J.; Gupta, V.; Huang, Y.F. Scheduling algorithms for PHEV charging in shared parking lots. In Proceedings of the 2012 American Control Conference (ACC), Montreal, QC, Canada, 27–29 June 2012; pp. 276–281. [Google Scholar]
  17. Vaya, M.G.; Andersson, G. Centralized and decentralized approaches to smart charging of plug-in vehicles. In Proceedings of the 2012 IEEE Power and Energy Society General Meeting, San Diego, CA, USA, 22–26 July 2012; pp. 1–8. [Google Scholar]
  18. Torreglosa, J.P.; García-Triviño, P.; Fernández-Ramirez, L.M.; Jurado, F. Decentralized energy management strategy based on predictive controllers for a medium voltage direct current photovoltaic electric vehicle charging station. Energy Convers. Manag. 2016, 108, 1–13. [Google Scholar] [CrossRef]
  19. García-Triviño, P.; Torreglosa, J.P.; Fernández-Ramírez, L.M.; Jurado, F. Control and operation of power sources in a medium-voltage direct-current microgrid for an electric vehicle fast charging station with a photovoltaic and a battery energy storage system. Energy 2016, 115, 38–48. [Google Scholar] [CrossRef]
  20. González-Rivera, E.; Sarrias-Mena, R.; García-Triviño, P.; Fernández-Ramírez, L.M. Predictive energy management for a wind turbine with hybrid energy storage system. Int. J. Energy Res. 2020, 44, 2316–2331. [Google Scholar] [CrossRef]
  21. Zheng, Y.; Song, Y.; Hill, D.J.; Meng, K. Online distributed MPC-based optimal scheduling for EV charging stations in distribution systems. IEEE Trans. Ind. Inform. 2018, 15, 638–649. [Google Scholar] [CrossRef]
  22. Zheng, H.; Wu, J.; Wu, W.; Wang, Y. Integrated motion and powertrain predictive control of intelligent fuel cell/battery hybrid vehicles. IEEE Trans. Ind. Inform. 2019, 16, 3397–3406. [Google Scholar] [CrossRef]
  23. Gabbar, H.A.; Adham, M.I.; Abdussami, M.R. Analysis of nuclear-renewable hybrid energy system for marine ships. Energy Rep. 2021, 7, 2398–2417. [Google Scholar] [CrossRef]
  24. Dragičević, T.; Sučić, S.; Vasquez, J.C.; Guerrero, J.M. Flywheel-based distributed bus signalling strategy for the public fast charging station. IEEE Trans. Smart Grid 2014, 5, 2825–2835. [Google Scholar] [CrossRef] [Green Version]
  25. Jain, P.; Nigam, M. Design of a model reference adaptive controller using modified MIT rule for a second order system. Adv. Electron. Electr. Eng. 2013, 3, 477–484. [Google Scholar]
Figure 1. Proposed MEG based fast charging station with EMS for eBuses.
Vehicles 03 00048 g001
Figure 2. Clearness index and daily radiation of solar power.
Vehicles 03 00048 g002
Figure 3. Flywheel storage system for fast charging station.
Vehicles 03 00048 g003
Figure 4. Schematic of the proposed converter.
Vehicles 03 00048 g004
Figure 5. Schematic of the MRAC control strategy.
Vehicles 03 00048 g005
Figure 6. Schematic of the converter control.
Vehicles 03 00048 g006
Figure 7. (a) Step response and (b) bode plot of the proposed control strategy.
Vehicles 03 00048 g007
Figure 8. (a) Irradiance value, (b) PV voltage, (c) PV current, (d) bus voltage, (e) boost current, and (f) power extracted from the PV panel.
Vehicles 03 00048 g008
Figure 9. (a) Rotor speed and (b) energy stored by the flywheel system.
Vehicles 03 00048 g009
Figure 10. (a) State of Charge, (b) voltage, and (c) current profile of EV’s battery charging using battery, supercapacitor and battery + supercapacitor.
Vehicles 03 00048 g010aVehicles 03 00048 g010b
Table 1. PV model design specifications.
Maximum
Power ( W )
Open Circuit
Voltage, V oc ( V )
Voltage at Maximum Power Point, V mp ( V ) Short Circuit
Current, I sc ( A )
Current at Maximum Power Point, I mp ( A ) Cells per Module
213.1536.3297.847.3560
Table 2. IM Parameter for Flywheel Simulation.
C DC L 0 L s L r R s R r σ j
2.2 mF10.46 mH10.76 mH10.76 mH0.01480.00930.05510
Table 3. Inductance equations in different operation modes.
Mode 12345
L 1 , m i n ( 1 D ) . T s Δ I L 1 V D C - D . T s 2 Δ I L V B t V D C ( 1 d 2 ) . T s Δ I L ( V D C V B t ) d 1 T s Δ I L 1
L 2 , m i n - ( 1 D ) . T s Δ I L 2 V D C D . T s 2 Δ I L V B t V D C ( 1 d 2 ) . T s Δ I L ( V D C V B t ) d 1 T s Δ I L 2
Table 4. Design specifications of the proposed converter.
SpecificationBattery
Voltage
( V Bt )
Supercapacitor
Voltage ( V SC )
DC Link
Voltage
( V DC )
Switching
Frequency
( f s )
Inductors
( L 1 and L 2 )
CapacitorPower
Values200 V160 V500 V20 kHz0.75 mH and 0.75 mH500 µ F15 kW
Publisher’s Note: MDPI stays neutral with regard to jurisdictional claims in published maps and institutional affiliations.

