Article

From Microcars to Heavy-Duty Vehicles: Vehicle Performance Comparison of Battery and Fuel Cell Electric Vehicles

Centre for Innovation, Technology and Policy Research (IN+), Associação Para o Desenvolvimento do Instituto Superior Técnico, Universidade de Lisboa, Avenida Rovisco Pais, 1049-001 Lisbon, Portugal
*
Author to whom correspondence should be addressed.
Vehicles 2021, 3(4), 691-720; https://doi.org/10.3390/vehicles3040041
Submission received: 31 August 2021 / Revised: 23 September 2021 / Accepted: 28 September 2021 / Published: 13 October 2021
(This article belongs to the Special Issue Advanced Storage Systems for Electric Vehicles)

Abstract

:
Low vehicle occupancy rates combined with record conventional vehicle sales justify the requirement to optimize vehicle type based on passengers and a powertrain with zero-emissions. This study compares the performance of different vehicle types based on the number of passengers/payloads, powertrain configuration (battery and fuel cell electric configurations), and drive cycles, to assess range and energy consumption. An adequate choice of vehicle segment according to the real passenger occupancy enables the least energy consumption. Vehicle performance in terms of range points to remarkable results for the FCEV (fuel cell electric vehicle) compared to BEV (battery electric vehicle), where the former reached an average range of 600 km or more in all different drive cycles, while the latter was only cruising nearly 350 km. Decisively, the cost analysis indicated that FCEV remains the most expensive option with base cost three-fold that of BEV. The FCEV showed notable results with an average operating cost of less than 7 cents/km, where BEV cost more than 10 €/km in addition to the base cost for light-duty vehicles. The cost analysis for a bus and semi-truck showed that with a full payload, FCPT (fuel cell powertrain) would be more economical with an average energy cost of ~1.2 €/km, while with BPT the energy cost is more than 300 €/km.

1. Introduction

Energy has always been considered the backbone of any economy around the world. Industrialization and modernization enhanced the rapid growth of the economy, along with the overuse of fossil energy resources, resulting in global warming, air, water, and noise pollution. The transportation sector has struggled to find alternatives that mitigate its externalities leading to an increasing number of vehicles worldwide [1,2]. This accelerated the need to revolutionize the transportation system with more efficient powertrains and energy systems. This path led to the development of emerging technologies in the transportation system, such as battery electric vehicles (BEV), plug-in hybrid electric vehicles (PHEV), and fuel cell electric vehicles (FCEV), substituting internal combustion engine vehicles (ICEV).
According to the European Environmental Agency “Trends and Projections in Europe 2020” report, the overall GHG emission trend had been reduced by 26% by 2019 (EU-28) as compared to 1990, which is below the EU’s GHG reduction target for 2020 [3]. However, 1103 Mt CO2eq of the total EU-28 emission, around 23% is generated from the road transportation [4]. With zero tailpipe emissions, offsetting the carbon footprint, and noise pollution, electrification of powertrains has emerged as a worldwide trend. Besides, the possibility of including renewable energy in transportation systems (e.g., green hydrogen, wind, and solar energy) has proved to be essential to reduce the well-to-wheel emissions associated with these alternative technologies. From 2015 to 2020, EV sales rapidly increased from 0.58 million vehicles to 3.24 million units globally, with nearly 1.4 million BEV and PHEV being registered in Europe, 137% more than in 2019 [5,6].
Furthermore, the seamless transition from conventional powered vehicles to fully electric vehicles should include not only the light-duty application but also medium and heavy-duty applications [7]. Studies have been performed formerly with different energy storage systems of EVs [8]. Using a battery as an energy storage system results in the least average energy consumption per kilometer of travel due to higher powertrain efficiency. However, the lower range and requirement of the larger battery pack is a significant disadvantage of BEV [9,10,11,12]. As for FCEV, studies have shown that with a single fueling of 5 kg of hydrogen, the vehicle can reach more than 500 km with less refueling time. By contrast, FCEV is less favorable at present [10,13,14,15,16], due to its higher average energy consumption per kilometer, fewer refueling stations, and higher capital expenses compared to BEV and ICEV. The ultracapacitor (UC) is also gaining attention as an emerging energy storage option, due to its higher power density (1000–2000 kW/kg). It consists of a fast-charging option and with a much higher capacity of performing charging and discharging cycles, making it a favorable choice in transportation options. It is ideal for applications that require higher energy and that can make frequent recharging options, like EV for public transportation [10,17,18,19]. The life cycle assessment performed by Sacchi et al. [20] for a series of medium and heavy-duty trucks shows that the fuel cell and battery will become the most promising powertrain options for trucks in 2040 even compared to advanced combustion technologies. Along with this, to identify the optimal vehicle powertrain, it is also essential to evaluate the driving profile and driving pattern of the user. Crozier et al. [21] performed an explicit study on the behavioral analysis of user-profiles in electric vehicles. The study noticeably shows that users tend to travel a distance between 11 to 91 miles on average each day in the UK. The study done by Sun et al. [22] shows the five different types of vehicle usage pattern on a weekday from floating car data in France, with variable averages and distance travelled in a day.
From the literature mentioned above, we can observe that individual studies have been performed to identify the optimal vehicle powertrain; nevertheless, none of them gives a clear idea of how the performance of EV changes with the number of passengers and vehicle segments for different scenarios. Though the powertrain and drive profile influence the vehicle performance, the number of passengers also impacts the EV performance. The operational results claimed by the manufacturers only consider the weight of the vehicle or with one passenger for testing and analysis [23], but in real-world conditions, a light-duty vehicle is entitled to carry up to 500 kg as payload, which can cause considerable changes to its performance.
In this paper, we propose a generic simulation model of EV for different vehicle types to quantify the vehicle performance in an electric powertrain powered by batteries or fuel cells in different usage profiles. The integrated approach covers all vehicle segments from micro-car to trucks, by evaluating the energy and cost performance of BPT and FCPT configurations. It also captures the effects of the described variables: a range from 100–500 km; different driving profiles, including certification drive cycles and real-world drive cycles; different vehicle segments; and different payload mass. This study presents an innovative approach capable of designing tailor-made EV powertrain and energy storage solutions based on user profile requirements.
The paper is structured as follows: Section 2 explain the study and is divided into further segments: Section 2.1 describes the different types of vehicles considered for this study, Section 2.2 explains the considered drive cycles, including real-world and standard drive cycles. Section 2.3 explains the development of the model in Simulink, including the modeling of battery and fuel cell systems. Section 3 presents the results from the simulation process with various vehicle types. The discussion about the results was performed in Section 4. And finally, the conclusions are reached in Section 5.

2. Data and Methods

This research aims to analyze vehicle performance with different powertrain configurations, driving profiles, the number of passengers, and vehicle segments. To accept these parameters as a variable, a highly flexible model is needed. The model should be capable of considering the former parameters as a variable. Facing the need for flexibility and to analyze different scenarios, an already developed Simulink model from a previous study was modified concerning the requirement of this study [9,10]. For this study, the model was revised from a previous model with a customized drive cycle for different analysis and specified vehicle types were replaced with generic vehicle model to study different vehicle types. The model consists of six subsystems, including drive cycle, vehicle model, vehicle physical model, motor system, battery system, and fuel cell system.

2.1. Vehicle Type

For this study, six generic vehicles were considered based on the vehicle types existing in the automotive market. Table 1 shows the different vehicle types, dimensions, and physical properties (corresponding to the average of a sample of available vehicles on the market).
With the current market trends, micro-cars have been marking their dominance in many of the prominent EV selling countries. Due to its lower energy consumption, higher battery life, ease of use, and convenience, micro-cars are becoming popular among EV users. In China, GM’s venture Micro-EV became the most sold EV in August 2020, followed by the Tesla Model 3 during the pandemic [24]. In 2026, the Micro-EV market size is projected to reach USD 5.8 billion based on the Fortune Business Insights forecast [25].
To study the concept of tailored vehicle for individual uses, a four-seater urban vehicle (Urban 4s) is included, which aims to study the real-world performance of compact urban vehicle with a maximum of four passengers instead of five. The smaller vehicle size with its lighter weight compared to the five-seater vehicle helps with reduced energy consumption and possibly longer range and battery life. This hypothesis will be explained later in the analysis stage. For the physical properties, the existing vehicle’s type of hatchback is considered for the 4-seater EV.
To compare with most EVs present in the market, a five-seater extra-urban model (Extra-urban 5s) is also considered. The vehicle properties are determined based on the average of the similar EV vehicles (Sedan) present in the market. In addition to this, in the context of the increasing need for promoting the modal shift to mass transit options and of the push for on-demand services, a shuttle model with an electric powertrain is analyzed in the study.
Additionally, due to the significant share of heavy-duty vehicles in the transport sector externalities (430,000 units [26]) and considering this sector has been slower in adopting alternative solutions, heavy-duty vehicles, specifically, the bus and semi-truck, are also included, due to their different specificities in terms of powertrain design and associated mobility patterns.

2.2. Drive Cycle Selection

The drive cycle data influence the simulation outcomes considerably as they represent the operational conditions of a vehicle. The vehicle types described in Table 1 were tested with certified and real-world drive cycles to study their energy performance. WLTP class 3 drive cycle is used as the certified drive cycle for light-duty vehicles [
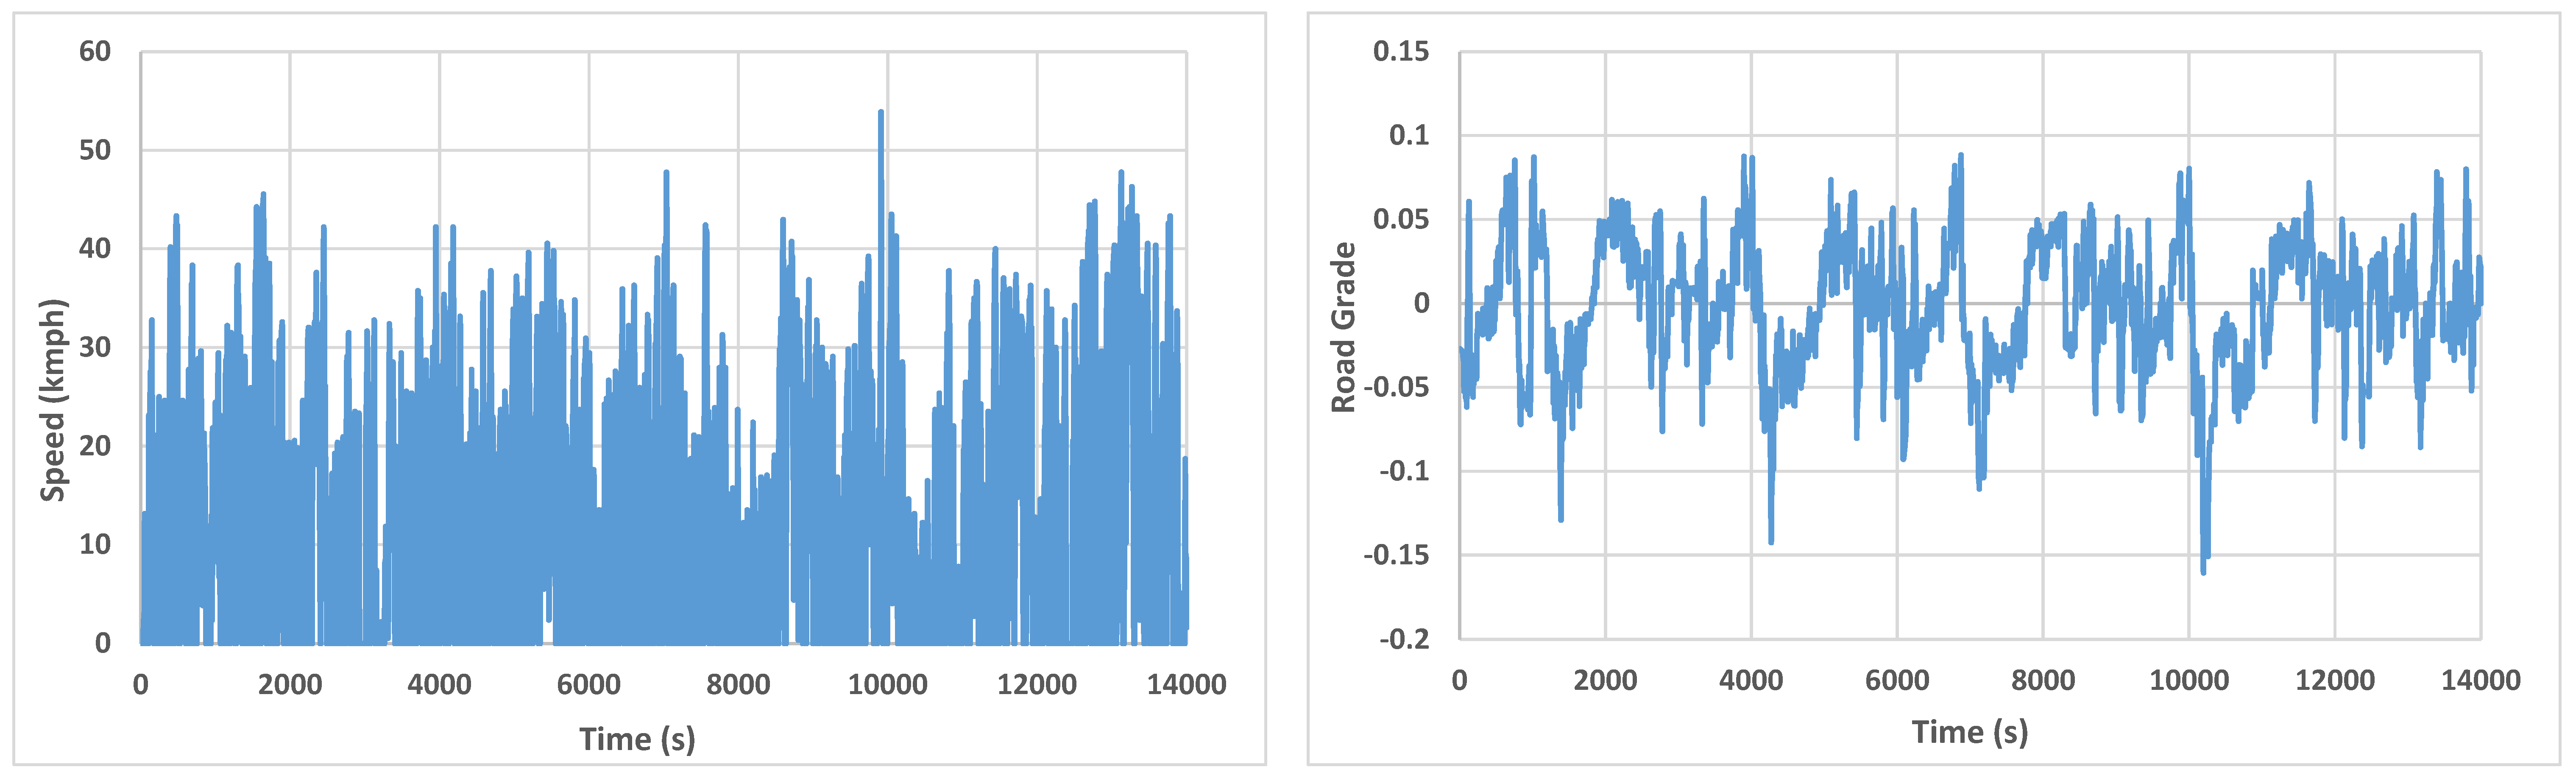
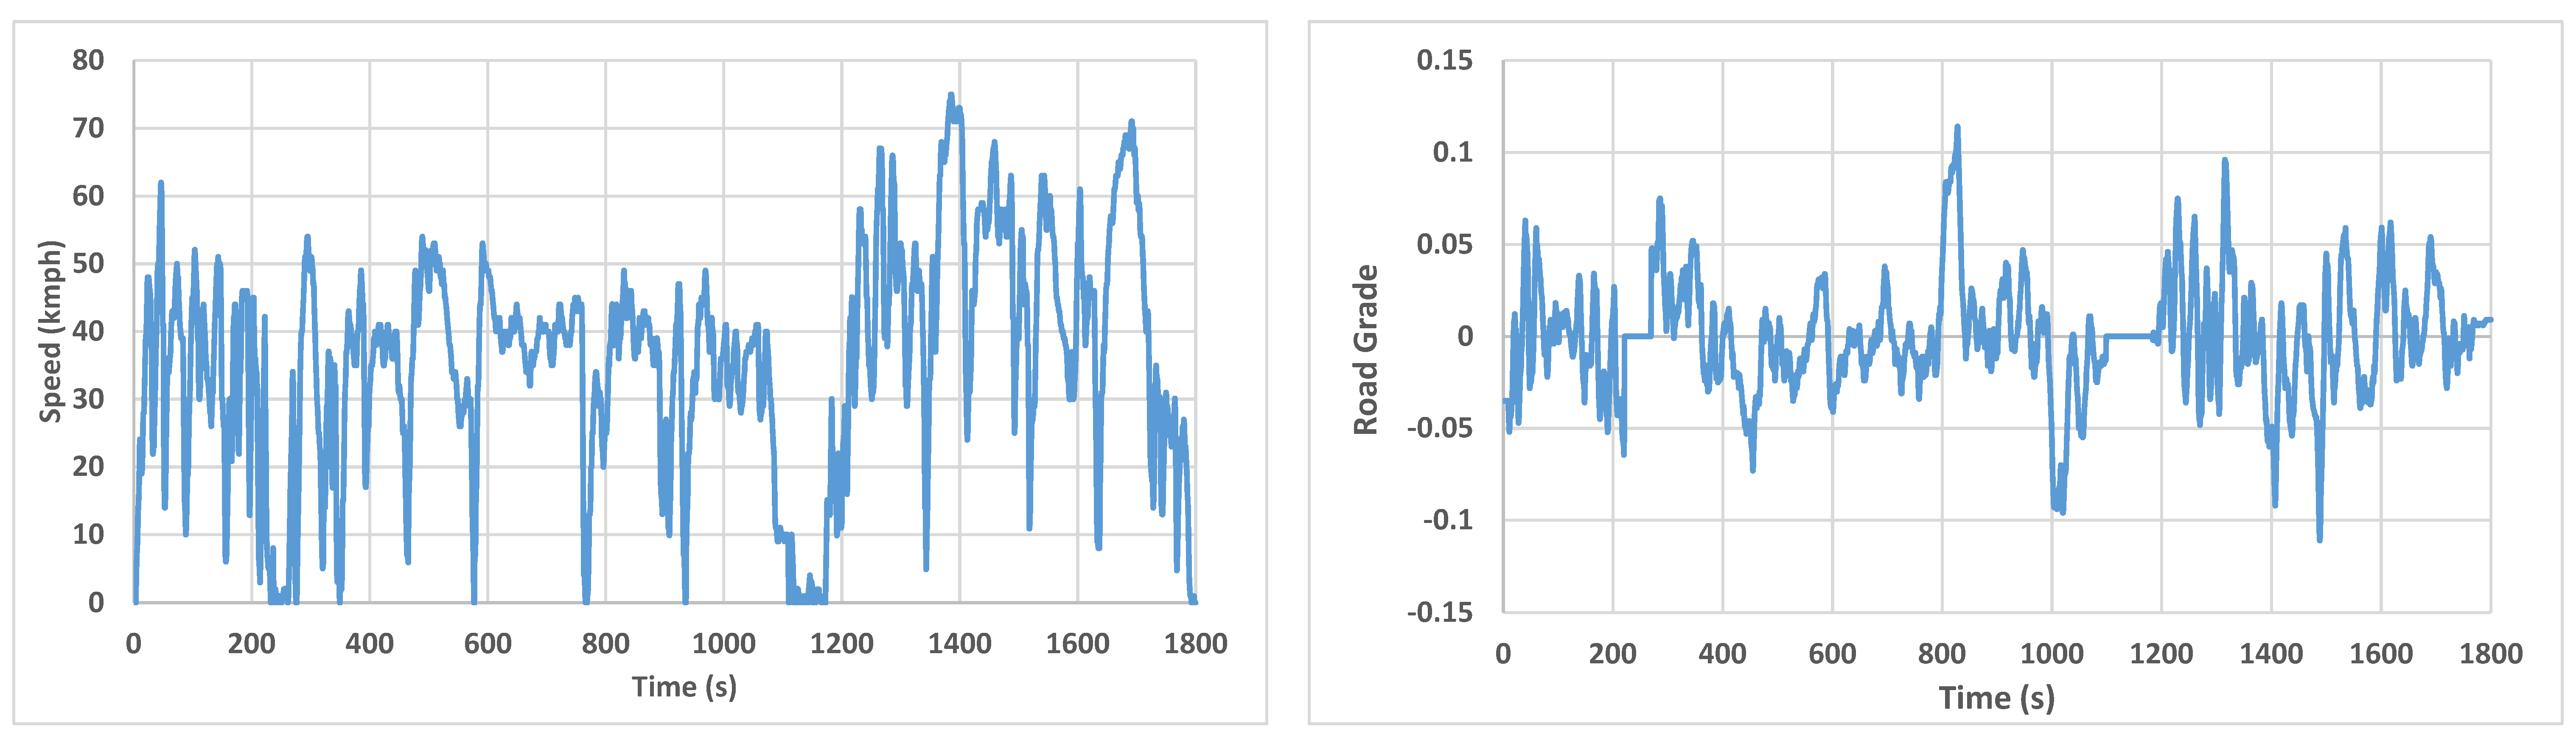
27]. For real-world drive cycle, 2 distinct drive cycles with road grade were extracted from a larger real-world drive cycles sample collected with light-duty vehicles in Lisbon, Portugal [12] (check the Appendix A, 
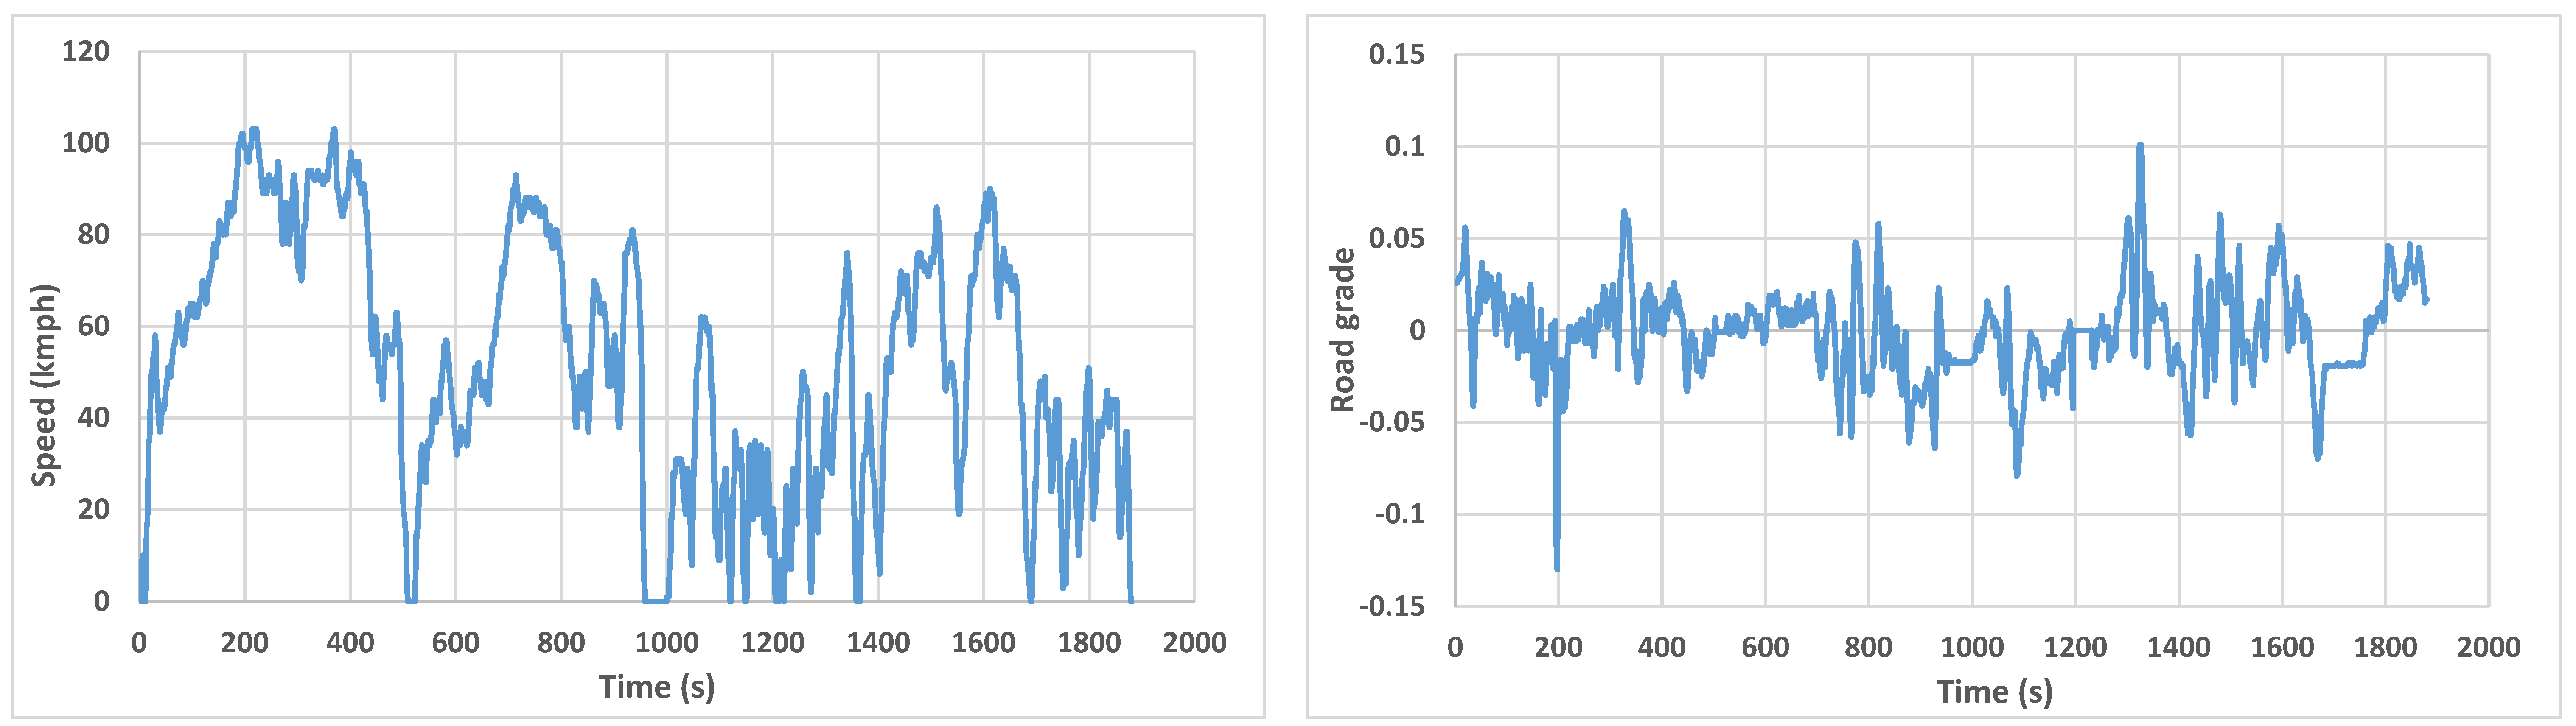
Figure A1 (Real-world drive cycle 1 (duration: 1800 s)) for real-world drive cycle 1-RW1 and 
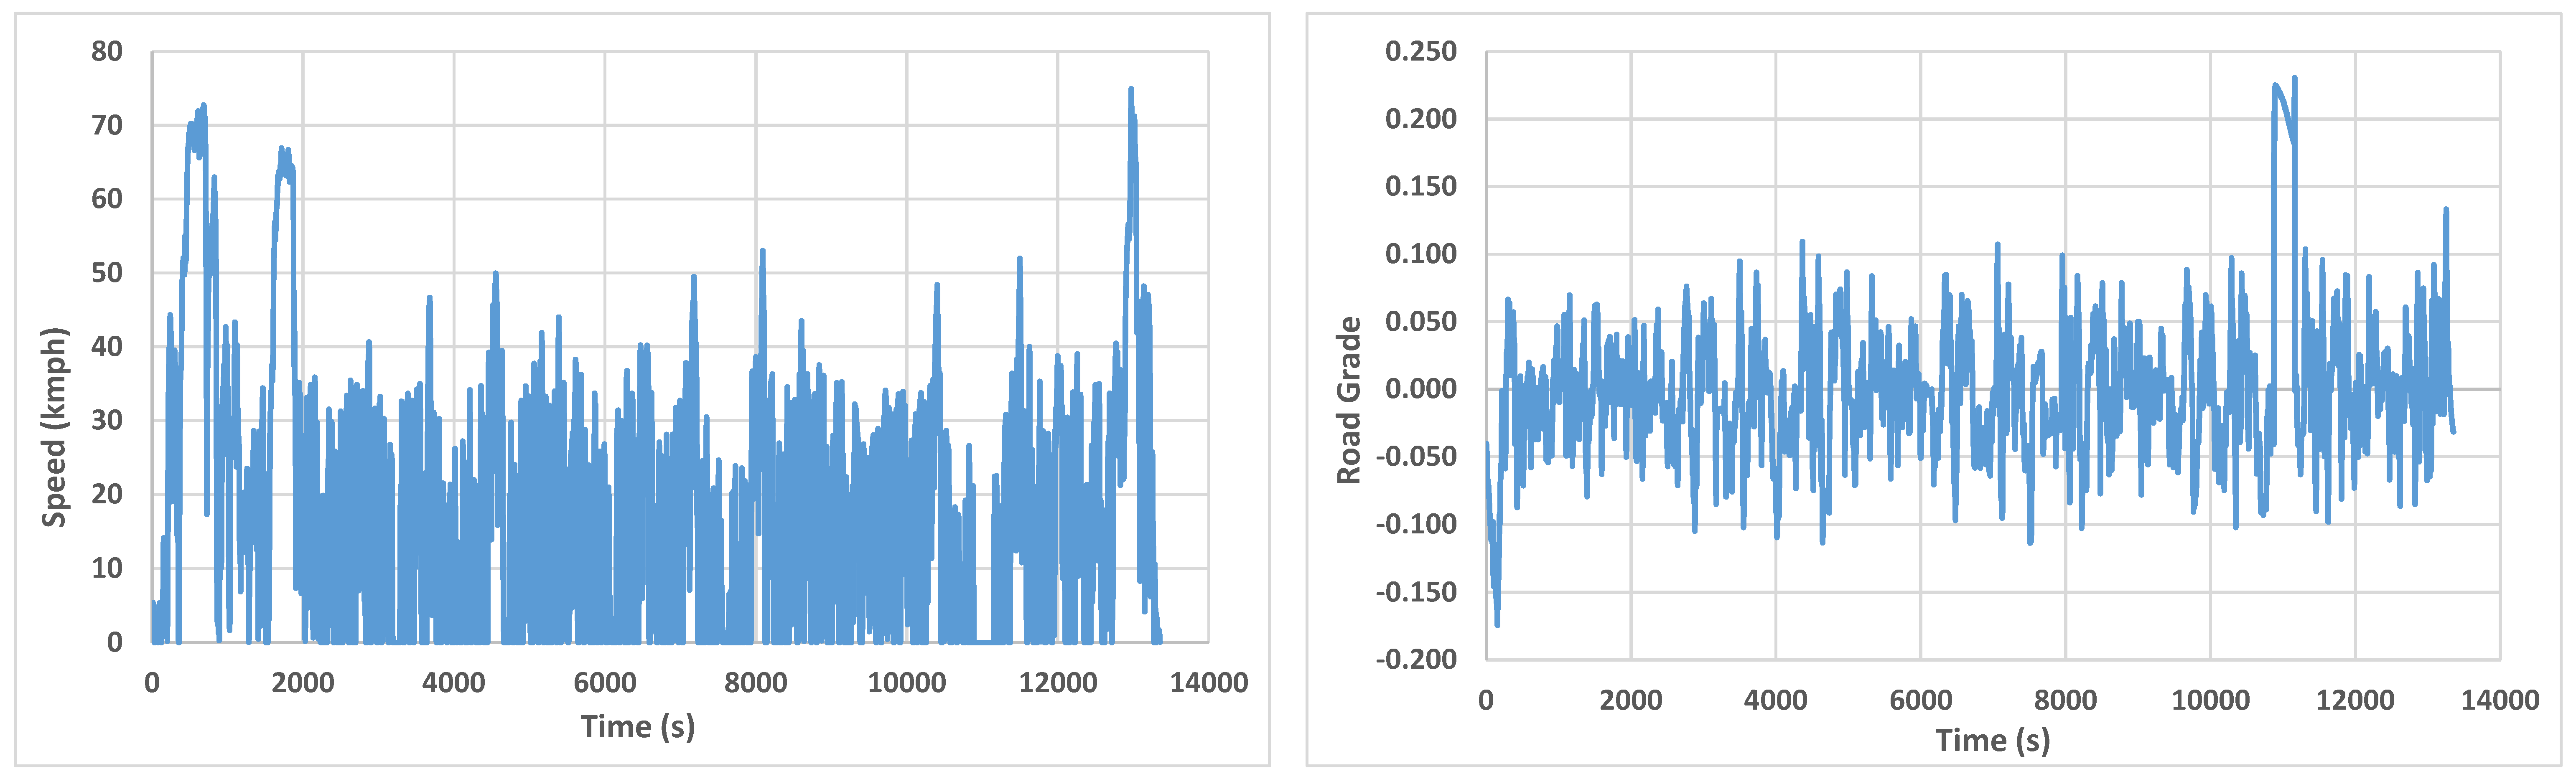
Figure A2 (Real-world drive cycle 2 (duration: 1880 s)) for real-world drive cycle 2-RW2). Since the Micro-car and Shuttle have limited engine power, the maximum speed they can achieve is lower than the Urban 4s and Extra-urban 5s, so lower speed drive cycles previously obtained for micro-cars were used [
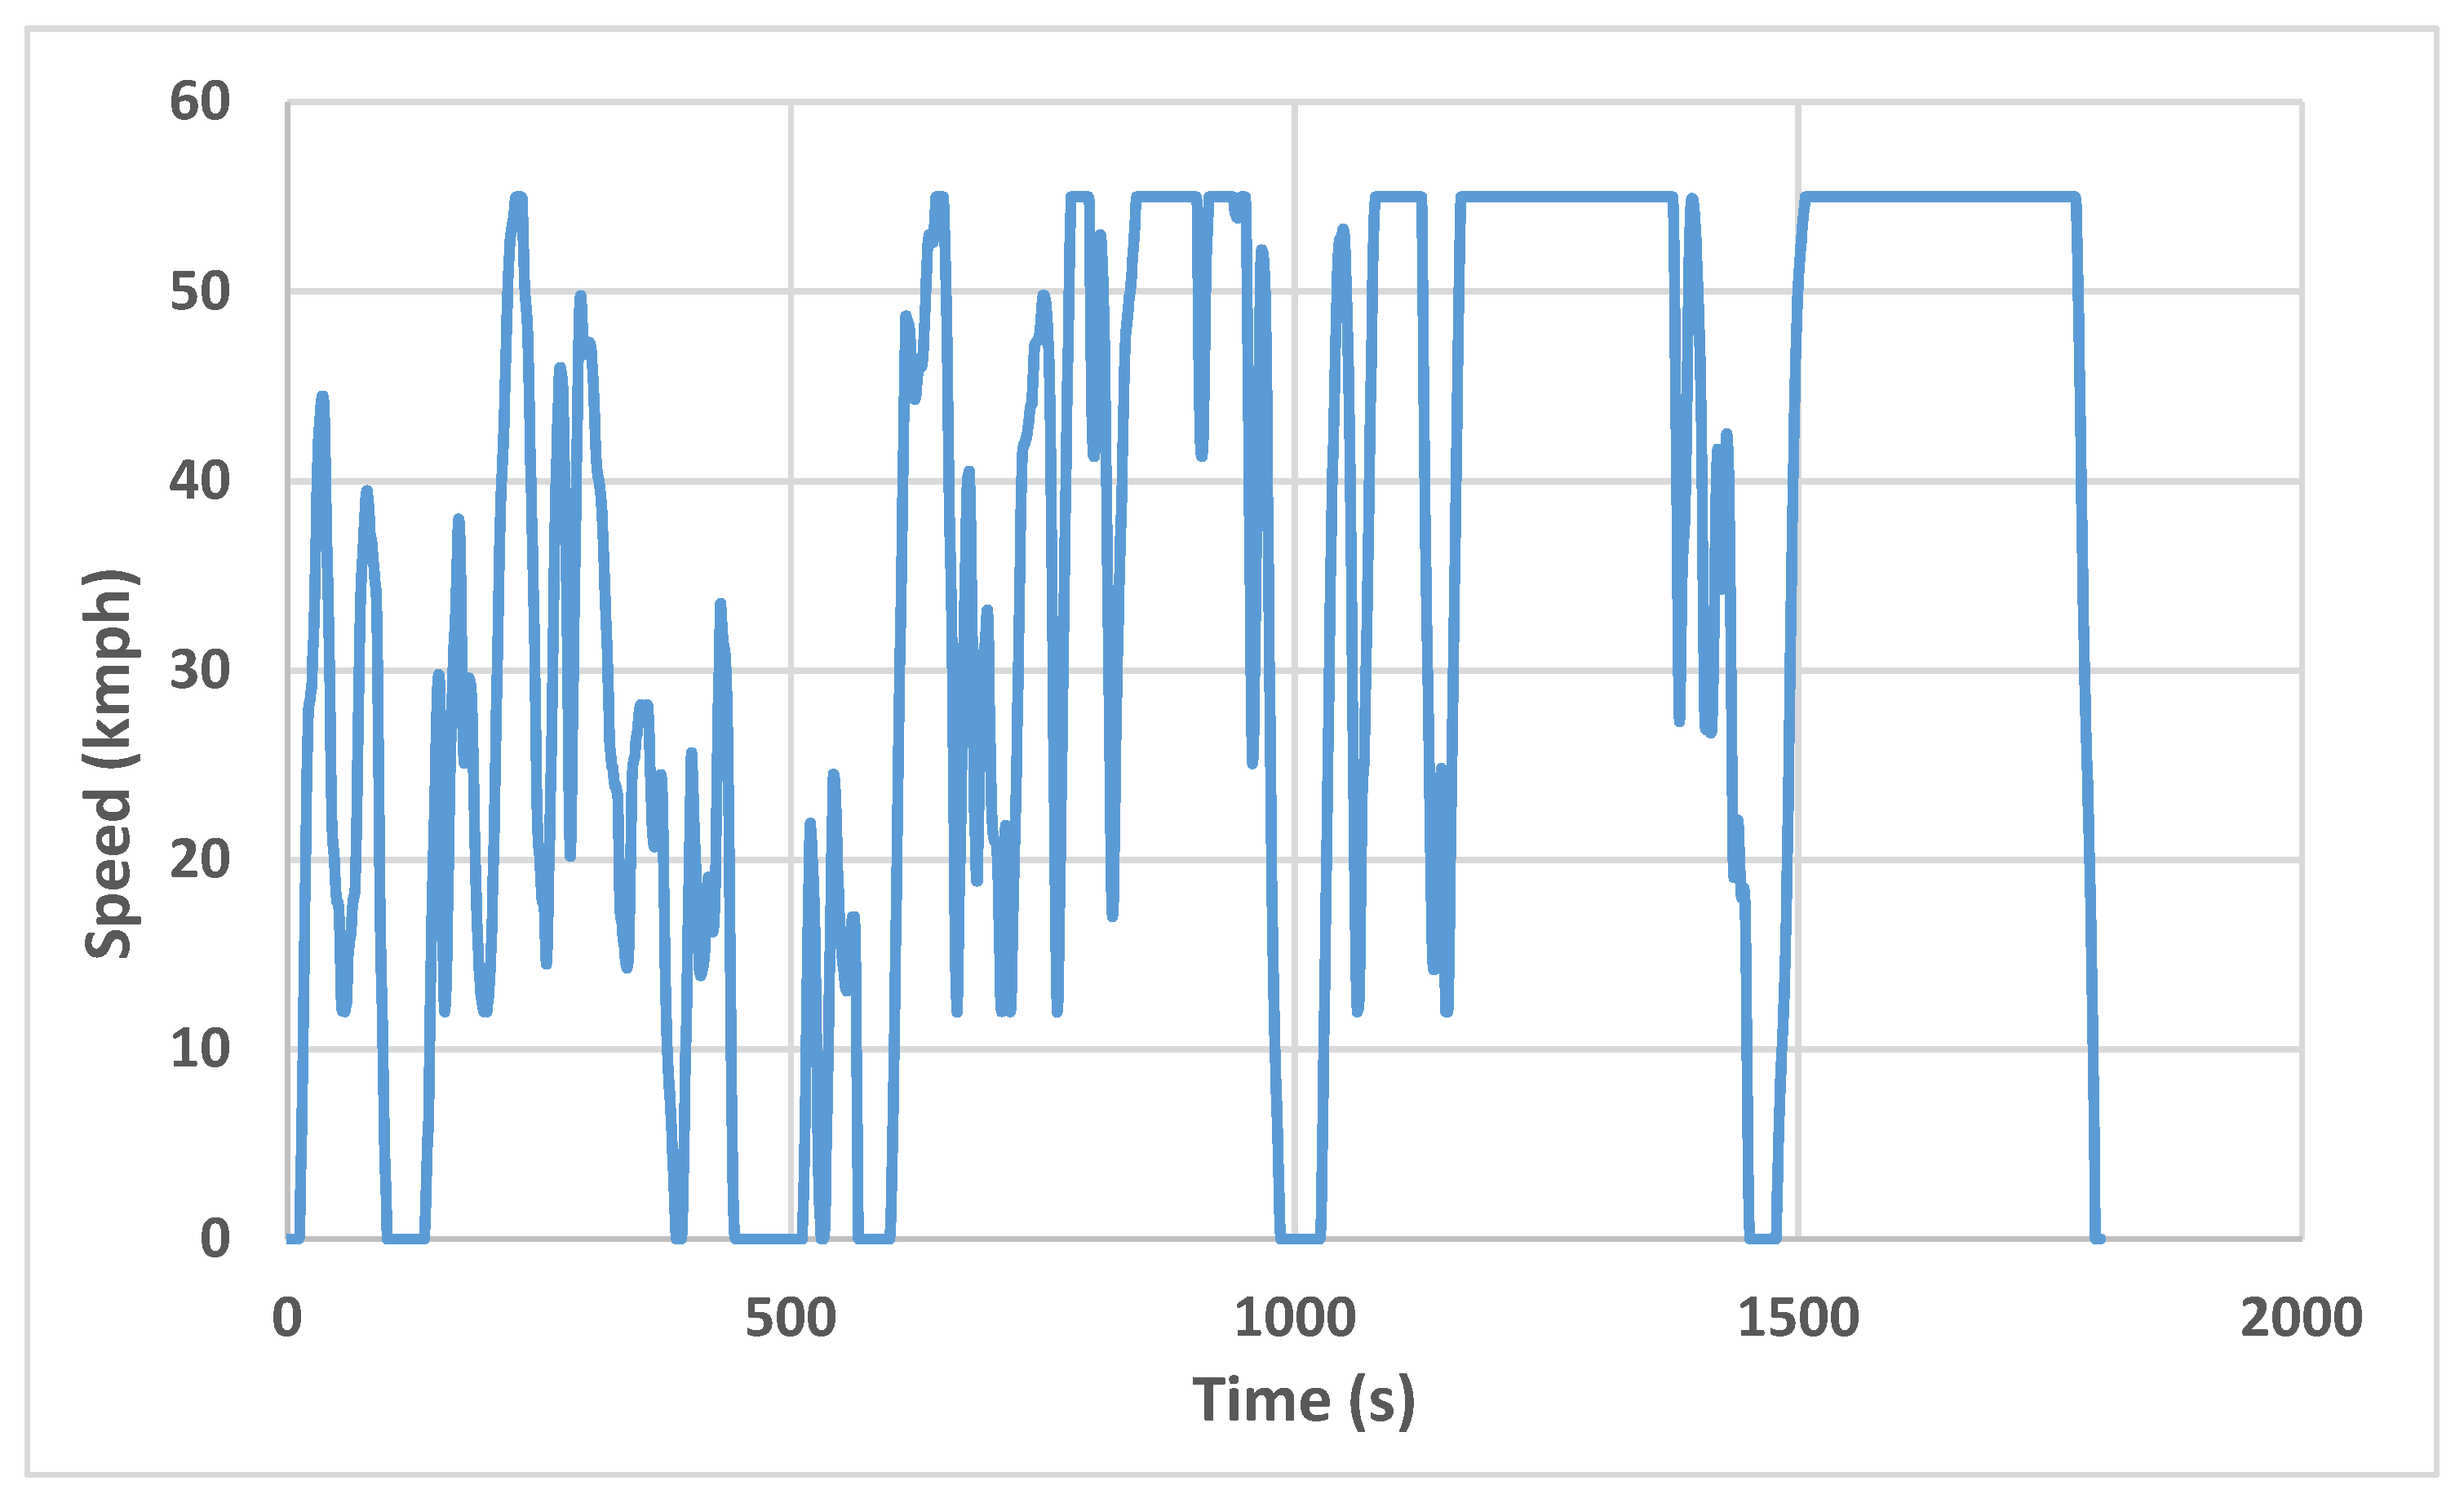
28]. Also, the certified WLTP drive cycle is modified for the former vehicles with a maximum speed of 55 km/h. Figure A3 (Real-world drive cycle for micro-car/shuttle (duration: 14,004 s)) shows the real-world drive cycle for Microcar/shuttle (RW_m) and Figure A4 (Modified WLTP class 3 drive cycle (duration: 1800 s)) shows the modified WLTP class 3-drive cycle. Table 2 details the specification of drive cycles used for the analysis of the light-duty vehicles.
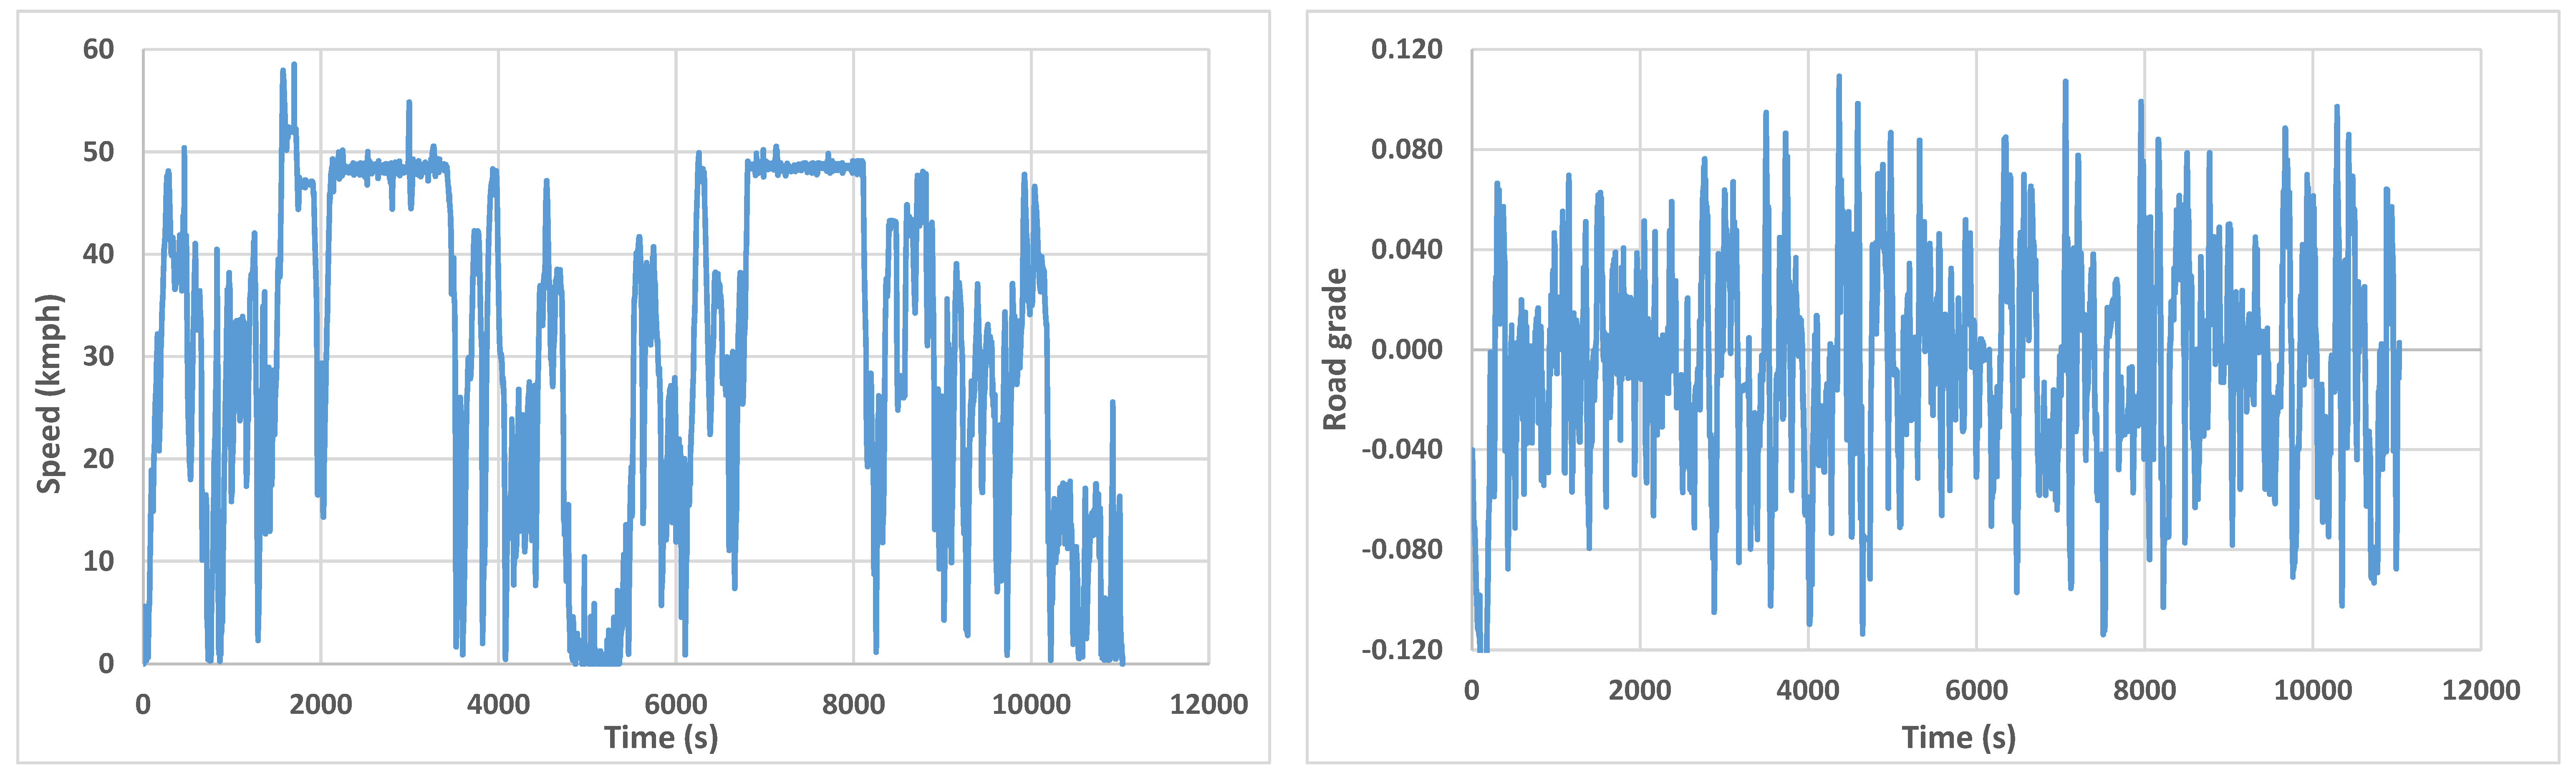
For heavy-duty vehicles, since there are no certification drive cycles, they are only analyzed with real-world drive cycles, which were recorded in previous studies [10,29]. Figure A5 (Real-world drive cycle for Bus (duration: 13,353 s)) represents the real-world drive cycle used for the simulation of bus and Figure A6 (Real-world drive cycle for Semi-truck (duration: 11,027 s)) show the speed profile of the real-world drive cycle used for semi-truck simulations. Table 2 shows the drive cycle specification used for the simulations of the heavy-duty vehicles (RW_b represents the real-world drive cycle for bus and RW_st represents the real-world drive cycle specifications for semi-truck).

2.3. Model Development

The developed model consists of six subsystems, including drive cycle, vehicle model, vehicle physical model, motor system, battery system, and fuel cell system. The second-by-second drive cycles defined in Section 2.2 are imported as input signals into the drive cycle subsystem. In the vehicle model, the vehicle specifications were considered based on information presented in Section 2.1. The model enables modification of battery capacity, fuel cell maximum power, and vehicle segment type in this subsystem.
The vehicle physical model subsystem consists of mechanical, mathematical, and numerical expressions to describe the vehicle’s physical behaviour, as in other studies in the literature [
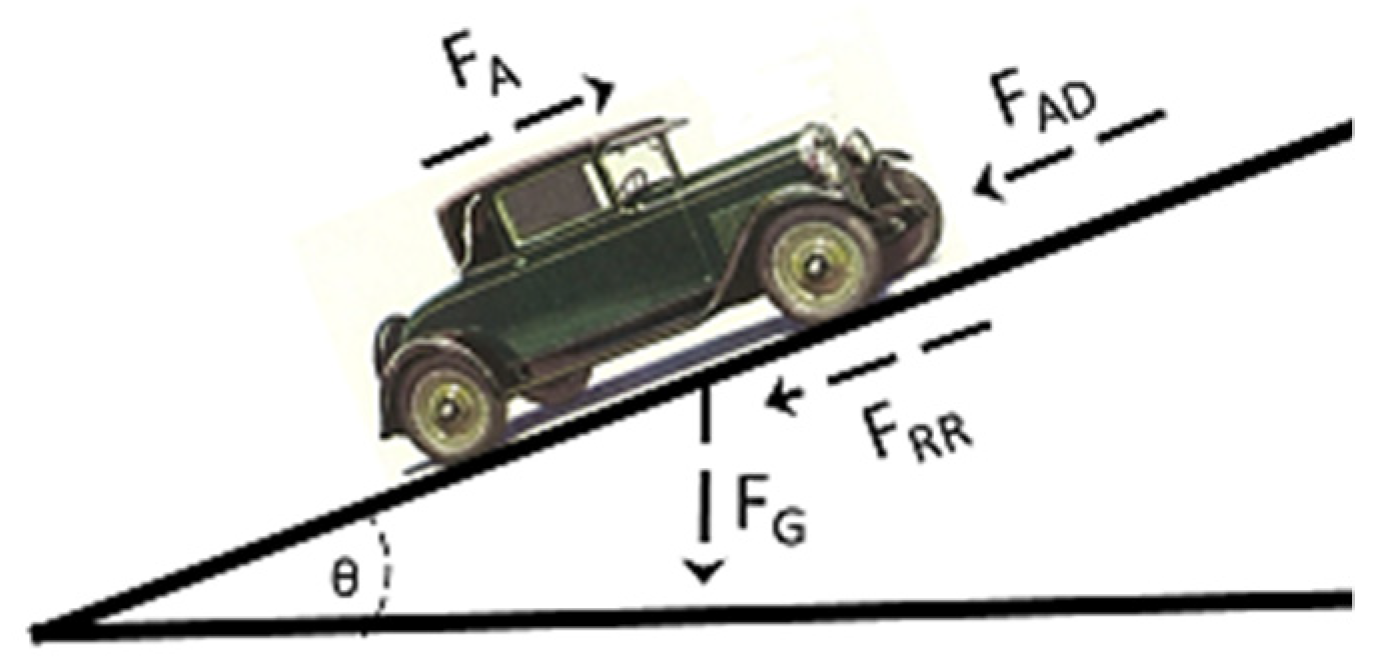
30]. The traction force required to accelerate the vehicle and deceleration forces are calculated based on the one-dimensional vehicle fundamental motion. That enables calculating the power requirement of the vehicle in each second, based on the drive cycle data and basic vehicle loads forces, as presented in Figure 1.
The total force that is required to move the vehicle is called traction force and is calculated as:
FT = FA + FG + FRR + FAD
where, FA is the acceleration force (N), FG is the gravitational force (N), FRR is the rolling resistance (N), and FAD is the aerodynamic drag (N). The previous expression is expanded as:
F T   ( N ) = ( m × a ) + ( 1 2 × C d × ρ × A f × v 2 ) + ( C r × m × g × cos   θ ) + ( m × g × sin   θ )
where m is the mass of the vehicle (kg), a is the acceleration (m/s2), Cd is the drag co-efficient, Af is the vehicle frontal area (m2), v is the velocity (m/s), Cr is the coefficient of rolling resistance, g is the acceleration due to gravity (m/s2) and θ is the road grade [9].
The model is designed in such a way that the air density is calculated numerically for each simulation [31]. The rolling resistance is determined based on the average speed of the drive cycle. The experimental results of tire T1071 (modern tire) on ISOr20 road surface (ISO reference surface) at different speeds are taken as a reference to compute the rolling resistance coefficient [32].
In the motor subsystem, a permanent magnet DC motor/generator is numerically modelled. The efficiency curve of the Nissan leaf 80 kW motor is taken as the reference. During forward motion/acceleration, a permanent magnet DC motor (PMDC) is employed as a motor, while during braking/deceleration, the PMDC works as a generator and extracts energy through regenerative braking. Equation (3) represents the power output from PMDC to the wheel during acceleration and Equation (4) represents the regenerative energy production during braking. The power required during each second of the travel is calculated as the sum of power required for acceleration (Pwheel), auxiliary power (PAUX), and power loss (Ploss), which is represented in Equation (5).
P wheel   ( W ) = F t × v η m
Pregen (W) = FT × ηregen
Ptotal (W) = Pwheel + PAUX + Ploss
where, ηm (%) is the efficiency of the motor and ηregen (%) is the regenerative efficiency. It is expected that regenerative efficiency at a particular deceleration point is the same as that motor efficiency at the same acceleration point, however, the maximum regenerative energy production has been limited to 25% of the motor power according to the literature [33,34].
For the battery powertrain (BPT), the total power stored in the battery is defined as the product of voltage (V) of the battery and total current (I) in the battery, as represented by Equation (6). The current injected during charging (regenerative braking) and extracted during discharging (acceleration mode) of the battery is estimated by Equation (7) and terminal voltage, Vt is calculated through Equation (8):
Pbat = V × I
I   ( A ) = V t V t 2 4 R P wheel 2 R
Vt = Vt(t−1)Vdrop
where R is the battery internal resistance (Ω) and t is the time in seconds. The resistance of the battery is considered to be 0.1 Ω [35]. The total energy consumed during the drive cycle is assessed by summing the power consumption through each second of the drive cycle. The final total power consumption is estimated by taking the difference of total power consumption to the regenerative energy produced during the journey, as presented in Equation (9).
P T = t = 1 T P total P regen
The average energy consumption (E_avg) of the vehicle is the amount of energy consumed to reach each unit distance, km, and is calculated as shown in Equation (10). The Range (km) of the vehicle is calculated as shown in Equation (11).
E _ avg   ( Wh / km ) = P t d
Range = P b a t E _ avg
where d is the distance travelled in the drive cycle (km). It is to be noted that 100% energy capacity available cannot be used, the battery reserves the last 15% of its energy density to prevent full discharge.
State of charge (SOC) is defined as the level of charge of the battery with respect to its capacity. It is presented in percentage: 100% represents fully charged battery and 0% represents empty. SOC is calculated at each second by using the coulomb current counting method (see Equation (12)):
S O C ( t ) = S O C ( t 1 ) ± I t I
where I is the current stored in the battery and it is the current drawn at that particular second.
For the fuel cell powertrain (FCPT), a proton-exchange membrane fuel cell (PEMFC) is modelled based on the polarisation curve of Toyota Mirai 2017, which is taken as the reference [36,37]. The portion of the output power of the fuel cell required to maintain the working condition is termed as the balance of plant (BOP). The fuel cell power (Pfc) is then calculated through Equation (13):
P f c   ( W ) = P f c p 1 B O P
where Pfcp is the maximum output of the fuel cell stack. From the polarization curve, the current and voltage for the power required are estimated. The stack output voltage (V) of the fuel cell is the total voltage produced by the number of cells in the stack (Nc), which is given by:
V f c p = N c × V f c
Fuel cell electrical efficiency is calculated as the ratio of the electric power output to the energy input from hydrogen. The total efficiency of the module can also be calculated as the product of the factors, as shown in Equation (15):
η = η t h × η v × η F × μ F
where η t h is the thermodynamic efficiency, η v is the voltage efficiency, η F is the faradic efficiency, and μ F is the utilization factor. The thermodynamic efficiency, faradic efficiency, and utilization factor are assumed as 0.83, 0.9, and 1 respectively [38], and voltage efficiency is calculated by Equation (16), and the fuel mass flow rate of hydrogen is calculated by Equation (17):
η v = V f c 1.23
m ˙ H 2 ( gm / s ) = P f c p Q × η
where Q = 120 MJ/kg or 33.33 kWh is the lower heating value/specific energy of hydrogen. Since the power requirements vary each second, the current and voltage produced also change and it will affect the fuel cell operation. In order to intercept that, a DC–DC converter is used with an efficiency of 90%. The range (km) of the vehicle is calculated as:
Range   ( km ) = M H 2 × 33.33 × 1000 E _ avg
For the FCPT, the modelling is performed in such a way that the energy required for the cruise is fully produced through the onboard FC stack, while the energy required for auxiliary consumption is delivered by a secondary battery, which is modelled similar to a battery system for BPT.

2.4. Application of the Model

The simulation model developed for this study is acknowledged as flexible since it enables us to easily modify the number of passengers, various driving profiles, vehicle segment types, and storage options as separate variables. This helps to assess the difference in vehicle performance in different driving scenarios and identify the effects in real-world driving. Through this model, the following analysis was performed.
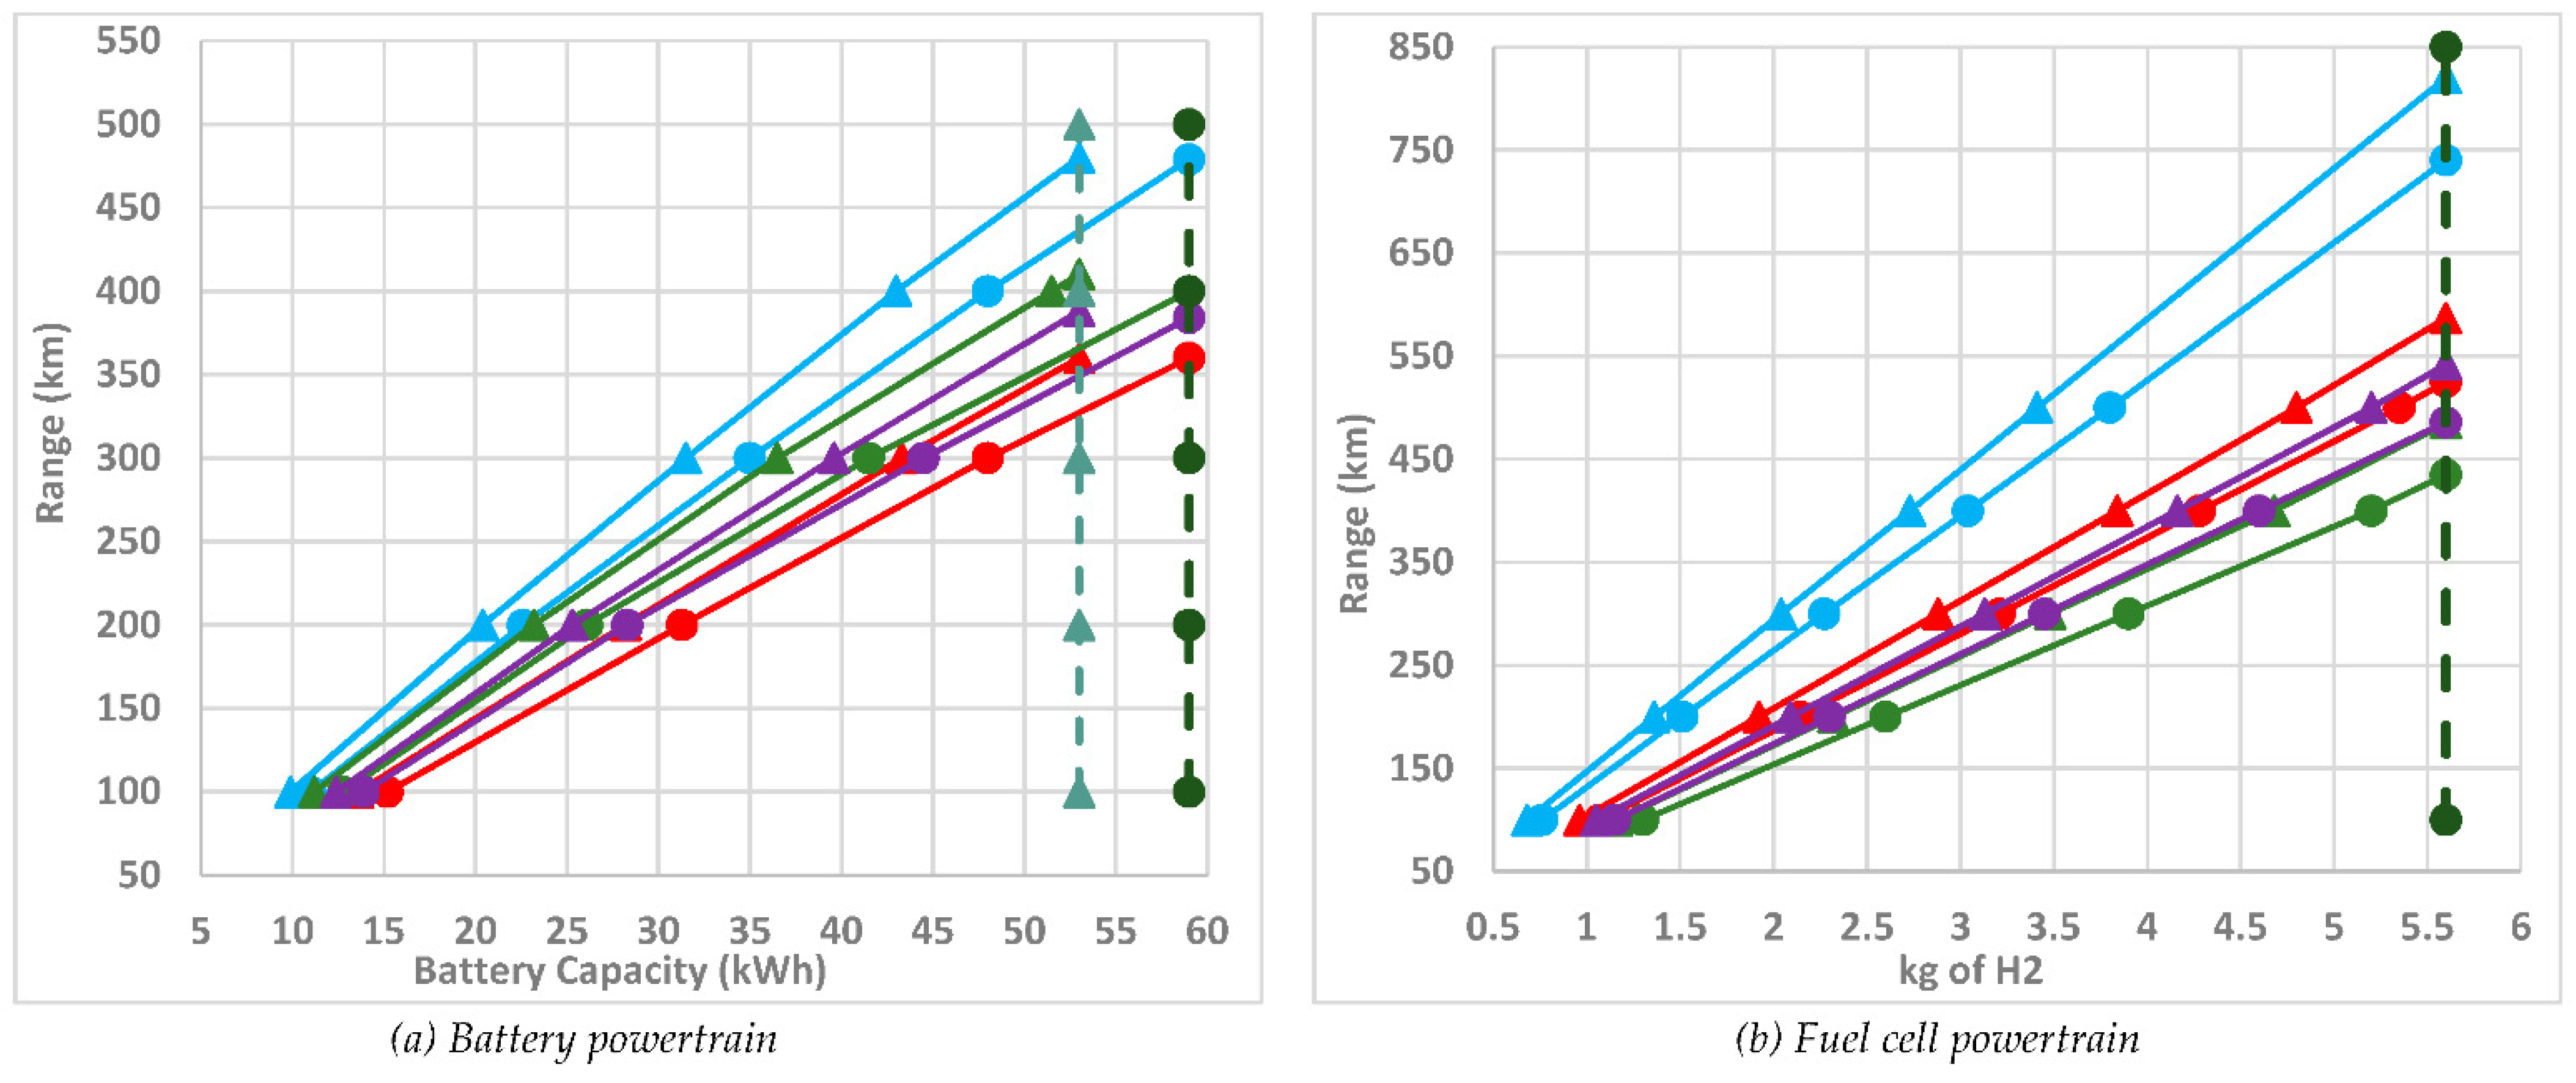
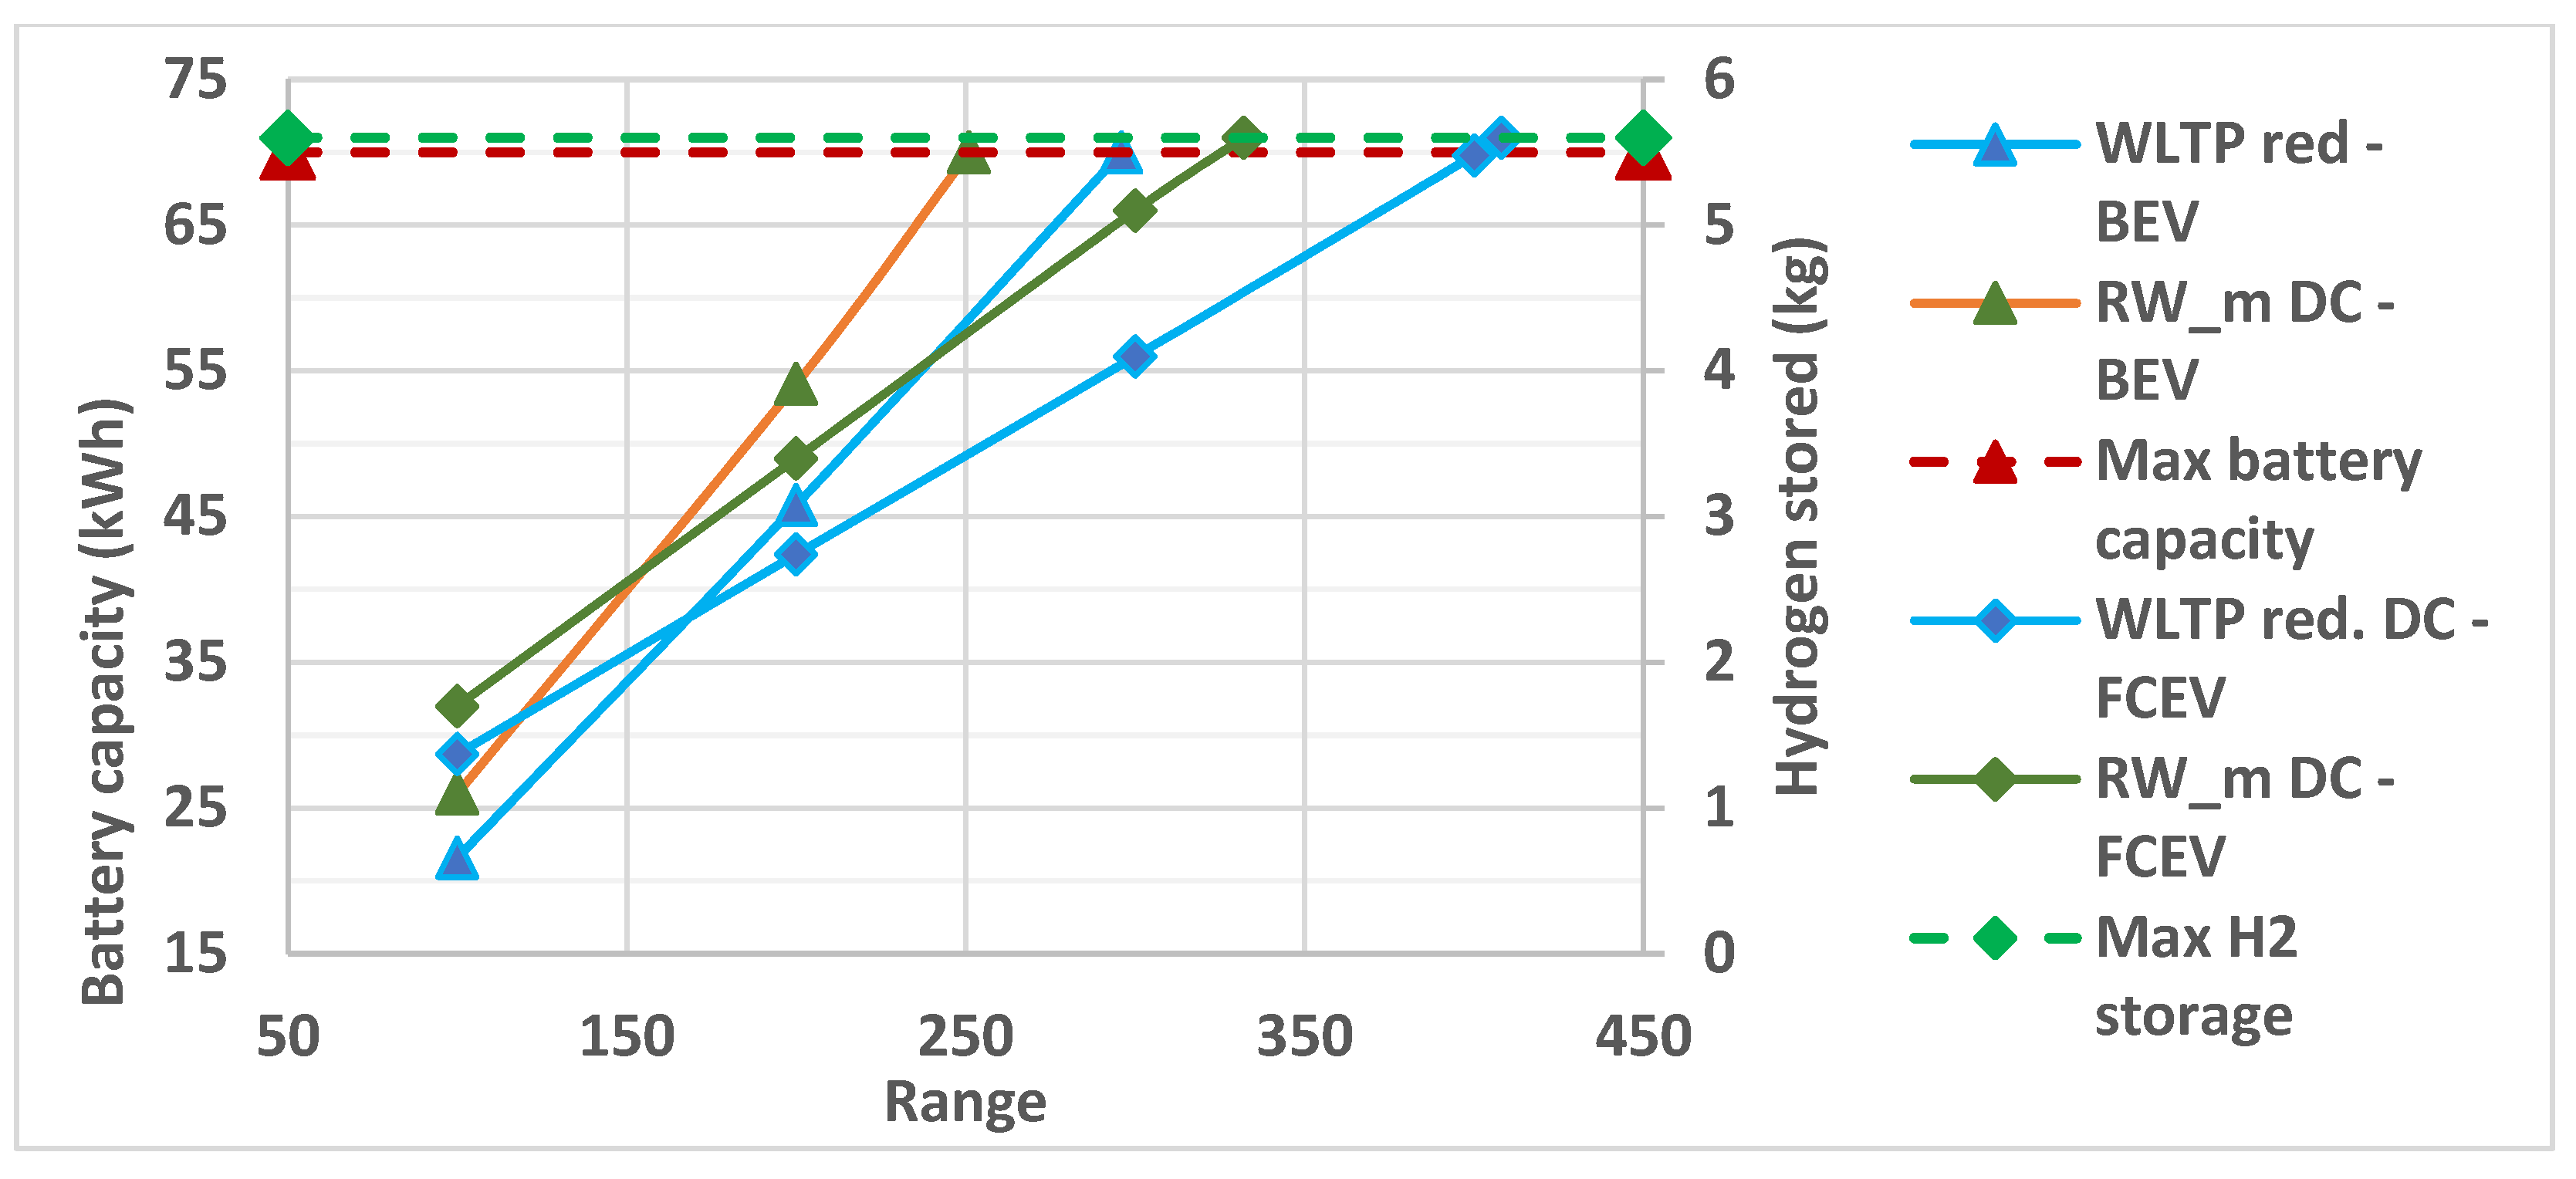
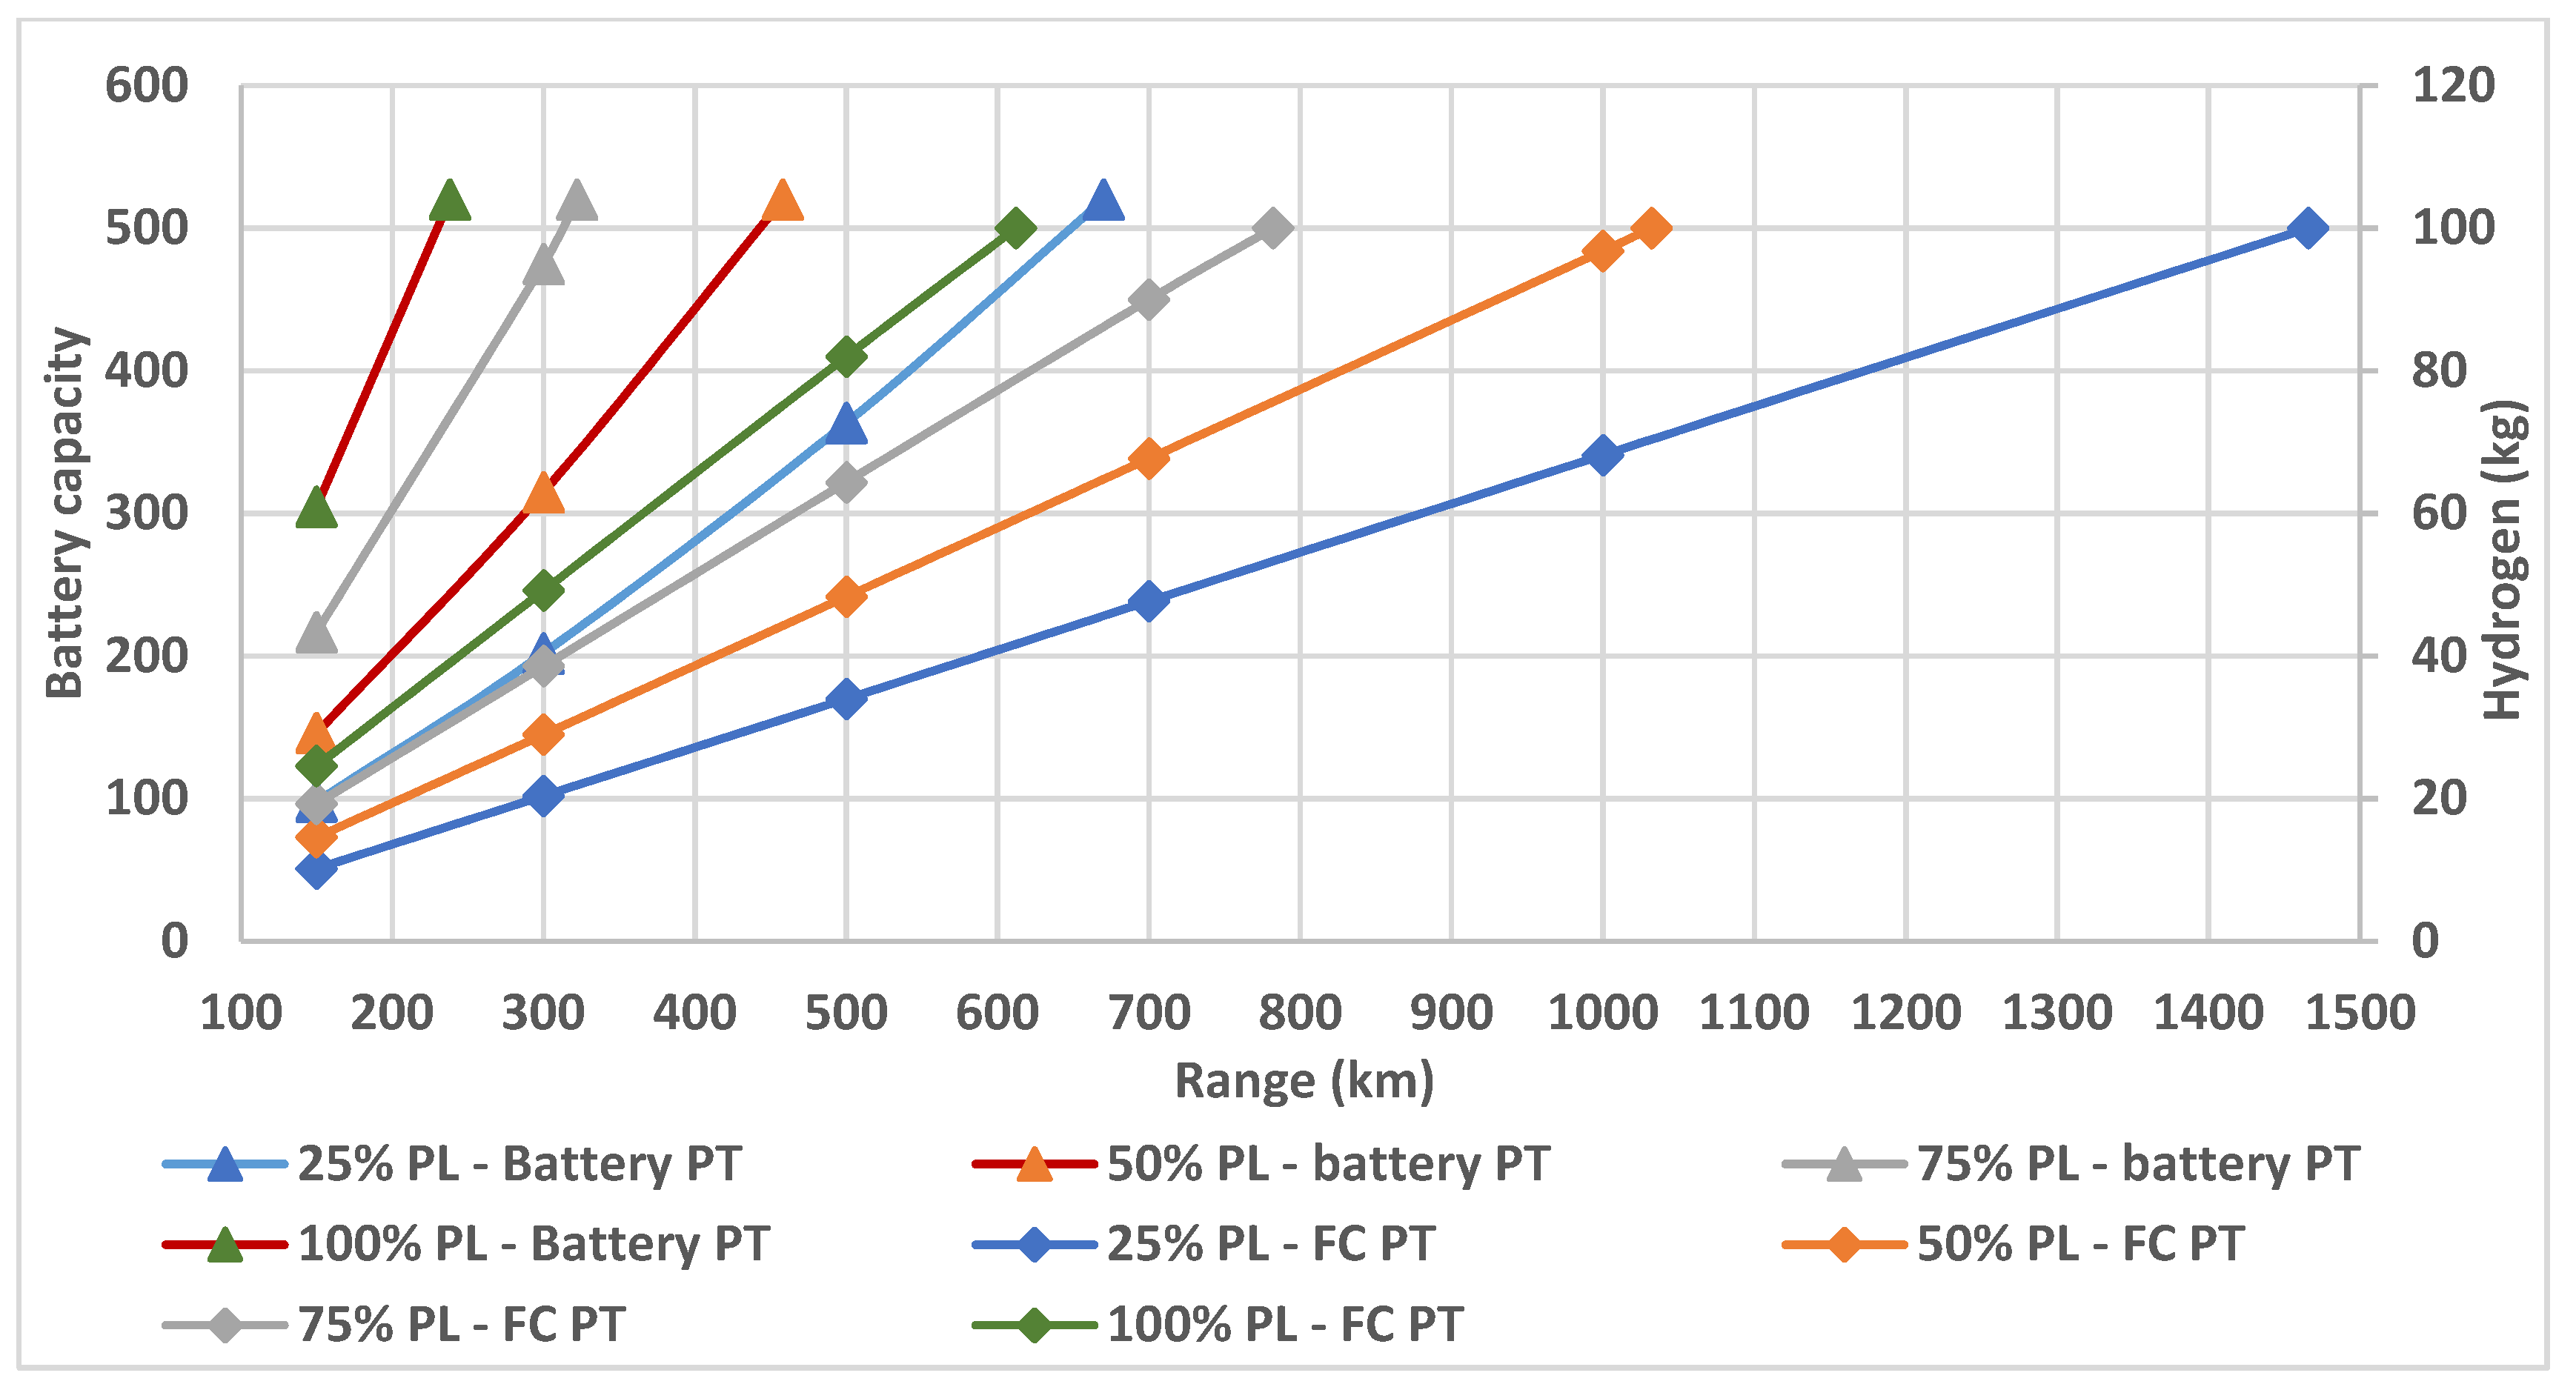
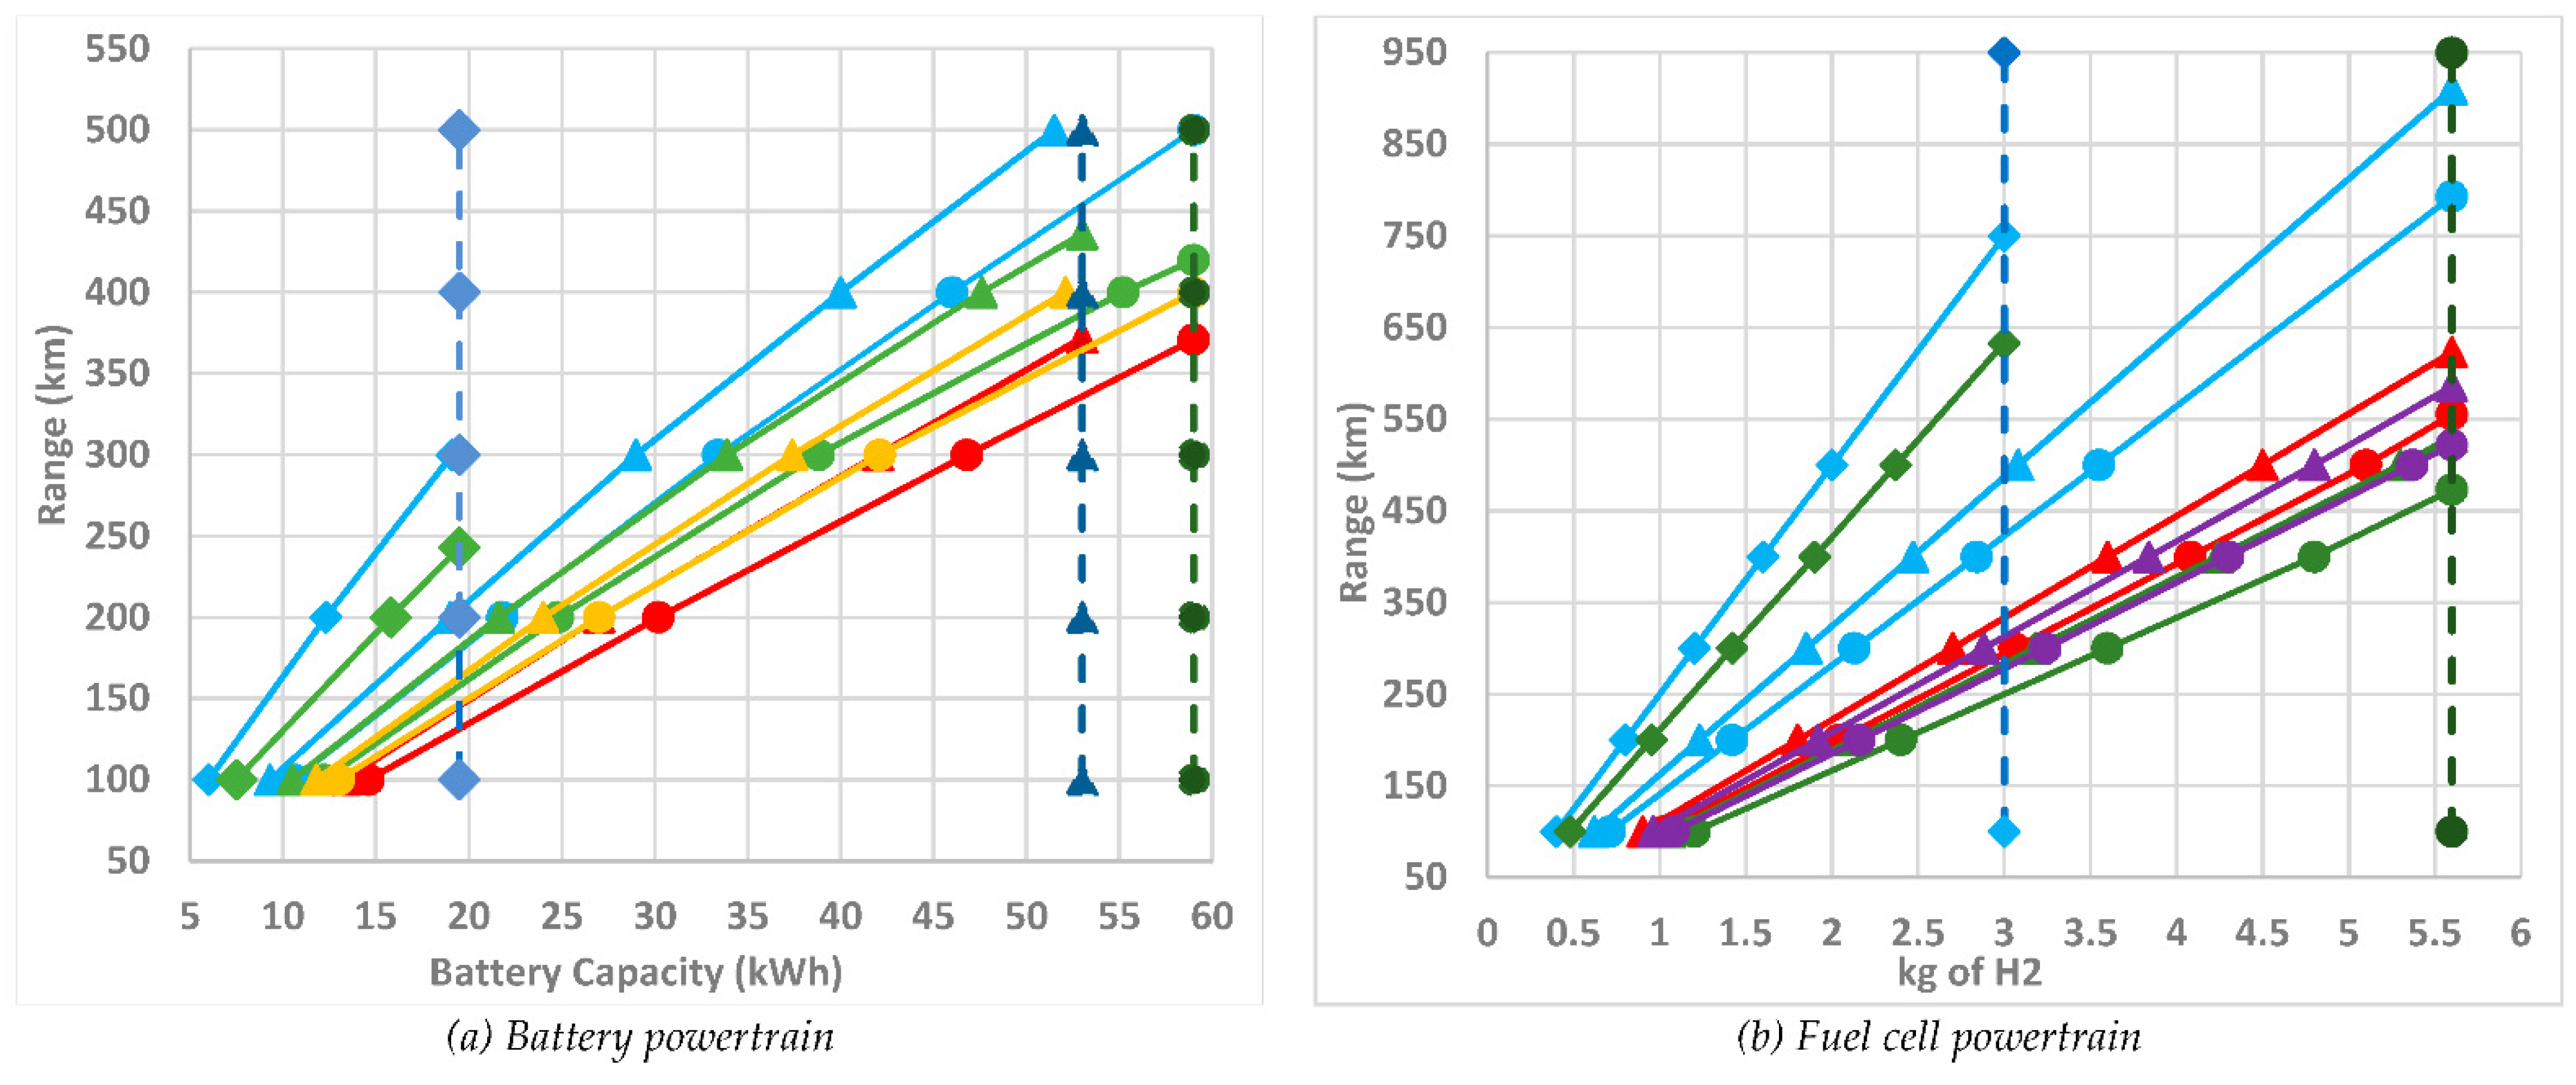
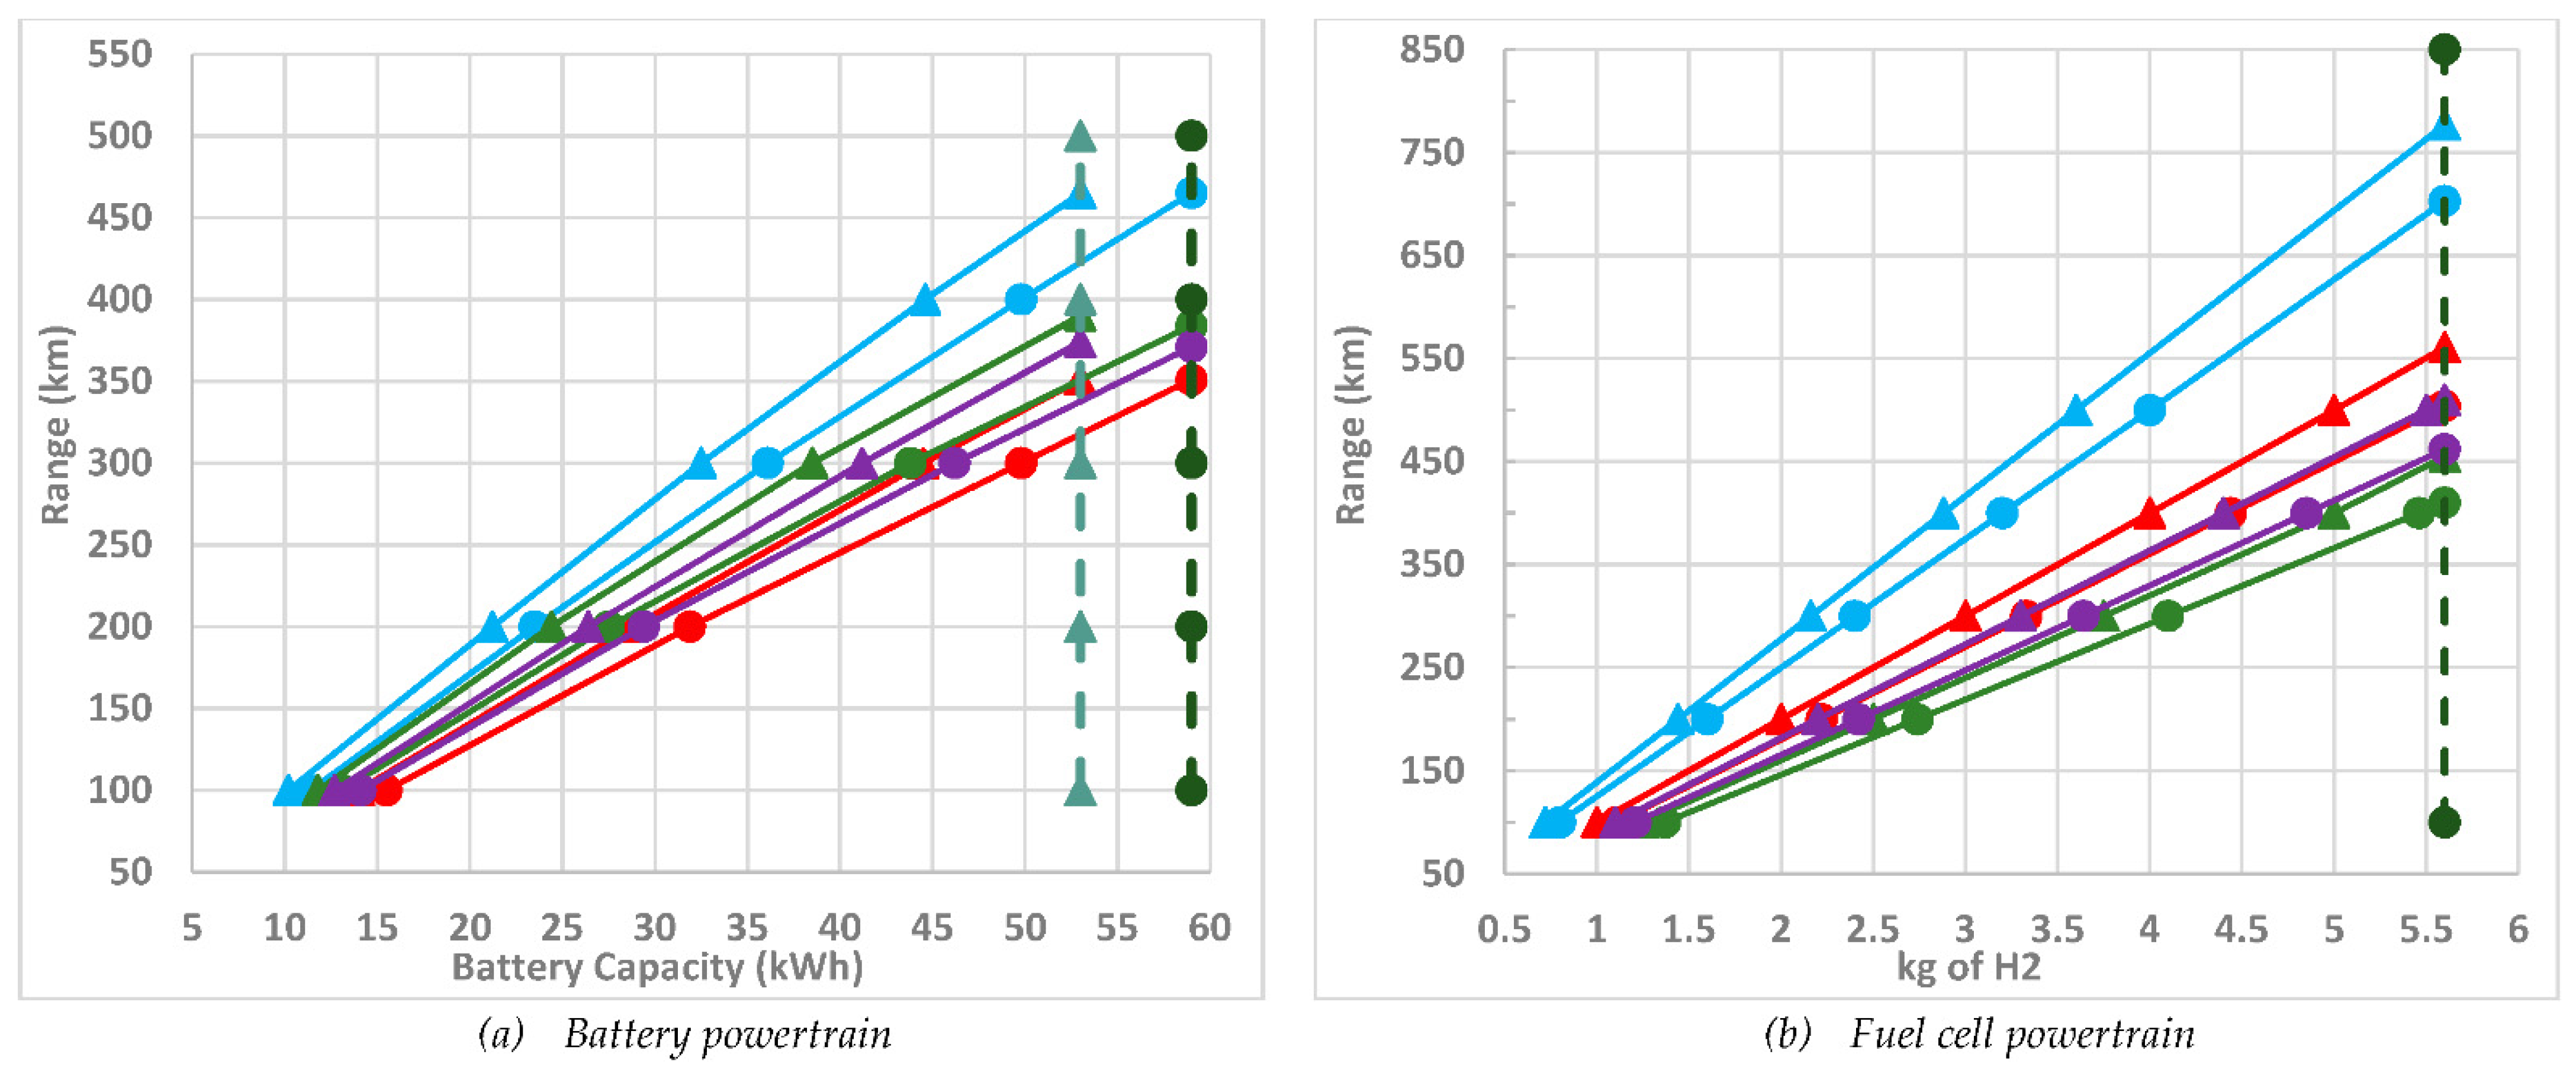
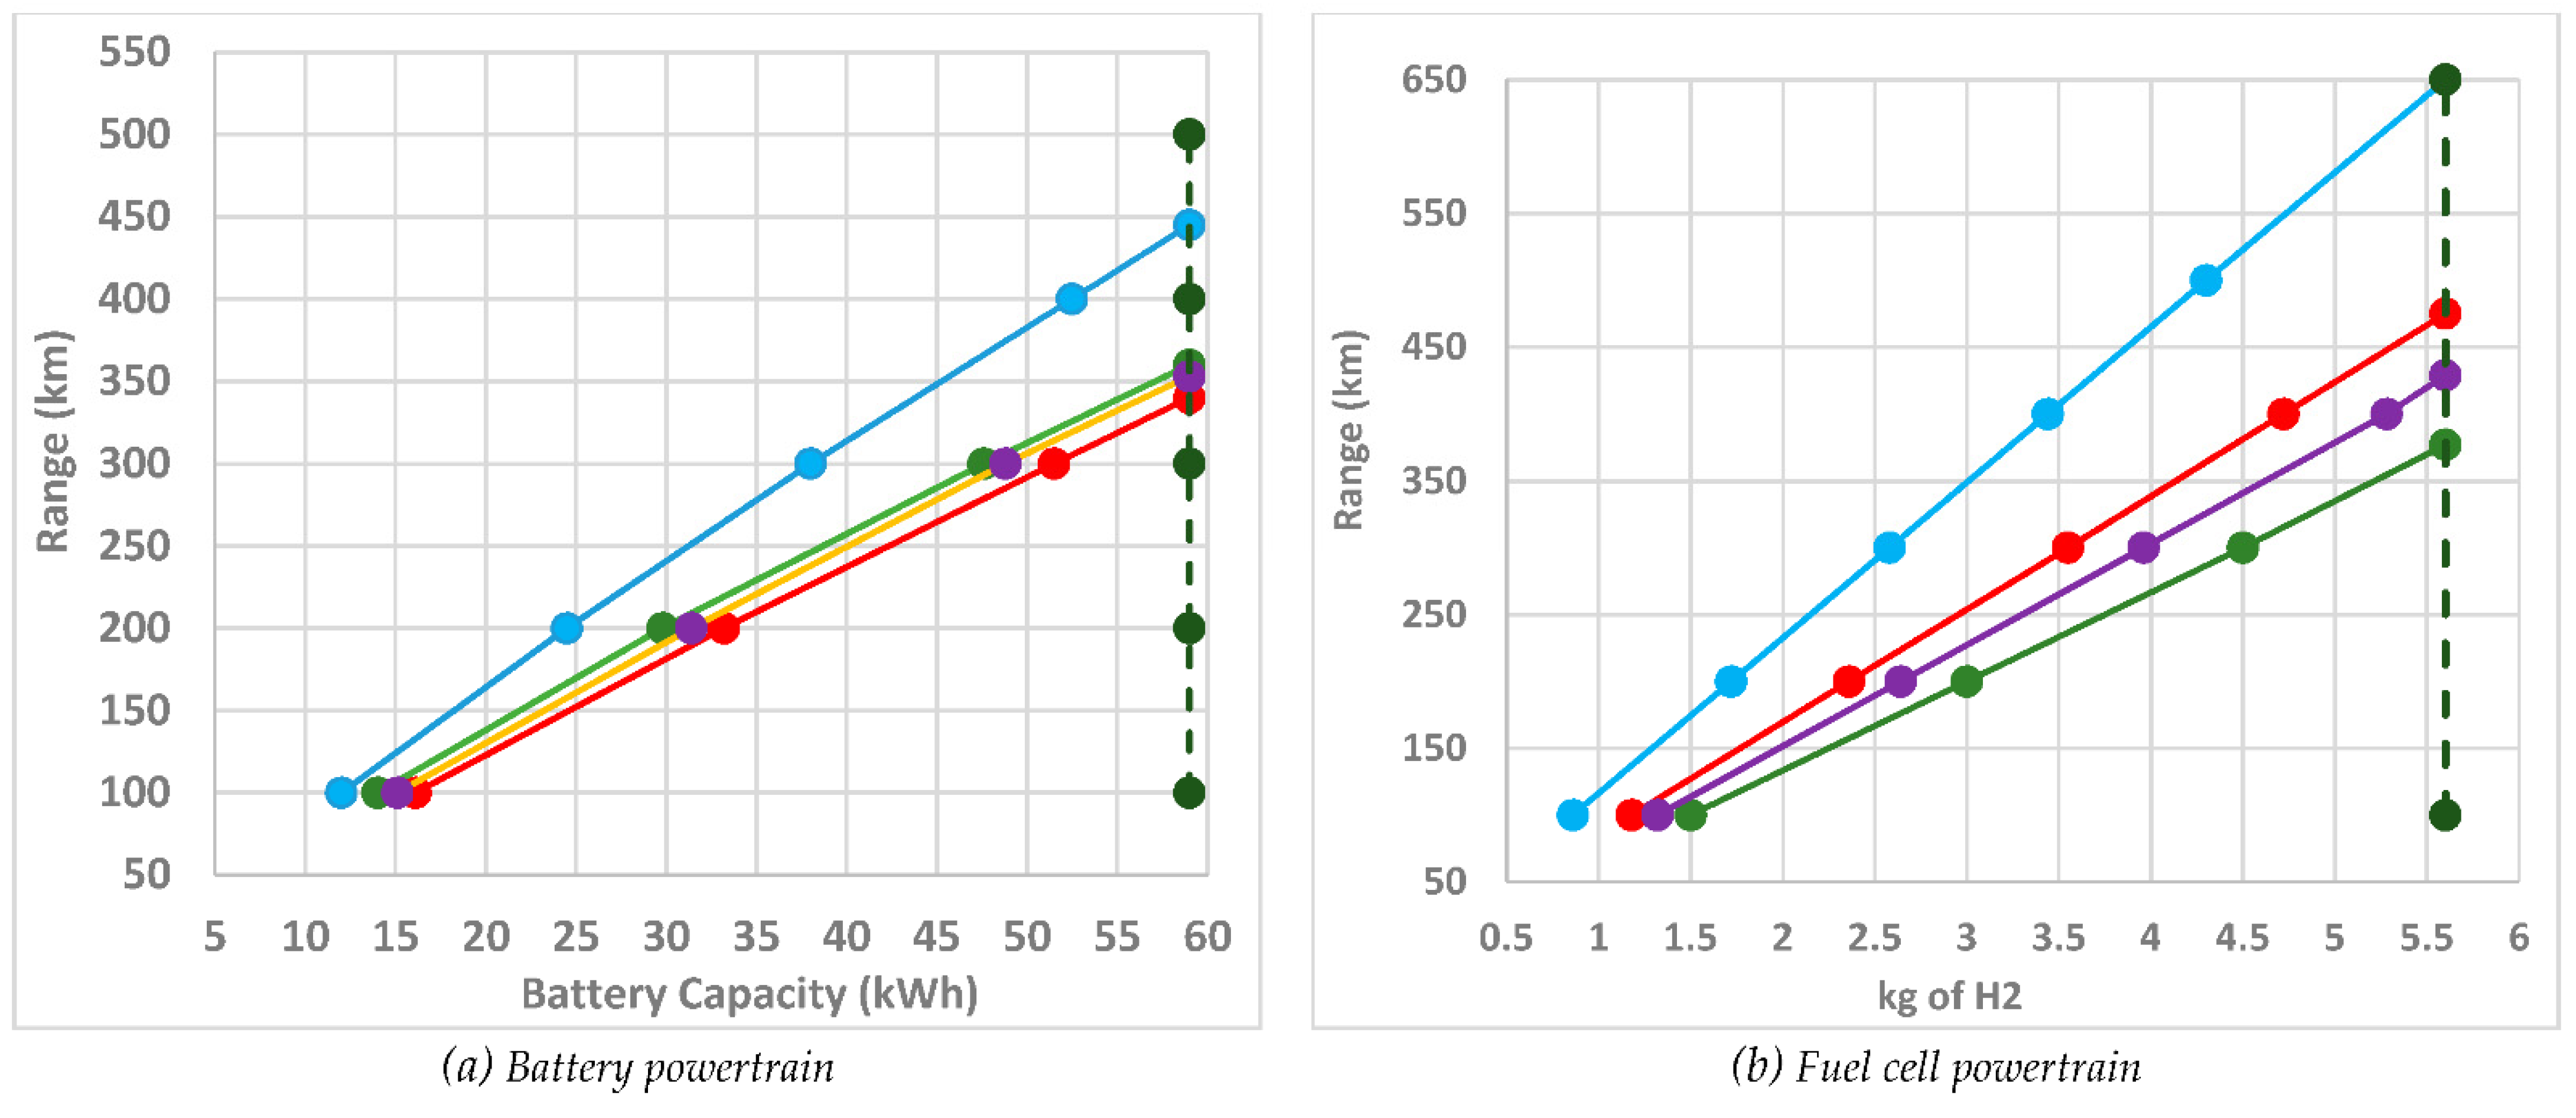
- Storage capacity assessment per vehicle type for diverse ranges with different payloads: The range is one of the key factors that affect the worldwide sales of EVs. The manufacturers test the vehicle segments with certified drive cycle under strict test conditions and only by considering 1 passenger as the driver. However, in real-world conditions, the performance varies drastically. Users do not follow certified drive cycle accelerations and face diverse road topography profiles, justifying the analysis through real-world drive cycles. Along with this, vehicle payload is aggravated in on-road conditions according to usage patterns, since vehicles can be fully or partially occupied. The vehicles presented in Table 1 are studied for various drive cycles described in 
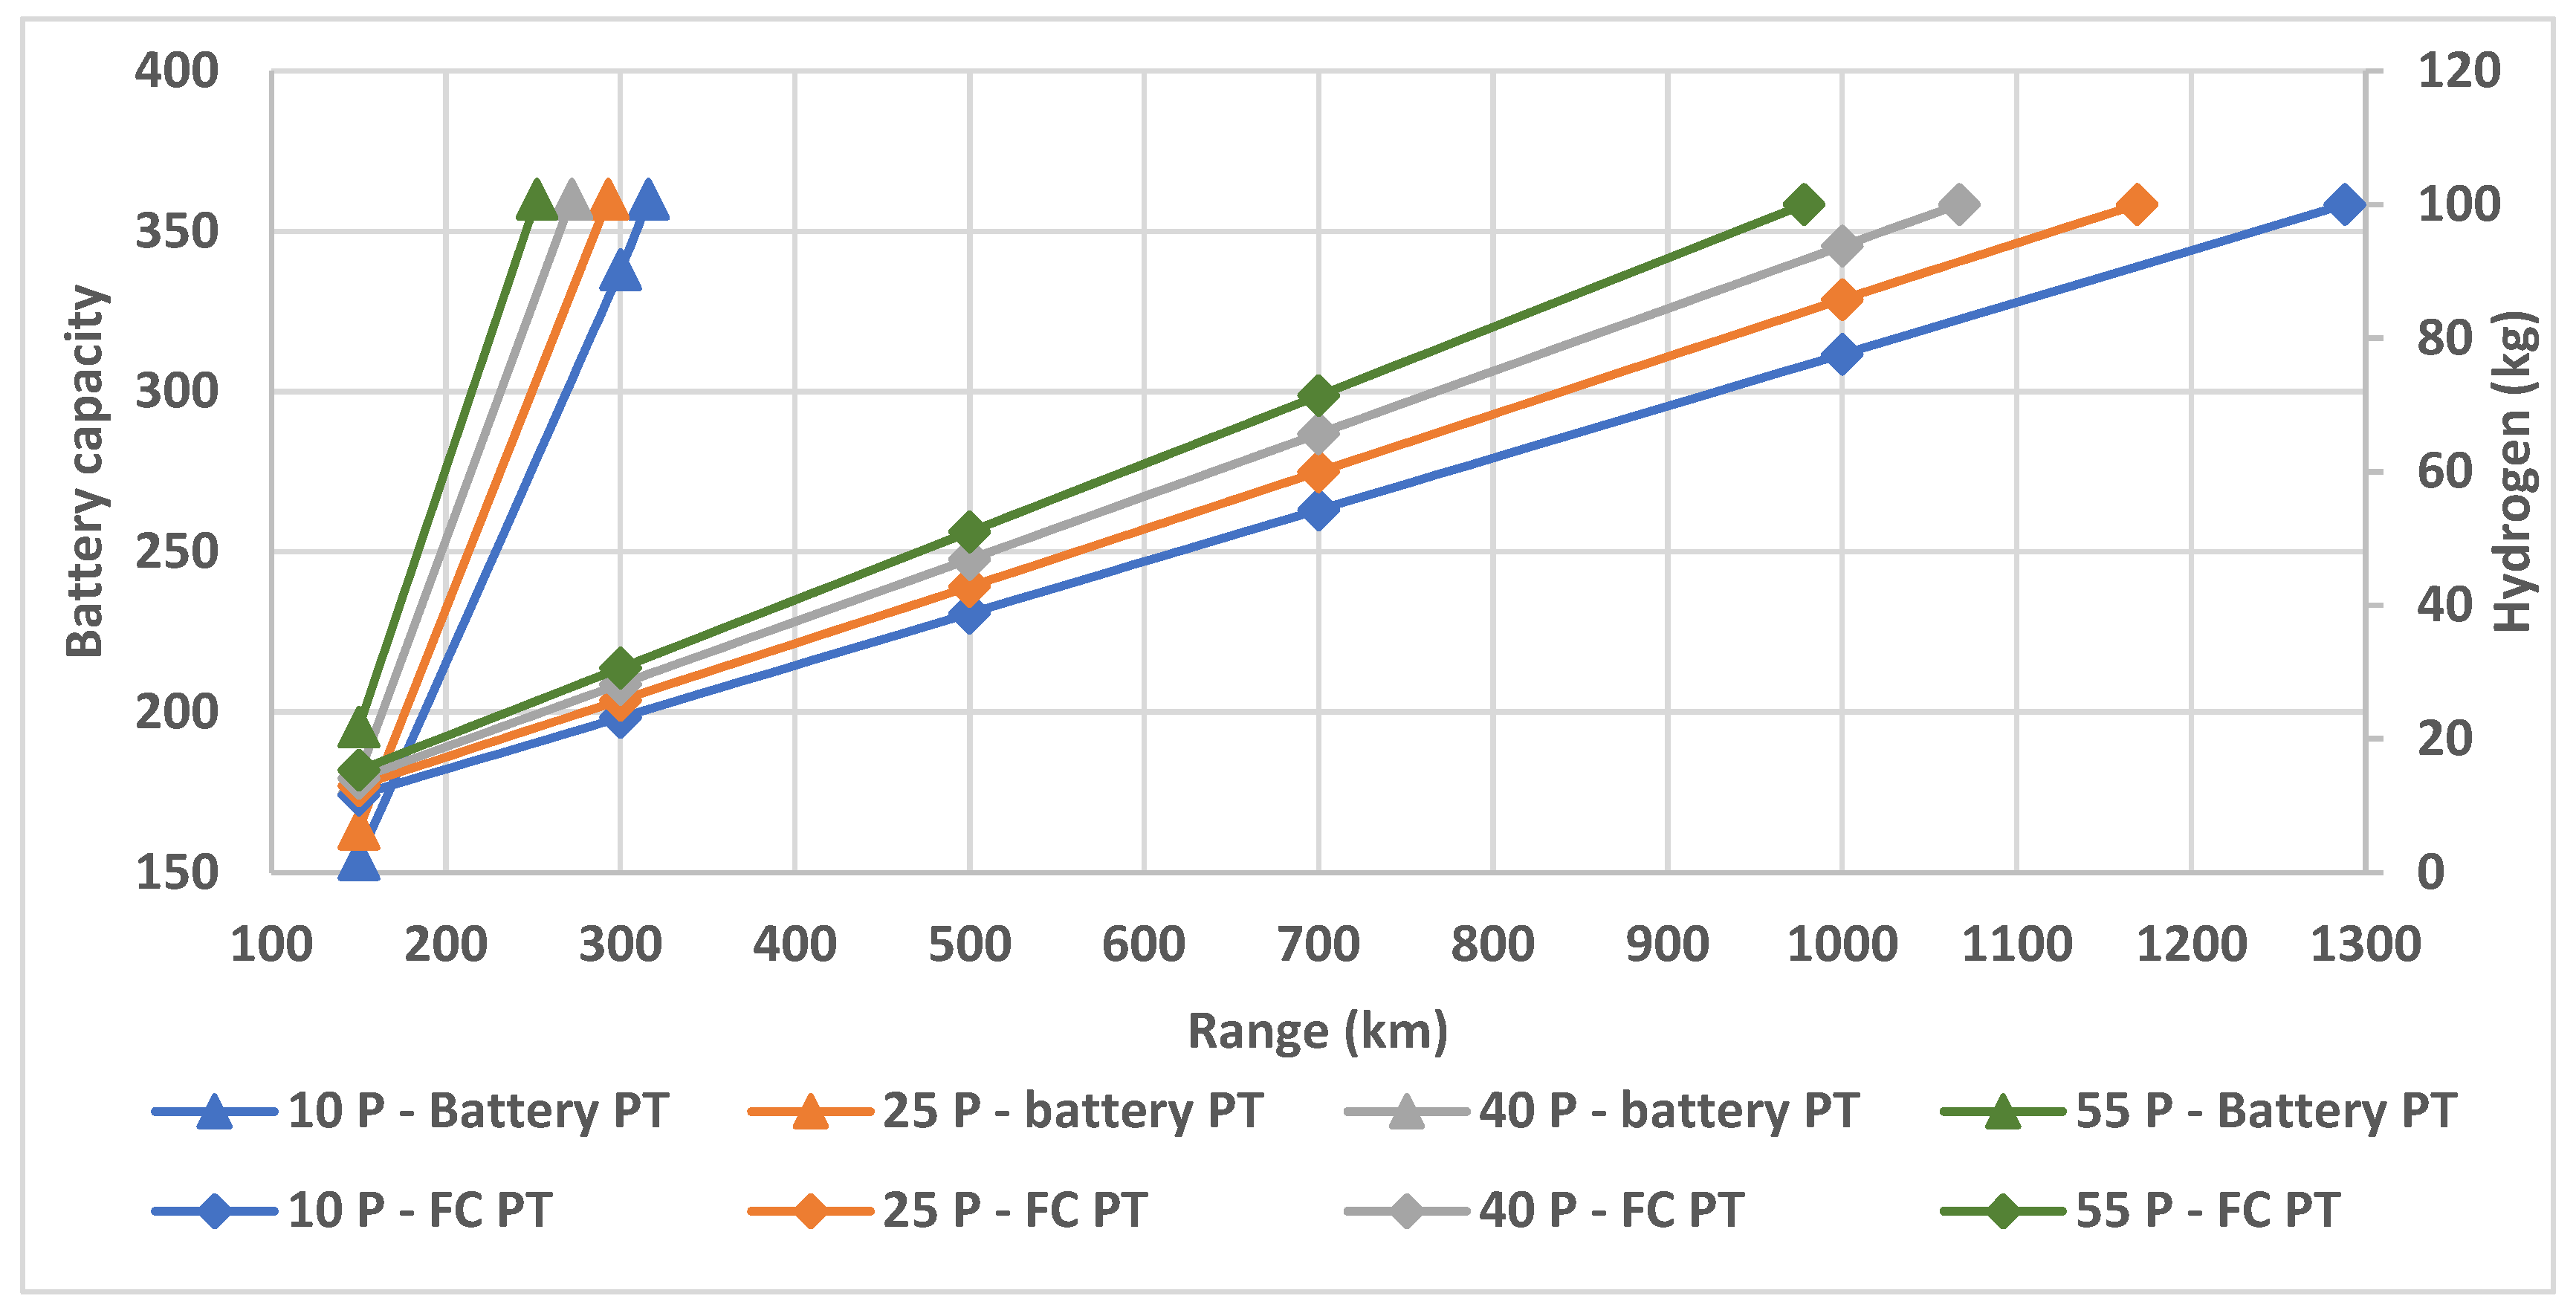
Section 2.2 for the different payloads of 150, 250, 350, and 500 kg for light-duty vehicles. For the electric bus, simulations were carried out for 10, 25, 40, and 55 passengers considered as payload, while for the semi-truck 25%, 50%, 75%, and 100% of maximum payload capacity were considered.
From the analysis of existing BEV in the market, the average battery mass of the vehicle is estimated as 32% of the vehicle curb mass without the battery [39,40]. Assuming state of art batteries in forthcoming vehicles, an optimistic value of 35% is considered as the maximum energy storage mass. Furthermore, for bus and semi-truck, the ratio changes to 26% and 42% respectively [41]. Table 3 shows the maximum battery mass for each vehicle segment and respective battery capacity based on the allocated battery mass and also the specifications assumed for the FCPT.
The average battery mass is considered as 8 kg/kWh, which is also estimated from the battery pack to weight ratio from the BEV available in the market [10,40]. For fuel cell vehicles, the maximum hydrogen storage in the FCEV at present for the light-duty vehicle is 5.6 kg [42], which is also assumed for the light-duty vehicle simulations. For heavy-duty vehicles, a 100 kg H2 storage capacity is considered, inspired by the latest long-range heavy-duty vehicle launched by Nikola Motors (Nikola 2 semi-truck) [43]. Based on the hydrogen storage, the model estimates the storage tank mass, in addition to the vehicle mass.
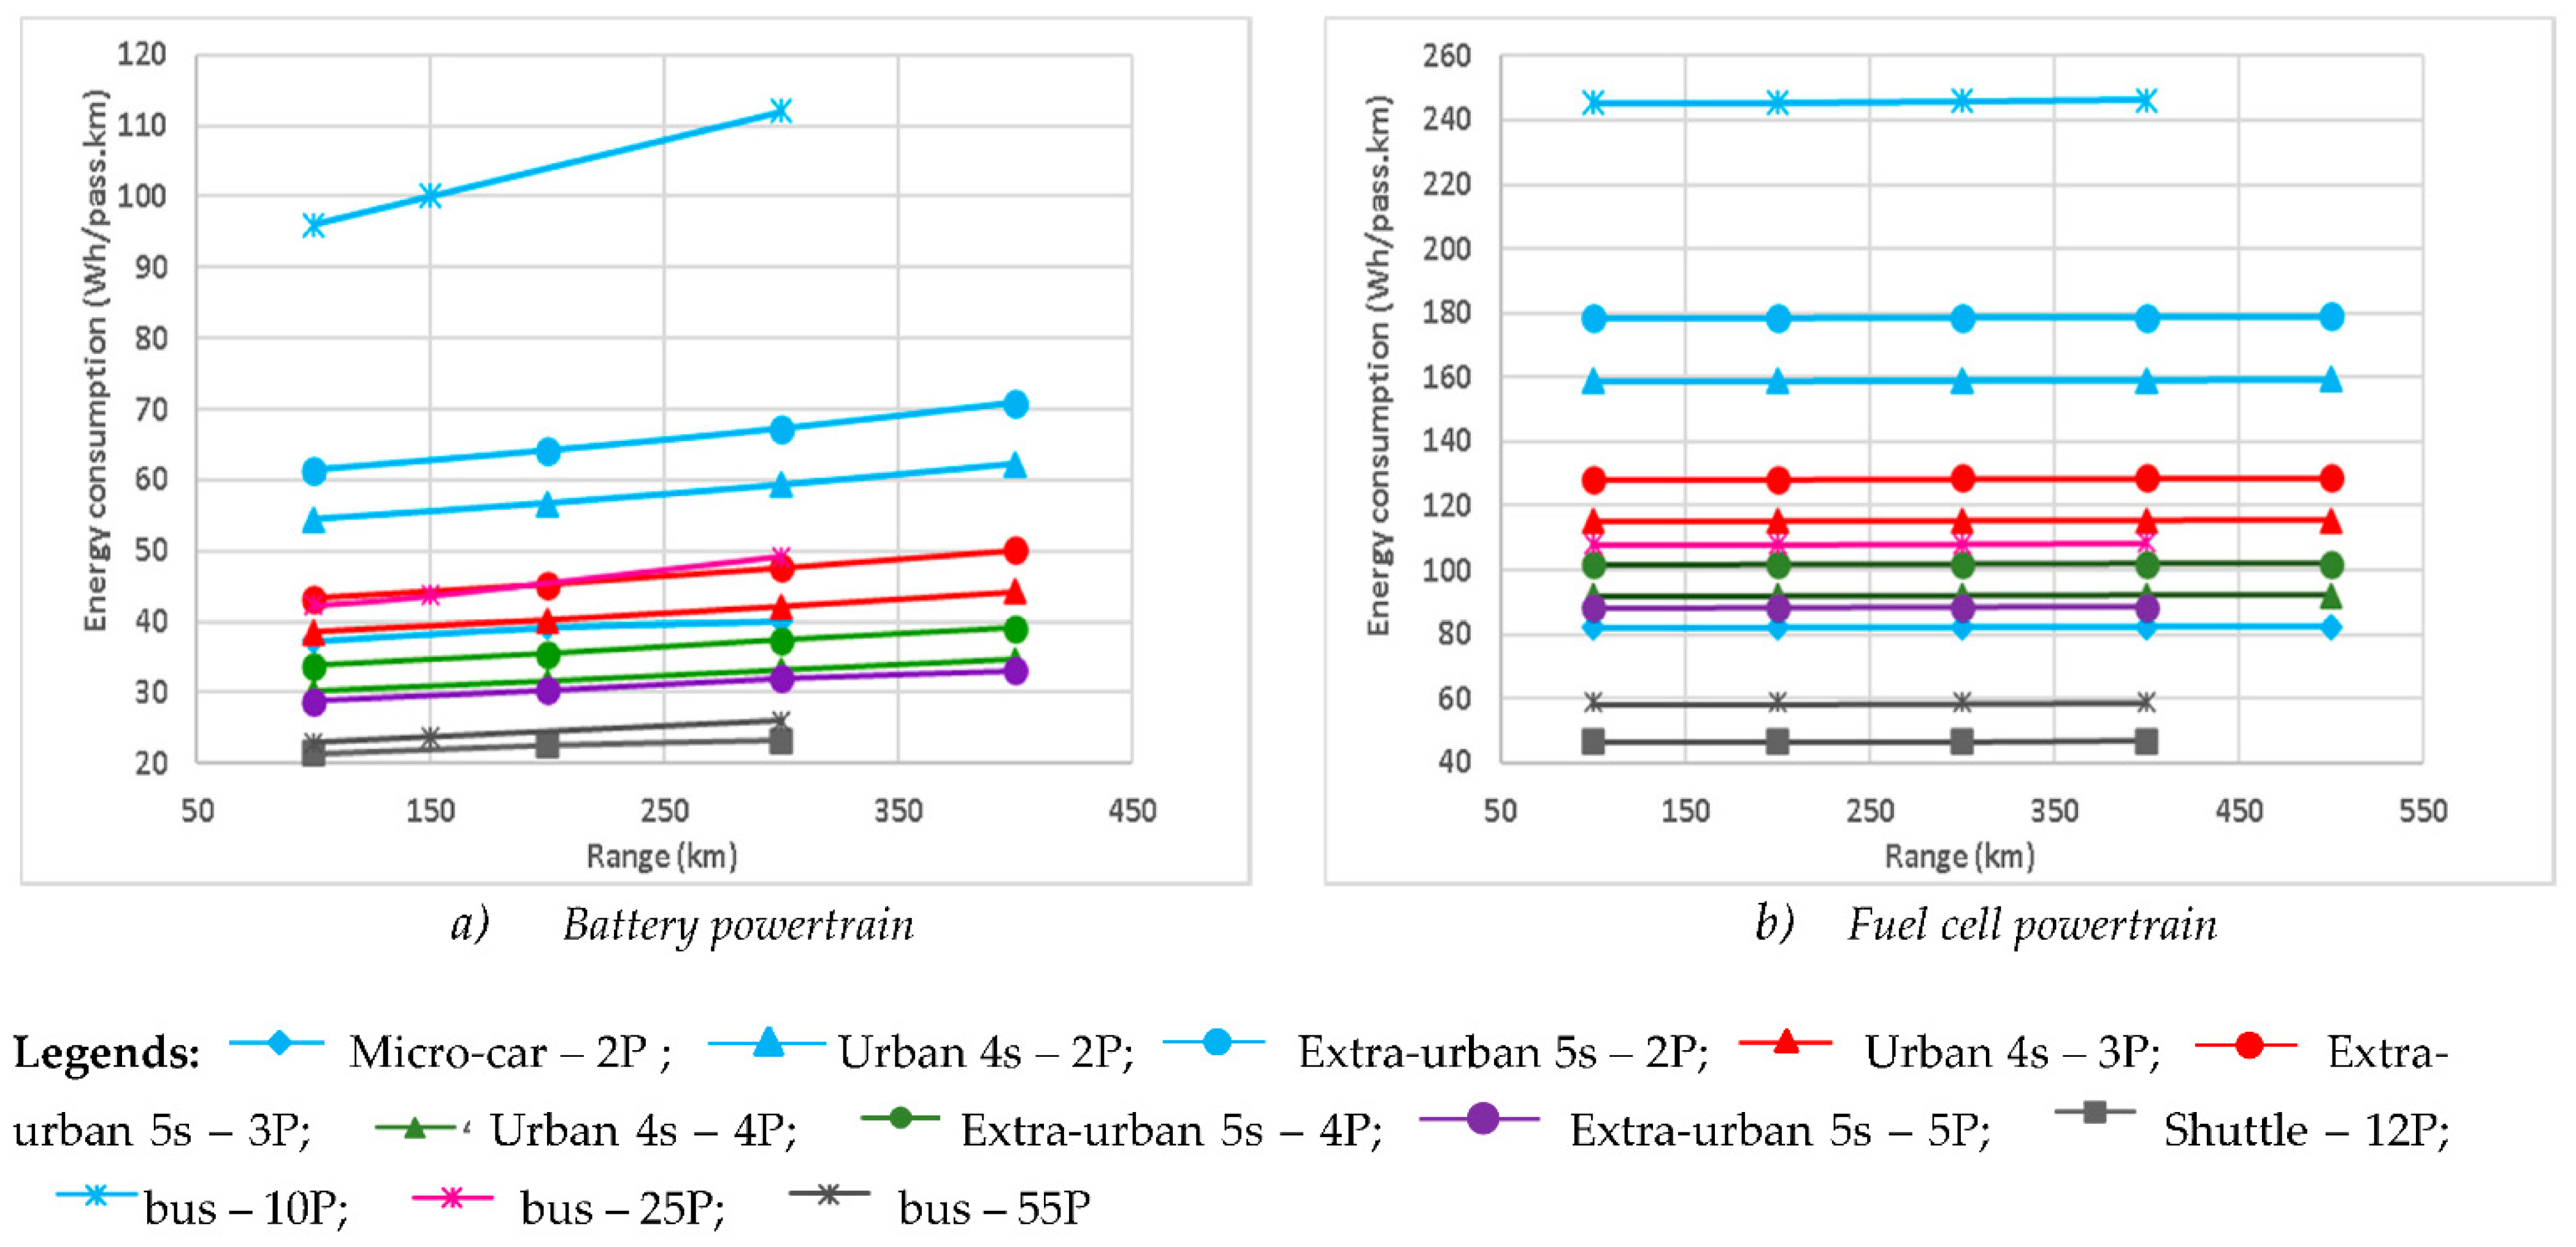
- Average energy consumption per km per person for different vehicle segments: It is to be noted that when we consider bigger vehicle types for transportation, presumably the average energy consumption will be higher than for the other smaller segments. By contrast, analyzing the number of passengers traveled, a five-seater vehicle may have the least average energy consumption for each passenger than a four-seater vehicle, which shows the five-seater vehicle has lesser average energy consumption per person. Although energy consumption per passenger is typically disregarded, it may retain significant importance in the future in the wider adoption of shared vehicle solutions. By analyzing the average energy consumption per person for unit distance, it is possible to identify the optimal vehicle segment selection based on the passengers.
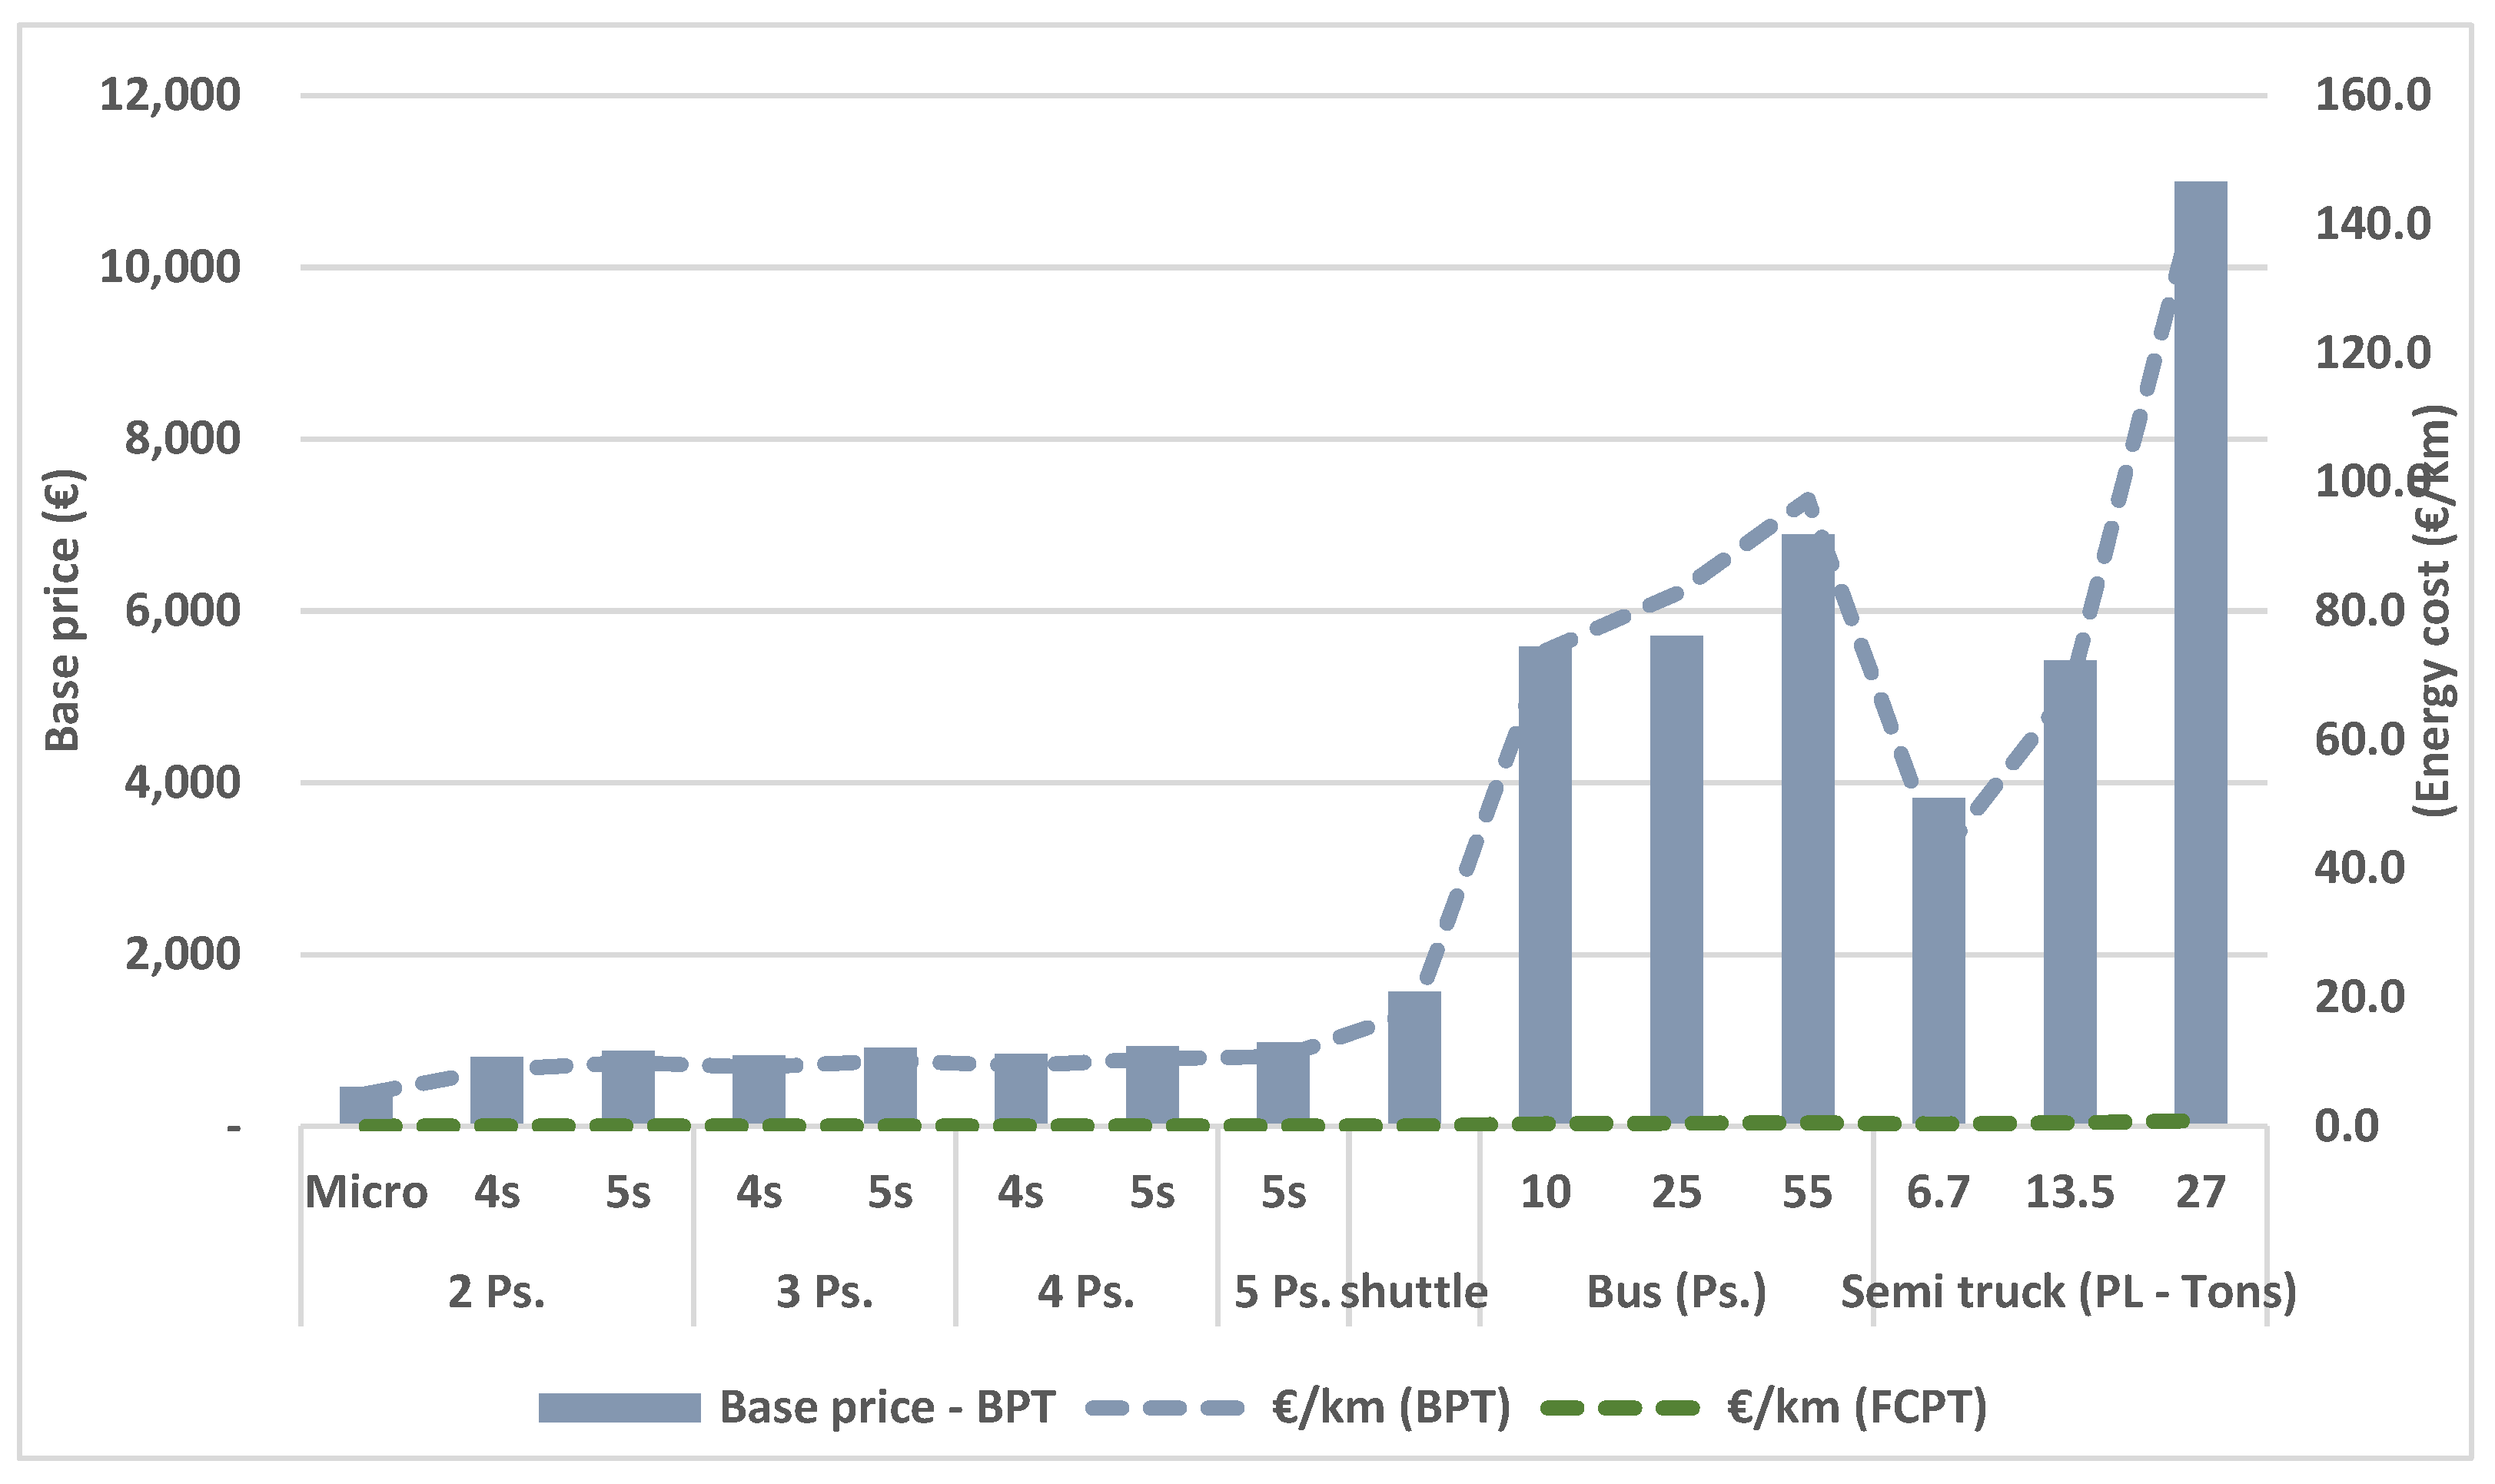
- Powertrain cost analysis on vehicle segments: The cost of the vehicle is one of the important decision factors from the user’s point of view before buying an EV. In the market, ICEV gained the title of most affordable vehicles, while FCEV is the most expensive option, considering the same vehicle category, sandwiching BEV in between [10]. However, for BEV and FCEV, the operation and maintenance cost is about 10–20% of the CAPEX, and ICE reaches up to 50%, which makes the total ownership cost almost equal to BEV over the vehicle’s lifetime [10]. In this study, powertrain cost analysis is carried out, where the spending for different energy storage options and operation cost is analysed for the whole trip and also for transporting per passenger or unit payload.
The cost assumptions were based on the literature. Currently, due to the limited vehicle production, the unit FC stack production cost is around 175 €/kW [10]. Increasing the production to 100,000 units/year can reduce the price below 60 €/kW [44]. In this study, mass production of FC units has been considered. As for the fuel price, 0.21 €/kWh is considered as the electricity price and 11.3 €/kg for hydrogen, while the average maintenance cost is considered as 0.018 €/km for both vehicles [10,45]. Hydrogen storage cost is also included in the cost analysis based on the energy storage assumed for these vehicle types [46]. Also, battery cost is estimated as 118 €/kWh presently [46]. Additionally, this study considers the technological growth in the future and it is estimated that the price of hydrogen fuel could be dropped by 60% and reach 6.5 €/kg in 2030 [47]. The battery would also become cheaper, with an estimated cost of 48 €/kWh in 2030 [46].

3. Results

The simulation model developed is tested for various vehicle types with distinct drive cycles for BPT and FCPT vehicles. Initially, the model is validated, and the analysis is carried out. The analysis is performed in two stages: the first stage includes the analysis of light-duty vehicles for distinct driving profiles and payloads and during the second stage the heavy-duty vehicle analysis is performed for both BEV and FCEV configurations.

3.1. Model Validation

The model validation is completed in two steps, initially for BEV and then for FCEV. The validation has been performed and is presented in the previous studies published by the authors [9,10]. WLTP class 3 drive cycle is employed for the validation, the result of the simulation is then compared against the laboratory test results. Seven different vehicle models available in the market from different vehicle manufacturers were tested with the certified drive cycle for the model validation. For FCEV, the simulation results of Toyota Mirai were compared with FTP 75 and HWFET laboratory test results. For heavy-duty vehicles (HDV), the City eGold bus was simulated with the real-world drive cycle and the results were compared with the recorded energy consumption. The vehicle specification such as vehicle dimension, vehicle mass, battery mass, and other parameters are given of the chosen vehicles, and results are tabulated in Table 4.
The comparisons results showed the simulation model results were reliable with a mean average error of 5% for light-duty vehicles and 2% for heavy-duty vehicles [9,10]. This shows the model is reliable and consistent.

3.2. Storage Capacity Assessment per Vehicle Type for Diverse Ranges with Different Payload

The range of EV is one of the critical variables when it comes to EV and, in this analysis, various types of vehicle are simulated with various drive cycles and payloads. It helps to estimate the energy storage requirement (battery capacity or quantity of stored H2) to reach certain range markers with each powertrain option. For light-duty vehicles, the vehicle is simulated with various payload mass ranges from 150, 250, 350, and 500 kg, which represents 2, 3, 4, and 5 passengers, respectively, along with maximum possible additional weights. Considering the maximum battery capacity and fuel cell specification from Table 3 it is possible to evaluate the energy storage required to transport a payload of 150 kg in different vehicle segments, considering the full BEV or FCEV configurations, following distinct drive cycles, as presented in Figure 2, Figure 3, Figure 4 and Figure 5. These show the energy storage requirements for the payloads 250, 350, and 500 kg, respectively.
The vehicles were simulated to reach a range marker of 100 km, 200 km, 300 km, 400 km, and 500 km and the results are plotted from Figure 2, Figure 3, Figure 4 and Figure 5. The simulations are extended to analyze the maximum range that can be traveled with the assigned energy storage capacity and are restricted after the vehicle reached its maximum possible distance with the maximum possible storage capacity.
Figure 2 shows the storage required for the transportation of two passengers for a Micro-car. We can observe that a Micro-car can reach an average distance of 270 km with an average energy consumption of 74 Wh/km. Whereas, Urban 4s or Extra-urban 5s vehicle reaches a higher cruise range of 430 km and 445 km with average energy consumption of 124 and 140 Wh/km, respectively. This points that the Micro-car would be ideal for 2 passengers, satisfying the drive cycle requirements and least energy consumption, and the state of art charging techniques give added advantages in reduction of charging time to a 13-kWh battery than for 53 or 59 kWh batteries.
Figure 3 and Figure 4 show the simulation results of vehicles transporting payload of 250 and 350 kg respectively. For payloads of 250 kg and 350 kg or 3 and 4 passengers, the Urban 4s and Extra-urban 5s vehicles can cruise almost to the same range, however, the Urban 4s transports the same passengers with lower energy consumption. For a payload of 500 kg, only the Extra Urban 5s vehicle type is simulated and Figure 5 shows the simulation results.
Legends: Vehicles 03 00041 i001 WLTP red.—Micro-car; Vehicles 03 00041 i002 WLTP red.—Urban 4s; Vehicles 03 00041 i003 WLTP red.—Extra-urban 5s; Vehicles 03 00041 i004 WLTP C3—Urban 4s; Vehicles 03 00041 i005 WLTP—Extra-urban 5s; Vehicles 03 00041 i006 RW_m—Micro-car; Vehicles 03 00041 i007 RW1—Urban 4s; Vehicles 03 00041 i008 RW1—Extra-urban 5s; Vehicles 03 00041 i009 RW2—Urban 4s; Vehicles 03 00041 i010 RW2—Extra-urban 5s; Vehicles 03 00041 i011 Micro-car—max capacity; Vehicles 03 00041 i012 Urban 4s—max capacity; Vehicles 03 00041 i013 Extra-urban 5s—max capacity.
On the other hand, looking at to FCPT for two passengers (Figure 2), a Micro-car can reach an average range of 690 km with 3 kg of hydrogen and 13 kW FC stack, while the Urban 4s and Extra-urban 5s vehicles with 5.6 kg of hydrogen and 130 kW FC stack reach an average distance of 660 and 590 km, respectively. The Micro-car reached a higher range of 690 km, due to its lower acceleration profile and total vehicle mass. Considering Urban 4s and Extra-urban 5s, the lower overall mass and same FC stack capacity and fuel stored, the Urban 4s can reach higher distances than the Extra-urban 5s. A similar trend can be observed from the results with different payloads in Figure 3, Figure 4 and Figure 5.
Table A1 shows in detail the average energy consumption, range, and regenerative braking energy produced for different vehicle segments with distinct drive cycles for variable payloads. Comparing FCPT and BPT, we can observe that for longer distances, battery capacity has to be increased and at a certain point. Due to chassis load capacity and safety factors, the battery capacity cannot be increased. This limits the range of BEV to 400 km or less with real-world drive cycles. By contrast, FCEV only requires extra fuel space, which has less influence on total vehicle mass and the chassis load capacity and thus can easily achieves 600 km range and more with real-world drive cycles.
The simulation was equally performed for the shuttle, bus, and semi-truck. Figure 6 shows the simulation results of the shuttle vehicle, considering a payload of 1000 kg or a total of 12 passengers. It can be seen that, with a maximum allowed battery capacity of 70 kWh, the vehicle can only move up to an average of 270 km, while with the FCPT the vehicle can drive 80 km more only with assumed H2 storage of 5.6 kg. Considering the application of the vehicle, assuming extra hydrogen storage with FCPT is practically executable and explainable, the vehicle can reach a longer range without any burden to the existing total vehicle mass.
For the bus, the simulation is carried out with a variable number of passengers. The payload is considered as 10, 25, 40, and 55 passengers accordingly. Figure 7 shows the simulation results obtained, showing that with the maximum battery capacity of 360 kWh, the bus can only travel to 315 km with 10 passengers and up to 250 km with a maximum capacity of 55 passengers. As for the FCPT, 100 kg of H2 enables the vehicle to cruise for 1300 km with 10 passengers and to 980 km with 55 passengers, which is almost four times the range than the BEV configuration.
Considering the distance of the drive cycle (73.1 km) and assuming full capacity throughout the journey and three trips per day, the full BEV configuration would require a recharging event after each day. In the FCPT, refueling is only required once in 4 days, or after 13 trips. This analysis shows the advantages of the requirement of FCPT in bus or heavy-duty vehicles.
For the semi-truck, the simulations were carried out for various payloads: 25%, 50%, 75%, and 100% of the maximum payload capacity. Figure 8 shows the simulation results of the model for the various payload with the real-world drive cycle.
From Figure 8, it can be observed that with the BPT, with the maximum load, the vehicle can only reach up to 240 km with a battery pack of 520 kW while with half load, the vehicle can reach up to 450 km. While presenting a similar trend for the FCPT, the truck can cover a distance of 612 km with a full load and 1030 km with a half load. Table A1 shows in detail the average energy consumption, range, and regenerative braking energy produced for different vehicle segments with distinct drive cycles for variable payloads.
This study shows the influence of payload mass on the vehicle performance and range of the vehicle. This shows that the type of service and mobility patterns to be performed are crucial variables that influence the decision to choose an adequate energy storage option.

3.3. Average Energy Consumption per km per Person for Different Vehicle Segments

This study aims to analyze the average energy consumption/km for each passenger transported, to identify the most efficient transportation mode. As we observed in the reduction of range with the increased number of passengers, this study validates how beneficial it is to have an extra passenger compared to having an extra vehicle on the road.
Figure 9 shows the average energy consumption/km per passenger for the above-specified vehicle types. The average energy consumption data from the real-world drive cycle simulation is used for this analysis.
Initial observation shows both BPT and FCPT have a similar trend with the average energy consumption/km for each passenger. Looking into the results, we can observe that for two passengers, the Micro-car is the optimal vehicle with the least energy consumption compared to other vehicle types. Considering the Urban 4s and Extra-urban 5s, Urban 4s only consumes less energy for different payload scenarios. However, for mass transportation of passengers, that shuttle is much more efficient than using multiple vehicles of any other category.
While including the bus in this analysis, the results show that with 25% of the capacity, i.e., with 10 passengers, the energy consumption per passenger is the highest among the other vehicles. Having an occupancy of 45%; with 25 passengers, the average consumption is nearly equal to that of Urban 4s and Extra-urban 5s. Though, with full occupancy of 55 passengers, the energy consumption is the least.
Considering the two different powertrains, unquestionably BPT consumes less energy due to its high tank-to-wheel efficiency. The low efficiency and wastage of regenerative energy due to the smaller secondary battery in FCEV reduce the potential of acquiring the fullest regenerative braking energy potential.
This analysis shows that fewer passengers can promote a lighter vehicle, such as Micro-car, which has better performance characteristics than a light-duty EV. On the other hand, choosing a five-seater car for four people would not be ideal, as the simulation results show that the Urban 4s and Extra-urban 5s vehicles can reach the same range, but Urban 4s vehicle consumes lesser energy per passenger. In terms of powertrain, FCPT is superior to BPT by providing a longer range with easier refueling procedure, even though BPT has the least energy consumption.

3.4. Powertrain Cost Analysis on Vehicle Segments

The previous study in Section 3.2 and Section 3.3 showed despite the lower energy efficiency than its counterpart, FCEV can reach almost double the range of BEV. Even though this is a significant part, the number of FCEV vehicles in the market is not even 1% compared to the BEV in the market. This is justified by the higher purchase costs of FCEV and also the lack of hydrogen refueling stations. Nonetheless, the recent European push for green hydrogen towards the decarbonization of society may help to alleviate some of the barriers in the transition to hydrogen. In this analysis, the average energy cost spent to cover a unit distance with a different powertrain is estimated for the vehicle segments.
Table 5 shows the cost associated with traveling to a targeted distance with different powertrains. The base price is defined as the initial energy storage price requirement to reach 100 km. For BPT, the cost of battery capacity required to reach 100 km is calculated and, for further travel, the additional battery cost is estimated for each additional kilometer. As for the FCPT, unit cost includes the fuel cell stack cost and fuel cost to reach an initial 100 km and, for further travel, only fuel is required, thus the hydrogen cost.
From an initial glance through the results, it can be observed that the base price of the BPT for microcar is nearly one-third that of the FCPT. While looking on to the energy expense to cover a 1 km distance in addition to the base expense, BEV owners have to pay more when compared to FC vehicle owners. This is because, for BPT, an additional battery has to be mounted along with the energy cost, while for FCPT, only fuel cost is included and the higher net calorific energy value of hydrogen (33.33 kWh/kg [48]) help to reduce the cost further down. Further studies were performed to analyze the cost breakdown for the transportation of each passenger with different vehicle types in BEV and FCEV configuration as shown in Table 6.
Table 6 shows the energy cost breakdown per passenger/km and we can see that the base price of the powertrain goes down for unit passengers as with more passengers. Considering the full capacity of the bus, BPT costs 246 €/km as the base cost, while with fuel cell the base cost becomes 578 €/km, which is comparable. In addition to this, taking into consideration the fuel expense for the rest of the journey, it can be estimated that the FCPT bus becomes more economical than its counterpart accounting for the total operating lifetime.
For the semi-truck, instead of the cost to travel unit distance with 1 passenger, the cost for transporting 1 ton to unit distance is estimated. From the results, it can be observed that at full load, the base price per ton of cargo is 50% more with FCPT in trucks, while transportation cost per km apart from the powertrain cost is cheapest at 7 cents/km. While considering half load, the base cost is almost triple, however, sizing the FC stack to transport the corresponding load drastically reduces this base cost. However, it requires personalized FC stack sizing, which reduces the flexibility to transport wide payload ranges.
Accepting the possibility of price reduction in the future for battery, hydrogen fuel cost and electricity price reduction, the base price and cruise expense for unit distance are expected to reduce even further. Figure 10 shows the variation in the price range for different vehicle types against the results in Table 5.
Figure 10 shows cost analysis with reduced battery pack and fuel prices. It is to be noted that the base price of FCPT is not included. This is due to that the fuel cell stack price solely depends on the number of units produced and since the technology is still at its initial development phase, the future production cannot be estimated and thus the stack price. A well-developed battery sector enables us to estimate the battery production for the future and thus the cost. From the results, it can be observed that the reduction in battery price nearly cut down the base price and cruise expense/km by half. Nonetheless, it can be seen that the reduction of hydrogen price reduces the cruise expense even further down by 50%, and enables semi-trucks with a full load to cruise under 1 €/km.
Soon, when vehicles become customized based on storage requirements, this slight change in price for each kilometer will generate a broader difference in the vehicle’s CAPEX. Assuming these favorable conditions, this will increase the unit FC stack production, which will reduce the cost even further from 60 €/kW, which can bring down the base price of FCEV.

4. Discussion

This study aims to assess BPT and FCPT vehicle performance in real-world conditions, evaluating range and energy consumption for various vehicle segments with real-world drive cycles and with variable payloads. A simulation model was developed in MATLAB using Simulink, by defining different vehicle type models and dimensioning the efficiency of the various components involved. This enables estimating the energy consumption under different real-world driving conditions. The model was previously validated [9] and ensured reliability with an error of 5% for light-duty vehicles and 2% for heavy-duty vehicles.
The results from Section 3.2 and Section 3.3 indicate that choosing vehicle segments based on the number of passengers results in the least energy consumption. For two passengers, a Micro-car is advised with energy consumption less than 60% compared to other vehicles, along with the least energy consumption per passenger. While for three and four passengers, the Urban 4s is suitable with a maximum range same as Extra-urban 5s, with less energy consumption; and for five passengers the Extra-urban 5s is adequate. The result showed Urban 4s and Extra-urban 5s vehicles can reach almost a similar distance with their respective full battery capacity, which shows that choosing the proper vehicle segment helps to reduce the CAPEX, OPEX, and battery charging time. Also, the result showed it would be beneficial to consider a medium-duty vehicle for a group of passengers rather than employing multiple light-duty vehicles. To transport more than 25 passengers, the bus would also be a better option, while having multiple shuttles can also be considered.
Considering the different powertrain options, the FCPT showed remarkable results compared to BT, where the former reached an average range of 600 km or more in all different drive cycles with full fuel capacity, while the latter only cruised nearly 350 km on average. On analyzing the operational cost based on powertrain selection for unit distance, FCEV remains the most expensive option with a base cost two to eight-fold that of the BEV based on vehicle types. However, FCEV showed remarkable results with an average operating energy cost between 7 cents/km to 2 €/km, where BEV cruise energy cost ranges between 10 €/km to 290 €/km in addition to the base cost. Also, it is worth noting that considering full occupancy in bus, the base cost per person for FCPT would be just 60% more when compared to BPT, and taking the operating cost into account, FCPT would be more economical. Real-world drive cycles testing with variable payload showed that the FCPT would be ideal for a heavy-duty vehicle for long-range operations against its cost as with full payload capacity, even though the base cost is 50% more with FCPT than BPT, the operational cost is around 1.2 €/km for FCPT compared to 300 €/km with BPT.

5. Conclusions

This paper presents an assessment of vehicle performance in real-world conditions with variable payloads despite the claims from the vehicle manufacturers. This difference in claimed vehicle performance to real-world performance will open opportunities for other vehicle segments which are considered as the model for this study. Consequently, these different vehicle types must be seen as complementary (and not competitive) according to usage and payload requirements, meaning that we may be transitioning to more tailor-made and not generalized solutions. In the future, manufacturing customized vehicles would improve the support from the automotive sector towards sustainable goals. Subsequently, this work provides guidelines to all the former mentioned forecasts towards a more sustainable automotive industry.
Future work will be performed in accounting for the volumetric constraints related to the hydrogen storage and thermal management requirements associated with these systems, which are not accounted for in this paper.

Author Contributions

Conceptualization, P.B., S.S.; methodology, P.B., S.S.; software, S.S.; validation, S.S.; formal analysis, P.B., S.S.; investigation, S.S.; data curation, S.S.; writing—original draft preparation, S.S., P.B., A.M., F.M.; writing—review and editing, S.S., P.B., A.M., F.M.; supervision, P.B., A.M., F.M.; project administration, A.M., F.M.; funding acquisition, A.M., F.M. All authors have read and agreed to the published version of the manuscript.

Funding

This research was funded through a scholarship by Project PAC (LISBOA-01-0247-FEDER-046095). This work was also supported by Fundação para a Ciência e Tecnologia, through IN+ (1801P.00962.1.01-IN+ UIDP/EEA/50009/2020-IST-ID) and grant number CEECIND/02589/2017.

Acknowledgments

Thanks are also due to Projects Baterias 2030 (LISBOA-01-0247-FEDER-046109), and C-TECH (LISBOA-01-0247-FEDER-045919).

Conflicts of Interest

The authors declare no conflict of interest.

Appendix A

Figure A1. Real-world drive cycle 1 (duration: 1800 s). Real-world drive cycle 1 (RW1) for light-duty vehicles (Urban 4s and Extra-urban 5s).
Vehicles 03 00041 g0a1
Figure A2. Real-world drive cycle 2 (duration: 1880 s). Real-world drive cycle 2 (RW2) for light-duty vehicles (Urban 4s and Extra-urban 5s).
Vehicles 03 00041 g0a2
Figure A3. Real-world drive cycle for micro-car/shuttle (duration: 14,004 s). Real-world drive cycle (RW_m) for Micro-car/Shuttle vehicle.
Vehicles 03 00041 g0a3
Figure A4. Modified WLTP class 3 drive cycle (duration: 1800 s). Modified WLTP class 3 drive cycle for Micro-car/shuttle (maximum speed limited to 55 kmph).
Vehicles 03 00041 g0a4
Figure A5. Real-world drive cycle for Bus (duration: 13,353 s). Real-world drive cycle (RW_b) for Bus.
Vehicles 03 00041 g0a5
Figure A6. Real-world drive cycle for Semi-truck (duration: 11,027 s). Real-world drive cycle (RW_st) for semi-truck.
Vehicles 03 00041 g0a6
Table A1. Simulation results of different vehicle segments with distinct drive cycles.
PLDrive CyclePower Train100 km200 km300 km400 km500 km
VehABC ABC ABC ABC ABC
150WLTP red.BEVMicro car58.510.126Micro car60.930.1312.3Micro car63.570.1319.1Micro car---Micro car---
FC133.80.120.4133.90.120.81340.121.2134.10.121.6134.30.122
RW_mBEV74.650.847.578.450.9415.880.210.9819.5/243 km------
FC164.50.880.48164.60.880.95164.70.881.42164.80.881.9164.90.882.37
WLTP red.BEVUrban 4s91.530.479.3Urban 4s94.080.5119Urban 4s96.730.5429Urban 4s99.660.57640Urban 4s102.70.6251.5
FC197.50.450.62197.50.481.23197.60.451.85197.70.452.47197.80.453.08
WLTP C3BEV130.80.6613.3134.80.7427139.10.8142142.30.8753/372 km---
FC287.50.620.9287.60.621.8287.70.622.7287.80.623.6287.90.624.5
RW 1BEV102.51.3510.5107.21.4421.6112.71.5433.91191.6547.6121.51.6953/436 km
FC333.70.651.06333.90.652.12334.20.653.8334.40.654.24334.70.655.3
RW 2BEV115.51.2811.8119.81.3724124.61.4937.4130.11.6152.1---
FC302.10.790.96302.30.791.92302.50.792.88302.60.793.84302.90.794.8
WLTP red.BEVExtra Urban 5s104.60.5310.6Extra Urban 5s107.70.5621.8Extra Urban 5s1110.633.4Extra Urban 5s114.60.6546Extra Urban 5s118.50.6959.5
FC226.70.490.71226.80.491.42226.90.492.132270.492.84227.10.493.55
WLTPBEV145.80.7414.6150.30.8230.2155.20.946.8159.90.9659/371 km---
FC321.90.691.023220.692.04322.10.693.06322.30.694.08322.50.695.1
RW 1BEV116.41.4812.2122.11.5924.8128.71.6938.8136.71.855.2---
FC374.70.691.2374.90.72.4375.20.73.6375.50.74.8375.70.75.6/473 km
RW 2BEV129.41.3913134.61.5127140.31.6342.11471.76559---
FC339.20.851.08339.40.852.16339.60.853.24339.80.854.33400.855.37
250WLTP red.BEVUrban 4s98.110.539.9Urban 4s1010.5720.4Urban 4s104.20.631.5Urban 4s107.40.6443Urban 4s110.30.6853/480 km
FC218.40.460.68218.40.461.36218.50.462.04218.60.462.73218.70.463.41
WLTPBEV135.60.7513.6139.80.8228.2144.30.943.4147.10.9553/360 km---
FC303.70.660.96303.90.661.923040.672.88304.10.663.84304.30.664.8
RW 1BEV109.81.4911.2115.21.5923.2121.41.6936.5128.61.851.5---
FC365.30.661.16365.60.662.32365.80.663.48366.10.664.64366.30.665.6/485 km
RW 2BEV121.41.4112.4126.11.52425.3131.51.6439.6136.71.7553/388 km---
FC326.40.81.05326.60.82.09326.90.83.133270.84.16327.30.85.2
WLTP red.BEVExtra Urban 5s109.30.5811Extra Urban 5s112.60.6222.6Extra Urban 5s116.10.6635Extra Urban 5s119.90.748Extra Urban 5s123.20.7459/478 km
FC242.60.50.76242.60.51.51242.70.52.27242.80.53.04242.90.53.8
WLTPBEV150.70.8315.2155.50.9131.3160.60.9948.4163.91.159/360 km---
FC339.10.721.07339.20.722.14339.30.723.21339.50.724.28339.60.725.35
RW 1BEV124.11.6212.8130.41.7226.11381.8341.51471.9659---
FC406.90.711.3407.10.712.6407.50.713.9407.70.715.24080.715.6/435 km
RW 2BEV135.71.5313.9141.31.6528.3147.71.7844.5153.71.8959/384 km---
FC363.90.861.15364.10.862.3364.30.863.45364.60.864.6364.70.875.6/486 km
350WLTP red.BEVUrban 4s101.70.5810.2Urban 4s104.80.6121.22Urban 4s1080.6532.5Urban 4s111.80.6944.6Urban 4s1140.7153/465 km
FC230.40.470.72230.40.471.44230.60.472.16230.60.472.88230.70.473.6
WLTPBEV139.30.8214143.60.8928.8148.30.9744.5150.91.0153/351 km---
FC316.80.71316.90.723170.73317.10.74317.30.75
RW 1BEV115.71.5611.8121.61.6924.4128.31.7938.5135.61.953/390 km---
FC389.90.671.25390.20.692.5390.50.673.75390.80.695390.90.695.6/454 km
RW 2BEV1261.5212.7131.21.6426.41371.7641.2141.81.8553/374 km---
FC345.40.811.1345.60.812.2345.80.813.33460.814.4346.20.815.5
WLTP red.BEVExtra Urban 5s112.90.6311.4Extra Urban 5s116.40.6723.5Extra Urban 5s120.10.7136.1Urban 5s124.20.7549.8Extra Urban 5s1270.7859/465 km
FC254.80.510.8254.90.511.62550.512.42550.513.2255.20.514
WLTPBEV154.50.8915.5159.40.9731.9164.91.149.8167.81.159/351 km---
FC352.30.751.11352.40.752.22352.50.753.33352.70.754.44352.90.755.56
RW 1BEV130.11.7113.1137.21.8227.5145.61.9443.8153.72.0459/384 km---
FC432.10.721.37432.50.722.74432.70.724.1433.10.725.46433.20.725.6/410 km
RW 2BEV140.61.6414.1146.71.7629.4153.51.8946.2158.91.9859/371 km---
FC383.20.871.21383.50.872.42383.70.873.64383.90.874.85384.10.875.6/462 km
500WLTP red.BEVExtra Urban 5s118.50.6912Extra Urban 5s122.20.7324.5Extra Urban 5s126.30.7838Extra Urban 5s130.70.8252.5Extra Urban 5s132.70.8459/445 km
FC273.30.520.86273.40.521.72273.50.522.58273.60.523.44273.70.524.3
WLTPBEV160.30.9816.1165.61.133.2171.41.1551.5173.81.259/340 km---
FC373.40.781.18373.60.782.36373.80.783.553740.784.72374.10.785.6/475 km
RW 1BEV139.91.8614148.11.9729.8157.72.0947.6164.12.1759/360 km---
FC470.30.741.5470.70.743471.10.744.5471.30.745.6/377 km---
RW 2BEV148.51.7815.1155.21.91631.4162.62.0548.81672.1259/ 353 km---
FC412.60.881.32412.90.882.64413.10.883.96413.40.885.28413.40.885.6/429 km
1000WLTP red.BEVShuttle216.50.6921.6Shuttle226.30.6845.8Shuttle236.30.7170/296 kmShuttle---Shuttle---
FC464.50.621.37464.70.622.74464.90.624.1465.20.625.48448.50.645.6/408
RWBEV257.34.8426270.65.1954.1278.55.3870/251------
FC561.34.681.7561.74.683.4562.14.685.1562.24.685.6/332 km---
A—Average energy consumption (Wh/km); B—Regenerative energy generated (kWh); C—Energy storage required (For BEV—kWh of battery; for FCEC—kg of H2).
Table A2. Simulation results for heavy-duty vehicles.
Range1503005007001000
Veh.PLPower TrainABCABCABCABCABC
Bus (220 kW FC)700BEV100027.71154112129.93338113630.18360/316 km------
FC245516.4211.6245816.4223.2246216.4238.8246516.4254.3247116.4577.6
1750BEV109229.43163.5122931.57360/293 km---------
FC270416.6113270716.6225.8271116.6242.8271516.6260272116.6385.8
2800BEV119431.07180132632.84360/272 km---------
FC296116.7714.1296516.7828.2296916.7946.9297416.7965.7298116.7993.8
3850BEV130132.53195.2142734.01360/252 km---------
FC323016.9315.3323416.9330.6323916.9351324416.9371.4325216.95100/978 km
Semi-truck6750 (25% PL)BEV646.652.1598673.454.7520272358.46363.5775.361.87520/670 km---
FC215614.8710.2215814.8720.4216014.8834216214.8847.7216414.8868.2
13,500 (50% PL)BEV95970.9146103573.8315113577.15520/458------
FC306115.5514.6306315.5529306715.5548.34306915.5567.7307315.5596.82
20,250 (75% PL)BEV142785216.8158688.38475161588.94520/322------
FC403815.919.3404115.938.6404515.964.4404915.990405115.9100/782 km
27,000 (100% PL)BEV203095.89304.8217997.9520/238 km---------
FC516016.1724.6516516.1749.2517116.1882517516.19100/612 km---
Note: In some simulation, instead of the required energy storage, the following format is used; {520/238 km}. It implies with the max possible storage capacity (i.e., 520 kW), only 238 km can be travelled. (Example taken from semi-truck simulated for 300 km targeted range with 100% payload capacity).

References

  1. Statista. Number of Passenger Cars and Commercial Vehicles in Use Worldwide from 2006 to 2015. 2021. Available online: https://www.statista.com/statistics/281134/number-of-vehicles-in-use-worldwide/ (accessed on 7 July 2021).
  2. Green Car Report. 1.2 Billion Vehicles on World’s Road Now. 2021. Available online: https://www.greencarreports.com/news/1093560_1-2-billion-vehicles-on-worlds-roads-now-2-billion-by-2035-report (accessed on 12 June 2021).
  3. European Environment Agency. Trends and Projections in Europe 2020. Available online: https://www.eea.europa.eu/publications/trends-and-projections-in-europe-2020 (accessed on 25 June 2021).
  4. European Environment Agency. Greenhouse Gas Emissions from Transport in the EU. 2020. Available online: https://www.eea.europa.eu/data-and-maps/daviz/greenhouse-gas-emissions-from-transport#tab-chart_1 (accessed on 2 August 2021).
  5. Statista. Plug-In Electric Light Vehicle Sales Worldwide 2015–2020. 2020. Available online: https://www.statista.com/statistics/665774/global-sales-of-plug-in-light-vehicles/ (accessed on 13 July 2021).
  6. EV Volumes. Global Plug-In Vehicle Sales Reached over 3.2 Million in 2020. 2021. Available online: https://www.ev-volumes.com/ (accessed on 23 July 2021).
  7. Reema, A.; Celebi, D. Planning a mixed fleet of electric and conventional vehicles for urban freight with routing and replacement considerations. Sustain. Cities Soc. 2021, 73, 103105. [Google Scholar]
  8. Kouchachvili, E.E.L.; Yaïci, W. Hybrid battery/supercapacitor energy storage system for the electric vehicles. J. Power Sources 2018, 374, 237–248. [Google Scholar] [CrossRef]
  9. Sagaria, S.; Neto, R.C.; Baptista, P. Modelling approach for assessing influential factors for EV energy performance. Sustain. Energy Technol. Assess. 2021, 44, 100984. [Google Scholar] [CrossRef]
  10. Sagaria, S.; Neto, R.C.; Baptista, P. Assessing the performance of vehicles powered by battery, fuel cell and ultra-capacitor: Application to light-duty vehicles and buses. Energy Convers. Manag. 2020, 229, 113767. [Google Scholar] [CrossRef]
  11. Vaz, W.; Nandi, A.K.R.; Landers, R.G.; Koylu, U.O. Electric vehicle range prediction for constant speed trip using multi-objective optimization Electric vehicle range prediction for constant speed trip using multi- objective optimization. J. Power Sources 2014, 275, 435–446. [Google Scholar] [CrossRef]
  12. Faria, M.V.; Duarte, G.O.; Varella, R.A.; Farias, T.L.; Baptista, P.C. Energy Research & Social Science Driving for decarbonization: Assessing the energy, environmental, and economic bene fi ts of less aggressive driving in Lisbon, Portugal. Energy Res. Soc. Sci. 2018, 47, 113–127. [Google Scholar] [CrossRef]
  13. Chan, C.C. The State of the Art of Electric, Hybrid, and Fuel Cell Vehicles. IEEE Trans. Power Electron. 2007, 95, 704–718. [Google Scholar] [CrossRef]
  14. Pollet, B.G.; Kocha, S.S.; Staffell, I. Electrochemistry Current status of automotive fuel cells for sustainable transport. Curr. Opin. Electrochem. 2019, 16, 90–95. [Google Scholar] [CrossRef]
  15. Thompson, S.T.; James, B.D.; Huya-Kouadio, J.M.; Houchins, C.; DeSantis, D.A.; Ahluwalia, R.; Wilson, A.R.; Kleen, G.; Papageorgopoulos, D. Direct hydrogen fuel cell electric vehicle cost analysis: System and high-volume manufacturing description, validation, and outlook. J. Power Sources 2018, 399, 304–313. [Google Scholar] [CrossRef]
  16. Greene, D.L.; Ogden, J.M.; Lin, Z. Challenges in the designing, planning and deployment of hydrogen refueling infrastructure for fuel cell electric vehicles. eTransportation 2020, 6, 100086. [Google Scholar] [CrossRef]
  17. Fathabadi, H. Fuel cell hybrid electric vehicle (FCHEV): Novel fuel cell/SC hybrid power generation system. Energy Convers. Manag. 2018, 156, 192–201. [Google Scholar] [CrossRef]
  18. Alamili, A.; Xue, Y.; Anayi, F. An experimental and analytical study of the ultra-capacitor storage unit used in regenerative braking systems. Energy Procedia 2019, 159, 376–381. [Google Scholar] [CrossRef]
  19. Yao, E.; Liu, T.; Lu, T.; Yang, Y. Optimization of electric vehicle scheduling with multiple vehicle types in public transport. Sustain. Cities Soc. 2020, 52, 101862. [Google Scholar] [CrossRef]
  20. Sacchi, R.; Bauer, C.; Cox, B.L. Does Size Matter? The Influence of Size, Load Factor, Range Autonomy, and Application Type on the Life Cycle Assessment of Current and Future Medium- and Heavy-Duty Vehicles. Environ. Sci. Technol. 2021, 55, 5224–5235. [Google Scholar] [CrossRef] [PubMed]
  21. Crozier, C.; Apostolopoulou, D.; Mcculloch, M. Clustering of Usage Profiles for Electric Vehicle Behaviour Analysis. In Proceedings of the 2018 IEEE PES Innovative Smart Grid Technologies Conference Europe (ISGT-Europe), Sarajevo, Bosnia and Herzegovina, 21–25 October 2018. [Google Scholar] [CrossRef] [Green Version]
  22. Sun, D.; Leurent, F.; Xie, X. Discovering vehicle usage patterns on the basis of daily mobility profiles derived from floating car data. Transp. Lett. 2021, 13, 163–171. [Google Scholar] [CrossRef]
  23. TNO. NEDC-WLTP Comparative Testing. 2021. Available online: https://www.researchgate.net/profile/Norbert-Ligterink-2/publication/316716593_NEDC_-_WLTP_comparative_testing/links/590f0ff74585159781872f24/NEDC-WLTP-comparative-testing.pdf (accessed on 13 August 2021).
  24. Automotive News China. GM Venture’s Minicar Was China’s Most-Sold EV in August. 2021. Available online: https://www.autonews.com/china/gm-ventures-minicar-was-chinas-most-sold-ev-august (accessed on 7 June 2021).
  25. Fortune Business Insights. Micro Electric Vehicle (EV) Market Size. 2021. Available online: https://www.fortunebusinessinsights.com/micro-electric-vehicles-ev-market-103474 (accessed on 18 September 2021).
  26. European Union. European Vehicle Market Statistics 2020. 2021. Available online: https://theicct.org/sites/default/files/publications/ICCT_EU_Pocketbook_2020_Web_Dec2020.pdf (accessed on 5 July 2021).
  27. Wikipedia. WLTP Drive Cycle. 2021. Available online: https://en.wikipedia.org/wiki/Worldwide_Harmonised_Light_Vehicles_Test_Procedure (accessed on 10 August 2021).
  28. Alves, J.; Baptista, P.; Gonçalves, G.; Duarte, G. Indirect methodologies to estimate energy use in vehicles: Application to battery electric vehicles. Energy Convers. Manag. 2016, 124, 116–129. [Google Scholar] [CrossRef]
  29. Reis, R.F.G. Energy Assessment of Eco-Driving and Energy Rationalization Measures for Heavy Goods Fleet; Instituto Superior Tecnico: Lisbon, Portugal, 2016. [Google Scholar]
  30. Jiang, S.; Wang, C.; Zhang, C.; Bai, H.; Xu, L. Adaptive estimation of road slope and vehicle mass of fuel cell vehicle. eTransportation 2019, 2, 100023. [Google Scholar] [CrossRef]
  31. Evtimov, I.; Ivanov, R.; Sapundjiev, M. Energy consumption of auxiliary systems of electric cars. MATEC Web Conf. 2017, 133, 06002. [Google Scholar] [CrossRef]
  32. Ejsmont, J.; Taryma, S.; Ronowski, G.; Swieczko-Zurek, B. Influence of temperature on the tyre rolling resistance. Int. J. Automot. Technol. 2017, 19, 45–54. [Google Scholar] [CrossRef]
  33. Saini, M.; Walia, K. Maximum Energy Recovery in Electric Vehicle. Int. J. Res. Appl. Sci. Eng. Technol. 2018, 6, 1780–1785. [Google Scholar] [CrossRef]
  34. Iora, P.; Tribioli, L. Effect of Ambient Temperature on Electric Vehicles’ Energy Consumption and Range: Model Definition and Sensitivity Analysis Based on Nissan Leaf Data. World Electr. Veh. J. 2019, 10, 2. [Google Scholar] [CrossRef] [Green Version]
  35. Davis, K.; Hayes, J.G. Analysis of electric vehicle powertrain simulators for fuel consumption calculations. In Proceedings of the International Conference on Electrical Systems for Aircraft, Railway, Ship Propulsion and Road Vehicles & International Transportation Electrification Conference (ESARS-ITEC), Toulouse, France, 2–4 November 2016. [Google Scholar] [CrossRef]
  36. Suzuki, K.Y.T.; Liyama, A.; Kubo, N.; Saito, N.; Shinohara, K.; Shimotori, S.; Sugawara, Y. Toward the Future Fuel Cell -Challenge for 2040. Electrochem. Soc. 2019, 92, 3–7. [Google Scholar] [CrossRef]
  37. Tanaka, S.; Nagumo, K.; Yamamoto, M.; Chiba, H.; Yoshida, K.; Okano, R. Fuel cell system for Honda CLARITY fuel cell. eTransportation 2020, 3, 100046. [Google Scholar] [CrossRef]
  38. Neto, R.C.; Teixeira, J.C.; Azevedo, J. Thermal and electrical experimental characterisation of a 1 kW PEM fuel cell stack. Int. J. Hydrogen Energy 2013, 38, 5348–5356. [Google Scholar] [CrossRef]
  39. EV Database. 2021. Available online: https://ev-database.org (accessed on 6 August 2021).
  40. EV Specs. 2021. Available online: https://www.evspecifications.com/ (accessed on 12 July 2021).
  41. BYD. BYD Electric Vehicles. 2021. Available online: https://www.byd.com/en/index.html (accessed on 19 June 2021).
  42. H2.Live. Hydrogen Cars-All Models at a Glance. 2021. Available online: https://h2.live/en/wasserstoffautos (accessed on 17 August 2021).
  43. Fuelcelltrucks. Nikola Two Fuelcell Semi Truck. 2021. Available online: https://fuelcelltrucks.eu/project/nikola-two/ (accessed on 7 July 2021).
  44. James, B.D.; Huya-Kouadio, J.M.; Houchins, C.; DeSantis, D.A. Final Report: Mass Production Cost Estimation of Direct H2 PEM Fuel Cell Systems for Transportation Applications (2012–2016). Available online: https://www.osti.gov/servlets/purl/1346414 (accessed on 3 June 2021).
  45. Kolb, O. “Deployment of Alternative Fuels Infrastructure”—Fuel Price Comparison; European Commission: Brussels, Belgium, 2017; ISBN 9789279575372. [Google Scholar]
  46. Statista. Lithium-Ion Battery Pack Costs Worldwide between 2011 and 2030. 2021. Available online: https://www.statista.com/statistics/883118/global-lithium-ion-battery-pack-costs/ (accessed on 8 August 2021).
  47. Path to Hydrogen Competitiveness a Cost Perspective. Hydrogen Council, 2020. Available online: https://hydrogencouncil.com/en/path-to-hydrogen-competitiveness-a-cost-perspective/ (accessed on 2 July 2021).
  48. H2data. Hydrogen Data. 2021. Available online: http://www.h2data.de/ (accessed on 20 August 2021).
Figure 1. Forces acting on the vehicle.
Vehicles 03 00041 g001
Figure 2. Energy storage requirement to transport 150 kg payload with different drive cycles.
Vehicles 03 00041 g002
Figure 3. Energy storage requirement to transport 250 kg payload with different drive cycles.
Vehicles 03 00041 g003
Figure 4. Energy storage requirement to transport 350 kg payload with different drive cycles.
Vehicles 03 00041 g004
Figure 5. Energy storage requirement to transport 500 kg payload with different drive cycles.
Vehicles 03 00041 g005
Figure 6. Energy storage requirement to transport 12 passengers (1000 kg equivalent) with different drive cycles.
Vehicles 03 00041 g006
Figure 7. Energy storage requirement for the electric bus to transport passengers.
Vehicles 03 00041 g007
Figure 8. Energy storage requirement for semi-truck to move freight.
Vehicles 03 00041 g008
Figure 9. Average energy consumption per passenger/km in a full battery electric vehicle (BEV) (a) and fuel cell electric vehicle (FCEV) (b) configuration.
Vehicles 03 00041 g009
Figure 10. Cost analysis with reduced battery pack and fuel price (fuel cell powertrain (FCPT) base price is not included).
Vehicles 03 00041 g010
Table 1. Vehicle segment and physical properties.
Vehicle TypeMicro-CarUrban 4sExtra-Urban 5sShuttleBusSemi-Truck
Mass * (kg)45012001350160011,00010,000
Motor power (kW)1313013060220560
Motor torque (N)10034034036012002600
Max speed (kmph)60145145609090
Max payload (kg)1503505001000450027,000
* Mass of the vehicle is considered without energy storage mass.
Table 2. Drive cycle specifications for different vehicle types.
Drive-CyclesWLTP C3 ModifiedWLTP C3RW_1RW_2RW_mRW_bRW_st
Distance (km)17.623.317.827.146.971.393.83
Av speed (kmph)31.546.535.551.812.119.1830.63
Max speed (kmph)55.0131.475.0103.053.974.958.5
Duration (s)180018001800188014,01013,35311,027
Av positive acc. (m/s2)0.500.410.570.480.420.330.10
Av negative acc. (m/s2)−0.19−0.32−0.45−0.40−0.22−0.27−0.11
Av positive road grade--0.0250.0190.0270.0370.028
Av negative road grade--−0.020−0.019−0.033−0.033−0.031
Table 3. Battery specification for vehicle segments.
VehiclesVehicle Mass (kg)Battery Mass (kg)Battery Capacity (kWh)Payload (kg)/Passengers (no.)Fuel Cell Capacity (kW)H2 Stored (kg)
Micro-car45015219150/2133
Urban 4s120042453350/41305.6
Extra urban 5s135047259500/51305.6
Shuttle1600560701000/12605.6
Bus11,00028803604500/60220100
Semi-Truck10,000416052027,000520100
Table 4. Electric vehicle (EV) simulation results (error compared to reference, %).
VehicleEnergy Consumption (Wh/km)Range (km)Battery Rated Energy (kWh) or Hydrogen Stored (kg)
EV
Nissan Leaf S138.6 (−1.7)288 (1.4)40.0
Renault Zoe R110132.5 (0.4)392 (−0.8)52.0
Kia Niro140.2 (3.0)280 (−3.2)39.2
Kia Soul EV145.1 (2.1)271 (−2.2)39.2
Hyundai IONIQ122.1 (−0.7)313 (0.6)38.3
BMW i3129.9 (−2.4)324 (2.8)42.0
Mini Cooper121.9 (−1.7)267 (1.5)32.6
City eGold (HDV)822.5 (−1.1)103.385
Fuel cell EV
Toyota Mirai313.5 (1.3)528 (4.6)5.6 (kg of H2)
Table 5. Cost analysis with battery powertrain and fuel cell powertrain (in euros).
Payload (kg)Veh.Battery Powertrain (BPT)Fuel Cell Powertrain (FCPT)
Base Price (100 km)200 km300 km400 kmBase Price (100 km)200 km300 km400 km500 km
150Micro888.49.810.2 26370.070.070.070.07
4s1574.016.217.718.111,5140.140.140.140.14
5s1727.718.519.620.311,5150.150.150.150.15
2504s1609.417.318.018.911,5150.150.150.150.15
5s1798.619.020.220.911,5160.160.160.160.18
3504s1656.717.518.619.711,5160.160.160.160.16
5s1834.019.421.221.411,5170.170.170.170.18
5005s1905.020.221.722.211,5190.190.190.14-
1000shuttle3075.333.236.9 73210.210.210.23-
700Bus10,955.9145.0145.0 31,7900.900.890.900.90
175011,207.4162.5162.5 32,8001.001.001.001.01
385013,526.9191.0191.0 31,8171.171.171.171.17
6750Semi-truck7488.482.082.0 49,7790.790.790.790.79
13,50010,632.8133.0133.0 49,8121.121.111.121.12
27,00021,578.3289.1289.1 49,8871.871.871.871.87
Note: It is assumed that vehicle segments with the same specification are employed and thus the cost apart from the powertrain is the same for both battery and fuel cell EV. Abbreviation: Micro—Microcar; 4s—Urban 4s; 5s—Extra Urban 5s.
Table 6. Cost analysis per passenger with battery powertrain and fuel cell powertrain (in euros per passenger).
Payload (kg)Veh.Battery Powertrain (BPT)Fuel Cell Powertrain (FCPT)
Base Price (100 km)200 km300 km400 kmBase Price (100 km)200 km300 km400 km500 km
150 kgMicro444.24.95.1 1318.60.040.040.040.04
4s787.08.18.99.05756.90.070.070.070.07
5s863.89.29.810.25757.70.080.080.080.07
250 kg4s536.55.86.06.33838.30.050.050.050.05
5s599.56.36.77.03838.80.050.050.050.06
350 kg4s414.24.44.64.92879.00.040.040.040.04
5s458.54.95.35.32879.30.040.040.040.04
500 kg5s381.04.04.34.42303.70.040.040.03-
1000shuttle256.32.83.1 610.10.020.020.02-
700Bus1095.614.514.5 3178.90.090.090.090.09
1750448.36.56.5 1272.00.040.040.040.04
3850245.93.53.5 578.50.020.020.020.02
6750Semi truck **1109.412.112.1 7374.60.120.120.120.12
13,500787.69.99.9 3689.80.080.080.080.08
27,000799.210.710.7 1847.70.070.070.070.07
** for semi-truck, powertrain expense per ton is calculated instead of per passenger. Abbreviation: Micro—Micro-car; 4s—Urban 4s; 5s—Extra Urban 5s.
Publisher’s Note: MDPI stays neutral with regard to jurisdictional claims in published maps and institutional affiliations.

