This research aims to analyze vehicle performance with different powertrain configurations, driving profiles, the number of passengers, and vehicle segments. To accept these parameters as a variable, a highly flexible model is needed. The model should be capable of considering the former parameters as a variable. Facing the need for flexibility and to analyze different scenarios, an already developed Simulink model from a previous study was modified concerning the requirement of this study [
9,
10]. For this study, the model was revised from a previous model with a customized drive cycle for different analysis and specified vehicle types were replaced with generic vehicle model to study different vehicle types. The model consists of six subsystems, including drive cycle, vehicle model, vehicle physical model, motor system, battery system, and fuel cell system.
2.1. Vehicle Type
For this study, six generic vehicles were considered based on the vehicle types existing in the automotive market.
Table 1 shows the different vehicle types, dimensions, and physical properties (corresponding to the average of a sample of available vehicles on the market).
With the current market trends, micro-cars have been marking their dominance in many of the prominent EV selling countries. Due to its lower energy consumption, higher battery life, ease of use, and convenience, micro-cars are becoming popular among EV users. In China, GM’s venture Micro-EV became the most sold EV in August 2020, followed by the Tesla Model 3 during the pandemic [
24]. In 2026, the Micro-EV market size is projected to reach USD 5.8 billion based on the Fortune Business Insights forecast [
25].
To study the concept of tailored vehicle for individual uses, a four-seater urban vehicle (Urban 4s) is included, which aims to study the real-world performance of compact urban vehicle with a maximum of four passengers instead of five. The smaller vehicle size with its lighter weight compared to the five-seater vehicle helps with reduced energy consumption and possibly longer range and battery life. This hypothesis will be explained later in the analysis stage. For the physical properties, the existing vehicle’s type of hatchback is considered for the 4-seater EV.
To compare with most EVs present in the market, a five-seater extra-urban model (Extra-urban 5s) is also considered. The vehicle properties are determined based on the average of the similar EV vehicles (Sedan) present in the market. In addition to this, in the context of the increasing need for promoting the modal shift to mass transit options and of the push for on-demand services, a shuttle model with an electric powertrain is analyzed in the study.
Additionally, due to the significant share of heavy-duty vehicles in the transport sector externalities (430,000 units [
26]) and considering this sector has been slower in adopting alternative solutions, heavy-duty vehicles, specifically, the bus and semi-truck, are also included, due to their different specificities in terms of powertrain design and associated mobility patterns.
2.2. Drive Cycle Selection
The drive cycle data influence the simulation outcomes considerably as they represent the operational conditions of a vehicle. The vehicle types described in
Table 1 were tested with certified and real-world drive cycles to study their energy performance. WLTP class 3 drive cycle is used as the certified drive cycle for light-duty vehicles [
27]. For real-world drive cycle, 2 distinct drive cycles with road grade were extracted from a larger real-world drive cycles sample collected with light-duty vehicles in Lisbon, Portugal [
12] (check the
Appendix A,
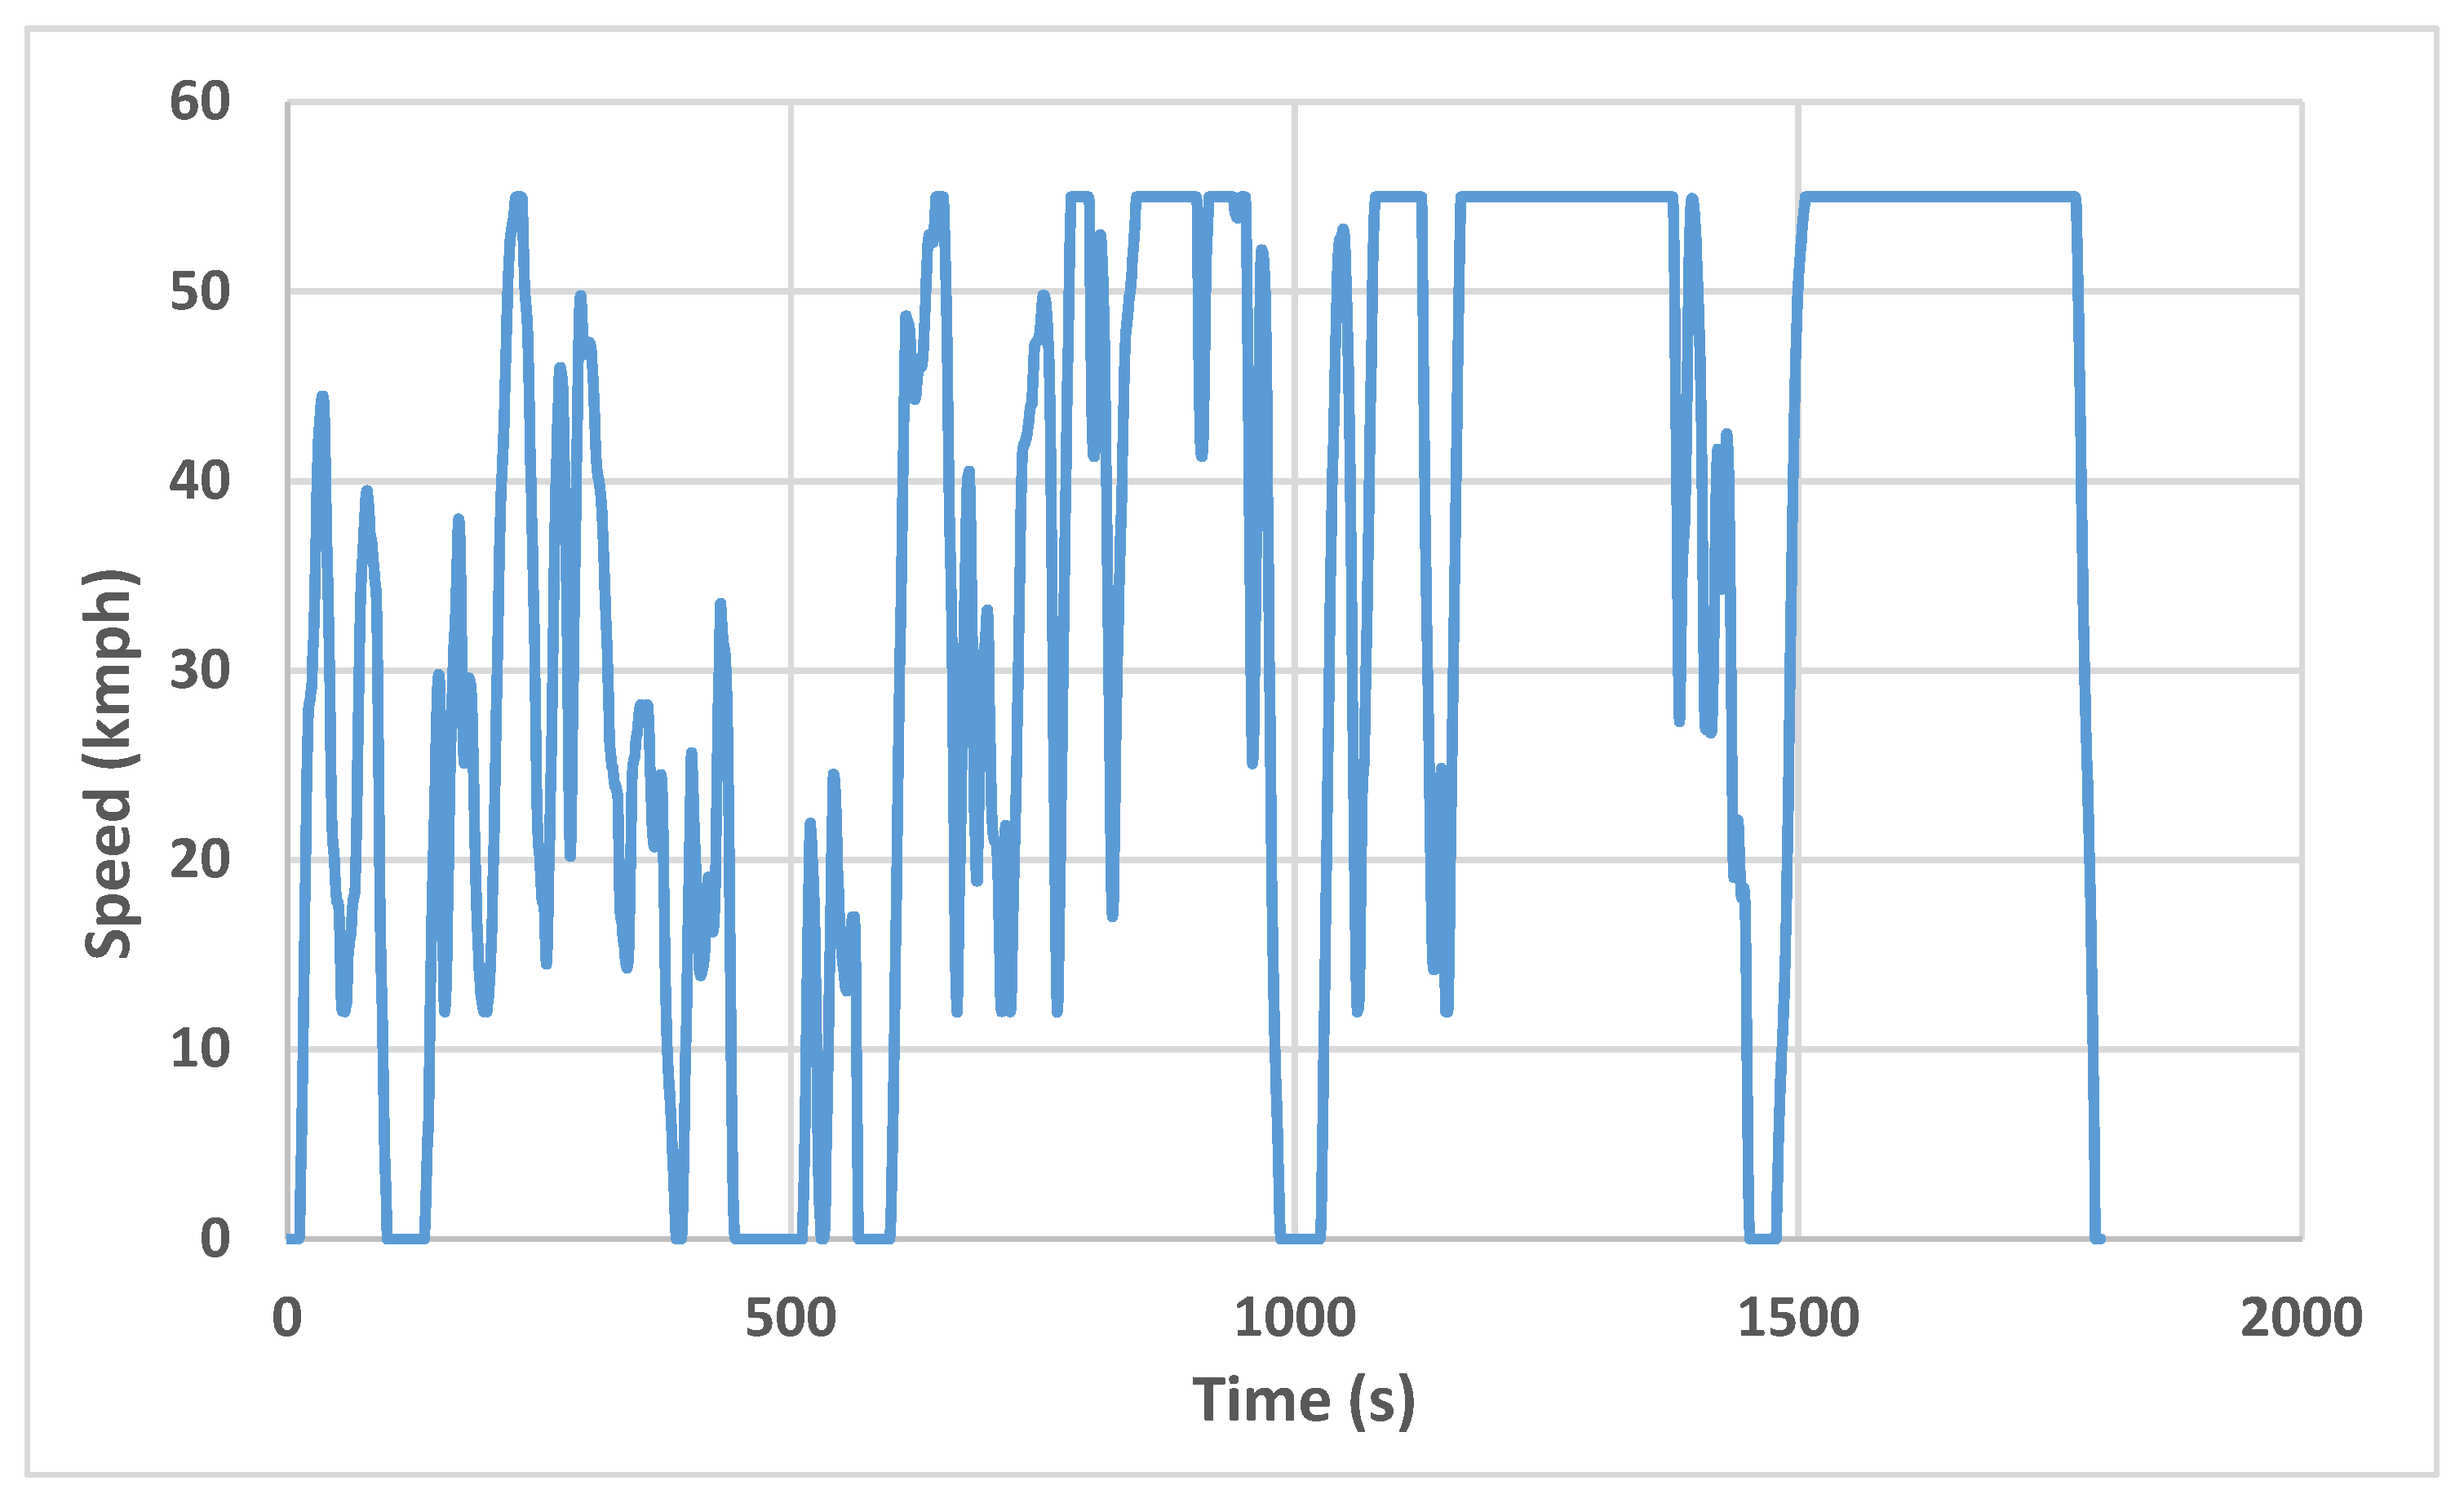
Figure A1 (Real-world drive cycle 1 (duration: 1800 s)) for real-world drive cycle 1-RW1 and
Figure A2 (Real-world drive cycle 2 (duration: 1880 s)) for real-world drive cycle 2-RW2). Since the Micro-car and Shuttle have limited engine power, the maximum speed they can achieve is lower than the Urban 4s and Extra-urban 5s, so lower speed drive cycles previously obtained for micro-cars were used [
28]. Also, the certified WLTP drive cycle is modified for the former vehicles with a maximum speed of 55 km/h.
Figure A3 (Real-world drive cycle for micro-car/shuttle (duration: 14,004 s)) shows the real-world drive cycle for Microcar/shuttle (RW_m) and
Figure A4 (Modified WLTP class 3 drive cycle (duration: 1800 s)) shows the modified WLTP class 3-drive cycle.
Table 2 details the specification of drive cycles used for the analysis of the light-duty vehicles.
For heavy-duty vehicles, since there are no certification drive cycles, they are only analyzed with real-world drive cycles, which were recorded in previous studies [
10,
29].
Figure A5 (Real-world drive cycle for Bus (duration: 13,353 s)) represents the real-world drive cycle used for the simulation of bus and
Figure A6 (Real-world drive cycle for Semi-truck (duration: 11,027 s)) show the speed profile of the real-world drive cycle used for semi-truck simulations.
Table 2 shows the drive cycle specification used for the simulations of the heavy-duty vehicles (RW_b represents the real-world drive cycle for bus and RW_st represents the real-world drive cycle specifications for semi-truck).
2.3. Model Development
The developed model consists of six subsystems, including drive cycle, vehicle model, vehicle physical model, motor system, battery system, and fuel cell system. The second-by-second drive cycles defined in
Section 2.2 are imported as input signals into the drive cycle subsystem. In the vehicle model, the vehicle specifications were considered based on information presented in
Section 2.1. The model enables modification of battery capacity, fuel cell maximum power, and vehicle segment type in this subsystem.
The vehicle physical model subsystem consists of mechanical, mathematical, and numerical expressions to describe the vehicle’s physical behaviour, as in other studies in the literature [
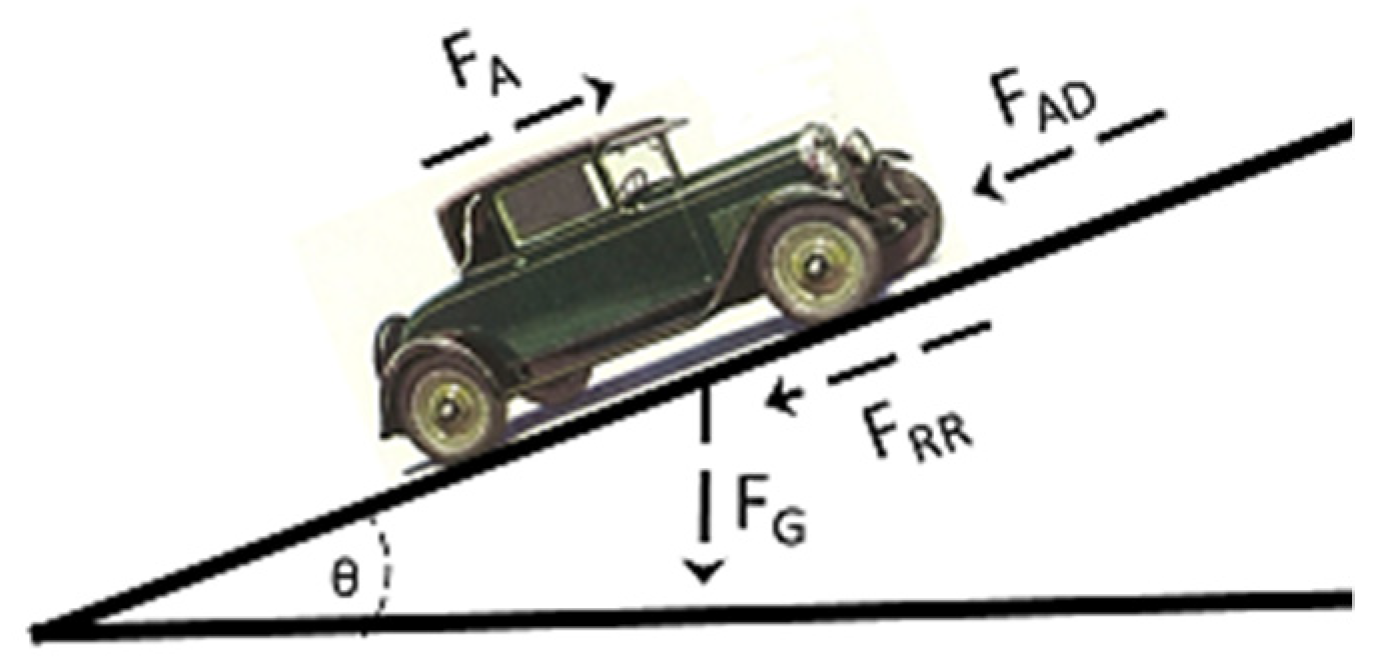
30]. The traction force required to accelerate the vehicle and deceleration forces are calculated based on the one-dimensional vehicle fundamental motion. That enables calculating the power requirement of the vehicle in each second, based on the drive cycle data and basic vehicle loads forces, as presented in
Figure 1.
The total force that is required to move the vehicle is called traction force and is calculated as:
where,
FA is the acceleration force (N),
FG is the gravitational force (N),
FRR is the rolling resistance (N), and
FAD is the aerodynamic drag (N). The previous expression is expanded as:
where
m is the mass of the vehicle (kg),
a is the acceleration (m/s
2),
Cd is the drag co-efficient,
Af is the vehicle frontal area (m
2),
v is the velocity (m/s),
Cr is the coefficient of rolling resistance,
g is the acceleration due to gravity (m/s
2) and
θ is the road grade [
9].
The model is designed in such a way that the air density is calculated numerically for each simulation [
31]. The rolling resistance is determined based on the average speed of the drive cycle. The experimental results of tire T1071 (modern tire) on ISOr20 road surface (ISO reference surface) at different speeds are taken as a reference to compute the rolling resistance coefficient [
32].
In the motor subsystem, a permanent magnet DC motor/generator is numerically modelled. The efficiency curve of the Nissan leaf 80 kW motor is taken as the reference. During forward motion/acceleration, a permanent magnet DC motor (PMDC) is employed as a motor, while during braking/deceleration, the PMDC works as a generator and extracts energy through regenerative braking. Equation (3) represents the power output from PMDC to the wheel during acceleration and Equation (4) represents the regenerative energy production during braking. The power required during each second of the travel is calculated as the sum of power required for acceleration (
Pwheel), auxiliary power (
PAUX), and power loss (
Ploss), which is represented in Equation (5).
where,
ηm (%) is the efficiency of the motor and
ηregen (%) is the regenerative efficiency. It is expected that regenerative efficiency at a particular deceleration point is the same as that motor efficiency at the same acceleration point, however, the maximum regenerative energy production has been limited to 25% of the motor power according to the literature [
33,
34].
For the battery powertrain (BPT), the total power stored in the battery is defined as the product of voltage (
V) of the battery and total current (
I) in the battery, as represented by Equation (6). The current injected during charging (regenerative braking) and extracted during discharging (acceleration mode) of the battery is estimated by Equation (7) and terminal voltage,
Vt is calculated through Equation (8):
where
R is the battery internal resistance (Ω) and t is the time in seconds. The resistance of the battery is considered to be 0.1 Ω [
35]. The total energy consumed during the drive cycle is assessed by summing the power consumption through each second of the drive cycle. The final total power consumption is estimated by taking the difference of total power consumption to the regenerative energy produced during the journey, as presented in Equation (9).
The average energy consumption (
E_avg) of the vehicle is the amount of energy consumed to reach each unit distance, km, and is calculated as shown in Equation (10). The
Range (km) of the vehicle is calculated as shown in Equation (11).
where
d is the distance travelled in the drive cycle (km). It is to be noted that 100% energy capacity available cannot be used, the battery reserves the last 15% of its energy density to prevent full discharge.
State of charge (SOC) is defined as the level of charge of the battery with respect to its capacity. It is presented in percentage: 100% represents fully charged battery and 0% represents empty.
SOC is calculated at each second by using the coulomb current counting method (see Equation (12)):
where
I is the current stored in the battery and it is the current drawn at that particular second.
For the fuel cell powertrain (FCPT), a proton-exchange membrane fuel cell (PEMFC) is modelled based on the polarisation curve of Toyota Mirai 2017, which is taken as the reference [
36,
37]. The portion of the output power of the fuel cell required to maintain the working condition is termed as the balance of plant (BOP). The fuel cell power (
Pfc) is then calculated through Equation (13):
where
Pfcp is the maximum output of the fuel cell stack. From the polarization curve, the current and voltage for the power required are estimated. The stack output voltage (
V) of the fuel cell is the total voltage produced by the number of cells in the stack (
Nc), which is given by:
Fuel cell electrical efficiency is calculated as the ratio of the electric power output to the energy input from hydrogen. The total efficiency of the module can also be calculated as the product of the factors, as shown in Equation (15):
where
is the thermodynamic efficiency,
is the voltage efficiency,
is the faradic efficiency, and
is the utilization factor. The thermodynamic efficiency, faradic efficiency, and utilization factor are assumed as 0.83, 0.9, and 1 respectively [
38], and voltage efficiency is calculated by Equation (16), and the fuel mass flow rate of hydrogen is calculated by Equation (17):
where
Q = 120 MJ/kg or 33.33 kWh is the lower heating value/specific energy of hydrogen. Since the power requirements vary each second, the current and voltage produced also change and it will affect the fuel cell operation. In order to intercept that, a DC–DC converter is used with an efficiency of 90%. The range (km) of the vehicle is calculated as:
For the FCPT, the modelling is performed in such a way that the energy required for the cruise is fully produced through the onboard FC stack, while the energy required for auxiliary consumption is delivered by a secondary battery, which is modelled similar to a battery system for BPT.
2.4. Application of the Model
The simulation model developed for this study is acknowledged as flexible since it enables us to easily modify the number of passengers, various driving profiles, vehicle segment types, and storage options as separate variables. This helps to assess the difference in vehicle performance in different driving scenarios and identify the effects in real-world driving. Through this model, the following analysis was performed.
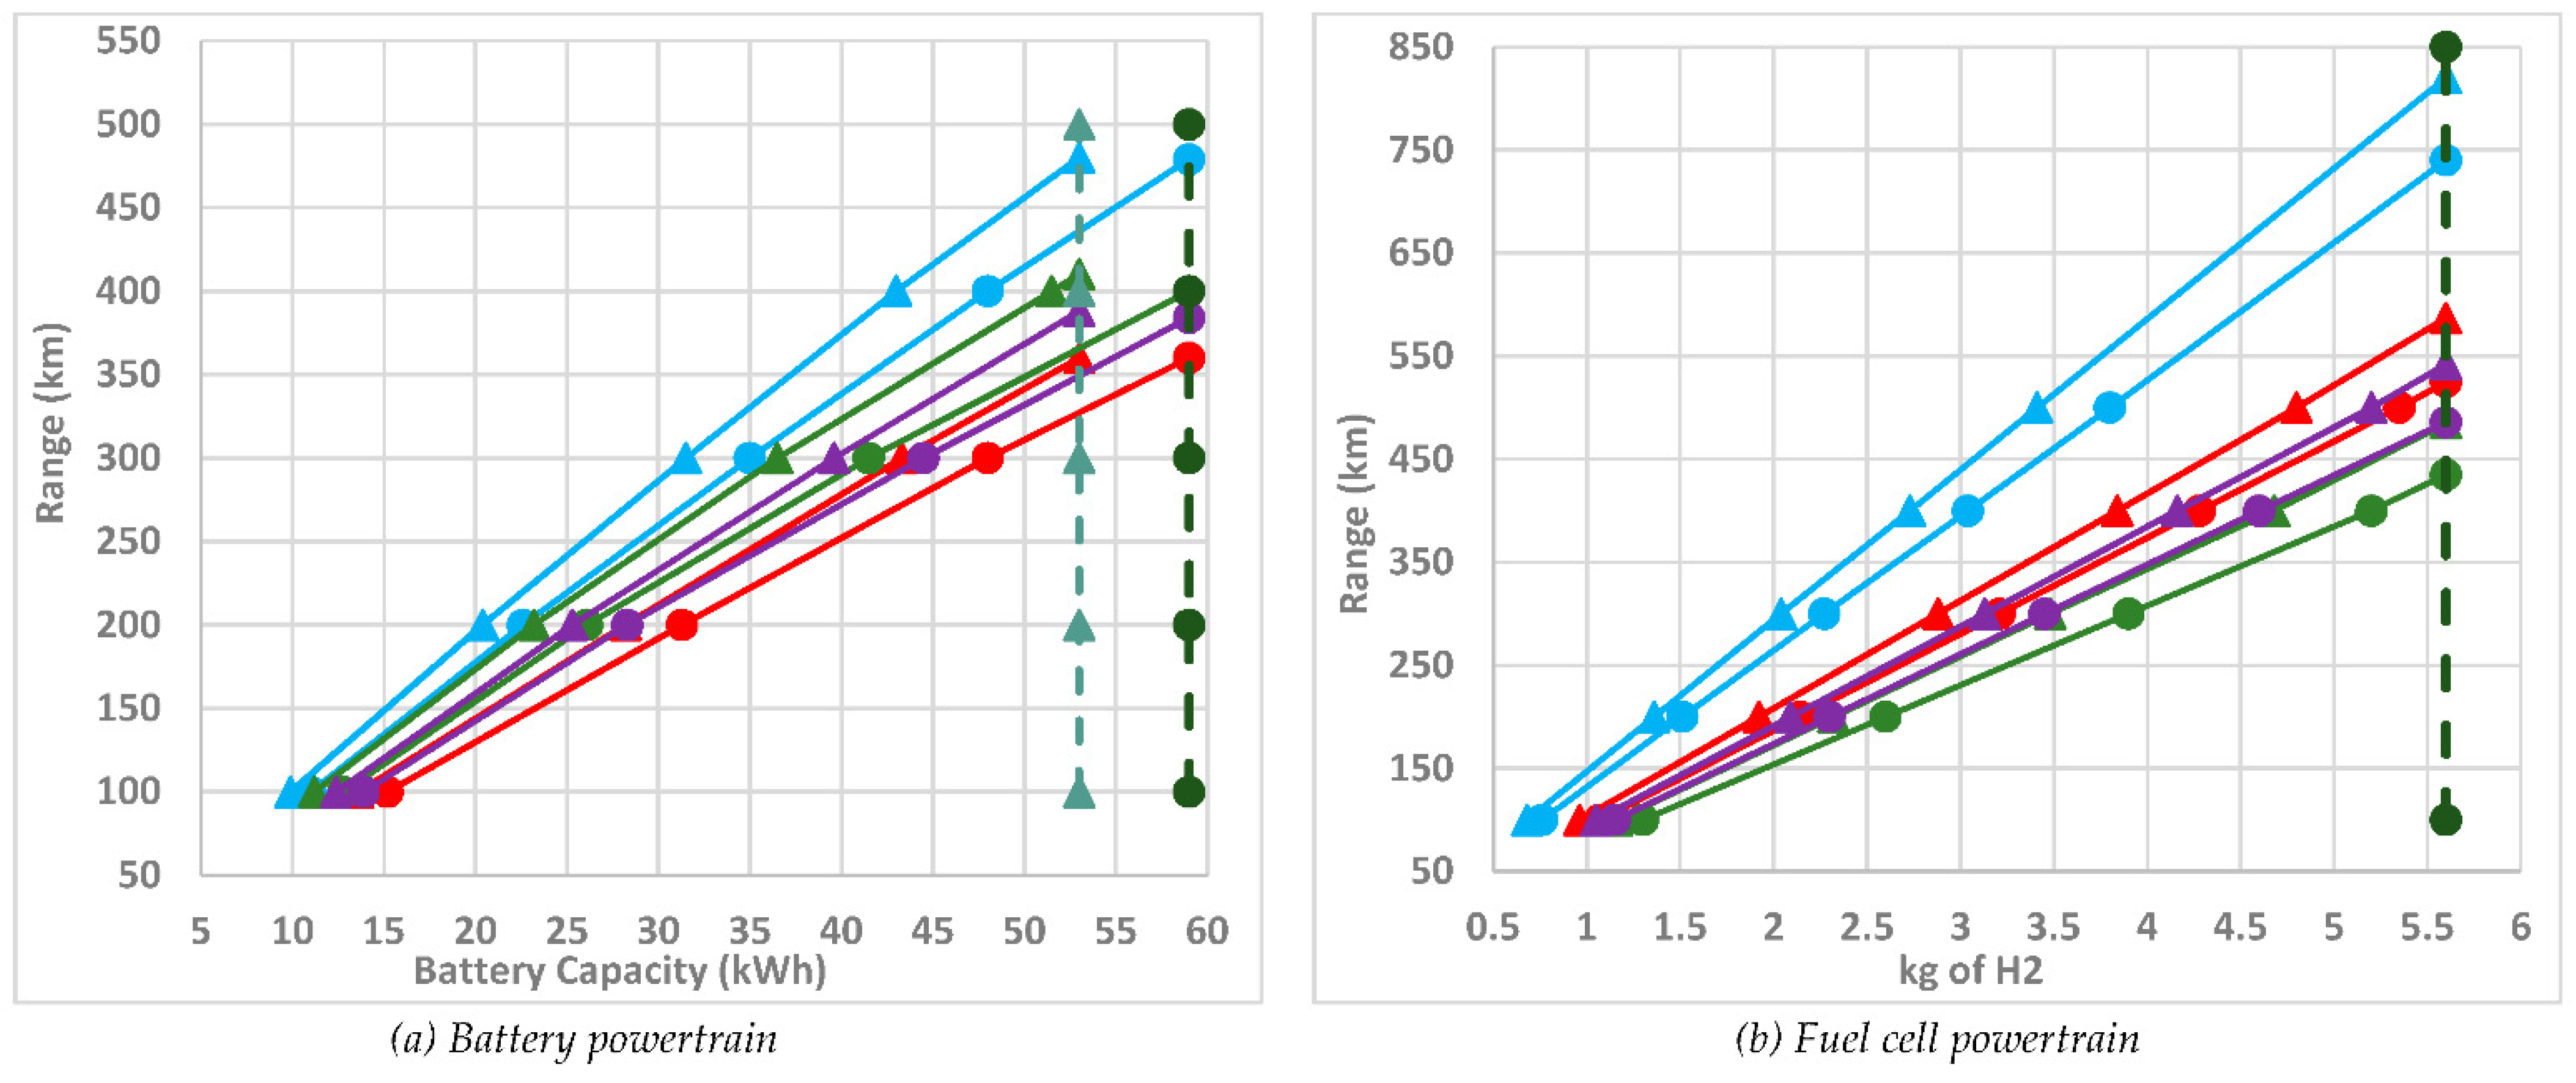
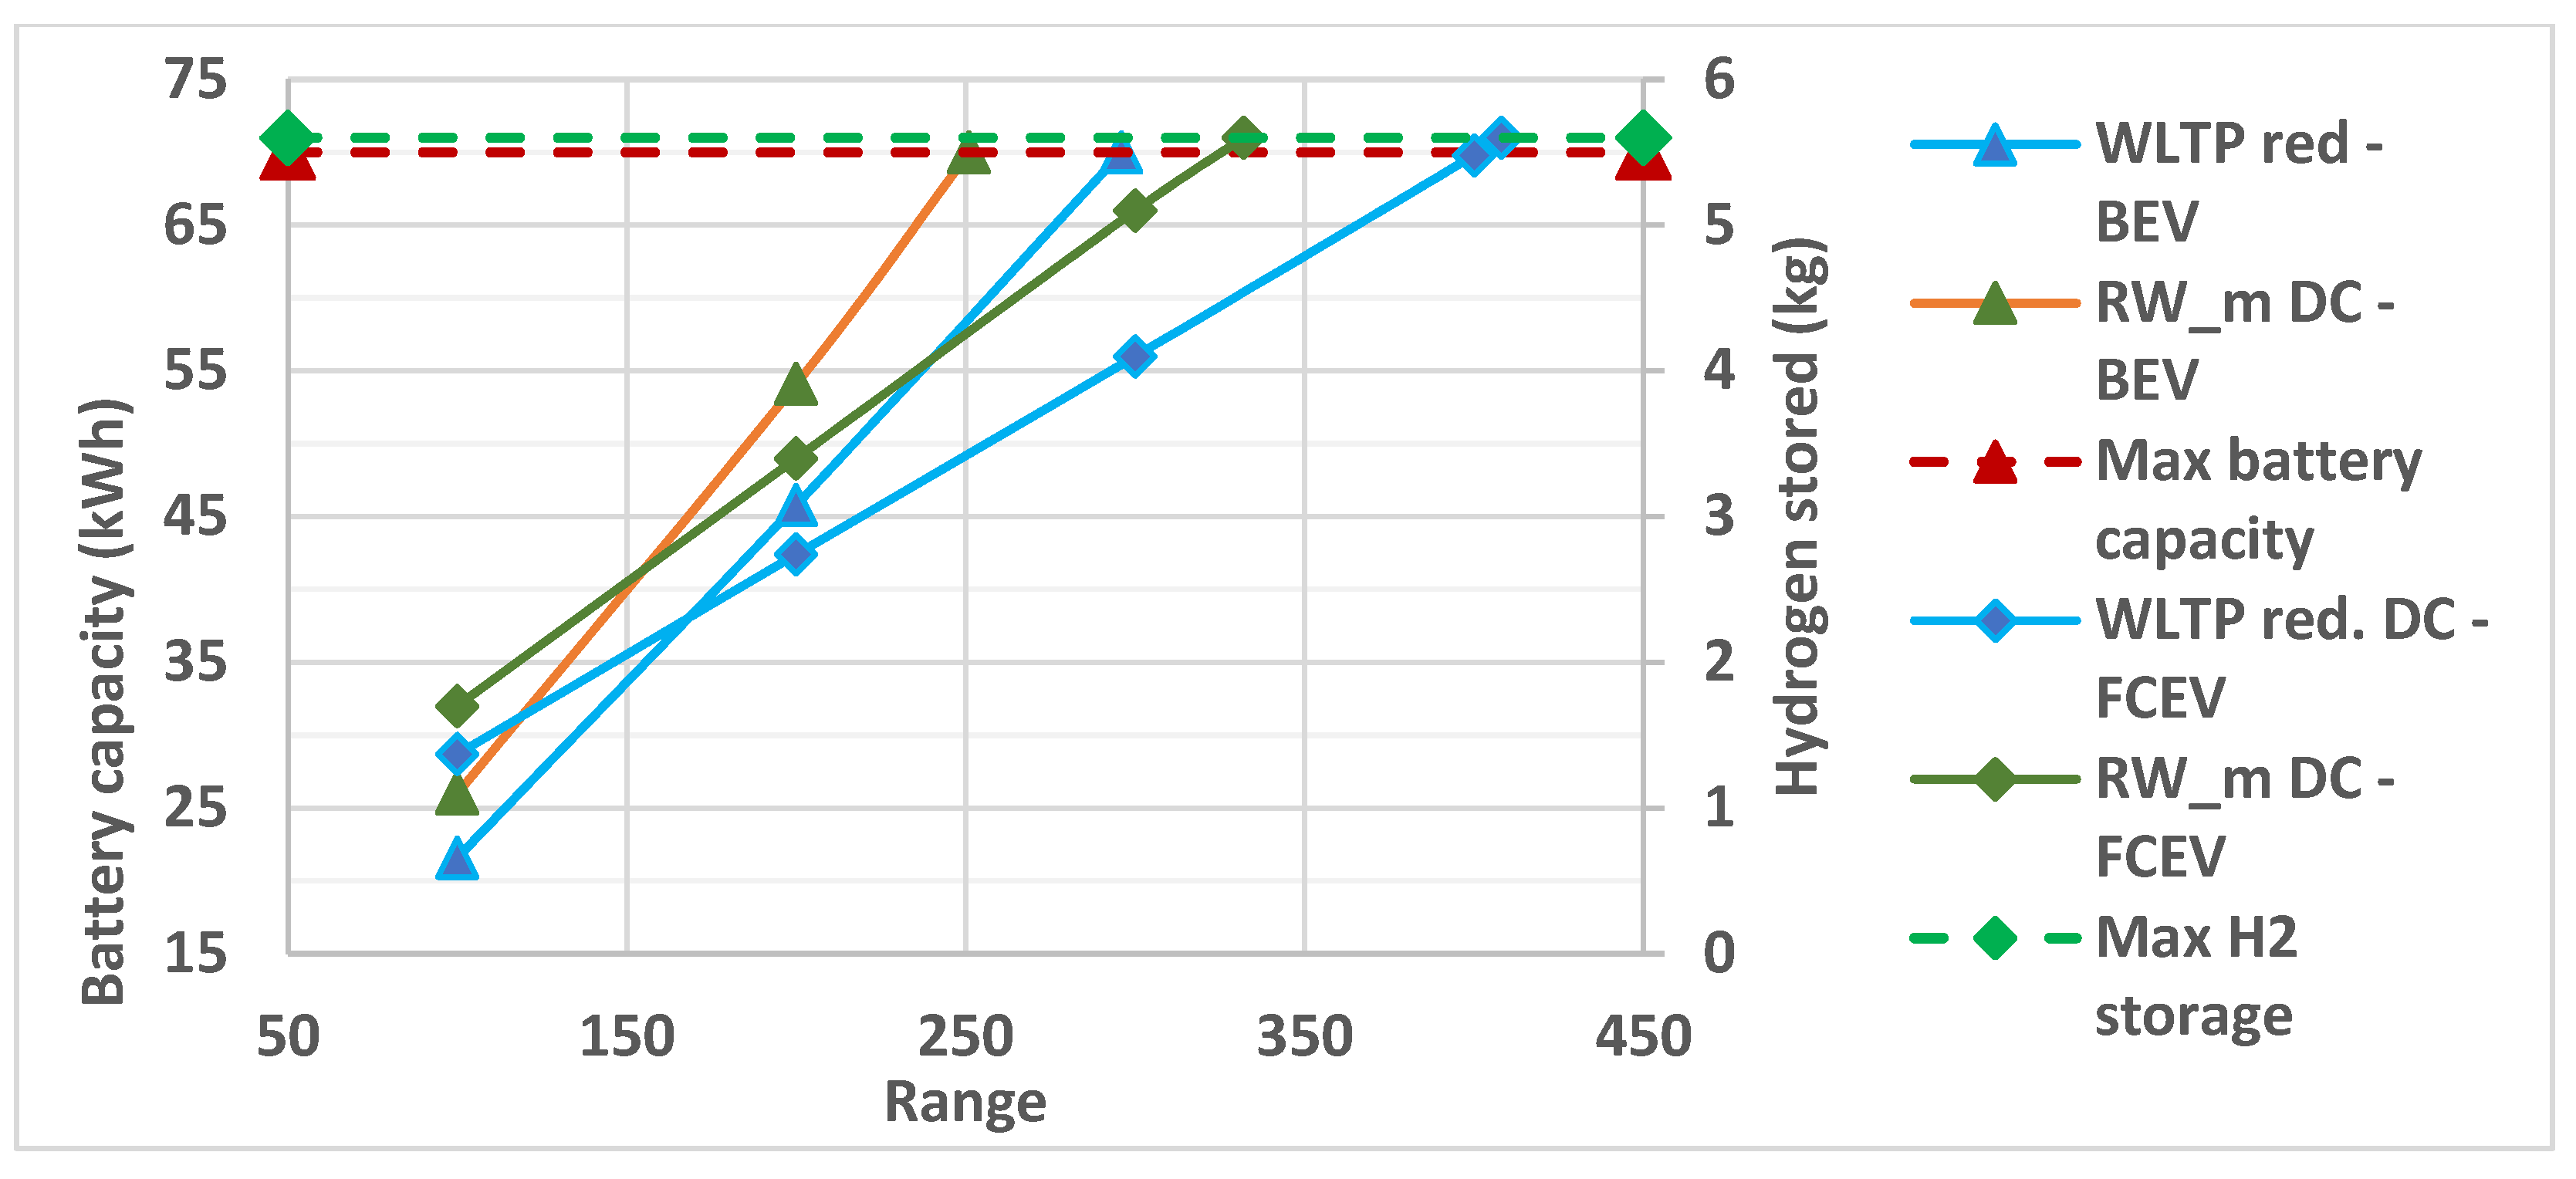
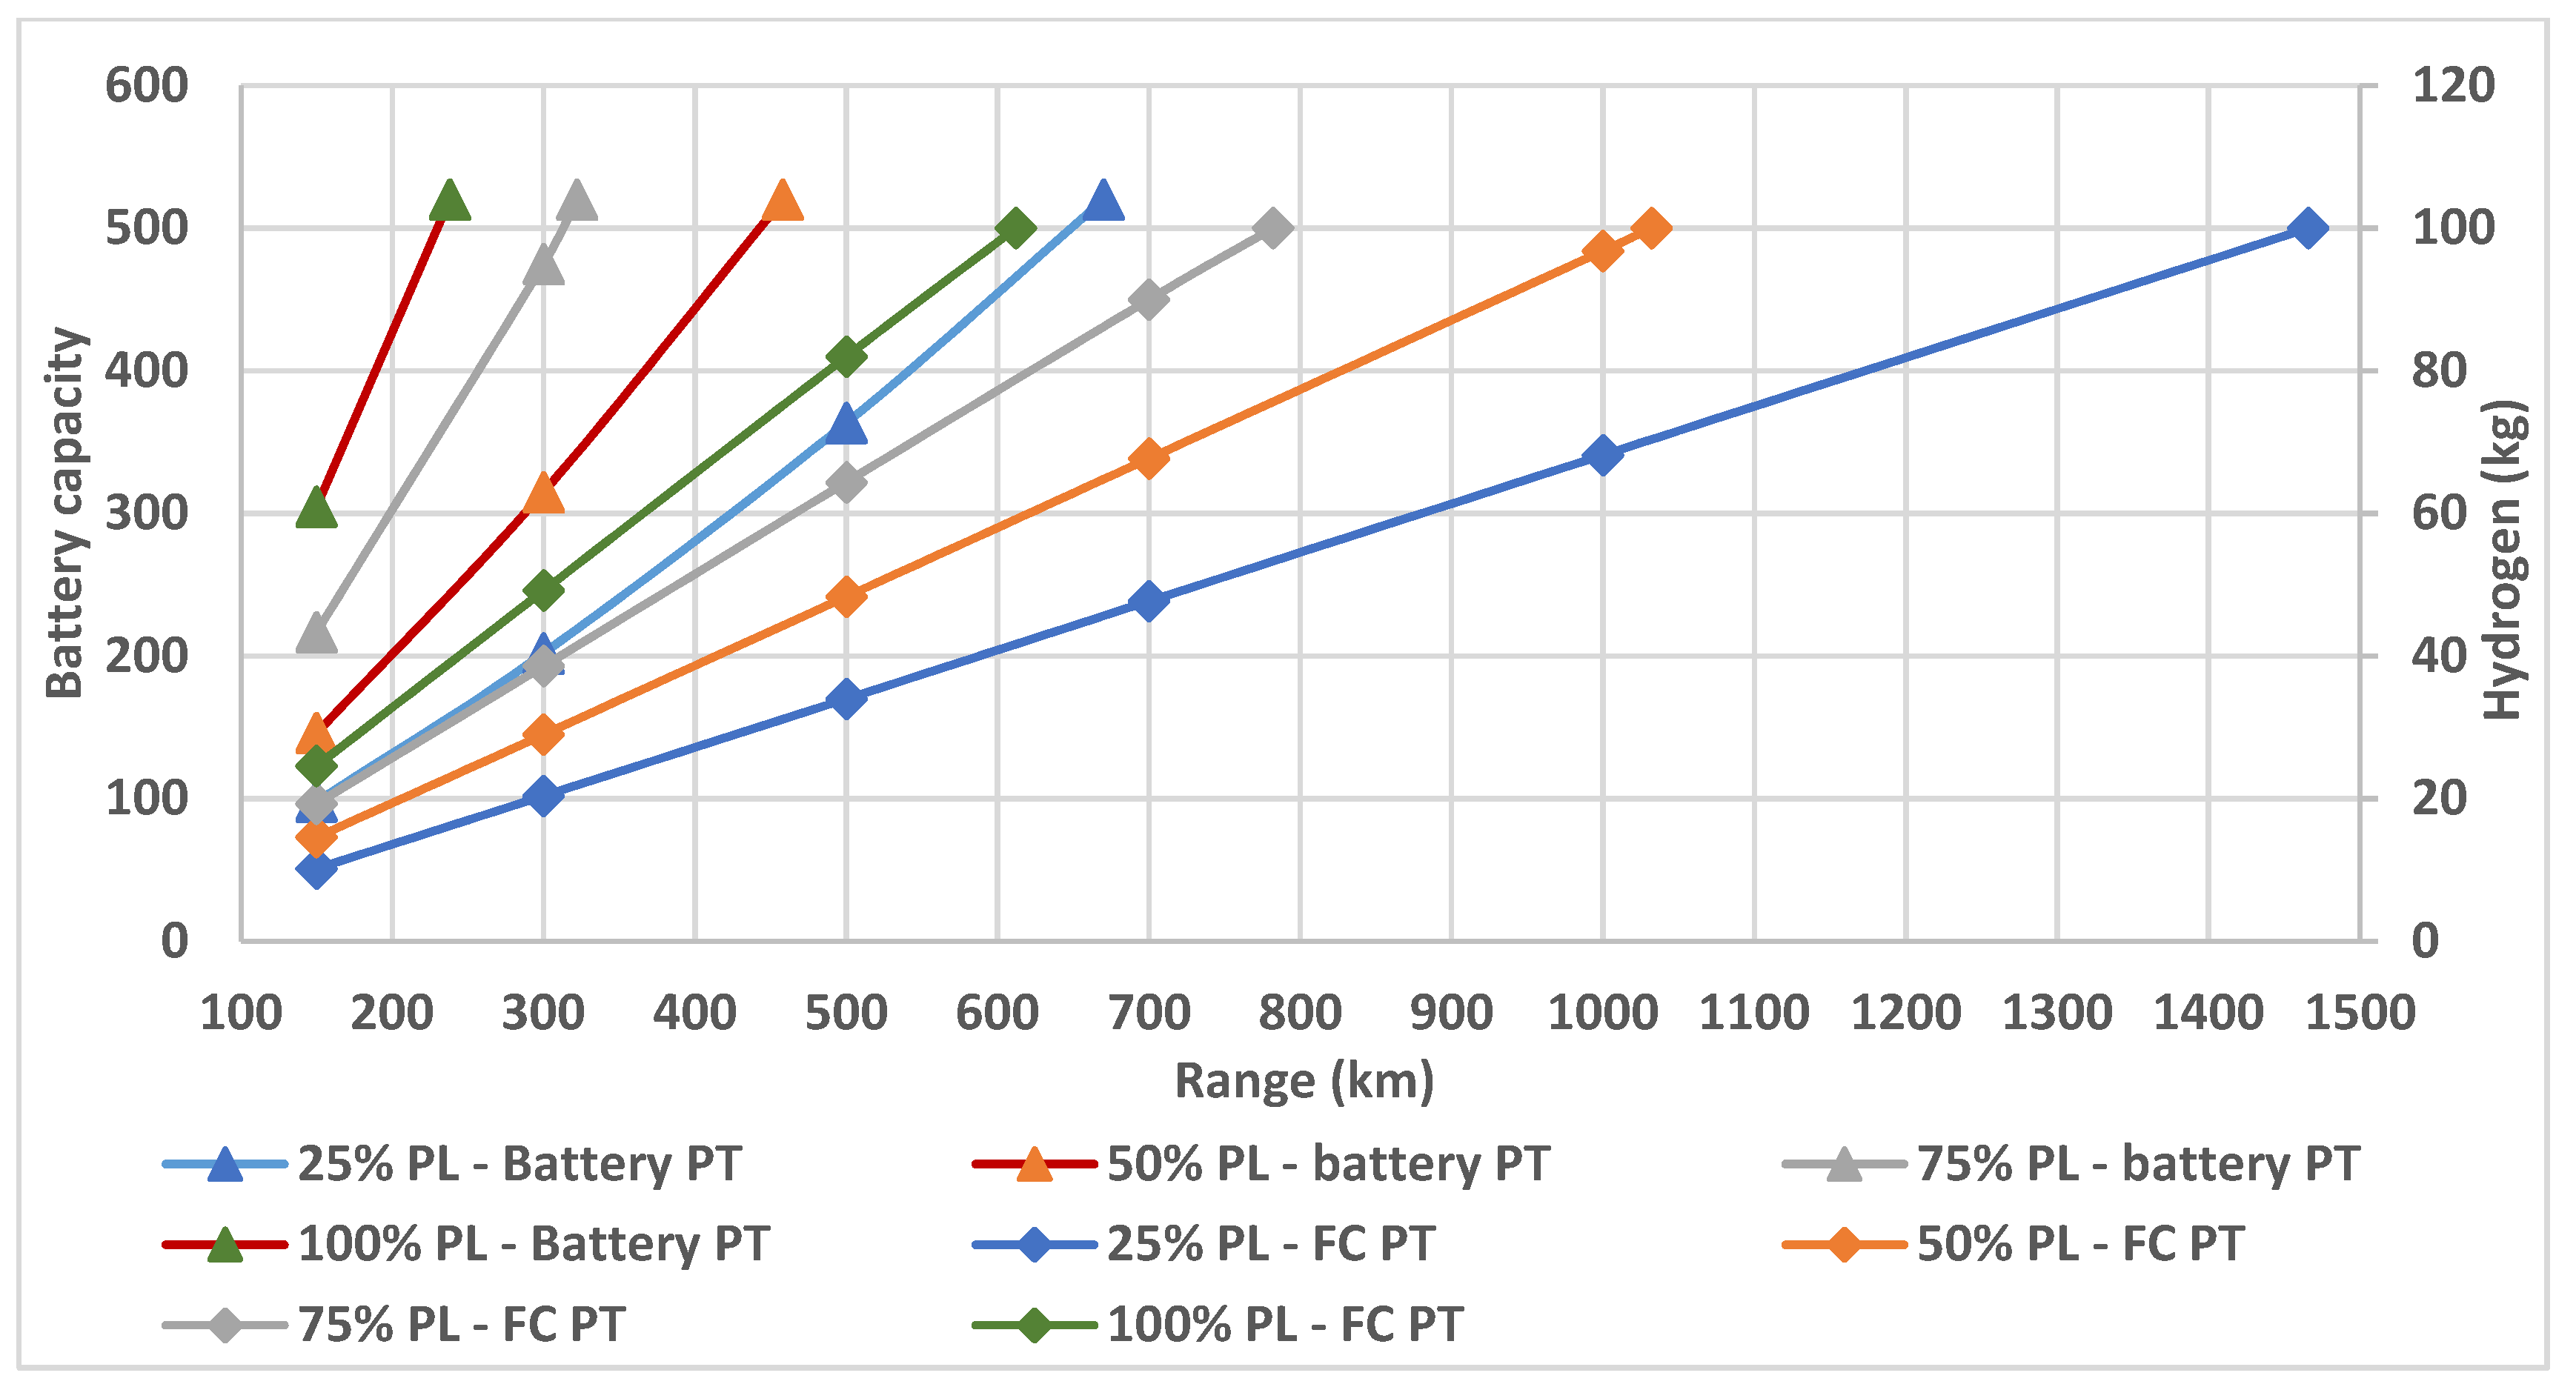
- Storage capacity assessment per vehicle type for diverse ranges with different payloads: The range is one of the key factors that affect the worldwide sales of EVs. The manufacturers test the vehicle segments with certified drive cycle under strict test conditions and only by considering 1 passenger as the driver. However, in real-world conditions, the performance varies drastically. Users do not follow certified drive cycle accelerations and face diverse road topography profiles, justifying the analysis through real-world drive cycles. Along with this, vehicle payload is aggravated in on-road conditions according to usage patterns, since vehicles can be fully or partially occupied. The vehicles presented in
Table 1 are studied for various drive cycles described in
Section 2.2 for the different payloads of 150, 250, 350, and 500 kg for light-duty vehicles. For the electric bus, simulations were carried out for 10, 25, 40, and 55 passengers considered as payload, while for the semi-truck 25%, 50%, 75%, and 100% of maximum payload capacity were considered.
From the analysis of existing BEV in the market, the average battery mass of the vehicle is estimated as 32% of the vehicle curb mass without the battery [
39,
40]. Assuming state of art batteries in forthcoming vehicles, an optimistic value of 35% is considered as the maximum energy storage mass. Furthermore, for bus and semi-truck, the ratio changes to 26% and 42% respectively [
41].
Table 3 shows the maximum battery mass for each vehicle segment and respective battery capacity based on the allocated battery mass and also the specifications assumed for the FCPT.
The average battery mass is considered as 8 kg/kWh, which is also estimated from the battery pack to weight ratio from the BEV available in the market [
10,
40]. For fuel cell vehicles, the maximum hydrogen storage in the FCEV at present for the light-duty vehicle is 5.6 kg [
42], which is also assumed for the light-duty vehicle simulations. For heavy-duty vehicles, a 100 kg H
2 storage capacity is considered, inspired by the latest long-range heavy-duty vehicle launched by Nikola Motors (Nikola 2 semi-truck) [
43]. Based on the hydrogen storage, the model estimates the storage tank mass, in addition to the vehicle mass.
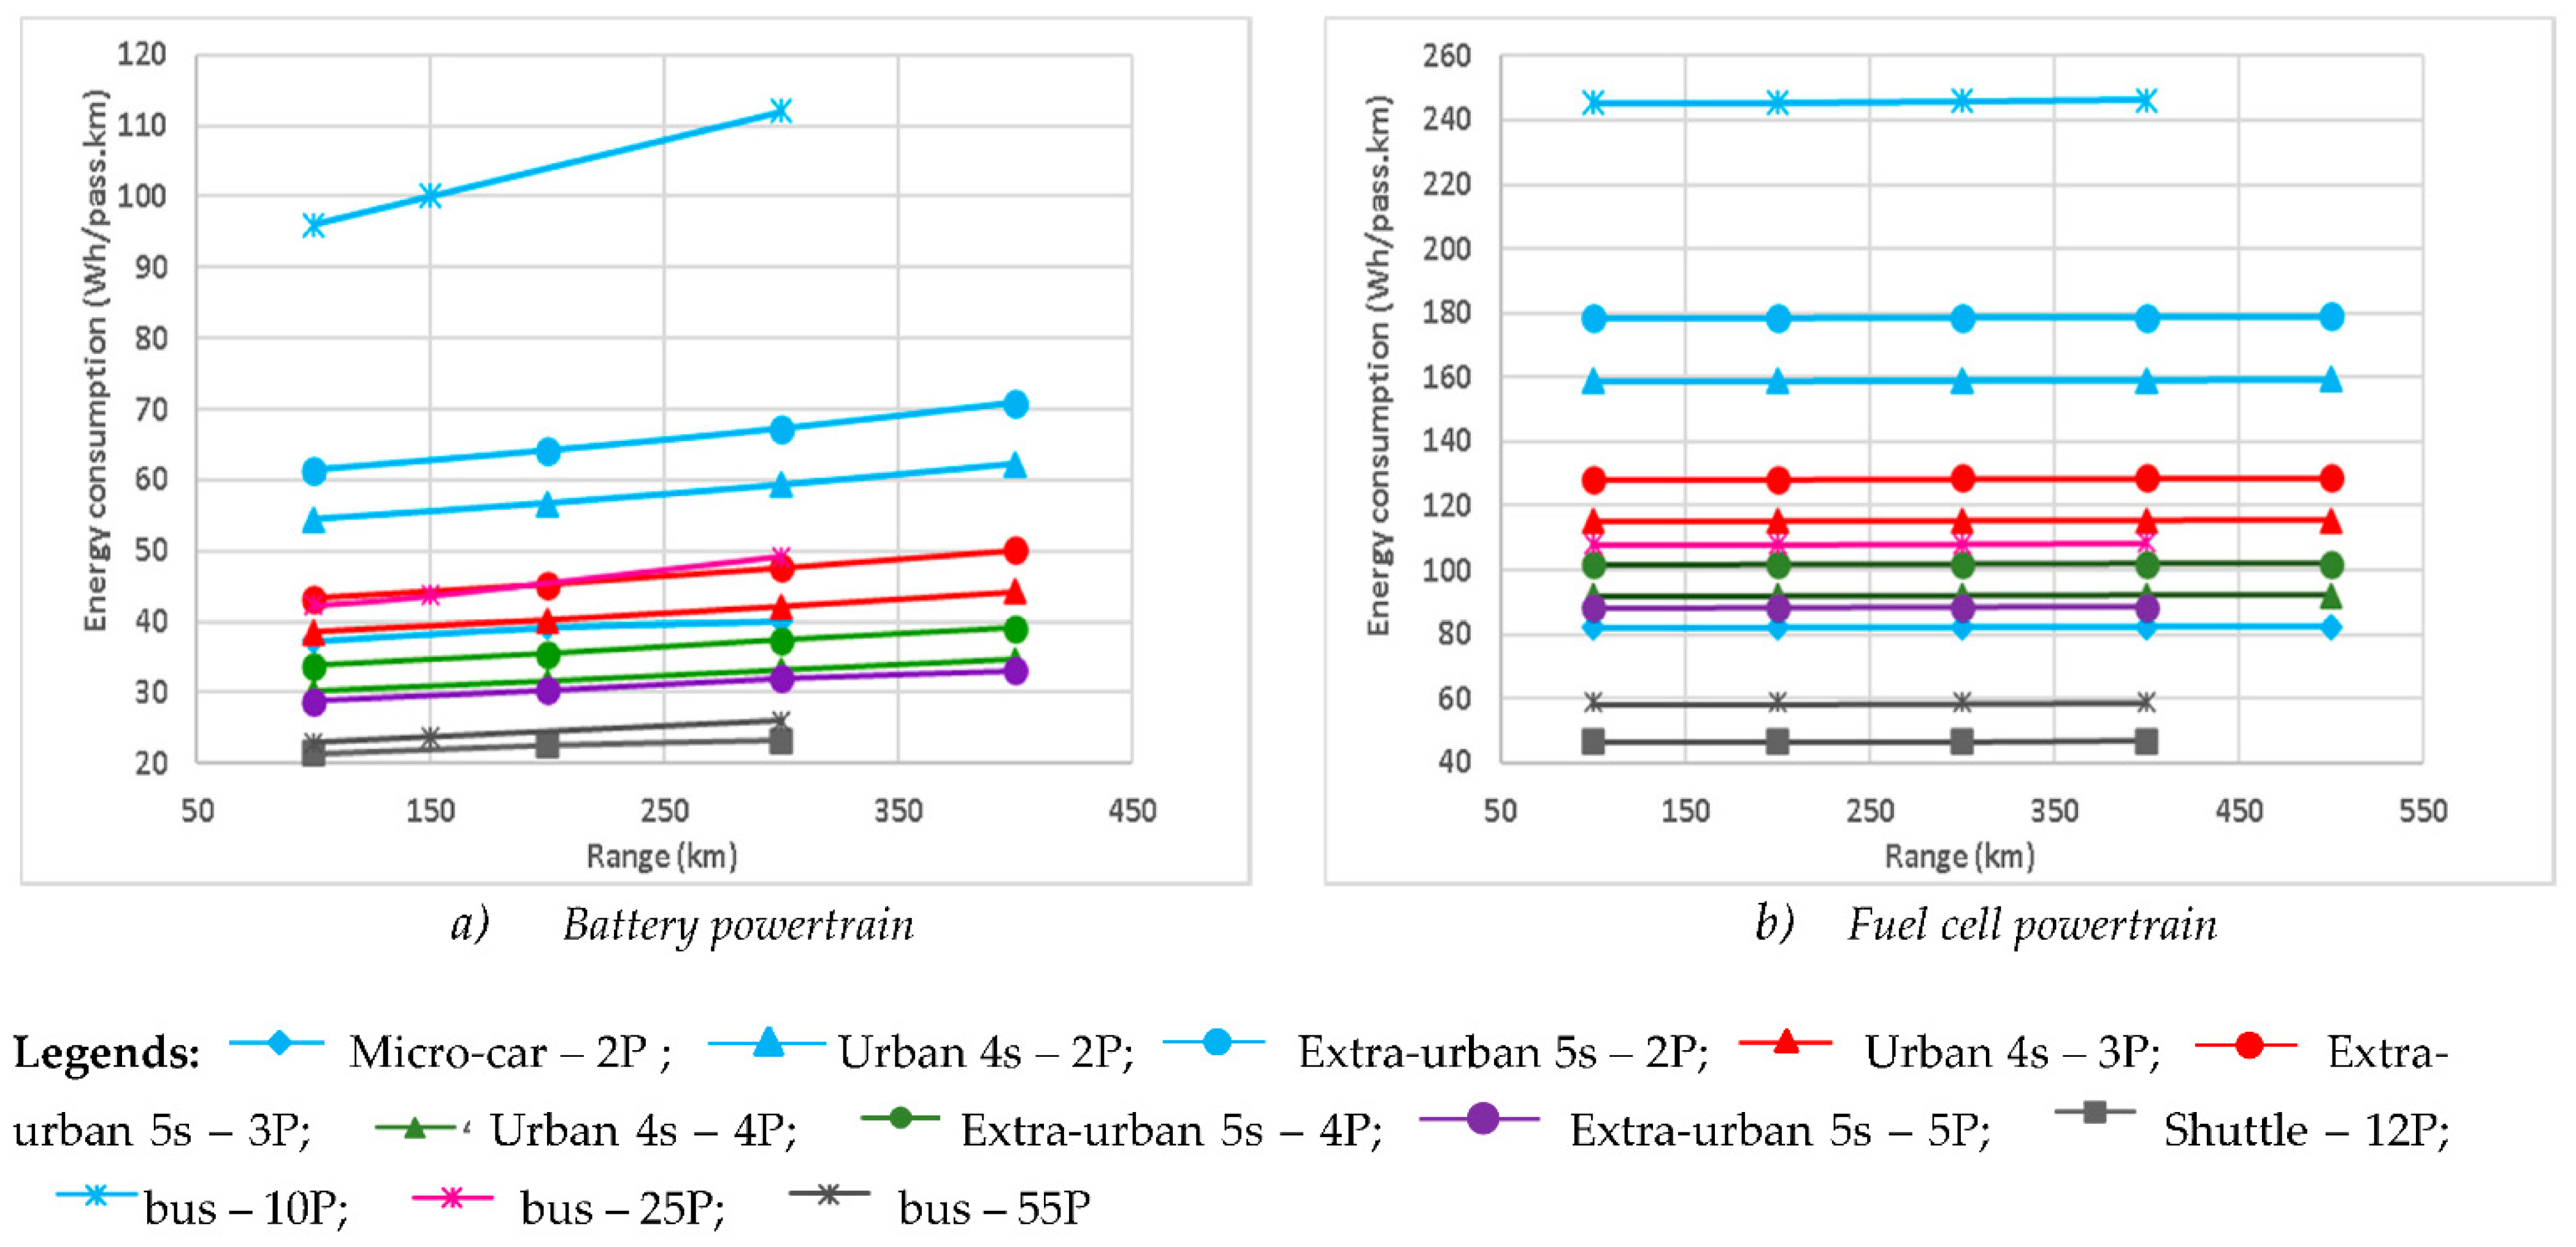
- Average energy consumption per km per person for different vehicle segments: It is to be noted that when we consider bigger vehicle types for transportation, presumably the average energy consumption will be higher than for the other smaller segments. By contrast, analyzing the number of passengers traveled, a five-seater vehicle may have the least average energy consumption for each passenger than a four-seater vehicle, which shows the five-seater vehicle has lesser average energy consumption per person. Although energy consumption per passenger is typically disregarded, it may retain significant importance in the future in the wider adoption of shared vehicle solutions. By analyzing the average energy consumption per person for unit distance, it is possible to identify the optimal vehicle segment selection based on the passengers.
- Powertrain cost analysis on vehicle segments: The cost of the vehicle is one of the important decision factors from the user’s point of view before buying an EV. In the market, ICEV gained the title of most affordable vehicles, while FCEV is the most expensive option, considering the same vehicle category, sandwiching BEV in between [
10]. However, for BEV and FCEV, the operation and maintenance cost is about 10–20% of the CAPEX, and ICE reaches up to 50%, which makes the total ownership cost almost equal to BEV over the vehicle’s lifetime [
10]. In this study, powertrain cost analysis is carried out, where the spending for different energy storage options and operation cost is analysed for the whole trip and also for transporting per passenger or unit payload.
The cost assumptions were based on the literature. Currently, due to the limited vehicle production, the unit FC stack production cost is around 175 €/kW [
10]. Increasing the production to 100,000 units/year can reduce the price below 60 €/kW [
44]. In this study, mass production of FC units has been considered. As for the fuel price, 0.21 €/kWh is considered as the electricity price and 11.3 €/kg for hydrogen, while the average maintenance cost is considered as 0.018 €/km for both vehicles [
10,
45]. Hydrogen storage cost is also included in the cost analysis based on the energy storage assumed for these vehicle types [
46]. Also, battery cost is estimated as 118 €/kWh presently [
46]. Additionally, this study considers the technological growth in the future and it is estimated that the price of hydrogen fuel could be dropped by 60% and reach 6.5 €/kg in 2030 [
47]. The battery would also become cheaper, with an estimated cost of 48 €/kWh in 2030 [
46].
 WLTP red.—Micro-car;
  WLTP red.—Urban 4s;
  WLTP red.—Extra-urban 5s;
  WLTP C3—Urban 4s;
  WLTP—Extra-urban 5s;
  RW_m—Micro-car;
  RW1—Urban 4s;
  RW1—Extra-urban 5s;
  RW2—Urban 4s;
  RW2—Extra-urban 5s;
  Micro-car—max capacity;
  Urban 4s—max capacity;
  Extra-urban 5s—max capacity.


