Article

Identification of the Optimal Passenger Car Vehicle Fleet Transition for Mitigating the Cumulative Life-Cycle Greenhouse Gas Emissions until 2050

1
Department of Mechanical Engineering, Institute for Mechatronic Systems in Mechanical Engineering, Technische Universität Darmstadt, 64287 Darmstadt, Germany
2
Department of Civil and Environmental Engineering Sciences, Institute IWAR, Chair of Material Flow Management and Resource Economy, Technische Universität Darmstadt, 64287 Darmstadt, Germany
*
Author to whom correspondence should be addressed.
Vehicles 2020, 2(1), 75-99; https://doi.org/10.3390/vehicles2010005
Submission received: 19 December 2019 / Revised: 14 January 2020 / Accepted: 20 January 2020 / Published: 24 January 2020
(This article belongs to the Special Issue Future Powertrain Technologies)

Abstract

:
We present an optimization model for the passenger car vehicle fleet transition—the time-dependent fleet composition—in Germany until 2050. The goal was to minimize the cumulative greenhouse gas (GHG) emissions of the vehicle fleet taking into account life-cycle assessment (LCA) data. LCAs provide information on the global warming potential (GWP) of different powertrain concepts. Meta-analyses of batteries, of different fuel types, and of the German energy sector are conducted to support the model. Furthermore, a sensitivity-analysis is performed on four key influence parameters: the battery production emissions trend, the German energy sector trend, the hydrogen production path trend, and the mobility sector trend. Overall, we draw the conclusion that—in any scenario—future vehicles should have a plug-in option, allowing their usage as fully or partly electrical vehicles. For short distance trips, battery electric vehicles (BEVs) with a small battery size are the most reasonable choice throughout the transition. Plug-in hybrid electric vehicles (PHEVs) powered by compressed natural gas (CNG) emerge as promising long-range capable solution. Starting in 2040, long-range capable BEVs and fuel cell plug-in hybrid electric vehicles (FCPHEVs) have similar life-cycle emissions as PHEV-CNG.

1. Introduction

The world community concurred to the goal of limiting global temperature rise to ideally 1.5 °C compared with the pre-industrial age during the United Nations climate conference in Paris in 2015. According to this, the German government set the goals of reducing greenhouse gas (GHG) emissions by 40% in 2020 (compared to 1990). The climate protection report of 2018 states that these climate targets will be missed. In contrast to the two main contributors—the energy sector and the industry sector—that will achieve almost a 40% GHG emission reduction by 2020, the GHG emissions of the mobility sector have only been reduced by 5% [1]. Consequently, in this sector there still is a lot of unlocked potential for climate protection.
This study addresses this issue focusing on the vehicle fleet transition and minimizing its GHG emissions. In contrast to this study, previous studies have made prognostics of the German vehicle fleet transition following different approaches without minimizing the GHG emissions. Supported by the Transport Emission Model (TREMOD), a project of the German Federal Environment Agency (UBA), Knörr et al. predict 7.5 and 44 million vehicles with plug-in option for the years 2020 and 2035 respectively [2]. In 2035, this corresponds to roughly 90% of the fleet according to their calculations. This model has been developed over 20 years ago and since then been improved and expanded several times. Its main goal was to calculate the emissions of the German transport sector. The German Aerospace Center (DLR) has developed the simulation model VECTOR21 [3]. They predict that by 2040 only 35% of the fleet will have a plug-in option. The simulations are based on the customer perspective and reflect the limited acceptance these powertrain classes currently have. The model includes a total cost of ownership approach, which calculates the lifelong costs which have to be covered by the respective owners. VECTOR21 minimizes this cost and this way determines the future fleet composition. Interestingly, Harrison et al. conclude that even assuming high user acceptance, by 2050 only 50% of the fleet will have a plug-in option [4]. Their model was specifically developed to gain insights in influences on the adoption rates of new technologies that can be applied in a policy context. Therefore, they modeled several agents of the automobile sector including their interactions. Plötz et al. determine the vehicle fleet transition with special focus on the resulting electricity demand. Similar to VECTOR21, their model relies on a total cost of ownership approach. They base the distribution of annual vehicle kilometers travelled over different vehicle classes on a large dataset of driving profiles from Germany. They predict that in 2050 approx. 60%—or 25 million vehicles—will have a plug-in option [5]. Overall, the prognostics have very differing outcomes depending on who performed them and what their modelling approach was. When comparing different studies and prognostics regarding the German vehicle fleet, one finds that most of them predict a transition to more hybrid electric vehicles (HEVs) without plug-in option, plug-in hybrid electric vehicles (PHEVs), battery electric vehicles (BEVs), and fuel cell electric vehicles (FCEVs). However, as the outcomes of most studies predict, even in the next 20 to 30 years, these alternative powertrain classes will not replace conventional internal combustion engines vehicles (ICEVs) completely. In some studies, the purchasing behavior plays an important role. According to the studies, only a limited customer segment feels comfortable switching to PHEVs, BEVs, and FCEVs.
In the present paper, we focus on the minimum achievable GHG emission potential—hereinafter referred to as ecological potential—of passenger car vehicles in the vehicle fleet. For this purpose, we research available life-cycle assessment (LCA) data. An essential difficulty in LCAs of passenger car vehicles lies in the many varying factors that influence its GHG emissions. Especially for PHEVs the differing charging behavior of different users can lead to very different outcomes when looking at the GHG emissions. This uncertainty adds to the fact that the GHG emissions caused by the electrical consumption differ depending on the energy sector composition in every region.
A series of studies have performed LCAs on series production vehicles, which is a common approach to assess the life-cycle GHG emissions of current state-of-the-art powertrain technologies [6,7,8]. However, when explicitly comparing the ecological potential of different powertrain concepts, the meaningfulness of these studies has to be questioned. This is because series production vehicles were not dedicatedly designed to minimize their GHG emissions and, therefore, will not represent the true ecological potential of their powertrain concept. Further, a powertrain concept can have different parametrizations, thus, the LCA of one specific series production vehicle does not allow generalized conclusions on the powertrain concept. In [9] an optimization framework was introduced, that allows to design the powertrain concepts so that the ecological potential is achieved. Using this approach, we ensure that no powertrain concepts are excluded from the fleet transitions due to non-optimal powertrain parametrizations.
Our team conducts comprehensive analyses of the production phase, the operational phase—taking into account the energy mix for electricity production—and the end-of-life (EoL) phase. We model the German fleet transition until 2050 and calculate the cumulative GHG emissions, including all life-cycle phases of all vehicles. The cumulative GHG emissions serve as objective value for an optimization problem, which enables us to determine the GHG-optimal fleet transition. This way, we are able to make a precise time-based assessment of the GHG emissions of different powertrain concepts taking into account the dynamic interaction of the vehicle fleet with the energy sector. Furthermore, the results serve as guideline as to which powertrain concepts should be introduced at which point in time in order to reduce the GHG emissions of the German vehicle fleet as a whole. Unlike other prognostics, this study is not intended to show the most likely transition of the German vehicle fleet. Instead, the GHG-optimal transition paths for different scenarios are identified and analyzed to gain comprehensive knowledge about similarities in different scenarios that can be used as a guideline for decision makers.
In Section 2.1, we discuss relevant technology parameters, such as the specific energy and the GHG emissions of battery production. In addition, different fuel types are analyzed regarding their GWP100—the GWP over a time span of 100 years—and the expected energy sector transition to more renewable energy sources in Germany will be addressed. Section 2.2 covers the different future scenarios that will be optimized and 2.3 describes the vehicle and its life-cycle GHG emissions. In Section 3, we identify the optimal fleet transitions for various scenarios and in Section 4 we draw our conclusions.

2. Optimization Model of the Vehicle Fleet Transition

As mentioned earlier, the present paper aims at identifying the GHG-optimal fleet transition in Germany. On one hand, our model shows some similarities with the models of previous studies mentioned in the introduction. In fact, we are talking about a replacement model in all cases, because existing vehicles are replaced by new vehicles once they achieve their specific lifetime mileage. On the other hand, our model differs significantly in other aspects. In particular, user acceptance has a very limited effect in our model. The only relevant aspect is that most users expect their vehicles to have a minimum range. Other than that, we make an accurate assessment of the GHG emissions stemming from electricity production considering the interaction with the electricity demand of the vehicle fleet. This way, we can precisely assess the GHG emissions of the operational phase of electrified powertrain classes. A detailed discussion on the German energy sector can be found in Section 2.1.3.
The powertrain concepts that we consider for the fleet transition are listed in Table 1. Under the powertrain class of conventional ICEV, four concepts are taken into consideration. The ICEV-E10 and ICEV-B7, which are powered by E10 and B7 respectively. E10 is a blend of petrol with 10% bioethanol and B7 is a blend of diesel and 7% biodiesel. Then we consider the ICEV-CNG and ICEV-LPG, which are powered by compressed natural gas (CNG) and liquefied petroleum gas (LPG) respectively. We only consider one hybrid powertrain concept without plug-in option: the mild hybrid electric vehicle powered by E10 (mHEV-E10). Further, we account for PHEV variants that are powered by E10, CNG, and hydrogen. For E10 and CNG there are three variants of the powertrain class with varying battery size (PHEV10 possesses a 10 kWh battery). Finally, we have the BEV with two different battery size variants and two fuel cell electric vehicles (FCEVs), one of them having a plug-in option and a battery size of 20 kWh (FCPHEV20). Regarding the different concepts, the BEV20 is the only concept that is not considered as long-range capable, which will become relevant to fulfill the user acceptance constraints during the fleet optimization. Furthermore, as explained in the introduction, each powertrain concept is parametrized to achieve minimal GHG emissions using the approach presented in [9]. This way, we ensure that no powertrain concepts are excluded due to non-optimal powertrain parametrizations.

2.1. Meta-Analysis of Life-Cycle GHG Emissions

The following subsections give an overview of meta-analysis results regarding the battery production GHG emissions and the fuel-related GHG emissions. In addition, the emission factors of the German energy sector and their contribution to the mean specific GHG emissions factor are described.

2.1.1. Meta-Analysis of the Life-Cycle GHG Emissions of Batteries

In general, for powertrain classes with a high voltage battery—which includes all vehicles with plug-in option in this study—the GHG emissions of the battery production represent a very important factor. Relevant battery characteristics for the considered use case—a mobile energy storage unit—are the following: specific energy, specific power, time to fully charge, self-discharge, memory-effect, and lifetime expectancy. Since lithium-ion (li-ion) batteries have proven by far as the most apt technology in the market regarding these requisites, we focus on them [10]. The two most important factors relevant for the present study are the production emissions and the specific energy. In the Supplementary Data, Table S1 [11], we have performed a meta-analysis of different studies regarding characteristics of li-ion batteries used in vehicles as traction batteries. These data points allow for a confident estimation of the GWP100 and the specific energy in present and future scenarios. The left side of Figure 1 shows the distribution of researched values regarding the GHG emissions of current and future battery production in 2025. The median value is approx. 16 kgCO2-equivalents (CO2-eq.) per kg battery. On the right side, we find the distribution of researched values regarding the specific energy of li-ion battery systems that can be reached nowadays. Further, prognostics for 2030 and 2040 predict specific energies of 500 and up to 700 Wh/kg battery. These prognostics include lithium-sulfur batteries—a different, lithium-based battery type. The median values marked in red are used in Section 2.2.1 as reference values for the first years of the fleet transition. The consideration of future technological improvements is also presented in Section 2.2.1.

2.1.2. Meta-Analysis of the Life-Cycle GHG Emissions of Fuels

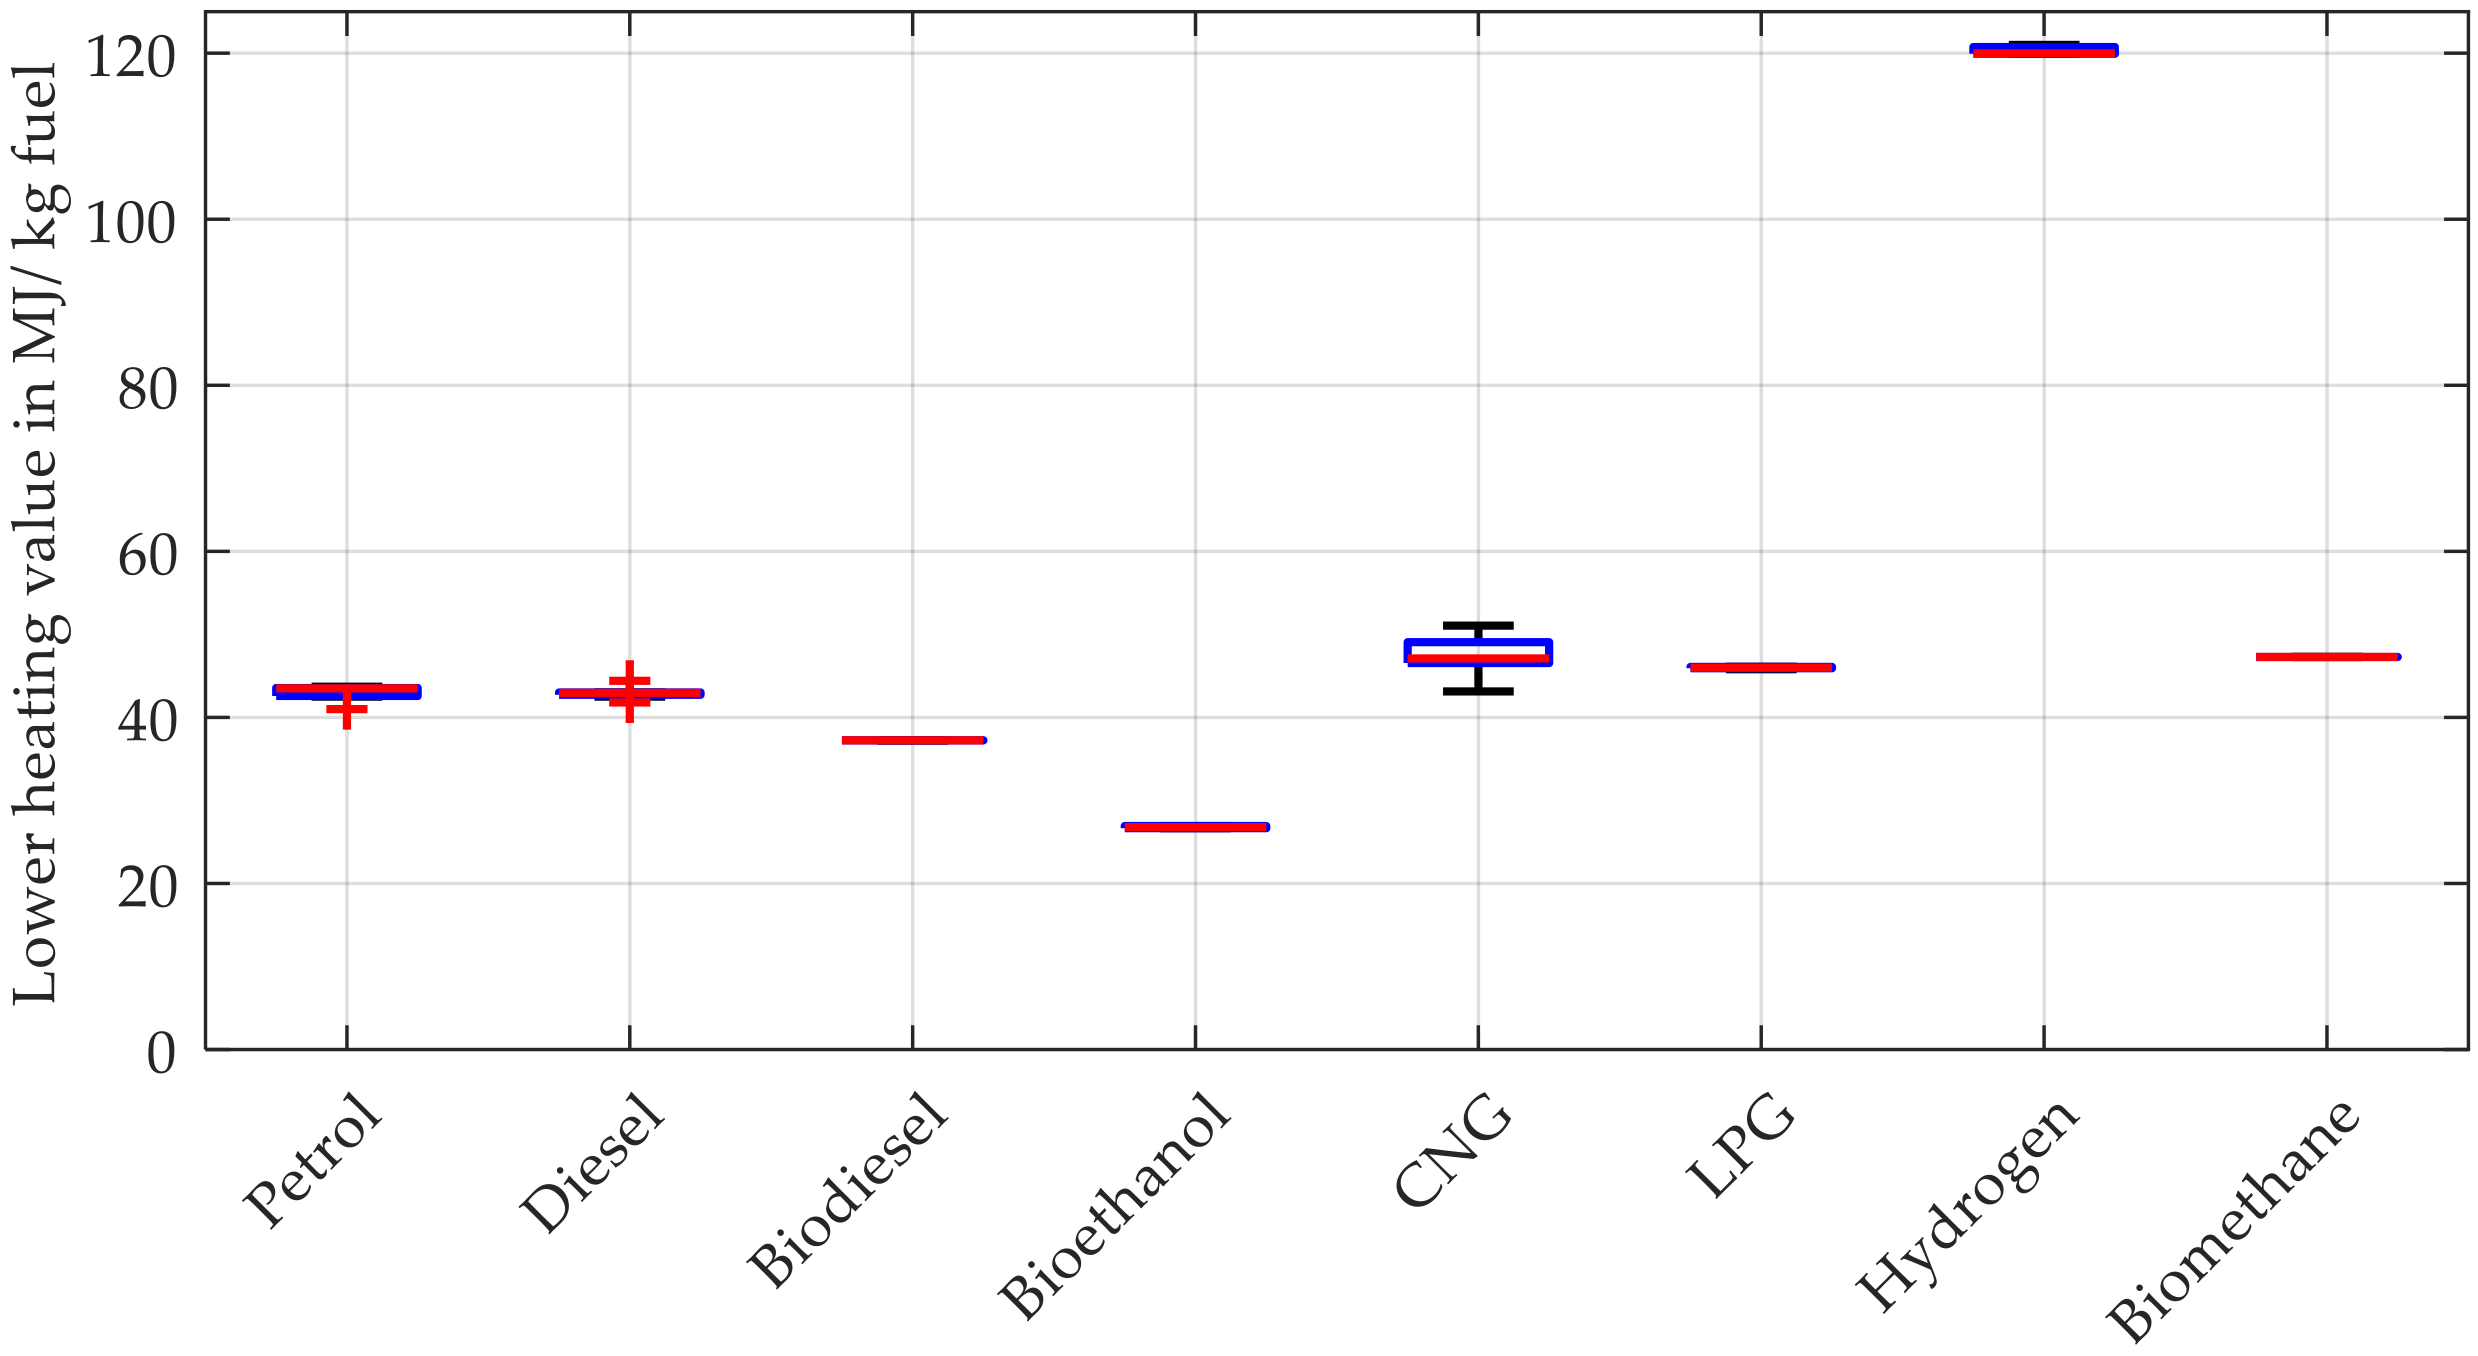
For the optimization process in Section 3, we need to gain insights regarding the operational phase of the vehicles. Therefore, we are comparing the characteristics of conventional fuels, i.e., petrol and diesel, with CNG, LPG, and hydrogen resulting from a meta-analysis of available research. Furthermore, we are considering biofuels and conventional fuels blended with biofuels. Supplementary Data, Table S2 contains all researched data points regarding the fuels [12]. Figure 2 shows the lower heating value for all fuel types considered. Only in the case of CNG, there are significant variations in the literature. This is due to the fact that the chemical composition of CNG slightly varies depending on its region of origin.
The densities of liquefied fuels are listed in Table 2.
In Figure 3 we compare the GHG emissions of the state-of-the-art fuel supply for all fuels. Our research lead to relatively accurate results for most fuels, except for hydrogen, which has the highest and most scattering specific emission values during fuel supply in the literature. The values vary strongly, because they highly depend on the chosen production path.
Hydrogen production nowadays has a very high GWP100 when compared to other liquid fossil fuels, due to the currently dominant production paths. The three main production paths are steam gas reformation, coal gasification, and electrolysis. All of these processes are very energy intensive and add to the energy expenses for subsequent compression. In theory, electrolysis powered with renewable energy would lead to the lowest production emissions of all fuels. Unfortunately, the German energy sector is not yet carbon neutral and there is currently not enough capacity for electrolysis on a large scale within Germany. In 2006, electrolysis represented only 4% of global hydrogen production [16]. There are several studies predicting an efficiency increase of electrolysis from 65% in 2017 to 68% in 2025 [17,18]. Optimistic studies even predict a 95% efficiency in 2050. One main advantage of hydrogen is that there are no direct emissions during the operational phase of a FCEV.
Very optimistic low hydrogen supply emission values, i.e., electrolysis with carbon neutral electricity, are not displayed in Figure 3, because this production path is not representative of current hydrogen production. Its GHG emissions would be reduced to transport and compression—approx. 2.4 kgCO2-eq./kg hydrogen. This represents a great opportunity for future reduction of its GWP100 during fuel supply.
Figure 4 compares the direct emissions of the different fuels. Because of their chemical composition, gaseous fuels like LPG and CNG have lower GHG emissions per energy unit than liquid fossil fuels. CNG, whose main component is methane, has the lowest direct emissions—apart from hydrogen.
In the context of the fleet transition modeled within this work, GHG emissions from fuel supply and the direct fuel emissions remain constant over the years with the exception of hydrogen. Because of its high variability during fuel supply depending on the chosen production path and further increases in electrolysis efficiency, hydrogen related GHG emissions are modelled separately. Detailed insights can be found in Section 2.2.3.
The chemical composition of synthetic natural gas (SNG)—either biomethane or methane synthesized via electricity-powered methanation (e-methane)—is almost identical to the one of CNG. This means that it can theoretically replace CNG in fuel tanks and gas pipes by 100% [19]. Similar to hydrogen, if the production of SNG is powered by carbon neutral electricity, there is ecological potential to be exploited. Since in 2012 biomethane was only present in niche markets representing 0.1% of total fuel consumption in Germany and there is not enough e-methane production capacity in Germany, it is not explicitly modelled in Section 2.2 [20].

2.1.3. Emissions Factors of the German Energy Sector from Today till 2050

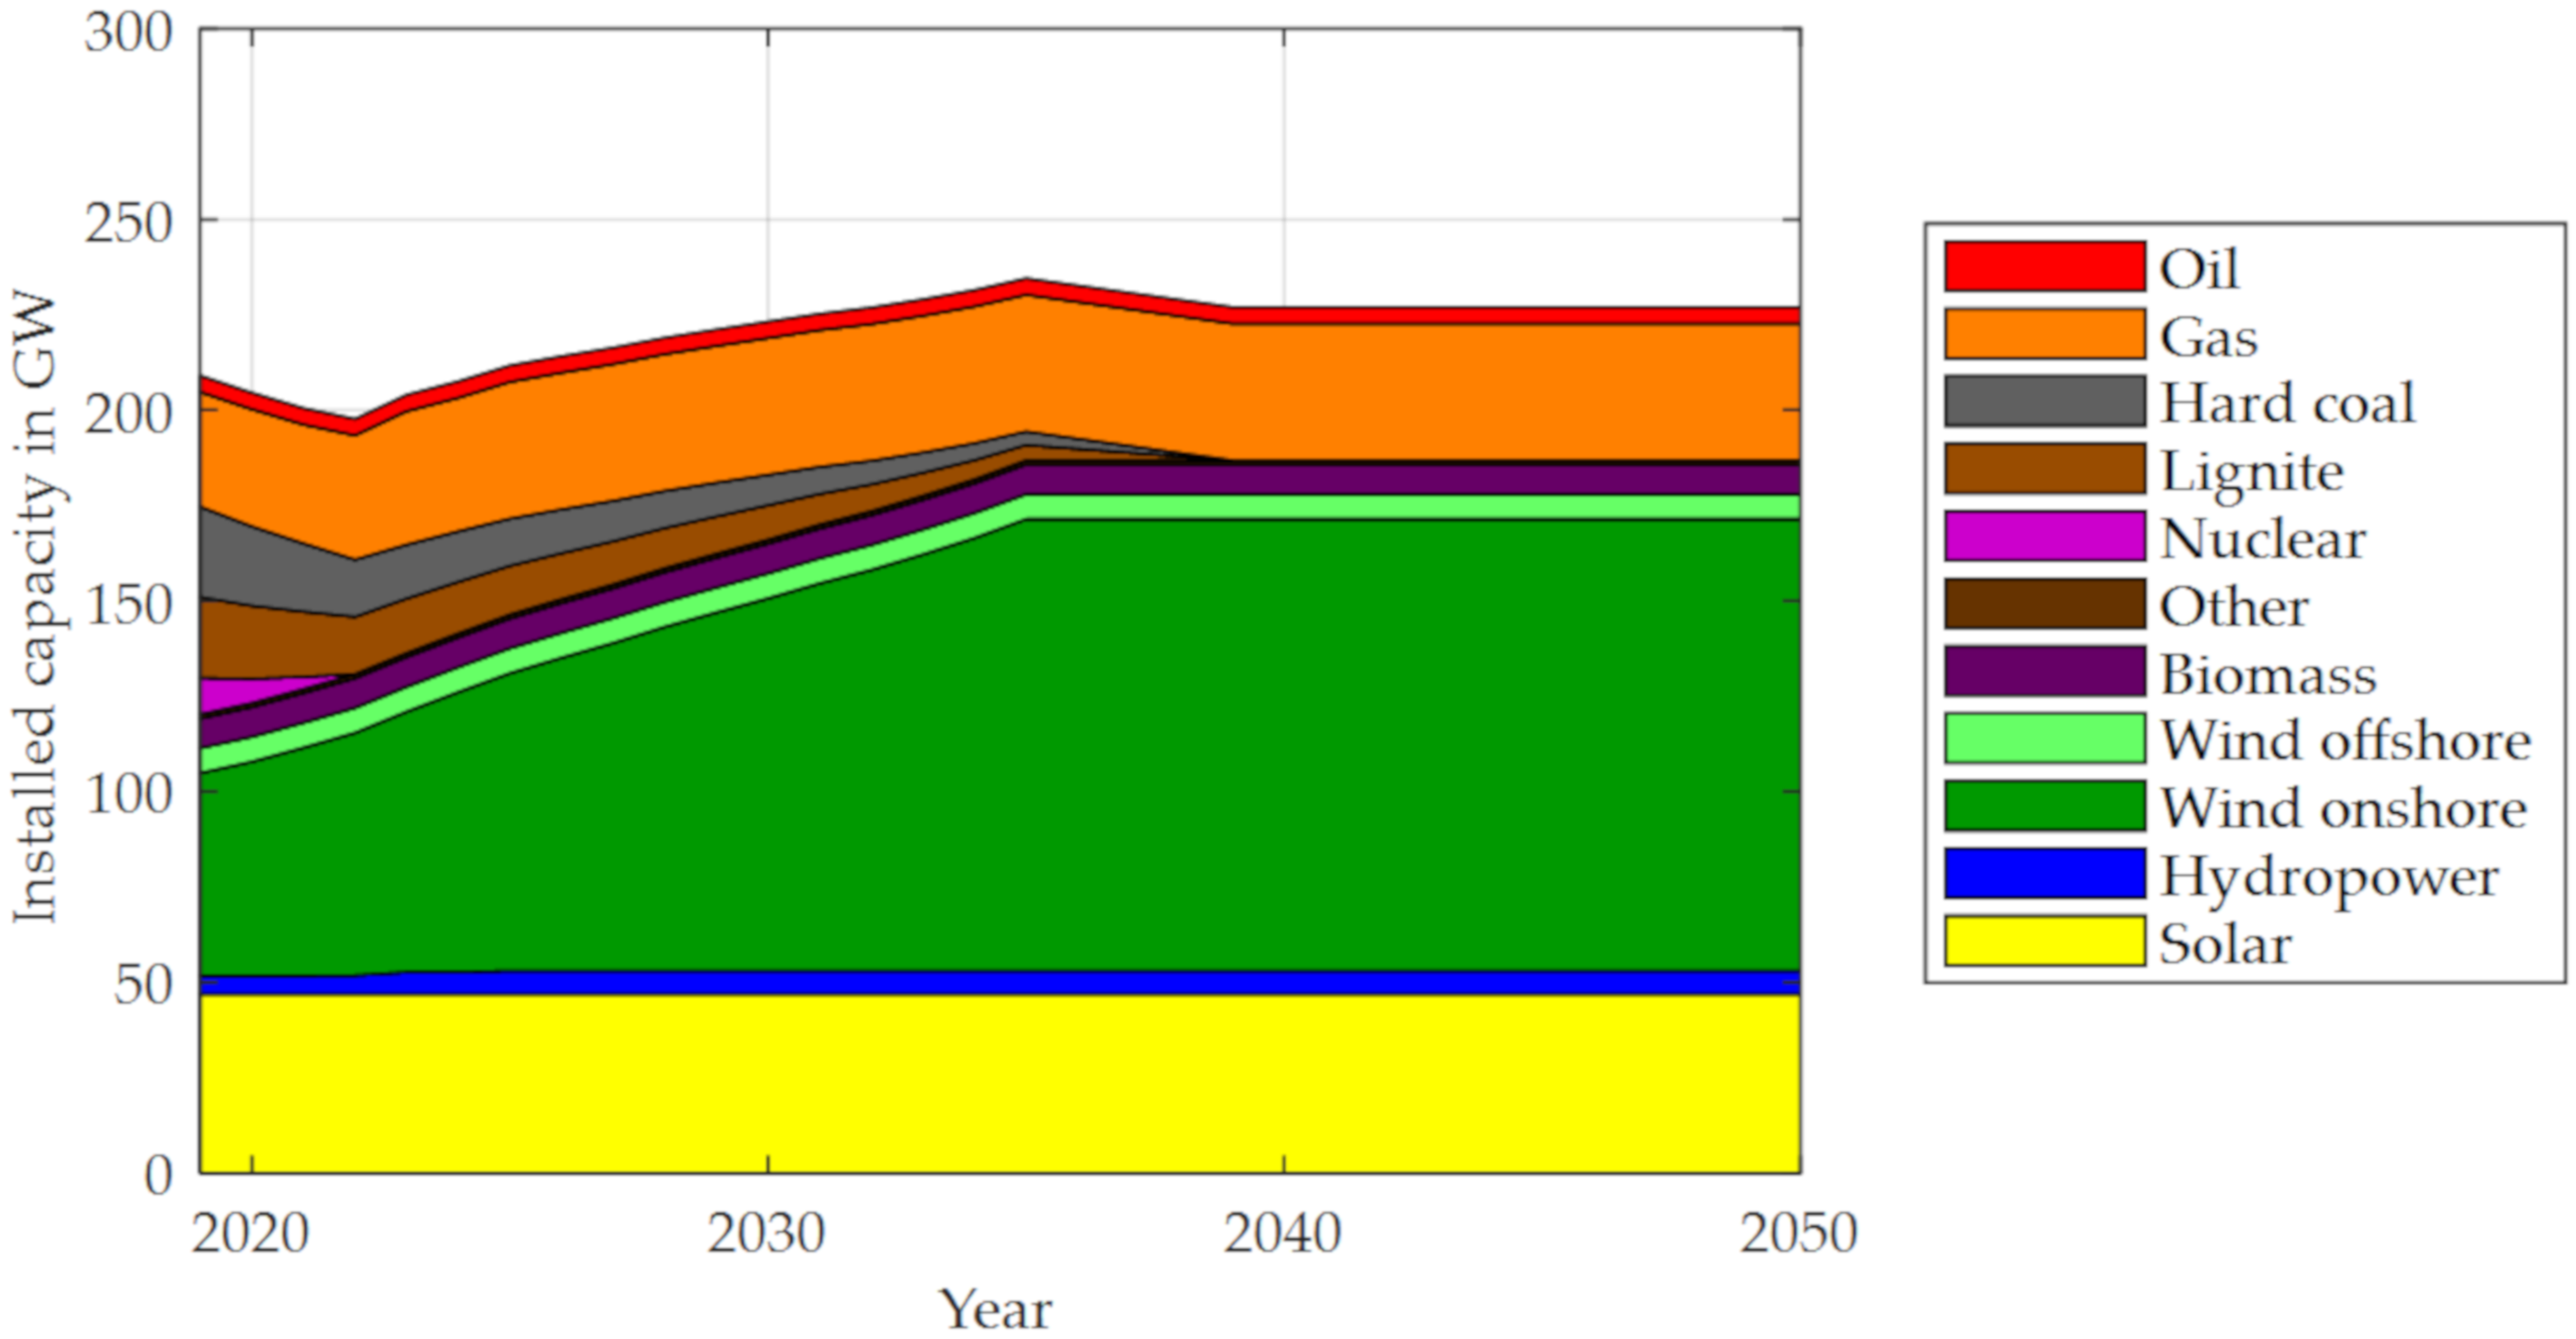
The modelling of the German energy sector is of central relevance for conducting a reliable analysis and optimization. Figure 5 displays the energy mix in terms of installed capacity. Dominant trends are the gradual reduction of installed capacity related to coal, the out-phasing of nuclear energy, and the further expansion of wind power [21,22,23].
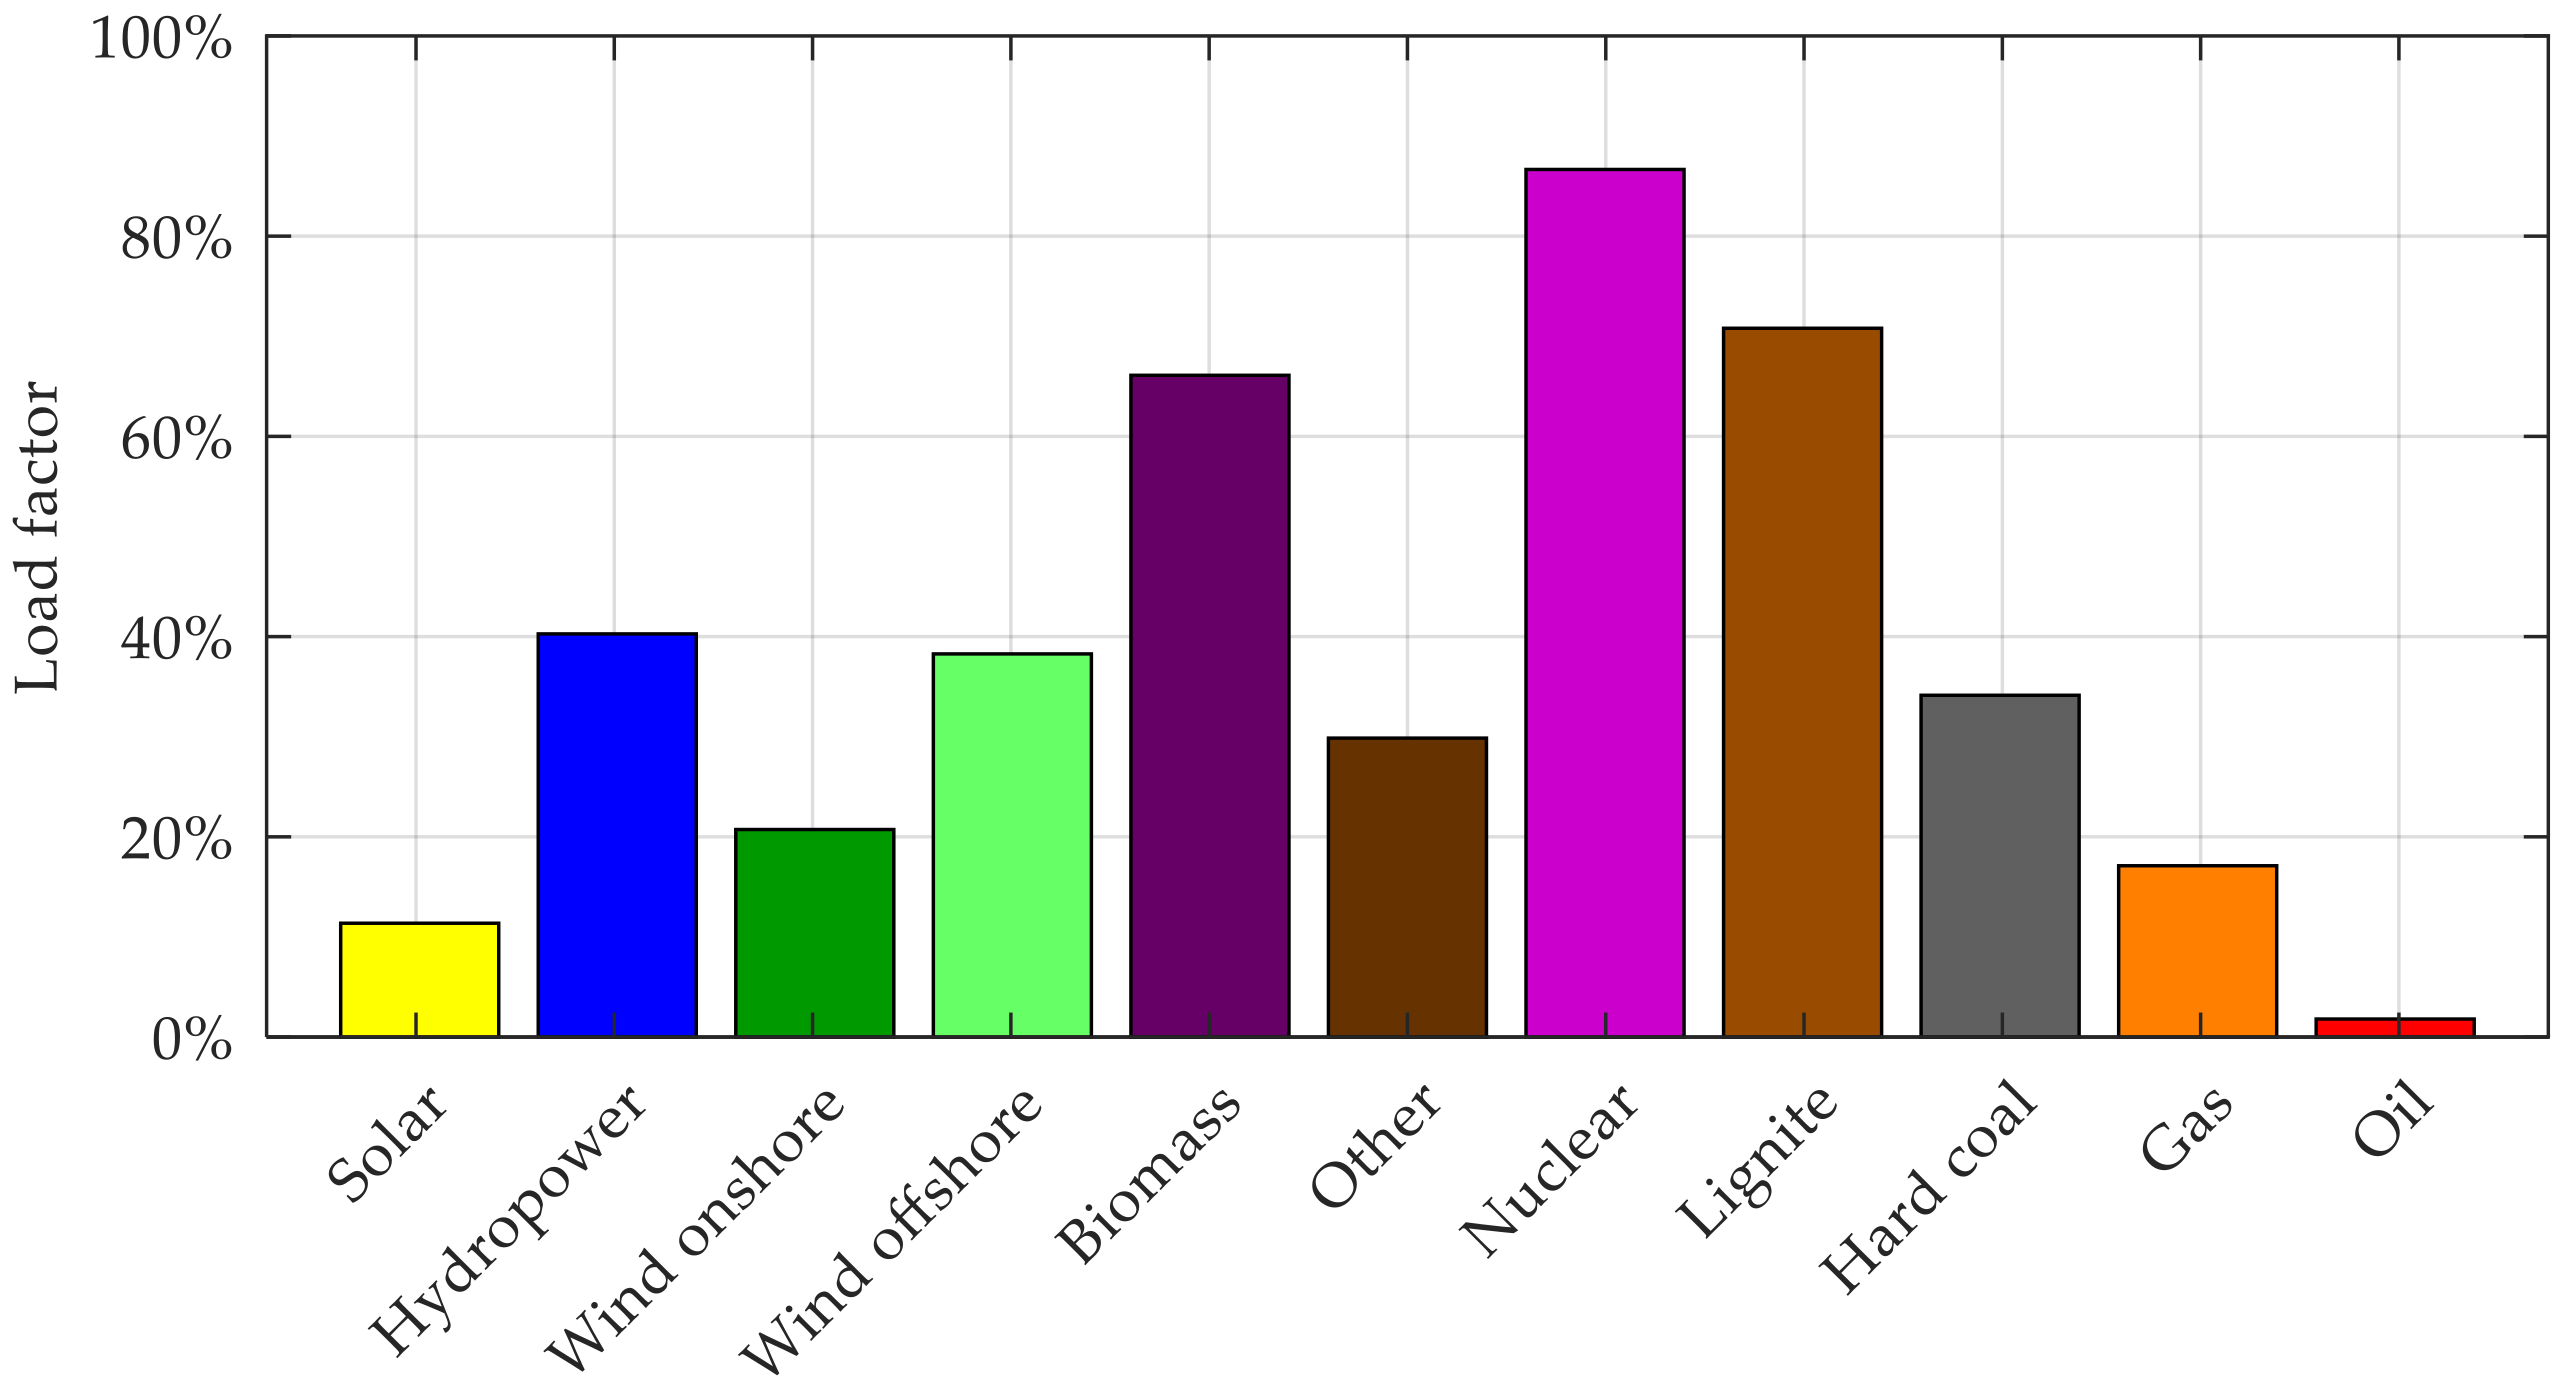
The actual energy output of a power plant over a given period of time divided by the theoretically maximum possible energy output over that same period of time is defined as load factor. Figure 6 displays the load factors of German power plants for 2018 divided by energy source. The electricity production of renewable energies precedes other energy sources by law and, therefore, is mostly independent of economic criteria. Thus, the load factors of renewable energies are mainly influenced by climatological phenomena and not by economic considerations. We assume them to be constant over the time horizon considered in this study. The remaining load factors depend on several other factors. Important to mention are the flexibility of different power plants in reacting to demand variations and the cost of operating different power plants. A closer look at the actual electricity production in 2018 reveals that hard coal, gas, and oil show greater variations than other non-renewable energy sources [24]. This leads to the conclusion that they are more likely to be used for satisfying demand variations. Consequently, in our model, most load factors remain constant—as in 2018—while the load factors of hard coal, gas, and oil will be adapted on a yearly basis in order to match the actual electricity demand.
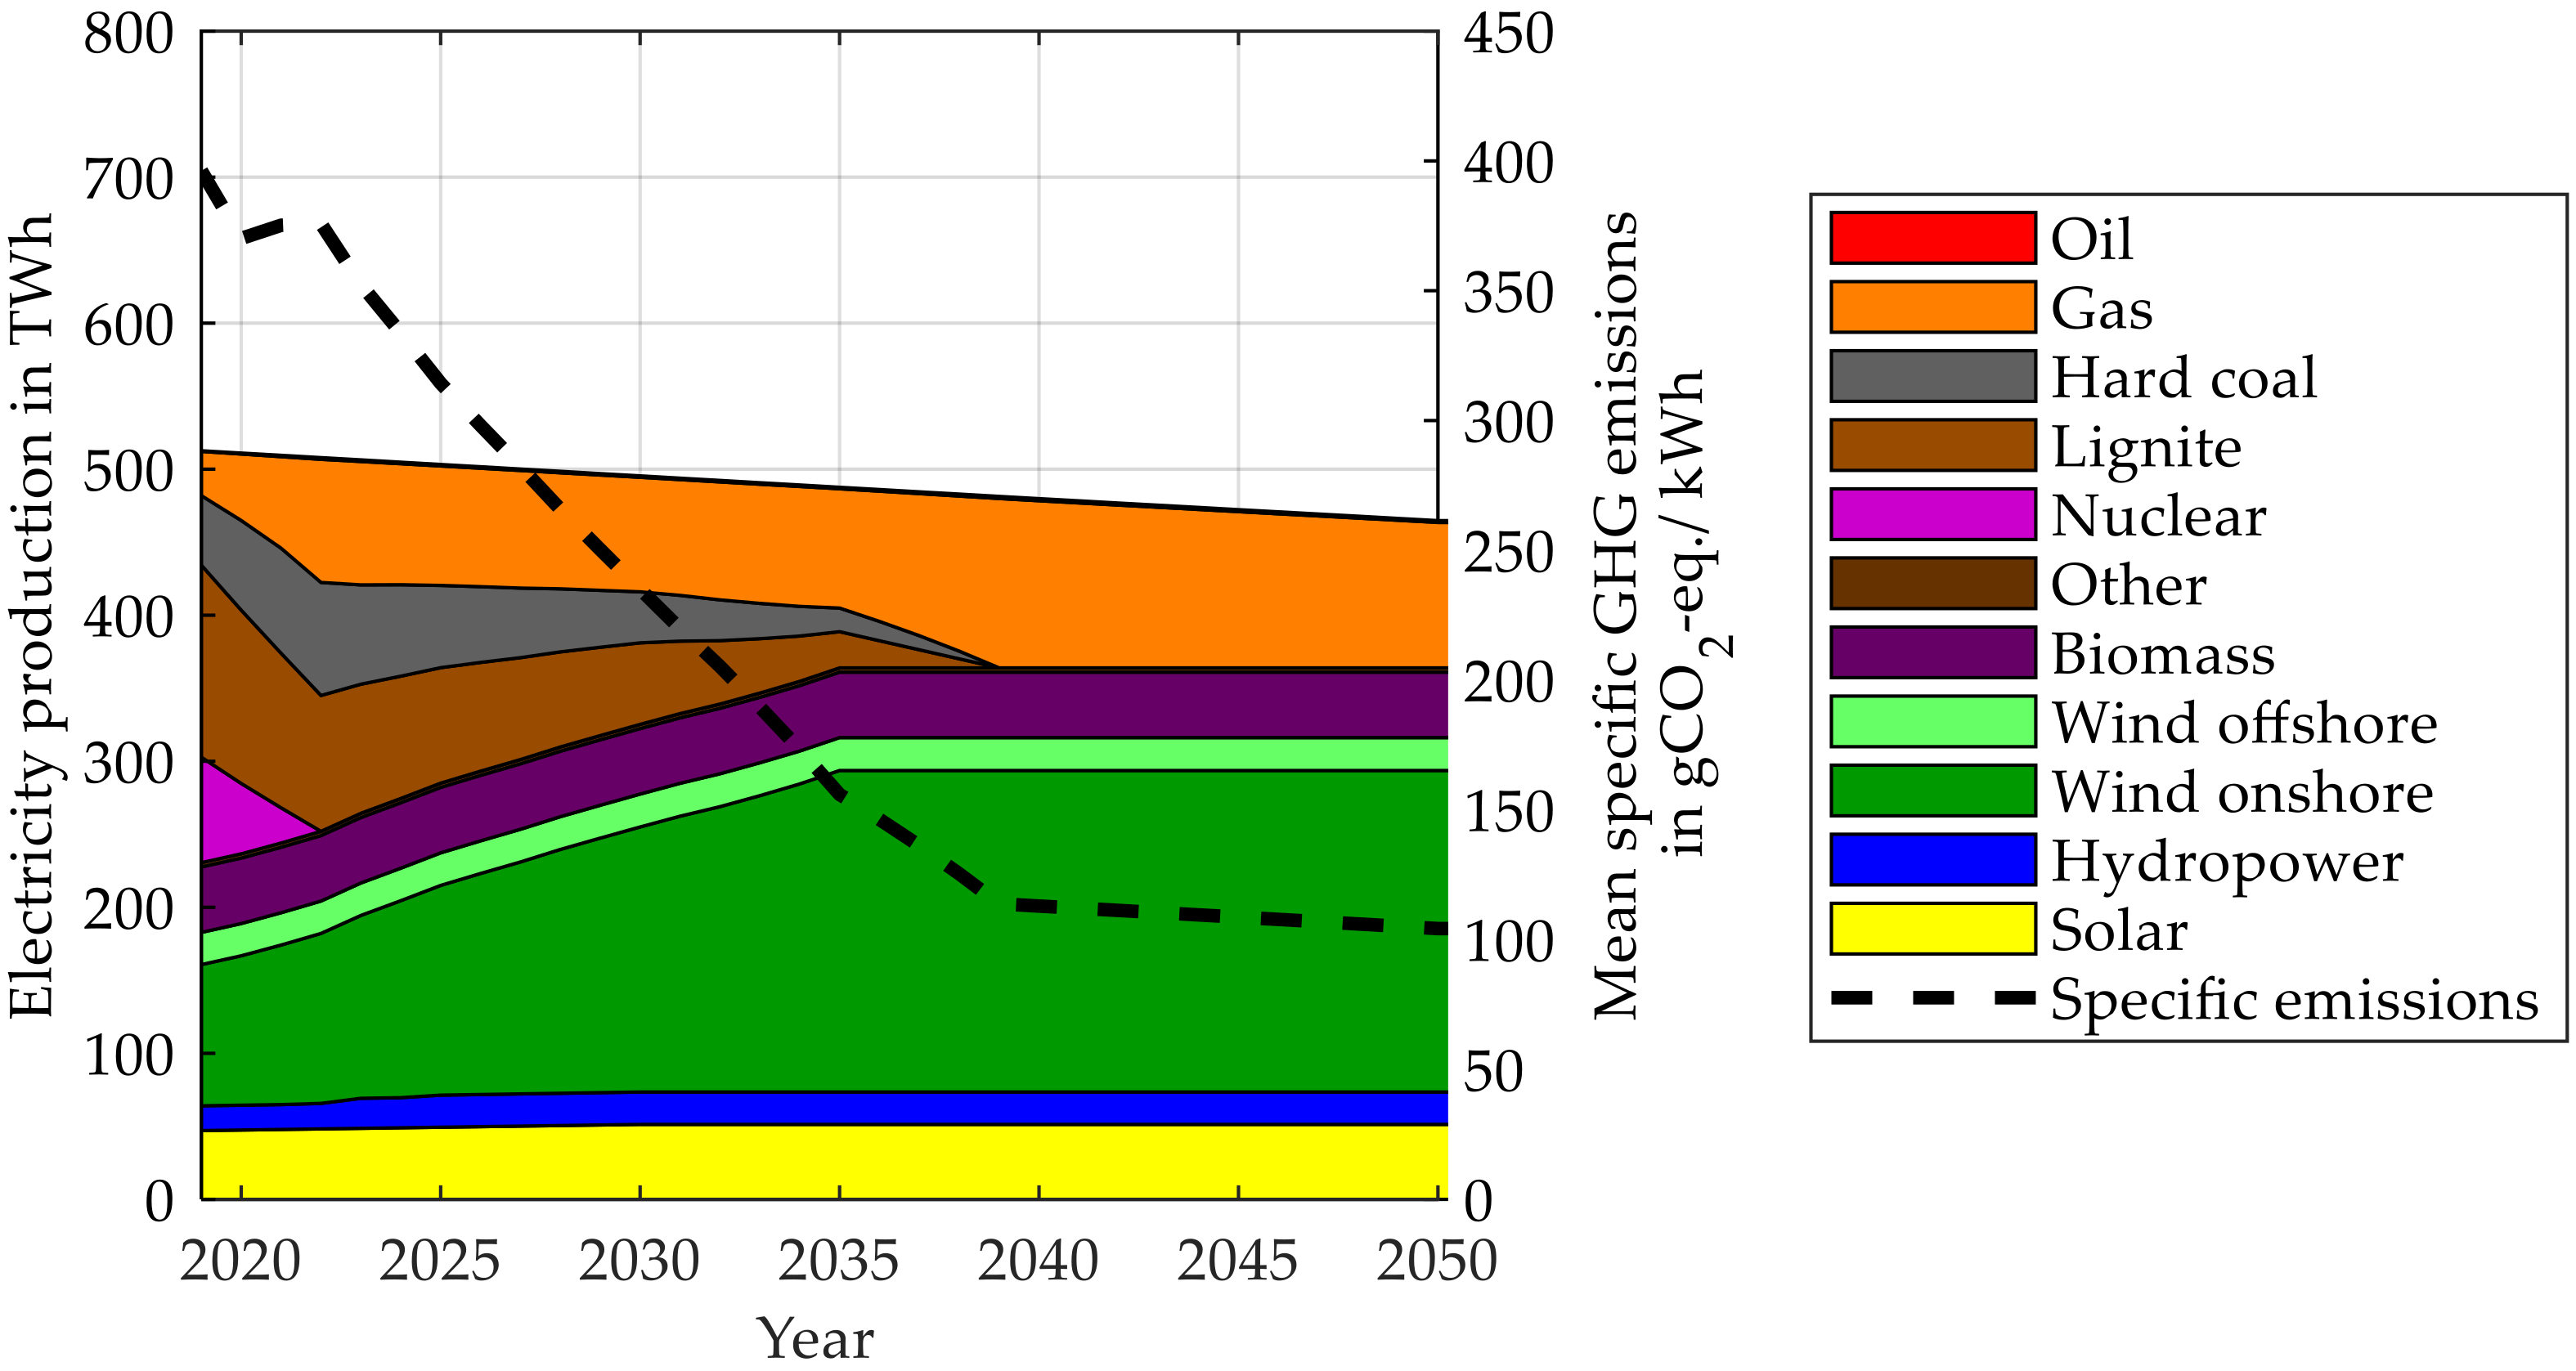
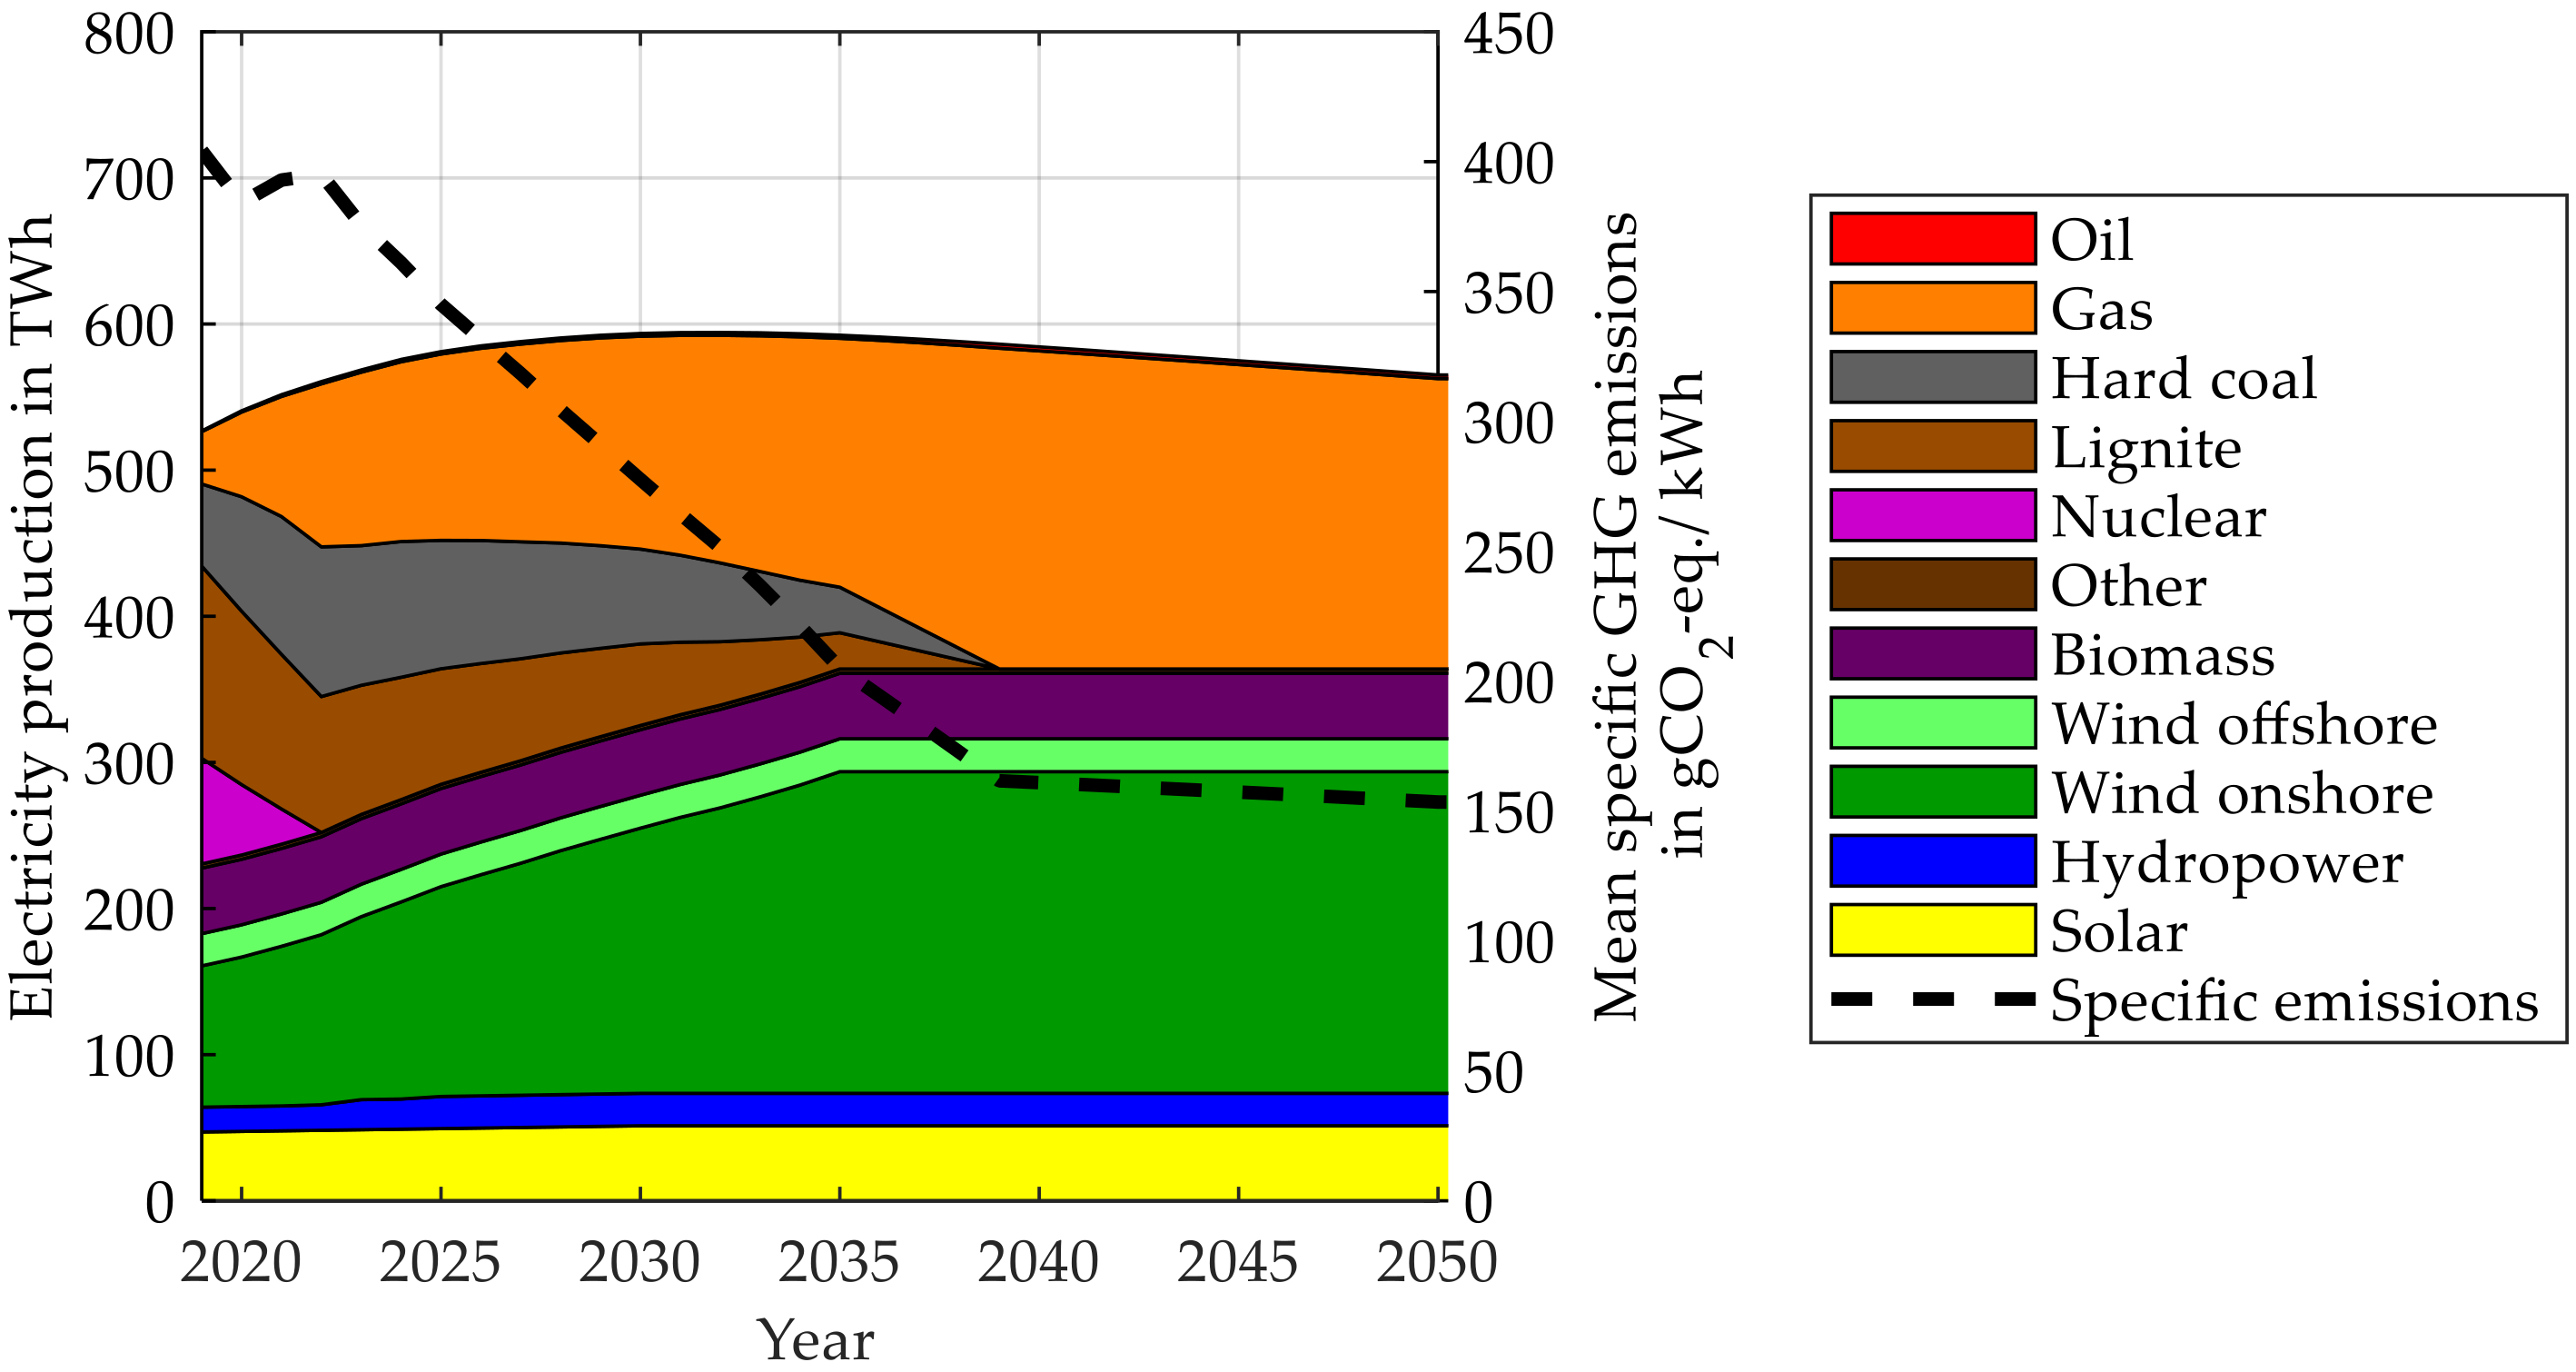
The UBA expects a slight decrease of electricity demand in Germany from 512 TWh in 2018 to 465.8 TWh in 2050 [26]. We assume a linearly decreasing trend until 2050. In Figure 7, we calculate the actual electricity production that matches the expected demand. Note that this does not include additional electricity demand from the vehicle fleet, which will be considered in the results in Section 3. For all energy sources—except hard coal, gas, and oil—the available installed capacity is multiplied by the load factor, which gives us the electricity production on a yearly basis. This electricity production partly covers the annual electricity demand. In order to satisfy the remaining electricity demand, the load factors of hard coal, gas, and oil are slightly adapted in every year, based on the reference load factors of 2018. As can be seen in Figure 7, this leads to the electricity production exactly matching the demand. Figure 7 also reveals the yearly mean specific GHG emissions of the energy sector resulting from the energy mix. As we will see in Section 3, considering the additional energy demand of the vehicle fleet leads to an increase of mean specific GHG emissions of the energy sector.
The out-phasing of hard coal and lignite allows for a drastic reduction of the mean specific GHG emissions of the energy sector. The underlying emission factors of all energy sources are listed in Table 3.

2.2. Scenarios for the Sensitivity-Analysis of Key Influence Parameters

Given the fact that some parameters of the vehicle fleet transition are subject to great uncertainty, we introduce different scenarios—pessimistic, neutral, and optimistic—for four parameters with key influence on the outcome of the optimization process. In the following four subsections, we take a closer look at the three possible scenarios for each key influence parameter.

2.2.1. Battery Production Scenarios

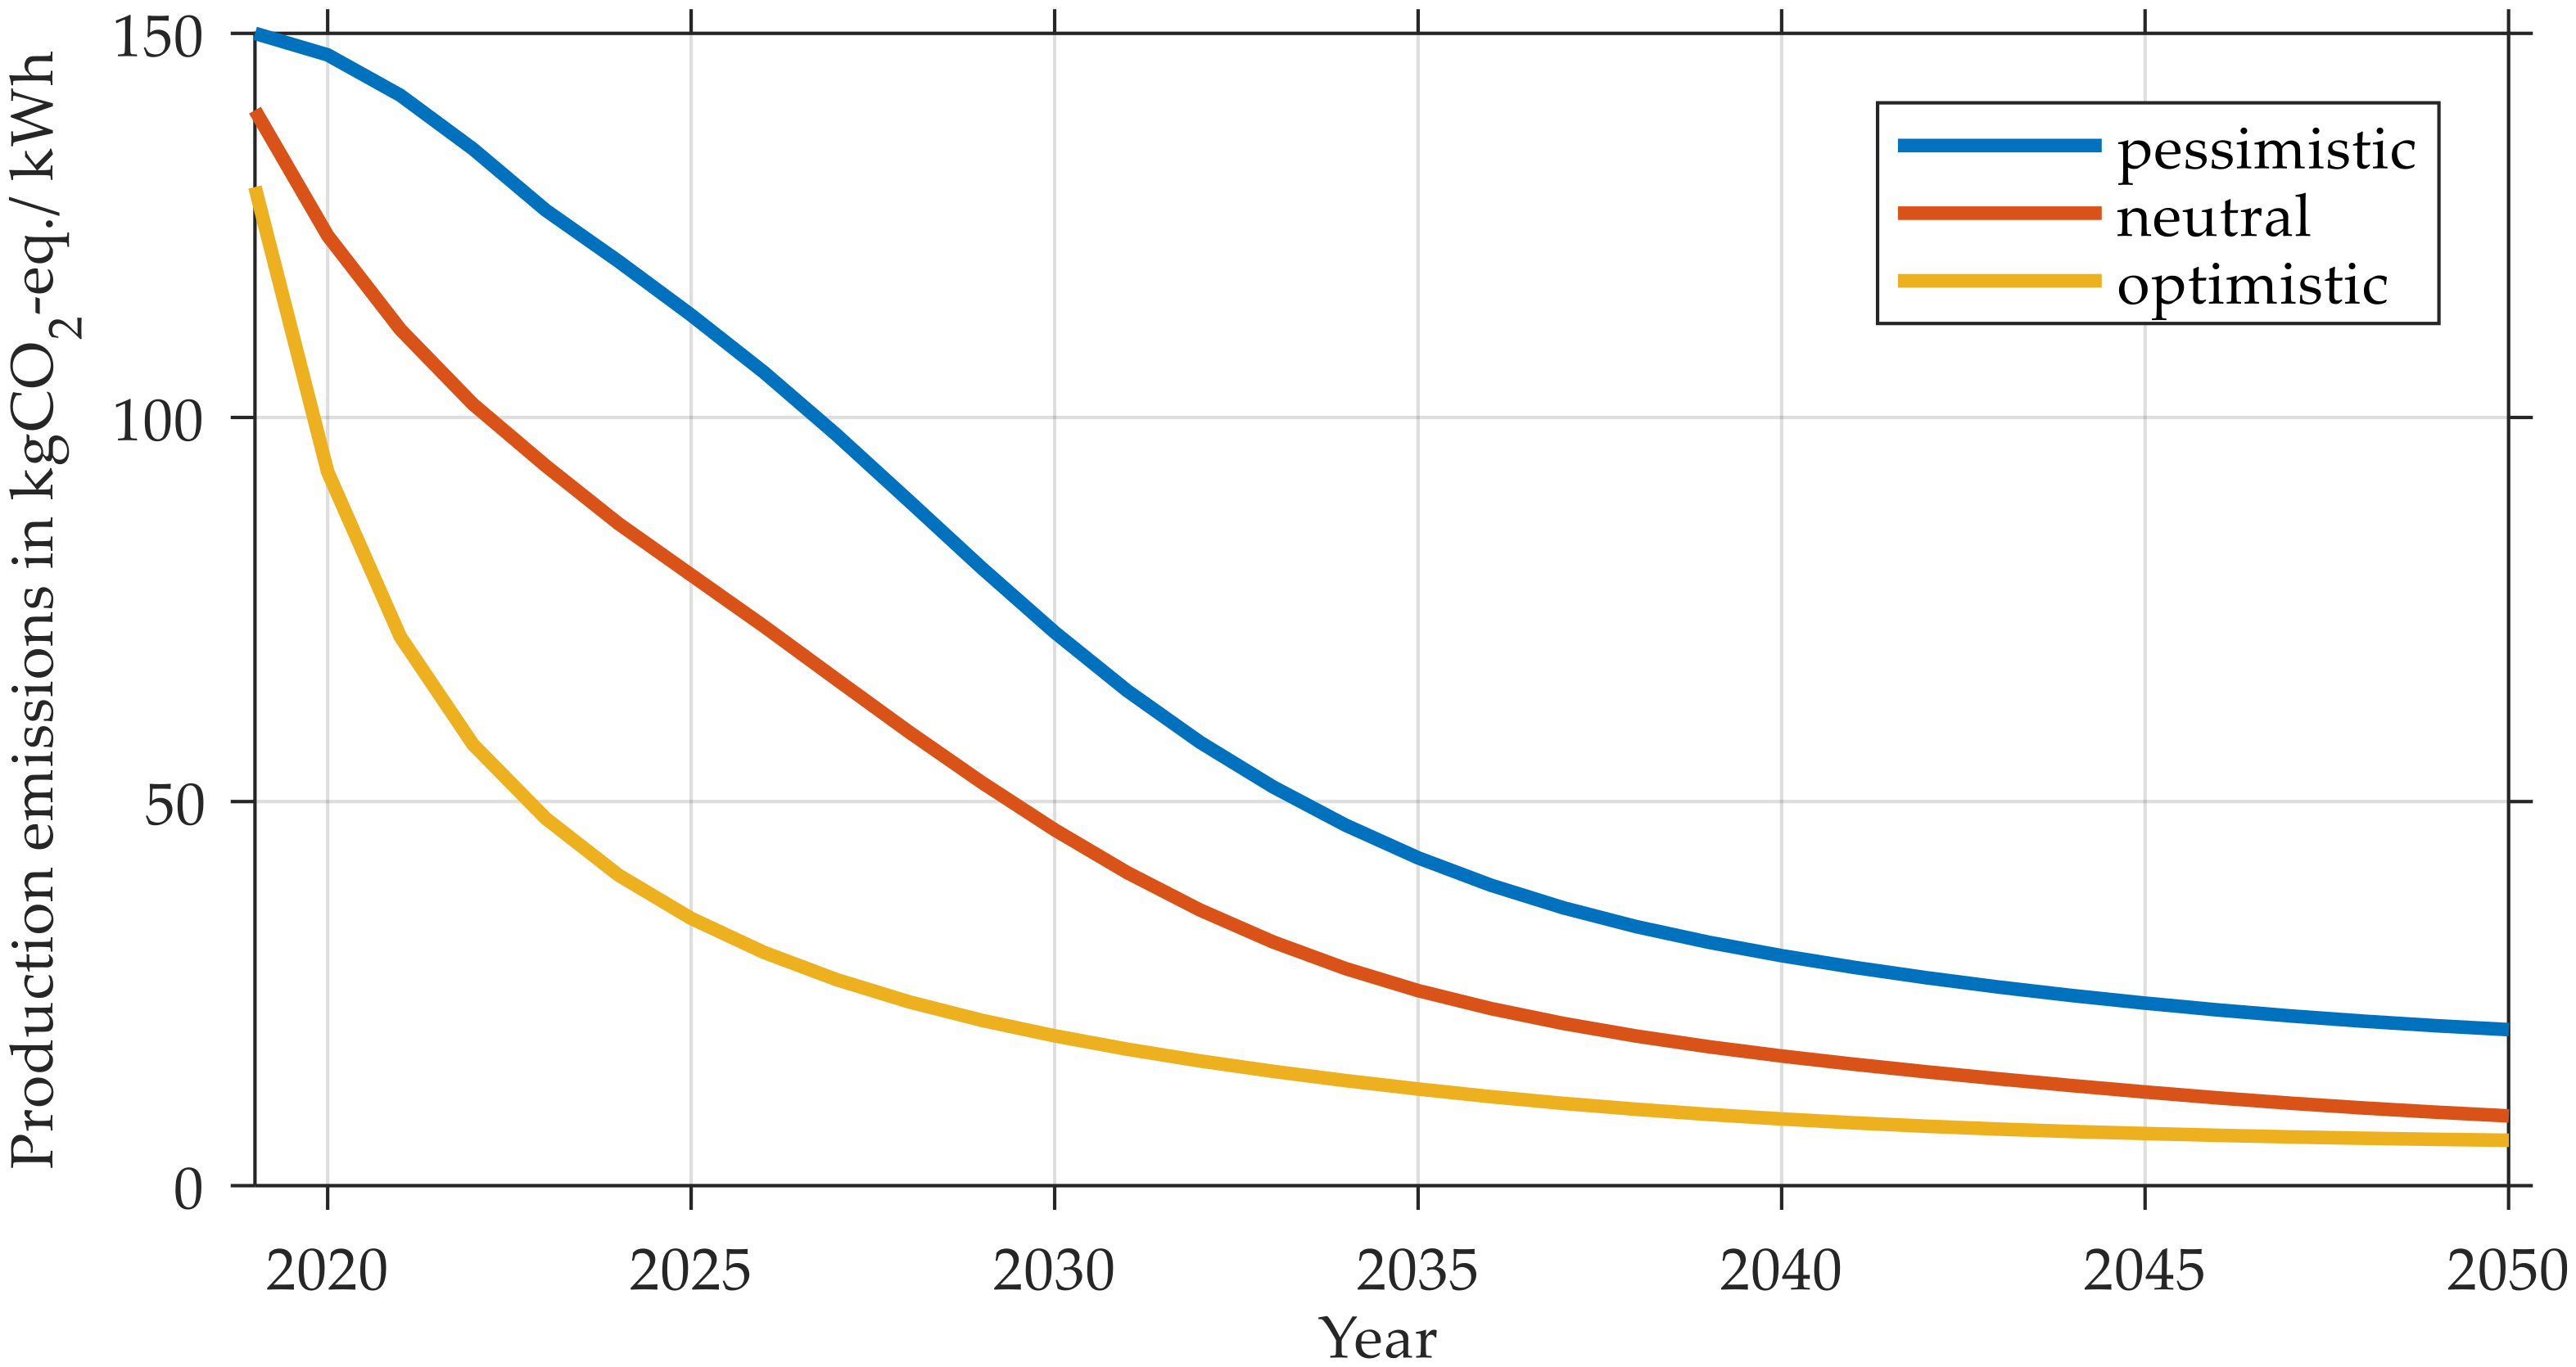
The GHG emissions during battery production per battery capacity constitute the first key influence parameter. Based on our research data in Supplementary Data, Table S1 [11], we generate the neutral scenario which can be seen in Figure 8. In case of a more pessimistic or optimistic scenario we adapt the emission reduction rate accordingly to be slower or faster.

2.2.2. Energy Sector Scenarios

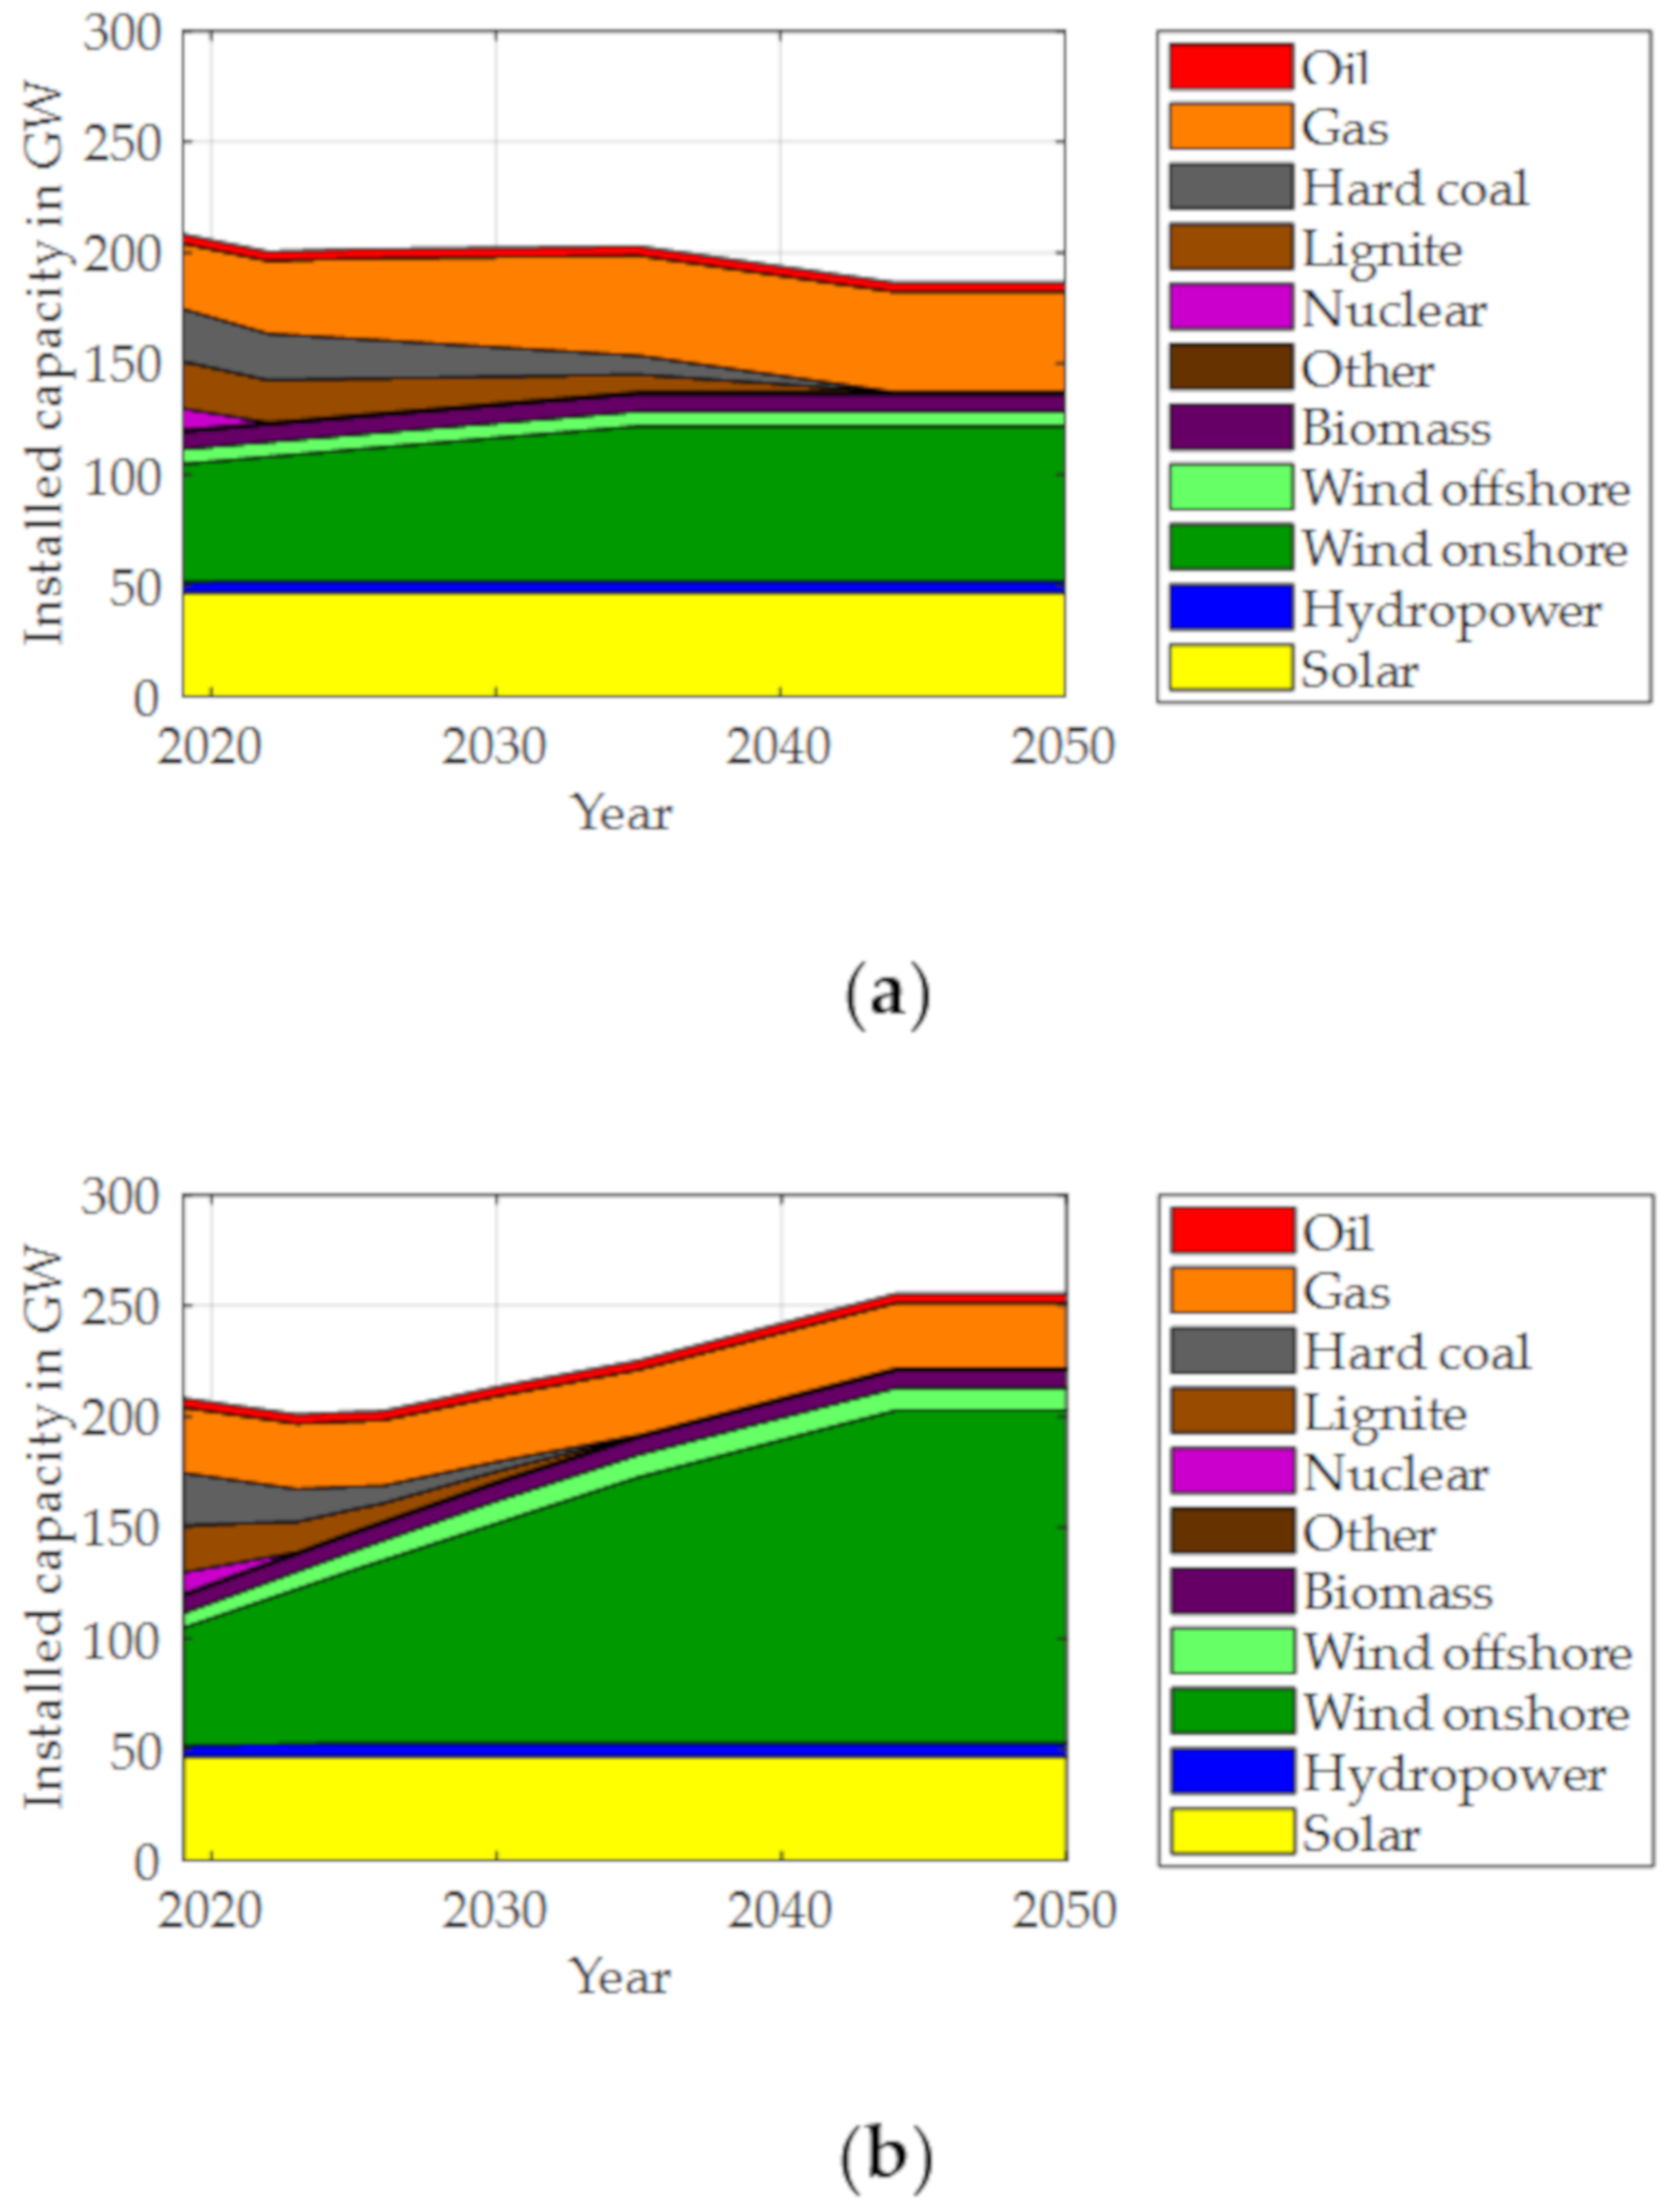
The second key influence parameter is the energy sector transition in Germany. Our neutral scenario assumes that political projects and promises like the out-phasing of nuclear and coal power take place as planned, refer to Figure 9. Power plants that are currently in their planning or construction phase are taken into account. A market research on the possible expansion of wind power conducted by the Federal Ministry for Economic Affairs and Energy (BMWi) plays an important role in our scenarios [21]. In pessimistic and optimistic scenarios, we slightly adapt the out-phasing and construction dates accordingly, as well as the magnitude of expansion or reduction.
Our model adapts the yearly electricity production to the demand from the vehicle fleet added to the projected demand presented in Figure 7. The mean specific GHG emissions of the electricity production is thereby changing every year. The biggest influence stems from the German energy transition, which results in a drastic lowering of the GHG emissions until 2050. The additional electricity demand of the vehicle fleet counters this trend, since it is satisfied using conventional energy sources as explained in Section 2.1.3. With this model, we are able to assess the GWP100 values for different powertrain concepts in every year until 2050. The GWP100 of the electrical consumption of vehicles is based on the mean specific GHG emissions of the energy sector. This contrasts with other assessment methods that exclusively allocate the GHG emissions of the marginal energy source covering the additional electricity demand to the consumer causing it—in this case the vehicle fleet. The resulting transition of the electricity production in the energy sector is presented for each of the investigated scenarios in Section 3.

2.2.3. Hydrogen Production Path Scenarios

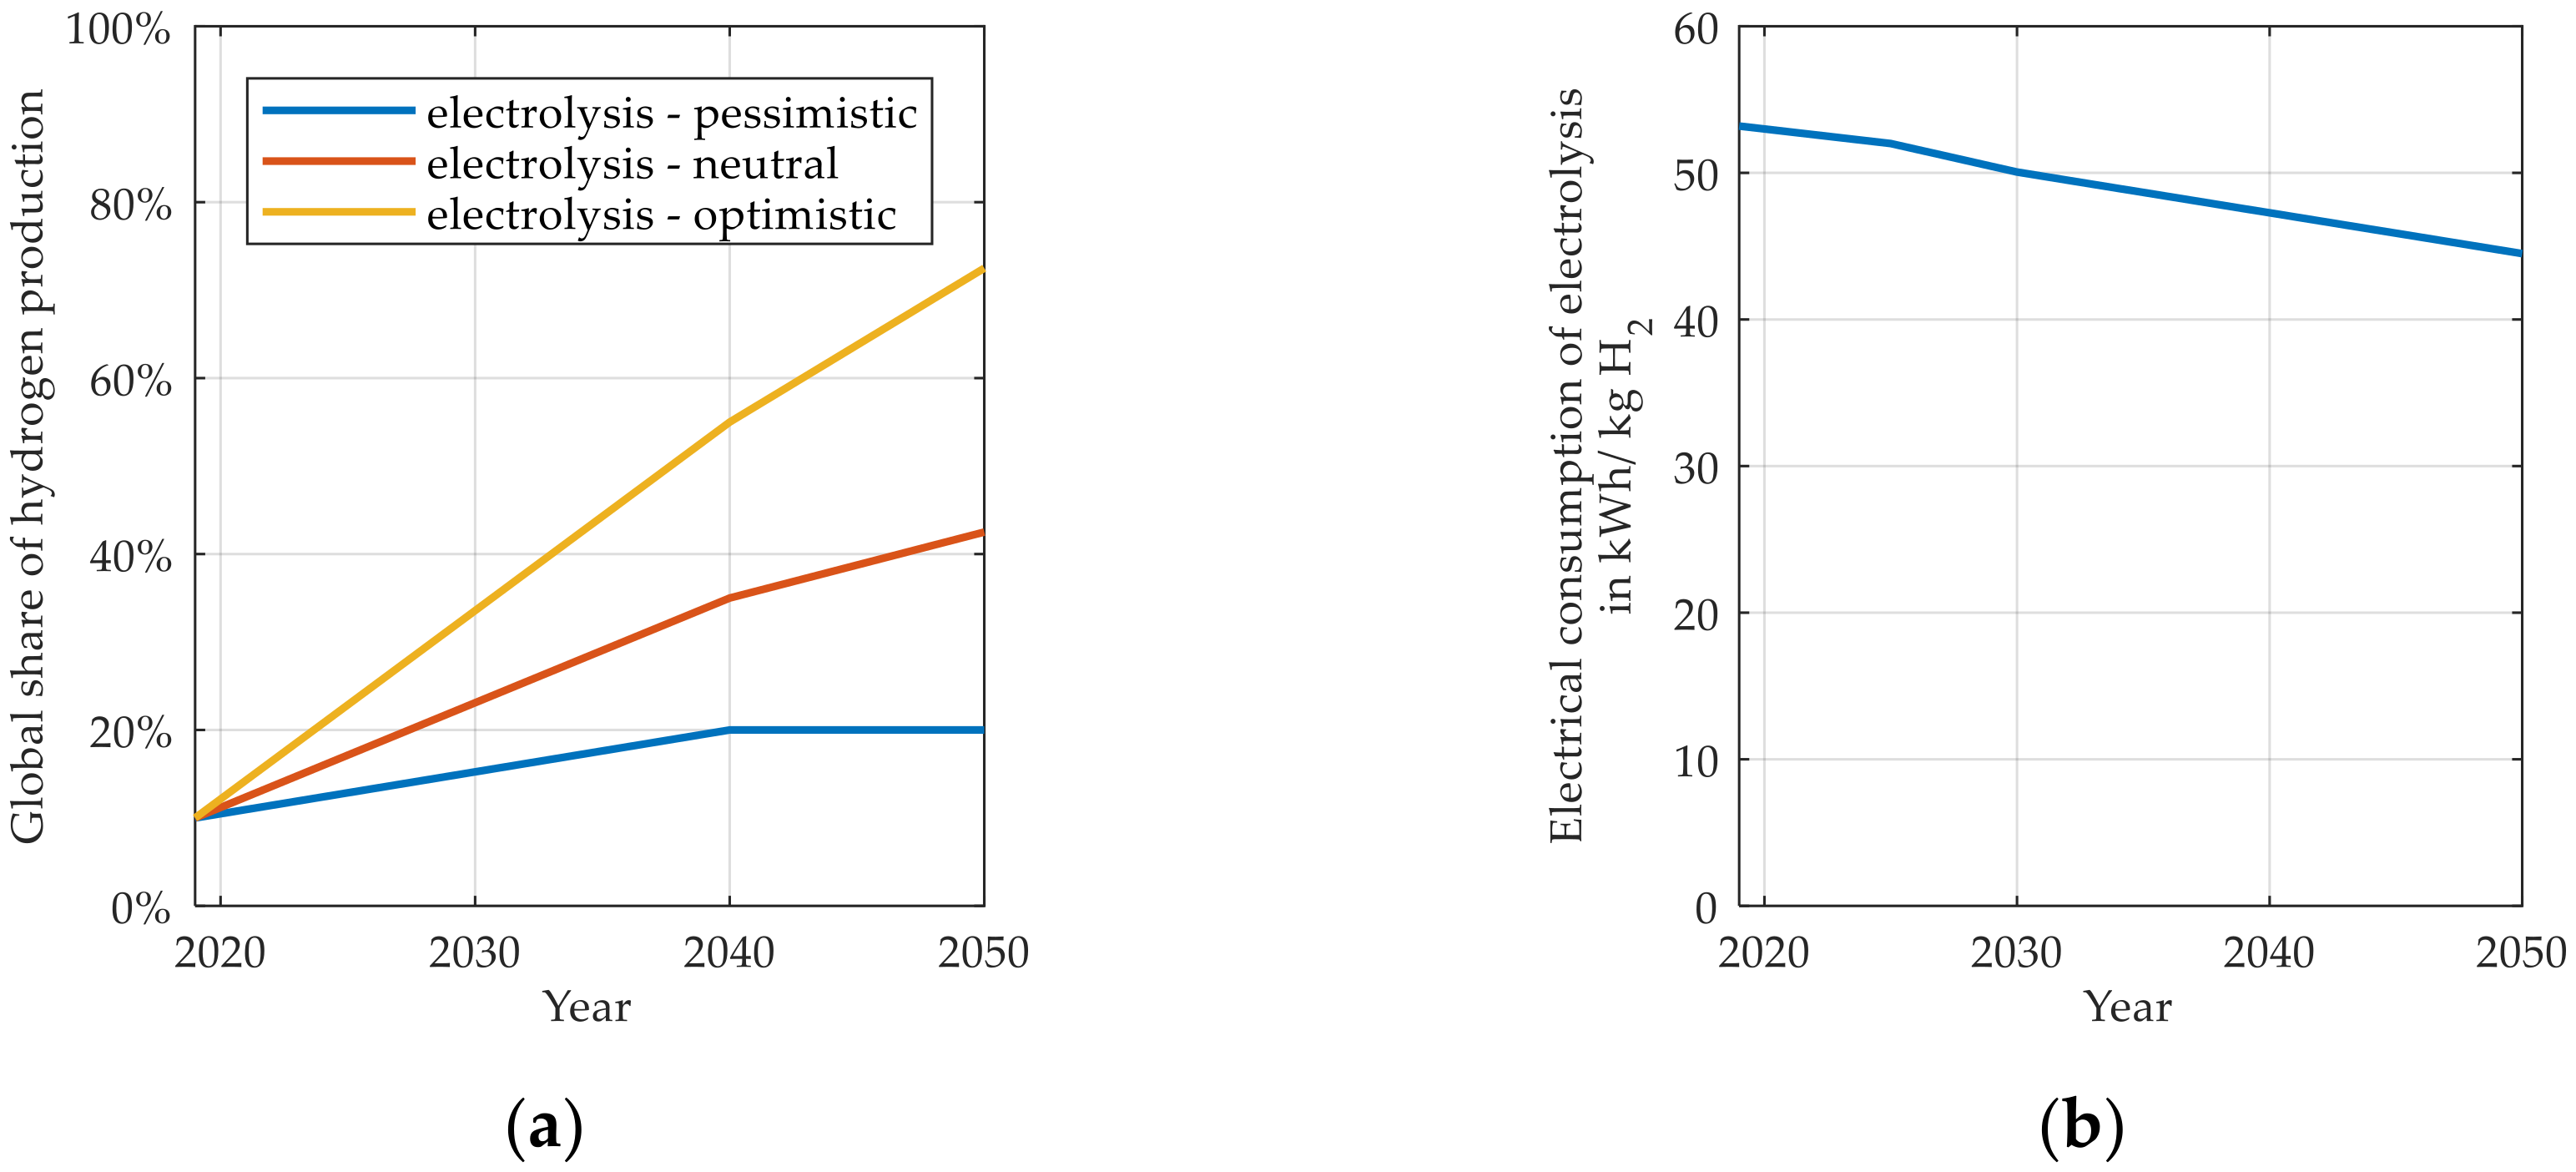
The third key influence parameter is the production of hydrogen, because it has a significant influence on the GHG emissions of FCEV. We assume that in future scenarios a bigger share of hydrogen is produced via electrolysis, see Figure 10a. Again, we generate three scenarios. On one hand, this leads to less GHG emissions from fossil fuels during hydrogen production. On the other hand, this further increases electricity demand when hydrogen is produced, although the latter is attenuated by an increase in electrolysis efficiency, displayed in Figure 10b.
As for the additional electricity demand of the vehicle fleet, the electricity demand of electrolysis is covered by the energy sector and, thereby, worsens its GWP100.

2.2.4. Mobility Trend Scenarios

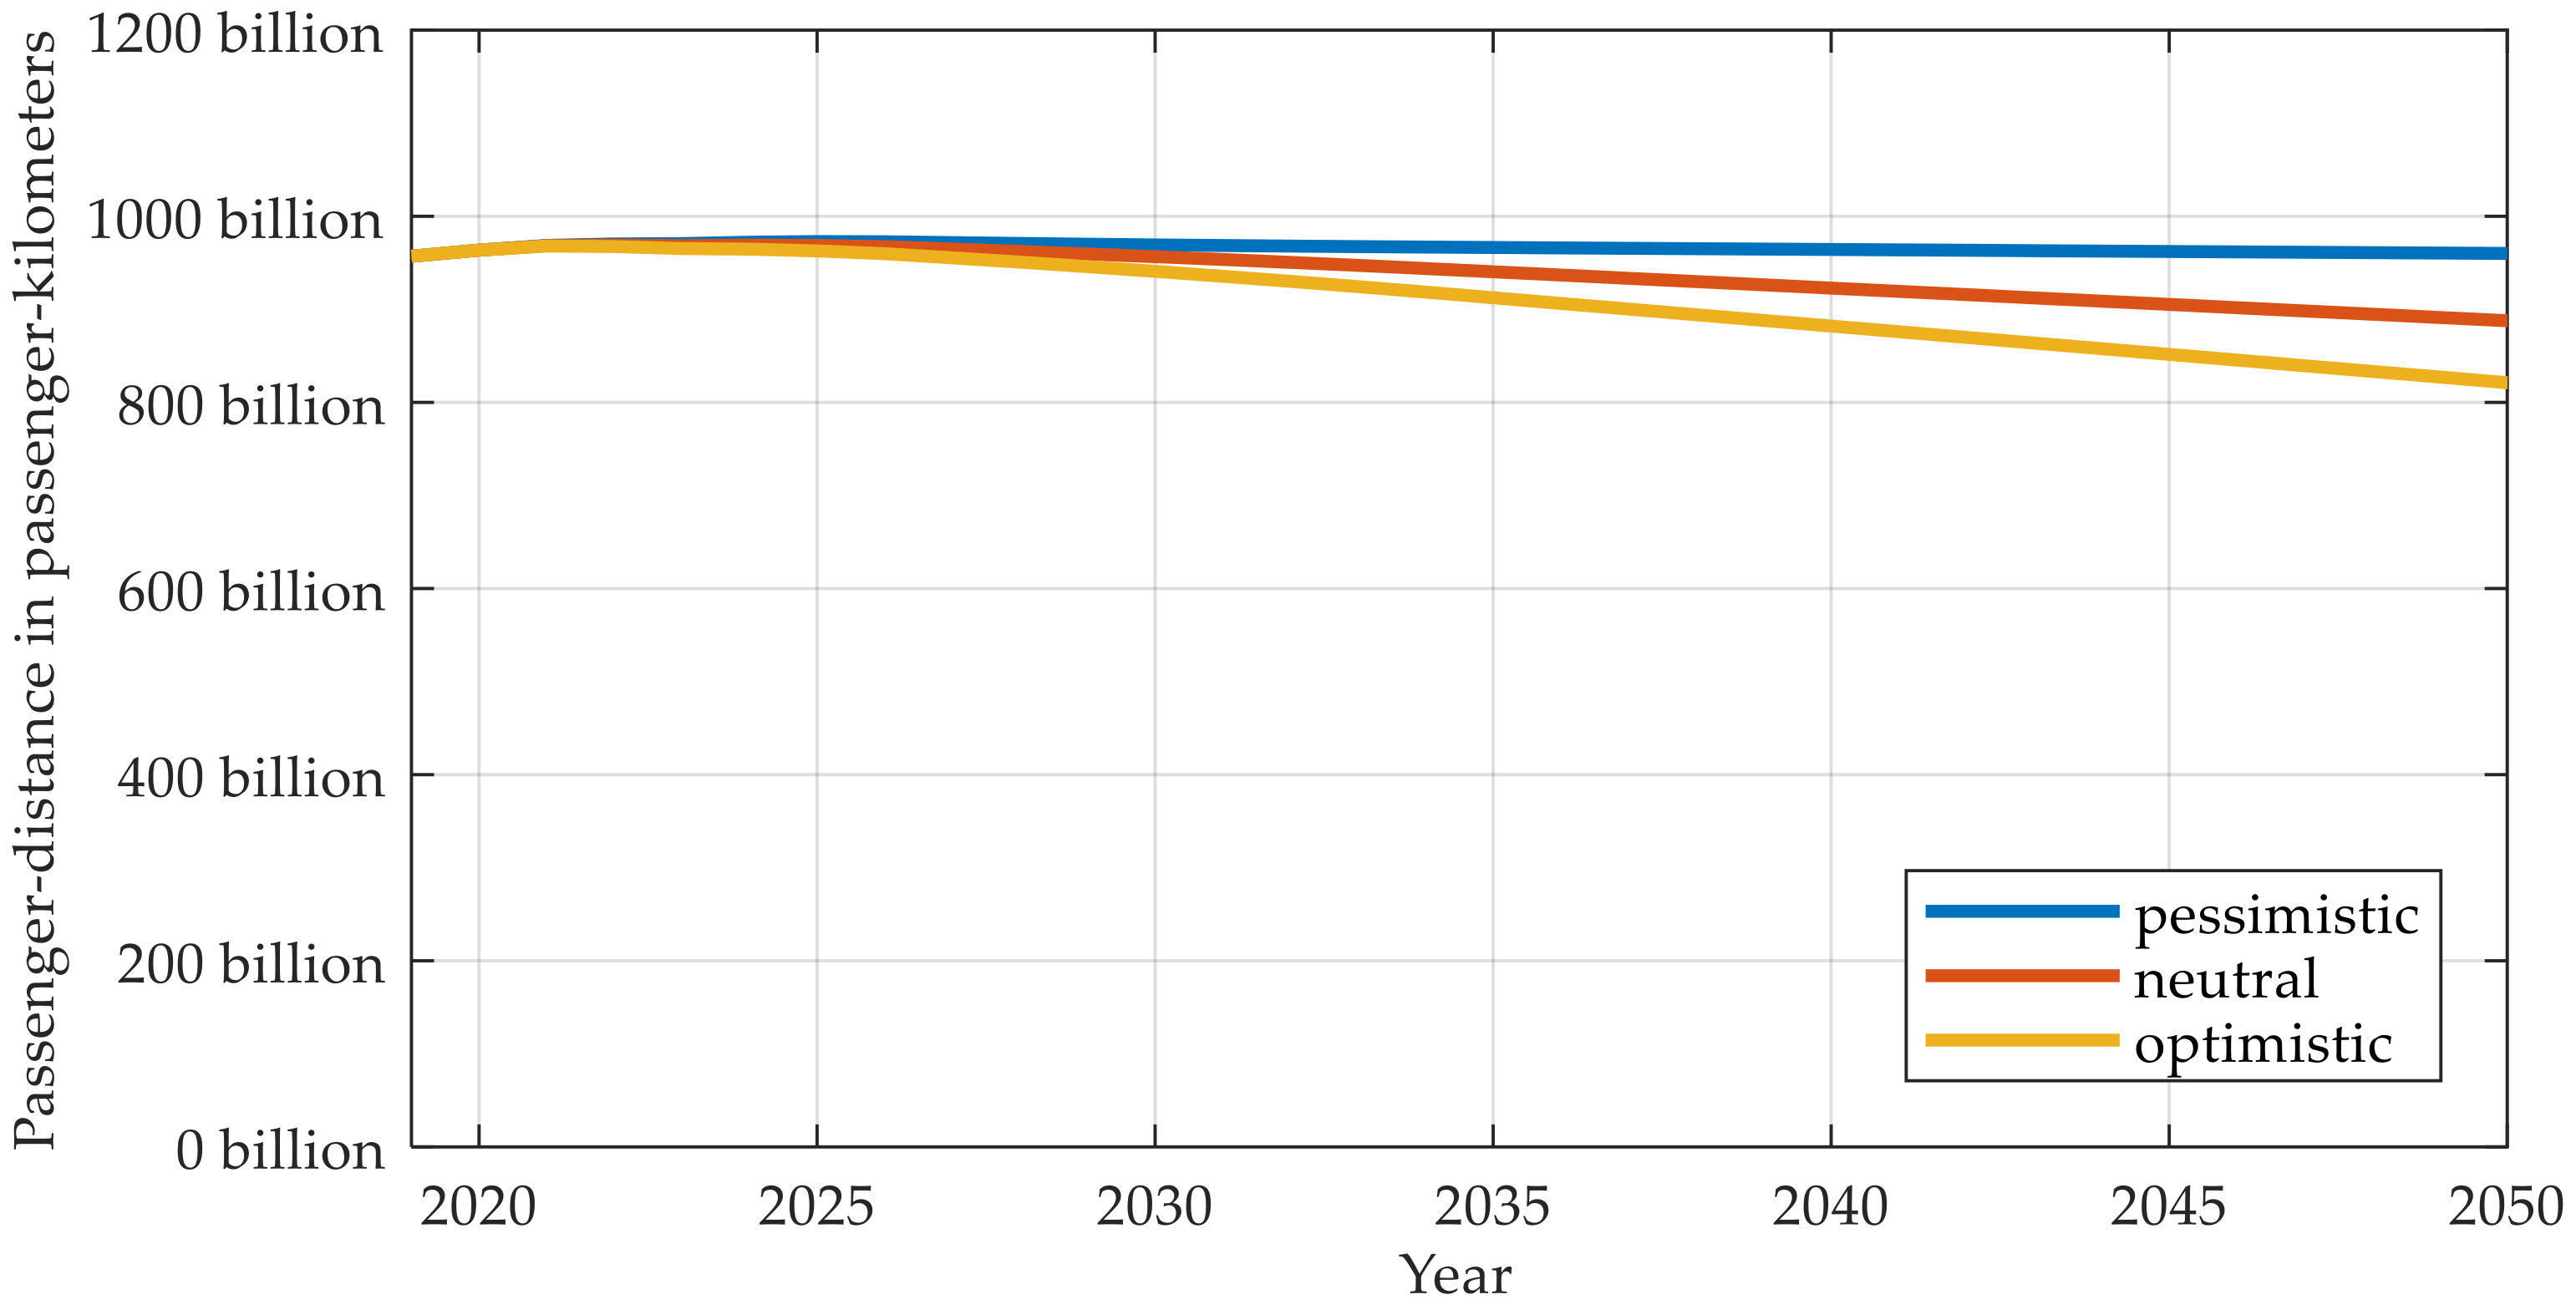
The German vehicle fleet comprises approx. 47 million vehicles in 2019 [30]. For the optimization, we need to determine the trend in absolute vehicle numbers until 2050. Assuming that in Germany there is a yearly passenger-distance to be satisfied, one can split it according to the means of transportation that serve it. The German Ministry of Transport and Digital Infrastructure (BMVI) provides short and mid-term prognostics for the main means of transportation—individual motorized mobility, railway, flights, and public transport [31]. For our work, we focus on the individual motorized mobility, which mainly refers to passenger car vehicles. In 2019, the cumulative passenger-distance of all passenger car vehicles is approx. 950 billion passenger-kilometers. The effect of people switching to other means of transportation and the further expansion of carsharing in Germany—on average more people utilizing the same vehicle—is subject to high uncertainty. This is especially true for prognostics over the next 30 years. Consequently, we generate three scenarios of future passenger-distance demand for passenger car vehicles, shown in Figure 11. This is our fourth key influence parameter.
In addition, the penetration of carsharing in the German market leads to less vehicles serving the same amount of passenger-distance, because these vehicles have a higher rate of utilization during their lifetime.
The initial situation of having approx. 30 million petrol and 15 million diesel-powered vehicles in the German vehicle fleet in 2019 has a great influence on the future transition. Having 47 million vehicles in 2019 and an average lifetime expectancy of 12.5 years, approx. 3.76 million vehicles would have to be replaced every year, if the number of vehicles were to stay the same. The initially present vehicles leave the fleet according to their age and their expected lifetime.

2.3. Modelling the Vehicle Behavior and Its Life-Cycle GHG Emissions

At this point, we will take a closer look at the different life-cycle phases of vehicles and the GHG emissions that have to be allocated to each one of them.
The GHG emissions of the production of vehicle components is based on the optimization framework for the comparative evaluation of the eco-impact of powertrain concepts [9]. This framework parametrizes the vehicle components in a way that leads to the minimum GHG emissions over all life-cycle phases. Main achievement of this method is that all vehicle parameters are adapted in such a way that their combined GWP100—production, operational, and EoL phase—is minimized. This approach enables a proper comparison of the ecological potential of different powertrain concepts on a common evaluation basis. We further use this idea within this work to identify the GHG-optimal transition paths of the German vehicle fleet. Table 4 contains the production emissions associated to the different powertrain concepts. Since the battery production emissions are subject to more detailed modelling, the production emissions of Table 4 exclude them.
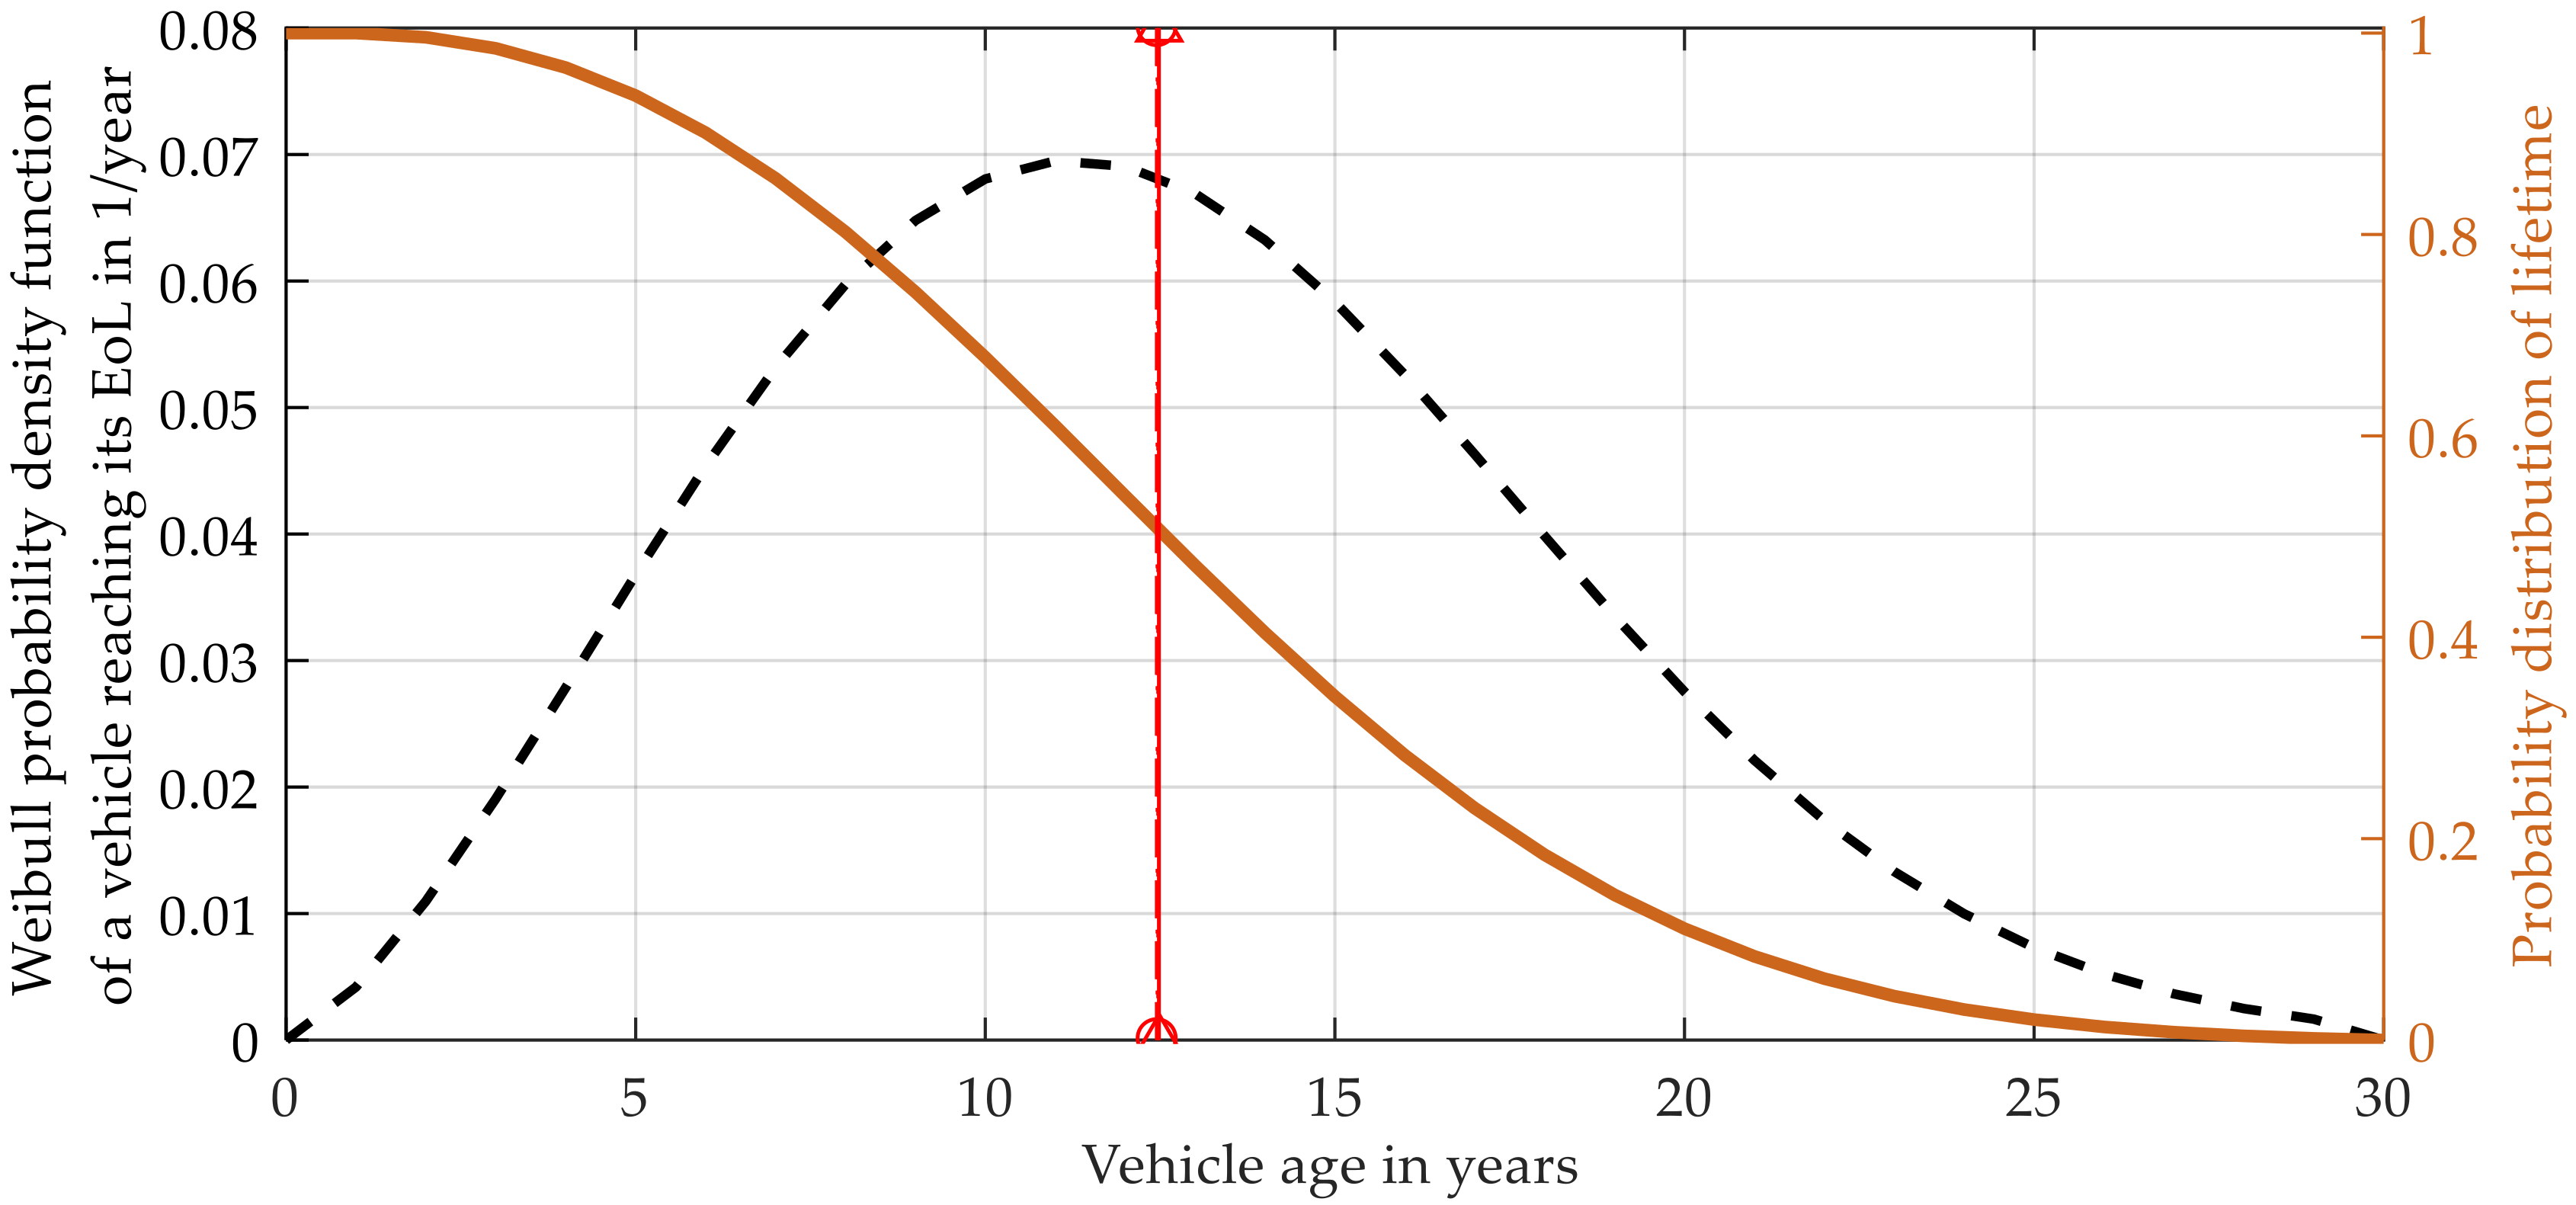
The lifetime expectancy of the vehicles is assumed to be equal for all different powertrain concepts. The probability of reaching its EoL is described by a Weibull curve. Plötz et al. estimated this distribution based on data from the Federal Motor Transport Authority (KBA) [32]. With the shape parameter of the Weibull function being 2.4 and the scale parameter 14.1, the average lifetime expectancy becomes 12.5 years, as shown in Figure 12.
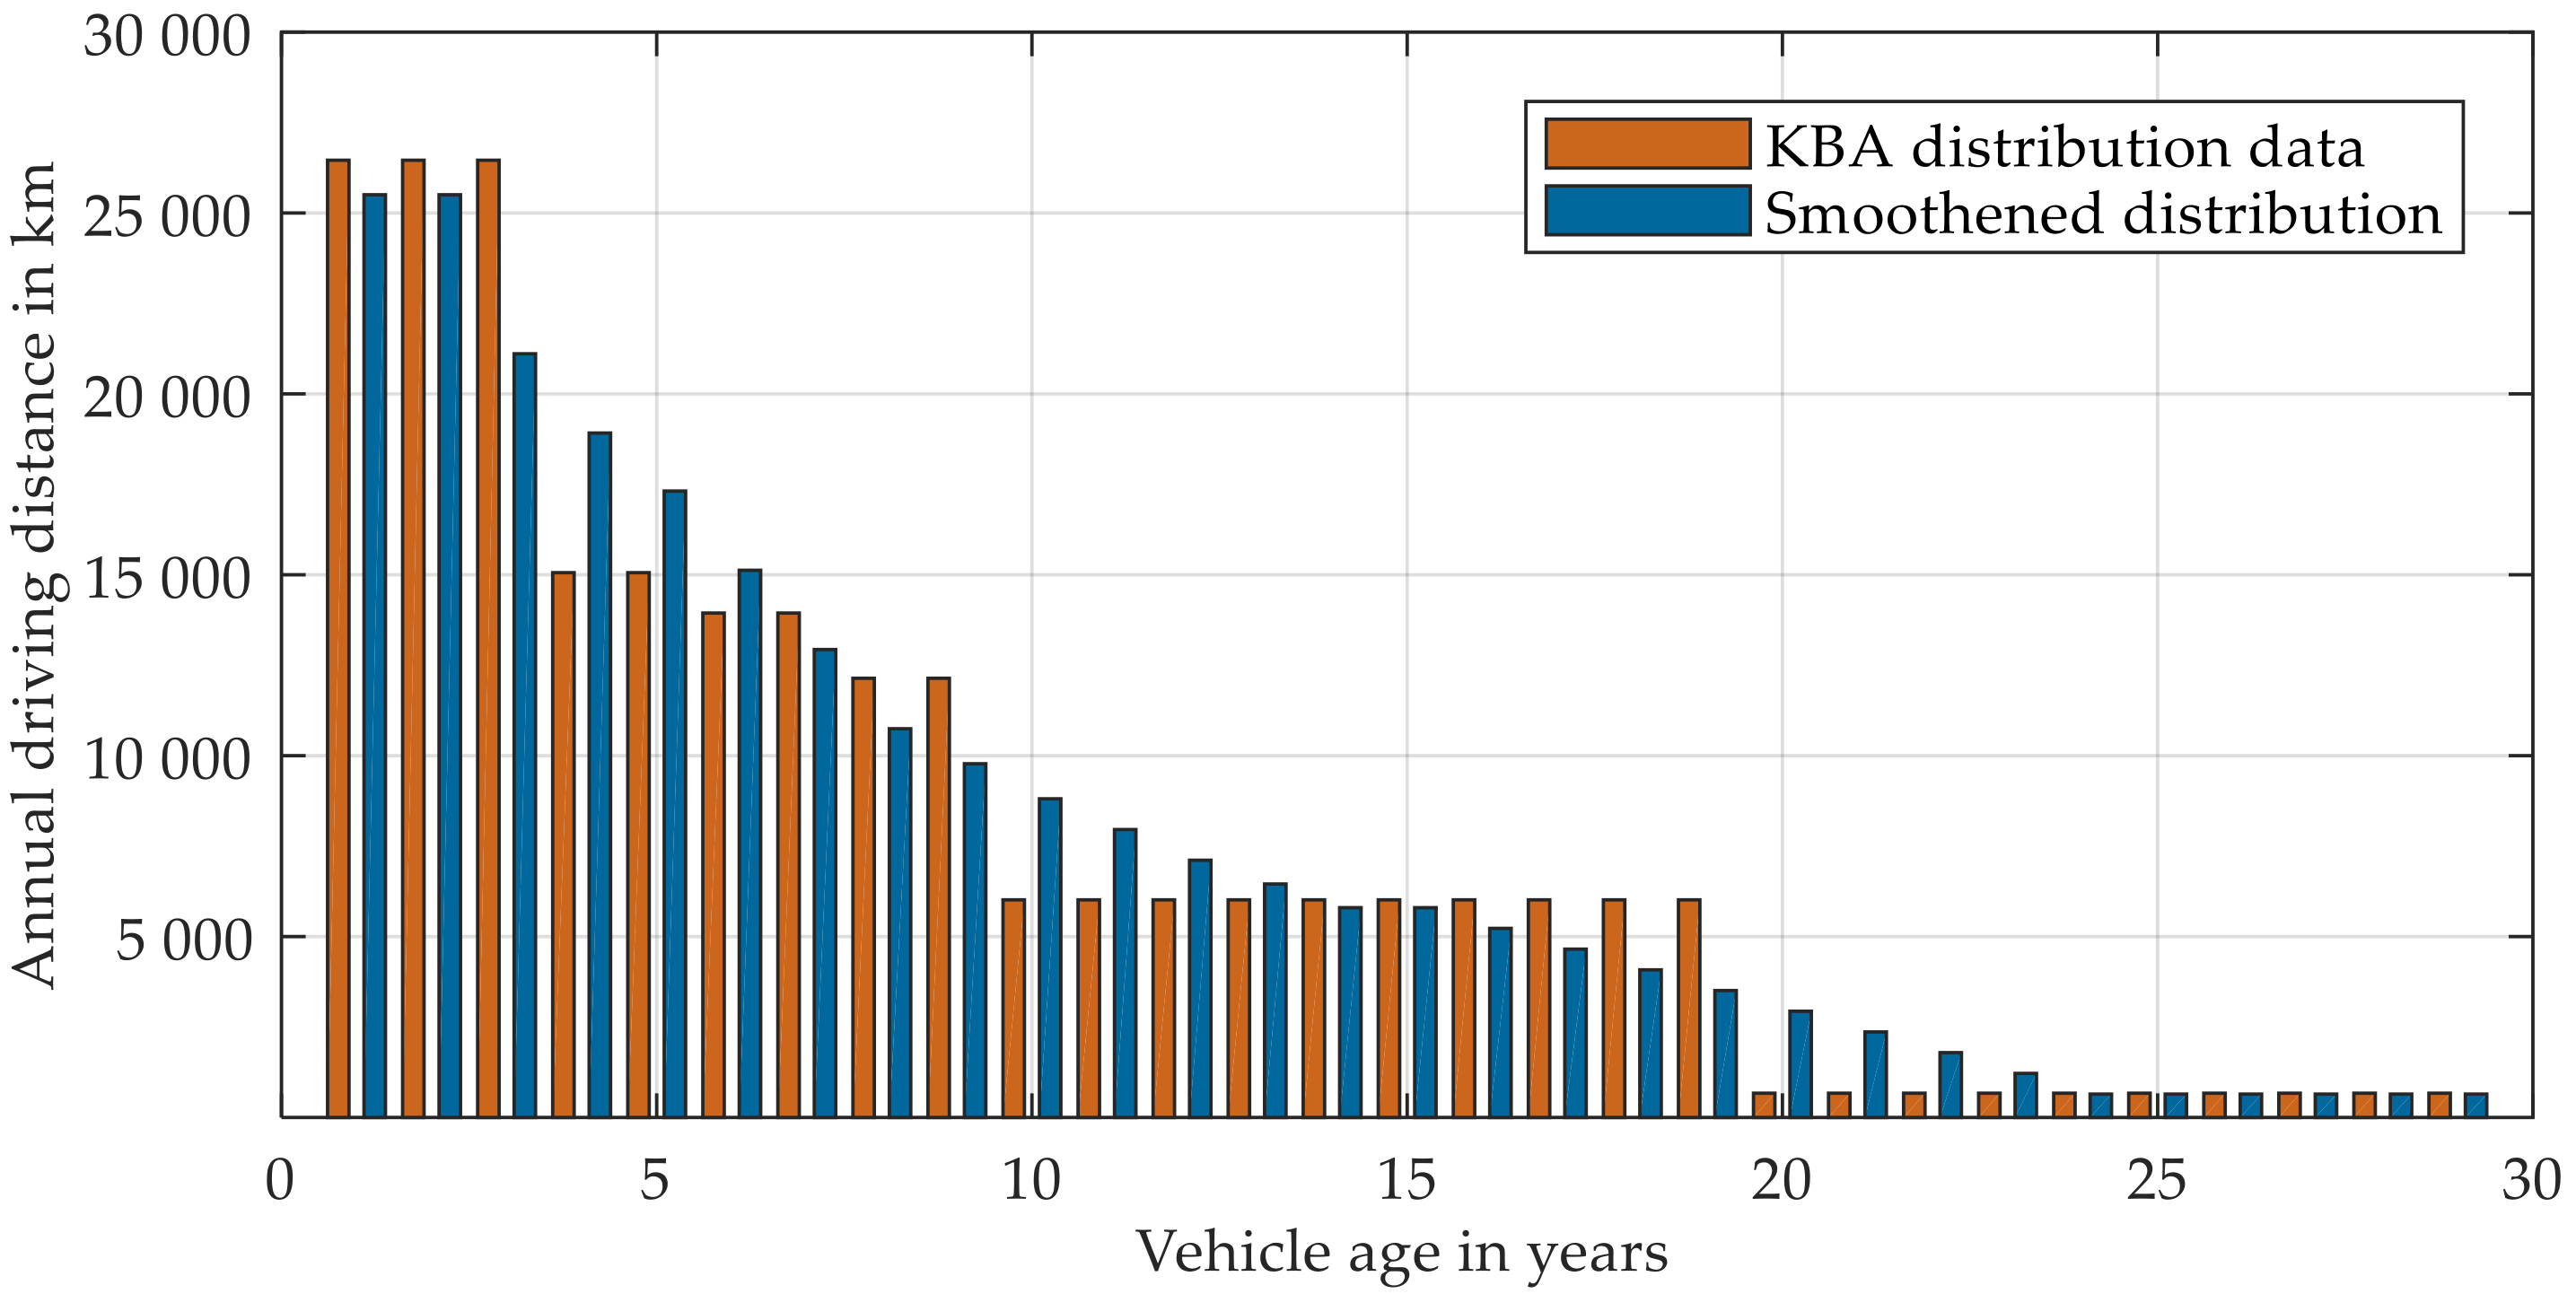
With an average lifetime expectancy of 12.5 years and knowing that the average annual mileage is 13,922 km, we conclude that the average lifetime mileage is approx. 173,906 km [33]. Additional data from the KBA regarding the annual mileage vehicles perform at different stages of their lifetime is also considered. As can be seen in Figure 13, once a vehicle enters the market, it will perform a high share of its lifetime mileage in the first three years [34]. Thereafter, mileage slowly decreases year by year. For optimization purposes we smoothened the data.
During the operational phase of the vehicles, we have to consider the fuel consumption, which leads to direct GHG emissions preceded by the emissions during fuel supply. Electrical consumption does not lead to direct GHG emissions. However, the electrical consumption leads to an increase in electricity demand, which ultimately causes additional GHG emissions in the energy sector. These emissions will be allocated to the vehicle, according to the mileage it performs in every year, using the mean specific GHG emissions of the energy sector in the corresponding years, as explained in Section 2.2.2.
The consumption values are also determined with the optimization framework of Esser et al. mentioned earlier [9]. For this work, we use driving cycles resulting from the ARTEMIS project, in which real world data was used to generate representative driving cycles [35]. The driving data is segmented into different driving cycles, depending on the driving situation. For the purpose of this work, we differentiated a short-range driving profile and an all-range driving profile, weighting the driving cycles as in Table 5.
Each powertrain concept has to perform both driving profiles. This way, we obtain four different consumption values for each powertrain concept—two electrical and two fuel consumption values. Obviously, for ICEVs the electrical consumption is zero and for BEVs the fuel consumption is zero. In the case of PHEVs, the fuel and electrical consumption vary relatively strong depending on the driving profile. For example, the PHEVs can drive with a higher electrical percentage on the short-range profile, compared to the all-range profile, which leads to a reduced electrical demand and increased fuel consumption on the all-range profile. Important to notice is that, for determining the consumption values of PHEVs, we assume them to be fully charged before starting out. Table 6 presents all consumption values for all powertrain concepts.
The consumption values are constant over the years with the exception of BEVs. It is considered that innovative technologies, i.e., BEVs with two speed transmissions, lead to more efficiency. Less power is lost during energy transmission, the operation points of electric machines can be better adapted to the load behavior, and, consequently, other vehicle components can also be adapted to be more efficient. For the BEV20 we assume that, on fleet-average, a consumption value of 16.6 kWh/100 km will be achieved by 2050. Regarding the BEV100, in 2050 we evaluate a short-range consumption value of 20.9 kWh/100 km and an all-range consumption value of 20.4 kWh/100 km using the optimization framework. Between 2019 and 2050, the average consumption values of BEVs in the fleet are assumed to follow a linear trend.
Considering that in Germany 75% of vehicle-distance is performed over distances under 100 km and only 25% over larger distances, we allocate the short-range consumption values presented in Table 6 to the number of vehicles responsible for the former 75% of the vehicle-distance per year [36]. Consequently, the remaining vehicles have the all-range consumption level. This distribution is equal for all powertrain concepts except the BEV20, which can only drive short distances.
Finally, the EoL phase of the vehicle has comparatively low GHG emissions, which is modelled as 10% of the production emissions in Table 4. This value represents the GHG emissions that are released after the operational phase of the vehicle when it is disassembled. Again, this refers to all vehicle components except batteries. The EoL emissions of batteries are modelled with 1.2 kgCO2-eq./kWh.

3. Identification of the Optimal Vehicle Fleet Transitions

The optimization process is implemented in MatLab. We make use of the nonlinear optimization function fmincon. The objective value of the optimization is the cumulative amount of GHG emissions until 2050 stemming from all life-cycle phases of the German vehicle fleet. Further details on the optimization process are to be found in the MathWorks description [37].
In the first place, we ran our model assuming that there would not be any transition in the vehicle fleet. In this business-as-usual scenario, considering everything remains as is until 2050, there would be approx. 15 million diesel and 30 million petrol powered vehicles in any given year. Alternative powertrain concepts would only represent a negligible part. We assume the mobility trend evolves according to the neutral scenario. The remaining key influence parameters do not affect the cumulative GHG emissions of this fleet transition. In this case, taking into account only vehicles introduced into the market since the beginning of 2019, the cumulative life-cycle GHG emissions of all vehicles until 2050 amount to 4299 million tons of CO2-eq.—operational and EoL phases beyond 2050 are also considered.
Secondly, we ran our model for three specific scenarios. In our base scenario, all key influence parameters evolve according to their neutral scenario. In addition, we analyzed both cases in which all key influence parameters evolve according to the pessimistic or optimistic scenarios respectively. We refer to them worst- and best-case scenario.
Thirdly, we ran our model for all 81 possible scenario cross-combinations of the four key influence parameters. The results of this exhaustive sensitivity-analysis are presented in aggregated manner in Section 3.4.

3.1. Optimal Vehicle Fleet Transition for the Base Scenario

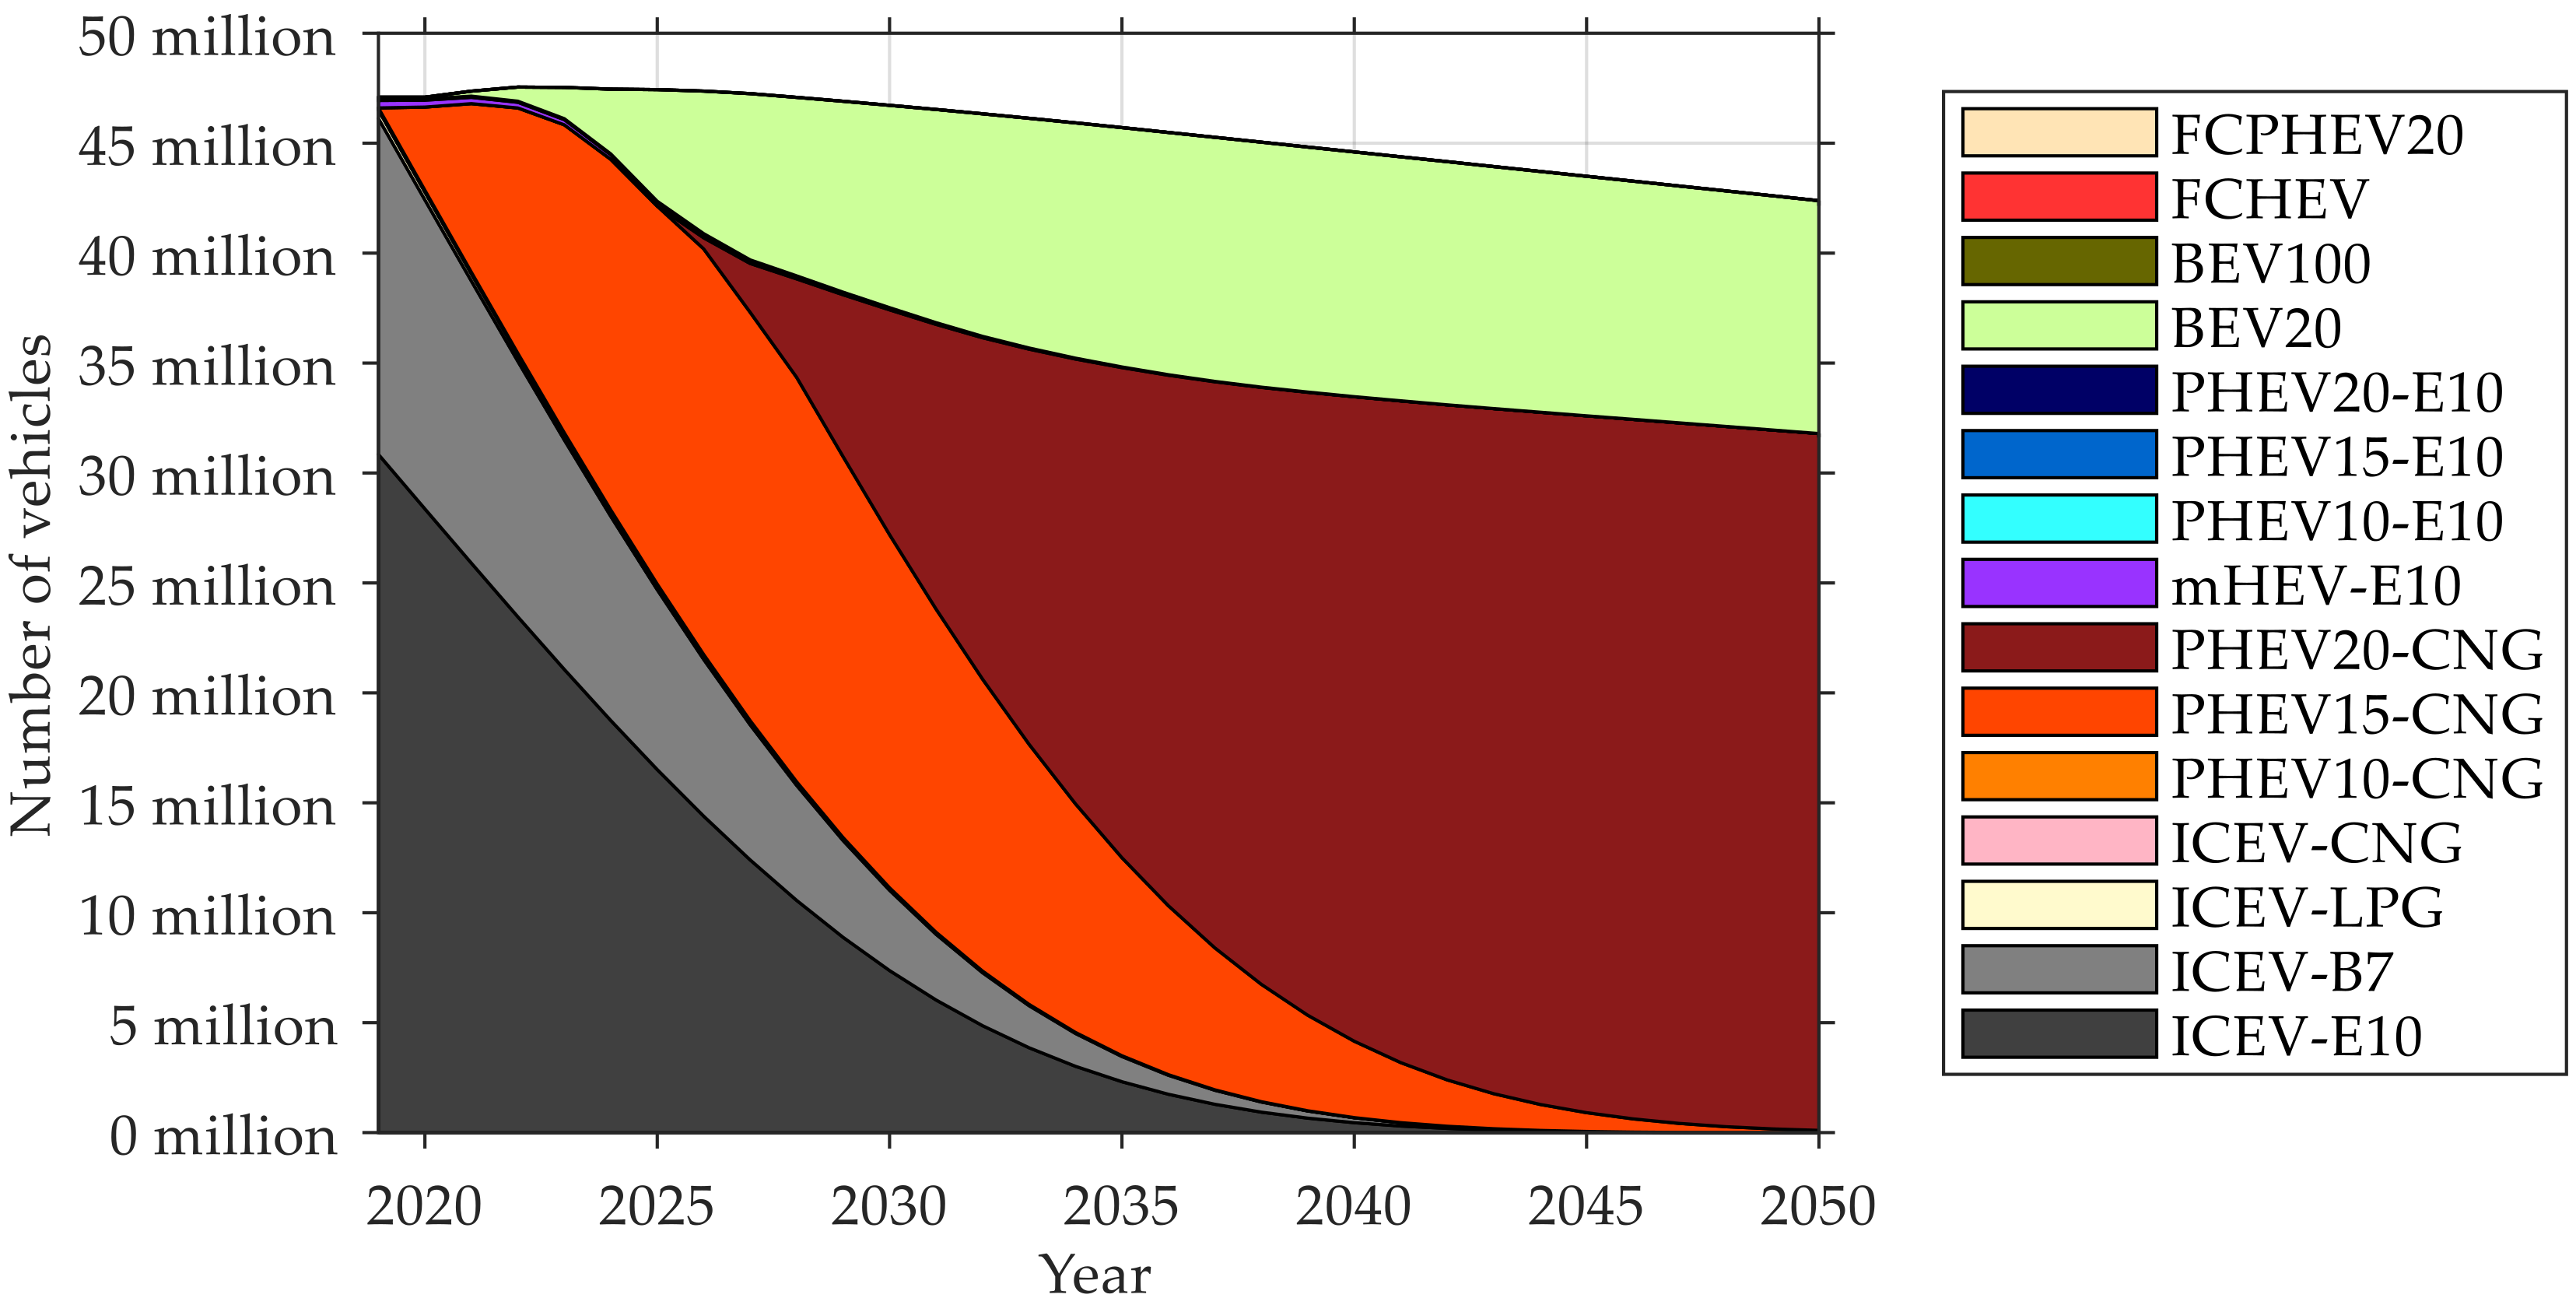
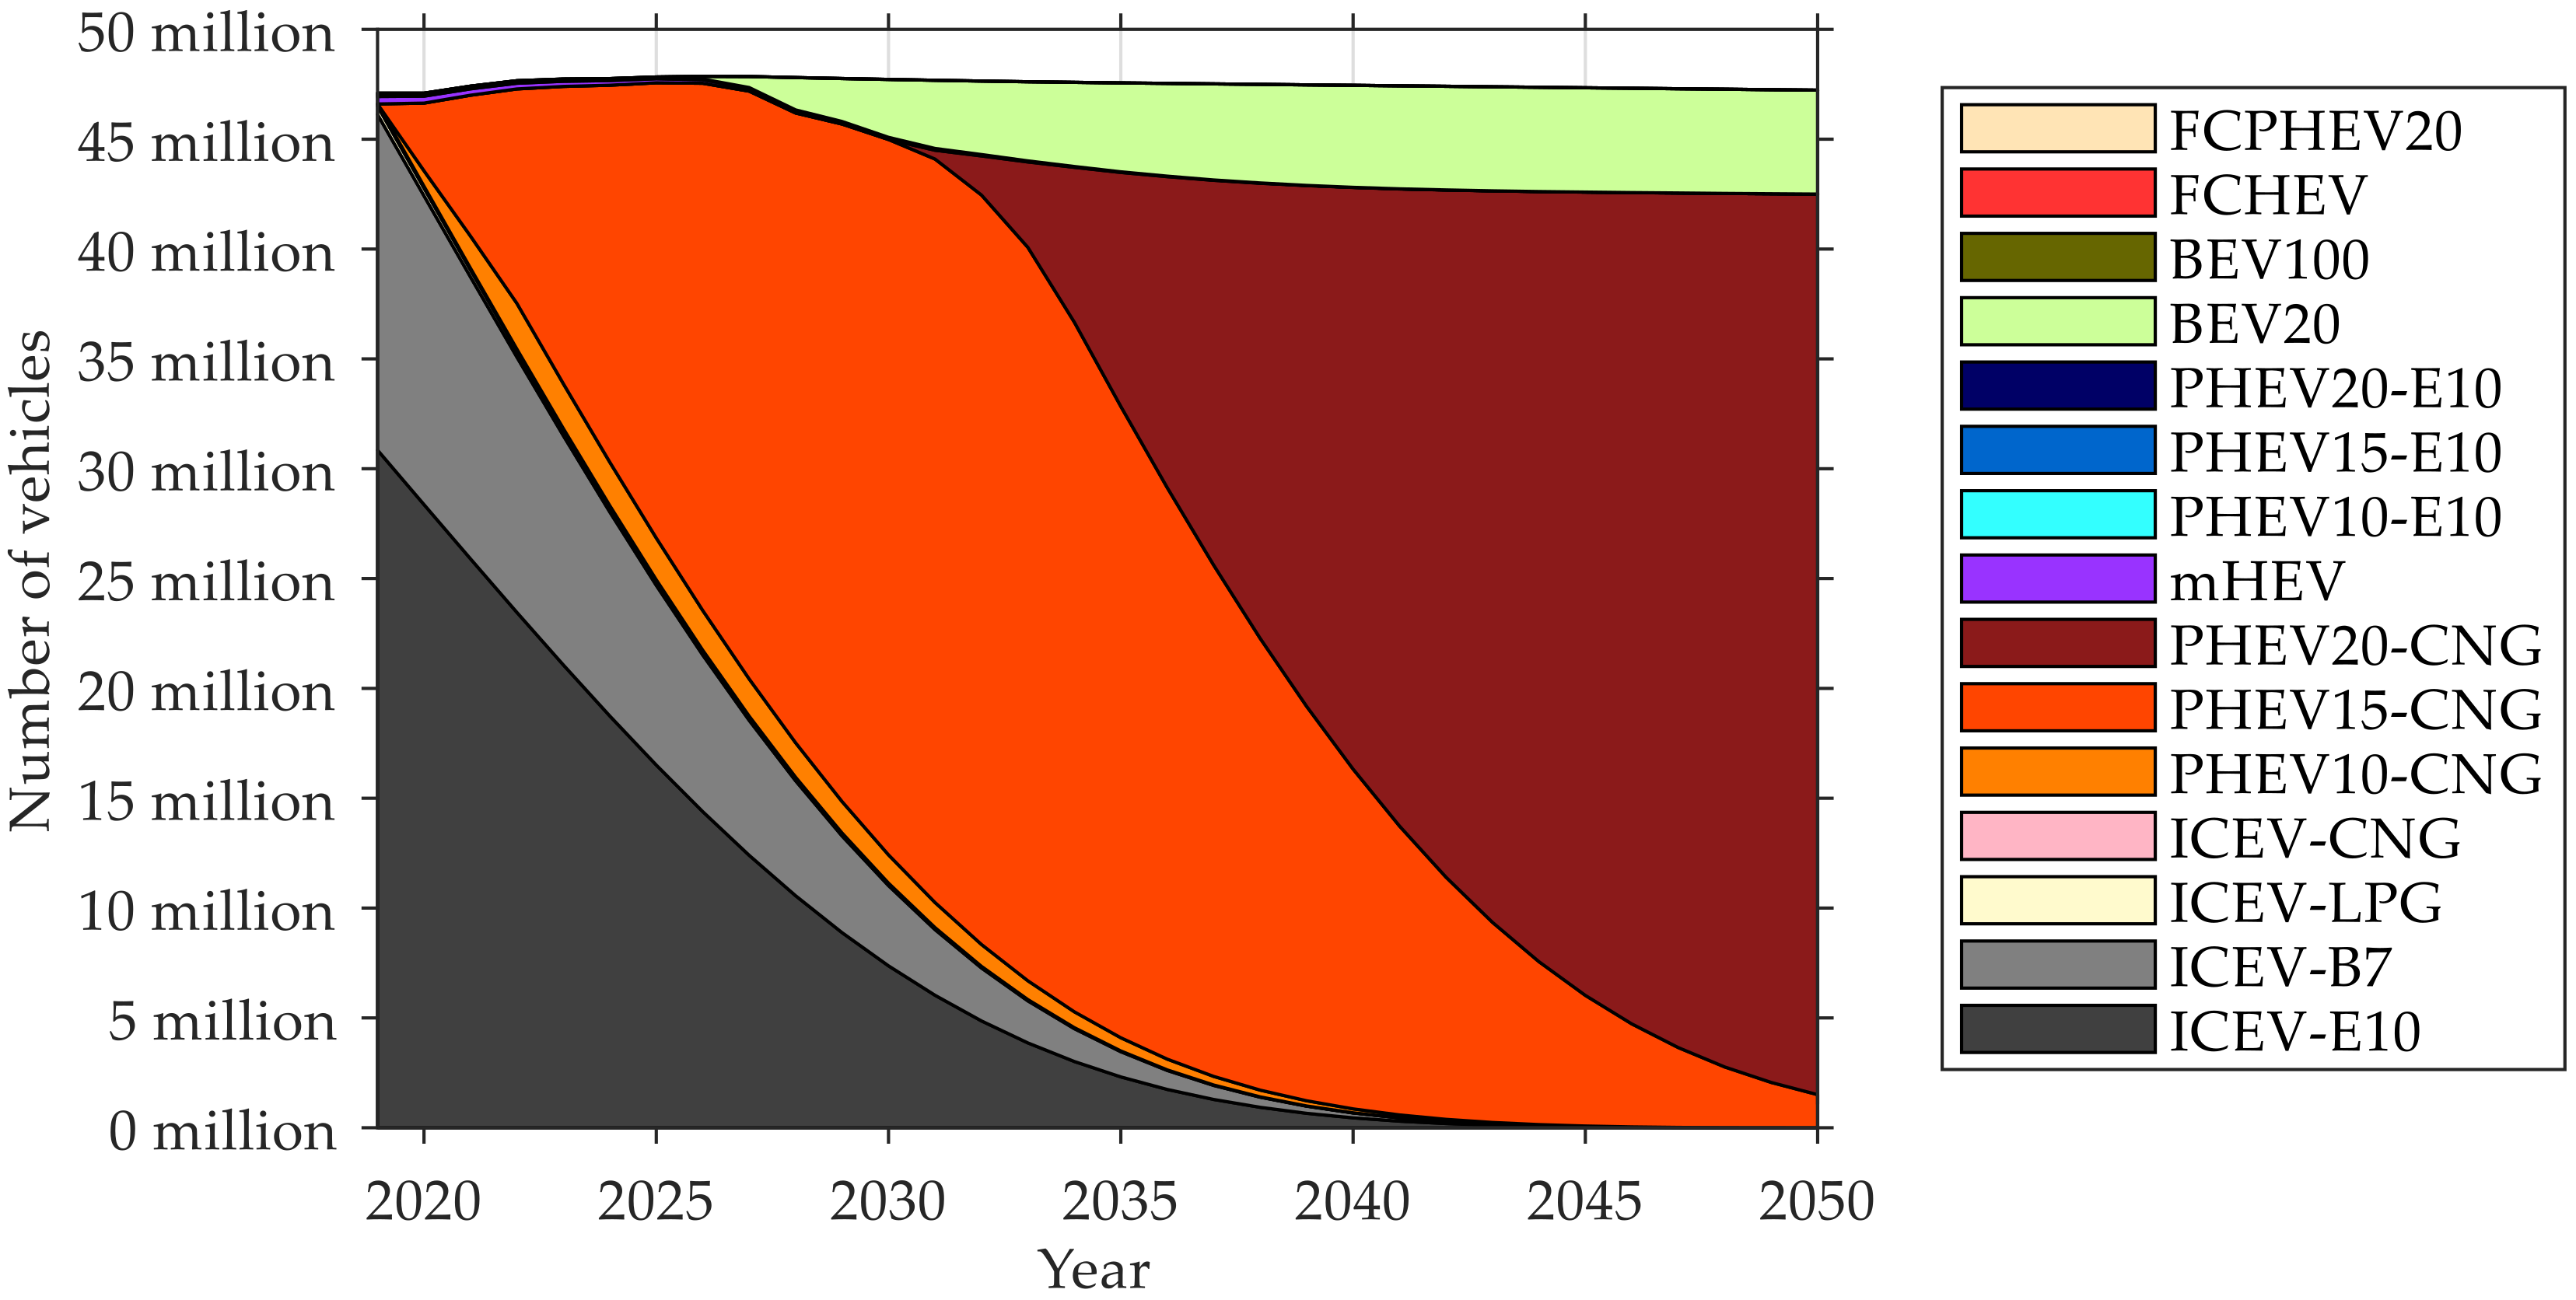
In the following, we take a closer look at the base scenario, in order to better understand the interconnected behavior of the vehicle fleet and the energy sector. As can be seen in the optimization results shown in Figure 14, apart from the vehicles of the initial situation in 2019, no more conventional ICEVs are introduced into the fleet.
PHEVs play a very important role during the fleet transition. Two types of PHEVs powered by electricity and CNG are the most relevant concepts. At the start, the concept with the 15 kWh battery is introduced, and, beginning in 2026 onwards, the concept with a slightly higher battery capacity—20 kWh—takes over. Shortly after 2019, BEV20 are gaining their share in the fleet until they reach their maximum share of 25% implemented in the mobility trend scenario. This constraint represents the limited user acceptance for short-ranged vehicles in the base scenario.
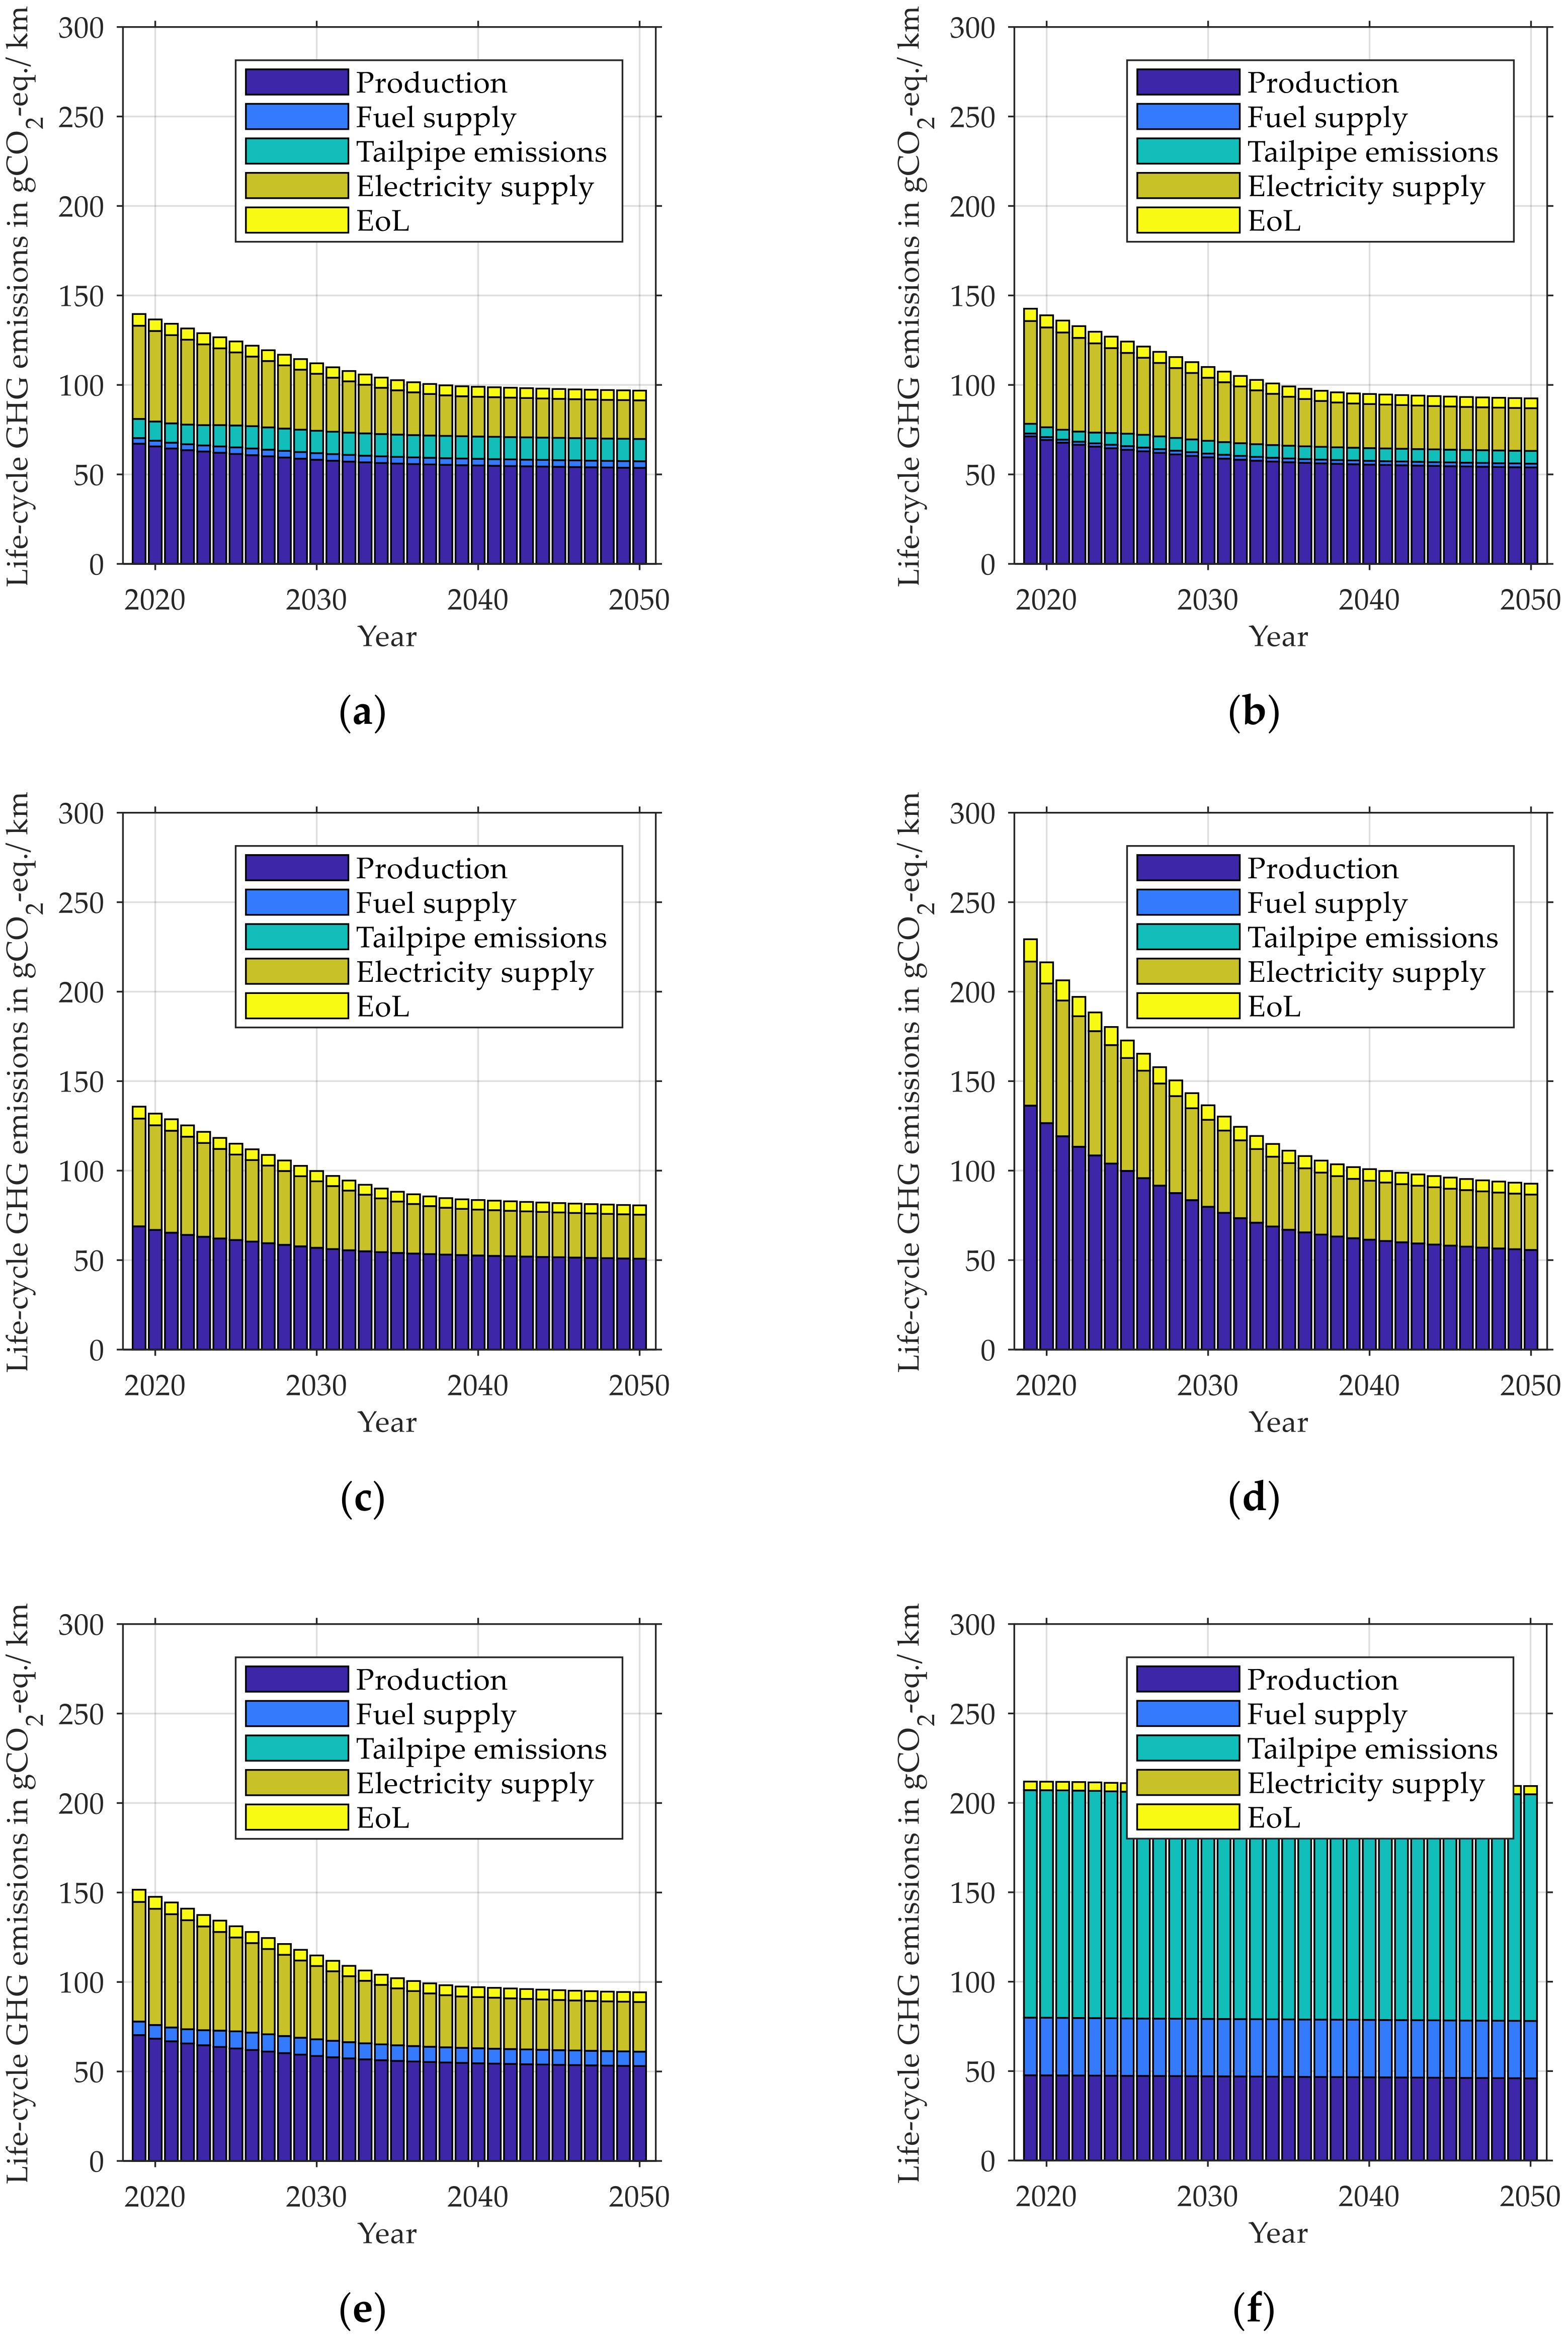
Our model permits analyzing the yearly life-cycle emissions for all powertrain concepts for every given fleet transition scenario. This way, regardless of being introduced into the fleet, we can estimate the life-cycle emissions of any given powertrain concept. In fact, for this base scenario, we identify that BEV100 and FCPHEV20 are causing a similar amount of GHG emissions as PHEV20-CNG when looking between 2040 and 2050. Even though the use of PHEV-CNG concepts is optimal for this scenario, the introduction of BEV100 or FCPHEV20 starting in 2040 would lead to similar cumulative emissions. Figure 15 reveals that the production emissions during this time interval barely differ between the powertrain concepts. Further, the long-range capable vehicles PHEV20-CNG, BEV100, and FCPHEV20 are mainly driven electrically during their operational phase. Given the similarity of their electrical consumption, they all interact in a similar way with the energy sector, only slightly changing its mean specific GHG emissions. This renders the vehicles interchangeable, with little impact on the objective value. In summary, the ecological potential of the BEV100 and FCPHEV20 concept should not be underestimated—especially considering the uncertainty that accompanies the prediction of technical boundary parameters over long time periods. Figure 15 shows the life-cycle emissions of the PHEV15-CNG (a), the PHEV20-CNG (b), the BEV20 (c), the BEV100 (d), the FCPHEV20 (e), and the ICEV-E10 (f) in every year for the base scenario transition.
Table 7 contains the life-cycle emissions of the PHEV15-CNG, the PHEV20-CNG, the BEV20, the BEV100, and the FCPHEV20 in the year 2050. The small magnitude of the differences between the long-range capable powertrain concepts remarks the fact that BEV100 and FCPHEV20 could also be considered at the end of the time-horizon in the context of a near-optimal fleet transition instead of PHEV20-CNG.
We already saw the electricity demand in Germany corresponding to expected scenarios of the UBA in Figure 7, Section 2.1.3. Figure 16 shows us the combined electricity demand of the projection and the additional demand from the vehicle fleet. The additional energy demand, caused by the vehicles with a plug-in option, is mainly satisfied by an increased usage of gas power plants. As can be seen, the mean specific GHG emissions of electricity production are higher than in Figure 7, but still follow the same trend of declining sharply during the out-phasing of coal-based power plants.
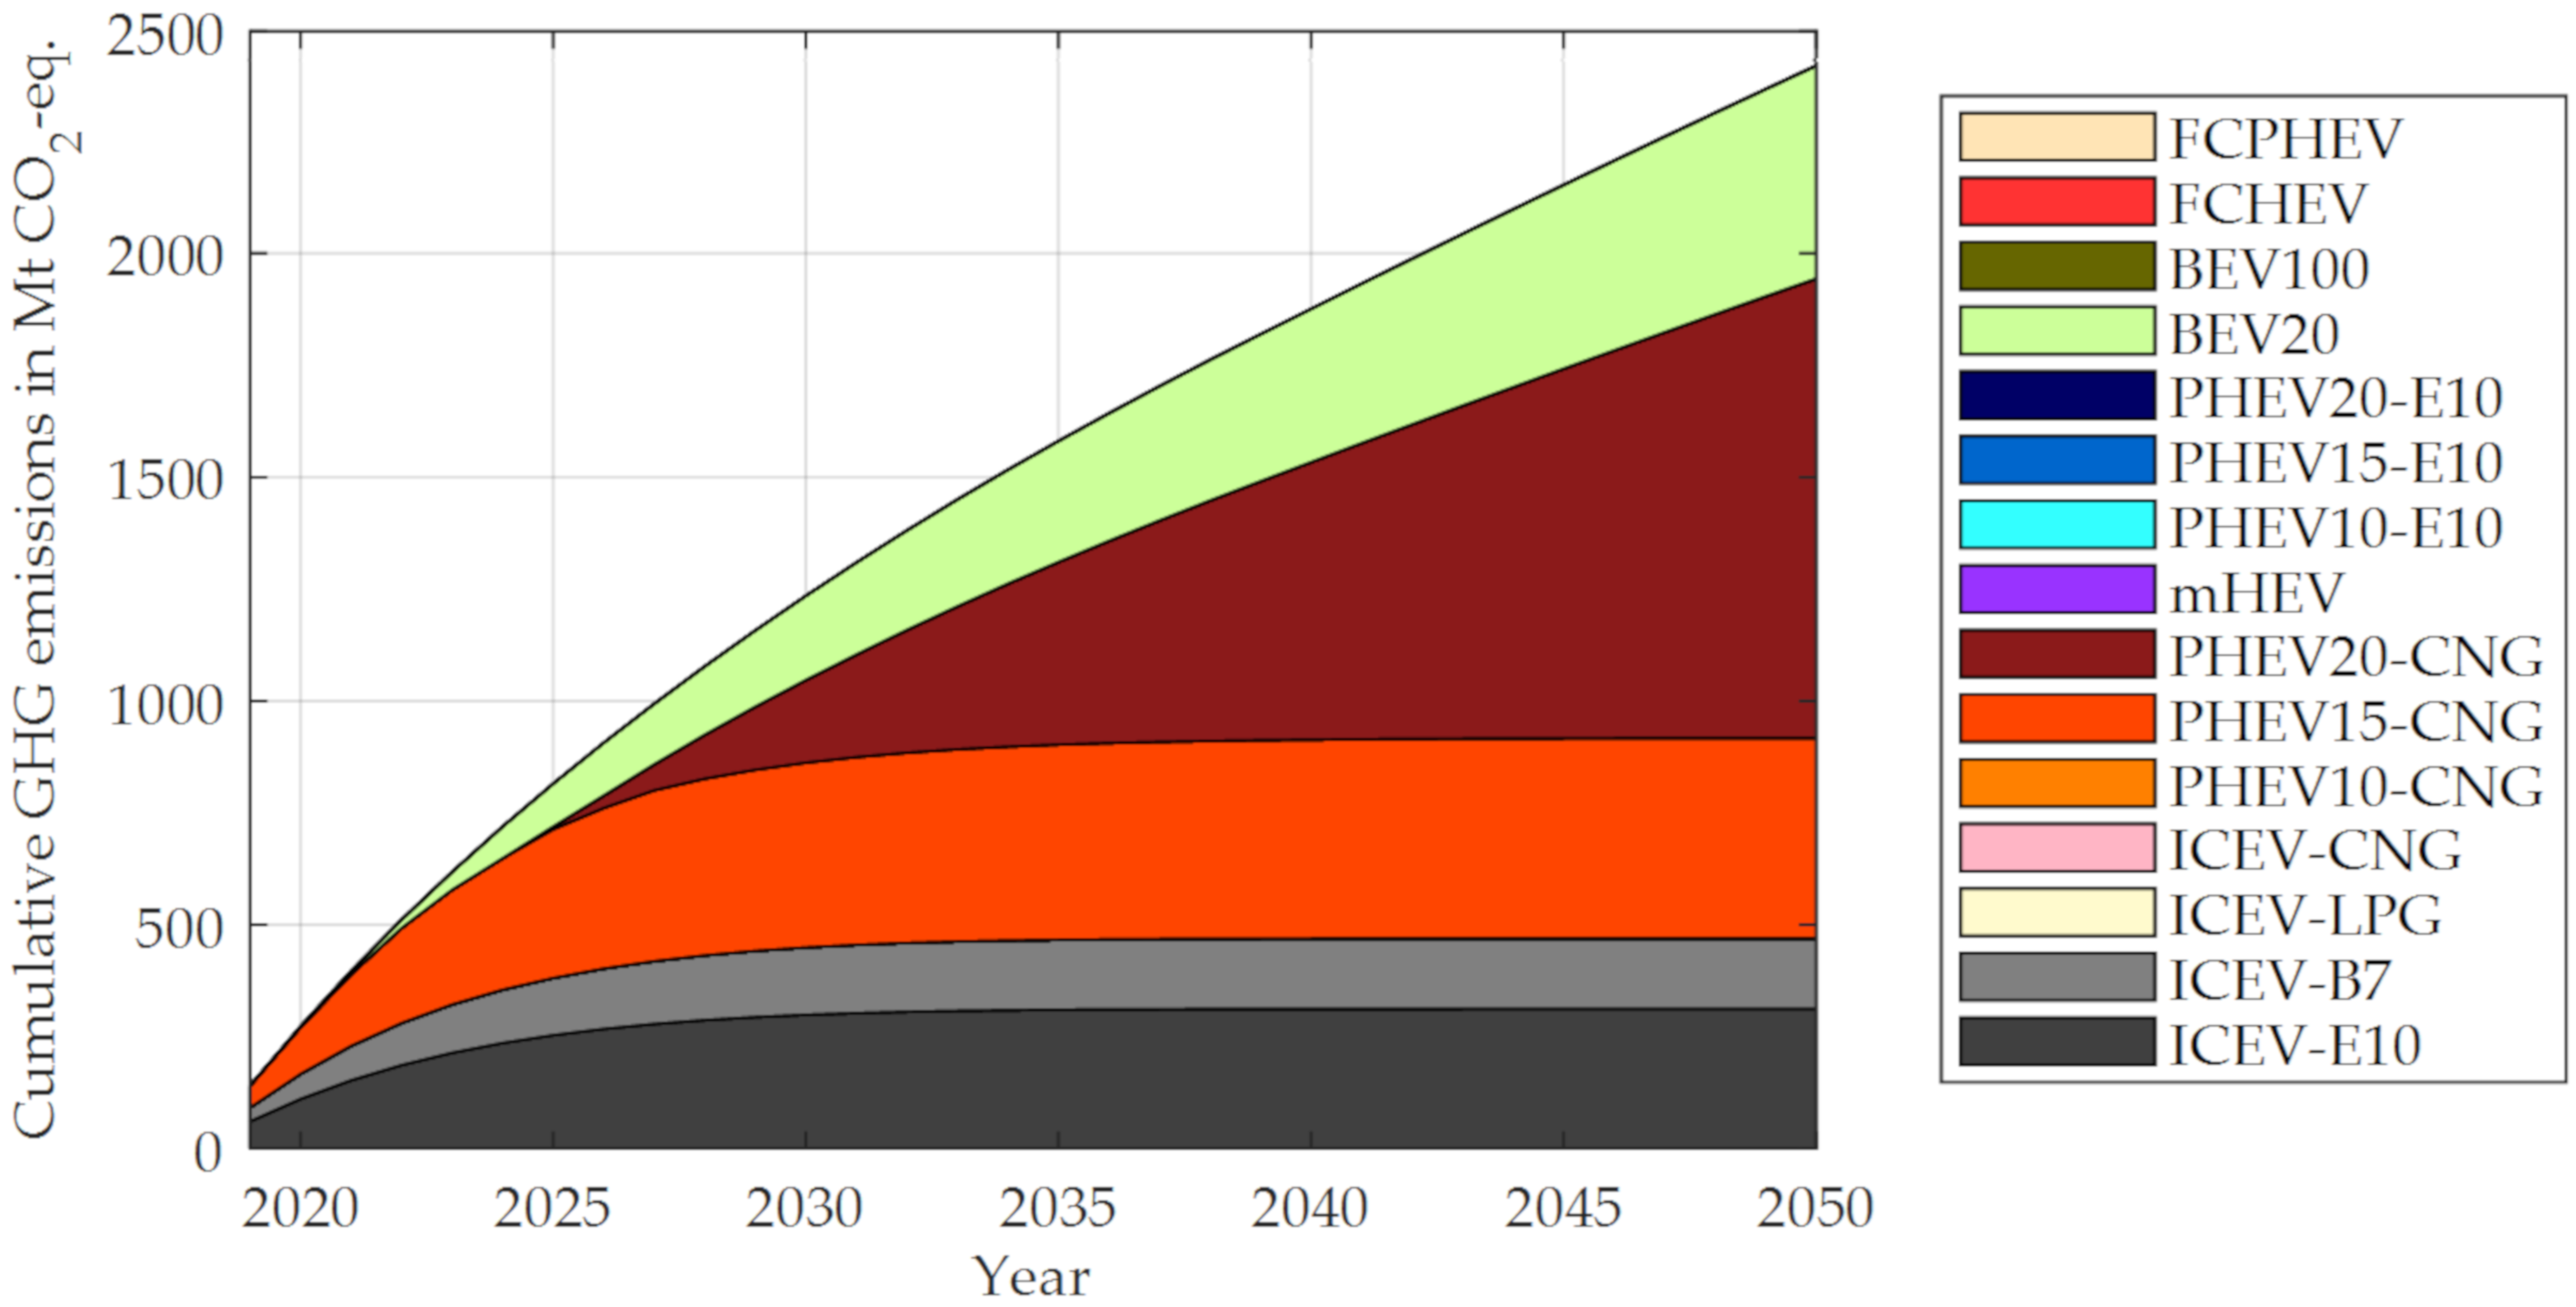
Figure 17 shows the cumulative GHG emissions caused by the entire vehicle fleet starting in 2019. The cumulative GHG emissions of ICEVs soon reach a plateau, because they are all replaced.
For this transition, the cumulative amount of GHG emissions of all life-cycle phases of the fleet until 2050 amounts to approx. 2046 million tons CO2-eq. This is less than 50% of the cumulative emissions compared to the business-as-usual scenario.

3.2. Optimal Vehicle Fleet Transition for the Worst-Case Scenario

In the worst-case scenario—all key influence parameters evolving according to their pessimistic scenario—the optimal fleet transition identified by the developed model looks similar to the base scenario, see Figure 18. Regarding the BEV20, we notice two main effects compared to the base scenario. They are introduced later and their maximum share in the fleet is limited. The former effect is due to a slower energy transition, which leads to higher GHG emissions resulting from electrical consumption, and the fact that battery production emissions cannot be reduced as fast as in the base scenario. The second effect is due to limited user acceptance of short-ranged vehicles implemented by a 10% cap for these concepts.
As in the base scenario, the rest of the fleet is constituted by PHEV-CNG. However, we notice a shift in the introduction of PHEV20-CNG when comparing to the base scenario. This shift results for the same reasons that lead to the later introduction of BEV20. Overall, the optimal fleet transition in the worst-case scenario leads to approx. 2,463 million tons of CO2-eq.—which is a reduction of about 40% compared to the business-as-usual scenario.

3.3. Optimal Vehicle Fleet Transition for the Best-Case Scenario

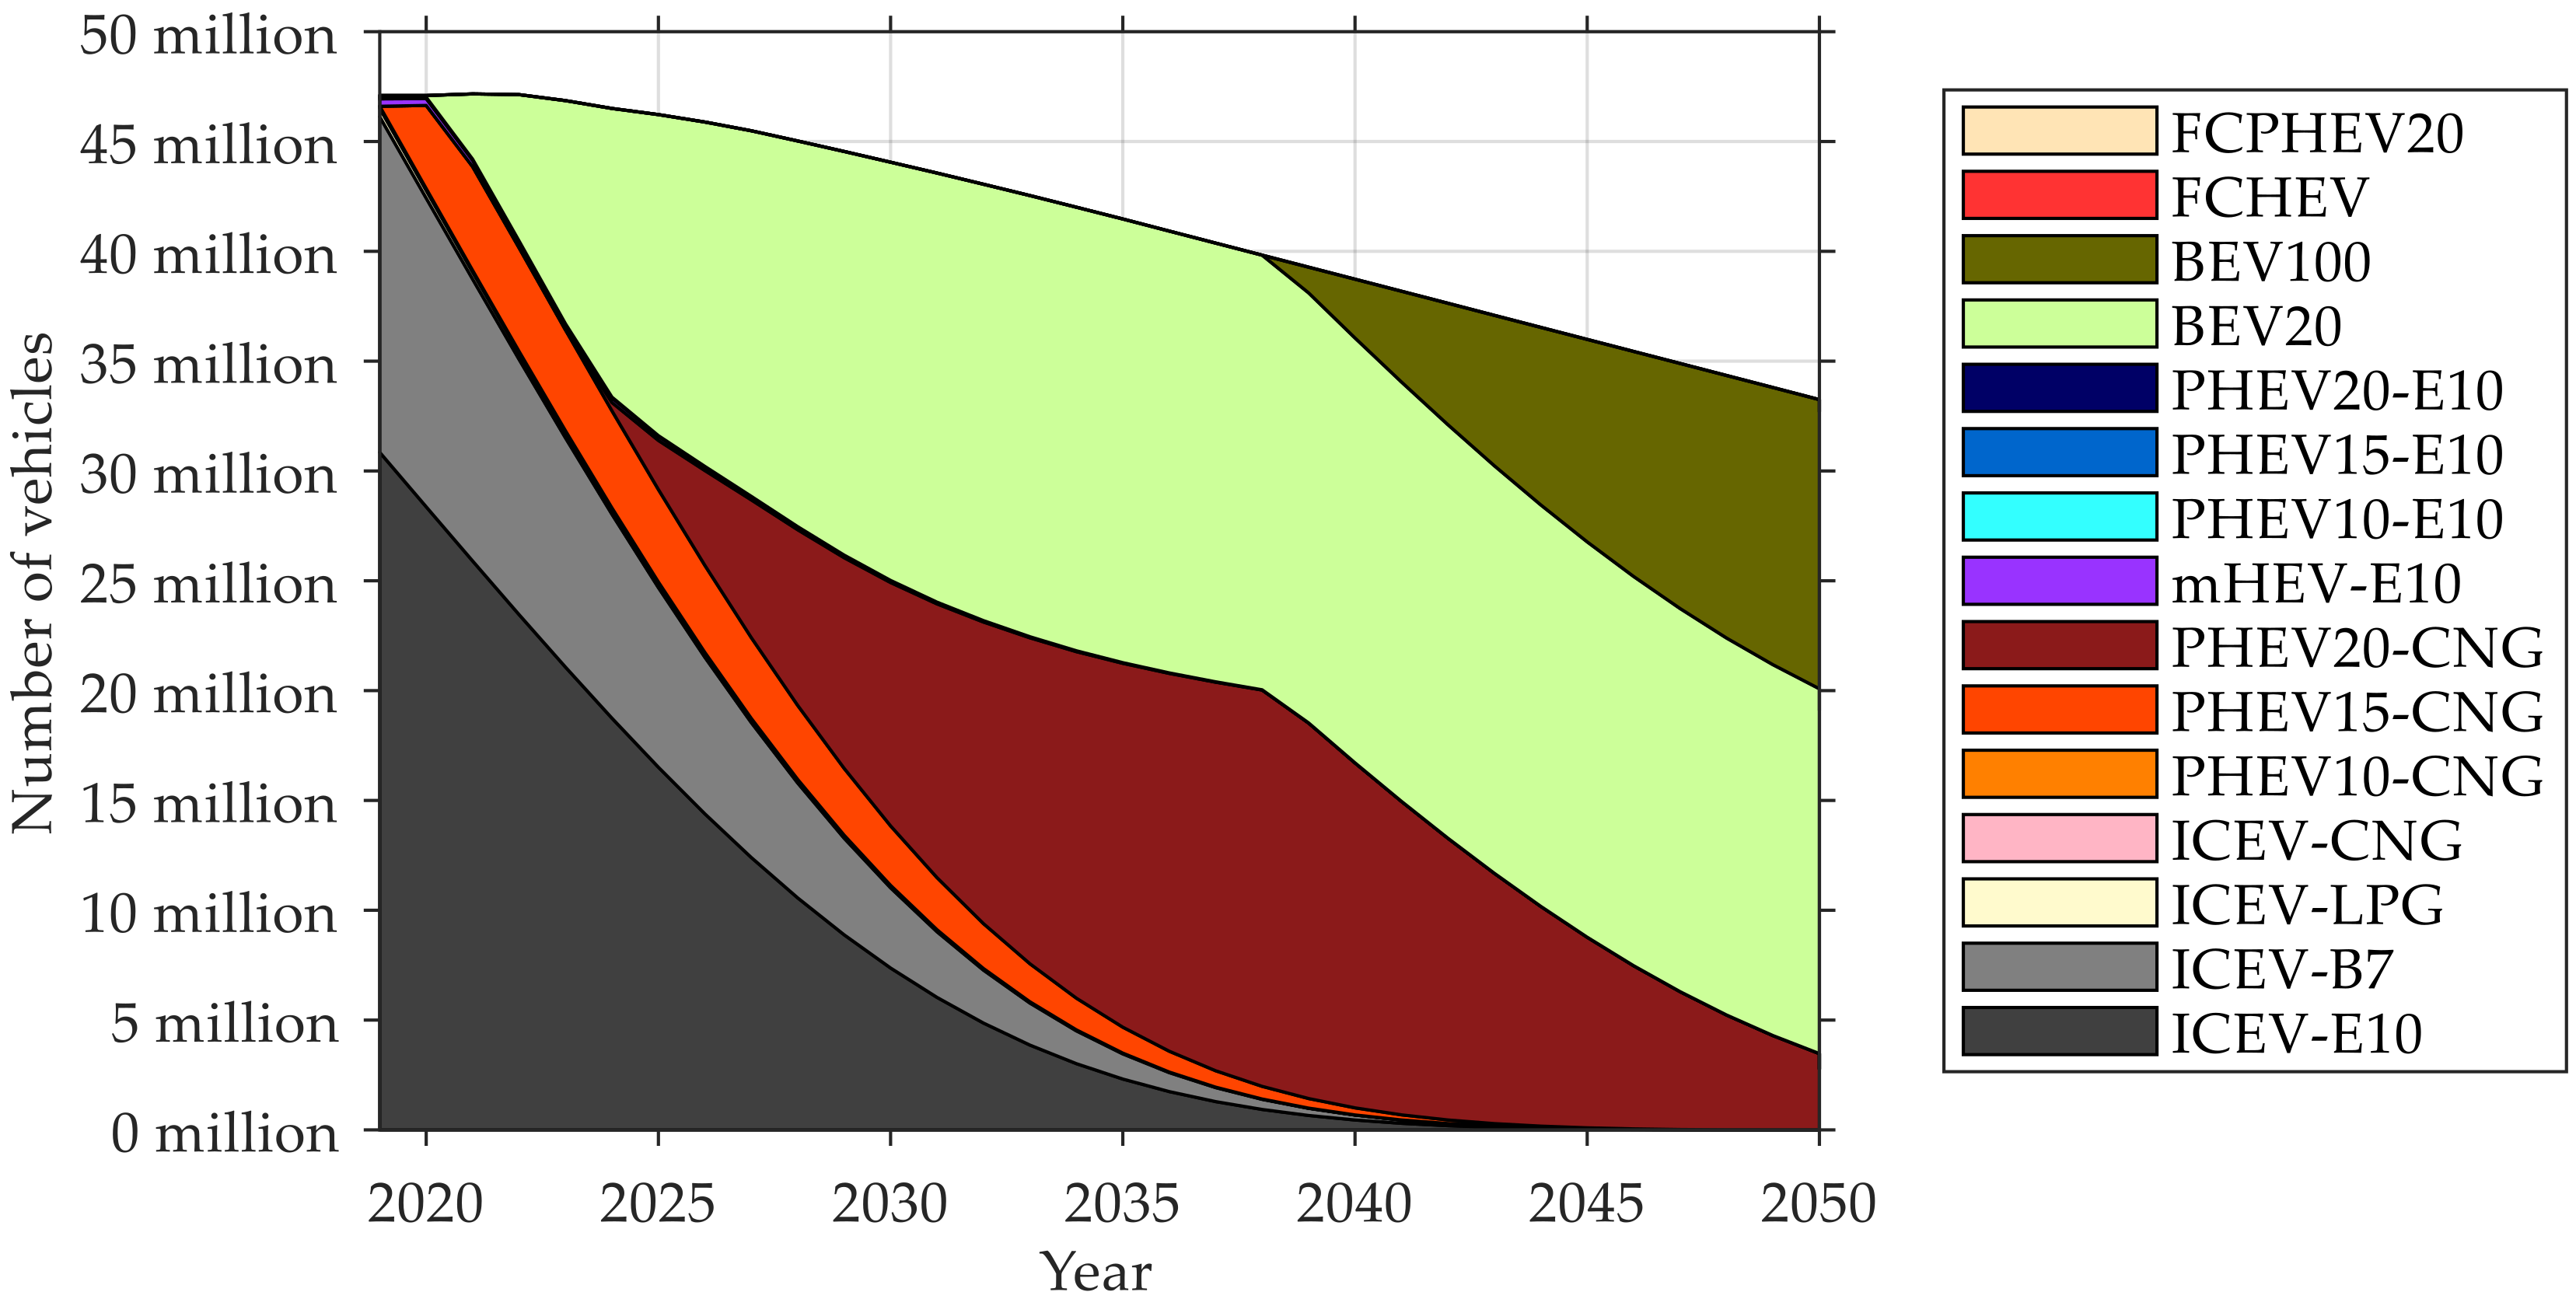
Now we have a look at the best-case scenario, in which all key influence parameters evolve according to their optimistic scenario. The mobility trend in Germany has a major influence on the transition. Firstly, people switch to other means of transport and thereby lower the demand for vehicles. Secondly, carsharing penetrates the market and thereby raises the average lifetime mileage of the vehicles putting a higher weight on the operational phase of the vehicles. Thirdly, a higher user acceptance for short-ranged vehicles increases their maximum fleet-share to 50%. As can be seen in Figure 19, the optimal transition mainly consists of BEVs. In fact, BEV20s gain a big share of the fleet very quickly. The fast developments of battery technologies and the effective energy transition to more renewables reduce the role of PHEVs in favor of BEVs. Nevertheless, the former are still relevant for the fleet transition. The PHEV15-CNG now takes a minor role and beginning in 2025 the PHEV20-CNG replaces the former achieving a significant fleet-share of around 50%. Furthermore, production emissions of batteries can be reduced in such a way and the expansion of wind power is such, that, starting in 2039, BEV100 are part of the optimal fleet transition.
Overall, the best-case scenario would lead to approx. 1680 million tons of CO2-eq. as cumulative emissions until 2050—which is a reduction of about 60% compared to the business-as-usual scenario.

3.4. Sensitivity-Analysis of Key Influence Parameters

The results suggest that future powertrain concepts need to be equipped with a plug-in option. ICEV concepts and even HEV concepts are not part of the presented optimal transition scenarios. PHEVs are present in all three transition scenarios previously considered. They offer a great compromise between electrical and fuel consumption. PHEV-CNG appear more advantageous than PHEV-E10, because their direct emissions are lower. Concerning the short-range vehicles, BEV20 are introduced for all considered scenarios. BEV100 and FCPHEV20 powertrain concepts both show potential to reduce GHG emissions in the optimal transition for the best-case scenario with optimistic boundary conditions and would lead to almost similar results in the base scenario if introduced after 2040.
At this point, we conduct a sensitivity-analysis of all possible future scenario-combinations of the four key influence parameters. Each parameter having three possible scenarios leads to a total of 81 possible combinations for future scenarios. We performed the analysis for all 81 combinations and found 81 optimal fleet transitions. Sequentially, we analyze the four key influence parameters by grouping the results according to their scenarios in every instance. For example, when looking at the mobility trend, there are 27 scenarios in which the trend evolves in a pessimistic way, 27 for the neutral scenario, and 27 for the optimistic scenario. In the end, we have four different ways of grouping the results into three groups of 27 each.
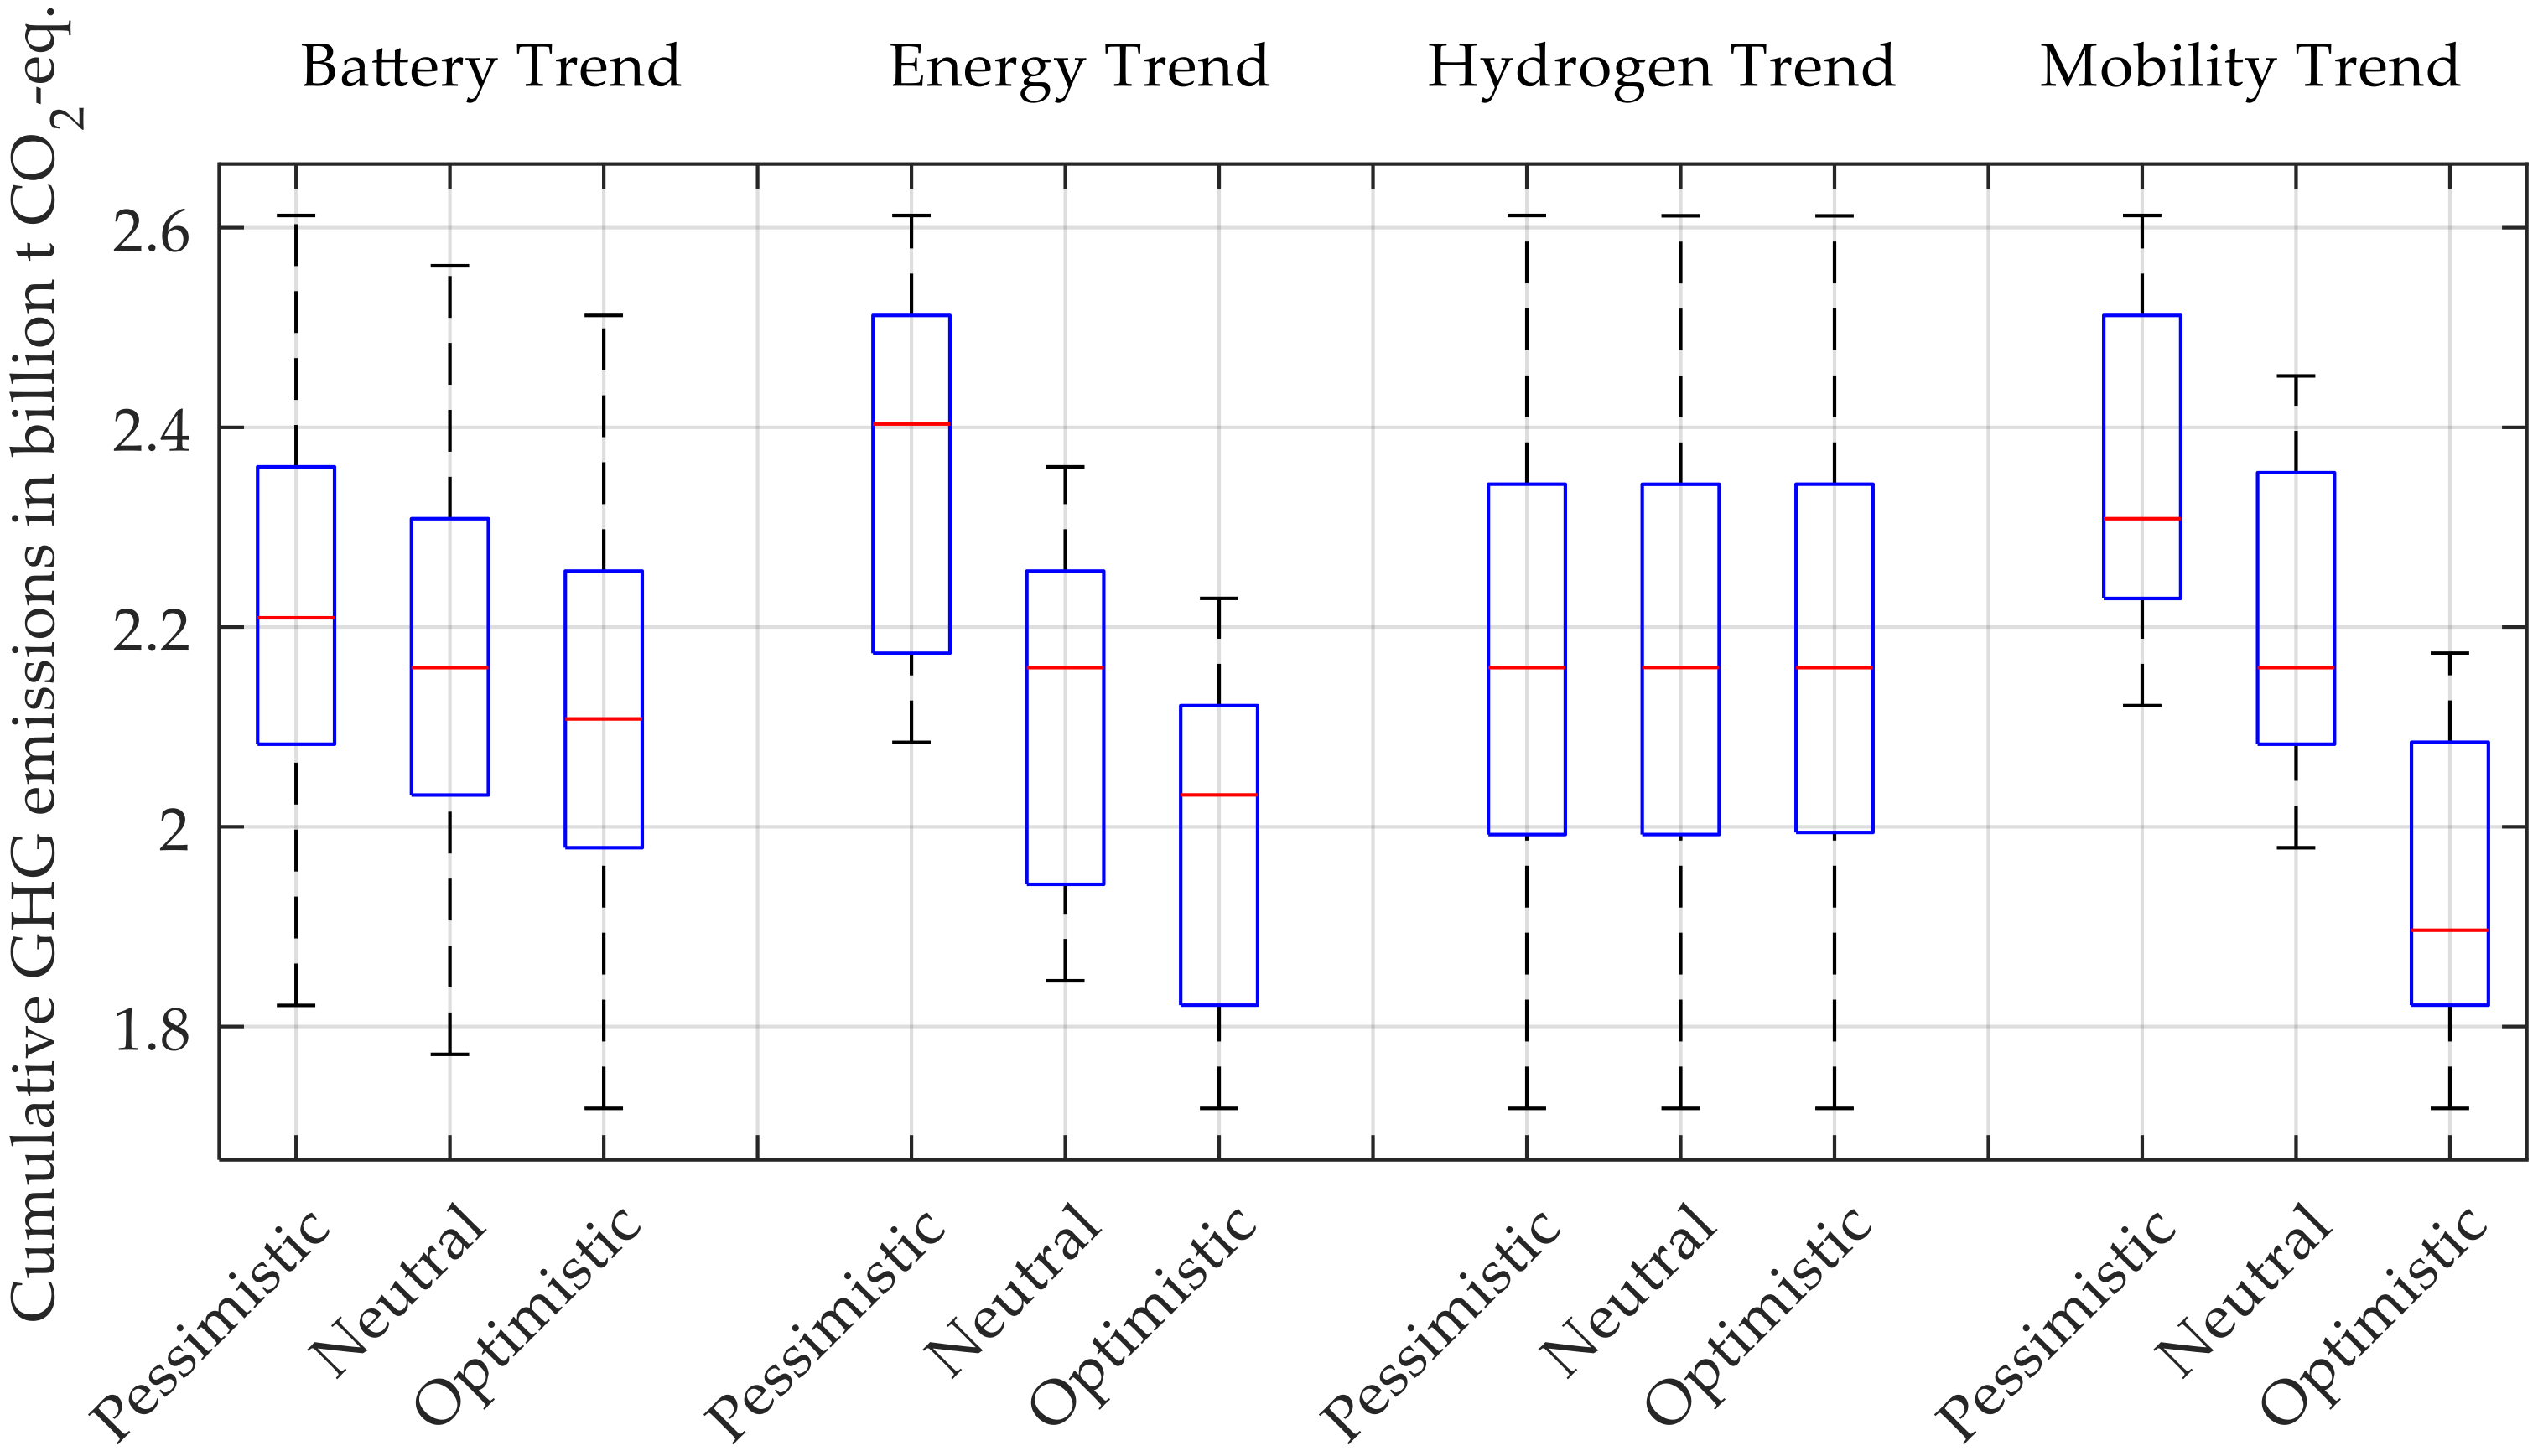
First, we analyze the objective value of the optimization function: the cumulative GHG emissions of the vehicle fleet until the year 2050. Generally, as can be seen in Figure 20, the groups containing the results for the pessimistic scenario of the key influence parameters correlate with higher cumulative emissions. After comparing the median values and their variation within one key influence parameter, we conclude that the mobility trend, followed by the trend in the energy sector are the primal determinants to reduce GHG. This is no surprise since less vehicles result in lower cumulative GHG emissions. In addition, more renewable energy for electricity production has a positive impact on PHEVs, BEVs, and FCPHEV20s, which have reduced GHG emissions during their operational phase. Battery production plays an important role as well. The sooner production emissions per kWh can be reduced, the sooner vehicles with a higher battery capacity can be introduced into the fleet. The electrical range from PHEVs can be increased, thereby reducing the distance travelled with fossil fuels. The key influence parameter regarding the hydrogen production path has no impact on the fleet transition, because no FCEVs are introduced in any scenario. This is due to the significant emissions during the supply of hydrogen as presented in Figure 3, that are not compensated by the positive developments presented in Section 2.2.3.
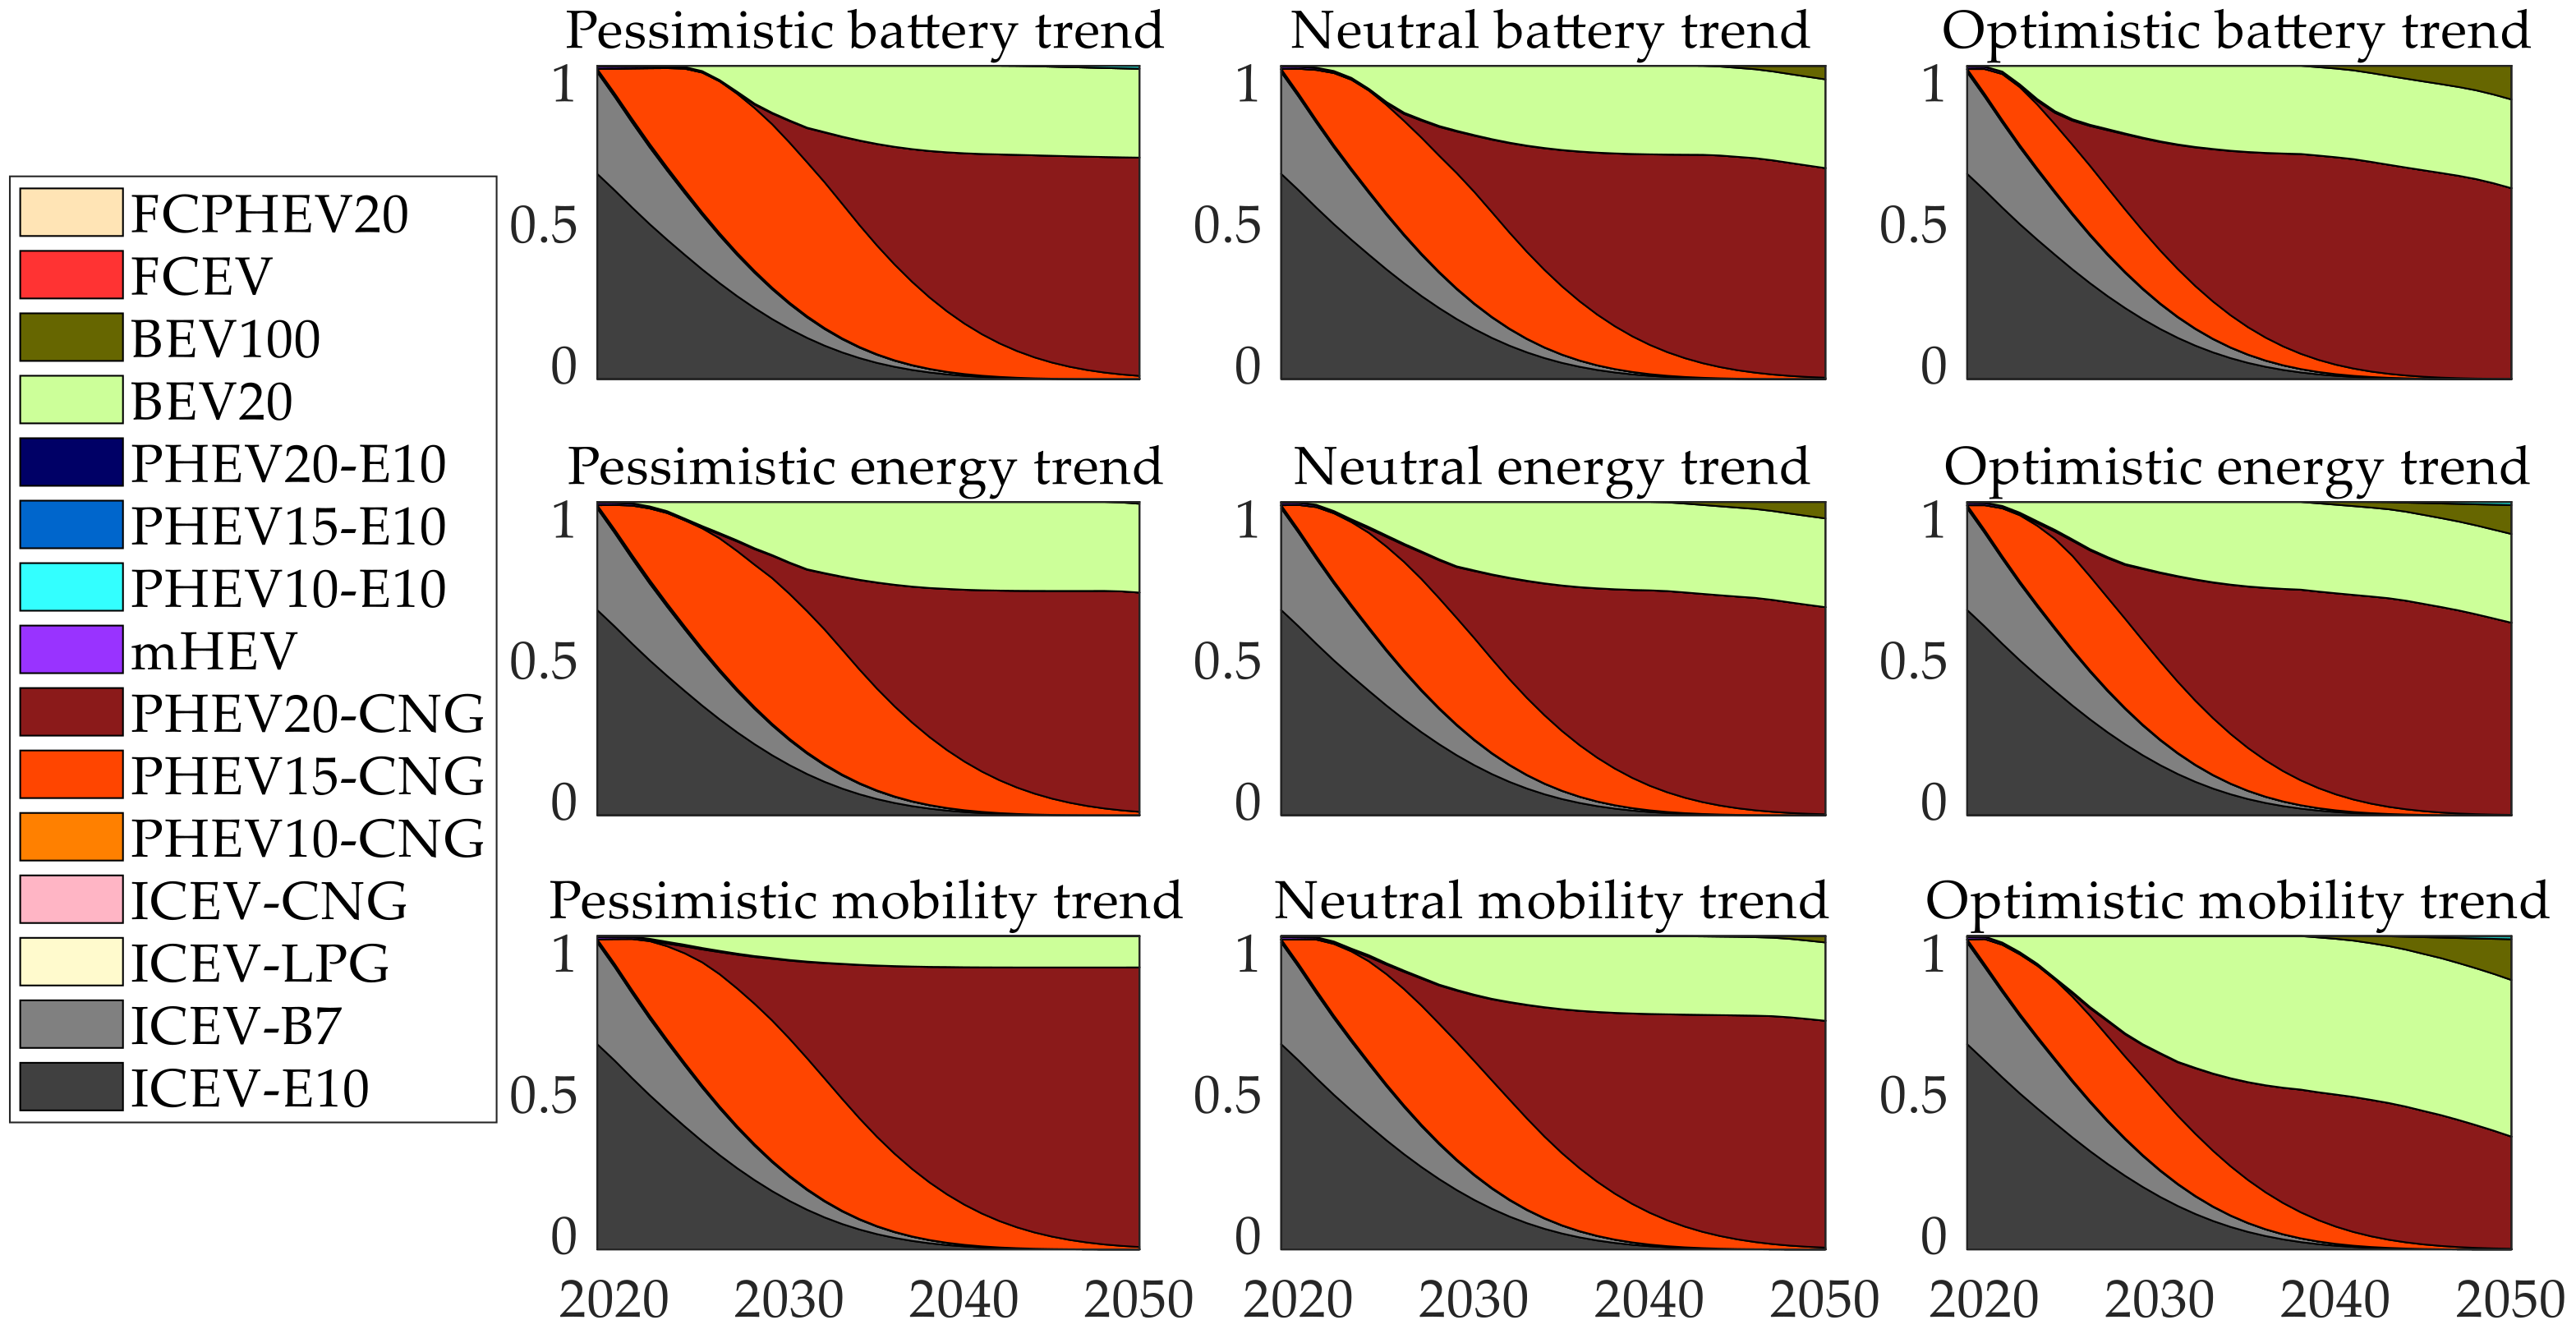
Next, in Figure 21, we present the composition of the fleet transitions. Since analyzing all 81 fleet transitions one by one would exceed the scope of this work, we merged 27 scenarios at a time following the same grouping procedure as above. Prior to merging, we normed the absolute vehicle number in all years to one, because vehicle numbers for the same year differ between different scenarios. The key influence parameter regarding the hydrogen production path is no longer part of our sensitivity-analysis, since there is no influence in our study, as shown by the former results.
On first sight, we notice the strong similarity with the base, worst-, and best-case scenarios discussed earlier. The trend of the battery production emissions and the trend in the energy sector both have a similar effect on the fleet transition. In more optimistic scenarios, the introduction of BEV20 and PHEV20-CNG takes place earlier. Consequently, the role of the PHEV15-CNG is moderately reduced. In very optimistic cases, BEV100 are introduced into the fleet starting in 2039. Regarding the mobility trend, we observe that in more optimistic scenarios the PHEV15-CNG are out-phased earlier and the PHEV20-CNG are introduced slightly later. This is due to higher user acceptance of short-range vehicles—BEV20—and the fact that it takes several years until the BEV20 reach the maximum share of 50% short-ranged vehicles of the fleet (optimistic case).

4. Conclusions

We presented an optimization model to identify optimal vehicle fleet transition paths for given scenarios with the cumulative amount of GHG emissions caused by all vehicles of the fleet taking into account all life-cycle phases of the vehicles. This way, the relevance of powertrain concepts can be compared in the context of a fleet transition over a 30-year time period. Furthermore, the identified optimal transitions give important insight about suitable timing and rates of introduction of new powertrain concepts. Special focus lies on the interaction of the fleet with the energy sector. Note that, for all powertrain concepts, the vehicles were parametrized in a way that reduces their life-cycle GHG emissions, as in [9]. The results do not represent the most likely fleet transitions, for which different prognosis have been performed as presented in Section 1, but rather reveal the hidden ecological potential of the mobility sector and serve as guideline for decision makers that want to achieve GHG-optimal results.
Aspects that have not been considered in this study are the costs of ownership of the different powertrain concepts and the user convenience, for which the charging infrastructure is essential. These two levers are of major relevance for policy in order to influence the composition of the vehicle fleet. At the same time, these levers will hinder the optimal fleet transition, if disregarded.
In particular, we analyzed the situation in Germany and modeled several parameters with yearly resolution. For four key influence parameters of interest, we modelled several scenarios, followed by an extensive sensitivity-analysis. The battery production emissions trend, the energy sector transition, and the mobility trend highly influence the cumulative GHG emissions of the fleet.
Interestingly, the optimal fleet transitions for different scenario parameters show various similarities, which allow to draw generic conclusions on how the transition of the German vehicle fleet should be organized. Based on our results, short-ranged BEVs with moderate battery capacities—like the BEV20 considered in this study—should soon be introduced into the fleet. As Esser et al. already confirmed in their previous work, this powertrain concept has the lowest life-cycle GHG emissions on short-range driving profiles [6]. Furthermore, we conclude that PHEVs are of central relevance for an optimal fleet transition—bear in mind that this fleet transition optimization aims at showing the ecological potential of different powertrain concepts and therefore, as mentioned earlier, PHEVs are assumed to be fully charged previous to every ride. In general, they represent a great compromise between mostly driving electrically on short distances—like BEV20—whilst having the possibility to drive longer distances as well. This behavior overlaps with the driving habits of most car owners in Germany. More in detail, our optimization finds that as time passes and the GWP100 of battery production gets lower, an increase of battery capacity of PHEVs leads to an overall reduction of cumulative GHG emissions. This effect is further strengthened—or conditioned by—the successful transition of the energy sector to more renewable energy sources. If PHEVs are not charged regularly, their good ecological potential will not be reached and their relevance for an optimal fleet transition is reduced. Therefore, regulations or incentives to ensure regular charging of the vehicles are essential.
The PHEVs powered by CNG emit less GHG compared to their petrol-powered counterparts. This is due to lower direct operational emissions of CNG. Nevertheless, deeper analyses of high-pressure tanks for natural gas should be conducted. In this paper, their GHG emissions have not been explicitly determined for the production phase of these vehicles.
When focusing on the time period between 2040 and 2050—assuming the energy transition in Germany is mostly completed—we find that the powertrain concepts PHEV20-CNG, BEV100, and FCPHEV20 show very similar life-cycle emissions. By that time, these three powertrain concepts lead to very similar GHG emissions and result in similar cumulative fleet emissions. Other factors, i.e., synergy effects between the mobility and the energy sector, should be further analyzed to determine the best powertrain concepts and fleet transition. This is because CNG and hydrogen can act as energy buffer and energy carriers between both sectors—globally optimizing the resource utilization.
The developed optimization model for the identification of optimal fleet transitions was applied to the German vehicle fleet. The representativeness of the driving profiles for Germany can be further increased, if the ARTEMIS cycles are substituted by actual driving cycles based on fleet driving data covering Germany as in [9]. This would permit a more precise assessment of the GHG emissions during the operational phase of the vehicles using representative driving cycles resulting in the true environmental impact of GHG emissions during the whole life-cycle of vehicles—the real ecological impact (REI) of considered powertrain concepts. Furthermore, the approach can be generalized and applied on further global regions. Future works on this topic can increase the meaningfulness of the results by integrating the GHG emissions of other means of transportation into a global mobility sector optimization environment that also considers different scenarios regarding policy incentives.

Supplementary Materials

The Supplementary Data Table S1: Meta-Analysis of Lithium-Ion Batteries is available online at http://dx.doi.org/10.25534/tudatalib-144. Supplementary Data Table S2: Meta-Analysis of Fuels is available online at http://dx.doi.org/10.25534/tudatalib-145.

Author Contributions

Conceptualization, B.B.B. and A.E.; methodology, B.B.B. and A.E.; software, B.B.B. and A.E.; validation, B.B.B., A.E. and S.W.; formal analysis, B.B.B. and A.E.; investigation, B.B.B. and A.E.; data curation, B.B.B.; writing—original draft preparation, B.B.B.; writing—review and editing, B.B.B., A.E., S.W. and G.F.; visualization, B.B.B.; supervision, L.S. and S.R.; project administration, S.R. All authors have read and agreed to the published version of the manuscript.

Funding

This research received no external funding.

Conflicts of Interest

The authors declare no conflicts of interest.

References

  1. Federal Ministry for Environment, Nature Conservation and Nuclear Safety. Klimaschutzbericht 2018—Zum Aktionsprogramm Klimaschutz 2020 der Bundesregierung; Federal Ministry for Environment, Nature Conservation and Nuclear Safety: Bonn, Germany, 2019.
  2. Knörr, W.; Heidt, C.; Gores, S.; Bergk, F. Aktualisierung “Daten- und Rechenmodell: Energieverbrauch und Schadstoffemissionen des Motorisierten Verkehrs in Deutschland 1960–2035” (TREMOD) für die Emissionsberichterstattung 2016 Berichtsperiode 1990–2014; IFEU—Institut für Energie- und Umweltforschung Heidelberg GmbH: Heidelberg, Germany, 2016. [Google Scholar]
  3. Kickhöfer, B.; Brokate, J. Die Entwicklung des Deutschen Pkw-Bestandes: Ein Vergleich Bestehender Modelle und die Vorstellung Eines Evolutionären Simulationsansatzes; Institut für Verkehrsforschung; Institut für Fahrzeugkonzepte; German Aerospace Center: Berlin, Germany, 2017. [Google Scholar]
  4. Harrison, G.; Krause, J.; Thiel, C. Transitions and Impacts of Passenger Car Powertrain Technologies in European Member States. Transp. Res. Procedia 2016, 14, 2620–2629. [Google Scholar] [CrossRef]
  5. Plötz, P.; Gnan, T.; Wietschel, M. Total Ownership Cost Projection for the German Electric Vehicle Market with Implications for its Future Power and Electricity Demand; Fraunhofer Institute for Systems and Innovation Research ISI: Karlsruhe, Germany, 2012. [Google Scholar]
  6. Helms, H.; Jöhrens, J.; Kämper, C.; Giegrich, J.; Liebich, A.; Vogt, R.; Lambrecht, U. Weiterentwicklung und vertiefte Analyse der Umweltbilanz von Elektrofahrzeugen. 2016. Available online: https://www.umweltbundesamt.de/sites/default/files/medien/378/publikationen/texte_27_2016_umweltbilanz_von_elektrofahrzeugen.pdf (accessed on 20 January 2020).
  7. Fraunhofer ISE. Treibhausgas-Emissionen für Batterie- und Brennstoffzellenfahrzeuge mit Reichweiten über 300 km; Fraunhofer ISE: Freiburg, Germany, 2019. [Google Scholar]
  8. Wietschel, M.; Kühnbach, M.; Rüdiger, D. Die Aktuelle Treibhausgas- Emissionsbilanz von Elektrofahrzeugen in Deutschland; Working Paper Sustainability and Innovation No. S 02/2019; Fraunhofer Institute for Systems and Innovation Research ISI: Karlsruhe, Germany, 2019. [Google Scholar]
  9. Esser, A.; Schleiffer, J.-E.; Eichenlaub, T.; Rinderknecht, S. Development of an Optimization Framework for the Comparative Evaluation of the Ecoimpact of Powertrain Concepts. In VDI-Berichte, Proceedings of the 19th Internationaler VDI-Kongress “Dritev—Getriebe in Fahrzeugen”, Bonn, Germany, 10–11 July 2019; Springer: Berlin/Heidelberg, Germany, 2019. [Google Scholar]
  10. Wuppertal Institut für Klima, Umwelt, Energie GmbH. STROMbegleitung—Begleitforschung zu Technologien, Perspektiven und Ökobilanzen der Elektromobilität; Wuppertal Institut für Klima, Umwelt, Energie GmbH: Wuppertal, Germany, 2015. [Google Scholar]
  11. Blat Belmonte, B.; Esser, A.; Weyand, S.; Franke, G. Meta-Analysis of Lithium-Ion Batteries—Identification of the Optimal Passenger Car Vehicle Fleet Transition for Mitigating the Cumulative Life Cycle Greenhouse Gas Emissions until 2050; Supplementary data table S1; Darmstadt, Germany. 2019. Available online: http://dx.doi.org/10.25534/tudatalib-144 (accessed on 21 January 2020).
  12. Blat Belmonte, B.; Esser, A.; Weyand, S.; Franke, G. Meta-Analysis of Fuels—Identification of the Optimal Passenger Car Vehicle Fleet Transition for Mitigating the Cumulative Life Cycle Greenhouse Gas Emissions until 2050; Supplementary data table S2; Darmstadt, Germany. 2019. Available online: http://dx.doi.org/10.25534/tudatalib-145 (accessed on 20 January 2020).
  13. Grote, K.-H.; Bender, B.; Göhlich, D. Dubbel; Springer: Berlin/Heidelberg, Germany, 2018. [Google Scholar]
  14. Helms, H.; Jöhrens, J.; Hanusch, J.; Höpfner, U.; Lambrecht, U.; Pehnt, M. UMBRELA—Wissenschaftlicher Grundlagenbericht Gefördert Durch das Bundesministerium für Umwelt, Naturschutz und Reaktorsicherheit (BMU); Federal Ministry for the Environment, Nature Conservation and Nuclear Safety: Heidelberg, Germany, 2011; Available online: https://www.erneuerbar-mobil.de/sites/default/files/publications/abschlussbericht-umbrela_1.pdf (accessed on 20 January 2020).
  15. Granovskii, M.; Dincer, I.; Rosen, M.A. Life cycle assessment of hydrogen fuel cell and gasoline vehicles. Int. J. Hydrogen Energy 2006, 31, 337–352. [Google Scholar] [CrossRef]
  16. Bhandari, R.; Trudewind, C.A.; Zap, P. Life Cycle Assessment of Hydrogen Production Methods—A Review; Forschungszentrum Jülich, Institute of Energy and Climate Research—Systems Analysis and Technology Evaluation (IEK-STE): Jülich, Germany, 2012. [Google Scholar]
  17. Edwards, R.; Larivé, J.-F.; Rickeard, D.; Weindorf, W. Well-to-Tank Report Version 4.a—JEC Well-to-Wheels Analysis; European Commission Joint Research Centre, Institute for Energy: Ispra, Italy, 2014. [Google Scholar]
  18. International Renewable Energy Agency. Hydrogen from Renewable Power—Technology Outlook for the Energy Transition; International Renewable Energy Agency: Abu Dhabi, UAE, 2018. [Google Scholar]
  19. BDEW Bundesverband der Energie- und Wasserwirtschaft e.V. Gas Kann Grün: Die Potentiale von Biogas/Biomethan—Status Quo, Fakten und Entwicklung; BDEW: Berlin, Germany, 2019. [Google Scholar]
  20. Braune, M.; Grasemann, E.; Gröngröft, A.; Klemm, M.; Oehmichen, K.; Zech, K. Die Biokraftstoffproduktion in Deutschland—Stand der Technik und Optimierungsansätze; Deutsches Biomasseforschungszentrum, DBFZ-ReportNr. 22; Deutsches Biomasseforschungszentrum Gemeinnützige GmbH: Leipzig, Germany, 2016. [Google Scholar]
  21. Federal Ministry for Economic Affairs and Energy. Marktanalyse Windenergie an Land. Federal Ministry for Economic Affairs and Energy; Federal Ministry for Economic Affairs and Energy: Berlin, Germany, 2014. Available online: https://www.erneuerbare-energien.de/EE/Redaktion/DE/Downloads/bmwi_de/marktanalysen-photovoltaik-windenergie-an-land.pdf?__blob=publicationFile&v=4 (accessed on 20 January 2020).
  22. The Federal Government of Germany. Kommission “Wachstum, Strukturwandel und Beschäftigung”—Abschlussbericht; The Federal Government of Germany: Berlin, Germany, 2019. Available online: https://www.bmwi.de/Redaktion/DE/Downloads/A/abschlussbericht-kommission-wachstum-strukturwandel-und-beschaeftigung.pdf?__blob=publicationFile (accessed on 20 January 2020).
  23. German Federal Environment Agency. Genehmigte Oder im Genehmigungsverfahren Befindliche Kraftwerksprojekte in Deutschland; German Federal Environment Agency: Dessau-Roßlau, Germany, 2019; Available online: https://www.umweltbundesamt.de/daten/energie/konventionelle-kraftwerke-erneuerbare-energien#textpart-1 (accessed on 9 April 2019).
  24. Burger, B. Energy Charts; Fraunhofer-Institut für Solare Energiesysteme ISE: Freiburg, Germany, 2018. [Google Scholar]
  25. BDEW Bundesverband der Energie- und Wasserwirtschaft e.V. Erneuerbare Energien und das EEG: Zahlen, Fakten, Grafiken (2017)—Anlagen, Installierte Leistung, Stromerzeugung, Marktintegration der Erneuerbaren Energien, EEG-Auszahlungen und Regionale Verteilung der EEG-Anlagen; BDEW: Berlin, Germany, 2017; Available online: https://www.dieter-bouse.de/app/download/5810146463/BDEW_Erneuerbare+Energien+und+das+EEG+-+Zahlen%2C+Fakten+und+Grafiken+2017%2C+Foliensatz+Juli+2017.pdf (accessed on 20 January 2020).
  26. German Federal Environment Agency. Treibhausgasneutrales Deutschland im Jahr 2050; German Federal Environment Agency: Dessau-Roßlau, Germany, 2013; Available online: https://www.umweltbundesamt.de/sites/default/files/medien/376/publikationen/treibhausgasneutrales_deutschland_im_jahr_2050_langfassung.pdf (accessed on 20 January 2020).
  27. German Aerospace Center; IFNE. Langfristszenarien und Strategien für den Ausbau Erneuerbarer Energien in Deutschland—Leitszenario 2009; German Aerospace Center; IFNE: Berlin, Germany, 2009. [Google Scholar]
  28. Fritsche, U.; Leuchtner, J.; Matthes, F.C.; Rausch, L.; Simon, K.-H. Umweltanalyse von Energie-, Transport- und Stoffsystemen: Gesamt-Emissions-Modell Integrierter Systeme (GEMIS) Version 2.1—Erweiterter und Aktualisierter Endbericht; Institut für angewandte Ökologie e.V.: Freiburg, Germany, 1995. [Google Scholar]
  29. Wernet, G.; Bauer, C.; Steubing, B.; Reinhard, J.; Moreno-Ruiz, E.; Weidema, B. The ecoinvent database version 3 (part I): Overview and methodology. Int. J. Life Cycle Assess. 2016, 21, 1218–1230. [Google Scholar] [CrossRef]
  30. Federal Motor Transport Authority. Jahresbilanz des Fahrzeugbestandes am 1. Januar 2019. Federal Motor Transport Authority. 2019. Available online: https://www.kba.de/DE/Statistik/Fahrzeuge/Bestand/b_jahresbilanz.html (accessed on 16 April 2019).
  31. Federal Ministry of Transport and Digital Infrastructure; German Aerospace Center; DIW. Verkehr in Zahlen 2018/2019. 47. Jahrgang; Federal Ministry of Transport and Digital Infrastructure; German Aerospace Center; DIW: Berlin, Germany, 2018.
  32. Plötz, P.; Gnan, T.; Kühn, A.; Wietschel, M. Markthochlaufszenarien für Elektrofahrzeuge; Fraunhofer ISI: Karlsruhe, Germany, 2013. [Google Scholar]
  33. Federal Motor Transport Authority. Erneut Mehr Gesamtkilometer Bei Geringerer Jahresfahrleistung je Fahrzeug; Kraftverkehrs statistik; Federal Motor Transport Authority: Flensburg, Germany, 2018. [Google Scholar]
  34. Federal Motor Transport Authority. Verkehr in Kilometern der Deutschen Kraftfahrzeuge im Jahr 2017—Jahresfahrleistung in Millionen Kilometer Nach Fahrzeugarten und Fahrzeugalter im Jahr 2017; Federal Motor Transport Authority: Flensburg, Germany, 2019; Available online: https://www.kba.de/DE/Statistik/Kraftverkehr/VerkehrKilometer/verkehr_in_kilometern_node.html (accessed on 28 May 2019).
  35. André, M. The ARTEMIS European driving cycles for measuring car pollutant emissions. Sci. Total. Environ. 2004, 334, 73–84. [Google Scholar] [CrossRef] [PubMed]
  36. Federal Ministry of Transport and Digital Infrastructure; Institut für Angewandte Sozialwissenschaft GmbH infas; German Aerospace Center; IVT Research GmbH; infas 360 GmbH. Mobilität in Deutschland—Ergebnisbericht; Federal Ministry of Transport and Digital Infrastructure; Institut für angewandte Sozialwissenschaft GmbH infas; German Aerospace Center; IVT Research GmbH; infas 360 GmbH: Bonn, Germany, 2019.
  37. MathWorks. Fmincon. Available online: https://www.mathworks.com/help/optim/ug/fmincon.html (accessed on 27 September 2019).
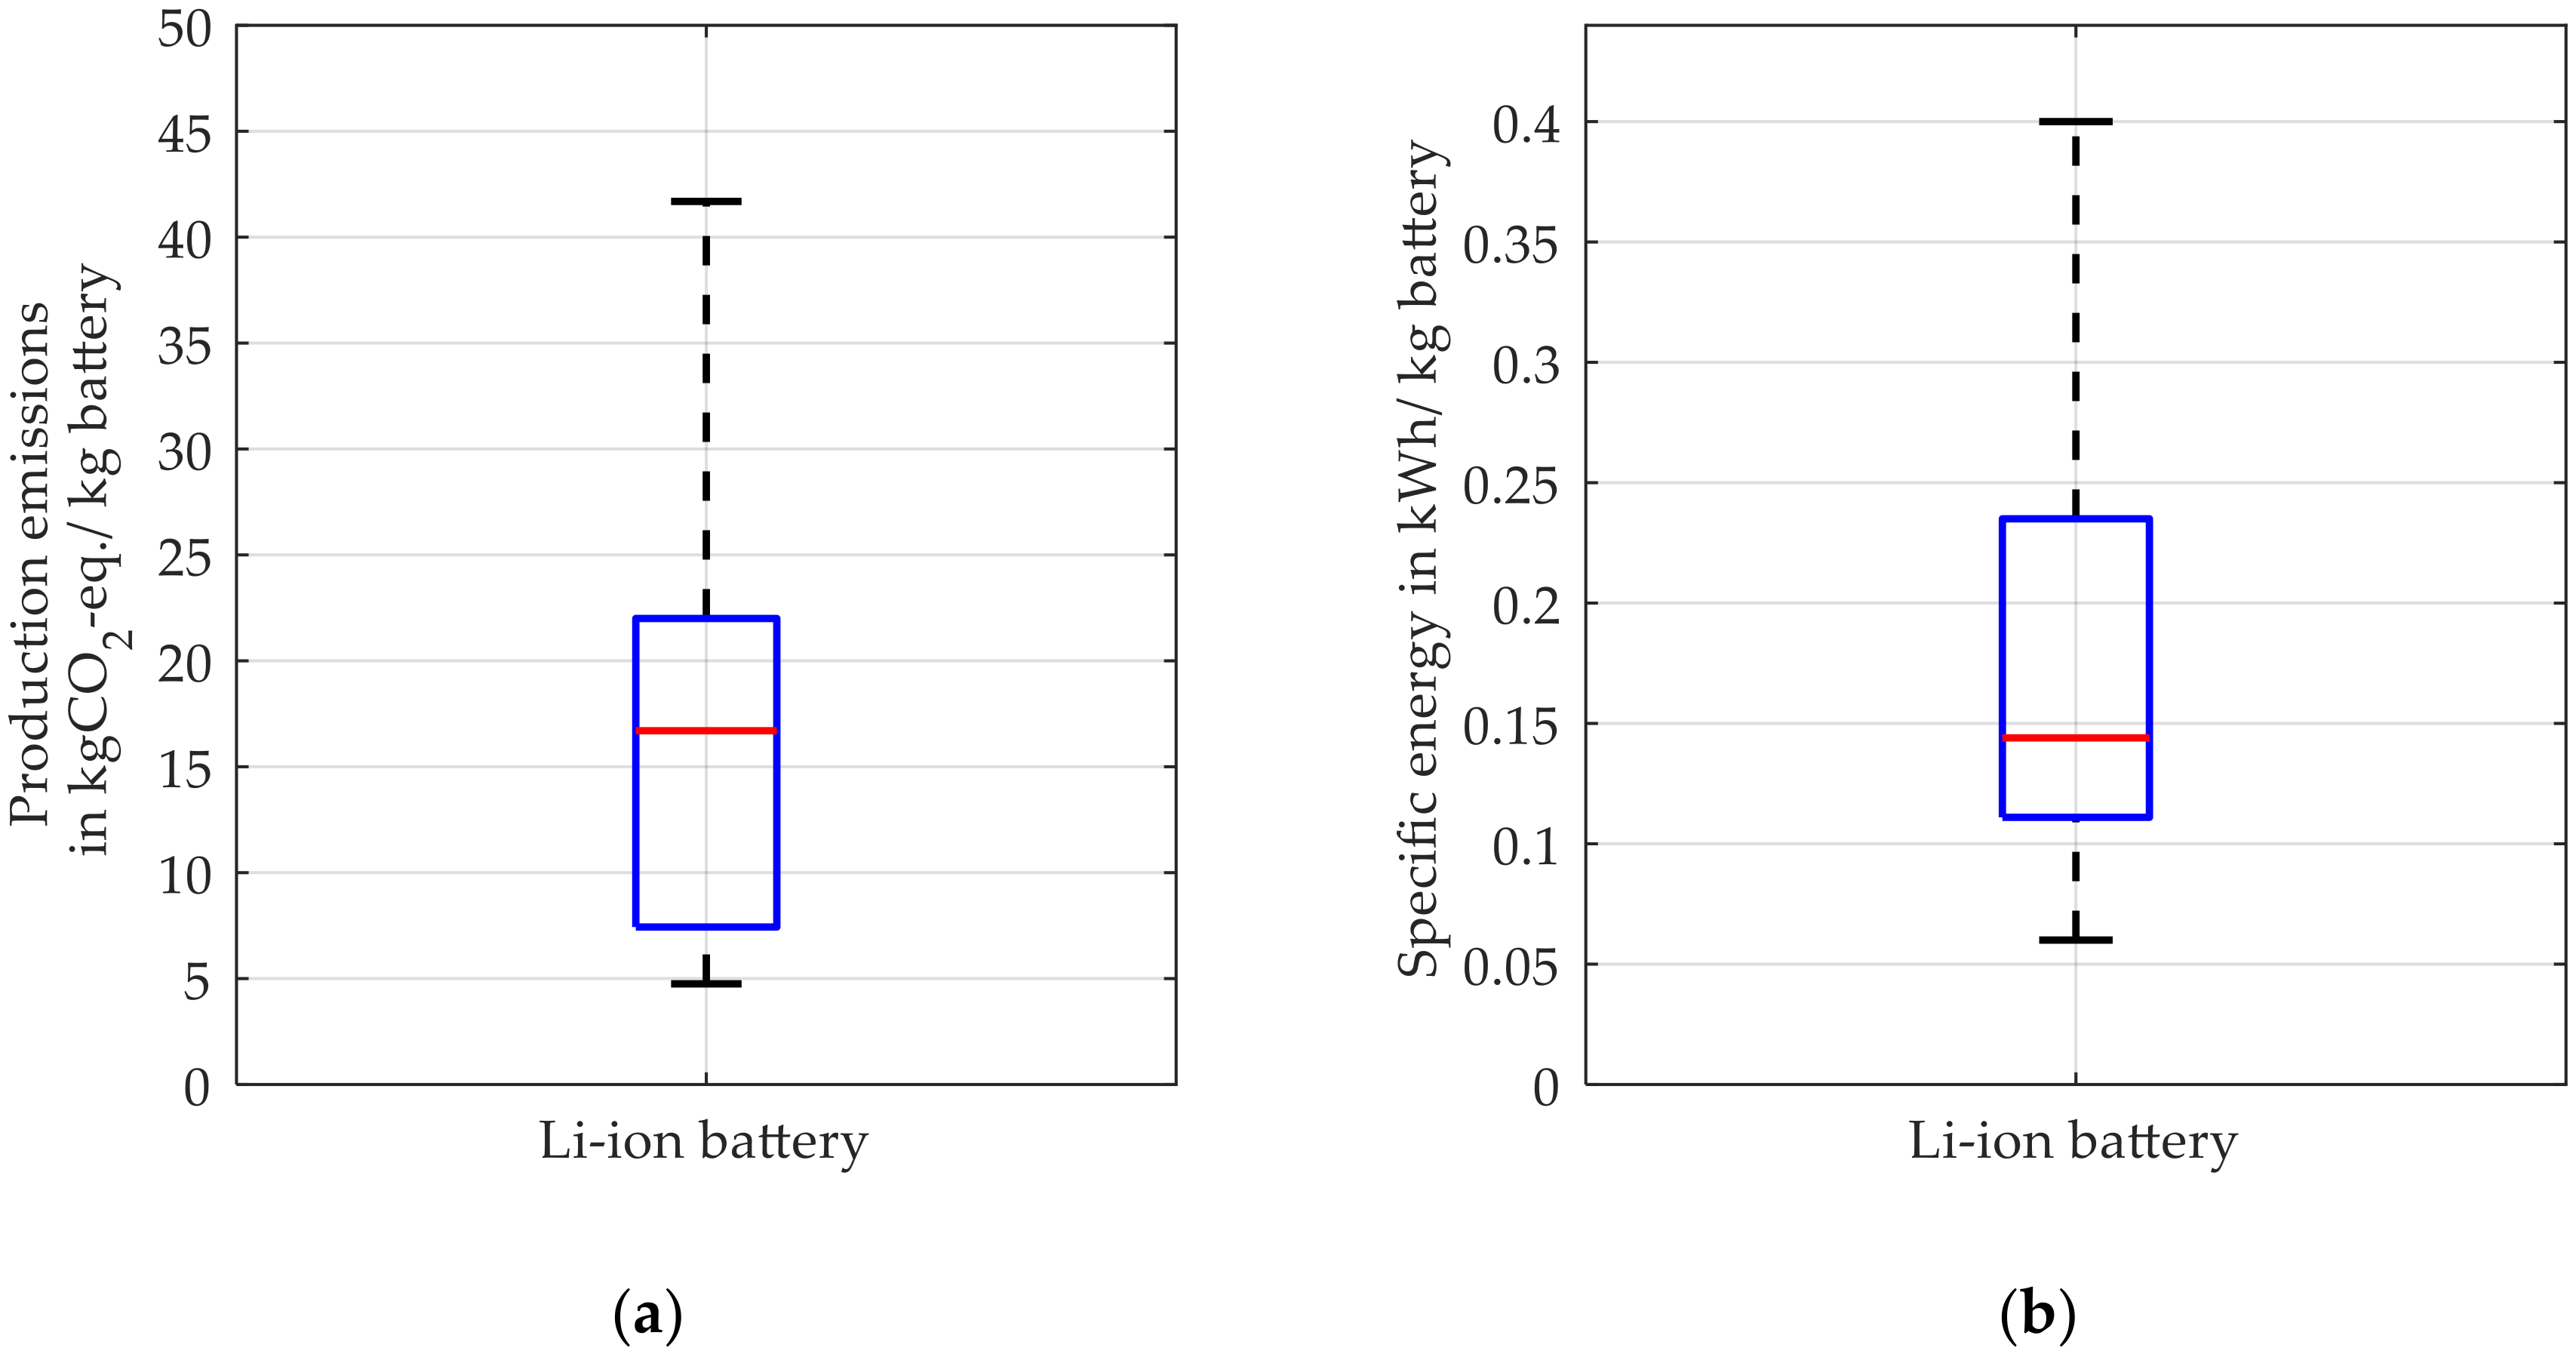
Figure 1. (a) Boxplot of the GWP100 values of battery production considered relevant for this work; (b) boxplot of the specific energy of li-ion batteries. The boxes include all values between the 25% quantile and the 75% quantile of the data. Minima and maxima are displayed with a short horizontal dash. Refer to Supplementary Data, Table S1 for more details [11].
Vehicles 02 00005 g001
Figure 2. Boxplots of the data points regarding the lower heating values of all fuels considered. Refer to Supplementary Data, Table S2 for more details [12].
Vehicles 02 00005 g002
Figure 3. Boxplots of the data points regarding the fuel supply emissions. Refer to Supplementary Data, Table S2 for more details [12].
Vehicles 02 00005 g003
Figure 4. Boxplots of the data points regarding direct fuel emissions. Refer to Supplementary Data, Table S2 for more details [12].
Vehicles 02 00005 g004
Figure 5. Development of the installed capacity in the German energy sector divided by all energy sources [21,22,23]. Other includes energy sources like waste incineration, which only account for a negligible part of electricity production.
Vehicles 02 00005 g005
Figure 6. Load factors of German power plants in 2018 divided by energy source [25].
Vehicles 02 00005 g006
Figure 7. Electricity production in Germany matching electricity demand projected by the German Federal Environment Agency (UBA) divided by energy source and the resulting mean specific GHG emissions of the energy sector.
Vehicles 02 00005 g007
Figure 8. Scenarios of production emissions per capacity of li-ion batteries.
Vehicles 02 00005 g008
Figure 9. Development of installed capacity in the German energy sector (a) for the pessimistic scenario; (b) for the optimistic scenario. The neutral scenario is shown in Figure 5.
Vehicles 02 00005 g009
Figure 10. (a) Share of electrolysis in hydrogen production; (b) projected electrical consumption of electrolysis subject to efficiency increases.
Vehicles 02 00005 g010
Figure 11. Three scenarios of passenger-distance carried out by passenger car vehicles.
Vehicles 02 00005 g011
Figure 12. Probability density function of a vehicle reaching its end-of-life (EoL) and the resulting vehicle lifetime.
Vehicles 02 00005 g012
Figure 13. Annual driving distance of vehicles depending on their age.
Vehicles 02 00005 g013
Figure 14. Optimal vehicle fleet transition for the base scenario.
Vehicles 02 00005 g014
Figure 15. Life-cycle emissions of (a) the PHEV15-CNG; (b) the PHEV20-CNG; (c) the BEV20; (d) the BEV100; (e) the FCPHEV20; and (f) the ICEV-E10 for the base scenario fleet transition.
Vehicles 02 00005 g015
Figure 16. Electricity production for the base scenario including the additional electricity demand of the vehicle fleet.
Vehicles 02 00005 g016
Figure 17. Cumulative greenhouse gas emissions for the base scenario.
Vehicles 02 00005 g017
Figure 18. Optimal vehicle fleet transition for the worst-case scenario.
Vehicles 02 00005 g018
Figure 19. Optimal vehicle fleet transition for the best-case scenario.
Vehicles 02 00005 g019
Figure 20. Sensitivity-analysis of the cumulative GHG emission values of 81 optimization processes. The boxes include all values between the 25% quantile and the 75% quantile of the data. Minima and maxima are displayed with a short horizontal dash.
Vehicles 02 00005 g020
Figure 21. Sensitivity-analysis of battery, energy, and mobility trends on the vehicle fleet transition.
Vehicles 02 00005 g021
Table 1. Powertrain concepts considered for the identification of greenhouse gas (GHG)-optimal vehicle fleet transitions.
Powertrain ClassInternal Combustion Engines Vehicles (ICEV)Hybrid Electric Vehicles (HEV)Plug-In Hybrid Electric Vehicles (PHEV)Battery Electric Vehicles (BEV)Full Cell Electric Vehicles (FCEV)
Powertrain conceptsICEV-E10mHEV-E10PHEV10-E10BEV20FCHEV
ICEV-B7 PHEV15-E10BEV100FCPHEV20
ICEV-CNG PHEV20-E10
ICEV-LPG PHEV10-CNG
PHEV15-CNG
PHEV20-CNG
Table 2. Densities of liquefied fuels [2,13,14,15].
Fuel TypePetrolDieselBioethanolBiodieselLiquefied Petroleum Gas (LPG)
Density0.745 kg/L0.837 kg/L0.786 kg/L0.879 kg/L0.590 kg/L
Table 3. Emission factors of power plants in Germany divided by energy source [27,28,29].
Energy SourceEmission Factor in 2018 in gCO2-eq./kWh
Lignite944.23
Hard coal805.29
Oil651.94
Other 1520.00
Gas386.75
Solar93.19
Hydropower38.00
Biomass32.49
Nuclear22.37
Wind onshore9.62
Wind offshore5.10
1 Includes energy sources like waste incineration, which only account for a negligible part of electricity production.
Table 4. Production emissions of vehicle components excluding the battery.
Powertrain ConceptProduction Emissions (Without Battery) in kg CO2-eq.Powertrain ConceptProduction Emissions (Without Battery) in kg CO2-eq.
ICEV-E108130PHEV10-CNG9349
ICEV-B78171PHEV15-CNG9349
ICEV-CNG8130PHEV20-CNG9349
ICEV-LPG8130BEV208945 (8802) 1
mHEV E109410BEV1009247 (8941) 1
PHEV10-E109381FCHEV8957
PHEV15-E109381FCPHEV209195
PHEV20-E109381--
1 Values in parenthesis represent projected values in 2050.
Table 5. Distance travelled on each driving cycle and weighting of the driving cycles for each driving profile.
ARTEMIS-Driving CyclesDistance TravelledAll-Range ProfileShort-Range Profile
City cycle0–60 km29.3%39.6%
Rural cycle100 km44.7%60.4%
Highway cycle (150 km/h version)200 km26%-
Table 6. Fuel and electrical consumption values for all powertrain concepts in present day.
Powertrain ConceptShort Range Driving ProfileAll Range Driving Profile
Fuel Consumptionin
in kg/100 km
Electrical Consumptionin
in kWh/100 km
Fuel Consumptionin
in kg/100 km
Electrical Consumptionin
in kWh/100 km
ICEV-E104.8104.590
ICEV-B74.8604.460
ICEV-CNG4.2404.030
ICEV-LPG4.3604.150
mHEV E10303.350
PHEV10-E101.110.81.918.27
PHEV15-E100.2161.1912.4
PHEV20-E100.074517.40.93214.1
PHEV10-CNG1.0210.61.698.27
PHEV15-CNG0.2115.91.0512.4
PHEV20-CNG0.01317.40.81514.2
BEV20017.4 (16.6) 1--
BEV100023.4 (20.9) 1023.1 (20.4) 1
FCHEV0.87400.9350
FCPHEV20020.40.22716.2
1 Values in parenthesis represent projected consumption values in 2050.
Table 7. Life-cycle GHG emissions of the PHEV15-CNG, the PHEV20-CNG, the BEV20, the BEV100, and the FCPHEV20 in 2050 for the base scenario.
Powertrain ConceptPHEV15-CNGPHEV20-CNGBEV20BEV100FCPHEV20
Life-cycle GHG emissions in kg CO2-eq./km96.8392.4980.6092.7194.23