Article

Estimation of Probability of Pregnancy Based on Health Status and Estrus Intensity in Organic Dairy Cows

1
Department of Animal Sciences, University of Florida, Gainesville, FL 32611, USA
2
Department of Animal Sciences, Colorado State University, Fort Collins, CO 80521, USA
3
Department of Agricultural and Bioengineering, University of Florida, Gainesville, FL 32611, USA
*
Author to whom correspondence should be addressed.
Dairy 2026, 7(4), 58; https://doi.org/10.3390/dairy7040058 (registering DOI)
Submission received: 22 May 2026 / Revised: 13 July 2026 / Accepted: 17 July 2026 / Published: 1 August 2026
(This article belongs to the Section Dairy Farm System and Management)

Abstract

Our first objective was to quantify the associations between health-related events (HRE) before insemination, the relative increase in estrus intensity (REI) at insemination, and the probability of cow-level pregnancy per artificial insemination (P/AI) in organic Holstein dairy cows. Quantifying these associations may aid on-farm decision-making, such as setting the voluntary waiting period, choice of type of semen, do-not-breed and culling decisions. A second objective was to develop predictive models to estimate P/AI based on readily available data, and present common goodness-of-fit results also used in the machine learning community. All data were collected from a certified organic dairy farm in the western USA from 2019 to 2021. Health-related and reproduction data were obtained through Dairy Records Management Systems (DRMS; Raleigh, NC, USA). Activity data were collected using pedometers (IceRobotics, Stirling, UK) mounted on the rear legs. The REI, defined as walking steps per hour before insemination divided by the cow’s baseline steps per hour, was available for 17,238 inseminations from 4759 cows. The REI was categorized as ≤200%, >200–400%, >400–600%, or >600%. The HRE were available for 65,684 inseminations from 13,365 cows. The HRE were categorized as mastitis, metabolic disease (i.e., hypocalcemia, ketosis, displaced abomasum, digestive problems), reproductive disease (i.e, metritis, endometritis, pyometra, retained fetal membranes), lameness, 2 different diseases, ≥3 different diseases, or as healthy (none of these diseases prior to insemination). Combinations (COMBO) between REI categories and 0, 1, or ≥2 HRE were also created. Data were split into training and test sets. The training data were used to fit three logistic regression models that included either HRE, or REI, or COMBO. Each of the three models also included the covariates of 3-mo herd-average P/AI prior to insemination, days in milk, and the fixed effects of parity, insemination season, days after the previous insemination or days to 1st insemination. A random effect accounted for repeated inseminations within cow. Parameter estimates, odds ratios, and the estimated marginal means of the estimated P/AI of the fixed effects were obtained from the logistic regression models. The models’ estimates were applied to the test datasets, and discrimination and calibration statistics were calculated to judge goodness-of-fit. Unadjusted mean P/AI were 0.31, 0.28 and 0.28 for the HRE, REI and COMBO training datasets. For the HRE model, estimated P/AI ranged from 0.20 (≥3 different HRE) to 0.30 (healthy). The estimated P/AI associated with four REI categories were not different from 0.27 in the REI model. The estimated P/AI associated with the combinations of HRE and REI in the COMBO model varied from 0.18 after ≥2 HRE and >200–400% REI, to 0.30 when inseminations were in healthy cows with REI >600%. Inseminations in older cows, in the spring, and outside 18–24 d after the previous insemination were also associated with lower estimated P/AI. The area underneath the Receiver Operating Characteristic curve ranged from 0.57 (COMBO) to 0.60 (HRE) for the test data, indicating fair discrimination ability of the models. Calibration plots showed that the prediction models produced unbiased predicted P/AI. In conclusion, the results showed no conclusive evidence of greater estimated P/AI related to greater REI as a measure of estrus activity. More HRE were associated with lower estimated P/AI. Combinations of low REI and more HRE were associated with notably decreased estimated P/AI. The logistic regression models produced unbiased predicted P/AI. We found no evidence that the strength of the relationship between REI and P/AI depended on the HRE category. The applications of the results are as follows. First, these predictive models may help inform insemination decisions in organic dairy cows, although further external validation is recommended, and the discriminatory performance is weak. Second, a variety of goodness-of-fit statistics were calculated to allow comparisons of the current logistic regression analyses with future analyses made by other machine learning techniques.

1. Introduction

Many studies have documented associations between cows’ physiological status, environment, genetics, and management factors and their reproductive outcomes (briefly reviewed in Shahinfar et al. [1] and Hempstalk et al. [2], for example). Quantified associations between health-related events (HRE), relative estrus intensity (REI), and probability of pregnancy per artificial insemination (P/AI) can aid in decision-making of insemination decisions for individual or groups of cows. Examples where predicted P/AI may be useful are the choice of the voluntary waiting period, hormonal intervention, type of semen to use, do-not-breed decisions, and removal of cows [1,2,3,4]. Recently, individual predictions of P/AI have been a component of targeted reproductive management which aims to improve the reproductive efficiency of (non-organic) dairy cows by applying customized group-level management strategies based on hormonal therapy and expected reproductive performance [5,6]. However, tools to easily predict the individual P/AI including HRE and REI information in organic dairy cows are not readily available.
Greater activity may be an indicator of stronger estrus display and greater fertility. Cows with greater REI, measured for example in walking steps/h compared to a baseline, had greater P/AI [7,8,9]. A high correlation has been found between estradiol level and changes in cows’ behavior during the estrus period [10]. Automated activity monitors (AAM) have been used for decades to measure the activity of dairy cows, and they have become reliable tools for detecting estrus expression using immediate data [7,11]. In addition to low REI, many diseases (HRE) are associated with reduced fertility [12,13,14]. Multiple HRE may further reduce P/AI [15]. We have also seen greater emphasis on predictive models of P/AI for individual inseminations. This development has been fueled by an interest in precision dairy management and an increase in the volume and variety of data collected that may be associated with P/AI, such as data from AAM, genomic testing and cameras [16,17].
Organic dairy production is bound by strict regulations [18]. For example, organic dairy production requires that dairy cows graze not less than 120 days per calendar year. Grazing may reduce estrus detection compared to confined housing [19]. The use of reproductive hormones to manage estrus and ovulation, and antimicrobials to treat reproductive disease, is not allowed [20,21]. In addition, organic dairy cows with reproductive failure may be inseminated more often than conventional cows because of their greater cost to replace for failure to conceive [22]. Grazing may also have positive effects on health, welfare, and stress reduction and therefore be beneficial to reproductive efficiency. Collectively, however, lower P/AI may be expected in some organic dairy herds than in conventional dairy herds because the technological limitations outweigh the possible fertility advantages of the organic dairy production system.
Machine learning methods other than the more traditional logistic regression have been employed because they can easily handle heterogenous data (see for example Shahinfar et al. [1], Fenlon et al. [23], and Barden et al. [4]). While predictions of P/AI may or may not be more accurate with newer machine learning methods, these methods are often not easy to deploy because they cannot be recreated from only the published study. However, parameter estimates of logistic regression can be published and are easy to incorporate in decision support software. Attention must be paid to the proper vetting of prediction models, including application of discrimination and calibration methods [24,25] as is common in the machine learning literature. This has not been common practice for prediction models of P/AI for dairy cattle, which has made comparisons of various prediction models wanting.
To our knowledge, there are no other studies evaluating the relationship between REI, HRE, and their combination and P/AI in organic dairy cows. Therefore, the first objective of this study was to explore associations between REI, HRE, and their combinations, and P/AI in organic certified dairy cows. Two other objectives were to create and report easily deployable equations for prediction of P/AI and to report discrimination and calibration statistics for the prediction models that are also used in the machine learning literature such that results can be easier compared across prediction methods.
We hypothesized that healthy cows would have greater P/AI than cows with at least one HRE. Moreover, cows with a high REI would have greater P/AI than those with a low REI. We also expected an additive effect of HRE and REI, where healthy cows with a high REI would have markedly greater P/AI than cows with at least one HRE and a low REI.

2. Materials and Methods

2.1. Animals and Housing

This observational retrospective cross-sectional study used insemination, health and activity data collected from 2019 to 2021 from 13,365 certified organic dairy cows located in Colorado, USA. All cows belonged to the same owner. Cows were milked twice daily and housed in free-stall barns with sand bedding when indoors and access to a patio for exercise. Alleys were cleaned once daily. The bedding was cleaned daily, and sand was added 3 times per week. During the winter, cows stayed 24 h per day in the free-stall barns.
A total mixed ration (TMR) was fed twice daily to meet or exceed the nutritional requirements for lactating Holstein cows producing 30 kg/d of milk. Nongrazing diets for lactating cows were based on corn silage, wheat silage, grain mix containing soybean, soy hulls, corn wheat, minerals and vitamins, sorghum silage, alfalfa hay, and grass hay. During grazing season, the diets included corn silage, wheat silage, grain mix containing soybean, soy hulls, corn, wheat, and minerals and vitamins, sorghum silage, alfalfa hay, or grass hay. During the grazing season (approximately April to October), cows were offered fresh TMR for approximately 4 h before being moved to pasture where they stayed for at least 8 h before returning for the second milking. Grazing provided approximately 35% of the daily dry matter intake. The grazing management included rotational grazing on various types of grass pastures. Water was always available ad libitum.
Rolling herd milk production was approximately 9000 kg per year. Individual cow milk yields were not available for many cows and were therefore not included in this study. We also had no access to data on body condition scores, body weights, calf birth weights, and other data that potentially might improve the estimation of P/AI.

2.2. Reproductive Management

Cows were inseminated throughout the year. Pregnancy per AI was lower in the summer due to heat stress, resulting in a slightly seasonal calving pattern with heavier calving in the winter. Artificial insemination was performed upon the AAM alerts or visual estrous detection. A list of cows eligible for insemination was generated every morning based on the alerts provided by the cloud-based CowAlert AAM system (IceRobotics, Stirling, UK, www.peacocktechnology.com/cowalert, accessed on 15 May 2025) software. Visual estrous detection was also performed by the farm staff every morning before the start of inseminations to ensure that cows that were in estrus but not found by the AAM system were also inseminated. Cows on the AAM alert list were inseminated regardless of visual estrus verification by the farm staff. Artificial insemination was performed after cows left the milking parlor using manual catch headgate chutes. Re-insemination was performed upon continued observation of estrous signs after the first insemination. Pregnancy confirmation was done by ultrasonography approximately 32 ± 3 days after insemination. Pregnancy was re-evaluated 67 ± 3 days after insemination.

2.3. Activity and Health-Event Related Data

Activity data were obtained using i-QUBE sensors (IceRobotics, Stirling, UK) worn on the cows’ rear legs to monitor each movement. Some cows received activity sensors starting in 2018, but not all cows wore sensors when the data for this study were collected. Activity data were sent wirelessly to the CowAlert software at every milking. Activity data produced by the sensor included motion index, number of steps, standing time, lying time, standing change, transitions down, and transitions up. The motion index was calculated by a proprietary, undisclosed algorithm. These data were reported per 15 min for each cow, including start and ending times. For our study, we used only the number of steps. We counted the number of steps per hour. Thus, every cow had 24 observations per day, unless observations were missing.
For analysis of each insemination, we included the steps/h for the first 6 h of the AI-day, and 192 h (8 days) before the AI-day. Thus, a total of 198 steps/h for the 198 h prior to 6:00 o’clock on AI-day were used. We assumed that 6:00 o’clock on AI-day was the most recent time (deadline) that activity data were available for calculation of the REI. Inseminations occurred in the morning after the 6:00 o’clock deadline. This way no activity data post insemination was used in our analysis.
Next, we calculated REI as [steps/h at AI-day/steps/h at baseline], expressed as a percentage, following Madureira et al. [26]. A REI > 100% indicated increased steps/h prior to AI. Steps/h at baseline represented the mean steps/h calculated from hours 31 to 198 (168 h = 7 d) prior to the 6:00 o’clock deadline. The most recent 30 h prior to the 6:00 o’clock deadline (6 h on AI-day and 24 h on the day before AI-day) were not used in the baseline calculation to avoid including possibly increased steps/h associated with estrus. Steps/h at AI-day was calculated as the highest 8 h moving mean in the most recent 30 h prior to the deadline. This calculation aimed to capture the greatest change in steps/h over a long enough period prior to insemination but was not necessarily the most recent 8 h prior to the 6:00 o’clock deadline. We categorized REI for every insemination in one of 4 categories as follows: ≤200%, >200–400%, >400–600%, and >600%.
Health-related events and inseminations were entered into DART software (DRMS, Raleigh, NC, USA, www.drms.org/Products-Services/Software/Dart, accessed on 15 May 2025) by farm staff and later obtained for our study from DRMS. The same health events that were less than 14 days apart from the previous same health event were omitted. After this filtering, the remaining health events were assumed to be new cases. For each insemination, we obtained the 10 most recent health events between calving and the day prior to AI-day. Often fewer than 10 events were present. We then classified health events as clinical mastitis, metabolic disease (i.e., hypocalcemia, ketosis, displaced abomasum, digestive problems), reproductive disease (i.e., metritis, endometritis, pyometra, retained fetal membranes), and lameness combined with injury. Diseases were diagnosed following a standardized physical exam protocol upon visual detection (e.g., mastitis after the milking procedure, lameness as the cows walked back to the pens from the milking parlor) or fresh cow health check. Cows were treated following the farm protocol using only medications allowed by the USDA-NOP [18].
Inseminations not having any health event in one of these 4 groups prior to AI-day were classified as healthy. If more than one class had at least 1 health event, such inseminations were classified as 2 or 3 and more HRE.

2.4. Records and Statistical Analysis

Data processing, filtering and statistical analyses were done with SAS 9.4 statistical software (SAS Institute, Cary, NC, USA). After initial filtering for errors and incomplete records, the dataset included 68,744 inseminations and their respective insemination outcomes (open or pregnant). The mean raw P/AI in this dataset was 0.31, calculated as number of inseminations diagnosed as pregnant. The median days in milk (DIM) at insemination was 105 d and the mean 125 d.
An important objective of this study was to create and report easily deployable equations. We therefore formulated three mixed logistic regression models using the GLIMMIX procedure of SAS where insemination was the event and pregnancy (conception) was the outcome (0/1). Prediction equations can be easily built from the published parameters alone. In all models, cow was used as a random effect to account for repeated inseminations within parity. Every model also included the continuous covariates of the natural logarithm of the DIM at insemination, the square of the natural logarithm of the DIM at insemination, and the uncorrected herd-average P/AI in the 3 mo before the month of the insemination. These covariates were known to be good predictors of P/AI.
In addition, every model included the categorical variables of parity (1, 2, 3, ≥4), insemination season (winter, spring, summer, fall) and interservice interval (days from calving to 1st insemination, or ≤17, 18–24, 25–35, 36–48, ≥49 d after previous insemination). These effects are referred to as the control model.
The first model added HRE as a categorical variable to the control model (categories: healthy (no diseases), or 1 case of lameness, mastitis, metabolic, or reproductive disease, or 2 HRE or ≥3 HRE). The second model added REI to the control model (categories: ≤200%, >200–400%, >400–600%, >600%). The third model added combinations of HRE and REI to the control model (the 4 REI categories combined with healthy, 1 HRE, or ≥2 HRE). Therefore, the equations used in the logistic regression models were:
L o g i t ( P / A I ) = μ + H P A I + L o g D I M + L o g D I M 2 + P A R I T Y + S E A S O N + I N T E R S E R V I C E I N T E R V A L + H R E + b c o w
L o g i t ( P / A I ) = μ + H P A I + L o g D I M + L o g D I M 2 + P A R I T Y + S E A S O N + I N T E R S E R V I C E I N T E R V A L + R E I + b c o w
L o g i t ( P / A I ) = μ + H P A I + L o g D I M + L o g D I M 2 + P A R I T Y + S E A S O N + I N T E R S E R V I C E I N T E R V A L + C O M B O + b c o w
where P/AI, DIM, HRE, REI, and COMBO were defined previously and HPAI is the previous 3-month herd P/AI, PARITY is parity, SEASON is insemination season, INTERSERVICEINTERVAL is interservice interval, and bcow is the random effect.
The number of observations used in each model is shown in Table 1. More HRE records were available than REI and COMBO records because initially not all cows were equipped with AAM sensors. Sensors were provided per pen when they became available. The REI and COMBO models included only cows with AAM sensors. The HRE model includes cows with and without sensors. We decided to use all the HRE records available to us to increase the power of the study. Therefore, not every cow was present in each of the three models.
The average cow in the study was approximately 3.7 years old. The number of inseminations per HRE category, REI category, or combined HRE and REI category by parity are in Supplementary Tables S1–S3. For each of the 3 models, the records were split randomly by cow to create a training set (70% of cows) and a test set (30% of cows). All records belonging to the same cow were therefore assigned to one or the other data set.
The logistic regression models were applied to the training data sets. The results obtained from the logistic models applied to the training sets included parameter estimates expressed on the log-odds scale, odds ratios and the estimated marginal means (EMM) of the estimated P/AI for the categorical variables. This approach allowed us to interpret the effects of REI, HRE and COMBO directly in terms of differences in estimated P/AI which aids interpretation. The parameter estimates were also applied to the test sets to obtain the predicted P/AI for cows that were not included in the training of the logistic regression models.

2.5. Model Evaluation

Discrimination statistics, such as sensitivity and specificity, measure the ability of the model to predict actual insemination outcomes. If the predicted P/AI > cutoff probability, then a pregnancy is predicted, otherwise failure of pregnancy is predicted. We used the standard cutoff probability of 0.5 and the cutoff probability equal to the mean P/AI in each relevant test set (0.27 to 0.31). The standard cutoff probability of 0.5 was added because is often used instead of the true probability of success. However, our study is concerned with the quality of the predicted P/AI, not classification of binary predictions and outcomes. Discrimination metrics cannot confirm that the predicted P/AI are without bias. Therefore, calibration tests were added to estimate accuracy and lack of bias of the predicted P/AI themselves [24,25]. All model evaluations were performed on the test sets.

2.5.1. Discrimination

Discrimination calculations were based on tabulating the number of true positive (TP), false positive (FP), true negative (TN), and false negative (FN) cases, where “true” and “false” indicate agreement between predicted and actual insemination outcomes. A “positive” prediction corresponds to pregnancy, whereas a “negative” prediction corresponds to failure of pregnancy. Predicted insemination outcomes follow from whether the model’s predicted P/AI is above or below the cutoff probability.
Calculated discrimination statistics were:
P o s i t i v e   p r e d i c t i v e   v a l u e = P r e c i s i o n = T P T P + F P ,
S e n s i t i v i t y = R e c a l l = T P T P + F N ,
S p e c i f i c i t y = T N F P + T N ,
F 1 - s c o r e = 2 × T P 2 × T P + F P + F N ,
N e g a t i v e   p r e d i c t i v e   v a l u e = T N T N + F N ,
A c c u r a c y = T P + T N T P + T N + F P + F N ,
M a t t h e w s   c o r r e l a t i o n   c o e f f i c i e n t = ( T P × T N F P × F N ) ( T P + F P ) × ( T P + F N ) × ( T N + F P ) × ( T N + F N )
The F1-score is the harmonic mean of precision and recall. These are all common statistics in the machine learning literature, or epidemiology literature, or both.
Precision, recall, specificity, accuracy, negative predictive value, positive predictive value and the F1-score vary between 0 and 1, with a value of 1 indicating excellent classification depending on no FP, FN or both. Some measures can be misleading in unbalanced data sets, such as the measures found in our study, for example, leading to high accuracy and specificity when the actual probability of success is much lower than 0.5. Matthews correlation coefficient is a balanced measure of discrimination success even when classes are imbalanced, as in our study, with a result > 0 indicating that the prediction is better than random and a value of 1 implies perfect prediction.
In addition, we calculated the area under the receiver operating characteristic curve (AUROC), which is equivalent to the concordance statistic. This curve plots the sensitivity vs. 1-specificity for cut-off probabilities varying from 0 to 1. In the context of this study, the AUROC is the probability that the model will predict a higher P/AI for a randomly chosen insemination that resulted in pregnancy than for a randomly chosen insemination that resulted in failure to get pregnant [23]. A result >0.5 indicates that the model is a better classifier than the population mean and a value of 1 implies perfect classification. The Youden’s J Index is the cut-off probability where the vertical distance between the curve and the diagonal non-discrimination line is the greatest.
Finally, we calculated:
B r i e r   s c o r e = 1 N i = 1 N ( f i o i ) 2 ,
where N is the number of inseminations, fi is the predicted P/AI and oi is the actual outcome of insemination (1 if pregnant, 0 if failure to get pregnant). A Brier score is compared to the baseline Brier score, calculated as:
B a s e l i n e   B r i e r   s c o r e = p ( 1 p ) 2 + ( 1 p ) ( 0 p ) 2 ,
where p is the population mean P/AI. Lower Brier scores than the baseline indicate better predictive performance of the model than the population mean. A Brier score of 0 means perfect prediction. The AUROC and Brier scores are independent of the choice of the cutoff-probability.

2.5.2. Calibration

Calibration was evaluated using the Hosmer–Lemeshow goodness-of-fit test, Brier score, the mean absolute calibration error percentage, and plots. A large, non-significant p-value of the Hosmer–Lemeshow chi-square statistic indicates good calibration. The lower the Brier score, the better the predictions are calibrated. The mean absolute calibration error percentage, calculated as:
M e a n   a b s o l u t e   c a l i b r a t i o n   e r r o r   p e r c e n t a g e = 1 N i = 1 N | m e a n   a c t u a l   P / A I i m e a n   p r e d i c t e d   P / A I i | m e a n   p r e d i c t e d   P / A I i
measures the calibration agreement between predicted and observed probabilities.
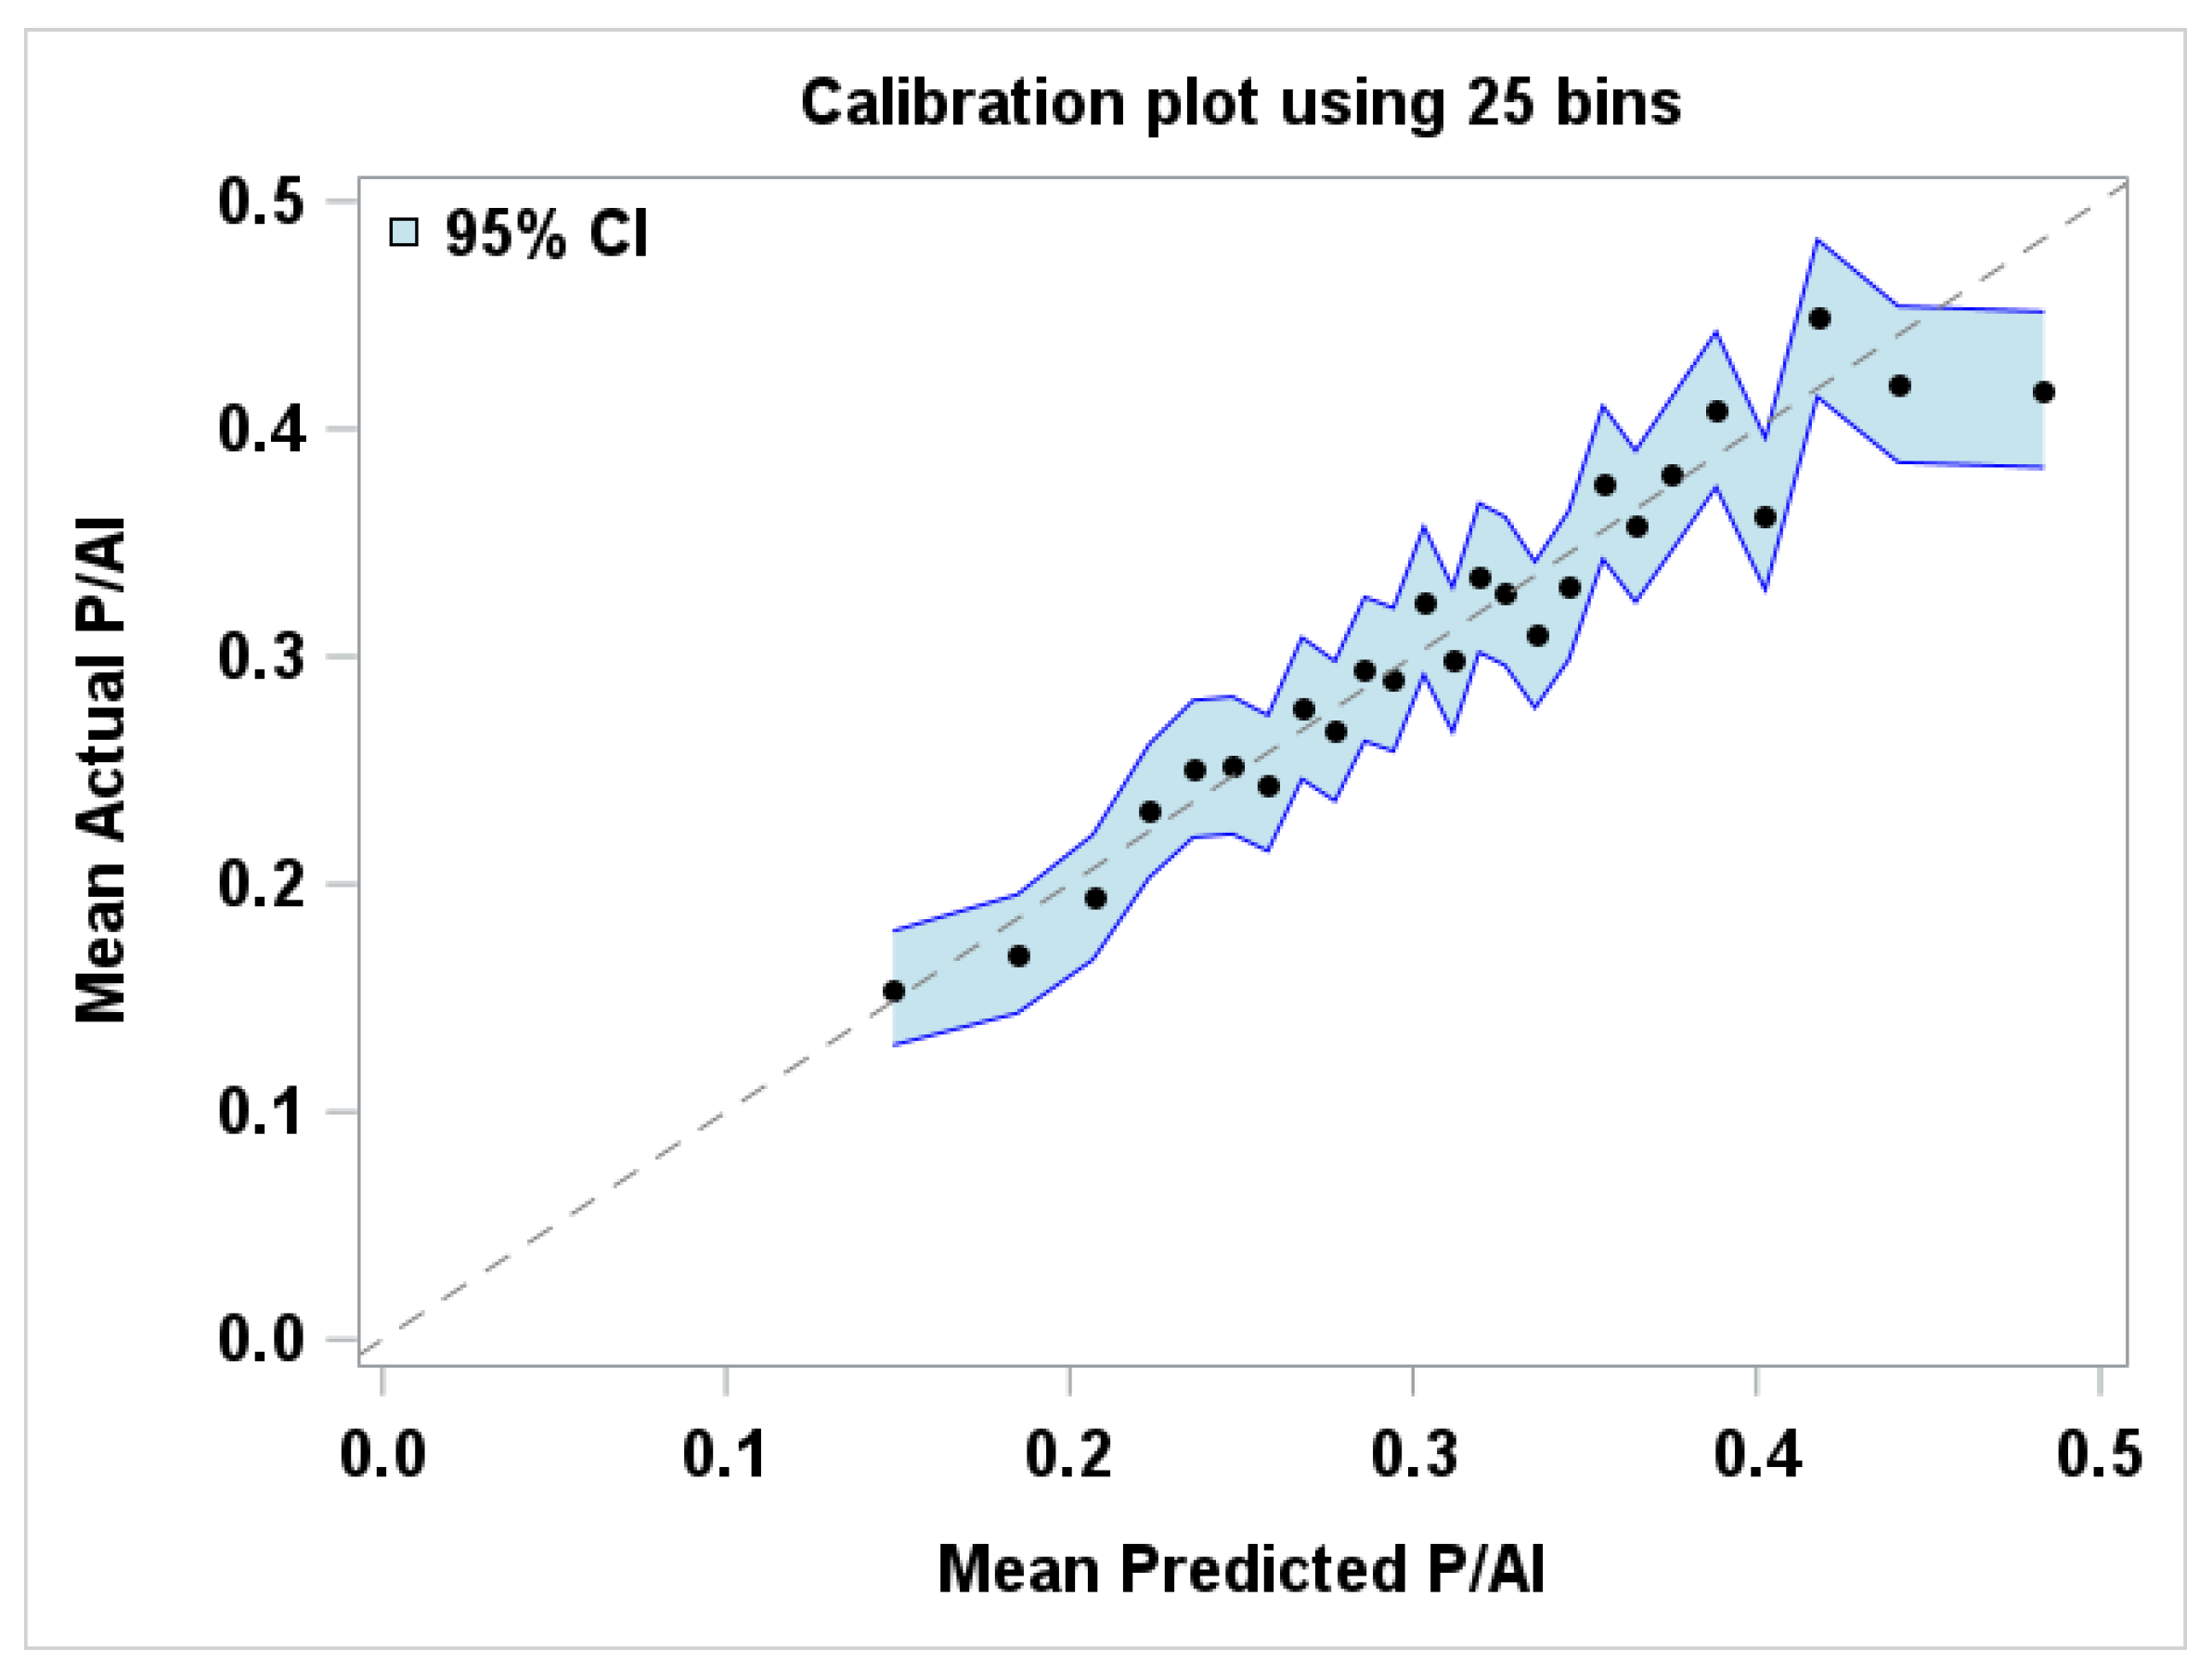
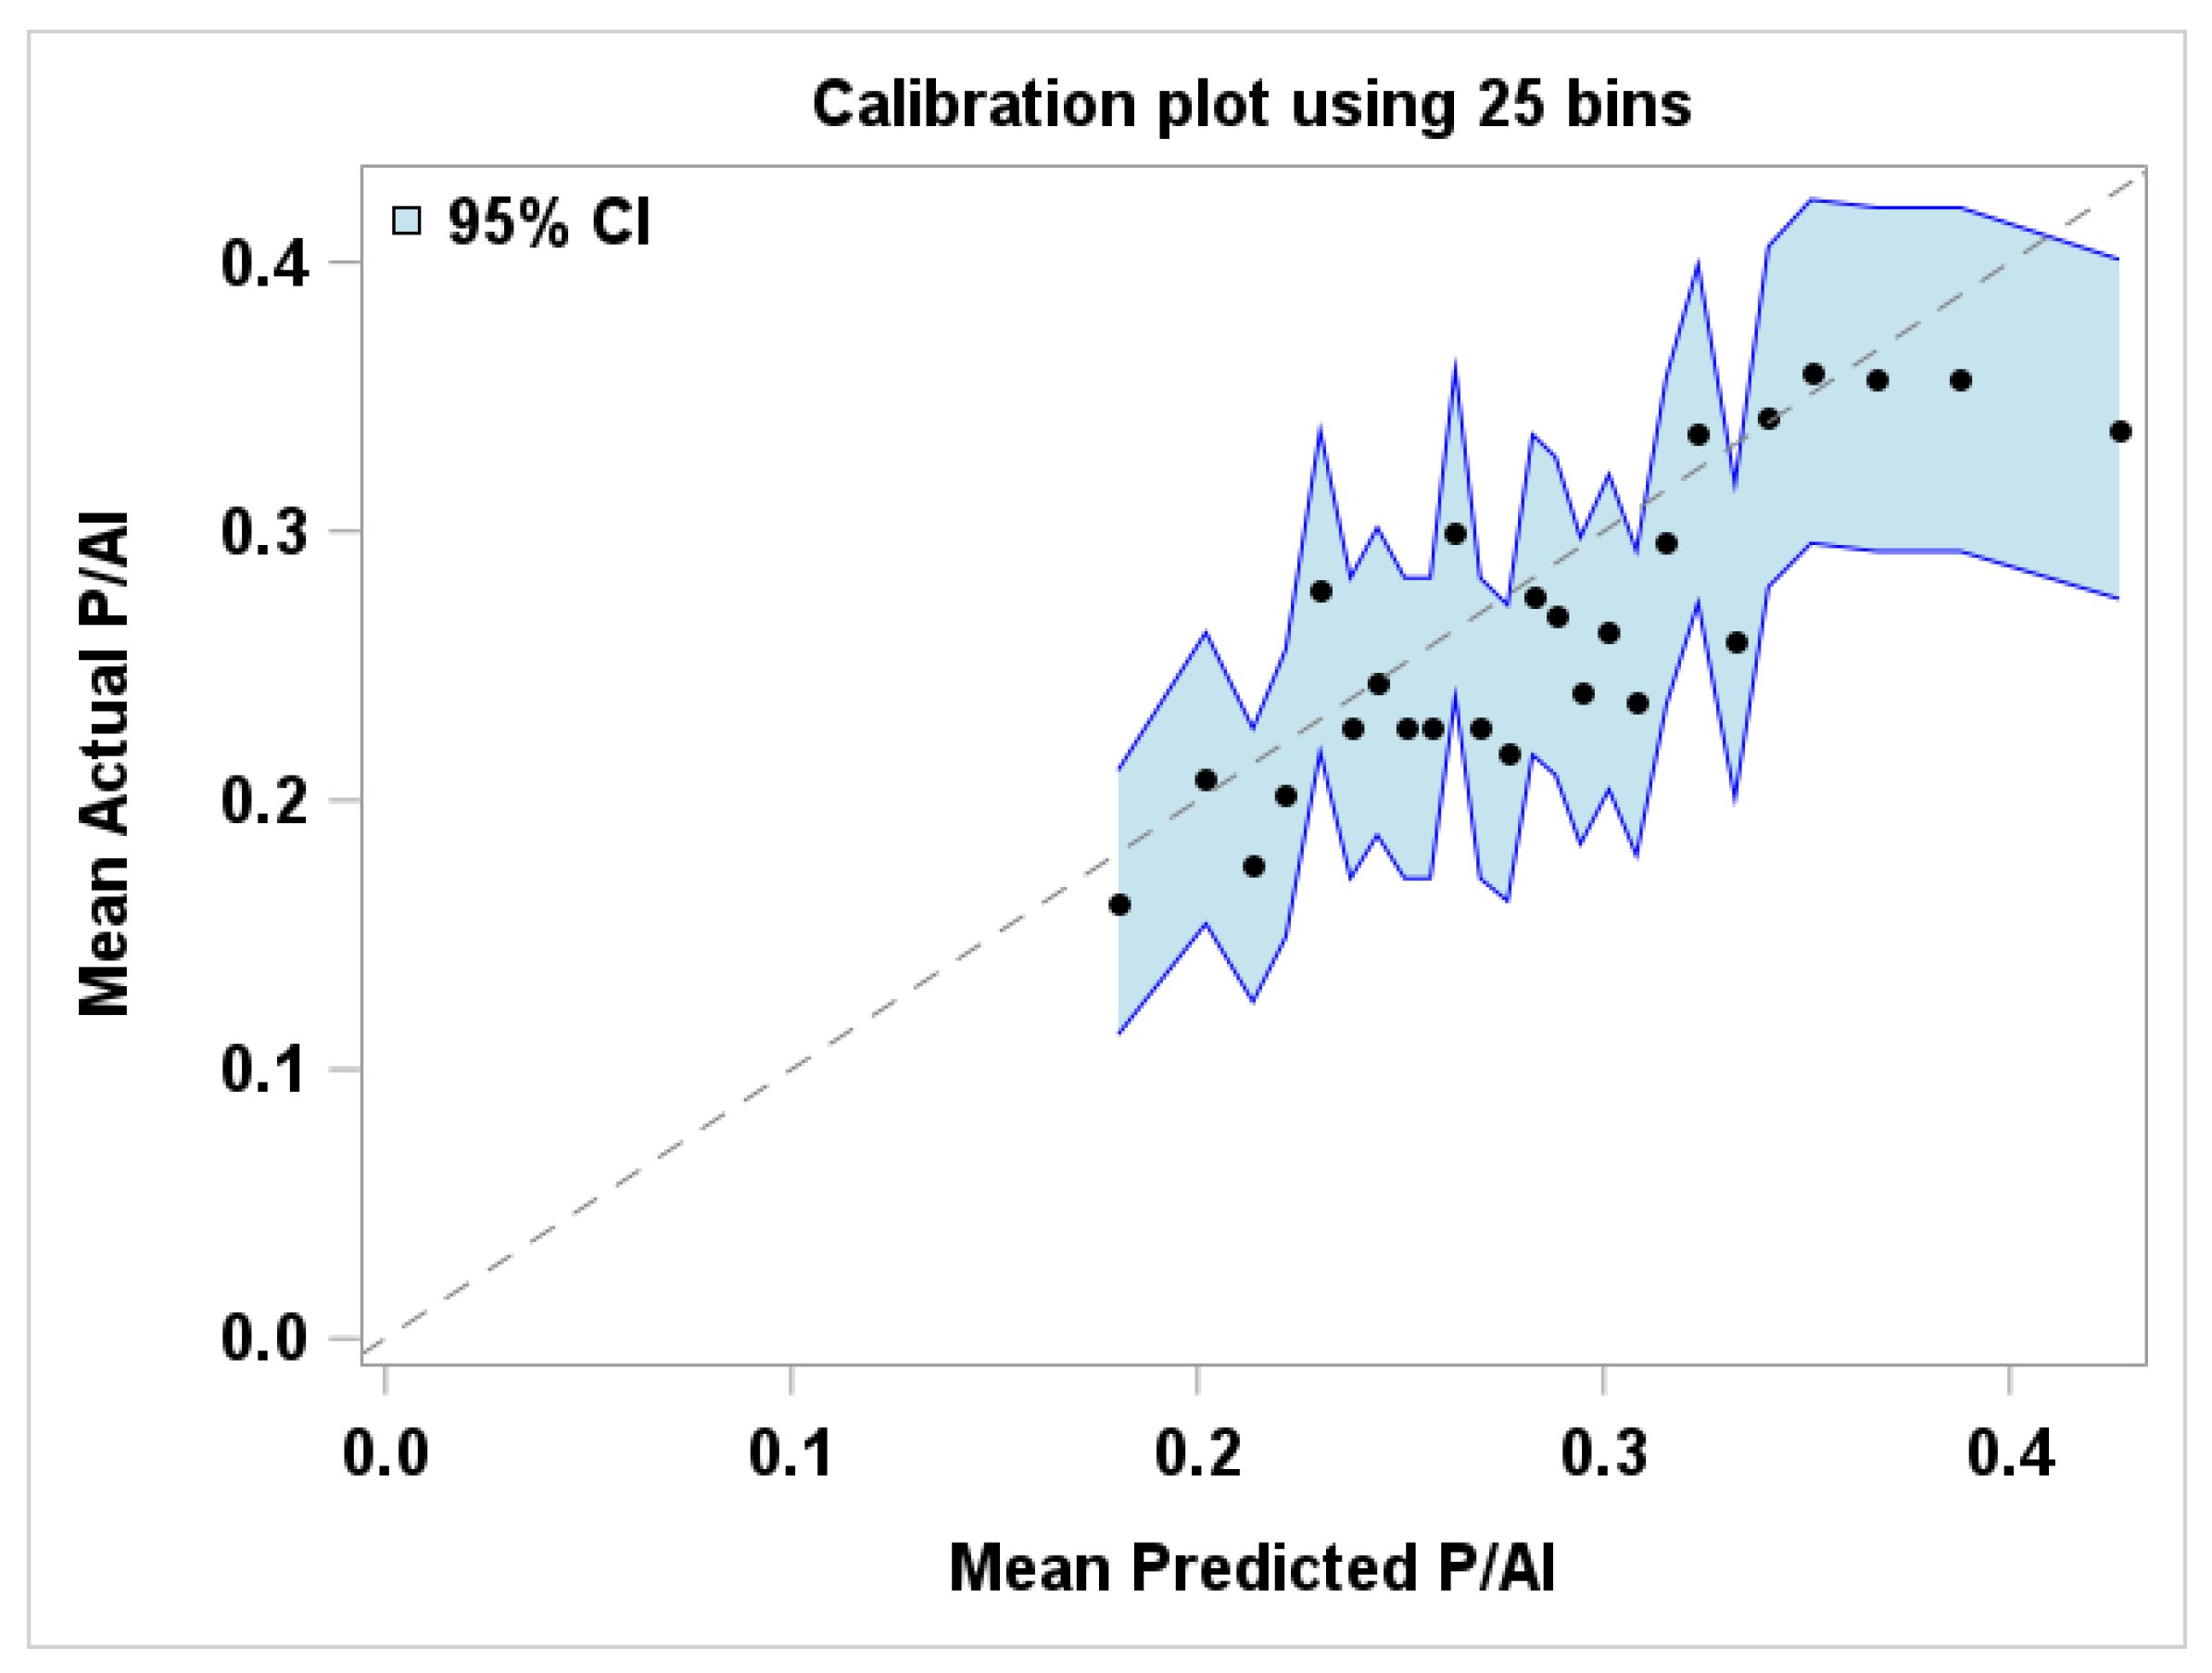
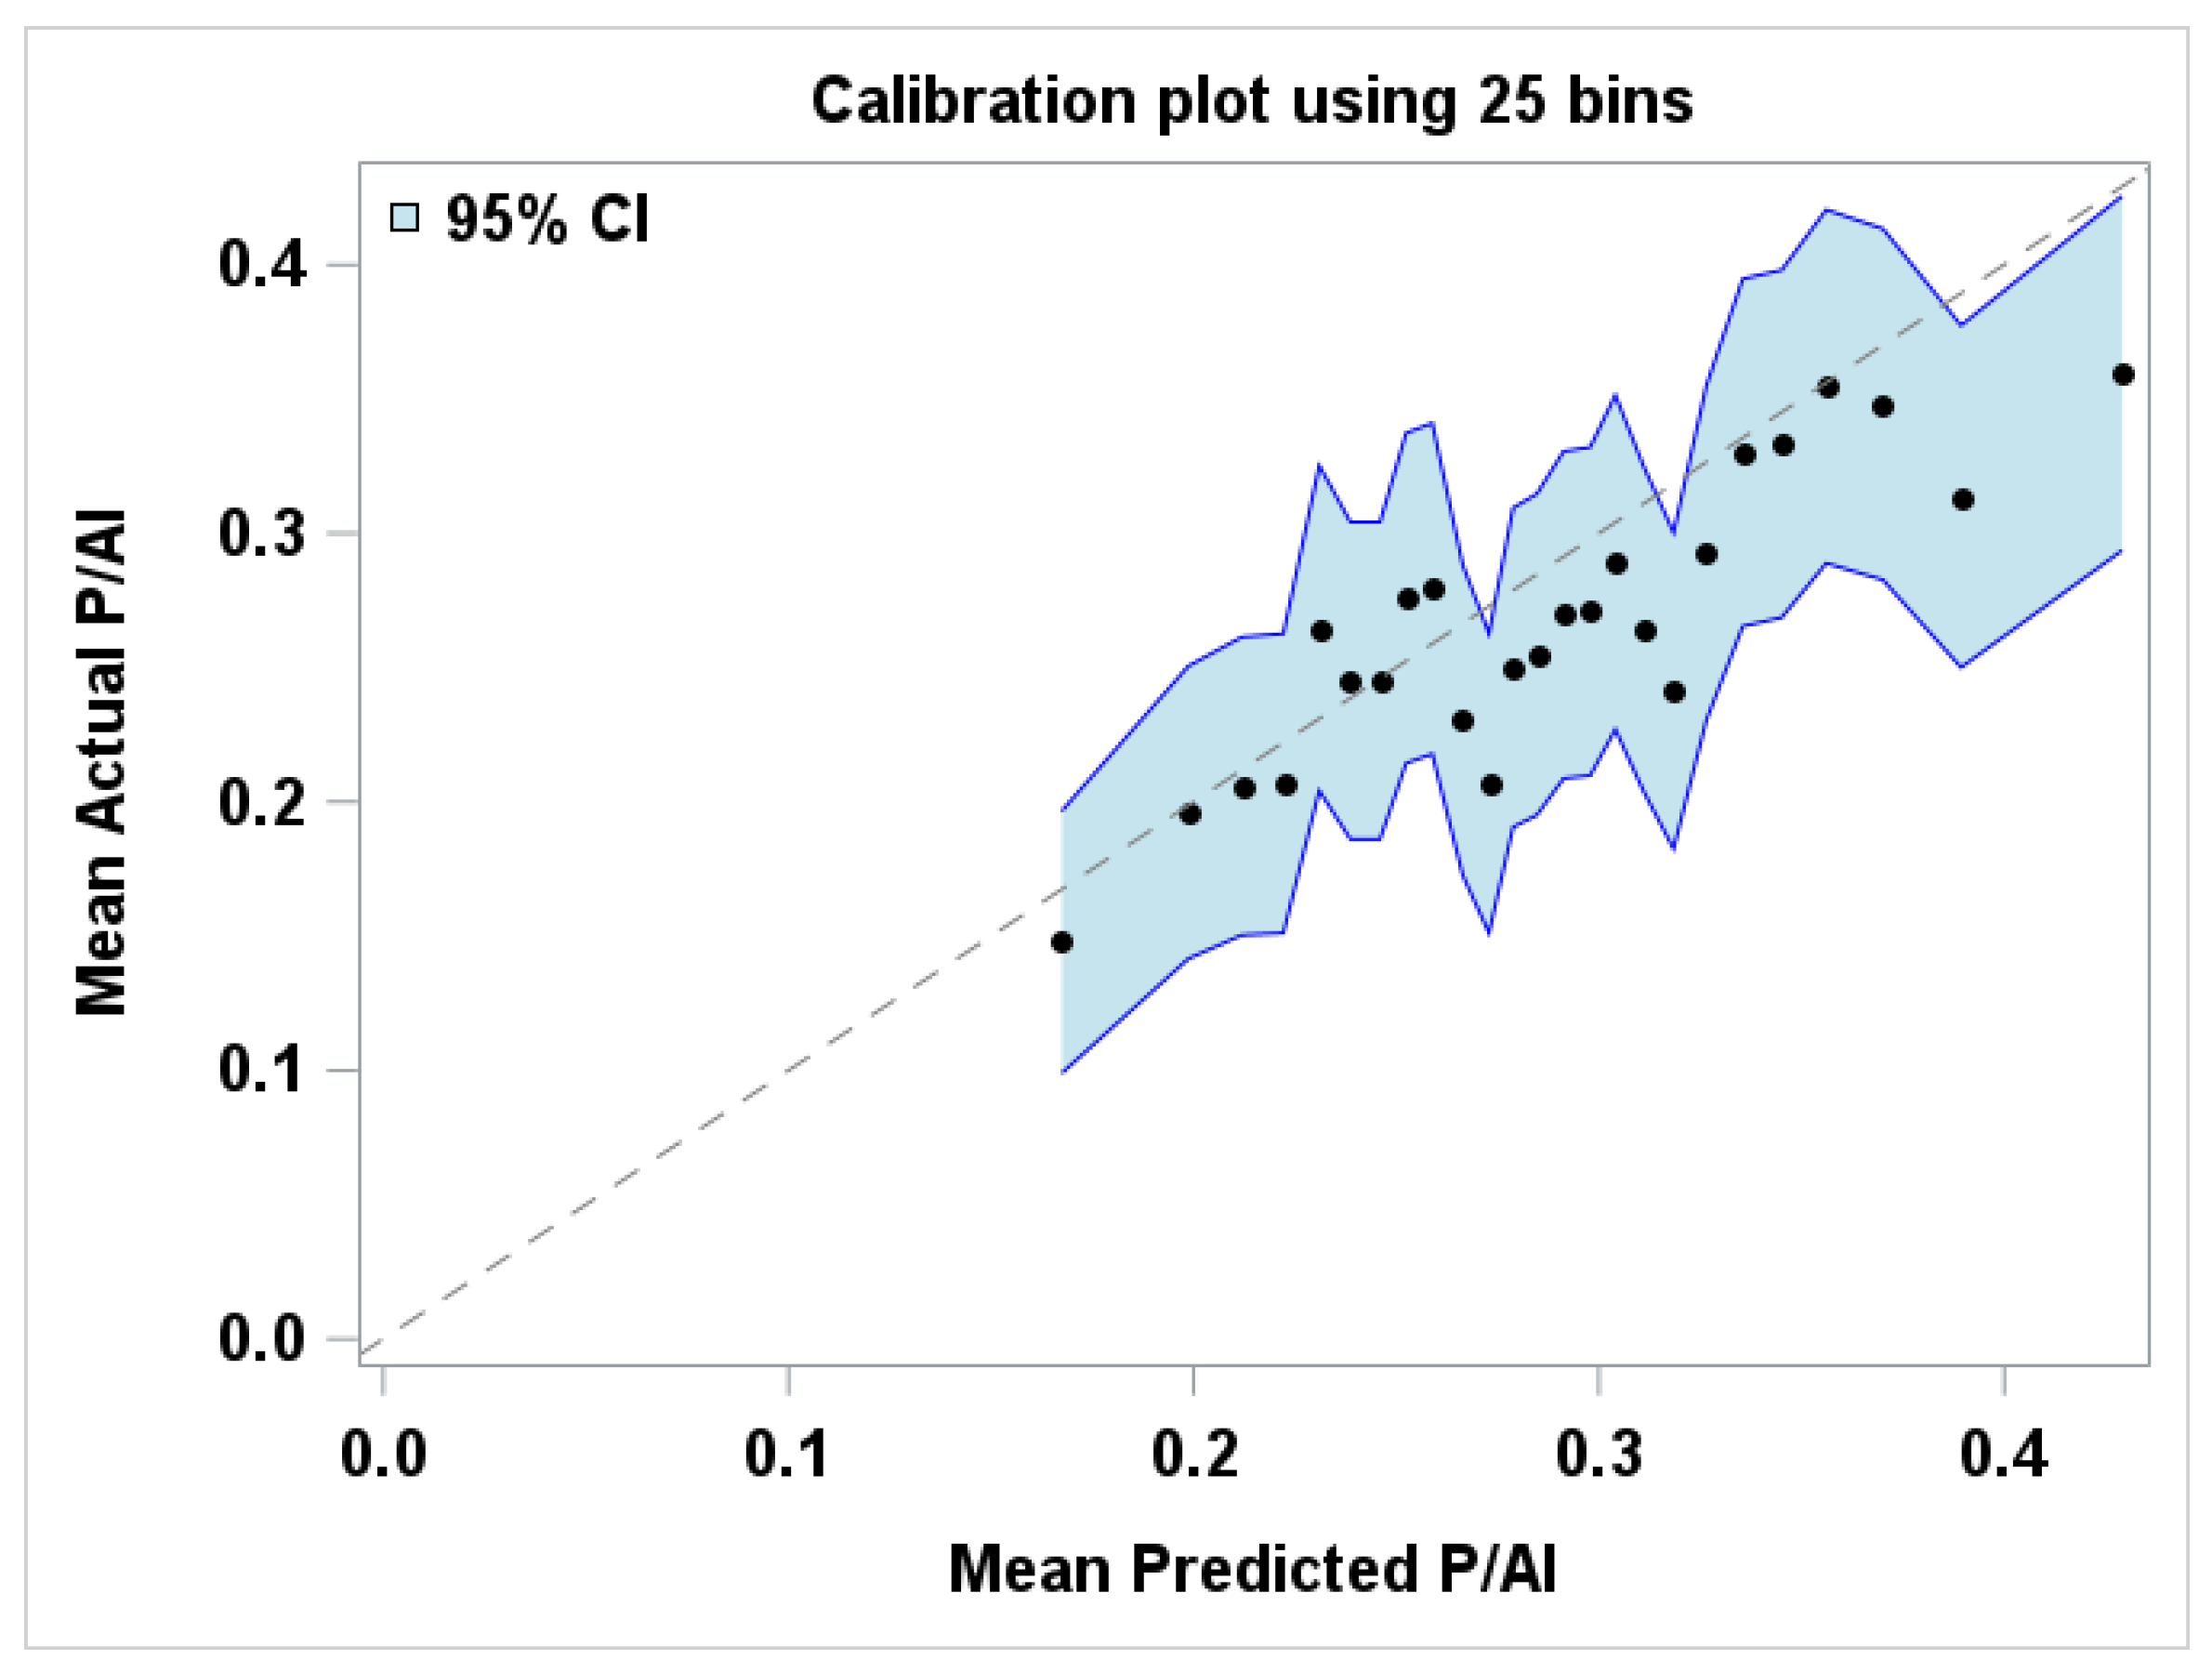
Calibration was also assessed visually with calibration plots for the 3 logistic regression models following Fenlon et al. [27]. A calibration plot was drawn by grouping the observations into 25 equi-interval bins based on the predicted P/AI and plotting the mean predicted P/AI against the actual proportion of insemination that resulted in a pregnancy within each bin. Points along the diagonal with 95% confidence intervals around the diagonal indicate good calibration.
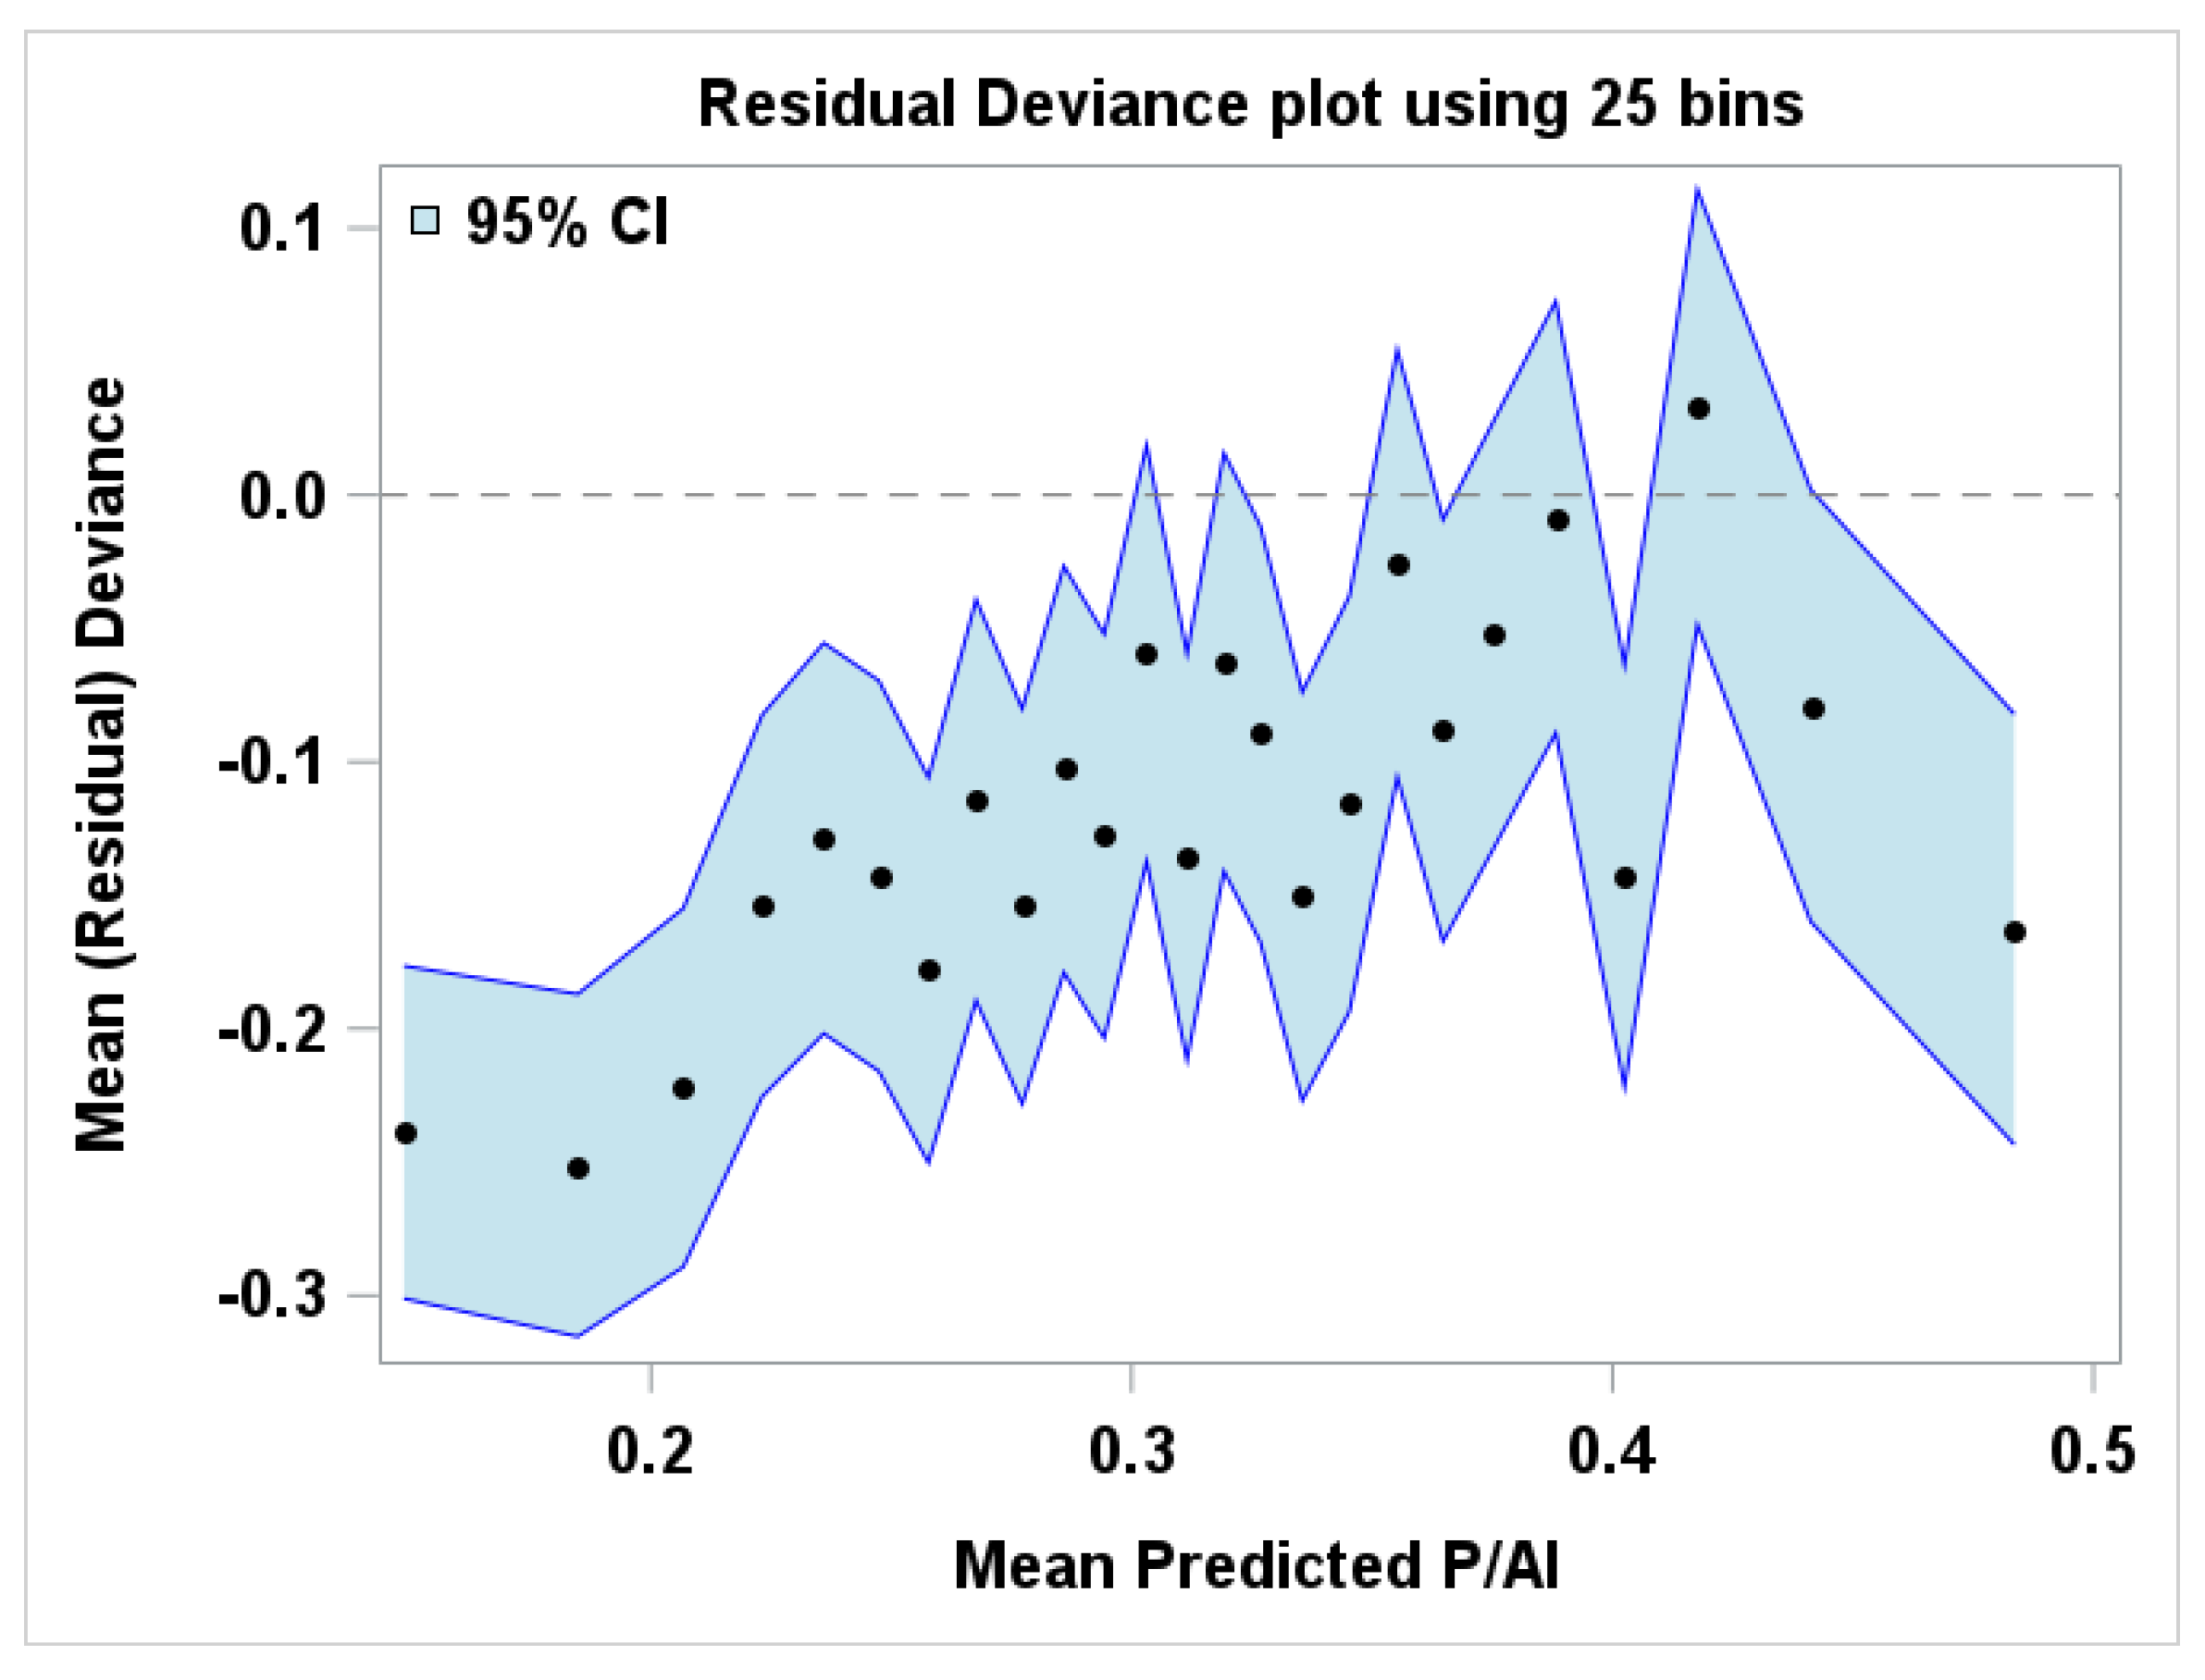
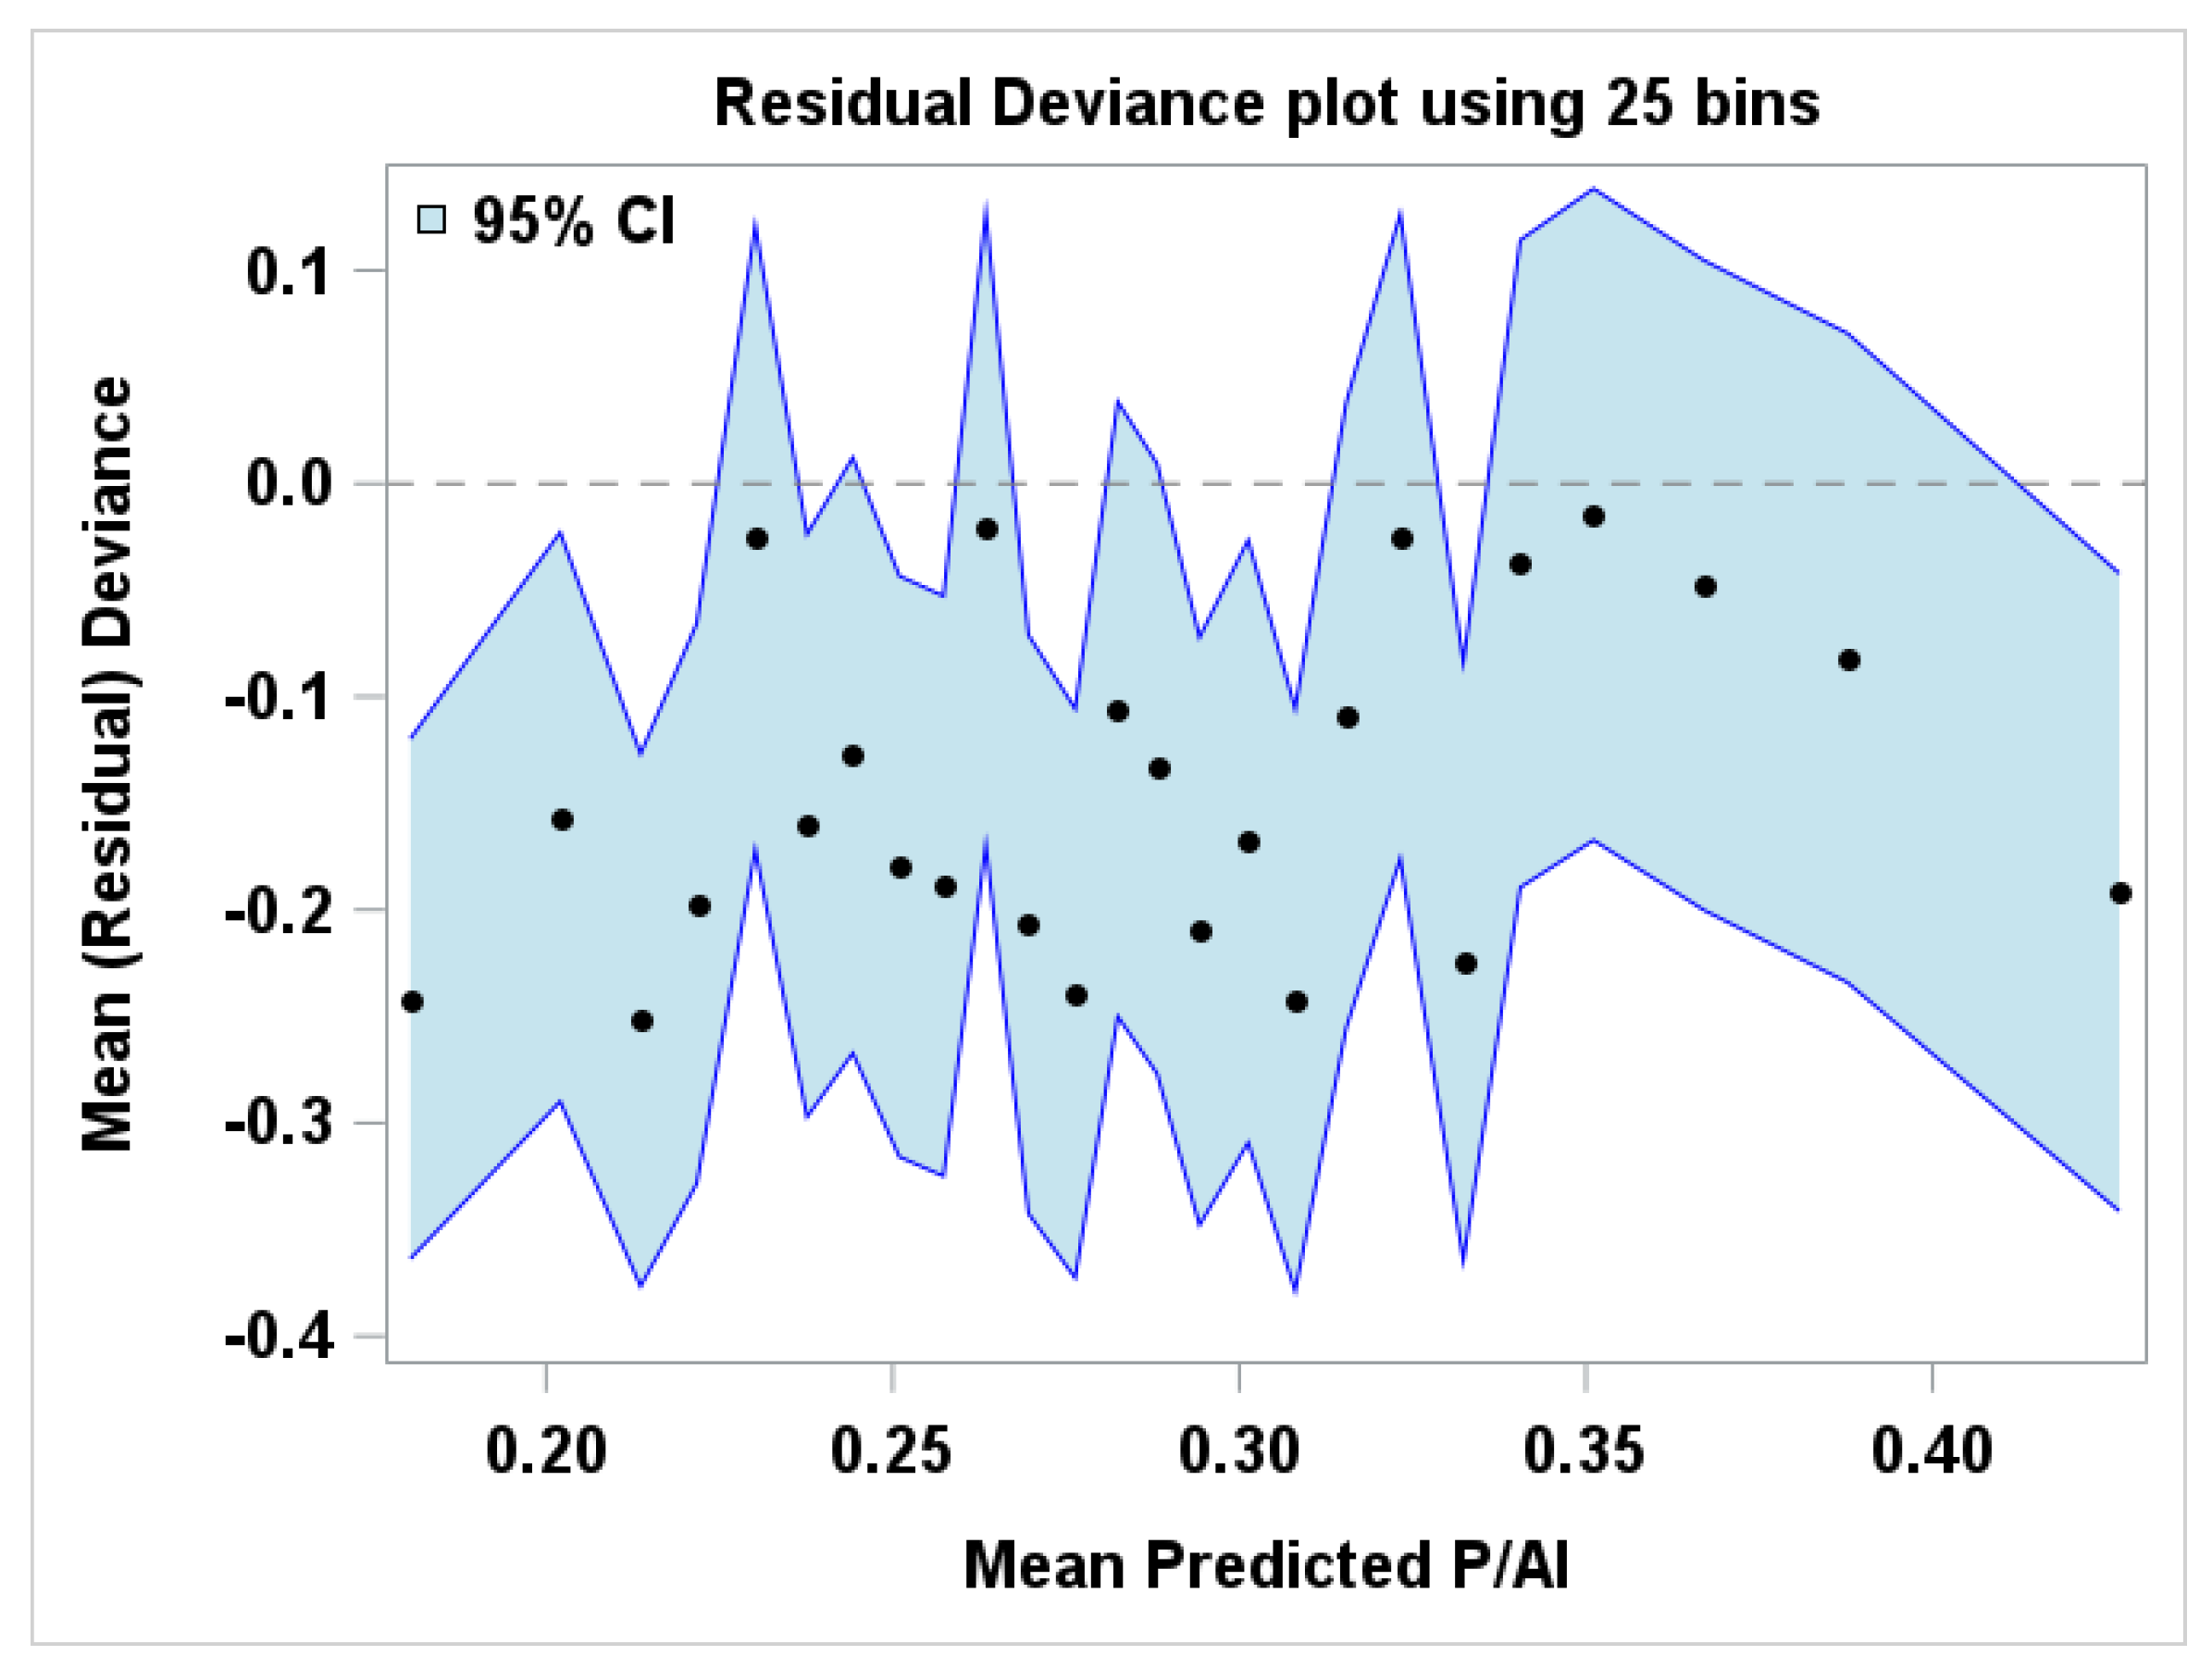
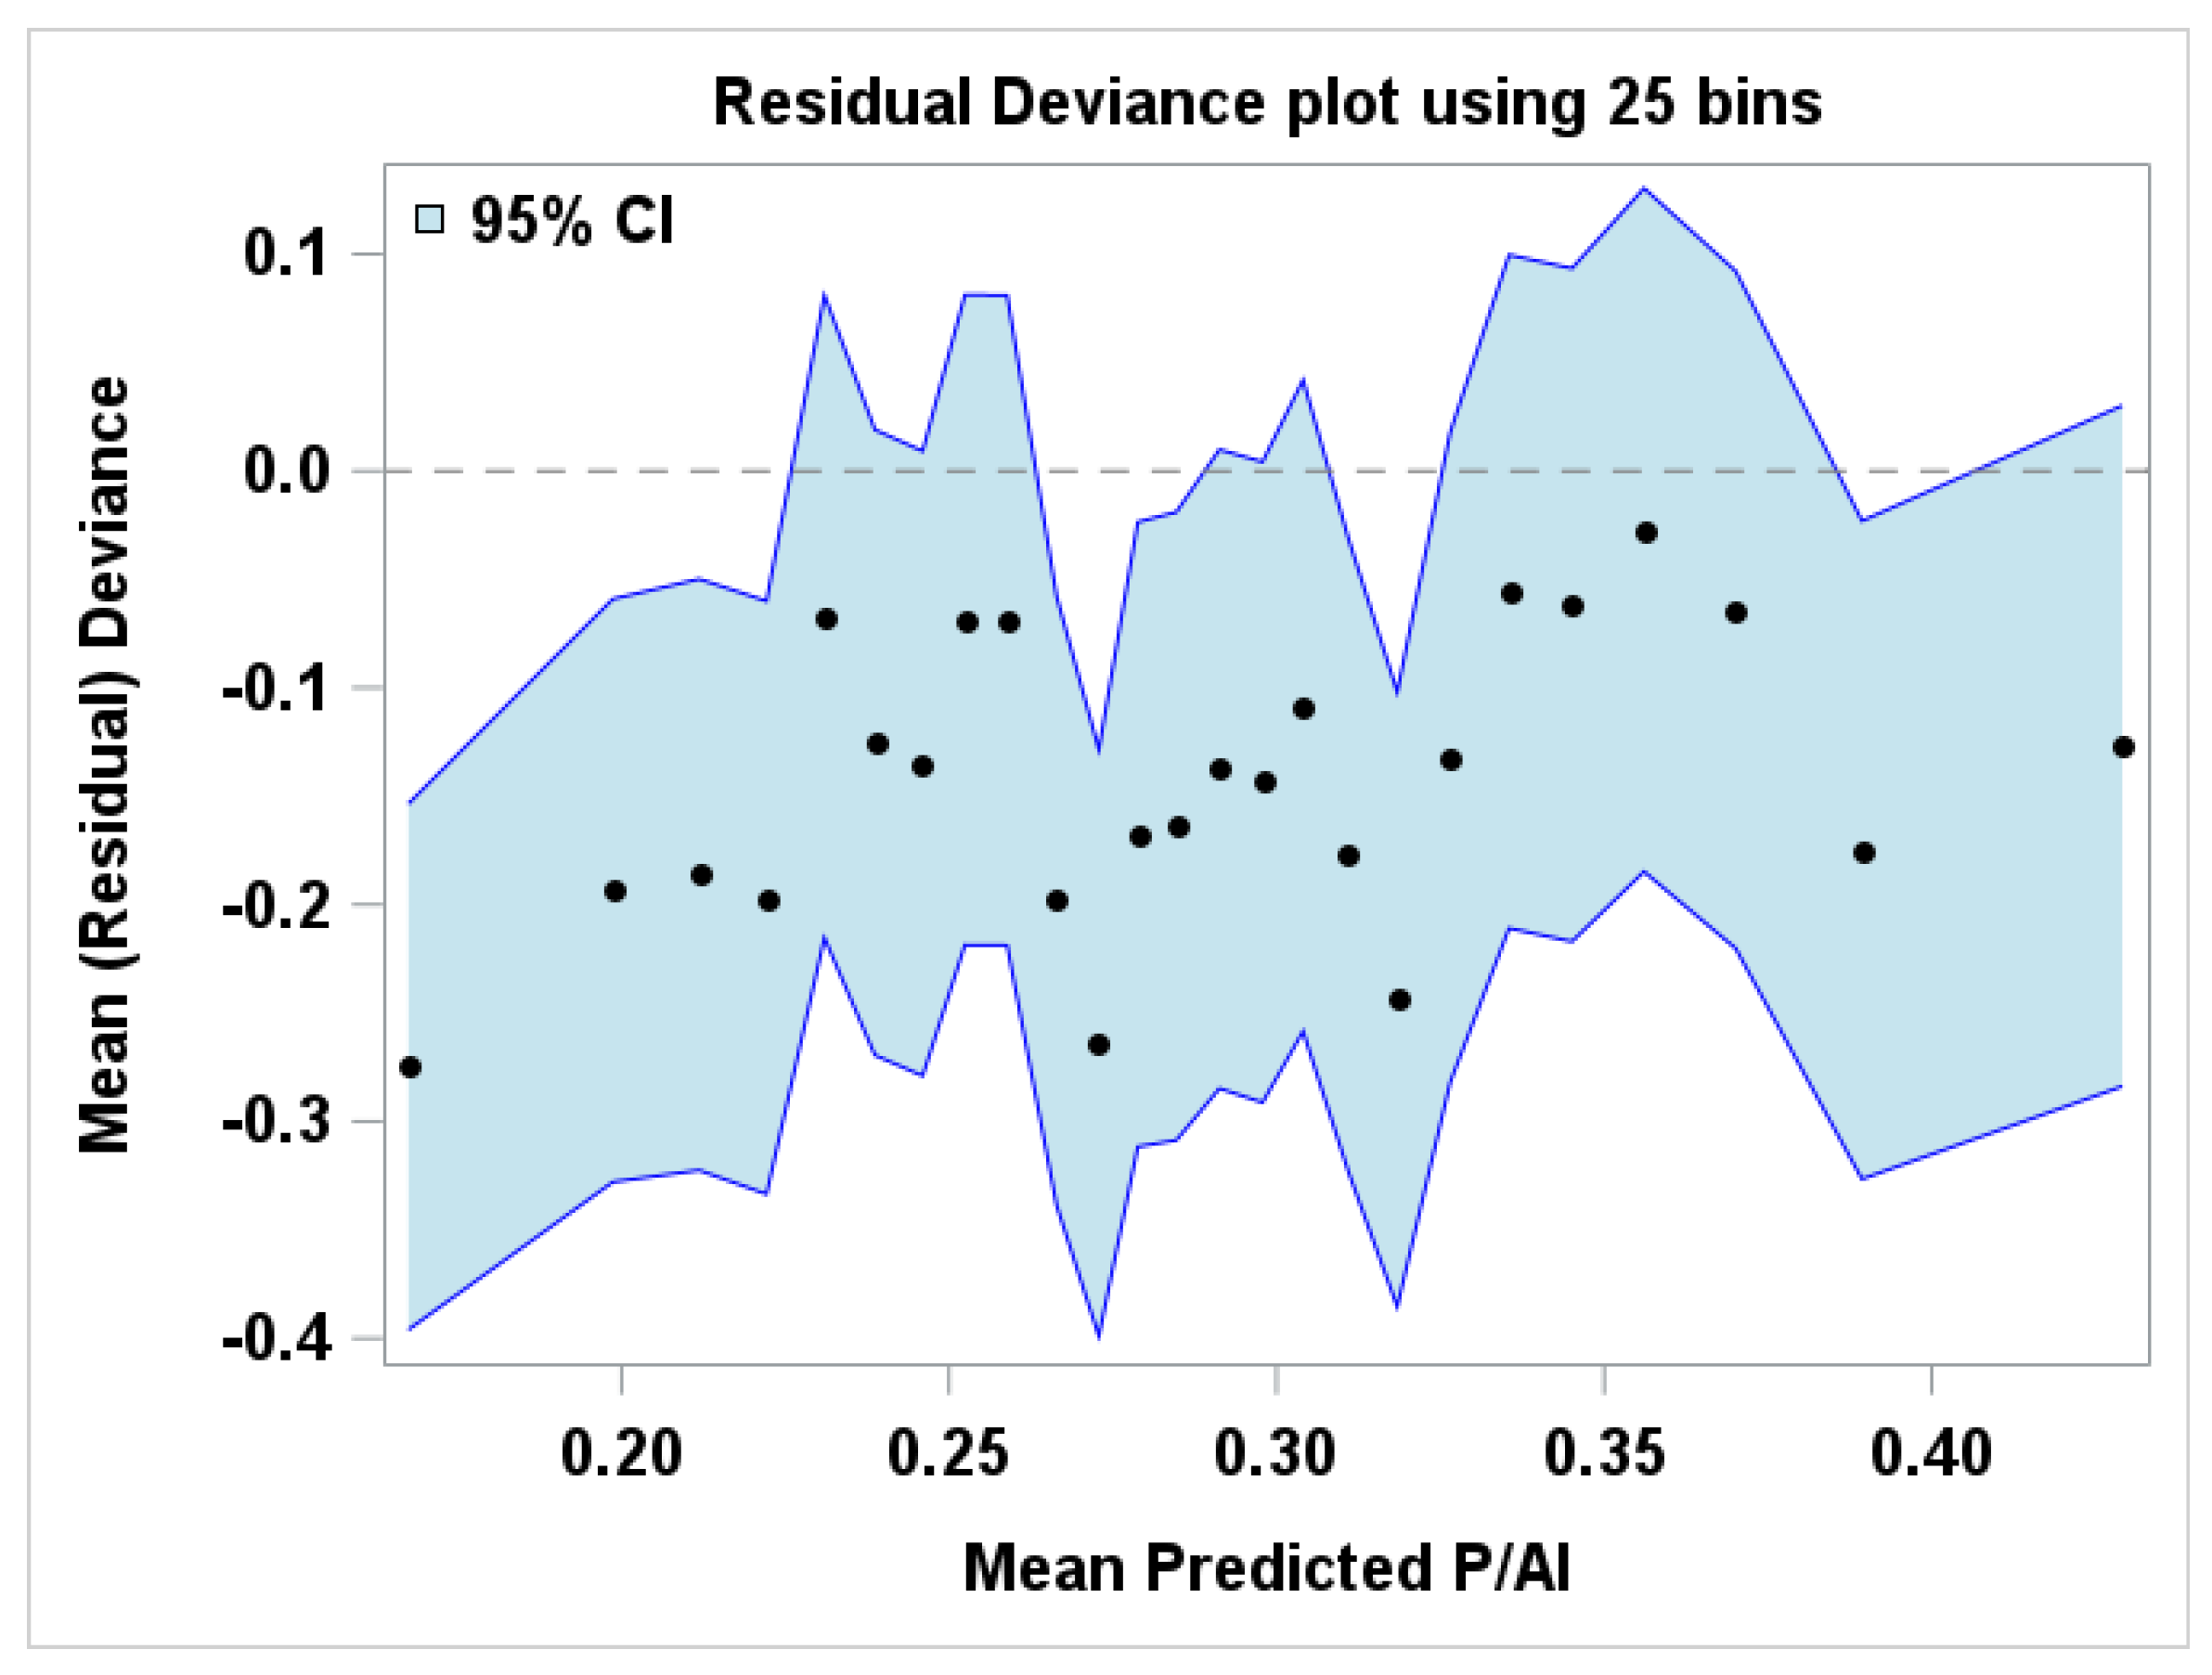
Finally, to further assess calibration, we created binned residual deviance plots for the 3 logistic regression models following Collet [28]. We grouped the observations into 25 equi-interval bins and plotted the mean predicted P/AI against the mean residual deviance within each bin. Residuals randomly scattered around zero with 95% confidence interval consistently covering 0 indicate good model fit.

3. Results

3.1. Logistic Regression Mixed Models and Estimated P/AI

3.1.1. Health Related Event Model

The HRE model included 65,684 inseminations (Table S1). Overall, 62.2% of inseminations did not have a preceding health event and were therefore classified as healthy. Other inseminations were preceded by lameness (6.2%), mastitis (13.9%), metabolic diseases (3.0%), reproductive diseases (7.5%), 2 events (6.1%) or ≥3 events (1.1%). In general, older cows had more HRE within the parity before insemination than younger cows.
Table 2 shows the parameter estimates and estimated probabilities for the association between HRE and P/AI. The estimates are on the log-odds scale. Odds ratios are the exponentiated estimates. Odds ratios greater than 1 imply estimates greater than 0. The 95% confidence interval of the odds ratios is the exponentiated estimates ± 1.96 × standard error. Herd P/AI, the 3-month herd-average P/AI before the insemination, had the greatest odds-ratio, and therefore was the primary determinant of a cow’s individual estimated P/AI.
All fixed effects were statistically significant (p < 0.001). The EMM (called LSMEANS in the GLIMMIX procedure) of the estimated probabilities ranged from a high of 0.30 for healthy inseminations, inseminations following an interservice interval of 18–24 d, and fall inseminations, to a low of 0.18 for inseminations following an interservice interval of ≤17 d.
Within the HRE effect, the estimated P/AI ranged from 0.20 for inseminations following ≥3 HRE to 0.30. Inseminations in first parity cows that occur in the fall following an interservice interval of 18–24 d in healthy cows had the greatest estimated P/AI.

3.1.2. Relative Estrus Intensity Model

The REI model included 17,238 inseminations (Table S2). The distributions of REI categories ≤200%, >200–400%, >400–600%, and >600% were 41%, 27%, 17%, and 15% before each insemination event.
Table 3 includes the parameter estimates and the EMM of the estimated probabilities of the fixed effects for the association between REI and P/AI. All fixed effects were statistically significant (p < 0.05), except for the REI effect itself (p = 0.11). The EMM varied from a high of 0.32 following an interservice interval of 18–24 d to a low of 0.22 for inseminations following an interservice interval of ≤17 d. Within the REI effect, the estimated probabilities varied from 0.26 to 0.28 but were not different (p > 0.05).
In Table S4, we present the parameter estimates and the EMM of the estimated probabilities of the base model for the REI dataset. That is, the same model and dataset as in Table 3 but without the REI fixed effect. The results in Table S4 are very similar to the results in Table 3 for the base variables.

3.1.3. Combo Model

The combined HRE and REI model included 16,415 inseminations (Table S3). Among the 12 categories, the most frequent category was healthy and ≤200% REI with 25.4% of inseminations. The least frequent category was ≥2 HRE and >400–600% REI, preceding only 1.0% of inseminations. Table 4 shows logistic regression results for the combination of HRE and REI. All effects, except for log(DIM) had p < 0.05. For the combined HRE x REI effects, the estimated probabilities ranged from 0.18 for ≥2 HRE and >200–400% REI, to 0.30 for healthy cows with >600% REI.

3.1.4. Odds Ratios

The odds ratios for the logistic regression mixed models that quantify the associations between HRE, REI, their combinations, and P/AI are shown in Table 2, Table 3 and Table 4. The odds ratios can be calculated from the data in the tables. For example, in the HRE model (Table 2), the P/AI preceded by 2 HRE is 0.20 and for healthy inseminations is 0.30 (reference). Therefore, the odds ratio is [0.20/(1 − 0.20)]/[0.30/(1 − 0.30)] ≈ 0.59, indicating that the odds of conception are 41% lower in the 2 HRE category than in healthy category. The trends in the odds ratios are equivalent to the trends in the estimated probabilities. The 95%-confidence intervals are generally wide on both sides of 1, indicating the uncertainty of the parameter estimates.

3.2. Classification Statistics

Table 5 shows classification statistics calculated on the test datasets of the logistic regression models for the HRE, REI, and COMBO datasets. These results depend on whether the predicted probability by the relevant logistic regression model is greater than the cutoff probability or not.
The standard cut off probability of 0.5 shows very imbalanced results with very low sensitivity and very high specificity. The Matthews correlation coefficients are all near 0 in this case, indicating that if the objective was classification (pregnant or not), the predictions from the logistic regression models are hardly better than the population mean P/AI. When the cutoff probability was set at the population means of the test sets, the Matthews correlation coefficients increased but were never greater than 0.132.

3.3. Discrimination and Calibration Statistics

Table 6 shows discrimination and calibration statistics. These results do not depend on a cutoff probability of pregnancy. For all statistics reported here, the HRE model had better discrimination and calibration ability than the REI and COMBO models. The AUROC varied from 0.567 for the COMBO model to 0.600 for the HRE model, all indicating poor discrimination power of the logistic regression models. Youden’s J index varied from 0.099 to 0.145, similarly indicating poor discrimination ability. The Brier scores varied from 0.193 (REI) to 0.208 (HRE), marginally lower than their baseline Brier scores of 0.195 and 0.214.
The Hosmer-Lemeshow p-values for the HRE and REI were >0.05, indicating that these models were well-calibrated. The COMBO model was less well calibrated (p = 0.0329). The mean absolute calibration error percentages ranged from 5.1% for the HRE model, indication of good calibration, to 10.7% for the REI model, indicating poorer calibration.

3.4. Calibration Plots

The calibration plot for the HRE model (Figure 1) shows good calibration with points well distributed around the diagonal line, except for the greatest mean predicted P/AI where the model overestimated the mean actual P/AI. The calibration plots for the REI (Figure 2) and COMBO (Figure 3) models showed more erratic distribution of points around the diagonal line, and wider confidence intervals, both indications of poorer model fit. The residual deviance plots (Figure 4, Figure 5 and Figure 6) showed deviances generally below 0, indicating the models consistently overestimated the P/AI, although the overestimation was small.

4. Discussion

Our study aimed to quantify the associations between REI, HRE, and their combinations, and P/AI in organic certified dairy cows. We were primarily interested in estimating the magnitude of these associations rather than focusing on hypothesis testing of explanatory variables. We also wanted to create and report easily deployable equations to predict P/AI for organic cows not in the datasets. In addition, we aimed to report discrimination and calibration statistics that are also used in the machine learning literature such that results can be easily compared across studies when other methods than logistic regression are used.
The discrimination and calibration results for the 3 models cannot be directly compared to judge the quality of the linear regression models because the test datasets did not contain the same records. We chose to use all records that met the criteria for the individual models to obtain the maximum power. Far fewer records contained activity data than health data.
The predictive power of our three logistic regression models was weak, as judged by the low AUROC. Hempstalk et al. [2] reported AUROC ranging from 0.487 to 0.675 for eight different machine learning algorithms and scenarios predicting insemination outcomes using pasture-based, seasonal breeding data from Ireland. In their study, logistic regression was generally the best-performing algorithm, however, Shahinfar et al. [1] reported AUROC varying from 0.61 to 0.76 for prediction of insemination outcomes in conventionally housed US dairy cows. Barden et al. [4] summarized the state-of-the art in 2024 and concluded that no predictive models for insemination outcomes have demonstrated high levels of discrimination, despite the use of advanced methods and large heterogenous datasets. It is likely that characterization of the underlying physiological processes is necessary to further discriminate between high and low P/AI [4].
These comparable studies did not all have access to the same explanatory variables. For example, Hempstalk et al. [2] included milk yield, mid-infrared spectral data, body condition score, and days open in the previous parity in their models, which were not available in our records. Barden et al. [4] reported that daily milk yield was the second most important predictor of individual cow P/AI, after herd-average P/AI prior to the AI event. Greater daily milk yield is often associated with lower P/AI early in lactation. That study did not include HRE (except for somatic cell counts). Other differences explain some of the variation in performance reported by these studies. For example, Hempstalk et al. [2] applied their trained models to data from other herds to measure prediction accuracy, likely leading to poorer performance, whereas Shahinfar et al. [1] and our study used only internal cross validation data. In addition, Shahinfar et al. [1] included herd–year–month as an independent variable, but this variable is not available when a model is applied to records from a new farm or year. Therefore, Hempstalk et al. [2] did not include this variable. We followed Barden et al. [4] and included herd average P/AI in the three months prior to insemination to make our model as robust and representative to new organic herds as possible. Nevertheless, the performance of our models when applied in other herds remains a question for now.
We used logistic regression to make our models as deployable as possible. Prediction functions to estimate P/AI can easily be constructed from the parameters estimates in Table 2, Table 3 and Table 4 and build into software. Deployment of trained machine learning models, such as random forests and support vector machines, is more challenging even when these models are made available. Often trained machine learning models are not available, and the reader of a published study is tasked to repeat the study with their own data to obtain a prediction function. However, given the goal to predict P/AI, rather than inference on the importance of explanatory variables, other machine learning methods may be useful on the large amounts of heterogenous data that are increasingly collected on dairy farms. Therefore, we attempted to provide discrimination and calibration statistics that are also commonly used in the machine learning community than has been the practice in the veterinary and dairy science literature for similar studies.
Despite the low AUROC, our logistic regression models may still be useful. The predicted P/AI in the calibration bins ranged from approximately 0.25 to 0.45, which is sufficient variation to affect some insemination decisions such as the type of semen, sire choice, delay of insemination, or culling decisions. Barden et al. [4] further discuss that prediction models with low AUROC, like in our study, may still be useful in practice.
As illustration, consider a cow with as inputs a previous three-month herd P/AI of 0.30, 90 DIM, second parity, inseminated during the spring, an interservice interval of 20 d (18–24 category), and a REI of >600%. The log-odds (η) is obtained by multiplying each variable input by its coefficient from the REI model and adding the regression coefficients corresponding to the cow’s categorical levels:
η = 0.076 + 4.610 × 0.30 1.208 × log 90 + 0.137 × log 90 2 0.087 0.016 + 0.283 + 0.115 = 0.91
The predicted P/AI is then obtained by applying the logit transformation:
P / A I = 1 1 + e η = 1 1 + e 0.91 = 0.29 ,  
Discrimination statistics that are calculated from a classification matrix which depends on a cutoff probability (Table 5) were only of secondary interest. Using the standard cutoff probability of 0.5, the ratio of FN to FP is high due to the mean P/AI being around 0.3. The conclusion should not be to not inseminate a cow when her predicted P/AI is <0.5. Following Shahinfar et al. [1], the cost of a FN (failing to inseminate a cow that would have become pregnant, i.e., the cost of a pregnancy [29]) is much greater than the cost of a FP (inseminating a cow that would not have become pregnant, i.e., semen and labor cost). Therefore, FN should be avoided more than FP, which implies a lower cutoff than 0.5 if the purpose is to decide to inseminate the animal or not. In all these cases, accurate cashflows following each decision alternative are needed to inform the probability cutoff(s) if the goal was to inseminate or not. These insemination decision alternatives are beyond the scope of the current study.
Trends in the parameters of the HRE model were as expected. Healthy, first lactation cows had a greater estimated P/AI. The detrimental effect of suboptimal health on insemination outcomes has been observed widely, in grazing and conventional dairy farms (for example in Ribeiro et al. [12]; Vergara et al. [30]). The magnitude of the associations of HRE with P/AI are similar in size to those reported by Pinedo et al. [14]. Therefore, our study does not provide evidence that the association between HRE and P/AI is different in organic herds compared to conventional herds.
The REI model explored how an increase in activity was associated with greater P/AI. Associations between REI, as measured in a relative increase in steps/h prior to insemination compared to the cow’s baseline activity level, and P/AI were weak and generally not different from inseminations at the lowest level of ≤200% REI. This was surprising because other studies have shown a clear increase in P/AI associated with greater activity [7,8,26,31,32]. For example, Madureira et al. [7], using a similar relative intensity measure as in our study, reported that cows with greater peak activity had greater P/AI than those with lower peak activity (37 vs. 25% for a collar-mounted accelerometer, 34 vs. 21% for a leg-mounted pedometer). Madureira et al. [26] reported an increase in P/AI from 23% (for relative intensity 100–199%) to 38% (for a relative intensity ≥400%) of all insemination events. They also reported that greater estrous expression at timed AI improved ovulation rates and reduced pregnancy loss.
Our definition of REI was very similar to the calculation using steps/h described by Madureira et al. [26]. On the study farm, cows were flagged for estrus based on an increase in the motion index, a proprietary algorithm with an unknown calculation for us. Although not identical, changes in the motion index prior to AI-day were like changes in the REI. The motion index is highly influenced by changes in steps/h. It is unlikely that increases in the motion index show a stronger agreement with P/AI than changes in the REI. Furthermore, our interest was not in quantifying the association between the motion index and P/AI because of the proprietary nature of the index.
Cows with low REI may not have been inseminated, and therefore not present in our observational study, if they had not been flagged by the motion index or diagnosed as in estrus by the farm staff. This contrasts with some studies (for example Madureira et al. [7,26]) where cows with low increases in activity were still inseminated because of research study design, likely leading to low P/AI. Such studies will have found a stronger agreement between activity and P/AI. It is possible that the weak association between REI and P/AI in our observational study was due to management decisions. The results of our study show that under practical conditions, the REI was not necessarily a good indicator of P/AI, and therefore of limited use for insemination decisions.
We decided to retain the REI fixed effect in the REI model and show the results in Table 3, even though the REI effect had p > 0.05. Because our emphasis was not hypothesis testing, we follow Wasserstein and Lazar [33] who advise that business decisions should not be based only on whether a p-value passes a specific threshold. Variations in REI may still affect P/AI, even though the evidence for it in our study is not very strong. A relatively large p-value does not imply evidence in favor of the null hypothesis (no REI effect). However, the more parsimonious base model (Table S4) offers similar estimated P/AI without the REI effect and might be used instead.
We hypothesized that the strength of the relationship between REI and P/AI might depend on the HRE category. However, we found no evidence for this using the logistic regression model that included both REI and HRE. This finding is likely due to the weak association between REI and P/AI, as shown in the REI model, and therefore the limited improvement in the COMBO model over the HRE model.
Assessment methods for the evaluation of binary prediction models, such as the logistic regression models developed in this study, can be divided into those for discrimination and calibration [27,34].
It is our impression that comprehensive model evaluation of binary prediction models for application in dairy science was generally not conducted until the recent past. For example, in a logistic regression model to predict chronic mastitis in dairy cows, Kristula et al. [35] showed parameter estimates, odds ratios, and probability estimates. The Hosmer–Lemeshow equal-decile goodness-of-fit chi-square statistic was calculated. Calibration was not mentioned. Shahinfar et al. [1] evaluated their models by the AUROC and the proportion of correctly classified instances (accuracy), but there is no evidence of any calibration evaluation. More recently, Fenlon et al. [23] reported precision, recall, F1-score, and AUC for their predictive model of insemination outcomes. They used tests of overall goodness-of-fit, bias, and calibration error to measure the accuracy of the predicted probabilities. Fenlon et al. [25] provide a discussion of calibration techniques for binary and categorical predictive models. These techniques have also been illustrated in Barden et al. [4].
We acknowledge that our study presents several limitations that hinder its general applicability. First, the study is based on data from a single herd. Specific management practices might have influenced our results and may not be representative of other organic dairy farms. For instance, artificial insemination was performed not only upon estrus alerts but cows were also inseminated upon visual estrous detection by farm staff. Combining visual detection with automated alerts may produce better reproductive outcomes, limiting the generalizability of our results to other farms relying exclusively on automated detection. Second, our models lack external validation, which should caution the reader against the general applicability of the results without further validation. Third, our study lacks specific information of severity of diseases or etiological agents causing the diseases. A fourth limitation is the absence of individual milk production data and other variables that might increase the discriminatory power of our models.


5. Conclusions

We concluded that HRE data could be useful to improve insemination decision-making in organic dairy herds, although their predictive power was weak. The results showed no conclusive evidence of greater estimated P/AI related to greater REI as a measure of estrus activity. Combinations of low REI and more HRE were associated with notably decreased estimated P/AI. The three logistic regression models produce unbiased predicted P/AI. A variety of goodness-of-fit statistics were shown, notably calibration statistics and plots, to allow comparisons of the current logistic regression analyses with future analyses made by other machine learning techniques. The results of this study represent preliminary prediction models requiring external validation before practical implementation is recommended.

Supplementary Materials

The following supporting information can be downloaded at: https://www.mdpi.com/article/10.3390/dairy7040058/s1, Table S1: Number of inseminations by parity group for the logistic regression mixed model with health-related events (HRE); Table S2: Number of inseminations by parity group for the logistic regression mixed model with relative estrus intensity (REI); Table S3: Number of inseminations by parity group for the logistic regression mixed model with combined health-related events (HRE) relative estrus intensity (REI); Table S4: Parameters estimates and estimated probabilities of the logistic regression mixed model for the association between the base variables and the probability of pregnancy (P/AI) in organic dairy cows. This model does not include health-related events (HRE) and/or relative estrus intensity (REI).

Author Contributions

Conceptualization, A.D.V., P.P. and H.Y.; methodology, A.D.V., H.Y., N.B.; software, A.D.V. and C.N.d.G.; validation, A.D.V. and N.B.; formal analysis, C.N.d.G. and A.D.V.; investigation, A.D.V.; resources, A.D.V. and P.P.; data curation, A.D.V. and P.P.; writing—original draft preparation, C.N.d.G. and A.D.V.; writing—review and editing, C.N.d.G., H.Y., P.P., N.B. and A.D.V.; visualization, A.D.V.; supervision, A.D.V.; project administration, A.D.V. and P.P.; funding acquisition, P.P., N.B. and A.D.V. All authors have read and agreed to the published version of the manuscript.

Funding

This work is supported by Food and Agriculture Cyberinformatics and Tools Initiative project award no. 2019-67021–28823, and by Organic Agriculture Research and Extension Initiative project award no. 2022-51300-37880, both from the U.S. Department of Agriculture’s National Institute of Food and Agriculture.

Data Availability Statement

The data presented in this study are available on request from the corresponding author due to privacy reasons.

Acknowledgments

The authors thank Juan Velez, Aurora Organic Dairy, Boulder, Colorado, USA, Robert Fourdraine, Dairy Records Management Systems, North Carolina State University, Raleigh, North Carolina, USA, and Daniel Foy, IceRobotics, Edinburgh, Scotland, UK, for providing the data.

Conflicts of Interest

The authors declare no conflicts of interest.

Abbreviations

The following abbreviations are used in this manuscript:
HREHealth-related events
REIRelative estrus intensity
COMBOCombination of HRE and REI
DIMDays in milk
P/AIPregnancy per artificial insemination
AAMAutomated activity monitors
AUROCArea under the receiver operating characteristic curve
TPTrue positive
TNTrue negative
FPFalse positive
FNFalse negative

References

  1. Shahinfar, S.; Page, D.; Guenther, J.; Cabrera, V.; Fricke, P.; Weigel, K. Prediction of Insemination Outcomes in Holstein Dairy Cattle Using Alternative Machine Learning Algorithms. J. Dairy Sci. 2014, 97, 731–742. [Google Scholar] [CrossRef] [PubMed]
  2. Hempstalk, K.; McParland, S.; Berry, D.P. Machine Learning Algorithms for the Prediction of Conception Success to a given Insemination in Lactating Dairy Cows. J. Dairy Sci. 2015, 98, 5262–5273. [Google Scholar] [CrossRef] [PubMed]
  3. Berry, D.P. Invited Review: Beef-on-Dairy—The Generation of Crossbred Beef × Dairy Cattle. J. Dairy Sci. 2021, 104, 3789–3819. [Google Scholar] [CrossRef] [PubMed]
  4. Barden, M.; Hyde, R.; Green, M.; Bradley, A.; Can, E.; Clifton, R.; Lewis, K.; Manning, A.; O’Grady, L. Development and Evaluation of Predictive Models for Pregnancy Risk in UK Dairy Cows. J. Dairy Sci. 2024, 107, 11463–11476. [Google Scholar] [CrossRef] [PubMed]
  5. Rial, C.; Laplacette, A.; Giordano, J.O. Effect of a Targeted Reproductive Management Program Designed to Prioritize Insemination at Detected Estrus and Optimize Time to Insemination on the Reproductive Performance of Lactating Dairy Cows. J. Dairy Sci. 2022, 105, 8411–8425. [Google Scholar] [CrossRef] [PubMed]
  6. Hannon, F.P.; Green, M.J.; O’Grady, L.; Hudson, C.; Gouw, A.; Randall, L.V. Predictive Models for the Implementation of Targeted Reproductive Management in Multiparous Cows on Automatic Milking Systems. J. Dairy Sci. 2025, 108, 1634–1643. [Google Scholar] [CrossRef] [PubMed]
  7. Madureira, A.M.L.; Silper, B.F.; Burnett, T.A.; Polsky, L.; Cruppe, L.H.; Veira, D.M.; Vasconcelos, J.L.M.; Cerri, R.L.A. Factors Affecting Expression of Estrus Measured by Activity Monitors and Conception Risk of Lactating Dairy Cows. J. Dairy Sci. 2015, 98, 7003–7014. [Google Scholar] [CrossRef] [PubMed]
  8. Borchardt, S.; Tippenhauer, C.M.; Plenio, J.-L.; Bartel, A.; Madureira, A.M.L.; Cerri, R.L.A.; Heuwieser, W. Association of Estrous Expression Detected by an Automated Activity Monitoring System within 40 Days in Milk and Reproductive Performance of Lactating Holstein Cows. J. Dairy Sci. 2021, 104, 9195–9204. [Google Scholar] [CrossRef] [PubMed]
  9. Tippenhauer, C.M.; Plenio, J.-L.; Madureira, A.M.L.; Cerri, R.L.A.; Heuwieser, W.; Borchardt, S. Factors Associated with Estrous Expression and Subsequent Fertility in Lactating Dairy Cows Using Automated Activity Monitoring. J. Dairy Sci. 2021, 104, 6267–6282. [Google Scholar] [CrossRef] [PubMed]
  10. Lyimo, Z.C.; Nielen, M.; Ouweltjes, W.; Kruip, T.A.M.; Eerdenburg, F.J.C.M. van Relationship among Estradiol, Cortisol and Intensity of Estrous Behavior in Dairy Cattle. Theriogenology 2000, 53, 1783–1795. [Google Scholar] [CrossRef] [PubMed]
  11. Cerri, R.L.A.; Burnett, T.A.; Madureira, A.M.L.; Silper, B.F.; Denis-Robichaud, J.; LeBlanc, S.; Cooke, R.F.; Vasconcelos, J.L.M. Symposium Review: Linking Activity-Sensor Data and Physiology to Improve Dairy Cow Fertility. J. Dairy Sci. 2021, 104, 1220–1231. [Google Scholar] [CrossRef] [PubMed]
  12. Ribeiro, E.S.; Lima, F.S.; Greco, L.F.; Bisinotto, R.S.; Monteiro, A.P.A.; Favoreto, M.; Ayres, H.; Marsola, R.S.; Martinez, N.; Thatcher, W.W.; et al. Prevalence of Periparturient Diseases and Effects on Fertility of Seasonally Calving Grazing Dairy Cows Supplemented with Concentrates. J. Dairy Sci. 2013, 96, 5682–5697. [Google Scholar] [CrossRef] [PubMed]
  13. Santos, J.E.P.; Ribeiro, E.S. Impact of Animal Health on Reproduction of Dairy Cows. Anim. Reprod. 2014, 11, 254–269. [Google Scholar]
  14. Pinedo, P.; Santos, J.E.P.; Chebel, R.C.; Galvão, K.N.; Schuenemann, G.M.; Bicalho, R.C.; Gilbert, R.O.; Rodriguez Zas, S.; Seabury, C.M.; Rosa, G.; et al. Early-Lactation Diseases and Fertility in 2 Seasons of Calving across US Dairy Herds. J. Dairy Sci. 2020, 103, 10560–10576. [Google Scholar] [CrossRef] [PubMed]
  15. Pascottini, O.B.; Leroy, J.L.M.R.; Opsomer, G. Metabolic Stress in the Transition Period of Dairy Cows: Focusing on the Prepartum Period. Animals 2020, 10, 1419. [Google Scholar] [CrossRef] [PubMed]
  16. Giordano, J.O.; Laplacette, A.L. Present and Future Opportunities for Artificial Intelligence Applications in Dairy Cattle Reproduction. Anim. Front. 2026, 16, 86–98. [Google Scholar] [CrossRef] [PubMed]
  17. Chebel, R.C.; Bisinotto, R.S.; Giordano, J.; Maggiolino, A.; de Palo, P. Reproduction in the Era of Genomics and Automation. Reprod. Fertil. Dev. 2023, 36, 51–65. [Google Scholar] [CrossRef] [PubMed]
  18. USDA-AMS. Organic Regulations. Available online: https://www.ams.usda.gov/rules-regulations/organic (accessed on 15 May 2025).
  19. Pereira, G.M.; Heins, B.J.; Endres, M.I. Estrous Detection with an Activity and Rumination Monitoring System in an Organic Grazing and a Low-Input Conventional Dairy Herd. Anim. Reprod. Sci. 2020, 221, 106553. [Google Scholar] [CrossRef] [PubMed]
  20. Sorge, U.S.; Moon, R.; Wolff, L.J.; Michels, L.; Schroth, S.; Kelton, D.F.; Heins, B. Management Practices on Organic and Conventional Dairy Herds in Minnesota. J. Dairy Sci. 2016, 99, 3183–3192. [Google Scholar] [CrossRef] [PubMed]
  21. Pinedo, P.J.; Velez, J. Invited Review: Unique Reproductive Challenges for Certified Organic Dairy Herds. Appl. Anim. Sci. 2019, 35, 416–425. [Google Scholar] [CrossRef]
  22. Shrestha, B.; Paudyal, S.; Kaniyamattam, K.; Grohn, Y.T. Graduate Student Literature Review: Organic Dairy Cattle Longevity and Economic Implications—Contemporary Perspectives. J. Dairy Sci. 2025, 108, 3734–3745. [Google Scholar] [CrossRef] [PubMed]
  23. Fenlon, C.; O’Grady, L.; Doherty, M.L.; Dunnion, J.; Shalloo, L.; Butler, S.T. The Creation and Evaluation of a Model Predicting the Probability of Conception in Seasonal-Calving, Pasture-Based Dairy Cows. J. Dairy Sci. 2017, 100, 5550–5563. [Google Scholar] [CrossRef] [PubMed]
  24. Steyerberg, E.W.; Vickers, A.J.; Cook, N.R.; Gerds, T.; Gonen, M.; Obuchowski, N.; Pencina, M.J.; Kattan, M.W. Assessing the Performance of Prediction Models. Epidemiology 2010, 21, 128–138. [Google Scholar] [CrossRef] [PubMed]
  25. Fenlon, C.; O’Grady, L.; Doherty, M.L.; Dunnion, J. A Discussion of Calibration Techniques for Evaluating Binary and Categorical Predictive Models. Prev. Vet. Med. 2018, 149, 107–114. [Google Scholar] [CrossRef] [PubMed]
  26. Madureira, A.M.L.; Polsky, L.B.; Burnett, T.A.; Silper, B.F.; Soriano, S.; Sica, A.F.; Pohler, K.G.; Vasconcelos, J.L.M.; Cerri, R.L.A. Intensity of Estrus Following an Estradiol-Progesterone-Based Ovulation Synchronization Protocol Influences Fertility Outcomes. J. Dairy Sci. 2019, 102, 3598–3608. [Google Scholar] [CrossRef] [PubMed]
  27. Fenlon, C.; O’Grady, L.; Dunnion, J.; Shalloo, L.; Butler, S.T.; Doherty, M. A Comparison of Machine Learning Techniques for Predicting Insemination Outcome in Irish Dairy Cows. In Proceedings of the 24th Irish Conference on Artificial Intelligence and Cognitive Science (AICS 2016); CEUR-WS: Aachen, Germany, 2016; pp. 57–67. [Google Scholar]
  28. Collett, D. Modelling Binary Data; Chapman & Hall/CRC: Boca Raton, FL, USA, 2003; ISBN 9781420057386. [Google Scholar]
  29. De Vries, A. Economic Value of Pregnancy in Dairy Cattle. J. Dairy Sci. 2006, 89, 3876–3885. [Google Scholar] [CrossRef] [PubMed]
  30. Vergara, C.F.; Döpfer, D.; Cook, N.B.; Nordlund, K.V.; McArt, J.A.A.; Nydam, D.V.; Oetzel, G.R. Risk Factors for Postpartum Problems in Dairy Cows: Explanatory and Predictive Modeling. J. Dairy Sci. 2014, 97, 4127–4140. [Google Scholar] [CrossRef]
  31. Silper, B.F.; Madureira, A.M.L.; Polsky, L.B.; Soriano, S.; Sica, A.F.; Vasconcelos, J.L.M.; Cerri, R.L.A. Daily Lying Behavior of Lactating Holstein Cows during an Estrus Synchronization Protocol and Its Associations with Fertility. J. Dairy Sci. 2017, 100, 8484–8495. [Google Scholar] [CrossRef] [PubMed]
  32. Burnett, T.A.; Polsky, L.; Kaur, M.; Cerri, R.L.A. Effect of Estrous Expression on Timing and Failure of Ovulation of Holstein Dairy Cows Using Automated Activity Monitors. J. Dairy Sci. 2018, 101, 11310–11320. [Google Scholar] [CrossRef] [PubMed]
  33. Wasserstein, R.L.; Lazar, N.A. The ASA Statement on p-Values: Context, Process, and Purpose. Am. Stat. 2016, 70, 129–133. [Google Scholar] [CrossRef]
  34. Tedeschi, L.O. Assessment of the Adequacy of Mathematical Models. Agric. Syst. 2006, 89, 225–247. [Google Scholar] [CrossRef]
  35. Kristula, M.A.; Curtis, C.R.; Galligan, D.T.; Bartholomew, R.C. Use of a Repeated-Measures Logistic Regression Model to Predict Chronic Mastitis in Dairy Cows. Prev. Vet. Med. 1992, 14, 57–68. [Google Scholar] [CrossRef]
Figure 1. Calibration plot of mean actual and mean predicted pregnancies/AI for health-related events (HRE).
Dairy 07 00058 g001
Figure 2. Calibration plot of mean actual and mean predicted pregnancies/AI for relative estrus intensity (REI).
Dairy 07 00058 g002
Figure 3. Calibration plot of mean actual and mean predicted pregnancies/AI for the combination (COMBO) of health-related events (HRE) and relative estrus intensity (REI).
Dairy 07 00058 g003
Figure 4. Residual deviance plot for health-related events (HRE).
Dairy 07 00058 g004
Figure 5. Residual deviance plot for relative estrus intensity (REI).
Dairy 07 00058 g005
Figure 6. Residual deviance plot for the combination of health-related events (HRE) and relative estrus intensity (REI).
Dairy 07 00058 g006
Table 1. Number of cows and inseminations used in the logistic regression mixed models for health-related events (HRE), relative estrus intensity (REI) and combinations of HRE and REI (COMBO).
HREHREREIREICOMBOCOMBO
CowsInseminationsCowsInseminationsCowsInseminations
Parity 1452122,8181430550214045291
Parity 2356517,1161408472513754530
Parity 3223511,01481730718012898
Parity 4+304414,7361104394010673696
All13,36565,684475917,238464716,415
Train933645,749331111,831324311,323
Test402919,9351448540714045092
Table 2. Parameter estimates and estimated probabilities of the logistic regression mixed model for the association between health-related events (HRE) and the probability of pregnancy (P/AI) in organic dairy cows.
VariableEstimate aSE bp-ValueOdds Ratio (95% Confidence Interval)EMM c of P/AI
Intercept−4.0640.753
Herd P/AI3.3670.227<0.00129.00 (18.60–45.20)
Log(DIM)1.0950.318<0.0012.99 (1.60–5.57)
Log(DIM)2−0.1160.033<0.0010.89 (0.84–0.95)
Parity: <0.001
     2−0.2030.026 0.82 (0.78–0.86)0.25
     3−0.2200.030 0.80 (0.76–0.85)0.24
     ≥4−0.3940.029 0.67 (0.64–0.71)0.21
     10 10.29
Insemination season: <0.001
     Fall0.2250.032 1.25 (1.18–1.33)0.30
     Spring−0.2410.033 0.79 (0.74–0.84)0.21
     Summer−0.0750.034 0.93 (0.87–0.99)0.24
     Winter0 10.25
Interservice interval (d): <0.001
     ≤17−0.5340.045 0.59 (0.54–0.64)0.18
     18–240.1200.033 1.13 (1.06–1.20)0.30
     25–35−0.1650.044 0.85 (0.78–0.92)0.24
     36–48−0.1070.043 0.90 (0.83–0.98)0.25
     ≥49−0.1250.051 0.88 (0.80–0.97)0.25
     1st bred0 10.27
HRE: <0.001
     2 events−0.3960.048 0.67 (0.61–0.74)0.22
     ≥3 events−0.5260.106 0.59 (0.48–0.73)0.20
     Lameness−0.1410.044 0.87 (0.80–0.95)0.27
     Mastitis−0.0520.030 0.95 (0.89–1.01)0.29
     Metabolic−0.2050.065 0.81 (0.72–0.93)0.26
     Reproductive−0.4740.043 0.62 (0.57–0.68)0.21
     Healthy0.000 10.30
a Estimates on the log-odds scale. b Standard error. c Estimated marginal means.
Table 3. Parameter estimates and estimated probabilities of the logistic regression mixed model for the association between Relative Estrus Intensity (REI) and the probability of pregnancy (P/AI) in organic dairy cows.
VariableEstimate aSE bp-ValueOdds Ratio (95% Confidence Interval)EMM c of P/AI
Intercept0.0761.341
Herd P/AI4.6100.563<0.001100.48 (33.32–303.00)
Log(DIM)−1.2080.5660.0330.30 (0.10–0.90)
Log(DIM)20.1370.0590.0201.15 (1.02–1.29)
Parity: <0.001
     2−0.0870.053 0.92 (0.83–1.02)0.28
     3−0.1830.061 0.83 (0.74–0.94)0.26
     ≥4−0.2490.058 0.78 (0.70–0.87)0.25
     10 10.30
Insemination season: <0.001
     Fall0.2840.055 1.33 (1.19–1.48)0.30
     Spring−0.0160.068 0.98 (0.86–1.12)0.24
     Summer0.2620.061 1.30 (1.15–1.47)0.30
     Winter0 10.24
Interservice interval (d) <0.001
     ≤17−0.2470.082 0.78 (0.67–0.92)0.22
     18–240.2830.067 1.33 (1.16–1.51)0.32
     25–350.0380.088 1.04 (0.87–1.24)0.27
     36–480.1110.089 1.12 (0.94–1.33)0.29
     ≥49−0.0560.107 0.95 (0.77–1.17)0.25
     1st bred0 10.27
REI: 0.110
     >200–400%0.0120.052 1.01 (0.91–1.12)0.26
     >400–600%0.1170.059 1.12 (1.00–1.26)0.28
     >600%0.1150.064 1.12 (0.99–1.27)0.28
     ≤200%0 10.26
a Estimates on the log-odds scale. b Standard error. c Estimated marginal means.
Table 4. Parameter estimates and estimated probabilities of the logistic regression mixed model for the association of the combination (COMBO) of health-related events (HRE) and relative estrus intensity (REI) and the probability of pregnancy (P/AI) in organic dairy cows.
VariableEstimate aSE bp-ValueOdds Ratio (95% Confidence Interval)EMM c of P/AI
Intercept−0.0651.383
Herd P/AI4.3360.576<0.00176.41 (24.73–236.10)
Log(DIM)−1.0380.5840.0750.35 (0.11–1.11)
Log(DIM)20.1220.0610.0441.13 (1.00–1.27)
Parity: <0.001
     2−0.0940.054 0.91 (0.82–1.01)0.26
     3−0.1830.063 0.83 (0.74–0.94)0.24
     ≥4−0.2290.060 0.80 (0.71–0.89)0.23
     10 10.28
Insemination season: <0.001
     Fall0.2670.057 1.31 (1.17–1.46)0.28
     Spring−0.0220.070 0.98 (0.85–1.12)0.23
     Summer0.2440.063 1.28 (1.13–1.44)0.28
     Winter0 10.23
Interservice interval (d) <0.001
     ≤17−0.2500.084 0.78 (0.66–0.92)0.21
     18–240.2630.068 1.30 (1.14–1.49)0.31
     25–350.0350.090 1.04 (0.87–1.24)0.26
     36–480.0660.092 1.07 (0.89–1.28)0.27
     ≥49−0.1090.111 0.90 (0.72–1.12)0.23
     1st bred0 10.25
COMBO: 0.002
     One HRE and ≤200% REI−0.2910.093 0.75 (0.62–0.90)0.24
     One HRE and >200–400% REI−0.2370.103 0.79 (0.64–0.97)0.25
     One HRE and >400–600% REI−0.1850.116 0.83 (0.66–1.04)0.26
     One HRE and >600% REI−0.2790.120 0.76 (0.60–0.96)0.24
     ≥2 HRE and ≤200% REI−0.5520.161 0.58 (0.42–0.79)0.20
     ≥2 HRE and >200–400% REI−0.6540.188 0.52 (0.36–0.75)0.18
     ≥2 HRE and >400–600% REI−0.0300.208 0.97 (0.65–1.46)0.29
     ≥2 HRE and >600% REI−0.1700.223 0.84 (0.55–1.30)0.26
     Healthy and ≤200% REI−0.1340.080 0.87 (0.75–1.02)0.27
     Healthy and >200–400% REI−0.1180.086 0.89 (0.75–1.05)0.27
     Healthy and >400–600% REI−0.0890.092 0.92 (0.76–1.10)0.28
     Healthy and >600% REI0 10.30
a Estimates on the log-odds scale. b Standard error. c Estimated marginal means.
Table 5. Classification matrix of logistic regression parameters applied to test data sets for health-related events (HRE), relative estrus intensity (REI) or their combinations (COMBO).
HREHREREIREICOMBOCOMBO
Cutoff probability0.50.3090.50.2650.50.267
Frequency19,93519,9355407540750925092
True positive (TP)72376129602915
True negative (TN)13,68473313972164337311498
False positive (FP)9264452233112223
False negative (FN)6087239814314731358445
Correct = Accuracy69.0%55.6%73.5%48.1%73.3%47.4%
Recall = Sensitivity1.2%61.1%0.1%67.0%0.1%67.3%
Specificity99.3%53.2%100.0%41.3%100.0%40.1%
Precision = Positive Predictive value43.9%36.9%50.0%29.2%66.7%29.1%
Negative Predictive value69.2%75.4%73.5%77.7%73.3%77.1%
F1-score2.3%46.0%0.3%40.7%0.3%41.1%
Matthews correlation coefficient0.0260.1320.0140.0750.0120.068
Table 6. Discrimination and calibration statistics for logistic regression parameters applied to test data sets for health-related events (HRE), relative estrus intensity (REI) or their combinations (COMBO).
HREREICOMBO
Discrimination:
     AUROC0.6000.5710.567
     Youden’s J index0.1450.1010.099
     Youden’s J (prob)0.3120.2670.271
Discrimination and Calibration:
     Brier score0.2080.1930.194
Calibration:
     Hosmer–Lemeshow p-value0.16930.26310.0329
     Mean absolute calibration error5.05%10.69%9.36%
Disclaimer/Publisher’s Note: The statements, opinions and data contained in all publications are solely those of the individual author(s) and contributor(s) and not of MDPI and/or the editor(s). MDPI and/or the editor(s) disclaim responsibility for any injury to people or property resulting from any ideas, methods, instructions or products referred to in the content.