Article

Lactic Microbiota and Metabolites in Raw Cow’s Milk: Implications for Consumer Health

by
María Carmen Sánchez
1,2,†,
Eduardo Soria
1,†,
Arancha Llama-Palacios
1,2,
Franco Almirón
1,
Alberto Valdés
3,
Alejandro Cifuentes
3,
Marta Hernández
4,
María José Ciudad
1,2,* and
Luis Collado
1,2
1
Department of Medicine, Faculty of Medicine, University Complutense, 28040 Madrid, Spain
2
GINTRAMIS Research Group (Translational Research Group on Microbiota and Health), Faculty of Medicine, University Complutense, 28040 Madrid, Spain
3
Foodomics Laboratory, Institute of Food Science Research (CIAL, CSIC), 28049 Madrid, Spain
4
CAPSA FOODS, Instituto Central Lechera Asturiana para la Nutrición Personalizada (ICLANP), 33199 Asturias, Spain
*
Author to whom correspondence should be addressed.
These authors contributed equally to this work.
Dairy 2025, 6(3), 24; https://doi.org/10.3390/dairy6030024
Submission received: 21 January 2025 / Revised: 12 May 2025 / Accepted: 12 May 2025 / Published: 22 May 2025
(This article belongs to the Section Metabolomics and Foodomics)

Abstract

:
This study explores the microbiota and metabolite profile of raw cow’s milk, analyzing the correlation between them and their potential impact on consumer health, focusing on factors like cow’s feeding regimen (conventional vs. grazing), the herd’s geographical location (coastal vs. inland), and the thermal stability of raw milk samples. To achieve this, raw milk quality was assessed through mesophilic bacterial count and thermal stability using the 70° and 80° ethanol test. Metataxonomic analysis was performed using Illumina 16S rRNA hypervariable region sequencing, and untargeted metabolomics was conducted using UHPLC-Q/TOF MS/MS, followed by multivariate correlation analysis. All samples met quality standards. A total of 1258 prokaryotic ASVs were identified, spanning 48 bacterial phyla and one archaeal phylum, with 909 genera and 349 unidentified ASVs. Additionally, 70 metabolites were identified, including essential amino acids, vitamins, and bioactive compounds with antimicrobial, anti-inflammatory, and prebiotic properties. Significant correlations between bacterial diversity and metabolite profiles were observed. Feeding regimen and geographical location influence microbial composition and metabolite abundance, while thermal stability was linked to specific metabolites like oleamide and pyridoxal. These findings suggest that microbiota-derived metabolites can enhance the nutritional and functional value of milk. Further research is needed to understand how environmental and processing factors influence these dynamics.

1. Introduction

Cow’s milk has a varied composition, consisting of proteins, fats, carbohydrates, vitamins, and mineral salts, as well as high digestibility, high exploitability by the human body, and numerous uses in food preparation, making milk an indispensable product for addressing the biological needs of humans of all ages [1,2]. In fact, cow’s milk and its derivatives are one of the most consumed food groups worldwide, especially in developed countries [1].
The main components of cow’s milk and their origin are well-known [3]; however, the broad range of metabolites that it can contain, along with the main components, which can be of considerable nutritional value, are still seldom described [2,4]. In this regard, the milk’s microbiota assumes a leading role in that the high nutritional value of milk, along with its neutral pH, makes it an optimal culture medium for a large variety of microorganisms [4].
A healthy mammary gland is considered a sterile environment, particularly in prepubescent animals with intact nipples before colostrogenesis and the start of milk secretion [4,5]. Around the first birth and after the start of milking, the mammary gland becomes a functionally open system with a direct connection to the environment. It has been hypothesized that there is a natural community of microorganisms within the mammary gland, the microbiota itself [4,6], which does not have to be associated with the deleterious processes related to fermentation and preservation [7,8,9]. This microbiota, defined as the collection of microorganisms that naturally inhabit milk, includes mainly bacteria, accompanied in a lesser proportion by archaea, yeasts, and molds, of diverse origin [4,10,11,12,13]. Lactic acid bacteria (LAB), a group of bacteria that ferment lactose into lactate, are the dominant population in cow’s milk before pasteurization and include genera such as Lactococcus, Lactobacillus, Leuconostoc, Streptococcus, and Enterococcus. Psychrotrophic bacteria generally establish during cold storage and are also an important component that frequently includes Pseudomonas and Acinetobacter spp. In some cases, raw milk includes several pathogens known to cause infections, such as Escherichia sp., Enterobacter sp., Staphylococcus aureus, and Streptococcus uberis. These microorganisms can pose health risks if not properly managed, so it is crucial to consider the conditions under which milk is produced and handled in order to minimize the presence of such pathogens and ensure milk safety [14].
It is important to note that the presence of milk microbiota is drastically reduced after pasteurization, ultra-pasteurization, or UHT processes, which are necessary steps to ensure food safety by preventing milk spoilage due to microbial growth and contamination. However, these treatments do not reach the consumer without causing some chemical changes, as well as alterations in the nutritional content and flavor of raw milk. Several studies have shown that thermal processing alters volatile compounds and results in a significant loss of labile compounds, including essential vitamins such as A, B, D, and E, among others; however, many of the milk metabolites will still reach the consumer [15,16]. Even so, although the microbiota of raw milk may not reach the consumer, many of the metabolites they produce will. This microbiota will be highly active metabolically, producing metabolites that contribute, in many cases, to this food’s nutritional and stability characteristics [4].
Some of the most important metabolites of bacterial origin identified in cow’s milk include lactic acid, which contributes to the bitter taste of fermented milk products and has antimicrobial and preservative properties; bioactive peptides, fragments of proteins with diverse biological functions such as blood pressure regulation and antioxidant activity; vitamin K2, important for bone and cardiovascular health; and conjugated linoleic acids, fatty acids with anticancer and anti-inflammatory properties, among others [4]. Thus, the beneficial potential of the metabolites of bacterial origin in cow’s milk are directed towards strengthening the immune system, helping prevent infections and improving the response to disease; promoting gut health by affecting the composition of the human gut microbiota, promoting a healthy balance of bacteria and improving digestion; providing antimicrobial properties, given that certain metabolites produced by the bacteria in milk, such as bacteriocins, can help fight against pathogenic bacteria; and providing anti-inflammatory effects. It has been suggested that certain metabolites have anti-inflammatory properties, which are potentially beneficial for various chronic diseases. There is also prebiotic potential, given that certain bacteria in milk, such as lactobacilli and bifidobacteria, produce metabolites that are used as prebiotics in fermented food and dietary supplements due to their health benefits [2,17,18,19].
It has been reported that the composition of this microbial community, and thus its metabolic activity, can be profoundly affected by various factors, such as the animal’s diet, genetics, number and stage of lactation, as well as seasonal variation, somatic cell counts, and the processing of the milk [20]. However, few studies have analyzed how these variables consequently affect the metabolic composition of milk. The present study was therefore proposed to better understand the composition of metabolites in raw cow’s milk and their impact on consumer health, as well as to understand the role of milk microbiota in relation to these metabolites and hence their nutritional value. The study addressed the characterization of microbiota in raw cow’s milk using the massive sequencing technique of Illumina 16S and the characterization of the metabolome by ultra-high-performance liquid chromatography-triple/time-of-flight mass spectrometry (UHPLC-Q/TOF MS/MS), analyzing its possible correlation. Additionally, the study considered a number of variables that could have implications in the content of microorganisms and metabolites, such as the herd’s feeding regimen, the geographical location of the livestock farm, and the milk’s stability, or in lieu thereof, thermal instability, verifying how these variables might affect the health benefits for consumers.

2. Materials and Methods

2.1. Sample Collection

A total of 36 raw milk samples were collected from Holstein dairy herds, free-range housing, located in the northwest of Spain. The samples were classified based on the feeding regimen declared by each farm (conventional, based on grass hay, corn silage, and concentrate, or grazing regimen, based on forage, grass silage, and concentrate) and by geographical location (coastal or inland farms) (Table 1). Samples were collected from three livestock operations for each condition, with three healthy animals randomly selected from each of them. To this end, 500 mL of milk was collected in sterile containers with hermetic seals halfway through the milking. The samples were kept cold from their collection to their delivery, in less than 24 h, to the testing laboratory. For each sample, an aliquot was immediately analyzed using the mesophilic bacterial count technique and by the 70° and 80° ethanol stability test. Another aliquot was stored at −20 °C until its metataxonomic analysis by Illumina 16S massive sequencing. Lastly, another aliquot was stored at –80 °C until its metabolomic analysis by UHPLC-Q/TOF MS/MS. To prevent abnormalities in milk production due to environmental changes, the samples were obtained in the shortest time possible (less than 2 weeks).

2.2. Study of the Quality of the Raw Milk Using the Mesophilic Bacterial Count and Thermal Stability Using the 70° and 80° Ethanol Test

To check that the collected milk samples met the quality standards, a mesophilic bacterial count was performed following the protocol indicated in the UNE-EN ISO 4833-2 standard (2014) [21], which was in force at the time of the analysis. For each milk sample, we planted (in triplicate) 0.1 mL of the 10−1 to 10−5 dilutions on Plate Count Agar-PCA plates (Scharlau, Barcelona, Spain). The plates were incubated at 30 °C ± 1° for 72 ± 3 h in aerobiosis. After incubation, the colony-forming units (CFUs) were counted and expressed as CFU/mL. Fisher’s test was employed to determine the differences in the categorical variables (herd’s geographical location and feeding regimen).
The milk’s thermal stability was determined using the ethanol test, which considered the milk stable in a certain concentration of ethanol solution if there was no coagulation, while considering it unstable if there was coagulation. Following the regulations described in Spain’s Royal Decree 1728/2007, which was in force at the time of the study, we mixed aliquots of the milk samples with solutions of ethyl alcohol at 70 and 80 v/v, in a 1:1 proportion, and their stability was determined depending on whether they coagulated or not. The Wilcoxon nonparametric test was applied to determine the stability/instability differences in the categorical variables (herd’s geographical location and feeding regimen).

2.3. Metataxonomic Analysis of the Samples by Massive Sequencing Using Illumina 16S rRNA

2.3.1. DNA Extraction

We employed a total of 5 mL of raw milk per sample. The genetic material was extracted with the DNeasy PowerSoil Pro Kit (250) (Qiagen, Hilden, Germany, following the manufacturer’s instructions. Once the DNA had been extracted, it was quantified using Qubit dsDNA High Sensitivity technology (Invitrogen, Carlsbad, CA, USA).

2.3.2. Massive Sequencing of the Amplicons of Gene 16S rRNA

To analyze the microbial community present in the milk samples, we amplified using polymerase chain reaction (PCR) the metagenomic DNA of the hypervariable region V3-V4 of gene 16S of the ribosomal RNA using the following primers: Forward: 5′ CCT AYG GGR BGC ASC AG 3′; Reverse: 5′ GGA CTA CNN GGG TAT CTA AT 3′ [22].
The PCR reactions were performed with the Phusion® High-Fidelity PCR Master Mix (New England Biolabs, Ipswich, MA, USA). The PCR products were mixed in equal parts to create an equimolar pool. The amplicons were purified with the Qiagen Gel Extraction Kit (Qiagen) and subsequently sequenced using the Illumina NovaSeq 6000 platform (2 × 250 bp).

2.3.3. Processing of the Sequencing Data and Statistical Analysis

The raw sequences generated by Illumina were imported into the bioinformatics tool Qiime2 [23] to conduct an initial quality control process of the sequences with DADA2. During this process, the low-quality reads were discarded and trimmed. The forward and reverse sequences that subsequently passed through the filter were assembled. The taxonomic assignment of each amplicon sequence variant (ASV), defined to a sequence similarity of 99.9%, was performed using the classify-Sklearn module in combination with the SILVA 138 database [24]. The statistical analysis and microbial ecology analysis were performed using various R software packages, including Phyloseq [25] and Vegan (Vegan: community ecology package. v. 0.5.2).
To analyze the change in the alpha diversity over the course of the treatment, we calculated 3 indices of alpha diversity: richness, Shannon diversity, and Simpson diversity. Richness represents the number of different ASVs observed in each sample. The Shannon index is a measure of diversity that considers the number of different taxa and their relative abundance. The Simpson index quantifies the distribution of the sequences in each of the identified ASVs, in such a way that a value of 1 indicates that all the ASVs have the same number of bacteria.
The beta diversity analysis was performed using the principal coordinate analysis (PCoA) after calculating a dissimilarity matrix between samples with the Bray–Curtis and Jaccard methods. To detect statistically significant differences in the composition of the microbiome between the analyzed groups, we employed the PERMANOVA (permutational analysis of variance) statistic.
The Wilcoxon Rank Sum Test was employed to assess statistically significant differences between groups of samples at the alpha diversity level. To determine statistically significant differences in the relative abundance of the taxa, we employed the DESeq2 test [26].

2.4. Metabolomic Analysis of the Samples by UHPLC-Q/TOF MS/MS

To homogenize the number of samples according to the study variables [feeding regimen (conventional or grazing), geographical location (inland or coastal) and stability/instability observed in the 80° ethanol test], we randomly selected 24 samples to perform the study of the metabolomic profiles using UHPLC-Q/TOF MS/MS, performing a comparative analysis of these according to the detailed variables. The coding for each sample is listed in Table 2, anonymized to prevent a direct association with the livestock farm.

2.4.1. Extraction of Metabolites and Untargeted Metabolomic Analysis Based on UHPLC Mass Spectrometry

The metabolites were extracted from the raw milk samples using methanol–methyl-tert-butyl-ether (MTBE). Specifically, 100 μL of each sample was combined with 700 μL of methanol MTBE (50:50 v/v), shaken for 1 min in a vortex, and subsequently agitated for 5 min at 2000 rpm at 4 °C. The mixture was then incubated on ice for 10 min and centrifuged for 15 min at 14,800 rpm and 4 °C. We collected 500 μL of the supernatant and centrifuged at 14,800 rpm for 5 min at 4 °C. The supernatants were finally collected and stored at −80 °C until their analysis by ultra-high resolution liquid chromatography—quadrupole time-of-flight mass spectrometry (UHPLC-MS/MS). An extraction blank was prepared following the same protocol for extracting metabolites from the samples.
Aliquots of 2 μL were randomly injected (in three replicates) into a liquid chromatography—tandem mass spectrometry system (LC–MS/MS), which consisted of a quadrupole Q-TOF series 6540 coupled to an HPLC (model 1290), both from Agilent Technologies (Agilent Technologies, Waldbronn, Germany), equipped with a thermal orthogonal electrospray ionization (ESI) source (Agilent Jet Stream, AJS; Agilent Technologies). MS control, data acquisition, and data analysis were conducted using the Agilent MassHunter (B.10.0) qualitative analysis software (Agilent Technologies). For the chromatographic separation, we employed an Eclipse Plus C18 analytical column (100 × 2.1 mm, particle size 1.8 μm) and a C18 guard column (0.5 cm × 2.1 mm, particle size 1.8 μm), both from Agilent (Waldbronn, Germany). The column temperature was kept at 40 °C. Water (grade LC-MS) was employed as mobile phase (A), and acetonitrile (ACN) was employed as mobile phase (B), using 0.1% formic acid as a mobile phase modifier. The following mobile phase gradient was supplied at a flow rate of 0.5 mL/min: 0% to 30% B in 7 min; 30% to 80% B in 2 min; 80% to 100% B in 2 min; 100% B for 2 min; 100% to 0% B in 1 min; and 0% B for 3 min to come back to initial conditions.
The mass spectrometer used the following parameters: capillary voltage of 3000 V; mass range of 25–1100 m/z; nebulizer pressure of 40 psig; drying gas flow rate of 8 L/min; and temperature of 300 °C. The sheath gas flow rate was 11 L/min at 350 °C. The tandem mass spectrometry (MS/MS) analysis was performed using the autoMS/MS mode using 5 precursors per cycle, dynamic exclusion after 2 spectra (released after 0.5 min), and collision energy of 20 and 40 V. To achieve appropriate mass accuracy, the spectra were corrected using ions at m/z 121.0509 (C5H4N4) and 922.0098 (C18H18O6N3P3F24), simultaneously bombarded onto the source of ionization.

2.4.2. Data Processing and Statistical Analysis

The raw LC-MS data files were converted to .abf format. Data processing was then performed using MS-DIAL software (v. 4.6) for deconvolution, peak selection, alignment, and identification. Compound annotation was performed by using different databases (NIST, LipidBLAST, and MoNA (https://mona.fiehnlab.ucdavis.edu/downloads, accessed on 12 May 2025). Peak height was calculated using the median of the 3 technical replicates and by combining data for different molecular species detected for each compound.
The list of metabolites was subsequently filtered, eliminating unknown metabolites, metabolites with a maximum height below 1000 units, and metabolites with a maximum height below three times the mean height in the extraction blank. Missing values were imputed by half of the minimum height value.
Multivariate statistical analyses (principal component analysis, PCA; partial least squares discriminant analysis, PLS-DA) and univariate analyses (ANOVA and t-test) between the different clusters of samples (stable vs. unstable; inland vs. coastal; conventional vs. grazing) were performed using the MetaboAnalyst 5.0 tool (https://genap.metaboanalyst.ca/, accessed on 12 May 2025).

2.5. Multivariate Correlation Analysis Based on Metabolomics and Microbial Profiles

Various R software packages were employed for all of these purposes. The pheatmap library (v1.0.12) (Pheatmap: Pretty Heatmaps [1.0.12]; https://cran.r-project.org/web/packages/pheatmap/, accessed on 12 May 2025) was employed to trace the correlation heatmaps. We also employed the cor.test() correlation test with the predetermined arguments to determine the statistical significance between each correlation. The nonparametric Wilcoxon test was applied to determine the differences between metabolites/taxa in the categorical variables (i.e., location and farm). The resulting p-values were adjusted according to the Benjamini–Hochberg method [27]. A Spearman correlation analysis was performed at three levels: metabolites to metabolites, taxa to taxa, and metabolites to taxa. The analyses were performed globally, including all types of samples, as well as separately to allow for the comparison between conditions (stable vs. unstable; coastal vs. inland; conventional vs. grazing).

3. Results

3.1. Study of the Quality and Stability of the Milk in 70° and 80° Ethanol

The 70° and 80° ethanol milk stability analyses of the analyzed samples revealed that 88.9% and 58.3% of the samples, respectively, were thermally stable. To determine whether the herd feeding regimen, location, or the combination of the two categories significantly affected the stability of the milk in 70° and 80° ethanol, comparisons were performed using Fisher’s test. The statistical significance results show that the feeding regimen and location were not significant with this analyzed sample size and that significant differences (p < 0.05) were only obtained in the 80° ethanol stability test when comparing the samples corresponding to the conventional feeding regimen in inland farms with the other combinations (Table S1 of the Supplementary Materials).
In parallel, we were able to verify that all the samples met the standards of quality. The results of the bacterial counts for all analyzed samples of raw milk were highly similar, as can be seen in Figure S1 (Supplementary Materials), and within the limits indicated by applicable legislation (RD 1728/2007). When checking whether the bacterial count varied for each of the variables (geographical location, feeding regimen, and stability in 70–80° ethanol), the Wilcoxon Rank Sum Test and the t-test showed that none of these comparisons were statistically significant (p > 0.05 in all cases).

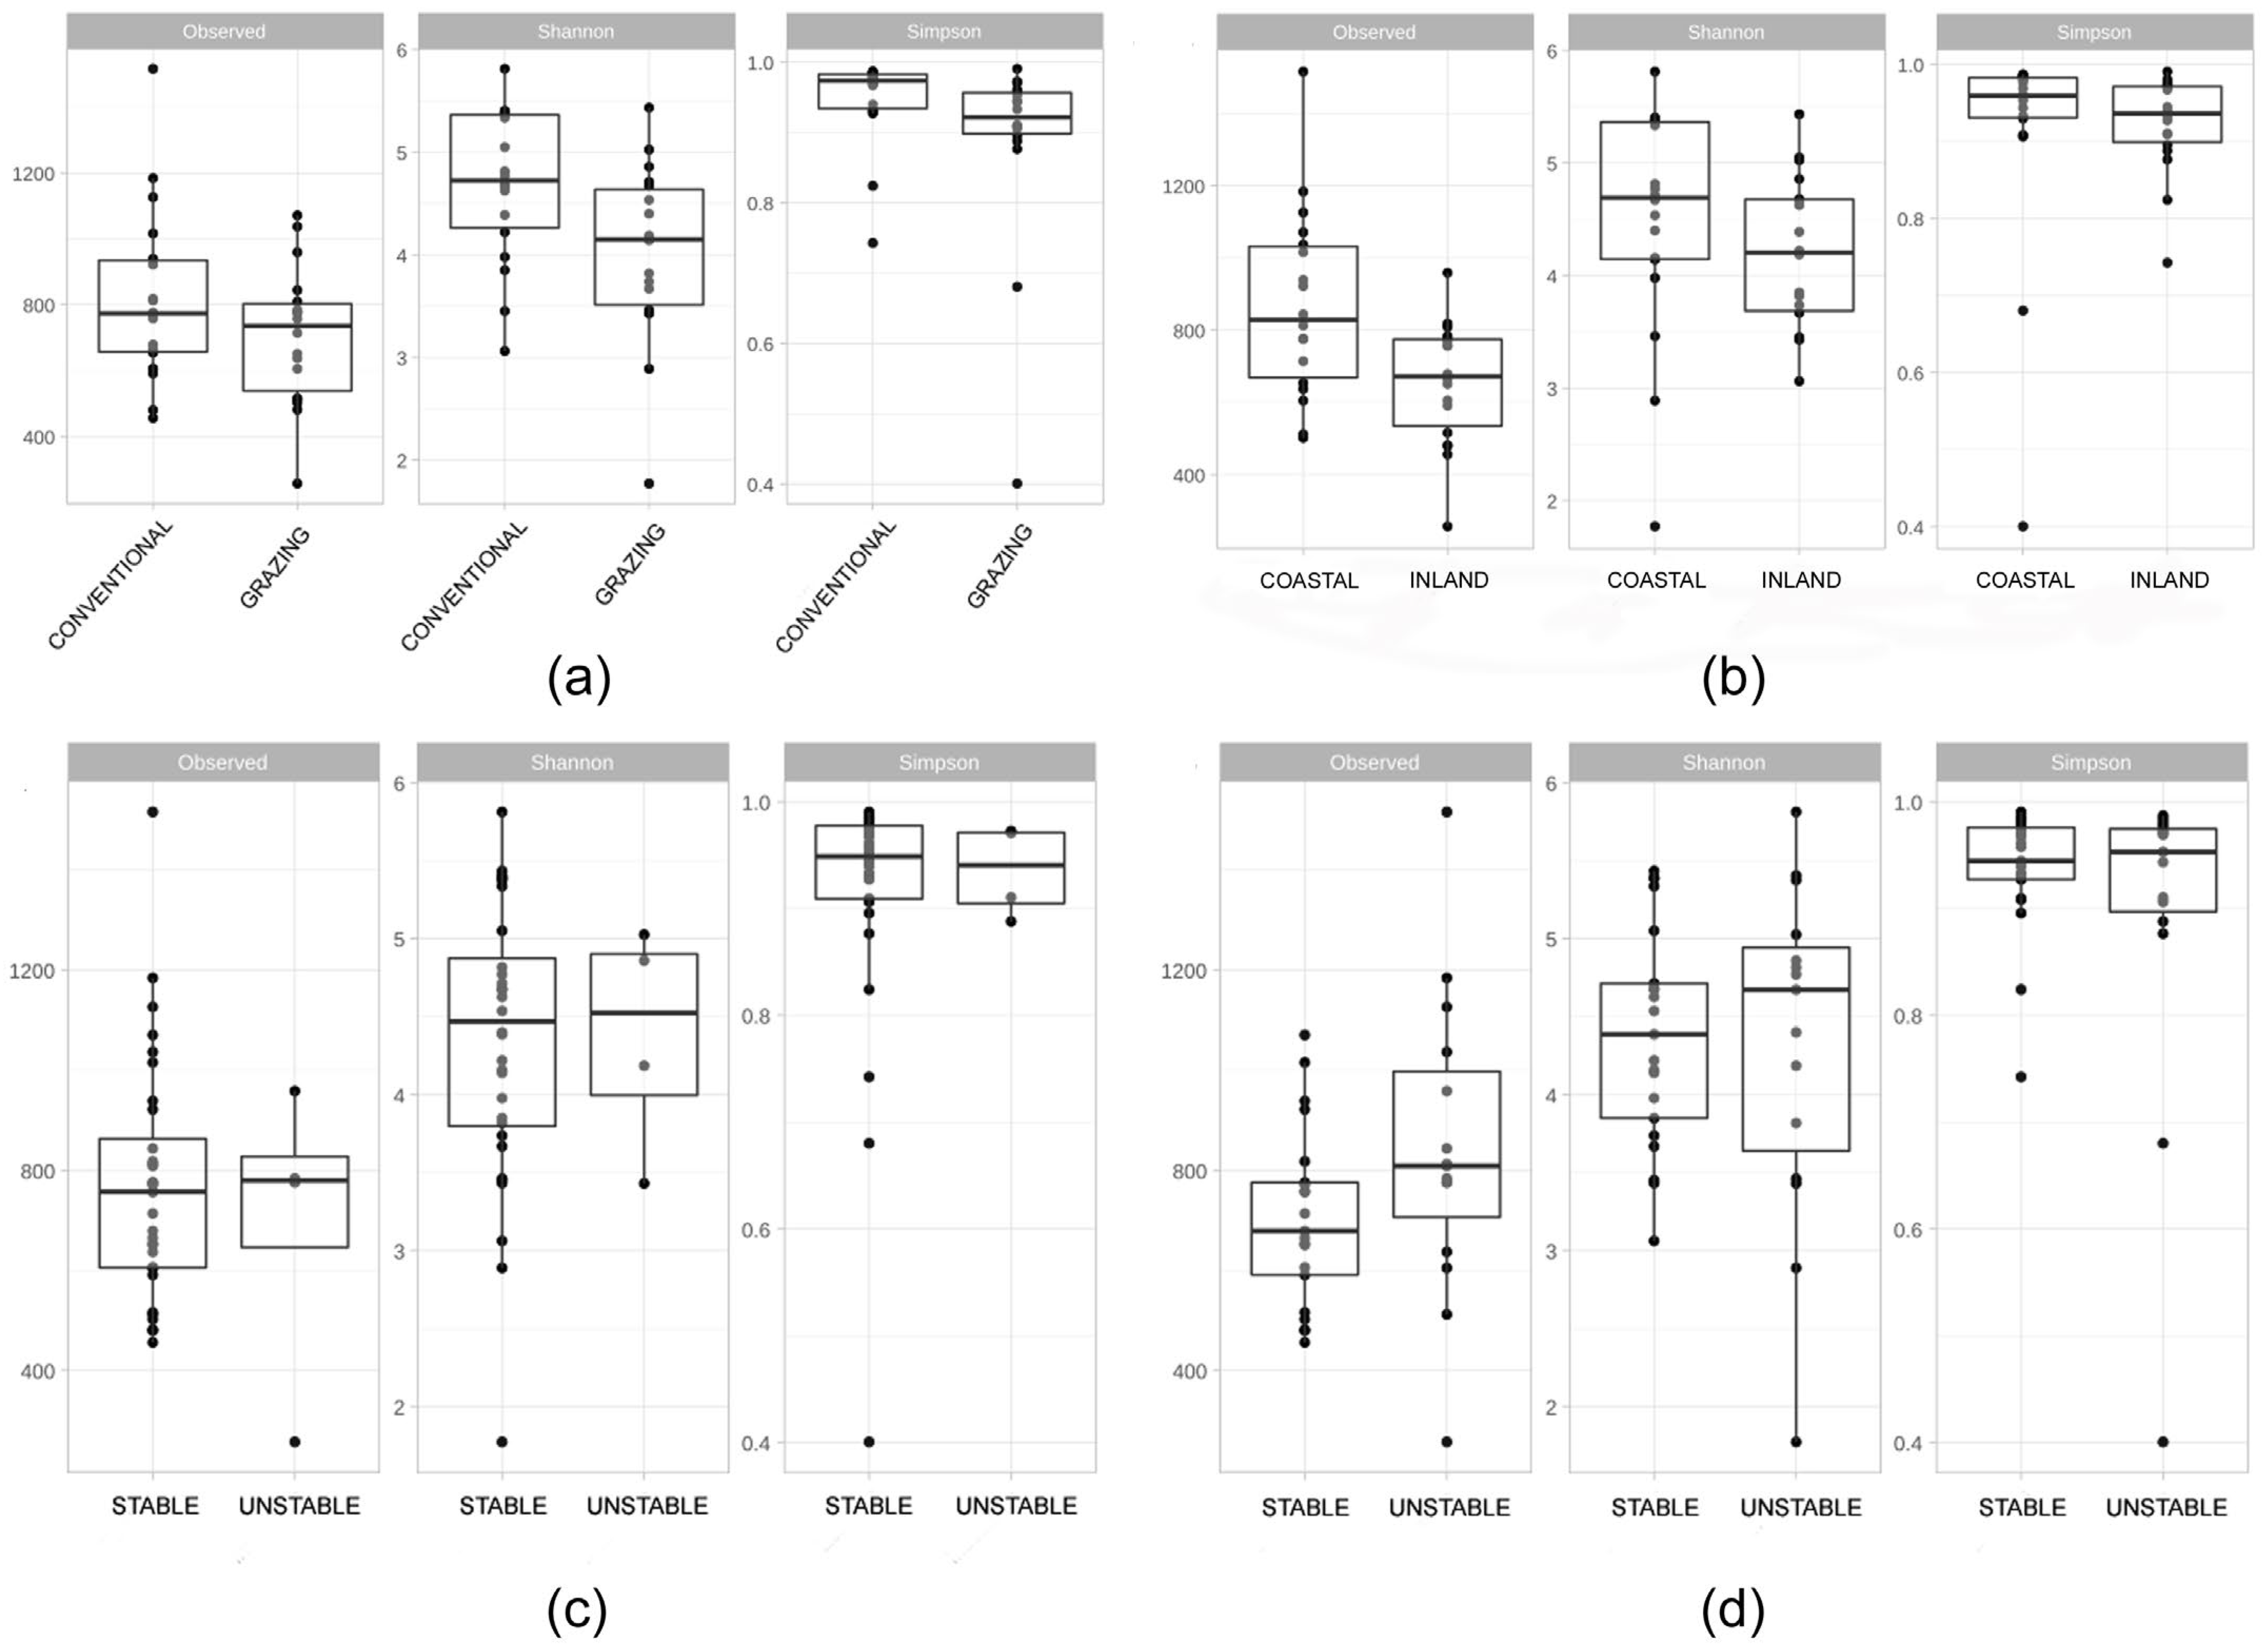
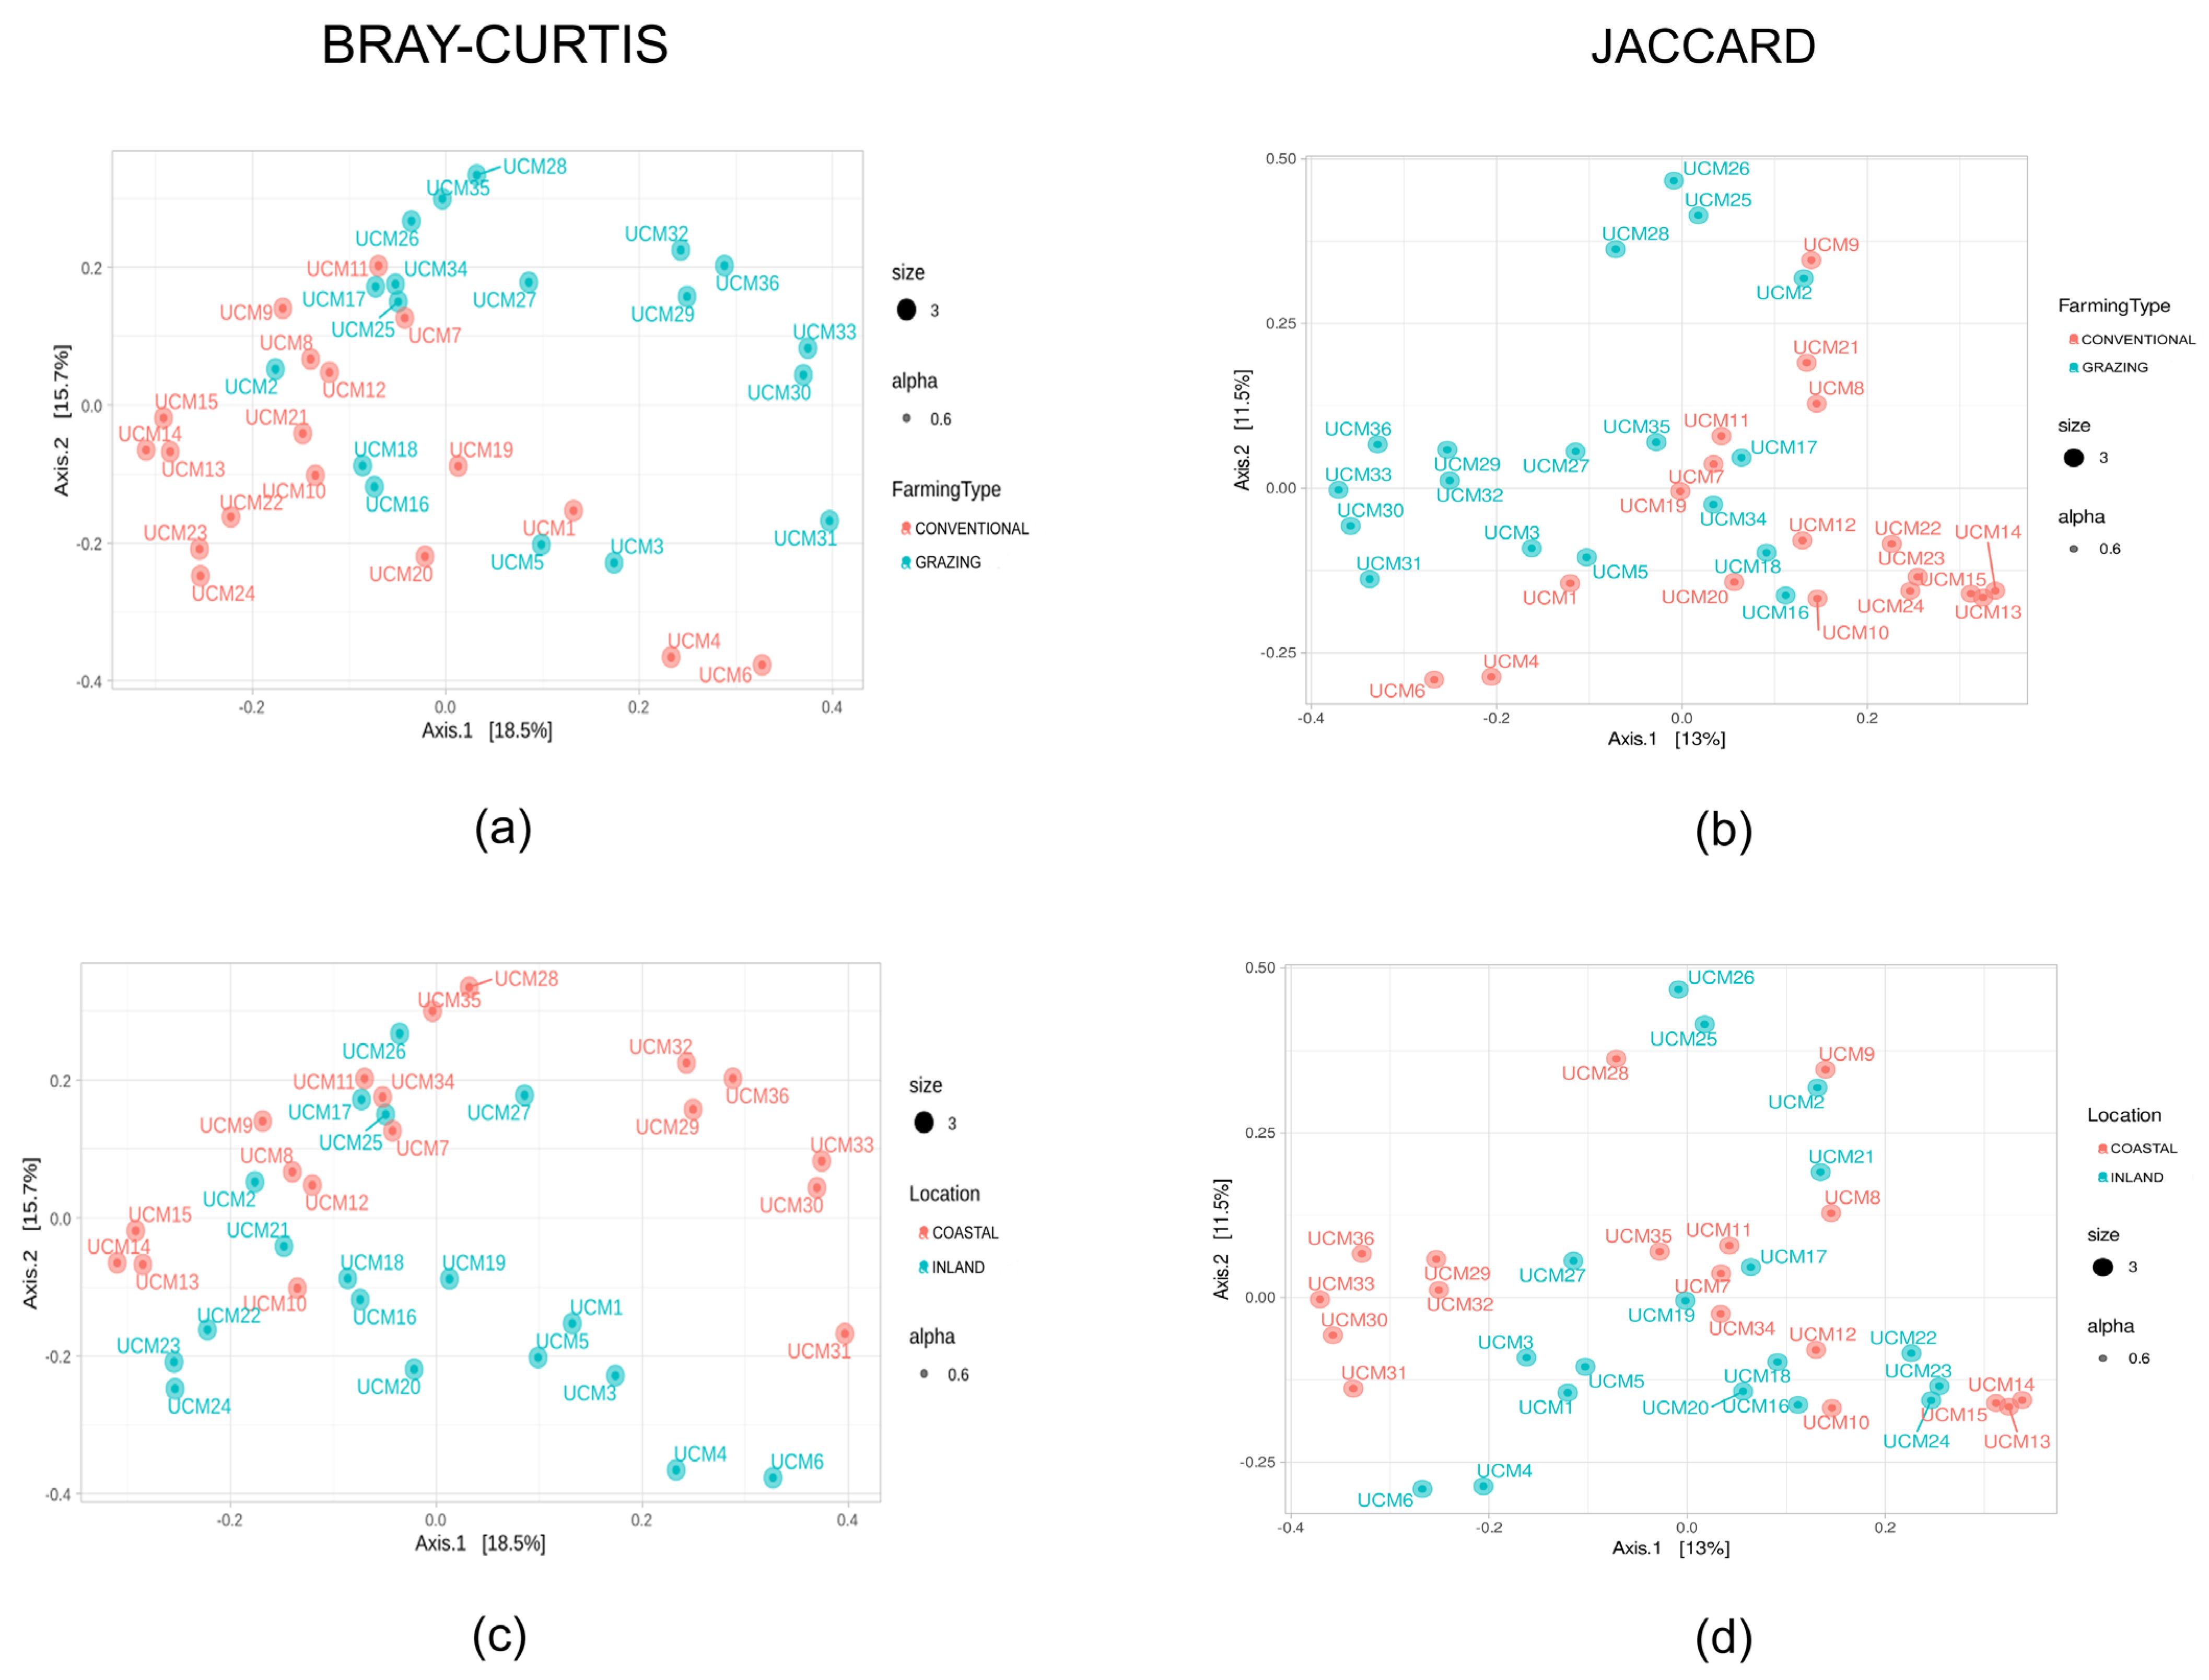
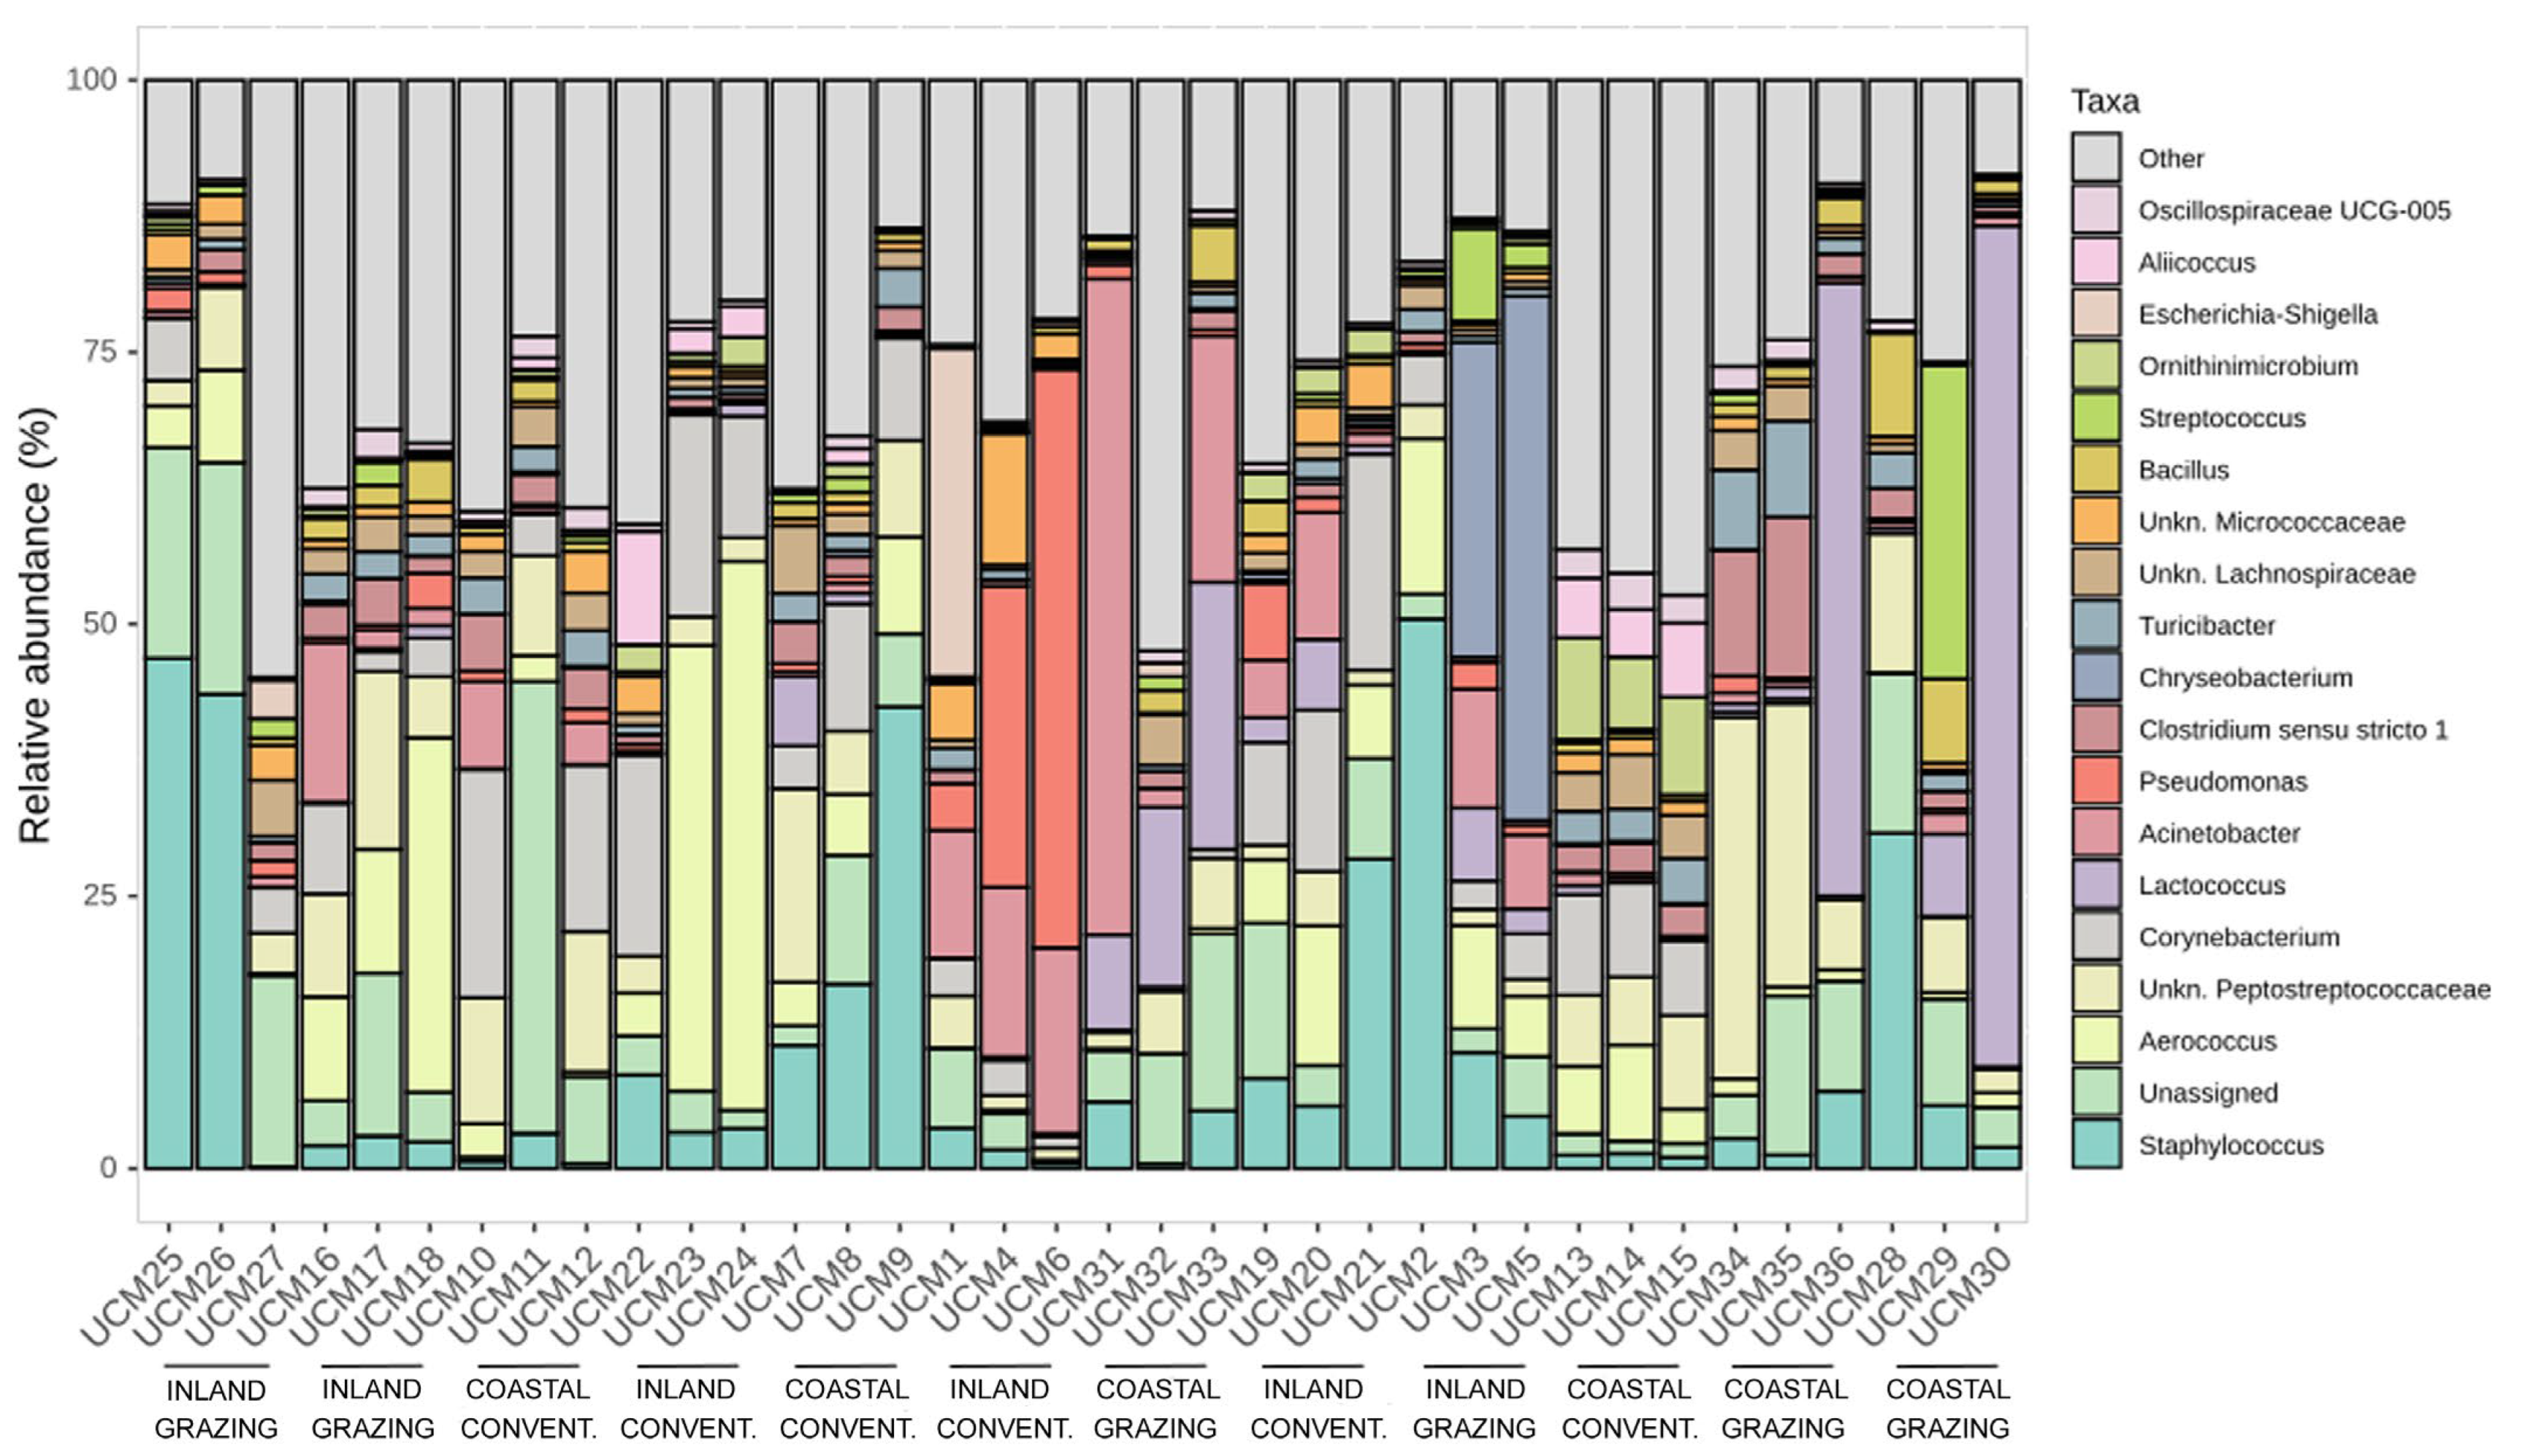
3.2. Metataxonomic Analysis

In this study, we sequenced the hypervariable region V3-V4 of gene 16S of the ribosomal RNA to investigate the bacterial diversity in 36 raw cow’s milk samples, consisting of 18 from conventional feeding and 18 from grazing-based feeding regimens, with 9 samples from inland locations and 9 from coastal areas in both cases. After quality filtering, denoising, paired-end joining, and chimera filtering, we obtained a total of 3,917,499 high-quality reads across all 36 samples (median/sample 108,819 (SD 27,619)), which were assigned to 1258 ASVs (with 99.9% similarity), of 470 bp of amplicon length. Rarefaction analysis indicated that the sequencing depth was sufficient to capture the full microbial diversity present in the samples (Figure S2 of the Supplementary Materials). The reads were classified into 49 phyla (48 from bacteria and 1 from archaea), 143 classes (134 from bacteria and 9 from archaea), 318 orders (309 from bacteria and 9 from archaea), 572 families (559 from bacteria and 13 from archaea), 909 genera (893 from bacteria and 16 from archaea), and 349 unidentified ASVs, accounting for 27.7% of the total. The analysis of the alpha diversity at the ASV level of the samples grouped by livestock showed richness and variable Shannon and Simpson indices (Figure S3 of the Supplementary Materials). Nevertheless, there were no intergroup differences in terms of richness, Simpson index, or Shannon index (p > 0.05 in all cases). The samples grouped according to feeding regimen (Figure 1a) showed no statistically significant differences in the Wilcoxon Rank Sum test, nor did those grouped by location (Figure 1b), stability in 70° ethanol (Figure 1c), or stability in 80° ethanol (Figure 1d).
To evaluate the similarity in bacterial composition among the samples and thereby explore the relationships between bacterial communities, we performed a PCoA at the different levels. Firstly, the samples belonging to the same livestock were observed to be grouped with each other, indicating a similar microbial composition (Figure S4 of the Supplementary Materials). The PERMANOVA test showed statistically significant differences in microbiota between the various livestock farms (p < 0.001). In terms of the differences between samples according to feeding regimen, there was a grouping among the samples of the same type (Figure 2a); i.e., the microbial composition was more similar among the samples obtained from animals with the same feeding regimen (conventional or grazing). The PERMANOVA test corroborated the differences in microbiota, with statistically significant differences between the samples corresponding to the conventional and grazing feeding regimens (p < 0.001 by the Bray–Curtis distance and Jaccard distance). Additionally, there was a grouping tendency for the samples according to the herd’s geographical location (coastal vs. inland) (Figure 2b), with statistical significance with the PERMANOVA test (p < 0.001 by the Bray–Curtis distance and Jaccard distance). No statistically significant differences in the composition due to stability either in 70° or 80° ethanol (p > 0.05 in all cases).
The study of the bacterial profiles indicated that the samples, at the phylum level, were dominated by members of the Firmicutes phylum and, to a lesser extent, Actinobacteriota and Proteobacteriota. The taxonomic distribution at the phylum level of the samples grouped according to each variable can be seen in Figures S5–S8 of the Supplementary Materials.
At the genus level, we confirmed the considerable diversity of genera among the samples (Figure 3). Staphylococcus was one of the most abundant genera in general, along with others such as Aerococcus, Peptostreptococcaceae, Corynebacterium, Lactococcus, Acinetobacter, Pseudomonas, Chryseobacterium, and Streptococcus.
In terms of the differential abundance analysis performed at the phylum, genus and ASV level (Figures S11 and S12 of the Supplementary Materials), we discovered that, when comparing by feeding regimen (conventional vs. grazing), three phyla presented a significantly greater abundance in the samples from conventional feeding (Actinobacteriota, Euryarchaeota and Deinococcota; p-value < 0.001 in all cases). Moreover, 29 genera had statistically significant differences in their abundance (p < 0.005 in all cases). Of these, a total of 6 genera were more present in the samples from grazing than from conventional feeding (such as Lactococcus, Streptococcus, and Bacillus), while 23 genera were more present in the conventional feeding regimen, including Enteractinococcus, Fermentimonas, and Enterococcus.
With regard to the geographical location (inland vs. coastal), no phyla were detected with statistically differential abundance (p-value > 0.05 in all cases). Of the total of 14 genera with significant differences in their abundance (p-value < 0.01 in all cases), 9 genera were more present in the inland herd samples than in the coastal herd samples, mainly Aerococcus, Acinetobacter, Pseudomonas, Escherichia-Shigella, and Enterococcus, while 5 genera were more present in the coastal herd samples, including Lactococcus and Clostridium sensu stricto 1.
Lastly, taking into account the samples’ thermal stability when comparing the stable versus unstable samples in 70° ethanol, only one phylum (Halanaerobiaeota) showed a significant increase (p < 0.001) in its abundance in the stable samples in 70° ethanol, which was reflected in the significant abundance of the genus Halocella in these samples. A total of nine genera were more present in the stable samples than in the unstable samples (including Facklamia, Ignavigranum, and Klebsiella). No genus was more abundant in the unstable samples (p-value > 0.05 in all cases). In terms of the stable versus unstable milk samples in 80° ethanol, two phyla were significantly more abundant in the stable samples in 80° ethanol: Bacteroidota (p-value < 0.001) and Deinococcota (p-value = 0.001). Of the total of 18 genera that presented significant differences in their abundance (p-value < 0.005 in all cases), a total of 3 genera were more present in the unstable samples (Proteiniclasticum, Propionimicrobium, and Clostridium sensu stricto 1), while 15 genera were more present in the stable samples (including Pseudomonas, Enterococcus, and Truepera) (Figures S9–S12 of the Supplementary Materials).

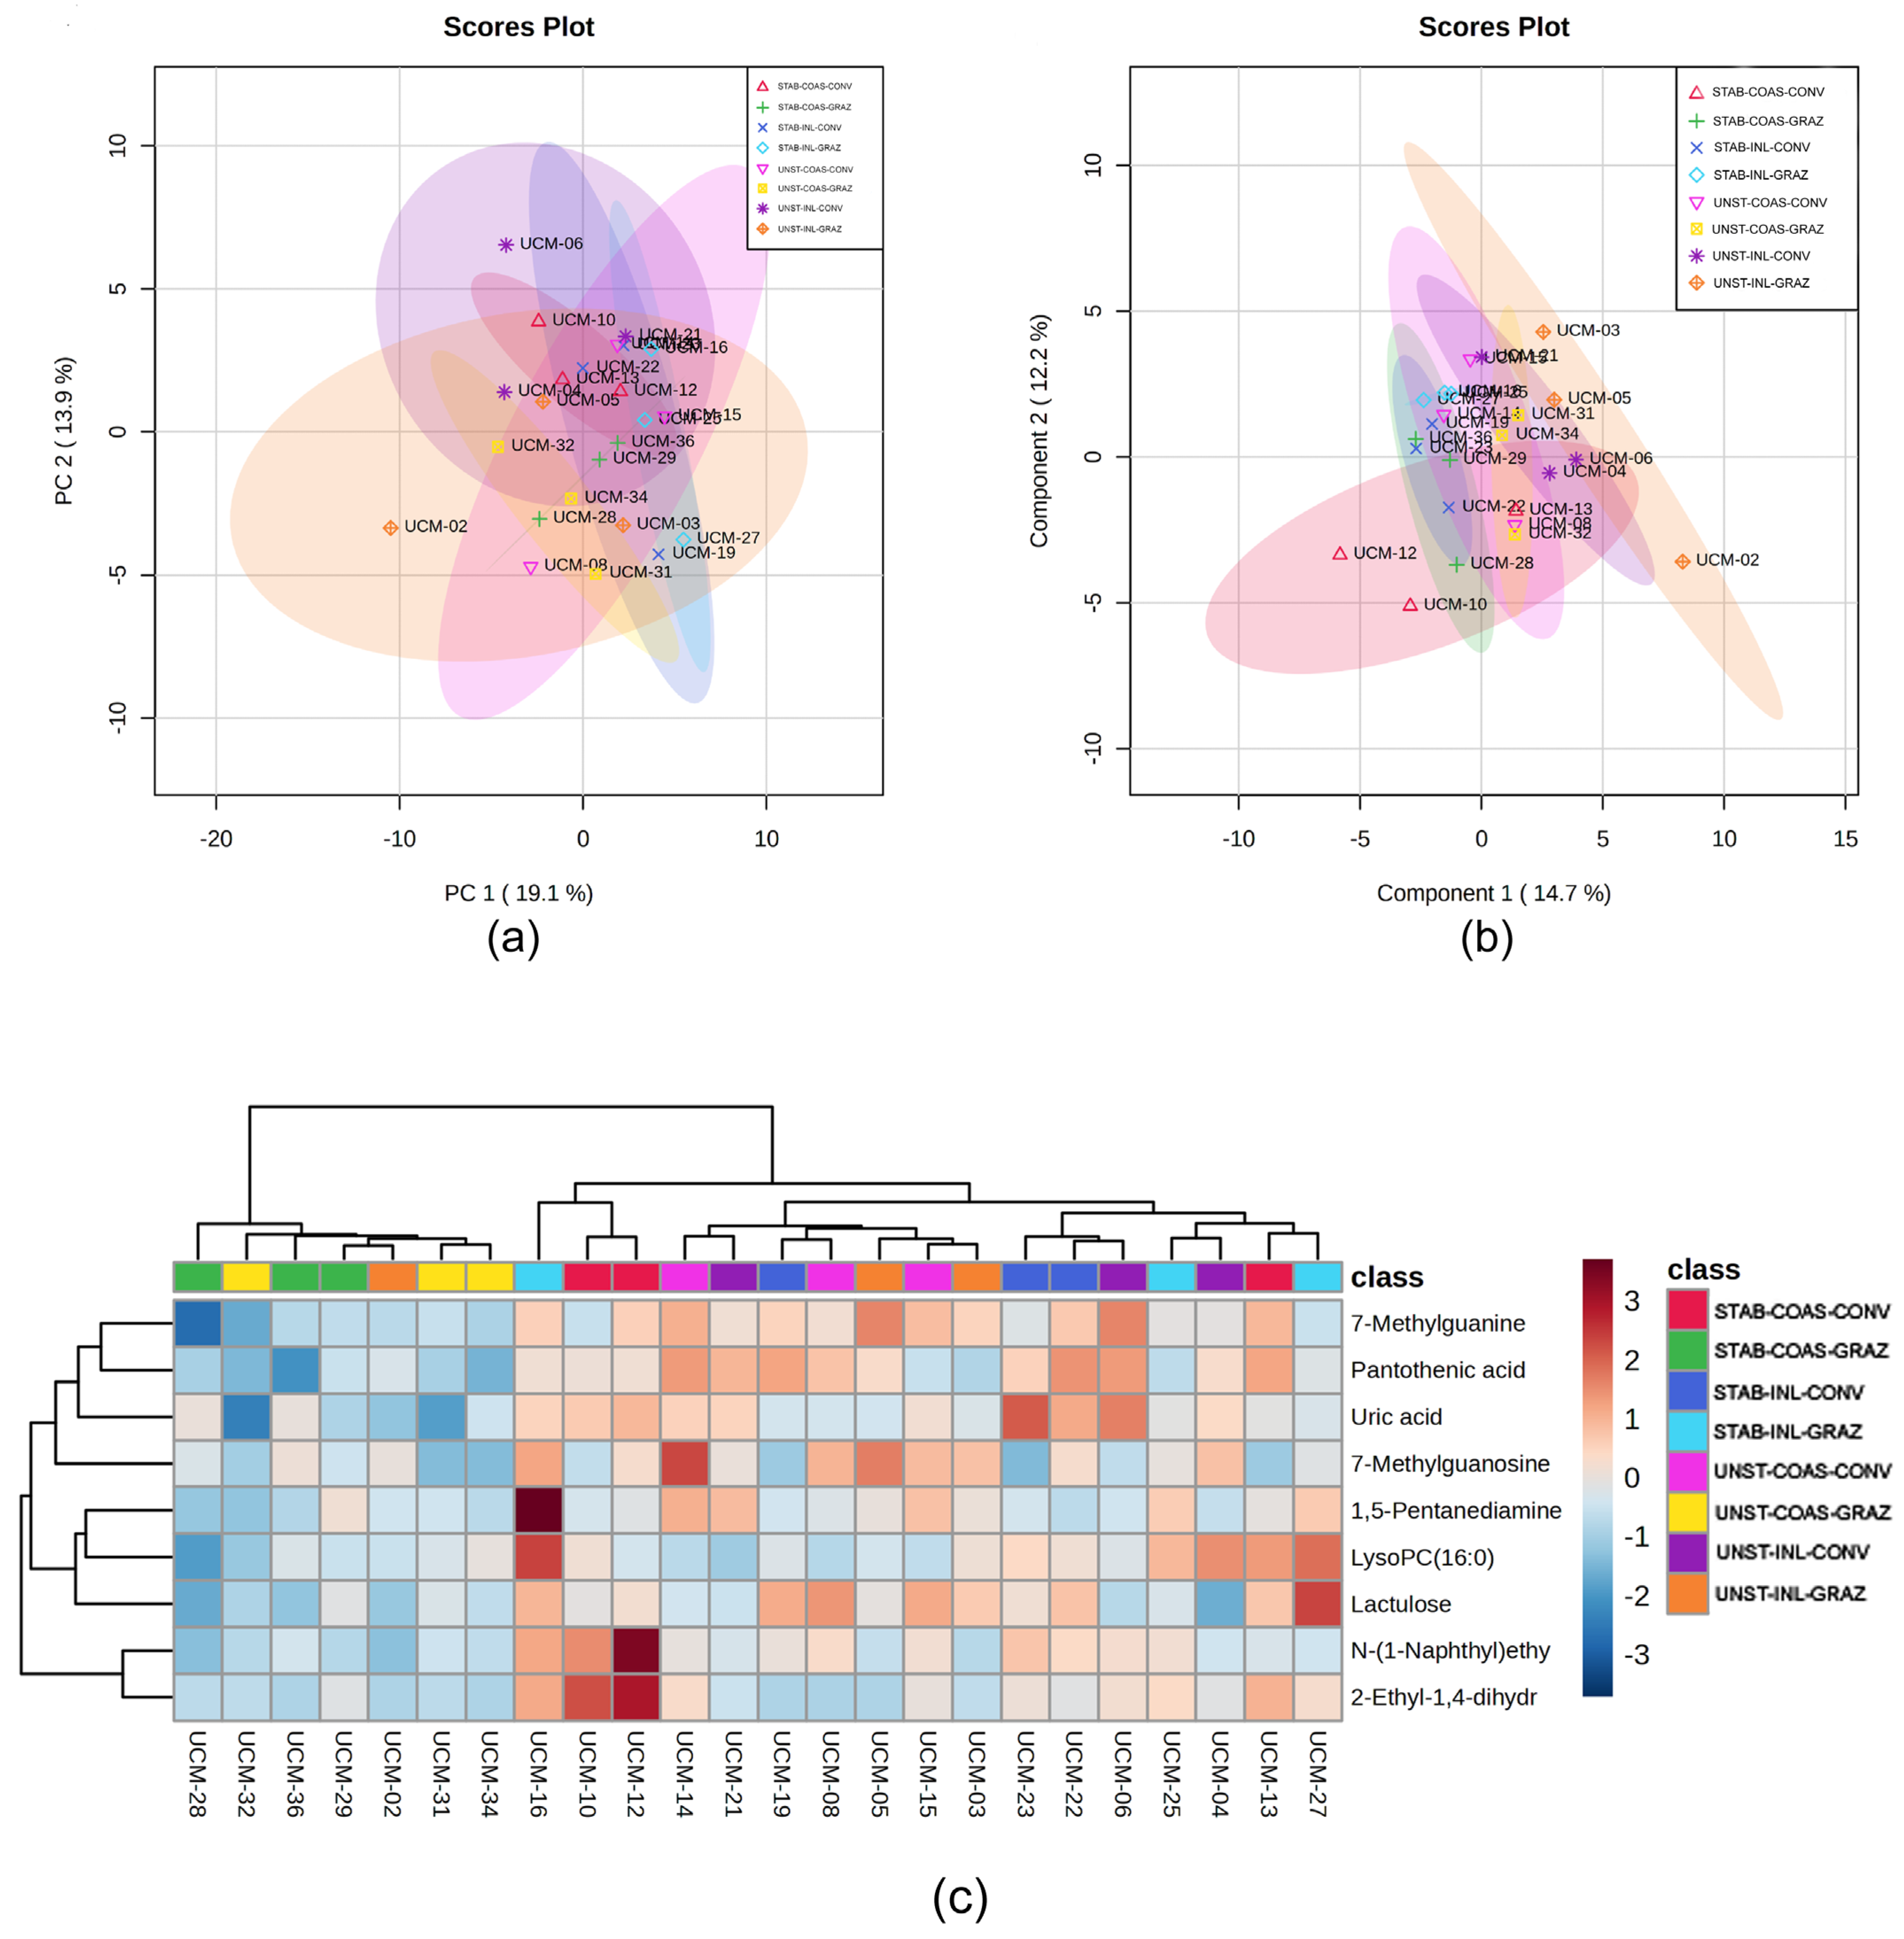
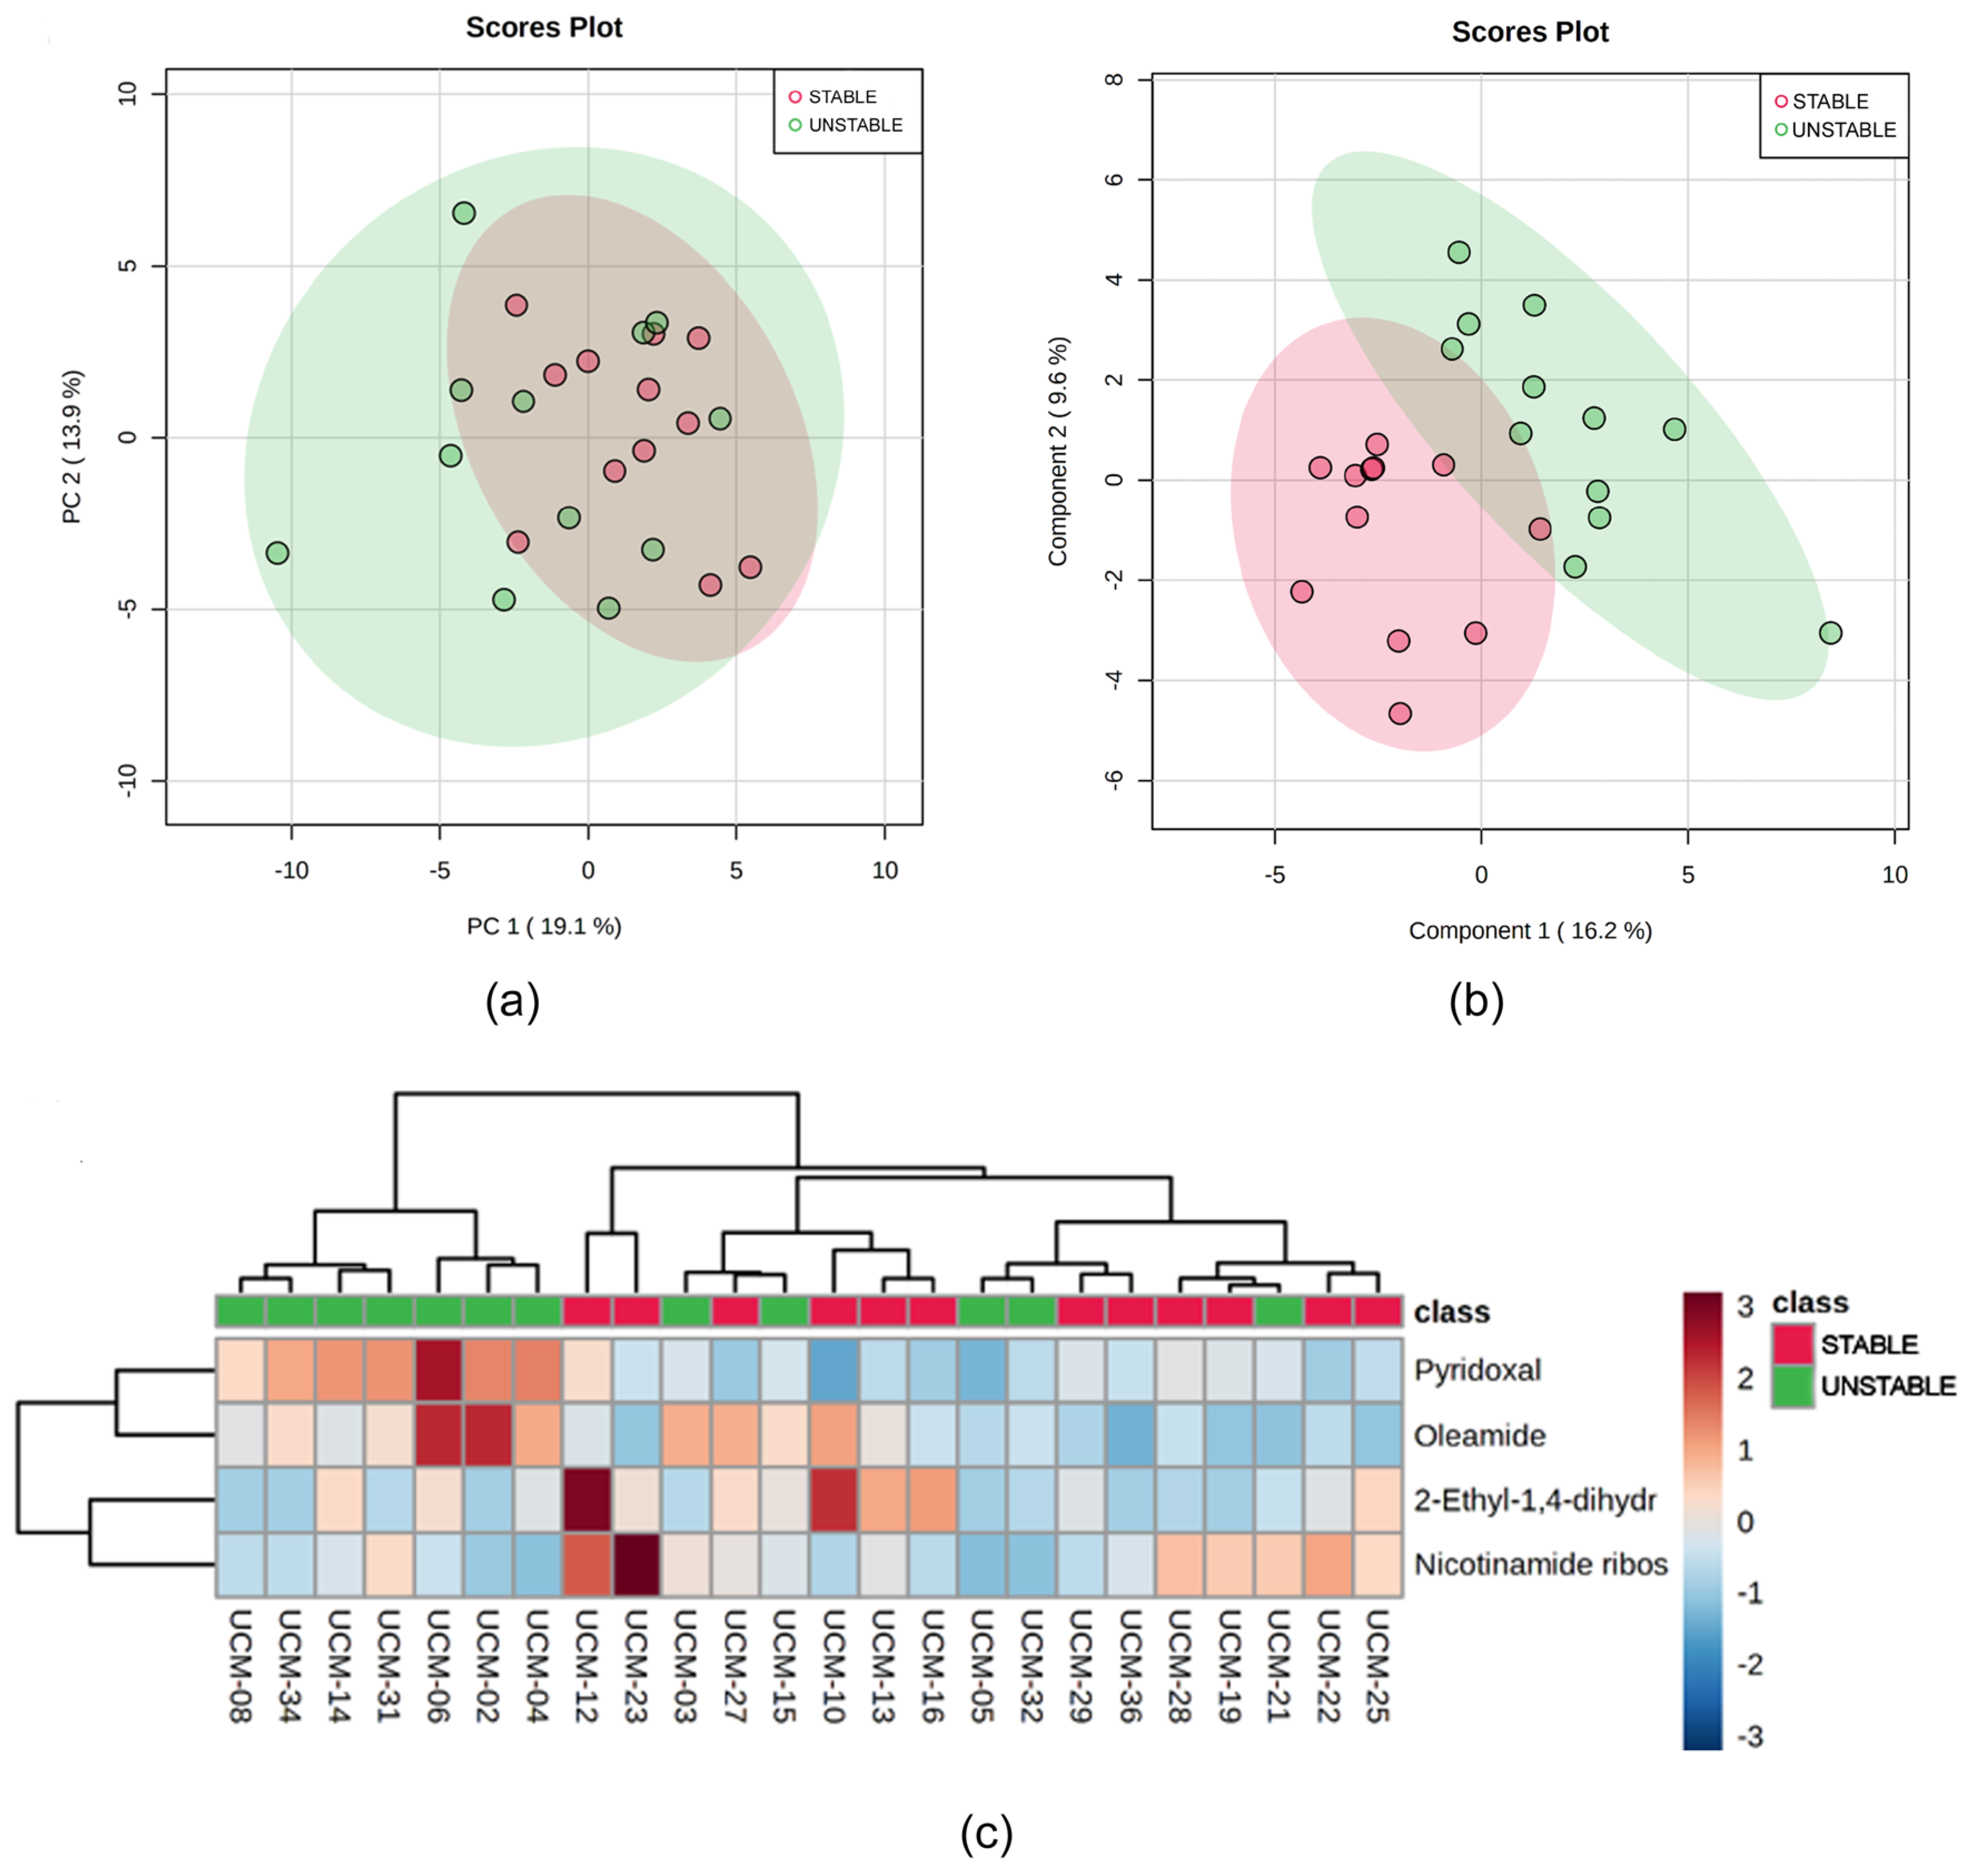
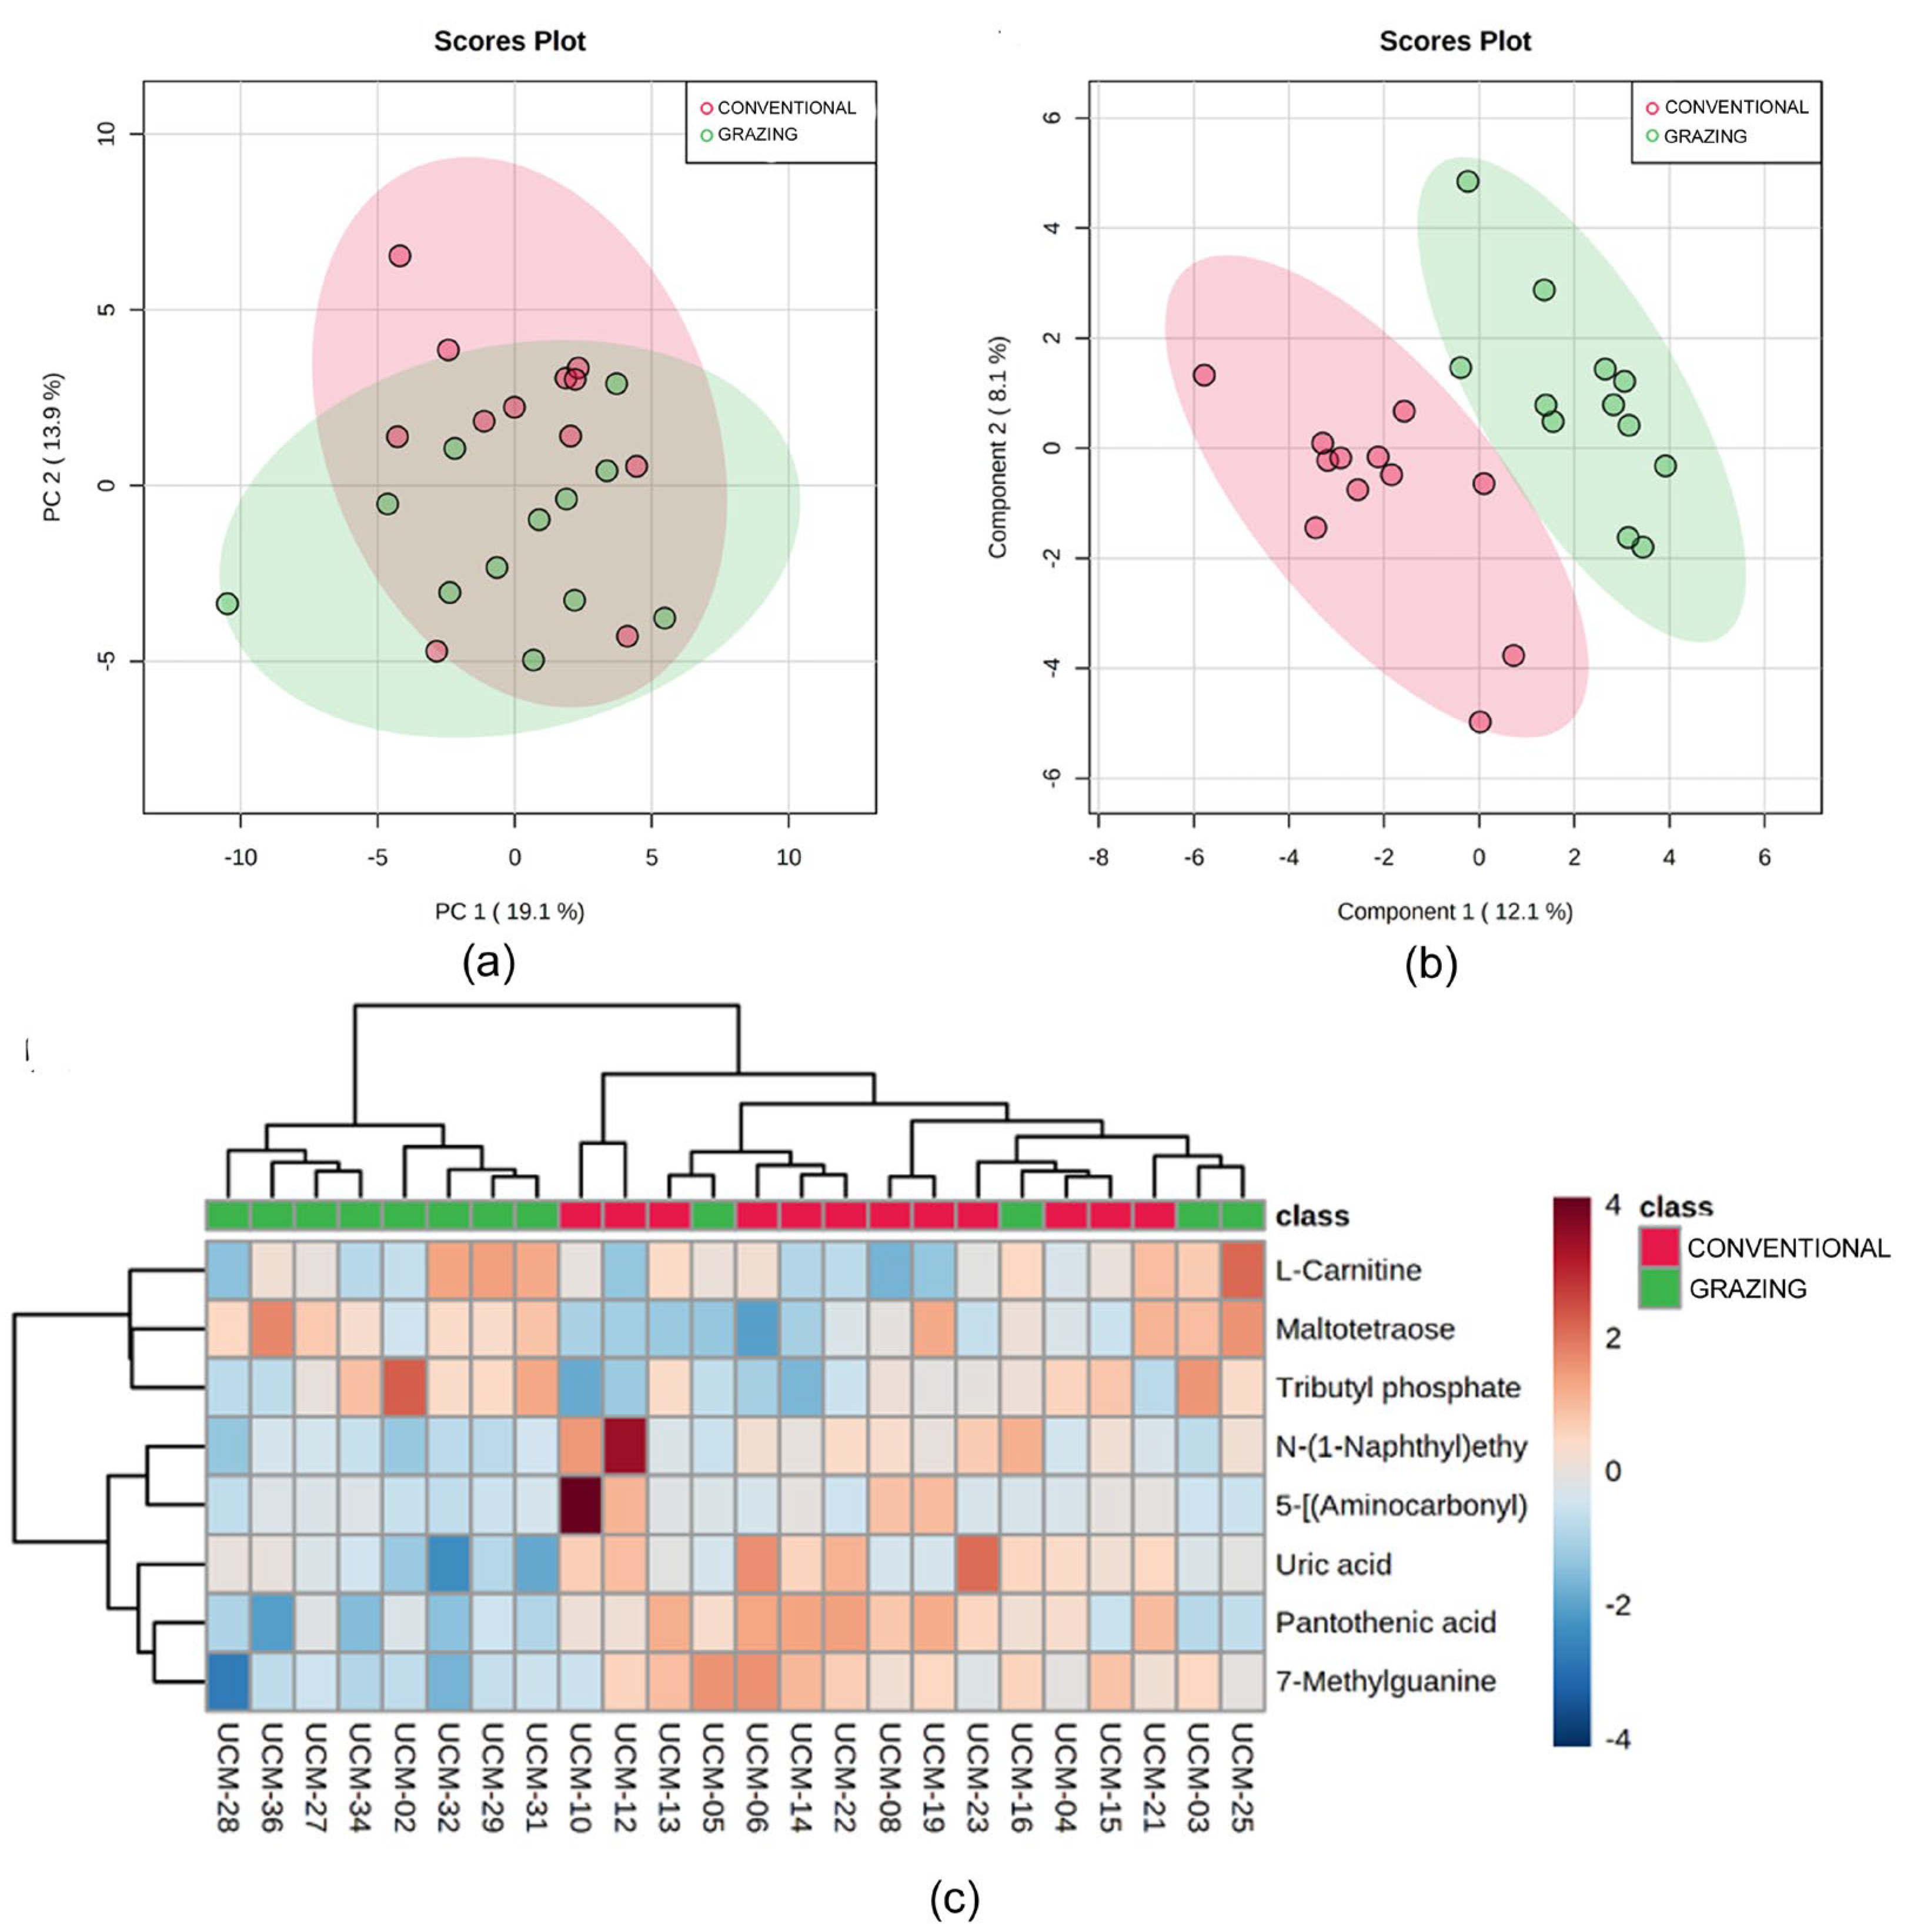
3.3. Metabolomic Analysis

In total, 70 metabolites were tentatively identified, all of them present in the 24 analyzed samples (Table 3). Signals attributed to environmental contaminants or background compounds are not included in the table, as they do not reflect the actual sample (these signals are described in more detail later in the text).
Overall, the study revealed a wide variety of metabolites, results based on the experimental conditions applied, and using the Milk Composition Database (MCDB), supplemented with various databases (NIST, MoNA, and LipidBlast). These latter databases employed to tentatively identify the metabolites are not specific for cow’s milk samples and contain all types of metabolites. Therefore, metabolites could be identified that are difficult to find in these types of samples. Furthermore, signals attributed to environmental contaminants or background compounds—such as residues from laboratory reagents, plastics, or cleaning agents—may also be present (Omeprazole N-oxide, Dikegulac acid, (3-Carboxypropyl)trimethylammonium cation, Benzyldimethyltetradecylammonium cation, Dimethylditetradecylammonium cation, and Dihexadecyldimethylammonium cation). It is also important to note that these databases are continuously being updated, and the compound annotation could vary, and more compounds would be identified in the future.
The large number of metabolites obtained through the use of untargeted metabolomics indicates the complexity of the feeding matrix under investigation. In particular, a large number of isomeric forms of lipids have been observed, mainly acyl lipids, glycerolipids, glycerophospholipids, lysophospholipids, and triglycerides (Table 3). Of note are carnitine, isovalerylcarnitine, butyrylcarnitine, and propionylcarnitine, as well as the glycerophospholipids PC(16:0_18:1), PC(18:1_14:0), PC(18:1_16:0), and PC(18:1_18:1), saturated fatty acids such as the derivatives of palmitic and stearic acid, and the only unsaturated fatty acid present in considerable quantity in cow’s milk, oleic acid.
Also of note are the carbohydrates, including lactose (identified as beta-lactose and its isomer lactulose), the predominant carbohydrate in milk, and the oligosaccharides ganglioside asialo-GM2 and maltotetraose.
Vitamins are represented by the water-soluble vitamins riboflavin (vitamin B2), nicotinamide riboside (the alternate form of vitamin B3 [niacin]), pantothenic acid (vitamin B5) and certain derivatives, as well as by 4-pyridoxic acid and pyridoxal, corresponding to vitamin B6. Additionally, the liposoluble vitamin K has been detected (which corresponds to the metabolite 2-ethyl-1,4-dihydroquinolin-4-one) (Table 3).
Oligopeptides, peptides, amino acids and derivatives, steroid derivatives, and secondary metabolites such as polyphenols have also been found (Table 3). Among the amino acids, essential amino acids such as tryptophan and isoleucine, as well as the non-essential amino acid glutamic acid, have been identified. In addition, peptides and derivatives, such as beta-Ala-Phe and D-alanyl-D-alanine, have been detected. Within the group of polyphenols and steroids, we identified 2.6-di-tert-butyl-4-(4-morpholinylmethyl) phenol and DL-octopamine.
Other noteworthy metabolites detected in the composition of the analyzed milk samples are choline, phosphocholine and glycerophosphocholine, as well as amines such as 1,2-Diamino-2-methylpropane, 1.5-Pentanediamine and n-Octadecylamine, the nucleotides, nucleosides and their derivatives including 2′-deoxycytidine, 7-Methylguanosine, adenosine and adenosine 3′,5′-cyclic monophosphate (cAMP) and N6-Me-Adenosine, cytidine, purines, including uric acid and uridine, the metabolite 5-[(Aminocarbonyl)amino] pentanoic acid or valeric acid, N-(1-Naphthyl) ethylenediamine and tributyl phosphate (Table 3).
A principal component analysis (PCA) was performed according to the various study variables, stability in 80° ethanol, location of the livestock farm (coastal vs. inland), and feeding regimen applied (stabling in conventional farms or grazing). The analysis of all samples revealed a lack of association between the samples from the various groups (the diagrams represent the 95% confidence intervals for each group) (Figure 4a). A supervised multivariate analysis (PSL-DA) was then performed, which identified the metabolites that best separated the various groups of samples (Figure 4b). A correlation analysis of the metabolites’ intensity was also conducted (Figure S13 of the Supplementary Materials), as well as a classification of the samples using a heatmap (Figure S14 of the Supplementary Materials). An ANOVA was subsequently performed, thereby indicating those metabolites that were statistically different among the various groups of samples. Considering an FDR < 0.05, only 2 metabolites (2-Ethyl-1,4-dihydroquinolin-4-one and pantothenic acid) were identified. Given the small size of this number, we also considered the p-value < 0.05 without an FDR adjustment, obtaining in this case 9 metabolites (2-Ethyl-1,4-dihydroquinolin-4-one, pantothenic acid, 7-Methylguanosine, Uric acid, LPC (16:0), N-(1-Naphthyl)ethylenediamine, Lactulose, 1,5-Pentanediamine and 7-Methylguanine) (Figure S15 of the Supplementary Materials). Using these metabolites, we classified the samples using a heatmap (Figure 4c).
When we compared the metabolites according to their thermal stability (samples grouped into stable vs. unstable), the PCA revealed no separation of the groups (Figure 5a). However, when we performed the PLS-DA to investigate and assess the contribution of each metabolite group in the milk for discrimination purposes, there was a separation of groups (Figure 5b), with the metabolites pyridoxal, 2-Ethyl-1,4-dihydroquinolin-4-one, nicotinamide riboside cation and oleamide presenting the greatest VIP (Figure S16 of the Supplementary Materials). Furthermore, the t-test showed that these four metabolites were the only ones that had a p-value < 0.05, but did not allow the clear separation of the samples (Figure S17 of the Supplementary Materials). The heatmap showed two main groups: the first hierarchical cluster represents the metabolomic profile of the unstable samples, which encompasses most samples with this characteristic, while the second cluster includes all stable samples and a number of unstable samples, which indicates their similar composition. In the heatmap, however, the unstable samples share a cluster in which the oleamide and pyridoxal metabolites are most abundant when compared with the stable milk samples, confirming the statistically significant differences observed in these samples (Figure 5c).
Taking into account the herds’ geographical location (inland or coastal), the PCA with the two groups of samples showed no separation of the groups (Figure 6a). The PLS-DA, however, did suggest a clear separation of the two groups (Figure 6b), with the glycerophospholipids LPC (16:0) and LPC (8:0), glycerophosphocholine, (R)-butyrylcarnitine, and adenosine 3′,5′-cyclic monophosphate (cAMP), an important nucleotide in numerous biological reactions, presenting the highest VIP and best characterizing the two groups of samples (Figure S18 of the Supplementary Materials). The t-test showed that these five metabolites were the only ones with a p-value < 0.05 (Figure S19 of the Supplementary Materials). In this case, the heatmap showed that the samples were not clearly separated into different clusters as in the previous case, although one of the branches that encompasses only the samples from coastal farms did appear (Figure 6c), which showed a lower abundance of the glycerophospholipids LPC (16:0) and (8:0-SN1), of glycerophosphocholine and of cAMP than the samples from inland farms and a greater abundance of butyrylcarnitine than those from inland farms.
Lastly, the PCA according to feeding regimen (conventional vs. grazing), as with the previous cases, showed no separation of the groups (Figure 7a). However, the PLS-DA did show a separation of the groups (Figure 7b), with the metabolites pantothenic acid, uric acid, N-(1-Naphthyl)ethylenediamine, maltotetraose, 7-Methylguanine, Tributyl phosphate, 5-[(Aminocarbonyl)amino]pentanoic acid and L-Carnitine showing the highest VIP (Figure S20 of the Supplementary Materials). Furthermore, the t-test showed that these eight metabolites were the only ones with a p-value < 0.05 (Figure S21 of the Supplementary Materials). This finding confirmed that observed in the heatmap (Figure 7c), in which we can observe two main groups: the first hierarchical cluster represents the metabolomic profile of the grazing samples, which encompasses most samples of this feeding regimen, while the second cluster includes all samples from animals from conventional farms and a number of grazing animals, which indicates their similar composition. It is noteworthy that in the heatmap of the grazing samples share a cluster in which pantothenic acid, uric acid, N-(1-Naphthyl)ethylendiamine, 7-Methylguanosine, 5-[(Aminocarbonyl)amino] pentanoic acid, or valeric acid are less abundant when compared with milk samples from conventional farms, confirming the statistically significant differences observed in these samples. In contrast, the grazing samples presented a significant abundance of maltotetraose, tributyl phosphate, and carnitine. These results show clear differences between the milk samples when considering their metabolomic profile, probably due to the differing feeding regimens.

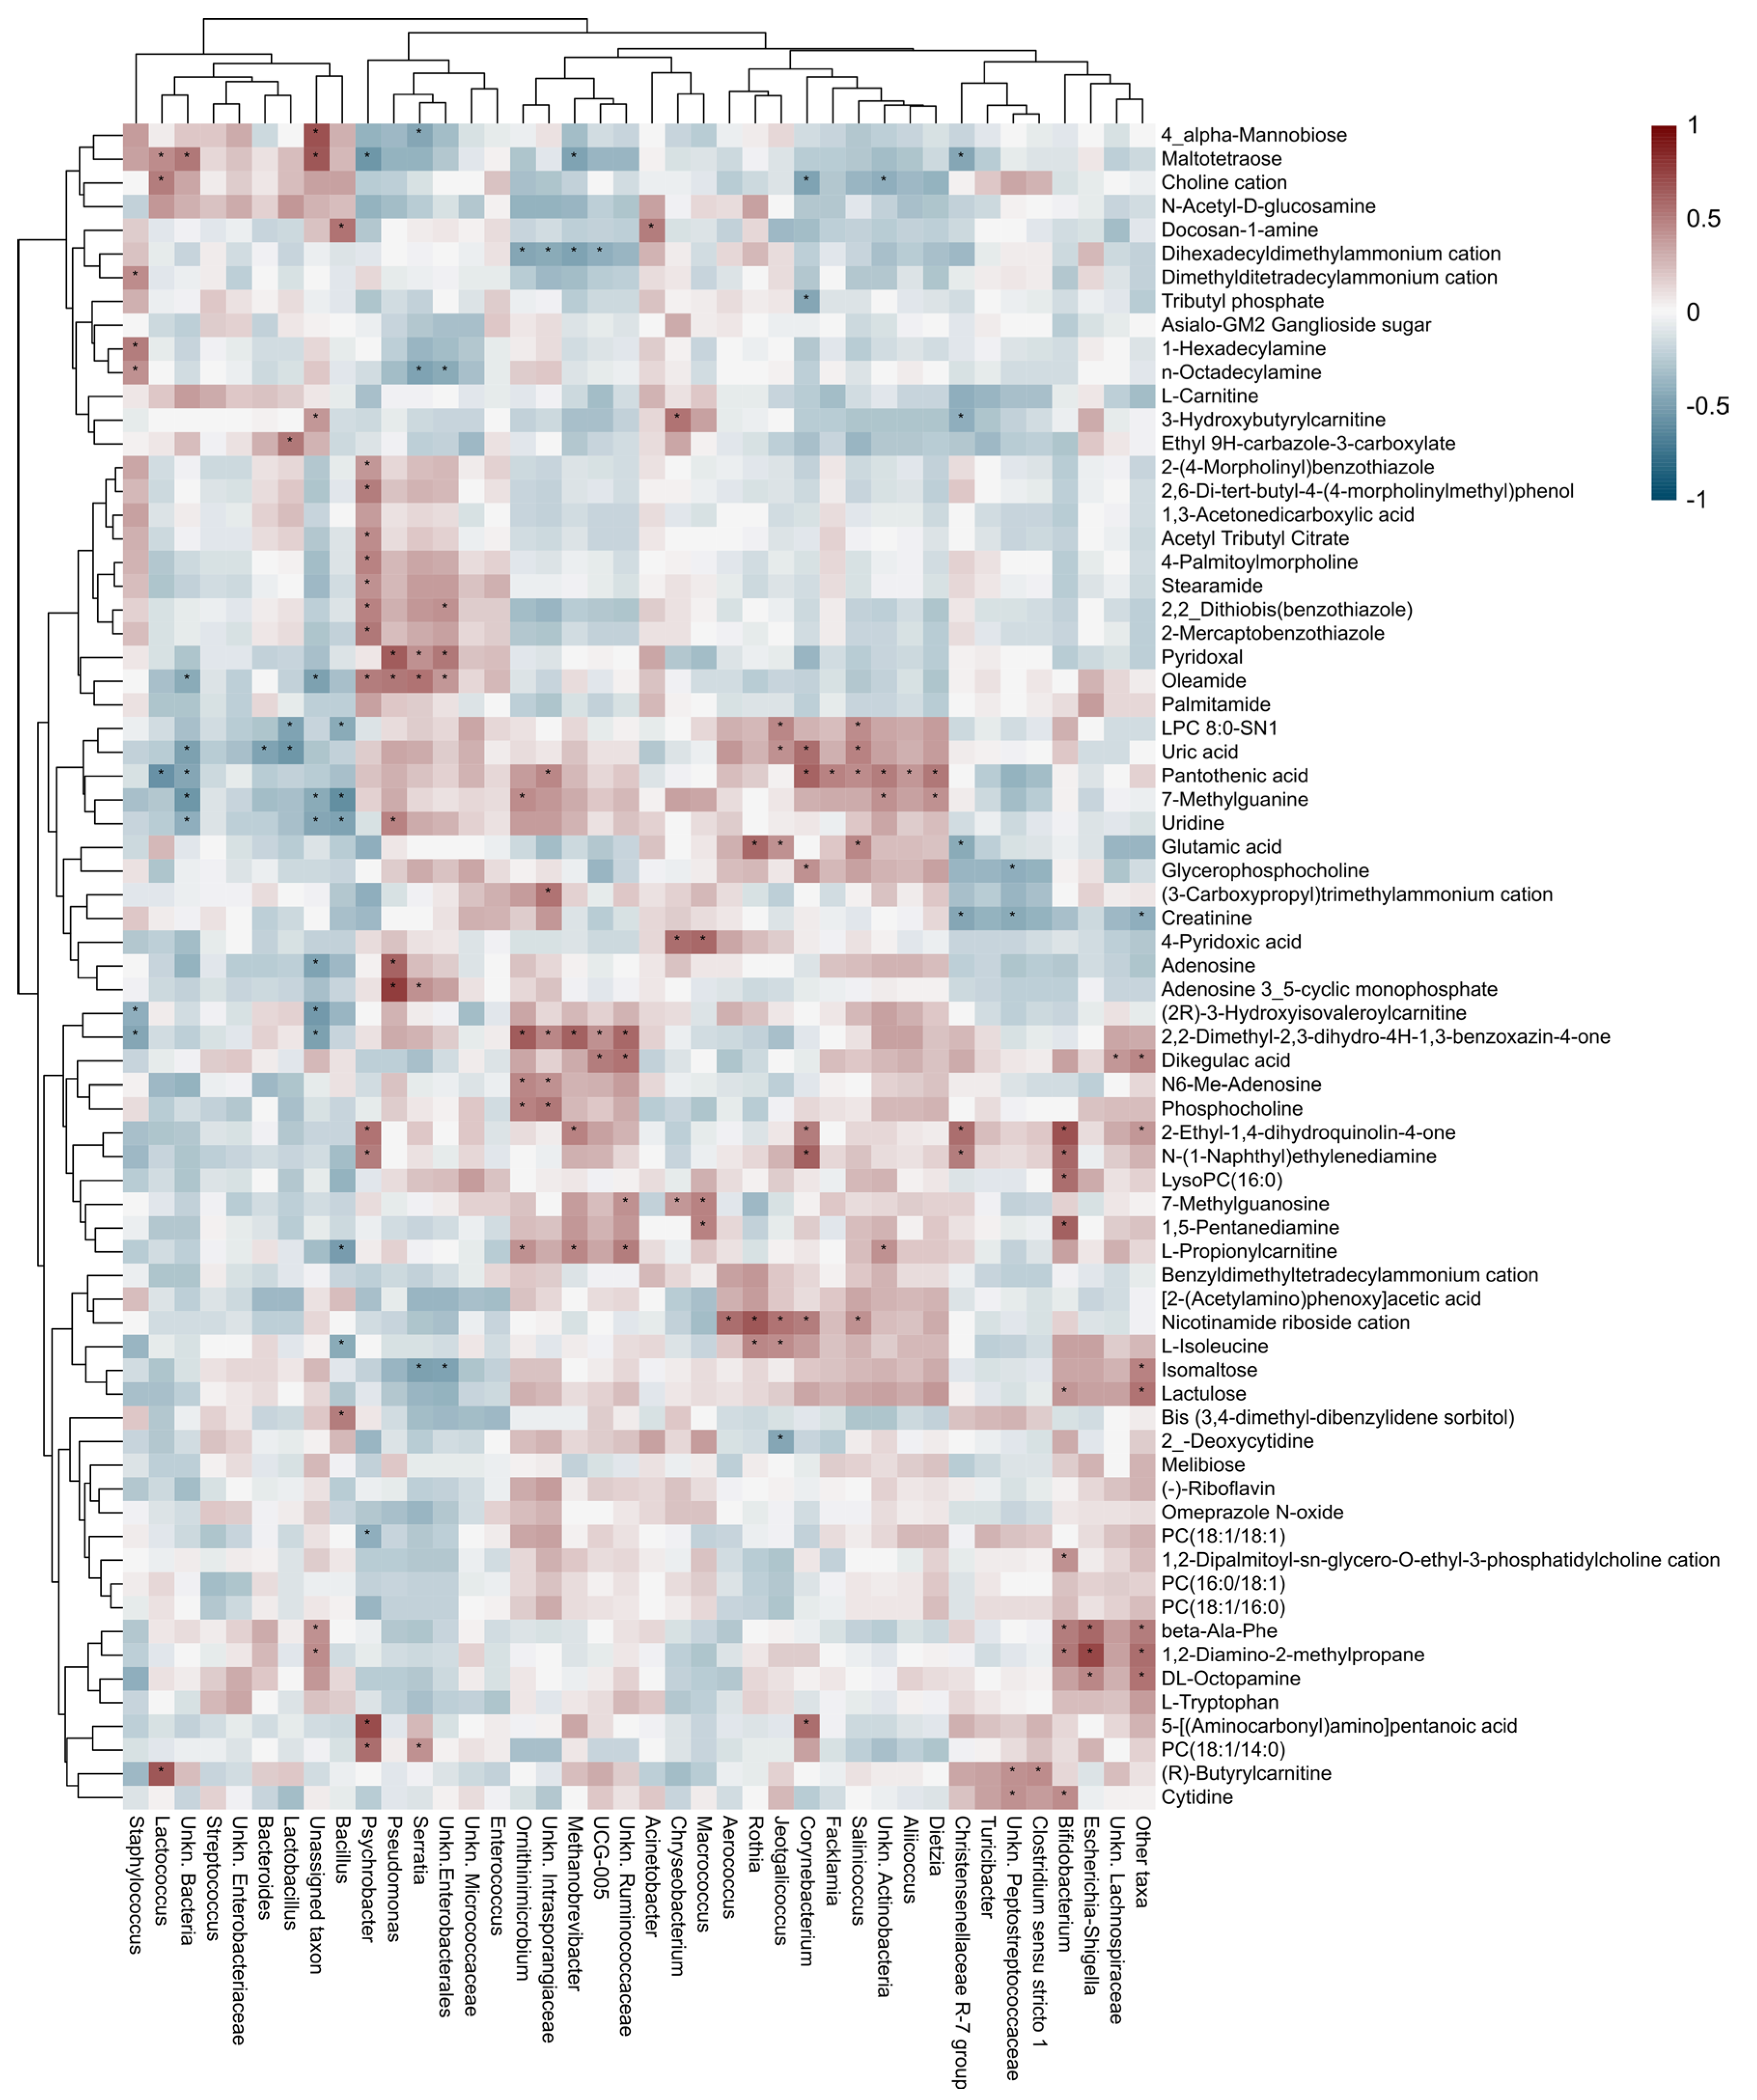
3.4. Correlation Between the Metabolomics and Metataxonomic Profiles Observed

A multivariate correlation analysis was conducted to determine the possible relationship between the metabolites detected in the milk samples and the identified microbiota present. The Spearman correlation analysis applied at three levels (metabolite to metabolite, taxa to taxa, and metabolites to taxa) revealed an important phenomenon of association at all levels.
First, when performing a Spearman correlation analysis at the metabolites-to-metabolites level and comparing the overall results (i.e., all samples as a whole), we detected several groups of positively correlated metabolites that jointly increased or decreased (Figure S22 of the Supplementary Materials). Thus, for example, a group was formed by metabolites involved in energy metabolism, such as melibiose, isomaltose, lactulose, (-)-riboflavin, and 3-Hydroxybutyrylcarnitine, which are, to a large degree, required for energy production at the cellular level. Other similar patterns were also found in compounds containing amino groups such as DL-Octopamine, 1.2-Diamino-2-methylpropane, L-tryptophan, and beta-Ala-Phe; nucleosides such as adenosine, uridine, and 7-Methylguanosine; L-carnitine and their derivatives such as L-propionylcarnitine and (2R)-3-hydroxyisovalerylcarnitine; and various forms of phosphatidylcholine such as the cation 1,2-Dipalmitoyl-sn-glycero-O-ethyl-3-phosphatidylcholine, PC(16:0_18:1), and PC(18:1_16:0). Negative correlations were also found, such as in the case of the nucleosides, which were negatively associated with the cation choline and maltotetraose.
When performing a Spearman correlation analysis at the taxon-to-taxon level, the correlation matrix of the 40 most abundant bacterial genera found in the raw milk samples showed the presence of three large groups of bacterial genera that exhibited a synchronized increase or decrease in their abundance (Figure S23 of the Supplementary Materials). The first group consisted of Enterococcus, Pseudomonas, Serratia, and two unidentified genera of the Micrococcaceae and Enterobacterales families. The second group consisted of the genus Christensenellaceae R-7 group, UCG-005 (Oscillospiraceae family), Methanobrevibacter, Turicibacter, and an unknown genus of the Ruminococcaceae family. The third large group that showed a common correlation tendency consisted of Aliicoccus, Dietzia, Facklamia, Salinicoccus, and an unknown genus of Actinobacteria. Almost no significant negative correlations were found between genera.
The Spearman correlation analysis at the metabolites and microorganisms level is shown in Figure 8.
The differential abundance analysis of the samples according to their geographical location (coastal vs. inland) revealed up to 5 bacterial genera (among the 40 most abundant) whose abundance differed according to the herd’s geographical location (Table S2 of the Supplementary Materials; p < 0.05). Some of them were correlated with a greater presence of metabolites of nutritional interest. This was the case for an unknown genus of the Peptostreptococcaceae family, which is positively correlated with the presence of cytidine. However, this metabolite was not significantly more abundant in either of the two groups (Table S3 of the Supplementary Materials). Additionally, the genus Christensenellaceae R-7 group, which was more abundant in the coastal samples, was correlated with a greater abundance of 2-ethyl-1,4-Dihydroquinolin-4-one; however, this metabolite was not significantly more abundant in this group. Based on these results, we cannot conclude that any of the evaluated localities improved the nutritional potential of the raw milk.
When comparing the samples according to the feeding regimen (conventional vs. grazing), the differential abundance analysis revealed that up to seven genera showed differential abundance when comparing the two groups (Table S2 of the Supplementary Materials; p < 0.05). Similarly, a number of these genera were correlated with a greater presence of metabolites with potential benefits for human health. Corynebacterium, which was more abundant in samples from conventional farms, was positively correlated in this analysis with 2-ethyl-1,4-Dihydroquinolin-4-one, the cation nicotinamide riboside, and pantothenic acid (vitamin B5). This last metabolite was significantly more abundant in this group of samples (Table S3 of the Supplementary Materials). The same tendency with respect to this metabolite was observed for Facklamia, the unknown genus of the Intrasporangiaceae family, and Dietzia. This last genus was also correlated with a greater abundance of 7-Methylguanosine, although this metabolite was not significantly over-represented.
Lastly, the analysis of the milk according to its stability showed no genus or metabolite with significant differences in abundance when comparing samples from the two groups (p > 0.05).

4. Discussion

The field of metabolomics applied to cow’s milk is still in its early stages, although with important advances for characterizing the various metabolites present in this complex matrix [16]. The results obtained highlight the potential of the main metabolites associated with the microbiota present in raw cow’s milk, which enhance the nutritional value of this food and its functional benefits for human health.
To ensure public safety, the dairy industry is governed by stringent quality standards, and all the analyzed cow’s milk samples in the present study complied with these requirements, showing acceptable mesophilic bacterial counts. Additionally, no significant differences were detected either by the herd’s feeding regimen or geographical location (p > 0.05 in all cases). Nevertheless, thermal instability—assessed through 70° and 80° ethanol stability tests—was still present in a significant percentage of samples (11.1% and 41.7% unstable, respectively), despite the considerable development in the milk industry in recent times, a problem that causes considerable economic losses [20,28,29,30,31]. Taking into account the technological properties of the milk from two dairy herds, Sundekilde et al. in several of their studies [32,33] demonstrated that the profiles of acquired metabolites might correlate with the milk’s coagulation properties, in particular with the variation in the concentrations of citrate, choline, carnitine, and lactose. Harzia et al. [34] found that the levels of the metabolites lactate, acetate, glutamate, creatinine, choline, carnitine, and glycerophosphocholine were associated with milk’s non-coagulation property and were significantly different between milk that did not coagulate and milk that did coagulate. Our approach, related to the samples’ functionality and with the analyzed sample size, showed that the feeding regimen and location were not significant factors in this regard. Results from the multivariate analysis revealed distinct clusters of milk samples based on metabolite profiles, separating stable and unstable raw cow’s milk. Notably, higher concentrations of oleamide and pyridoxal were consistently observed in the unstable samples, suggesting a potential biochemical basis for the milk’s thermal instability. These findings, while not directly attributed to microbial abundance alone, point to a probable synergistic effect between certain microbial populations and metabolite accumulation.
Despite differences in methodology across the existing literature, the identified metabolites broadly correspond to those reported by other researchers in raw cow’s milk [32,33,35,36,37]. Feeding regimen, particularly the inclusion of fresh forage versus hay or total mixed rations (TMRs), significantly influenced the metabolic composition of the milk. Previous studies, such as those by Rocchetti et al. (2020) [36], demonstrated that feeding corn, hay, or mixed rations results in detectable changes in metabolite classes, including phenolic compounds, lipids (triglycerides, glycerophospholipids), nucleotides, and bile acid derivatives. The present study corroborated those findings and further highlighted three key metabolites—maltotetraose, tributyl phosphate, and carnitine—as significantly associated with grazing-fed herds. O’Callaghan et al. (2018) [35] differentiated milk from grazing animals from milk of animals fed with total mixed rations (TMRs). The metabolites correlated with pasture-derived milk were dimethyl sulfone and hippuric acid. Bellassi et al. (2018) [37] observed correlations between certain lysophospholipids, such as lysophosphatidylethanolamines, differentiating raw milk from cows fed fresh fodder versus hay-based feeding. Our approach, however, highlights the correlation between milk from grazing animals and the metabolites maltotetraose, tributyl phosphate, and carnitine.
It has been reported that the herd’s geographical location could have an impact on the nutritional composition of the cows’ milk. However, there are very few studies that have addressed this finding. In a study focused on the altitude of the herd’s pasture, Bonizzi et al. [38] concluded that alpine raw milk contains highly diverse bacterial communities, whose composition is related to the altitude of the pasture where the milk was produced. These results agree with ours, observing as well broad microbial diversity, significant differences at the phylum and genus levels in certain bacteria according to the herd’s location, with an impact on the composition of the metabolites of the milk according to this variable.
In addition to being a rich source of proteins, vitamins, etc., raw cow’s milk has a microbial richness that, although it may not reach consumers directly, can improve human health through its metabolic activity and the metabolites produced. These compounds have the potential to influence the strengthening of the immune system, protection against infections, or reduction in inflammation [2,39,40]. The results observed in this study, coinciding with earlier reports, show that, overall, the raw cow’s milk samples have considerable microbial diversity, with a predominance of phyla such as Firmicutes and Actinobacteria, and genera such as Staphylococcus and Acinetobacter. This highlights the predominance of highly relevant bacteria in this matrix, such as those of the LAB group, particularly Lactococcus [31,38,41,42,43,44,45]. It could be observed that the composition of the microbiota was significantly influenced by the animals’ feeding system and geographical location, though not by thermal stability. Conventional feeding favored the presence of genera such as Enterococcus and Enteractinococcus, whereas grazing promoted genera like Lactococcus, Streptococcus, and Bacillus. Inland herds showed higher abundance of Acinetobacter, Pseudomonas, and Escherichia-Shigella, while coastal herds had more Lactococcus and Clostridium sensu stricto 1. With regard to thermal stability, stable raw milk in 70° ethanol was associated with the presence of Halocella and other genera, while stable samples in 80° ethanol showed a greater abundance of Pseudomonas, Enterococcus, and Truepera. Unstable milk in this study showed a higher abundance of Proteiniclasticum, Propionimicrobium, and Clostridium sensu stricto 1. It has been reported that the microorganisms present in cow’s milk depend on whether the animals are fed indoors or outdoors, with an increase in Staphylococcus spp. during outdoor feeding [31,38,41,42,43,44,45]. The microorganisms are also affected by the animals’ location [38], the animals’ current lactation stage [12], and more specific factors such as the milking system and the farms’ hygiene measures [45].
With the exception of certain more recognized genera such as Bifidobacterium and Pseudomonas, the effects of most genera in cow’s milk have seldom been studied. Thus, for example, among the bacteria that have been identified in this study, there is the genus Rothia, for which an anti-inflammatory effect has been reported that prevents the progression of respiratory diseases [46]. This bacterium can also ferment various carbohydrates and amino acids and produce enterobactins, inhibiting the growth of other bacteria [47]. The halotolerant genus Jeotgalicoccus, widely detected in the analyzed samples, can increase the presence of taurocholic acid in bile, employed in medicine as a cholagogue and choleretic [48]. Salinicoccus, as has been previously described, can have antioxidant functions [49], and the genus Dietzia has been associated with antioxidant, anti-inflammatory, and anticancer effects [50]. It is important to highlight that some species of the genus identified in several studies of raw milk, such as Rothia kristinae, Staphylococcus aureus, and certain Enterobacteriaceae, often originate from fecal contamination, are ubiquitous in the dairy environment [14,28,51]. The role of this species in spoilage or contamination must be acknowledged, but the current dairy practices, including cold storage and pasteurization, are effective in mitigating these risks. The detection of such species also highlights the importance of strict hygiene measures and environmental controls in dairy farming [14,28,51].
A correlation was established between the metabolomic and metataxonomic profiles, demonstrating that microbial presence can influence the concentration of key metabolites with potential health implications. The correlation matrix of the 40 most abundant genera found in the raw milk samples showed the presence of three large groups of genera that exhibited a synchronized increase or decrease in their abundance. The first group consisted of Enterococcus, Pseudomonas, Serratia, and two unidentified genera of the Micrococcaceae and Enterobacterales families. A number of these genera, including Serratia and Pseudomonas, have been associated with diseases in cows and the rapid deterioration of the milk they produce [52,53]. The second group consisted of the genus Christensenellaceae R-7 group, UCG-005 (Oscillospiraceae family), Methanobrevibacter, Turicibacter, and an unknown genus of the Ruminococcaceae family. These genera, which have often been correlated [45,54], are in many cases typical of the animals’ intestinal tract. They have been associated with functions of interest, such as improving lipid and metabolic profiles and promoting the production of butyrate (which has anti-inflammatory and anticancer activity) [55,56]. The third large group that showed a common correlation tendency was formed by Aliicoccus, Dietzia, Facklamia, Salinicoccus, and an unknown genus of Actinobacteria. Almost no significant negative correlations were found between genera.
Among the most notable associations, beta-Ala-Phe, a dipeptide with anti-fatigue and antidepressant effects [57,58,59], was positively correlated with Escherichia-Shigella and Bifidobacterium. Cytidine, which can act as an antidepressant [60], simultaneously increased as Bifidobacterium and a genus of the family Peptostreptococcaceae increased. Additionally, lactulose, a known prebiotic and laxative, was also associated with Bifidobacterium [61,62].
Among the amino acids, glutamic acid—an antioxidant and precursor of glutathione which participates in the maintenance and growth of cells and muscles [63]—increased in correlation with Rothia, Jeotgalicoccus, and Salinicoccus, and its presence was lower when the abundance of Christensenellaceae R-7 group increased. Rothia is particularly notable for its anti-inflammatory properties and ability to ferment carbohydrates and inhibit pathogen growth. Jeotgalicoccus was associated with bile acid modulation, while Salinicoccus demonstrated antioxidant functions [49]. These genera also correlated with L-isoleucine, another essential amino acid supporting muscle growth and glucose absorption, although it was negatively associated with Bacillus [64].
Other metabolites of neurological and metabolic relevance, such as choline, showed microbial associations as well. Choline, a precursor of acetylcholine and therefore a participant in regulating memory, mood, and intelligence [65], was positively correlated with the genus Lactococcus, while the opposite tendency was observed when Corynebacterium and an unknown genus of Actinobacteria increased. It is important to note that several species of Lactococcus have been described as psychobiotic, helping to reduce problems resulting from anxiety, depression, and mood [57].
Among the vitamins, nicotinamide riboside (vitamin B3) was linked to Aerococcus, Rothia, Jeotgalicoccus, Corynebacterium, and Salinicoccus, all of which are relevant to skin health, metabolic regulation, and inflammation control [66,67,68,69,70]. Pantothenic acid (vitamin B5) correlated with Corynebacterium, Facklamia, Salinicoccus, Aliicoccus, Dietzia, and two unknown genera of Actinobacteria and the family Intrasporangiaceae, and was negatively correlated with Lactococcus, suggesting roles in triglyceride metabolism [71]. Pyridoxal (vitamin B6), implicated in neurotransmitter synthesis such as serotonin, norepinephrine, epinephrine, and gamma-aminobutyric acid, and therefore associated with neuronal inhibition and agitation [72], was correlated with Pseudomonas and Serratia—two genera also linked to milk spoilage—as well as an unknown genus of the order Enterobacterales.
Among the fatty acids, there was a noteworthy detection of oleamide, which is correlated with Psychrobacter, Pseudomonas and Serratia, and an unknown genus of the order Enterobacterales, an amide of oleic acid, the most abundant monounsaturated fatty acid in cow’s milk and of considerable importance as a structural and regulatory lipid of plasma lipids [73]. In particular, oleamide can be found as a supplement for reducing stress and inducing sleep [74]. Previous studies have reported that the genus Pseudomonas participates in lipid metabolism through fatty acid degradation [75,76].
Another metabolite of interest is 2-ethyl-1,4-Dihydroquinolin-4-one, for which anticancer and antimalaria properties have been reported for the quinoline molecules [77,78]. In this study, we observed positive correlations in the abundance of this compound with the genera Psychrobacter, Methanobrevibacter, Corynebacterium, Christensenellaceae R-7 group, and Bifidobacterium. It has been reported that both the Christensenellaceae family and the genera Bifidobacterium and Methanobrevibacter have anti-inflammatory and anticancer properties [56,58,79]. Other metabolites with important correlations with the microbiota include 7-Methylguanosine, which can have antitumor activity due to its ability to inhibit poly(ADP-ribose) polymerase (PARP) [80]. Dietzia, Ornithinimicrobium, and an unknown genus of Actinobacteria are positively correlated with this compound, while Bacillus is negatively correlated. The genus Dietzia is characterized by the production of canthaxanthin, a carotenoid with antioxidant, anti-inflammatory, and anticancer properties [50]. The metabolite 7-Methylguanosine, which has an important role in the mRNA translation process and cell viability [81], increased as the genera Chryseobacterium, Macrococcus, and an unknown genus of the family Ruminococcaceae increased. Adenosine, which is employed for treating cardiac arrhythmia [69], varied in abundance along with Pseudomonas. Similarly, the metabolite ethyl 9H-carbazole-3-carboxylate belongs to a family of compounds for which anticancer, antibacterial, antiviral, antidiabetic, anti-HIV, and neuroprotective properties have been reported in animals [82]. The metabolite has been positively correlated with Lactobacillus, a genus comprising several species that can inhibit the growth of pathogens and the development of diabetes and tumors [83].
The study’s findings suggest that promoting the abundance of specific bacterial genera—such as Bifidobacterium, Rothia, Jeotgalicoccus, and Dietzia—could enhance the health-promoting potential of cow milk through increased levels of beneficial metabolites. While some genera like Bifidobacterium are well-documented for their probiotic effects, others (e.g., Rothia, Dietzia) are emerging as promising contributors to immune modulation, anti-inflammatory responses, and antioxidant activity through their metabolic activity. These insights open pathways for leveraging microbial and metabolic profiling in milk quality control and product development. Also, the results highlight the importance of maintaining a balanced microbiota in dairy cattle, given that this not only affects the quality of the milk but also the animals’ well-being. It has been observed that factors such as diet and environment can significantly affect milk’s microbial composition, which can affect the herd’s health. For example, a grazing-based diet promotes the presence of bacteria such as Lactococcus and Streptococcus, which are associated with a more stable microbiota that is less predisposed to diseases such as mastitis. On the other hand, the study findings also suggest that implementing grazing-based feeding systems and adjusting management practices according to the herd’s geographical location can promote the presence of beneficial metabolites in the milk, including conjugated fatty acids and carnitine. These compounds not only improve the nutritional value of the final product but also contribute to better livestock health.

5. Conclusions

This study reveals that raw cow’s milk hosts a rich and diverse lactic microbiota that significantly influences its metabolite composition, which in turn can impact consumer health. The feeding regimen (grazing vs. conventional) and geographical location (coastal vs. inland) of dairy herds notably affect the microbial diversity and metabolite profiles, with grazing practices being associated with a more beneficial microbiota and metabolome. While thermal stability did not correlate with microbial diversity, specific metabolites such as oleamide and pyridoxal were linked to milk instability. Importantly, correlations between certain bacterial genera and health-promoting compounds suggest the microbiota’s potential role in enhancing milk’s nutritional value. These findings advocate for a deeper understanding and possible modulation of dairy microbial ecosystems to improve milk quality and functional benefits.
A limitation of this study is the use of frozen cow milk samples, as both freezing and storage can compromise microbial DNA integrity and alter the relative abundance of sensitive taxa, particularly Gram-negative bacteria. In addition, freeze–thaw cycles may affect labile metabolites through degradation or oxidation. To minimize these effects, all samples were stored immediately after collection at –20 °C for metataxonomic analysis and at –80 °C for metabolomic analysis, and were subjected to only one freeze–thaw cycle prior to processing. Importantly, all samples were handled under identical conditions, ensuring that any storage-related effects were systematic and did not bias comparative results. This approach is consistent with validated protocols in metataxonomic and metabolomic research, where the use of frozen biological samples is standard practice.

Supplementary Materials

The following supporting information can be downloaded at: https://www.mdpi.com/article/10.3390/dairy6030024/s1, Figure S1. Samples’ bacterial count, expressed as colony-forming units per milliliter (CFU/mL), of the samples grouped by feeding regimen (conventional or grazing), herd’s geographical location (coastal or inland) and by their stability in 70° and 80° ethanol; Figure S2. Rarefaction curves obtained at the ASV level. The rarefaction analysis indicated that the sequencing depth was sufficient to capture the full microbial diversity present in the samples; Figure S3. Alpha diversity at the amplicon sequence variant level (ASV) of the samples grouped by livestock farming; There were no intergroup differences in terms of richness, Simpson index or Shannon index (p > 0.05 in all cases); Figure S4. Beta diversity at the amplicon sequence variant level (ASV) of the samples grouped by livestock farming, obtained by principal coordinates analysis (PCoA), displaying the distribution among the 36 samples; Permanova was carried to test for significance of the a priori defined groups. The results show significant differences between groups by Bray Curtis distance and Jaccard distance (Permanova Analysis p-value < 0.001 in all cases); Figure S5. Taxonomic distribution at the phylum level of the samples grouped by feeding regimen (conventional or grazing). The mean relative abundance of the copies that constitute the group are listed; Figure S6. Taxonomic distribution at the phylum level of the samples grouped by the herd’s geographical location (coastal or inland). The mean relative abundance of the copies that constitute the group are listed; Figure S7. Taxonomic distribution at the phylum level of the samples grouped by their stability in 70° ethanol. The mean relative abundance of the copies that constitute the group are listed; Figure S8. Taxonomic distribution at the phylum level of the samples grouped by their stability in 80° ethanol. The mean relative abundance of the copies that constitute the group are listed; Figure S9. Taxonomic distribution at the genus level of the samples grouped by feeding regimen (conventional or grazing). The mean relative abundance of the copies that constitute the group are listed; Figure S10. Taxonomic distribution at the genus level of the samples grouped by the herd’s geographical location (coastal or inland). The mean relative abundance of the copies that constitute the group are listed; Figure S11. Taxonomic distribution at the genus level of the samples grouped by their stability in 70° ethanol. The mean relative abundance of the copies that constitute the group are listed; Figure S12. Taxonomic distribution at the genus level of the samples grouped by their stability in 80° ethanol. The mean relative abundance of the copies that constitute the group are listed; Figure S13. Correlation analysis of all identified metabolites identified in the milk samples; Figure S14. Heatmap classification of the samples using all identified metabolites; Figure S15. Bar charts and box plots of the significant metabolites (ANOVA with p < 0.05); Figure S16. Representation of the 15 metabolites with the highest VIP of the samples grouped according to their thermal stability (samples grouped into stable vs. unstable); Figure S17. Bar charts and box plots of the significant metabolites (t-test with p < 0.05) of the samples grouped according to their thermal stability (samples grouped into stable vs. unstable); Figure S18. Representation of the 15 metabolites with the highest VIP of the samples grouped according to the herd’s geographical location (samples grouped into coastal and inland); Figure S19. Bar charts and box plots of the significant metabolites (t-test with p < 0.05) of the samples grouped according to the herd’s geographical location (samples grouped into coastal and inland); Figure S20. Representation of the 15 metabolites with the highest VIP with the samples grouped according to feeding regimen (samples grouped into conventional vs. grazing); Figure S21. Bar charts and box plots of the significant metabolites (t-test with p < 0.05) of the samples grouped according to feeding regimen (conventional vs. grazing); Figure S22. Spearman correlation analysis of the metabolites identified in the milk samples; Figure S23. Spearman correlation analysis among the 40 most abundant genera in the milk samples; Table S1. P-values resulting from the Fisher Test Performed in the Stability Analysis of the Samples in Ethanol. Significant differences when p < 0.05; Table S2. Average relative abundances (%) of each genus according to the herd’s geographical location (coastal or inland) and feeding regimen (conventional or grazing). The p-adjusted values of the Wilcoxon signed rank test are included. Those p-adjusted values lower than 0.05 are shown in bold; Table S3. Average abundances of each metabolite according to the herd’s geographical location (coastal or inland) and feeding regimen (conventional or grazing).The p-adjusted values of the Wilcoxon signed rank test are included. Those p-adjusted values lower than 0.05 are shown in bold.

Author Contributions

M.C.S. and E.S. contributed to the design of the study, undertook experiments, analyzed the data, and wrote the manuscript. A.L.-P., F.A. and A.V. contributed to the design of the research, undertook experiments, and analyzed the data. A.C., M.H., M.J.C. and L.C. contributed to the design of the research, supervision of the project, and the final draft of the manuscript. All authors have read and agreed to the published version of the manuscript.

Funding

This research was funded by the Extraordinary Chair Central Lechera Asturiana-UCM of Training and Research in Nutrition and Health Education.

Informed Consent Statement

Not applicable.

Data Availability Statement

The original contributions presented in the study are included in the article. Further inquiries can be directed to the corresponding author.

Acknowledgments

We thank the Darwin Bioprospecting Excellence S.L. platform (Paterna, Valencia, Spain) for their technical assistance, especially Adriel Latorre, for their support in analyzing the samples, processing the sequencing data, and statistical analysis.

Conflicts of Interest

M.H. is an employee of Instituto Central Lechera Asturiana para la Nutrición Personalizada (ICLANP) as indicated by affiliation. This work was funded by the Extraordinary Chair Central Lechera Asturiana-UCM of Training and Research in Nutrition and Health Education. The funders were involved in the design of the study, in the decision to publish the results, and in the review of the article.

References

  1. Haug, A.; Hostmark, A.T.; Harstad, O.M. Bovine milk in human nutrition—A review. Lipids Health Dis. 2007, 6, 25. [Google Scholar] [CrossRef] [PubMed]
  2. Zhang, X.; Chen, X.; Xu, Y.; Yang, J.; Du, L.; Li, K.; Zhou, Y. Milk consumption and multiple health outcomes: Umbrella review of systematic reviews and meta-analyses in humans. Nutr. Metab. 2021, 18, 7. [Google Scholar] [CrossRef] [PubMed]
  3. Mansson, H.L. Fatty acids in bovine milk fat. Food Nutr. Res. 2008, 52, 1821. [Google Scholar] [CrossRef]
  4. Addis, M.F.; Tanca, A.; Uzzau, S.; Oikonomou, G.; Bicalho, R.C.; Moroni, P. The bovine milk microbiota: Insights and perspectives from -omics studies. Mol. Biosyst. 2016, 12, 2359–2372. [Google Scholar] [CrossRef] [PubMed]
  5. Taponen, S.; McGuinness, D.; Hiitiö, H.; Simojoki, H.; Zadoks, R.; Pyörälä, S. Bovine milk microbiome: A more complex issue than expected. Vet. Res. 2019, 50, 44. [Google Scholar] [CrossRef]
  6. Derakhshani, H.; Fehr, K.B.; Sepehri, S.; Francoz, D.; De Buck, J.; Barkema, H.W.; Plaizier, J.C.; Khafipour, E. Invited review: Microbiota of the bovine udder: Contributing factors and potential implications for udder health and mastitis susceptibility. J. Dairy Sci. 2018, 101, 10605–10625. [Google Scholar] [CrossRef]
  7. Kuehn, J.S.; Gorden, P.J.; Munro, D.; Rong, R.; Dong, Q.; Plummer, P.J.; Wang, C.; Phillips, G.J. Bacterial community profiling of milk samples as a means to understand culture-negative bovine clinical mastitis. PLoS ONE 2013, 8, e61959. [Google Scholar] [CrossRef]
  8. Oikonomou, G.; Bicalho, M.L.; Meira, E.; Rossi, R.E.; Foditsch, C.; Machado, V.S.; Teixeira, A.G.; Santisteban, C.; Schukken, Y.H.; Bicalho, R.C. Microbiota of cow’s milk; distinguishing healthy, sub-clinically and clinically diseased quarters. PLoS ONE 2014, 9, e85904. [Google Scholar] [CrossRef]
  9. Oikonomou, G.; Machado, V.S.; Santisteban, C.; Schukken, Y.H.; Bicalho, R.C. Microbial diversity of bovine mastitic milk as described by pyrosequencing of metagenomic 16s rDNA. PLoS ONE 2012, 7, e47671. [Google Scholar] [CrossRef]
  10. Doyle, C.J.; Gleeson, D.; O’Toole, P.W.; Cotter, P.D. Impacts of Seasonal Housing and Teat Preparation on Raw Milk Microbiota: A High-Throughput Sequencing Study. Appl. Environ. Microbiol. 2017, 83, e02694-16. [Google Scholar] [CrossRef]
  11. Quigley, L.; O’Sullivan, O.; Stanton, C.; Beresford, T.P.; Ross, R.P.; Fitzgerald, G.F.; Cotter, P.D. The complex microbiota of raw milk. FEMS Microbiol. Rev. 2013, 37, 664–698. [Google Scholar] [CrossRef] [PubMed]
  12. Callon, C.; Duthoit, F.; Delbès, C.; Ferrand, M.; Le Frileux, Y.; De Crémoux, R.; Montel, M.C. Stability of microbial communities in goat milk during a lactation year: Molecular approaches. Syst. Appl. Microbiol. 2007, 30, 547–560. [Google Scholar] [CrossRef]
  13. Vithanage, N.R.; Yeager, T.R.; Jadhav, S.R.; Palombo, E.A.; Datta, N. Comparison of identification systems for psychrotrophic bacteria isolated from raw bovine milk. Int. J. Food Microbiol. 2014, 189, 26–38. [Google Scholar] [CrossRef]
  14. Quigley, L.; O’Sullivan, O.; Beresford, T.P.; Ross, R.P.; Fitzgerald, G.F.; Cotter, P.D. Molecular approaches to analysing the microbial composition of raw milk and raw milk cheese. Int. J. Food Microbiol. 2011, 150, 81–94. [Google Scholar] [CrossRef] [PubMed]
  15. Zhu, D.; Kebede, B.; Chen, G.; McComb, K.; Frew, R. Effects of the vat pasteurization process and refrigerated storage on the bovine milk metabolome. J. Dairy Sci. 2020, 103, 2077–2088. [Google Scholar] [CrossRef]
  16. Suh, J.H. Critical review: Metabolomics in dairy science—Evaluation of milk and milk product quality. Food Res. Int. 2022, 154, 110984. [Google Scholar] [CrossRef] [PubMed]
  17. Cavero-Redondo, I.; Alvarez-Bueno, C.; Sotos-Prieto, M.; Gil, A.; Martinez-Vizcaino, V.; Ruiz, J.R. Milk and Dairy Product Consumption and Risk of Mortality: An Overview of Systematic Reviews and Meta-Analyses. Adv. Nutr. 2019, 10, S97–S104. [Google Scholar] [CrossRef]
  18. Givens, D.I. Milk in the diet: Good or bad for vascular disease? Proc. Nutr. Soc. 2012, 71, 98–104. [Google Scholar] [CrossRef]
  19. Tieri, M.; Ghelfi, F.; Vitale, M.; Vetrani, C.; Marventano, S.; Lafranconi, A.; Godos, J.; Titta, L.; Gambera, A.; Alonzo, E.; et al. Whole grain consumption and human health: An umbrella review of observational studies. Int. J. Food Sci. Nutr. 2020, 71, 668–677. [Google Scholar] [CrossRef]
  20. Deeth, H.C.; Khusniati, T.; Datta, N.; Wallace, R.B. Spoilage patterns of skim and whole milks. J. Dairy. Res. 2002, 69, 227–241. [Google Scholar] [CrossRef]
  21. UNE-EN ISO 4833-2:2013; Microbiology of the Food Chain—Horizontal Method for the Enumeration of Microorganisms—Part 2: Colony Count at 30 Degrees C by the Surface Plating Technique. ISO: Geneva, Switzerland, 2014.
  22. Roggenbuck, M.; Bærholm Schnell, I.; Blom, N.; Bælum, J.; Bertelsen, M.F.; Sicheritz-Pontén, T.; Sørensen, S.J.; Gilbert, M.T.P.; Graves, G.R.; Hansen, L.H. The microbiome of New World vultures. Nat. Commun. 2014, 5, 5498. [Google Scholar] [CrossRef] [PubMed]
  23. Bolyen, E.; Rideout, J.R.; Dillon, M.R.; Bokulich, N.A.; Abnet, C.C.; Al-Ghalith, G.A.; Alexander, H.; Alm, E.J.; Arumugam, M.; Asnicar, F.; et al. Reproducible, interactive, scalable and extensible microbiome data science using QIIME 2. Nat. Biotechnol. 2019, 37, 852–857. [Google Scholar] [CrossRef] [PubMed]
  24. Quast, C.; Pruesse, E.; Yilmaz, P.; Gerken, J.; Schweer, T.; Yarza, P.; Peplies, J.; Glöckner, F.O. The SILVA ribosomal RNA gene database project: Improved data processing and web-based tools. Nucleic Acids Res. 2013, 41, D590–D596. [Google Scholar] [CrossRef]
  25. McMurdie, P.J.; Holmes, S. phyloseq: An R package for reproducible interactive analysis and graphics of microbiome census data. PLoS ONE 2013, 8, e61217. [Google Scholar] [CrossRef] [PubMed]
  26. Love, M.I.; Huber, W.; Anders, S. Moderated estimation of fold change and dispersion for RNA-seq data with DESeq2. Genome. Biol. 2014, 15, 550. [Google Scholar] [CrossRef]
  27. Benjamini, Y.; Hochberg, Y. Controlling the False Discovery Rate: A Practical and Powerful Approach to Multiple Testing. J. R. Stat. Soc. Ser. B Methodol. 2018, 57, 289–300. [Google Scholar] [CrossRef]
  28. Machado, S.G.; Baglinière, F.; Marchand, S.; Van Coillie, E.; Vanetti, M.C.; De Block, J.; Heyndrickx, M. The Biodiversity of the Microbiota Producing Heat-Resistant Enzymes Responsible for Spoilage in Processed Bovine Milk and Dairy Products. Front. Microbiol. 2017, 8, 302. [Google Scholar] [CrossRef]
  29. Ledenbach, L.H.; Marshall, R.T. Microbiological Spoilage of Dairy Products. In Compendium of the Microbiological Spoilage of Foods and Beverages; Sperber, W.H., Doyle, M.P., Eds.; Springer: New York, NY, USA, 2009; pp. 41–67. [Google Scholar]
  30. Singh, H. Heat stability of milk. Int. J. Dairy Technol. 2004, 57, 111–119. [Google Scholar] [CrossRef]
  31. Lejeune, J.T.; Rajala-Schultz, P.J. Food safety: Unpasteurized milk: A continued public health threat. Clin. Infect. Dis. 2009, 48, 93–100. [Google Scholar] [CrossRef]
  32. Sundekilde, U.K.; Gustavsson, F.; Poulsen, N.A.; Glantz, M.; Paulsson, M.; Larsen, L.B.; Bertram, H.C. Association between the bovine milk metabolome and rennet-induced coagulation properties of milk. J. Dairy. Sci. 2014, 97, 6076–6084. [Google Scholar] [CrossRef]
  33. Sundekilde, U.K.; Frederiksen, P.D.; Clausen, M.R.; Larsen, L.B.; Bertram, H.C. Relationship between the metabolite profile and technological properties of bovine milk from two dairy breeds elucidated by NMR-based metabolomics. J. Agric. Food Chem. 2011, 59, 7360–7367. [Google Scholar] [CrossRef] [PubMed]
  34. Harzia, H.; Kilk, K.; Joudu, I.; Henno, M.; Kart, O.; Soomets, U. Comparison of the metabolic profiles of noncoagulating and coagulating bovine milk. J. Dairy. Sci. 2012, 95, 533–540. [Google Scholar] [CrossRef]
  35. O’Callaghan, T.F.; Vázquez-Fresno, R.; Serra-Cayuela, A.; Dong, E.; Mandal, R.; Hennessy, D.; McAuliffe, S.; Dillon, P.; Wishart, D.S.; Stanton, C.; et al. Pasture Feeding Changes the Bovine Rumen and Milk Metabolome. Metabolites 2018, 8, 27. [Google Scholar] [CrossRef]
  36. Rocchetti, G.; Gallo, A.; Nocetti, M.; Lucini, L.; Masoero, F. Milk metabolomics based on ultra-high-performance liquid chromatography coupled with quadrupole time-of-flight mass spectrometry to discriminate different cows feeding regimens. Food Res. Int. 2020, 134, 109279. [Google Scholar] [CrossRef] [PubMed]
  37. Bellassi, P.; Rocchetti, G.; Nocetti, M.; Lucini, L.; Masoero, F.; Morelli, L. A Combined Metabolomic and Metagenomic Approach to Discriminate Raw Milk for the Production of Hard Cheese. Foods 2021, 10, 109. [Google Scholar] [CrossRef] [PubMed]
  38. Bonizzi, I.; Buffoni, J.N.; Feligini, M.; Enne, G. Investigating the relationship between raw milk bacterial composition, as described by intergenic transcribed spacer-PCR fingerprinting, and pasture altitude. J. Appl. Microbiol. 2009, 107, 1319–1329. [Google Scholar] [CrossRef]
  39. Antunes, I.C.; Bexiga, R.; Pinto, C.; Roseiro, L.C.; Quaresma, M.A.G. Cow’s Milk in Human Nutrition and the Emergence of Plant-Based Milk Alternatives. Foods 2022, 12, 99. [Google Scholar] [CrossRef]
  40. Thorning, T.K.; Raben, A.; Tholstrup, T.; Soedamah-Muthu, S.S.; Givens, I.; Astrup, A. Milk and dairy products: Good or bad for human health? An assessment of the totality of scientific evidence. Food Nutr. Res. 2016, 60, 32527. [Google Scholar] [CrossRef]
  41. Alemayehu, D.; Hannon, J.A.; McAuliffe, O.; Ross, R.P. Characterization of plant-derived lactococci on the basis of their volatile compounds profile when grown in milk. Int. J. Food Microbiol. 2014, 172, 57–61. [Google Scholar] [CrossRef]
  42. Alothman, M.; Hogan, S.A.; Hennessy, D.; Dillon, P.; Kilcawley, K.N.; O’Donovan, M.; Tobin, J.; Fenelon, M.A.; O’Callaghan, T.F. The “Grass-Fed” Milk Story: Understanding the Impact of Pasture Feeding on the Composition and Quality of Bovine Milk. Foods 2019, 8, 350. [Google Scholar] [CrossRef]
  43. Coorevits, A.; De Jonghe, V.; Vandroemme, J.; Reekmans, R.; Heyrman, J.; Messens, W.; De Vos, P.; Heyndrickx, M. Comparative analysis of the diversity of aerobic spore-forming bacteria in raw milk from organic and conventional dairy farms. Syst. Appl. Microbiol. 2008, 31, 126–140. [Google Scholar] [CrossRef]
  44. Hagi, T.; Kobayashi, M.; Nomura, M. Molecular-based analysis of changes in indigenous milk microflora during the grazing period. Biosci. Biotechnol. Biochem. 2010, 74, 484–487. [Google Scholar] [CrossRef]
  45. Vacheyrou, M.; Normand, A.C.; Guyot, P.; Cassagne, C.; Piarroux, R.; Bouton, Y. Cultivable microbial communities in raw cow milk and potential transfers from stables of sixteen French farms. Int. J. Food Microbiol. 2011, 146, 253–262. [Google Scholar] [CrossRef] [PubMed]
  46. Rigauts, C.; Aizawa, J.; Taylor, S.L.; Rogers, G.B.; Govaerts, M.; Cos, P.; Ostyn, L.; Sims, S.; Vandeplassche, E.; Sze, M.; et al. R othia mucilaginosa is an anti-inflammatory bacterium in the respiratory tract of patients with chronic lung disease. Eur. Respir. J. 2022, 59, 2101293. [Google Scholar] [CrossRef]
  47. Uranga, C.C.; Arroyo, P., Jr.; Duggan, B.M.; Gerwick, W.H.; Edlund, A. Commensal Oral Rothia mucilaginosa Produces Enterobactin, a Metal-Chelating Siderophore. mSystems 2020, 5, e00161-20. [Google Scholar] [CrossRef]
  48. Petrov, V.A.; Fernández-Peralbo, M.A.; Derks, R.; Knyazeva, E.M.; Merzlikin, N.V.; Sazonov, A.E.; Mayboroda, O.A.; Saltykova, I.V. Biliary Microbiota and Bile Acid Composition in Cholelithiasis. Biomed. Res. Int. 2020, 2020, 1242364. [Google Scholar] [CrossRef] [PubMed]
  49. Fariq, A.; Yasmin, A.; Jamil, M. Production, characterization and antimicrobial activities of bio-pigments by Aquisalibacillus elongatus MB592, Salinicoccus sesuvii MB597, and Halomonas aquamarina MB598 isolated from Khewra Salt Range, Pakistan. Extremophiles 2019, 23, 435–449. [Google Scholar] [CrossRef]
  50. Gharibzahedi, S.M.T.; Razavi, S.H.; Mousavi, S.M. Developing an emulsion model system containing canthaxanthin biosynthesized by Dietzia natronolimnaea HS-1. Int. J. Biol. Macromol. 2012, 51, 618–626. [Google Scholar] [CrossRef] [PubMed]
  51. Ramos, G.L.d.P.A.; Vigoder, H.C.; Nascimento, J.n.d.S. Kocuria spp. in Foods: Biotechnological Uses and Risks for Food Safety. Appl. Food Biotechnol. 2021, 8, 79–88. [Google Scholar] [CrossRef]
  52. Friman, M.J.; Eklund, M.H.; Pitkala, A.H.; Rajala-Schultz, P.J.; Rantala, M.H.J. Description of two Serratia marcescens associated mastitis outbreaks in Finnish dairy farms and a review of literature. Acta Vet. Scand. 2019, 61, 54. [Google Scholar] [CrossRef]
  53. Meng, L.; Zhang, Y.; Liu, H.; Zhao, S.; Wang, J.; Zheng, N. Characterization of Pseudomonas spp. and Associated Proteolytic Properties in Raw Milk Stored at Low Temperatures. Front. Microbiol. 2017, 8, 2158. [Google Scholar] [CrossRef] [PubMed]
  54. Amat, S.; Holman, D.B.; Schmidt, K.; Menezes, A.C.B.; Baumgaertner, F.; Winders, T.; Kirsch, J.D.; Liu, T.; Schwinghamer, T.D.; Sedivec, K.K.; et al. The Nasopharyngeal, Ruminal, and Vaginal Microbiota and the Core Taxa Shared across These Microbiomes in Virgin Yearling Heifers Exposed to Divergent In Utero Nutrition during Their First Trimester of Gestation and in Pregnant Beef Heifers in Response to Mineral Supplementation. Microorganisms 2021, 9, 2011. [Google Scholar] [CrossRef]
  55. Tavella, T.; Rampelli, S.; Guidarelli, G.; Bazzocchi, A.; Gasperini, C.; Pujos-Guillot, E.; Comte, B.; Barone, M.; Biagi, E.; Candela, M.; et al. Elevated gut microbiome abundance of Christensenellaceae, Porphyromonadaceae and Rikenellaceae is associated with reduced visceral adipose tissue and healthier metabolic profile in Italian elderly. Gut Microbes 2021, 13, 1–19. [Google Scholar] [CrossRef] [PubMed]
  56. Camara, A.; Konate, S.; Tidjani Alou, M.; Kodio, A.; Togo, A.H.; Cortaredona, S.; Henrissat, B.; Thera, M.A.; Doumbo, O.K.; Raoult, D.; et al. Clinical evidence of the role of Methanobrevibacter smithii in severe acute malnutrition. Sci. Rep. 2021, 11, 5426. [Google Scholar] [CrossRef] [PubMed]
  57. de Araújo, F.F.; Farias, D.P. Psychobiotics: An emerging alternative to ensure mental health amid the COVID-19 outbreak? Trends Food Sci. Technol. 2020, 103, 386–387. [Google Scholar] [CrossRef]
  58. Sharma, M.; Wasan, A.; Sharma, R.K. Recent developments in probiotics: An emphasis on Bifidobacterium. Food Biosci. 2021, 41, 100993. [Google Scholar] [CrossRef]
  59. Berti Zanella, P.; Donner Alves, F.; Guerini de Souza, C. Effects of beta-alanine supplementation on performance and muscle fatigue in athletes and non-athletes of different sports: A systematic review. J. Sports Med. Phys. Fit. 2017, 57, 1132–1141. [Google Scholar] [CrossRef]
  60. Machado-Vieira, R.; Salvadore, G.; DiazGranados, N.; Ibrahim, L.; Latov, D.; Wheeler-Castillo, C.; Baumann, J.; Henter, I.D.; Zarate, C.A., Jr. New therapeutic targets for mood disorders. Sci. World J. 2010, 10, 713–726. [Google Scholar] [CrossRef]
  61. Kot, T.V.; Pettit-Young, N.A. Lactulose in the management of constipation: A current review. Ann. Pharmacother. 1992, 26, 1277–1282. [Google Scholar] [CrossRef]
  62. Karakan, T.; Tuohy, K.M.; Janssen-van Solingen, G. Low-Dose Lactulose as a Prebiotic for Improved Gut Health and Enhanced Mineral Absorption. Front. Nutr. 2021, 8, 672925. [Google Scholar] [CrossRef]
  63. Garattini, S. Glutamic acid, twenty years later. J. Nutr. 2000, 130, 901s–909s. [Google Scholar] [CrossRef] [PubMed]
  64. Holeček, M. Branched-chain amino acids in health and disease: Metabolism, alterations in blood plasma, and as supplements. Nutr. Metab. 2018, 15, 33. [Google Scholar] [CrossRef]
  65. Zeisel, S.H. Nutritional importance of choline for brain development. J. Am. Coll. Nutr. 2004, 23, 621s–626s. [Google Scholar] [CrossRef]
  66. Bissett, D.L.; Oblong, J.E.; Berge, C.A. Niacinamide: A B Vitamin that Improves Aging Facial Skin Appearance. Dermatol. Surg. 2005, 31, 860–865. [Google Scholar] [CrossRef]
  67. Yiasemides, E.; Sivapirabu, G.; Halliday, G.M.; Park, J.; Damian, D.L. Oral nicotinamide protects against ultraviolet radiation-induced immunosuppression in humans. Carcinogenesis 2009, 30, 101–105. [Google Scholar] [CrossRef] [PubMed]
  68. Maccubbin, D.; Tipping, D.; Kuznetsova, O.; Hanlon, W.A.; Bostom, A.G. Hypophosphatemic Effect of Niacin in Patients without Renal Failure: A Randomized Trial. Clin. J. Am. Soc. Nephrol. 2010, 5, 582–589. [Google Scholar] [CrossRef]
  69. Bingley, P.J.; Mahon, J.L.; Gale, E.A.M.; European Nicotinamide Diabetes Intervention Trial Group. Insulin Resistance and Progression to Type 1 Diabetes in the European Nicotinamide Diabetes Intervention Trial (ENDIT). Diabetes Care 2008, 31, 146–150. [Google Scholar] [CrossRef]
  70. Ridaura, V.K.; Bouladoux, N.; Claesen, J.; Chen, Y.E.; Byrd, A.L.; Constantinides, M.G.; Merrill, E.D.; Tamoutounour, S.; Fischbach, M.A.; Belkaid, Y. Contextual control of skin immunity and inflammation by Corynebacterium. J. Exp. Med. 2018, 215, 785–799. [Google Scholar] [CrossRef] [PubMed]
  71. Rumberger, J.A.; Napolitano, J.; Azumano, I.; Kamiya, T.; Evans, M. Pantethine, a derivative of vitamin B5 used as a nutritional supplement, favorably alters low-density lipoprotein cholesterol metabolism in low– to moderate–cardiovascular risk North American subjects: A triple-blinded placebo and diet-controlled investigation. Nutr. Res. 2011, 31, 608–615. [Google Scholar] [CrossRef]
  72. Stover, P.J.; Field, M.S. Vitamin B-6. Adv. Nutr. 2015, 6, 132–133. [Google Scholar] [CrossRef]
  73. Sales-Campos, H.; Souza, P.R.; Peghini, B.C.; da Silva, J.S.; Cardoso, C.R. An overview of the modulatory effects of oleic acid in health and disease. Mini Rev. Med. Chem. 2013, 13, 201–210. [Google Scholar] [PubMed]
  74. Mueller, G.P.; Driscoll, W.J. Biosynthesis of oleamide. Vitam. Horm. 2009, 81, 55–78. [Google Scholar] [CrossRef] [PubMed]
  75. Morello, E.; Pérez-Berezo, T.; Boisseau, C.; Baranek, T.; Guillon, A.; Bréa, D.; Lanotte, P.; Carpena, X.; Pietrancosta, N.; Hervé, V.; et al. Pseudomonas aeruginosa Lipoxygenase LoxA Contributes to Lung Infection by Altering the Host Immune Lipid Signaling. Front. Microbiol. 2019, 10, 1826. [Google Scholar] [CrossRef] [PubMed]
  76. Yuan, Y.; Leeds Jennifer, A.; Meredith Timothy, C. Pseudomonas aeruginosa Directly Shunts β-Oxidation Degradation Intermediates into De Novo Fatty Acid Biosynthesis. J. Bacteriol. 2012, 194, 5185–5196. [Google Scholar] [CrossRef]
  77. Jaskulska, A.; Gach-Janczak, K.; Drogosz-Stachowicz, J.; Janecki, T.; Janecka, A.E. Synthesis and Anticancer Properties of New 3-Methylidene-1-sulfonyl-2,3-dihydroquinolin-4(1H)-ones. Molecules 2022, 27, 3597. [Google Scholar] [CrossRef]
  78. Nilsen, A.; Miley, G.P.; Forquer, I.P.; Mather, M.W.; Katneni, K.; Li, Y.; Pou, S.; Pershing, A.M.; Stickles, A.M.; Ryan, E.; et al. Discovery, Synthesis, and Optimization of Antimalarial 4(1H)-Quinolone-3-Diarylethers. J. Med. Chem. 2014, 57, 3818–3834. [Google Scholar] [CrossRef]
  79. Waters, J.L.; Ley, R.E. The human gut bacteria Christensenellaceae are widespread, heritable, and associated with health. BMC Biol. 2019, 17, 83. [Google Scholar] [CrossRef]
  80. Nilov, D.; Maluchenko, N.; Kurgina, T.; Pushkarev, S.; Lys, A.; Kutuzov, M.; Gerasimova, N.; Feofanov, A.; Švedas, V.; Lavrik, O.; et al. Molecular Mechanisms of PARP-1 Inhibitor 7-Methylguanine. Int. J. Mol. Sci. 2020, 21, 2159. [Google Scholar] [CrossRef]
  81. Cowling, V.H. Regulation of mRNA cap methylation. Biochem. J. 2009, 425, 295–302. [Google Scholar] [CrossRef]
  82. Tan, M.A.; Sharma, N.; An, S.S.A. Phyto-Carbazole Alkaloids from the Rutaceae Family as Potential Protective Agents against Neurodegenerative Diseases. Antioxidants 2022, 11, 493. [Google Scholar] [CrossRef]
  83. Slattery, C.; Cotter, P.D.; W. O’Toole, P. Analysis of Health Benefits Conferred by Lactobacillus Species from Kefir. Nutrients 2019, 11, 1252. [Google Scholar] [CrossRef] [PubMed]
Figure 1. Alpha diversity at the amplicon sequence variant level (ASV) of the samples grouped by (a) type of farm (conventional vs. grazing), (b) location (inland vs. coastal), (c) stability in 70°, and (d) 80° ethanol.
Dairy 06 00024 g001
Figure 2. Beta diversity by (a,b) type of farm (conventional and grazing) and (c,d) location (coastal and inland) obtained by principal coordinates analysis (PCoA), displaying the distribution among the 36 samples. Permanova was carried out to test for significance of the a priori defined groups. The results show significant differences between groups by Bray–Curtis distance and Jaccard distance (Permanova Analysis p-value < 0.001 in all cases).
Dairy 06 00024 g002
Figure 3. Dominant ASVs at genera taxonomic level of the bacteria present in the 36 raw cow’s milk samples analyzed, consisting of 18 from conventional feeding and 18 from grazing-based feeding regimens, with 9 samples from inland locations and 9 from coastal areas in both cases, highlighting the variability among them, spanning 909 genera (893 from bacteria and 16 from archaea), and 349 unidentified ASVs, accounting for 27.7% of the total.
Dairy 06 00024 g003
Figure 4. (a) Principal component analysis (PCA) and (b) partial least squares discriminant analysis score (PLS-DA) of all study samples; (c) heatmap classification of the samples based on the 9 significant metabolites (using analysis of variance, p < 0.05).
Dairy 06 00024 g004
Figure 5. (a) Principal component analysis (PCA) and (b) partial least squares discriminant analysis score (PLS-DA) of the samples grouped in stable and unstable in 80° ethanol; (c) heatmap classification of the samples based on the 4 significant metabolites (using the t-test, p < 0.05).
Dairy 06 00024 g005
Figure 6. (a) Principal component analysis (PCA) and (b) partial least squares discriminant analysis score (PLS-DA) of the samples grouped in coastal and inland; (c) heatmap classification of the samples based on the 5 significant metabolites (using the t-test, p < 0.05).
Dairy 06 00024 g006
Figure 7. Principal component analysis (a) and partial least squares discriminant analysis score plot (b) of the samples grouped in “conventional” and “grazing”; (c) heatmap classification of the samples based on the 8 significant metabolites (using the t-test, p < 0.05).
Dairy 06 00024 g007
Figure 8. Spearman correlation analysis between the 40 most abundant genera in the samples and all analyzed metabolites. Asterisks in the graph indicate statistically significant differences (p < 0.05).
Dairy 06 00024 g008
Table 1. Samples of raw cow’s milk collected from Holstein dairy herds, free-range housing, classified according to the feeding regimen declared by each livestock farm (conventional or grazing feeding regimen) and by geographical location (inland or coastal farm). Samples were collected from three livestock operations for each condition, with three healthy animals randomly selected from each of them. Each sample was assigned an ID code to de-identify it and avoid an association with the livestock farms.
Feeding RegimenGeographical
Location of the Herd
Number of SamplesID of the Samples
GrazingInland9UCM2; UCM3; UCM5; UCM16; UCM17; UCM18; UCM25; UCM26; UCM27
Coastal9UCM28; UCM29; UCM30; UCM31; UCM32; UCM33; UCM34; UCM35; UCM36
ConventionalInland9UCM1; UCM4;UCM6; UCM19; UCM20; UCM21; UCM22; UCM23; UCM24
Coastal9UCM7; UCM8; UCM9; UCM10; UCM11; UCM12; UCM13; UCM14; UCM15
Table 2. Samples of raw cow’s milk collected and classified according to the feeding regimen declared by each livestock farm (conventional or grazing feeding regimen), by geographical location (inland or coastal farm), and by stability in the 80° ethanol test.
Feeding RegimenGeographic Location of the HerdNumber of SamplesID of the Samples
Stable for the 80° Ethanol TestUnstable for the 80° Ethanol Test
GrazingInland6UCM16; UCM25; UCM27UCM2; UCM3; UCM5
Coastal6UCM28; UCM29; UCM36UCM31; UCM32; UCM34
ConventionalInland6UCM19; UCM22; UCM23UCM4;UCM6; UCM21
Coastal6UCM10; UCM12; UCM13UCM8; UCM14; UCM15
Table 3. Number of metabolites detected and identified in the 24 samples analyzed by UHPLC-Q/TOF MS.
Retention Time (min)Metabolite NameMolecular
Formula
m/zAdduct Type
0.55Glutamic acidC5H9NO4148.0597[M+H]+
0.59MaltotetraoseC24H42O21667.22[M+H]+
0.594Choline cationC5H14NO104.1073_60.0808[Cat]+_[M+H-CH4N2]+
0.594CreatinineC4H7N3O114.0663[M+H]+
0.596L-CarnitineC7H15NO3162.1109[M+H]+
0.608GlycerophosphocholineC8H20NO6P296.0656_280.0914_258.1110[M+K]+_[M+Na]+_[M+H]+
0.616N-Acetyl-D-glucosamineC8H15NO6222.0974_204.0867[M+H]+_[M+H-H2O]+
0.616Asialo-GM2 Ganglioside sugarC20H35NO16546.1978[M+H]+
0.62PhosphocholineC5H14NO4P184.0727[M+H]+
0.6444alpha-Mannobiose/beta-lactoseC12H22O11707.223[2M+Na]+
0.649MelibioseC12H22O11325.1132_360.1507[M+H-H2O]+_[M+NH4]+
0.7221,2-Diamino-2-methylpropaneC4H12N272.081[M+H-NH3]+
0.819CytidineC9H13N3O5487.1792_244.0934[2M+H]+_[M+H]+
0.8191,5-PentanediamineC5H14N286.0959[M+H-NH3]+
0.9622′-DeoxycytidineC9H13N3O4112.0507[M+H-C5H8O3]+
0.9732,2-Dimethyl-2,3-dihydro-4H-1,3-benzoxazin-4-oneC10H11NO2178.0864[M+H]+
0.978Nicotinamide riboside cationC11H15N2O5123.0555[Cat-C5H8O4]+
1.024Uric acidC5H4N4O3169.0355[M+H]+
1.116Isomaltose/beta-lactoseC12H22O11365.1053[M+Na]+
1.1553-HydroxybutyrylcarnitineC11H21NO5248.1492[M+H]+
1.177-MethylguanineC6H7N5O166.0722[M+H]+
1.222N6-Me-AdenosineC11H15N5O4282.1196[M+H]+
1.289LactuloseC12H22O11365.1055[M+Na]+
1.289L-IsoleucineC6H13NO2132.1016[M+H]+
1.306DL-OctopamineC8H11NO2136.0753[M+H-H2O]+
1.399UridineC9H12N2O6245.0771[M+H]+
1.702L-PropionylcarnitineC10H19NO4218.1393[M+H]+
1.821AdenosineC10H13N5O4268.1042[M+H]+
1.8744-Pyridoxic acidC8H9NO4184.0608[M+H]+
1.91(2R)-3-HydroxyisovaleroylcarnitineC12H23NO5262.1651[M+H]+
1.91PyridoxalC8H9NO3150.0548[M+H-H2O]+
1.917Adenosine 3′,5′-cyclic monophosphateC10H12N5O6P330.06[M+H]+
2.087beta-Ala-PheC12H16N2O3166.086[M+H-C3H5NO]+
2.1255-[(Aminocarbonyl)amino]pentanoic acid/d-Alanyl-D-AlanineC6H12N2O3100.076[M+H-CH3NO2]+
2.1917-MethylguanosineC11H15N5O5298.1151[M+H]+
2.369Ethyl 9H-carbazole-3-carboxylateC15H13NO2240.1025[M+H]+
2.421Pantothenic acidC9H17NO5242.1004_220.1191[M+Na]+_[M+H]+
2.426(R)-ButyrylcarnitineC11H21NO4232.1555[M+H]+
2.5312-Ethyl-1,4-dihydroquinolin-4-oneC11H11NO174.0913[M+H]+
2.8L-TryptophanC11H12N2O2205.0982_188.0701[M+H]+_[M+H-NH3]+
4.031N-(1-Naphthyl)ethylenediamineC12H14N2187.1234[M+H]+
4.489(-)-RiboflavinC17H20N4O6377.1458[M+H]+
7.3542-MercaptobenzothiazoleC7H5NS2167.9937[M+H]+
7.3792,2′-Dithiobis(benzothiazole)C14H8N2S4332.9646[M+H]+
7.798LPC (8:0)C16H34NO7P384.2142[M+H]+
7.952-(4-Morpholinyl)benzothiazoleC11H12N2OS221.0747[M+H]+
8.3732,6-Di-tert-butyl-4-(4-morpholinylmethyl)phenolC19H31NO2306.2433[M+H]+
9.341Bis (3,4-dimethyl-dibenzylidene sorbitol)C24H30O6432.2391_119.0852_135.0802_415.2123_453.1677[M+NH4]+_[M+H-C15H20O6]+_[M+H-C15H20O5]+_[M+H]+_[M+K]+
9.429LPC (16:0)C24H50NO7P496.3404[M+H]+
9.591-HexadecylamineC16H35N242.2846[M+H]+
9.765Tributyl phosphateC12H27O4P267.1721[M+H]+
9.87Docosan-1-amineC22H47N326.3792[M+H]+
9.962n-OctadecylamineC18H39N270.316[M+H]+
10.041,3-Acetonedicarboxylic acidC5H6O5129.0183[M+H-H2O]+
10.352Acetyl Tributyl CitrateC20H34O8425.216[M+Na]+
10.531PC(18:1_14:0)C40H78NO8P732.5511[M+H]+
10.536PC(16:0_18:1)C42H82NO8P760.585[M+H]+
10.611PC(18:1_18:1)C44H84NO8P786.6008[M+H]+
10.6271,2-Dipalmitoyl-sn-glycero-O-ethyl-3-phosphatidylcholine cationC42H85NO8P734.5695[Cat-C2H4]+
10.629PC(18:1_16:0)C42H82NO8P760.5867[M+H]+
10.822PalmitamideC16H33NO256.2644[M+H]+
10.927OleamideC18H35NO282.2797[M+H]+
11.3944-PalmitoylmorpholineC20H39NO2326.3062[M+H]+
11.528StearamideC18H37NO284.2953[M+H]+
Disclaimer/Publisher’s Note: The statements, opinions and data contained in all publications are solely those of the individual author(s) and contributor(s) and not of MDPI and/or the editor(s). MDPI and/or the editor(s) disclaim responsibility for any injury to people or property resulting from any ideas, methods, instructions or products referred to in the content.

