
Compositional Characteristics, Fatty Acid Profile, Phenolic Content and Volatile Organic Compounds (VOCs) of Feta Cheese Made in Mountainous Grasslands and Plains of Greece

 , , and
Abstract
:1. Introduction
2. Materials and Methods
2.1. Chemicals and Reagents
2.2. Animals and Diet
2.3. Cheesemaking
2.4. Physicochemical Analysis
2.5. Lipid Oxidation
2.6. Fatty Acids Analysis
2.7. Total Phenolic Content
2.8. Volatile Organic Compounds of Forage and Cheese
2.9. Statistical Analysis
3. Results and Discussion
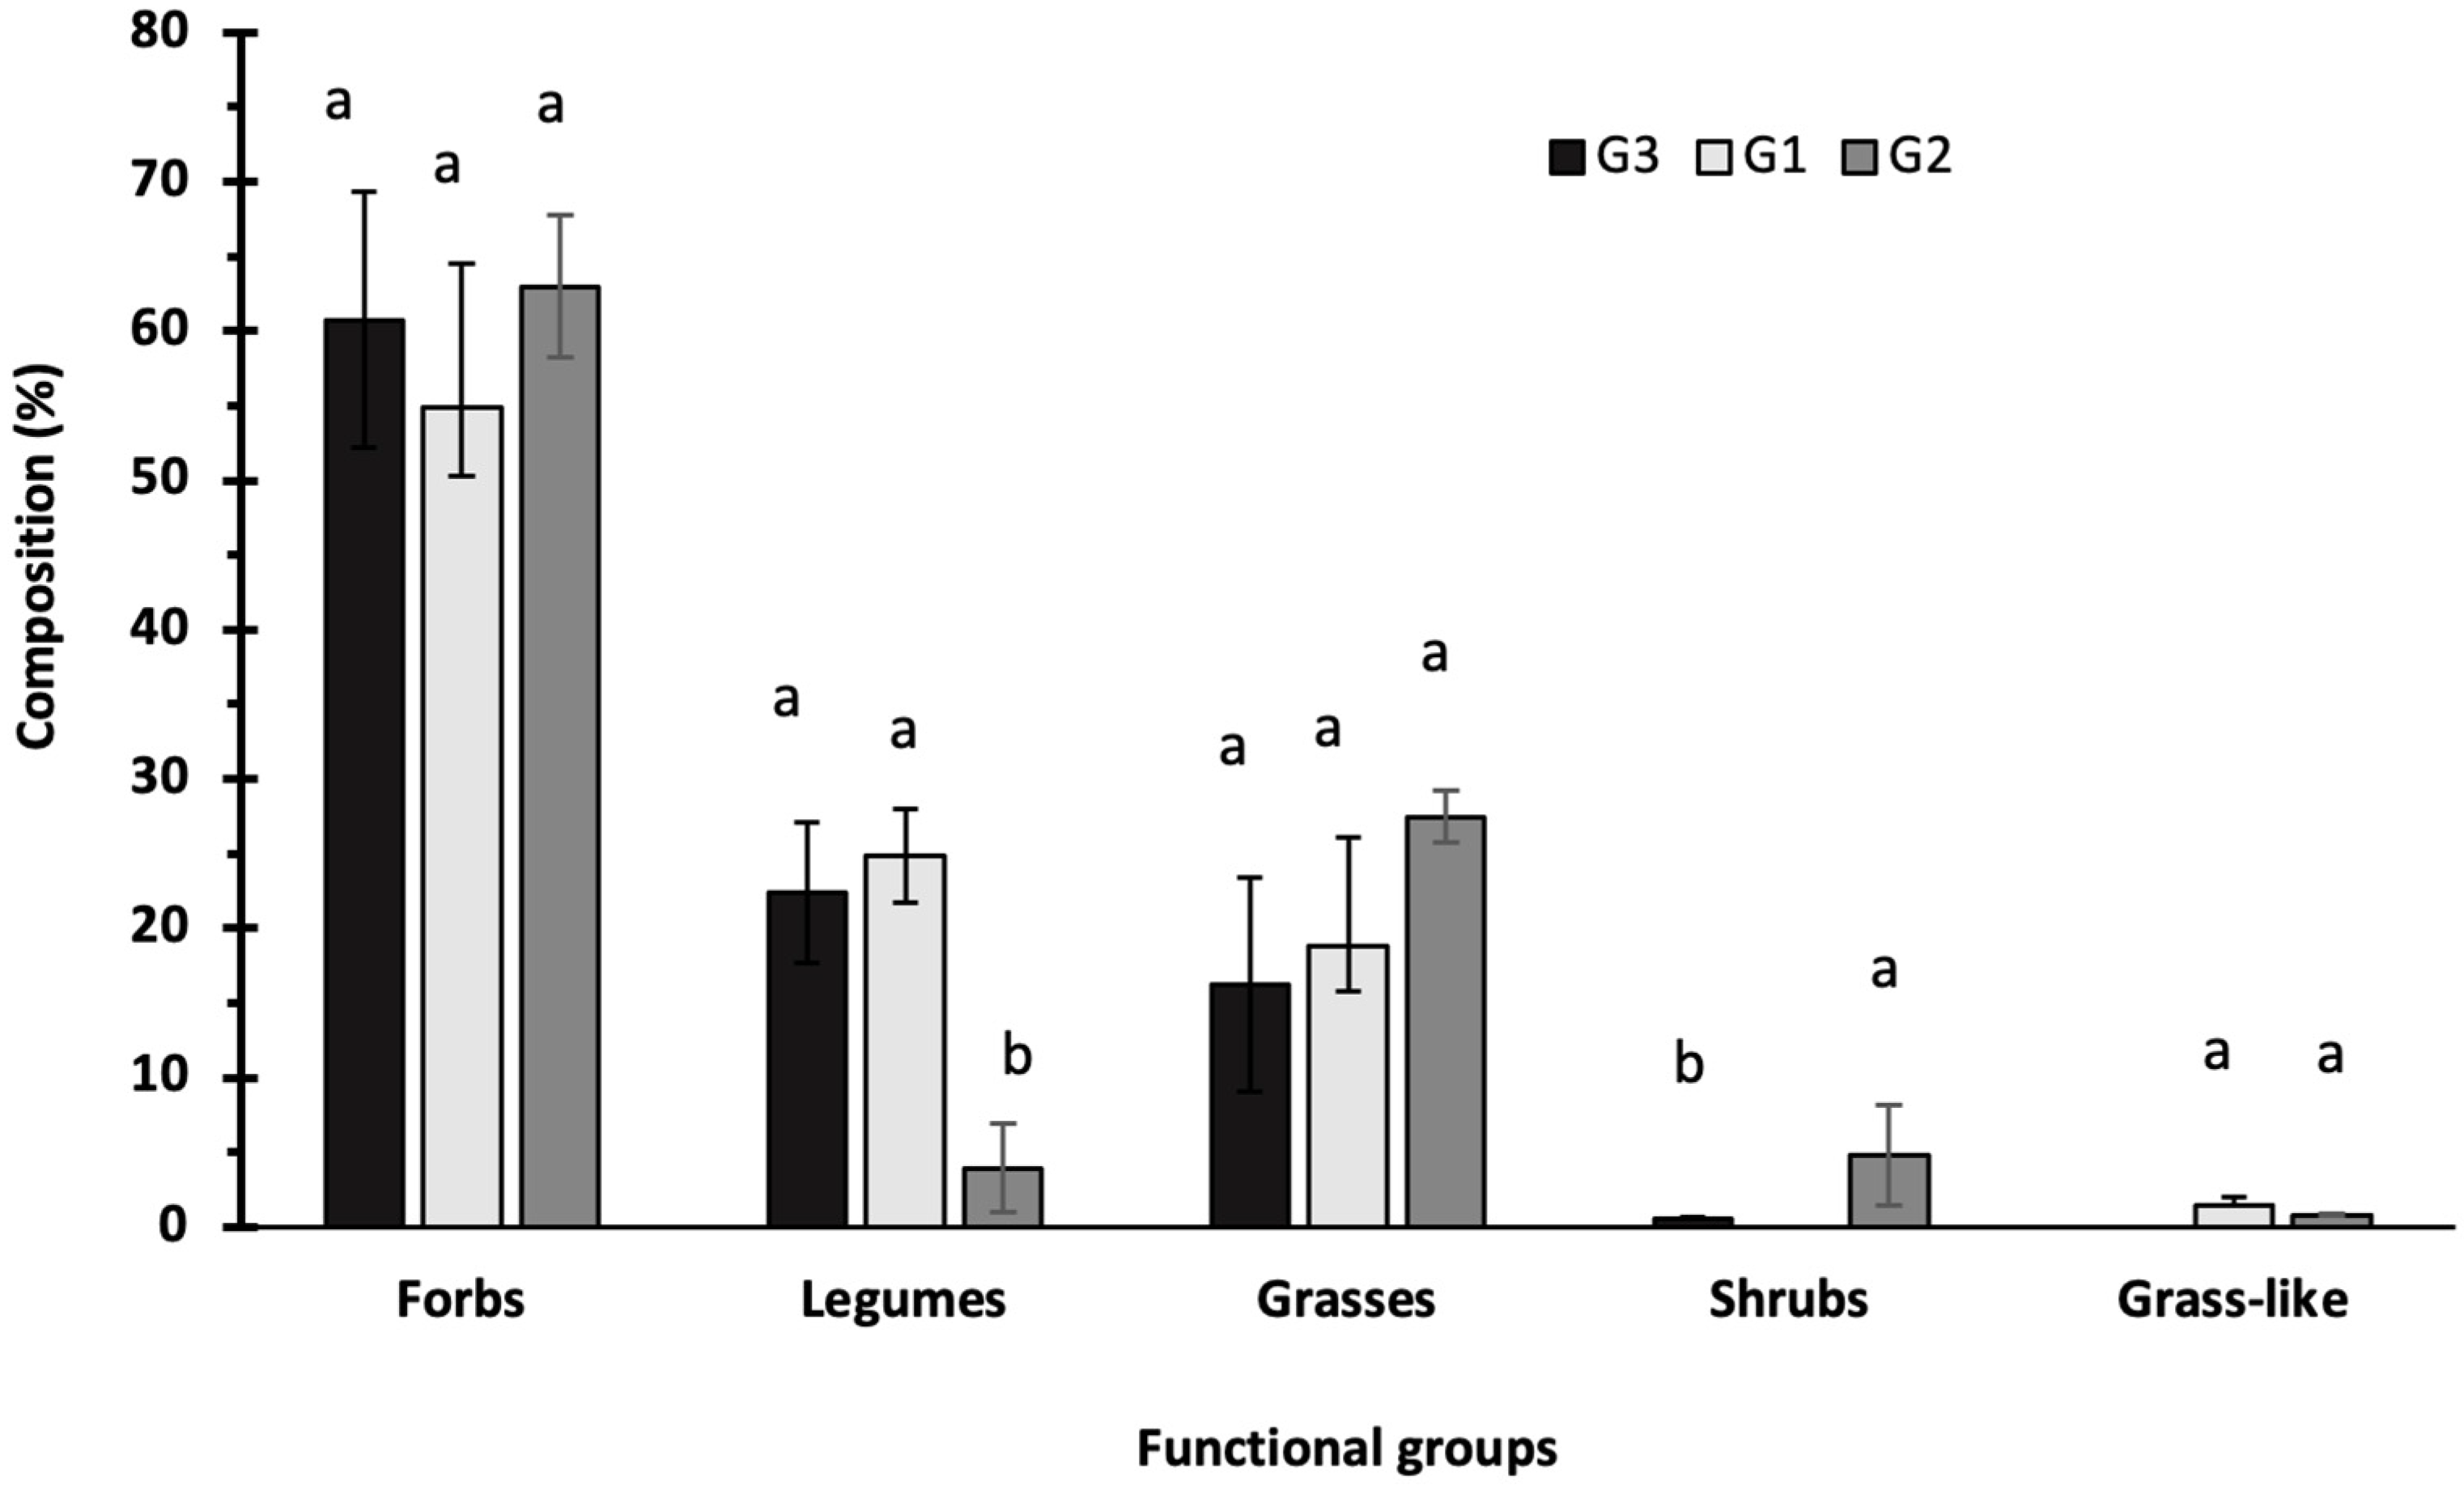
3.1. Floristic Composition
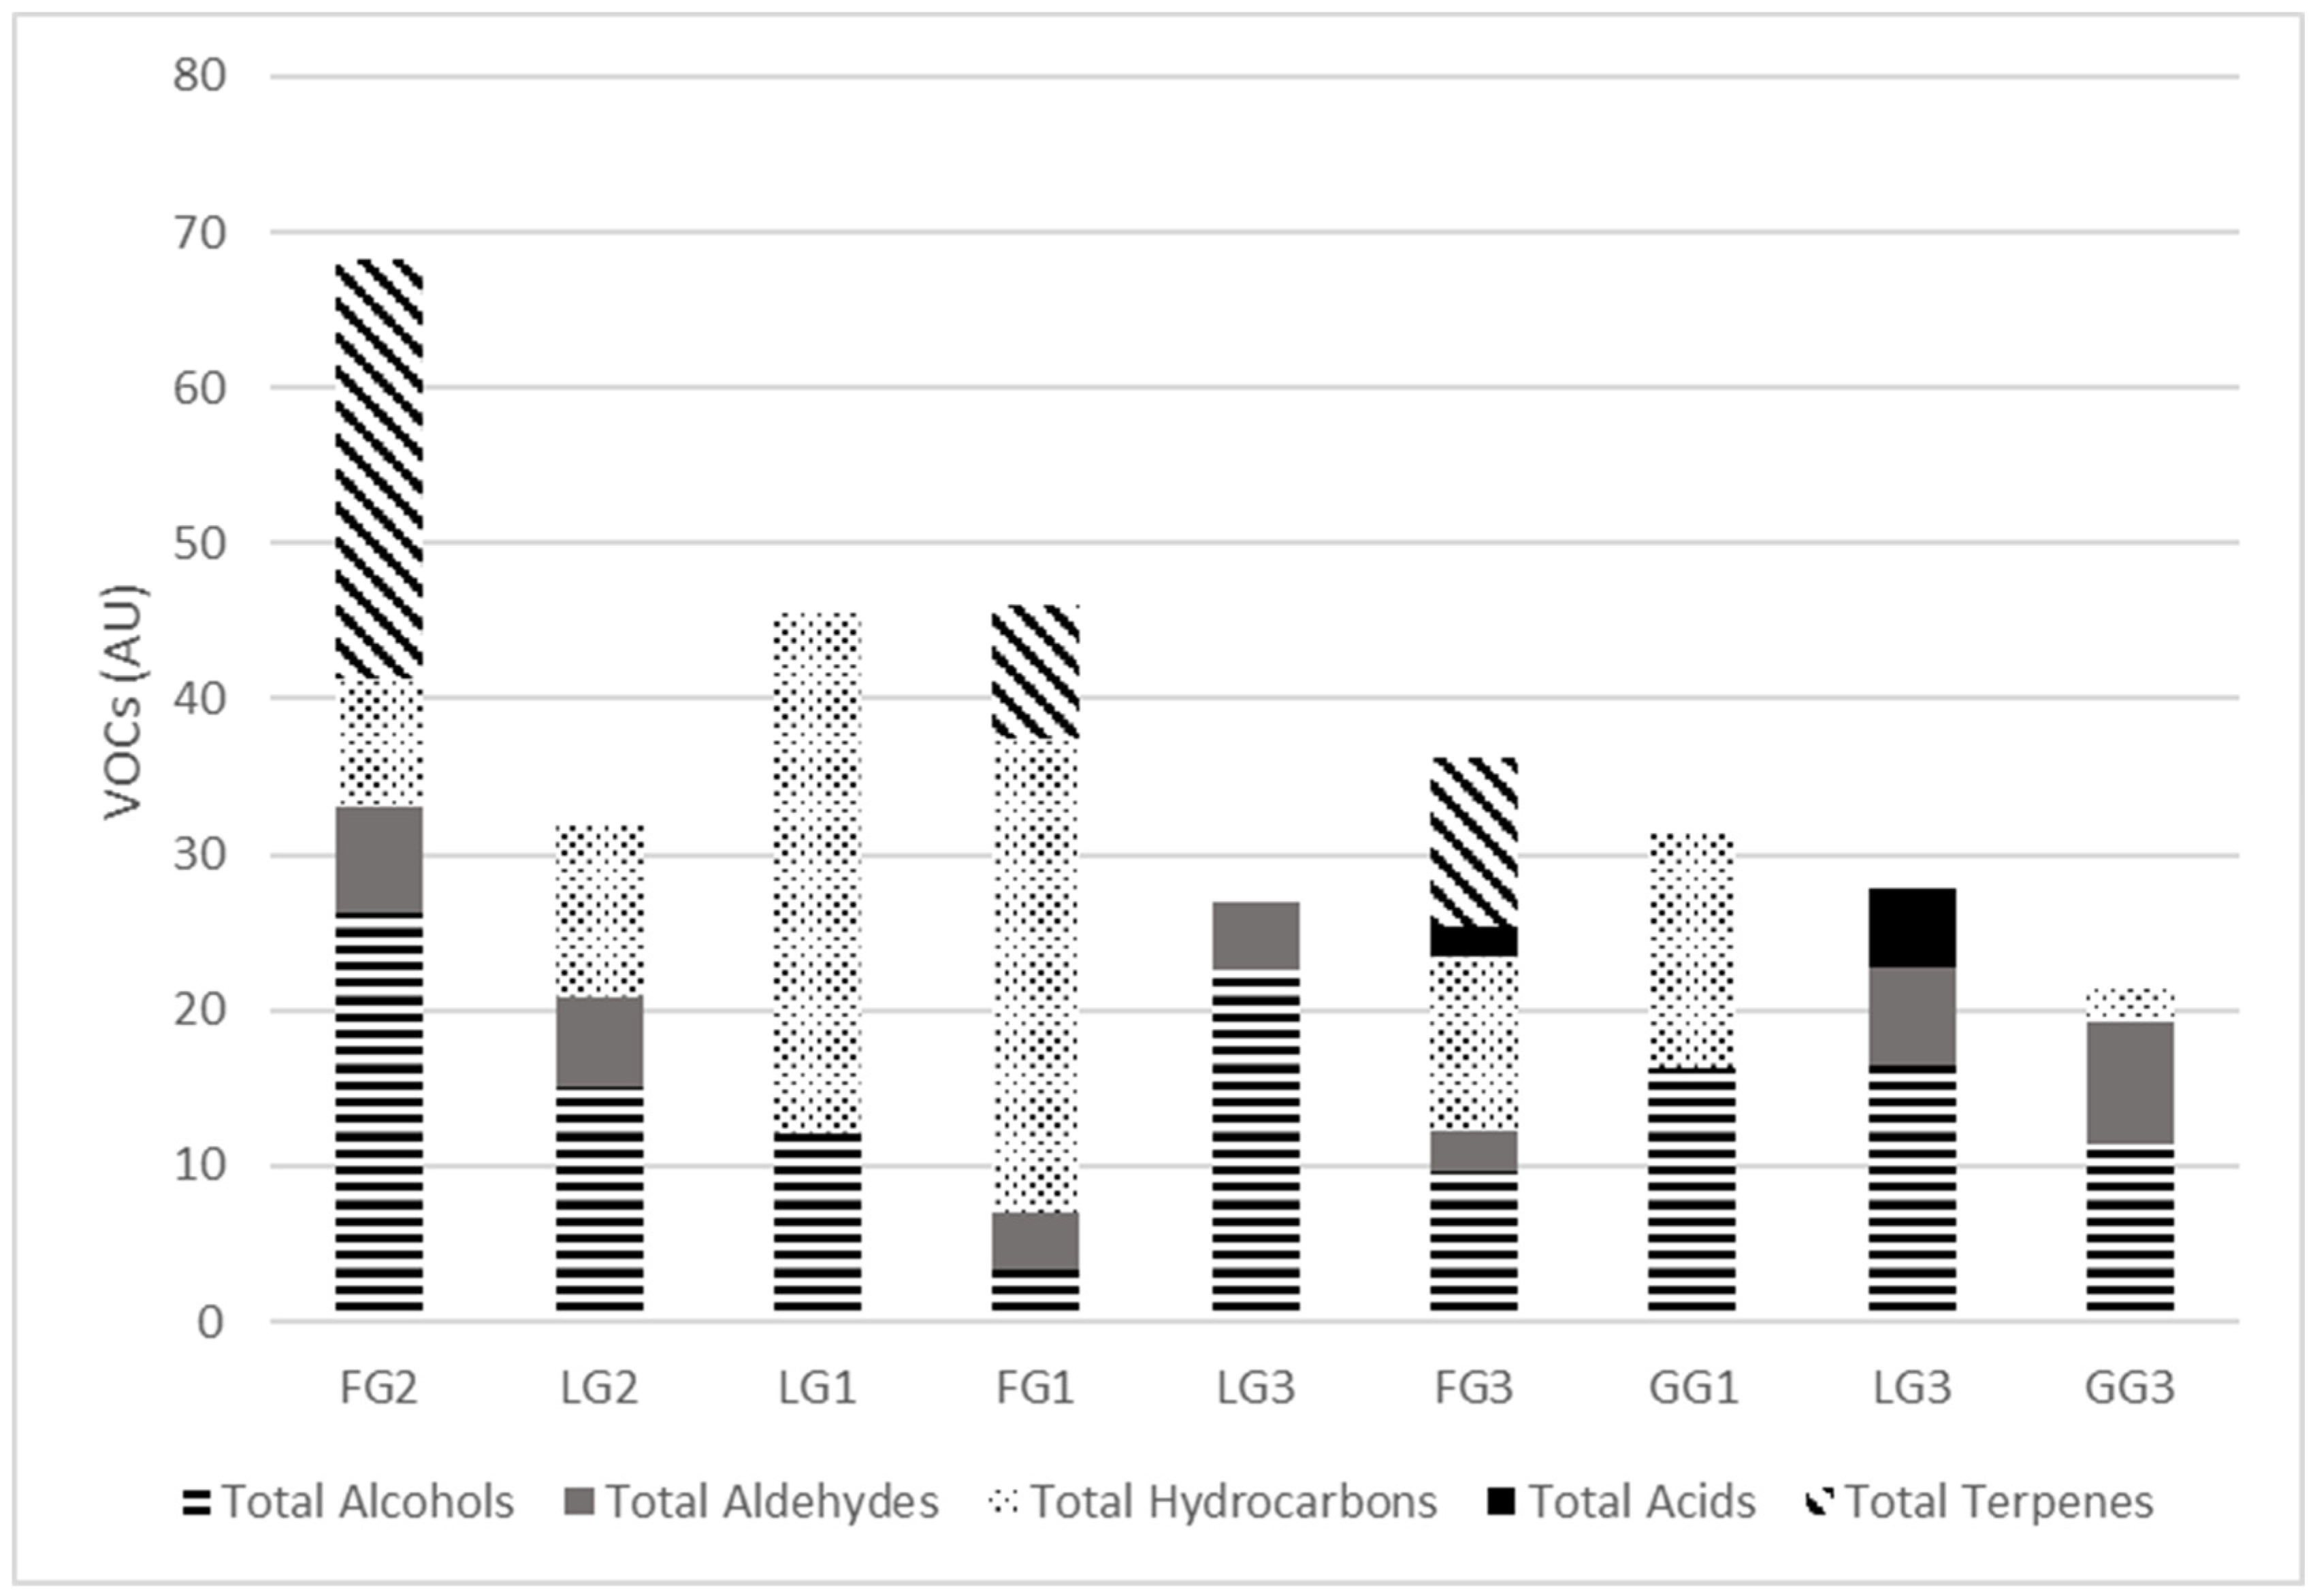
3.2. Volatile Organic Compound Content of the Pasture
3.3. Physicochemical Characteristics of Cheese
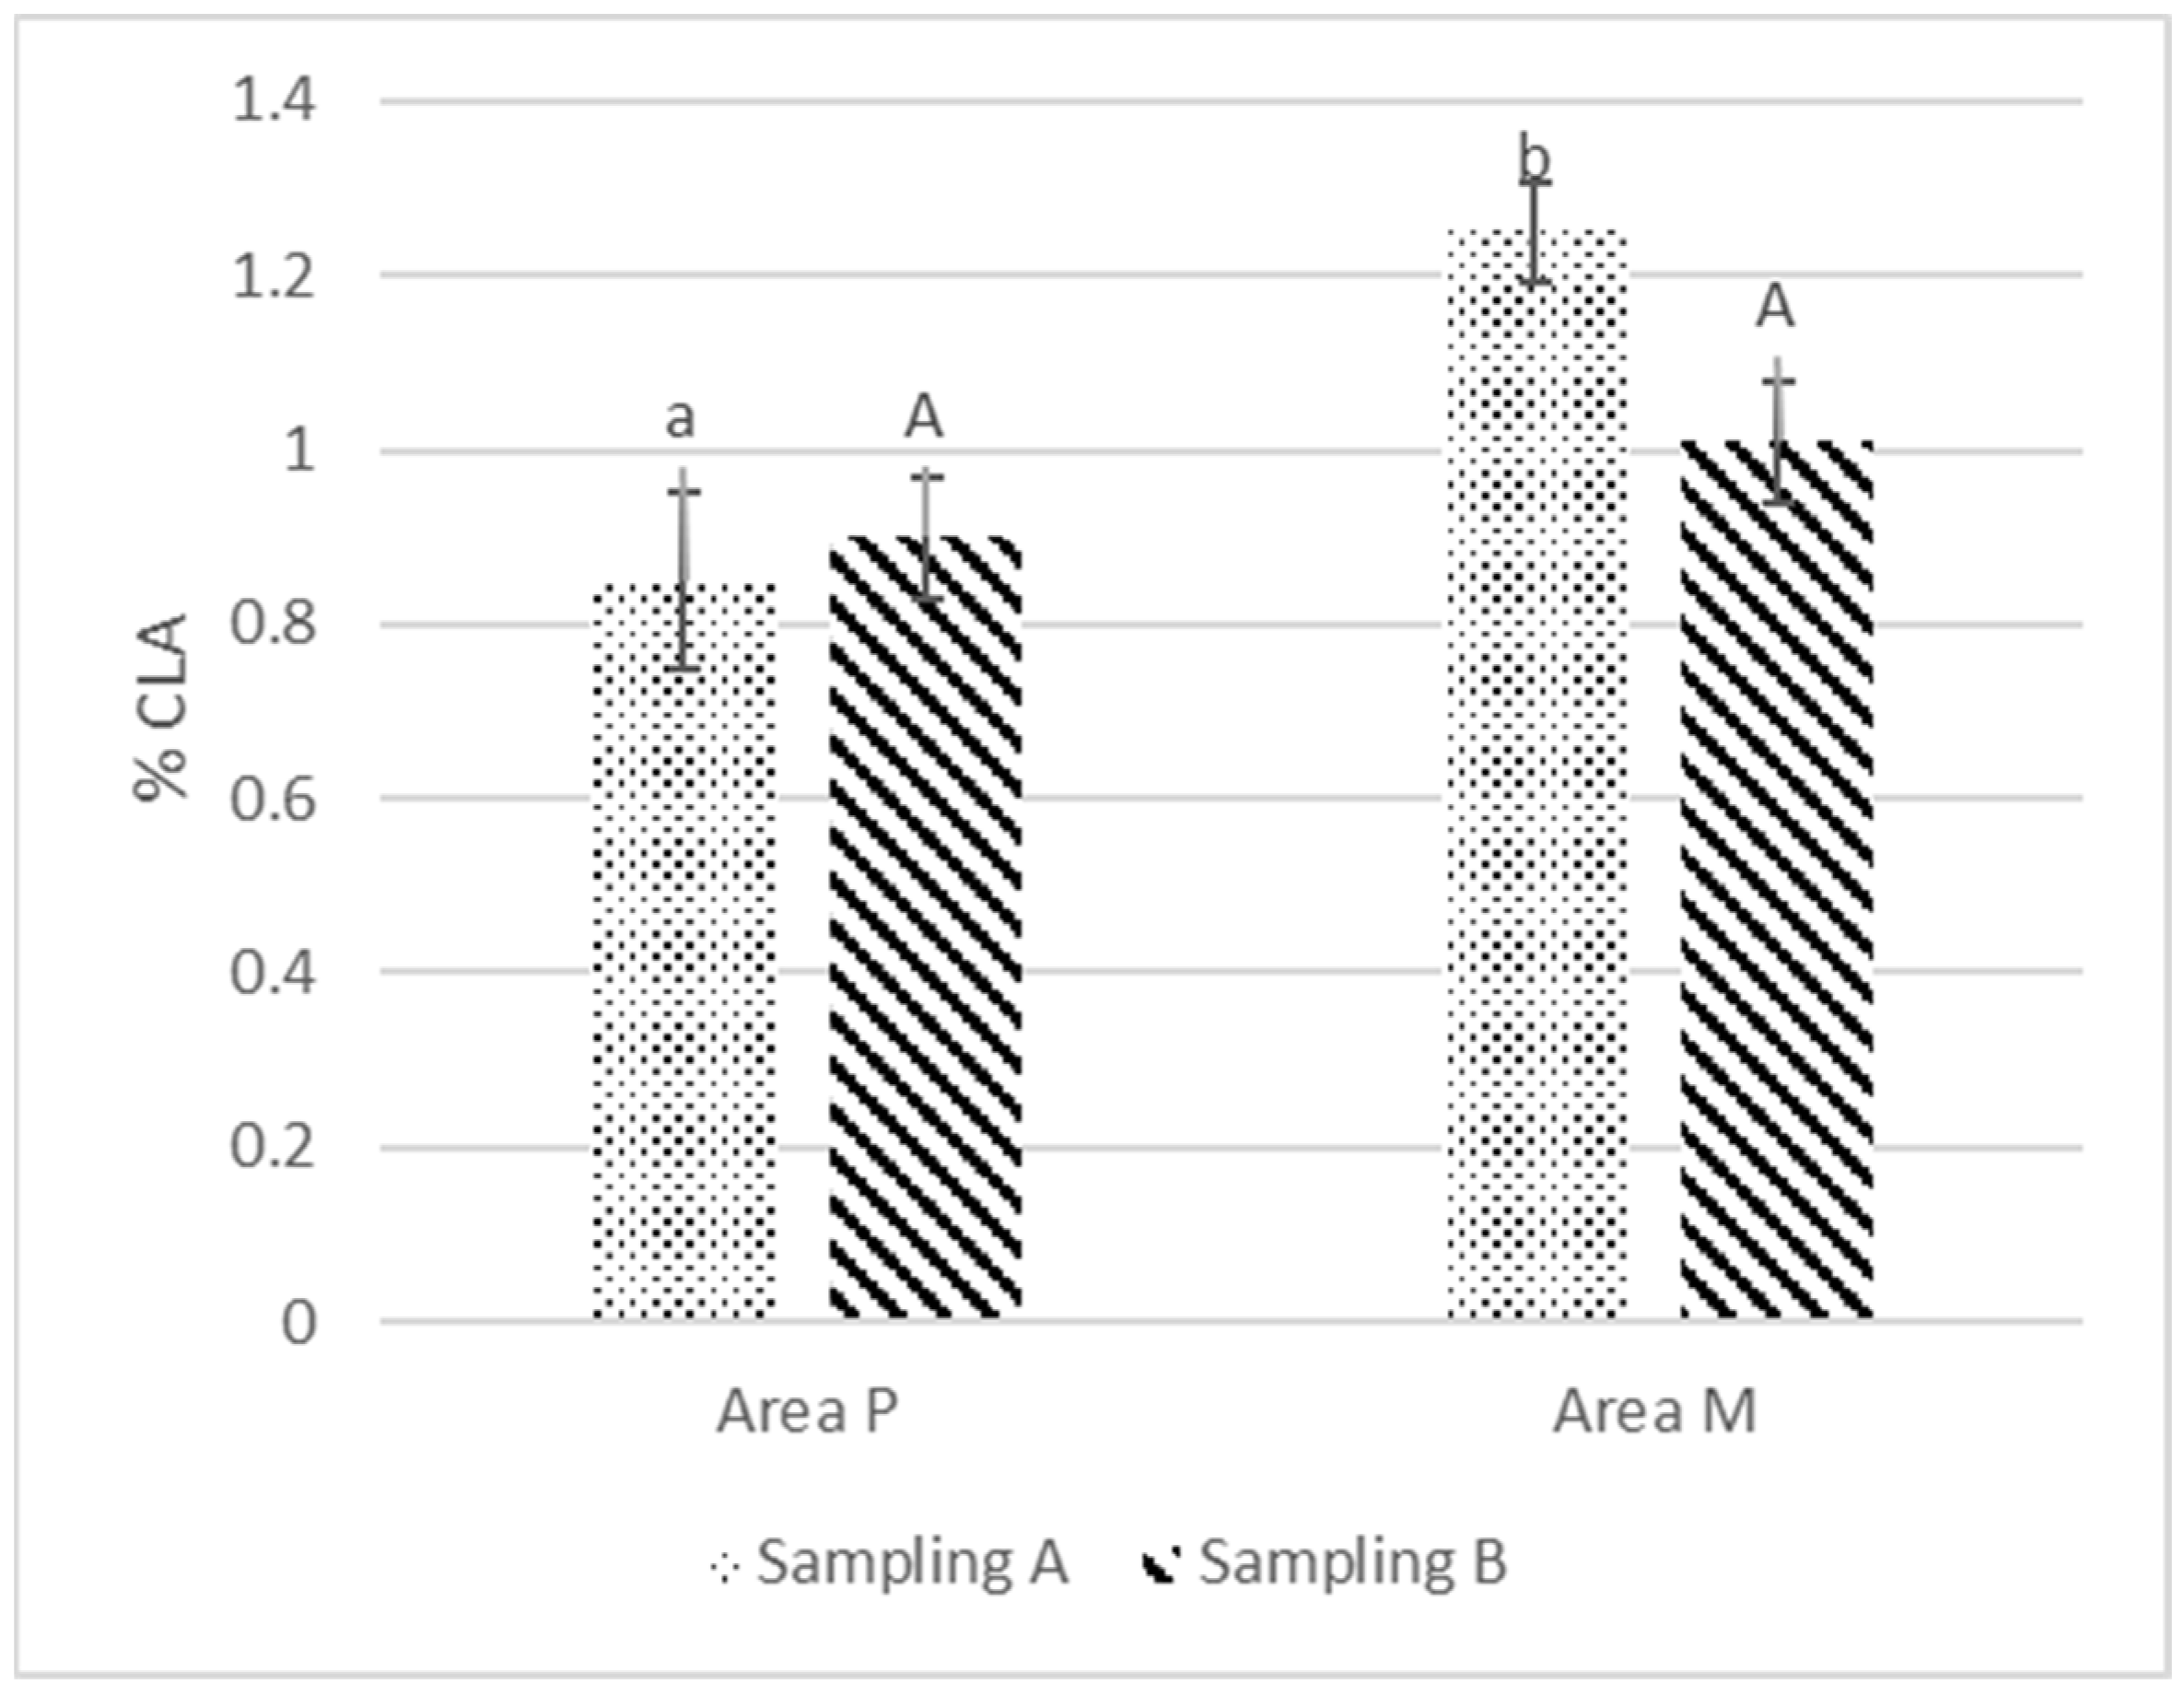
3.4. Fatty Acid Composition
3.5. Lipid Oxidation
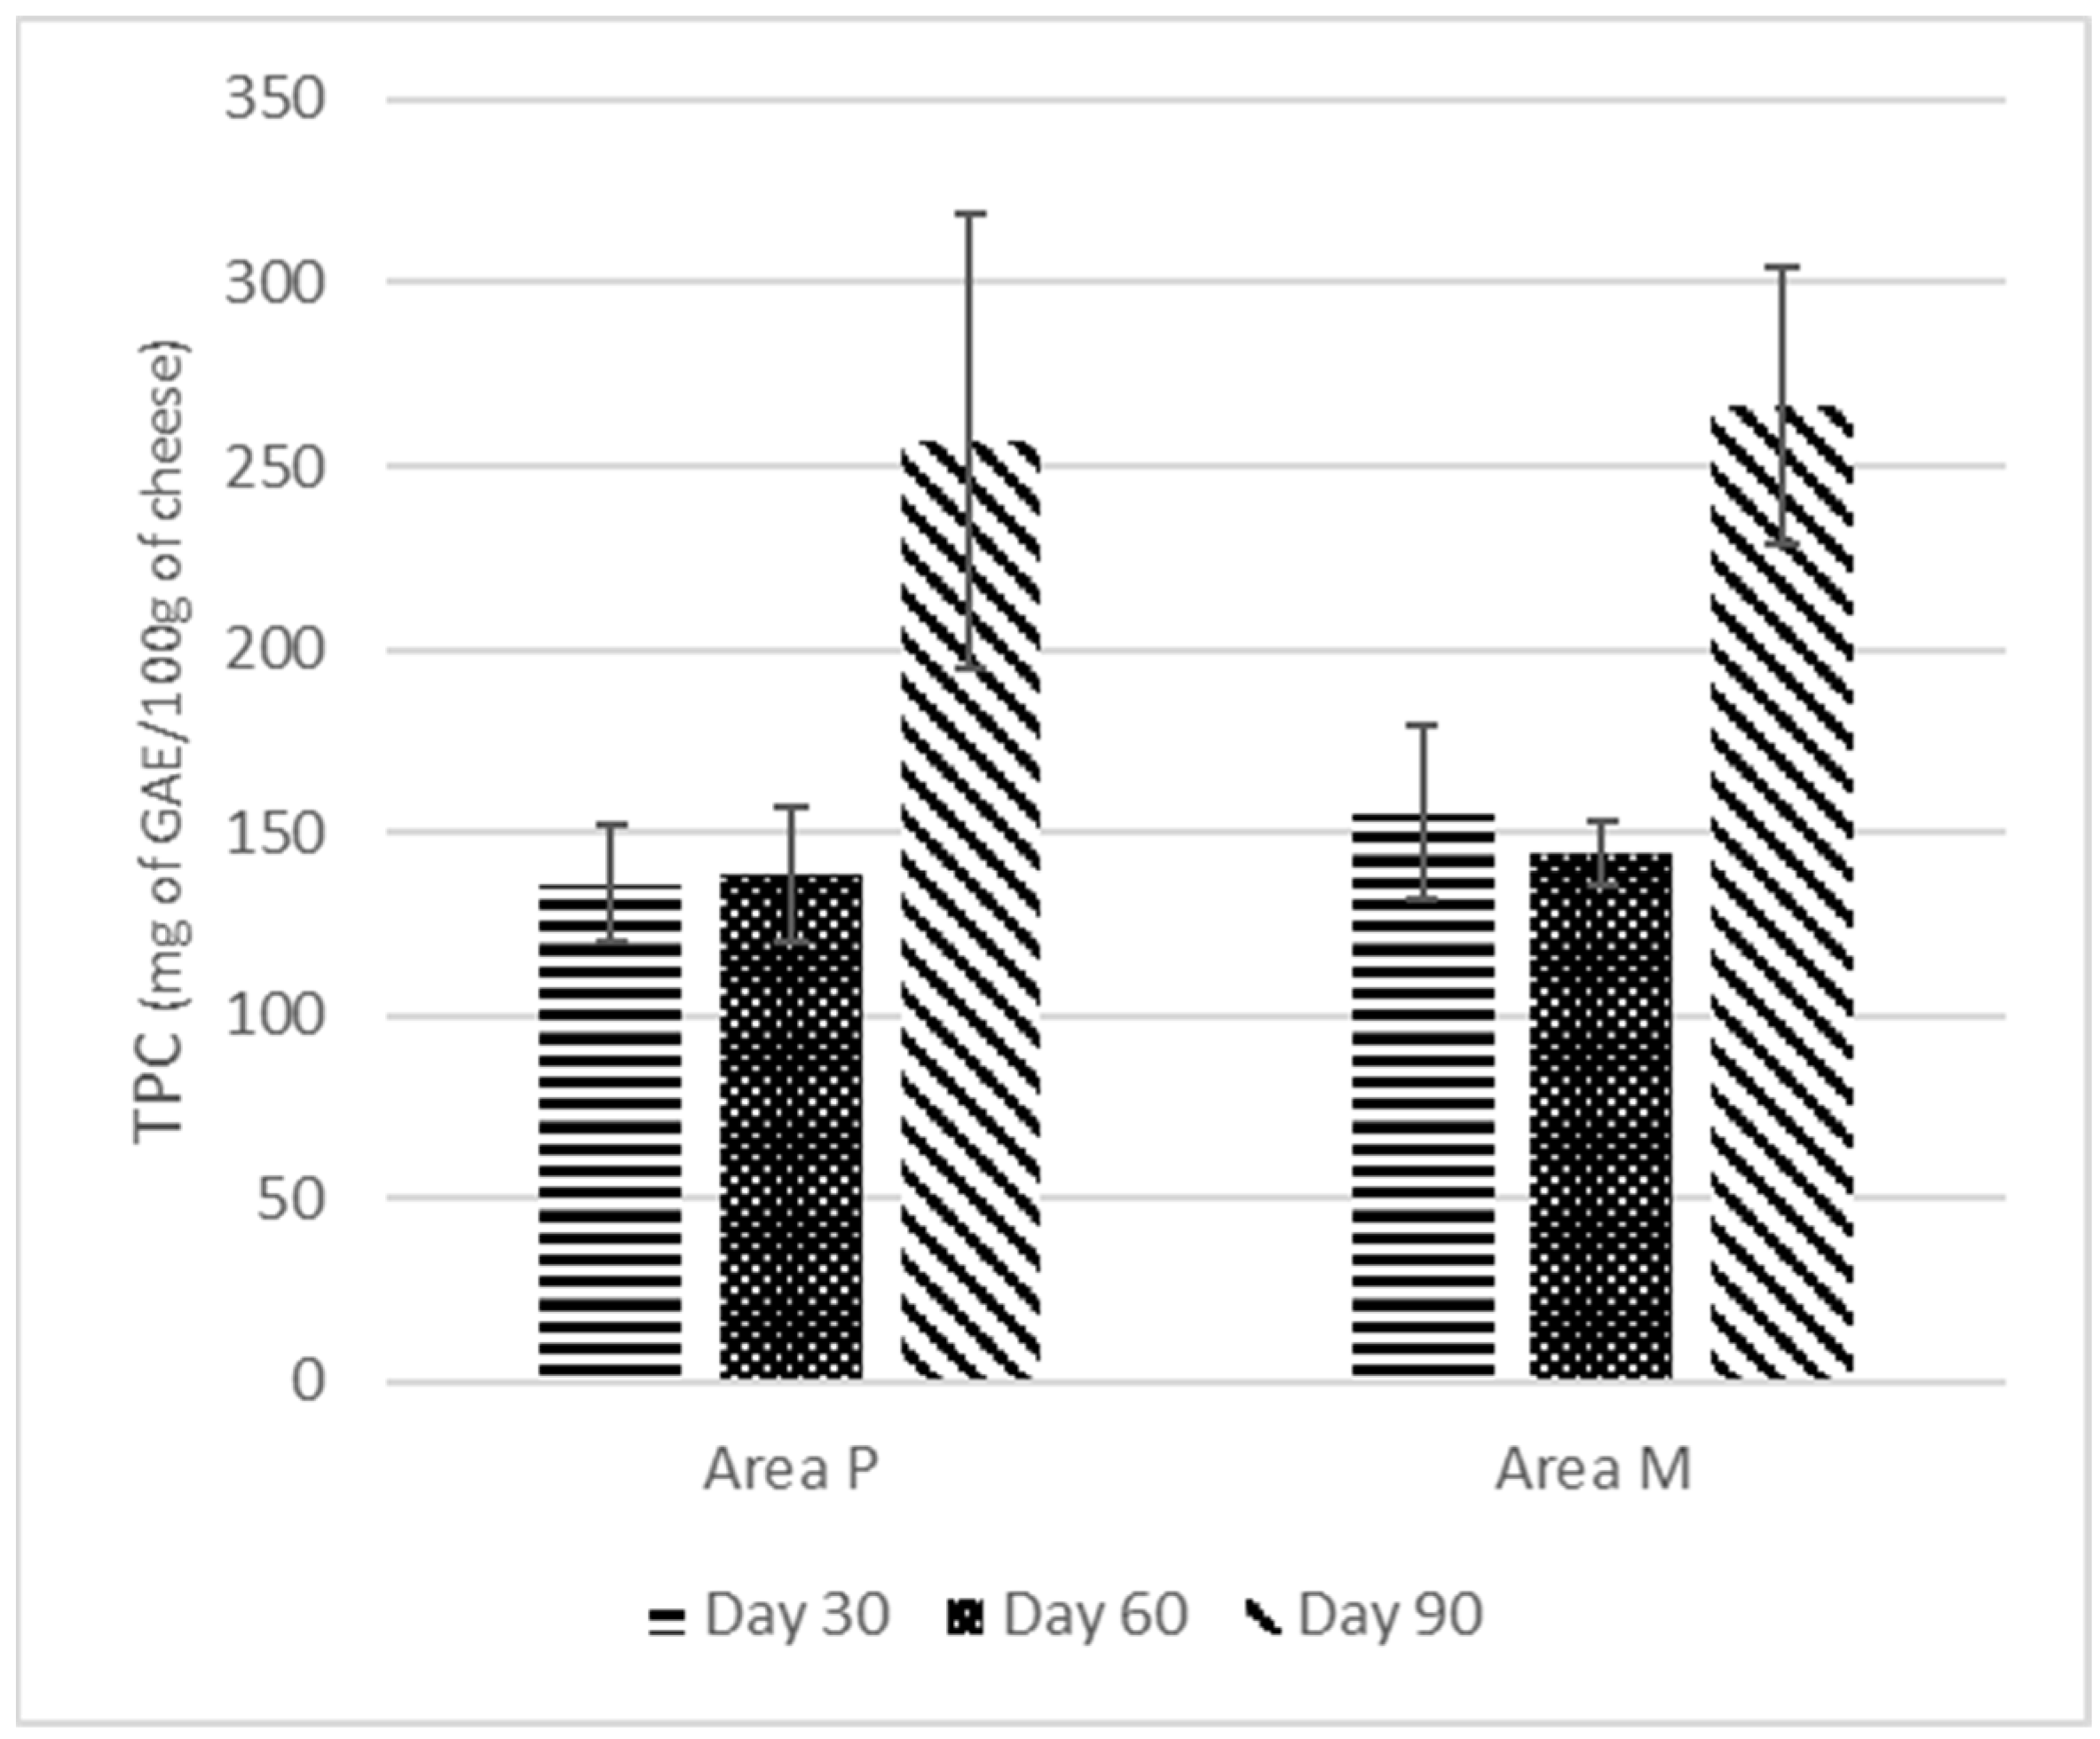
3.6. Total Phenolic Content
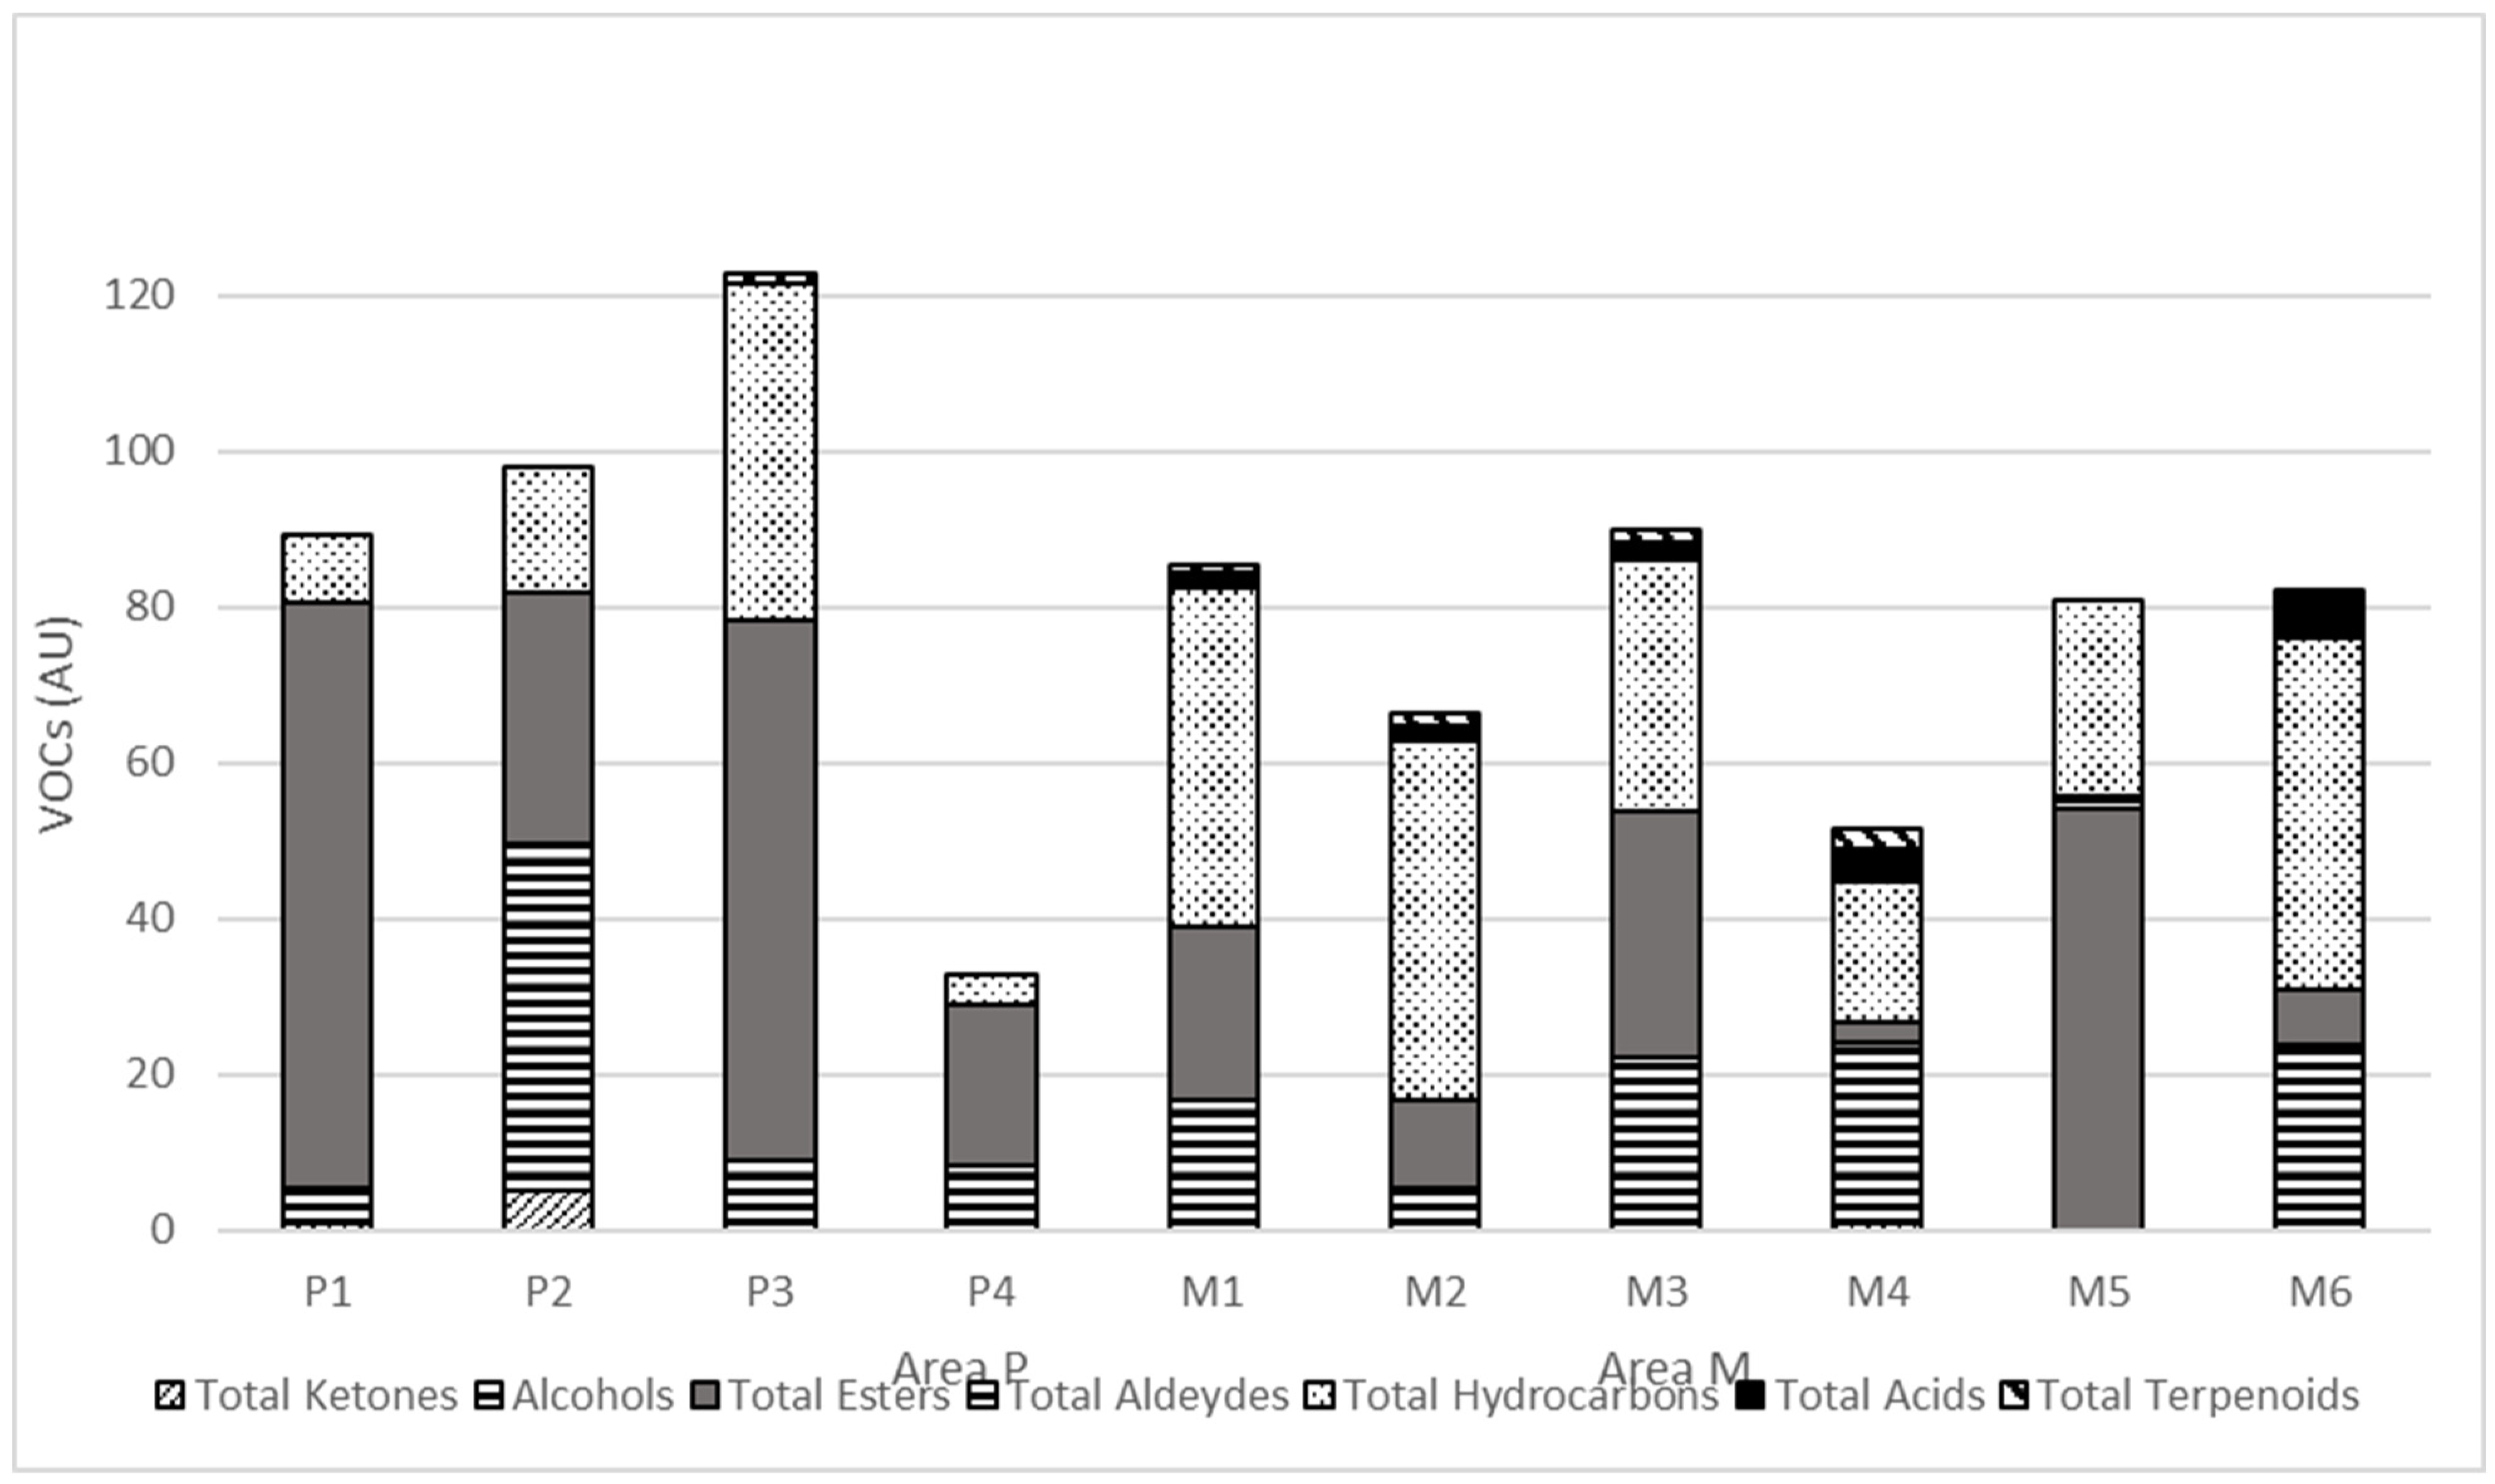
3.7. Volatile Organic Compound Content of the Cheeses
4. Conclusions
Author Contributions
Funding
Institutional Review Board Statement
Informed Consent Statement
Data Availability Statement
Conflicts of Interest
References
- Litopoulou-Tzanetaki, E.; Tzanetakis, N. Microbiological Characteristics of Greek Traditional Cheeses. Small Rumin. Res. 2011, 101, 17–32. [Google Scholar] [CrossRef]
- Anifantakis, E.M. Greek Cheeses: A Tradition of Centuries; National Dairy Committee of Greece: Athens, Greece, 1991. [Google Scholar]
- Morand-Fehr, P.; Fedele, V.; Decandia, M.; Le Frileux, Y. Influence of Farming and Feeding Systems on Composition and Quality of Goat and Sheep Milk. Small Rumin. Res. 2007, 68, 20–34. [Google Scholar] [CrossRef]
- Blondel, J. The ‘Design’ of Mediterranean Landscapes: A Millennial Story of Humans and Ecological Systems during the Historic Period. Hum. Ecol. 2006, 34, 713–729. [Google Scholar] [CrossRef]
- Oteros-Rozas, E.; Martín-López, B.; López, C.A.; Palomo, I.; González, J.A. Envisioning the Future of Transhumant Pastoralism through Participatory Scenario Planning: A Case Study in Spain. Rangel. J. 2013, 35, 251. [Google Scholar] [CrossRef]
- León, N.P.; Bruzzone, O.; Easdale, M.H. A Framework to Tackling the Synchrony between Social and Ecological Phases of the Annual Cyclic Movement of Transhumant Pastoralism. Sustainability 2020, 12, 3462. [Google Scholar] [CrossRef]
- De Noni, I.; Battelli, G. Terpenes and Fatty Acid Profiles of Milk Fat and “Bitto” Cheese as Affected by Transhumance of Cows on Different Mountain Pastures. Food Chem. 2008, 109, 299–309. [Google Scholar] [CrossRef] [PubMed]
- Basdagianni, Z.; Papaloukas, L.; Kyriakou, G.; Karaiskou, C.; Parissi, Z.; Sinapis, E.; Kasapidou, E. A Comparative Study of the Fatty Acid and Terpene Profiles of Ovine and Caprine Milk from Greek Mountain Sheep Breeds and a Local Goat Breed Raised under a Semi-Extensive Production System. Food Chem. 2019, 278, 625–629. [Google Scholar] [CrossRef]
- Matera, J.; Luna, A.S.; Batista, D.B.; Pimentel, T.C.; Moraes, J.; Kamimura, B.A.; Ferreira, M.V.S.; Silva, H.L.A.; Mathias, S.P.; Esmerino, E.A.; et al. Brazilian Cheeses: A Survey Covering Physicochemical Characteristics, Mineral Content, Fatty Acid Profile and Volatile Compounds. Food Res. Int. 2018, 108, 18–26. [Google Scholar] [CrossRef] [PubMed]
- Slots, T.; Butler, G.; Leifert, C.; Kristensen, T.; Skibsted, L.H.; Nielsen, J.H. Potentials to Differentiate Milk Composition by Different Feeding Strategies. J. Dairy Sci. 2009, 92, 2057–2066. [Google Scholar] [CrossRef]
- Bugaud, C.; Buchin, S.; Noël, Y.; Tessier, L.; Pochet, S.; Martin, B.; Chamba, J.; Buchin, S.; Chamba, J.F. Relationships between Abondance Cheese Texture, Its Composition and That of Milk Produced by Cows Grazing Different Types of Pastures. Lait 2001, 81, 593–607. [Google Scholar] [CrossRef]
- Soják, L.; Blaško, J.; Kubinec, R.; Górová, R.; Addová, G.; Ostrovský, I.; Margetín, M. Variation among Individuals, Breeds, Parities and Milk Fatty Acid Profile and Milk Yield of Ewes Grazed on Pasture. Small Rumin. Res. 2013, 109, 173–181. [Google Scholar] [CrossRef]
- Cook, C.W.; Stubbendieck, J.L. Range Research: Basic Problems and Techniques; Society for Range Management: Englewood, CO, USA, 1986; p. 317. [Google Scholar]
- ISO 2920:2004; Whey Cheese—Determination of Dry Matter (Reference Method). ISO: Geneva, Switzerland, 2004. Available online: https://www.iso.org/standard/40464.html (accessed on 2 September 2021).
- ISO 3433:2008; Cheese—Determination of Fat Content—Van Gulik Method. ISO: Geneva, Switzerland, 2008. Available online: https://www.iso.org/standard/46336.html (accessed on 2 September 2021).
- AOAC 920.123-1920; Nitrogen in Cheese-$14.15: AOAC Official Method. AOAC: Rockville, MD, USA, 2015. Available online: http://www.aoacofficialmethod.org/index.php?main_page=product_info&products_id=852 (accessed on 2 September 2021).
- ISO 8968-1:2014; Milk and Milk Products—Determination of Nitrogen Content—Part 1: Kjeldahl Principle and Crude Protein Calculation. ISO: Geneva, Switzerland, 2014. Available online: https://www.iso.org/standard/61020.html (accessed on 17 May 2023).
- Kosikowski, F.V. Cheese and Fermented Milk Foods, 2nd ed.; Edwards Brothers, Inc.: Ann Arbor, MI, USA, 1977. [Google Scholar]
- Botsoglou, N.A.; Fletouris, D.J.; Papageorgiou, G.E.; Vassilopoulos, V.N.; Mantis, A.J.; Trakatellis, A.G. Rapid, Sensitive, and Specific Thiobarbituric Acid Method for Measuring Lipid Peroxidation in Animal Tissue, Food, and Feedstuff Samples. J. Agric. Food Chem. 2002, 42, 1931–1937. [Google Scholar] [CrossRef]
- ISO 12966-2:2017; Animal and Vegetable Fats and Oils Gas Chromatography of Fatty Acid Methyl Esters Part 2: Preparation of Methyl Esters of Fatty Acids. ISO: Geneva, Switzerland, 2017. Available online: https://www.iso.org/standard/72142.html (accessed on 17 May 2023).
- Giorgio, D.; Di Trana, A.; Di Napoli, M.A.; Sepe, L.; Cecchini, S.; Rossi, R.; Claps, S. Comparison of Cheeses from Goats Fed 7 Forages Based on a New Health Index. J. Dairy Sci. 2019, 102, 6790–6801. [Google Scholar] [CrossRef]
- Kamtekar, S.; Keer, V.; Patil, V. Estimation of Phenolic Content, Flavonoid Content, Antioxidant and Alpha Amylase Inhibitory Activity of Marketed Polyherbal Formulation. J. Appl. Pharm. Sci. 2014, 4, 61–65. [Google Scholar] [CrossRef]
- Lo, M.M.; Benfodda, Z.; Bénimélis, D.; Fontaine, J.X.; Molinié, R.; Meffre, P. Development of a HS-SPME/GC-MS Method for the Extraction and Identification of the Volatile Compounds Emitted by Flowers of Tillandsia Xiphioides. ACS Omega 2021, 6, 12691–12698. [Google Scholar] [CrossRef]
- Download JASP-JASP-Free and User-Friendly Statistical Software. Available online: https://jasp-stats.org/download/ (accessed on 17 May 2023).
- Jafari, M.; Chahouki, M.A.Z.; Tavili, A.; Azarnivand, H.; Amiri, G.Z. Effective Environmental Factors in the Distribution of Vegetation Types in Poshtkouh Rangelands of Yazd Province (Iran). J. Arid Environ. 2004, 56, 627–641. [Google Scholar] [CrossRef]
- Čop, J.; Vidrih, M.; Hacin, J. Influence of Cutting Regime and Fertilizer Application on the Botanical Composition, Yield and Nutritive Value of Herbage of Wet Grasslands in Central Europe. Grass Forage Sci. 2009, 64, 454–465. [Google Scholar] [CrossRef]
- Holechek, J.; Pieper, R.D.; Herbel, C.H. Range Management: Principles and Practices; Pearson: London, UK, 2001; p. 587. [Google Scholar]
- Povolo, M.; Contarini, G.; Mele, M.; Secchiari, P. Study on the Influence of Pasture on Volatile Fraction of Ewes’ Dairy Products by Solid-Phase Microextraction and Gas Chromatography-Mass Spectrometry. J. Dairy Sci. 2007, 90, 556–569. [Google Scholar] [CrossRef] [PubMed]
- Bozoudi, D.; Claps, S.; Abraham, E.M.; Parissi, Z.M.; Litopoulou-Tzanetaki, E. Volatile Organic Compounds of Mountainous Plant Species and the Produced Milk as Affected by Altitude in Greece: A Preliminary Study. Int. J. Dairy Technol. 2019, 72, 159–164. [Google Scholar] [CrossRef]
- Fedele, V.; Rubino, R.; Claps, S.; Sepe, L.; Morone, G. Seasonal Evolution of Volatile Compounds Content and Aromatic Profile in Milk and Cheese from Grazing Goat. Small Rumin. Res. 2005, 59, 273–279. [Google Scholar] [CrossRef]
- Abd El-Salam, M.H. CHEESES White Brined Varieties. In Encyclopedia of Food Sciences and Nutrition; Academic Press: Cambridge, MA, USA, 2003; pp. 1098–1103. [Google Scholar] [CrossRef]
- Alichanidis, E. Cheeses Ripened in Brine: Introduction. In Cheese Problems Solved; Woodhead Publishing: Sawston, UK, 2007; pp. 330–331. [Google Scholar] [CrossRef]
- Bozoudi, D.; Kondyli, E.; Claps, S.; Hatzikamari, M.; Michaelidou, A.; Biliaderis, C.G.; Litopoulou-Tzanetaki, E. Compositional Characteristics and Volatile Organic Compounds of Traditional PDO Feta Cheese Made in Two Different Mountainous Areas of Greece. Int. J. Dairy Technol. 2018, 71, 673–682. [Google Scholar] [CrossRef]
- Carpino, S.; Horne, J.; Melilli, C.; Licitra, G.; Barbano, D.M.; Van Soest, P.J. Contribution of Native Pasture to the Sensory Properties of Ragusano Cheese. J. Dairy Sci. 2004, 87, 308–315. [Google Scholar] [CrossRef] [PubMed]
- Summer, A.; Formaggioni, P.; Franceschi, P.; Di Frangia, F.; Righi, F.; Malacarne, M. Cheese as Functional Food. Food Technol. Biotechnol. 2017, 55, 277–289. [Google Scholar] [CrossRef] [PubMed]
- Danezis, G.P.; Tsiplakou, E.; Pappa, E.C.; Pappas, A.C.; Mavrommatis, A.; Sotirakoglou, K.; Georgiou, C.A.; Zervas, G. Fatty Acid Profile and Physicochemical Properties of Greek Protected Designation of Origin Cheeses, Implications for Authentication. Eur. Food Res. Technol. 2020, 246, 1741–1753. [Google Scholar] [CrossRef]
- Laskaridis, K.; Serafeimidou, A.; Zlatanos, S.; Gylou, E.; Kontorepanidou, E.; Sagredos, A. Changes in Fatty Acid Profile of Feta Cheese Including Conjugated Linoleic Acid. J. Sci. Food Agric. 2013, 93, 2130–2136. [Google Scholar] [CrossRef]
- Ioannidou, M.D.; Maggira, M.; Samouris, G. Physicochemical Characteristics, Fatty Acids Profile and Lipid Oxidation during Ripening of Graviera Cheese Produced with Raw and Pasteurized Milk. Foods 2022, 11, 2138. [Google Scholar] [CrossRef]
- Malacarne, M.; Summer, A.; Franceschi, P.; Formaggioni, P.; Pecorari, M.; Panari, G.; Mariani, P. Free Fatty Acid Profile of Parmigiano–Reggiano Cheese throughout Ripening: Comparison between the Inner and Outer Regions of the Wheel. Int. Dairy J. 2009, 19, 637–641. [Google Scholar] [CrossRef]
- de la Fuente, M.A.; Fontecha, J.; Juárez, M. Fatty Acid Composition of the Triglyceride and Free Fatty Acid Fractions in Different Cows-, Ewes- and Goats-Milk Cheeses. Z. Lebensm. Unters. Forsch. 1993, 196, 155–158. [Google Scholar] [CrossRef]
- Woo, A.H.; Lindsay, R.C. Concentrations of Major Free Fatty Acids and Flavor Development in Italian Cheese Varieties. J. Dairy Sci. 1984, 67, 960–968. [Google Scholar] [CrossRef]
- Gatzias, I.S.; Karabagias, I.K.; Kontominas, M.G.; Badeka, A.V. Geographical Differentiation of Feta Cheese from Northern Greece Based on Physicochemical Parameters, Volatile Compounds and Fatty Acids. LWT 2020, 131, 109615. [Google Scholar] [CrossRef]
- Akn, N.; Aydemir, S.; Koçak, C.; Yildiz, M.A. Changes of Free Fatty Acid Contents and Sensory Properties of White Pickled Cheese during Ripening. Food Chem. 2003, 80, 77–83. [Google Scholar] [CrossRef]
- Corazzin, M.; Romanzin, A.; Sepulcri, A.; Pinosa, M.; Piasentier, E.; Bovolenta, S. Fatty Acid Profiles of Cow’s Milk and Cheese as Affected by Mountain Pasture Type and Concentrate Supplementation. Animals 2019, 9, 68. [Google Scholar] [CrossRef] [PubMed]
- Ledoux, M.; Chardigny, J.-M.; Darbois, M.; Soustre, Y.; Laloux, L. Fatty Acid Composition of French Butters, with Special Emphasis on Conjugated Linoleic Acid (CLA) Isomers. J. Food Compos. Anal. 2005, 18, 409–425. [Google Scholar] [CrossRef]
- Dhiman, T.R.; Anand, G.R.; Satter, L.D.; Pariza, M.W. Conjugated Linoleic Acid Content of Milk from Cows Fed Different Diets. J. Dairy Sci. 1999, 82, 2146–2156. [Google Scholar] [CrossRef] [PubMed]
- Jahreis, G.; Fritsche, J.; Steinhart, H. Conjugated linoleic acid in milk fat: High variation depending on production system. Nutr. Res. 1997, 17, 1479–1484. [Google Scholar] [CrossRef]
- Maurelli, S.; Blasi, F.; Cossignani, L.; Bosi, A.; Simonetti, M.S.; Damiani, P. Enzymatic Synthesis of Structured Triacylglycerols Containing CLA Isomers Starting from Sn-1,3-Diacylglycerols. J. Am. Oil Chem. Soc. 2009, 86, 127–133. [Google Scholar] [CrossRef]
- Garaffo, M.A.; Vassallo-Agius, R.; Nengas, Y.; Lembo, E.; Rando, R.; Maisano, R.; Dugo, G.; Giuffrida, D. Fatty Acids Profile, Atherogenic (IA) and Thrombogenic (IT) Health Lipid Indices, of Raw Roe of Blue Fin Tuna (Thunnus thynnus L.) and Their Salted Product “Bottarga”. Food Nutr. Sci. 2011, 2, 736–743. [Google Scholar] [CrossRef]
- Kliem, K.E.; Humphries, D.J.; Grandison, A.S.; Morgan, R.; Livingstone, K.M.; Givens, D.I.; Reynolds, C.K. Effect of a Whey Protein and Rapeseed Oil Gel Feed Supplement on Milk Fatty Acid Composition of Holstein Cows. J. Dairy Sci. 2019, 102, 288–300. [Google Scholar] [CrossRef]
- Rego, O.A.; J Cabrita, A.R.; D Rosa, H.J.; Alves, S.P.; Duarte, V.; M Fonseca, A.J.; M Vouzela, C.F.; Rocha Pires, F.; B Bessa, R.J. Changes in Milk Production and Milk Fatty Acid Composition of Cows Switched from Pasture to a Total Mixed Ration Diet and Back to Pasture. Ital. J. Anim. Sci. 2016, 15, 76–86. [Google Scholar] [CrossRef]
- Elgersma, A. Grazing Increases the Unsaturated Fatty Acid Concentration of Milk from Grass-Fed Cows: A Review of the Contributing Factors, Challenges and Future Perspectives. Eur. J. Lipid Sci. Technol. 2015, 117, 1345–1369. [Google Scholar] [CrossRef]
- Delgado, F.J.; González-Crespo, J.; Ladero, L.; Cava, R.; Ramírez, R. Free Fatty Acids and Oxidative Changes of a Spanish Soft Cheese (PDO ’Torta Del Casar’) during Ripening. Int. J. Food Sci. Technol. 2009, 44, 1721–1728. [Google Scholar] [CrossRef]
- Rashidinejad, A.; Birch, E.J.; Everett, D.W. Effects of (+)-Catechin on the Composition, Phenolic Content and Antioxidant Activity of Full-Fat Cheese during Ripening and Recovery of (+)-Catechin after Simulated in Vitro Digestion. Antioxidants 2016, 5, 29. [Google Scholar] [CrossRef] [PubMed]
- Rashidinejad, A.; Birch, E.J.; Sun-Waterhouse, D.; Everett, D.W. Effects of Catechin on the Phenolic Content and Antioxidant Properties of Low-Fat Cheese. Int. J. Food Sci. Technol. 2013, 48, 2448–2455. [Google Scholar] [CrossRef]
- Shrivastava, A.; Gupta, B.V. Methods for the Determination of Limit of Detection and Limit of Quantitation of the Analytical Methods. Chron. Young Sci. 2011, 2, 21–25. [Google Scholar] [CrossRef]
- Feo, V.; Quaranta, E.; Fedele, V.; Claps, S.; Rubino, R.; Pizza, C. Flavonoids and Terpenoids in Goat Milk in Relation to Forage Intake. Ital. J. Food Sci. 2006, 18, 85–92. [Google Scholar]
- Di Trana, A.; Di Rosa, A.R.; Addis, M.; Fiori, M.; Di Grigoli, A.; Morittu, V.M.; Spina, A.A.; Claps, S.; Chiofalo, V.; Licitra, G.; et al. The Quality of Five Natural, Historical Italian Cheeses Produced in Different Months: Gross Composition, Fat-Soluble Vitamins, Fatty Acids, Total Phenols, Antioxidant Capacity, and Health Index. Animals 2022, 12, 199. [Google Scholar] [CrossRef] [PubMed]
- García, V.; Rovira, S.; Boutoial, K.; López, M.B. Improvements in Goat Milk Quality: A Review. Small Rumin. Res. 2014, 121, 51–57. [Google Scholar] [CrossRef]
- Curioni, P.M.G.; Bosset, J.O. Key Odorants in Various Cheese Types as Determined by Gas Chromatography-Olfactometry. Int. Dairy J. 2002, 12, 959–984. [Google Scholar] [CrossRef]
- Collins, Y.F.; McSweeney, P.L.H.; Wilkinson, M.G. Lipolysis and Catabolism of Fatty Acids in Cheese. Cheese Chem. Phys. Microbiol. 2004, 1, 373–389. [Google Scholar] [CrossRef]
- Engels, W.J.M.; Dekker, R.; De Jong, C.; Neeter, R.; Visser, S. A Comparative Study of Volatile Compounds in the Water-Soluble Fraction of Various Types of Ripened Cheese. Int. Dairy J. 1997, 7, 255–263. [Google Scholar] [CrossRef]
- Kondyli, E.; Pappa, E.C.; Vlachou, A.M. Effect of Package Type on the Composition and Volatile Compounds of Feta Cheese. Small Rumin. Res. 2012, 108, 95–101. [Google Scholar] [CrossRef]
- Molimard, P.; Spinnler, H.E. Review: Compounds Involved in the Flavor of Surface Mold-Ripened Cheeses: Origins and Properties. J. Dairy Sci. 1996, 79, 169–184. [Google Scholar] [CrossRef]
- Urbach, G. Contribution of Lactic Acid Bacteria to Flavour Compound Formation in Dairy Products. Int. Dairy J. 1995, 5, 877–903. [Google Scholar] [CrossRef]
- Correä, M.; Nogueira, L.; Lubachevsky, G.; Rankin, S.A. A Study of the Volatile Composition of Minas Cheese. LWT 2005, 38, 555–563. [Google Scholar] [CrossRef]
- Bosset, J.O.; Butikofer, U.; Gauch, R.; Sieber, R. Occurrence of Terpenes and Aliphatic Hydrocarbons in Swiss Gruyere and Etivaz Alpine Cheese Using Dynamic Headspace GC-MS Analysis of Their Volatile Flavour Compounds. Schweiz. Milchwirt. Forsch. 1994, 23, 39–42. [Google Scholar]

| Functional Groups | |||||||||
|---|---|---|---|---|---|---|---|---|---|
| Volatile Organic Compounds Profile (VOCs) 1 | FG2 | LG2 | LG1 | FG1 | LG3 | FG3 | GG1 | LG3 | GG3 |
| Ketones | |||||||||
| Alcohols | |||||||||
| 1-Hexanol | 3.4 | 2.4 | 7.5 | 1.4 | n.d. | 3.6 | 5.9 | 2.7 | 3.2 |
| 2-Hexenol | 10.2 | n.d. | n.d. | n.d. | 10.5 | n.d. | n.d. | 5.1 | 8.1 |
| 3,4-Hexanediol, 3,4-bis(4-hydroxyphenyl) | 12.7 | 12.7 | 4.5 | 1.9 | 4.9 | 4.0 | 10.4 | 7.3 | 12.4 |
| 1-undecanol | n.d. | n.d. | n.d. | n.d. | 4.2 | n.d. | n.d. | n.d. | n.d. |
| Phenylethyl alcohol | n.d. | n.d. | n.d. | n.d. | 3 | 2.0 | n.d. | 1.3 | n.d. |
| Esters | |||||||||
| Aldehydes | |||||||||
| Benzaldehyde | n.d. | n.d. | n.d. | 3.7 | 4.4 | 2.6 | n.d. | 2.5 | 7.9 |
| Benzaldehyde, 2-hydroxy | 6.8 | n.d. | n.d. | n.d. | n.d. | n.d. | n.d. | n.d. | n.d. |
| Trichlorobenzaldehyde | n.d. | 5.8 | n.d. | n.d. | n.d. | n.d. | n.d. | n.d. | n.d. |
| 2,3,6-trichlorobenzaldehyde | n.d. | n.d. | n.d. | n.d. | n.d. | n.d. | n.d. | 3.9 | n.d. |
| Hydrocarbons | |||||||||
| 1,3-Budadiene, 2,3-dimethyl | 5.3 | n.d. | n.d. | 1.1 | n.d. | 3.1 | 4.2 | n.d. | 2.1 |
| Benzene, 1-ethyl-2,4-dimethyl | 2.9 | n.d. | n.d. | n.d. | n.d. | n.d. | n.d. | n.d. | n.d. |
| Cyclohexane, 1,2-dimethyl | n.d. | 10.9 | 33.9 | n.d. | n.d. | 8.2 | 11.0 | n.d. | n.d. |
| 1-tetradecene | n.d. | n.d. | n.d. | 23.2 | n.d. | n.d. | n.d. | n.d. | n.d. |
| 2-cyclopenten-1-one2-hydroxy-3-methyl | n.d. | n.d. | n.d. | 6.2 | n.d. | n.d. | n.d. | n.d. | n.d. |
| Acids | |||||||||
| Gibberellic acid | n.d. | n.d. | n.d. | n.d. | n.d. | 1.8 | n.d. | n.d. | n.d. |
| Dodecanoic acid | n.d. | n.d. | n.d. | n.d. | n.d. | n.d. | n.d. | 5.1 | n.d. |
| Terpenes | |||||||||
| tricyclene | 9.0 | n.d. | n.d. | n.d. | n.d. | n.d. | n.d. | n.d. | n.d. |
| b-pinene | 7.4 | n.d. | n.d. | 4.2 | n.d. | n.d. | n.d. | n.d. | n.d. |
| γ-terpinene | 4.3 | n.d. | n.d. | n.d. | n.d. | n.d. | n.d. | n.d. | n.d. |
| terpinolene | 6.2 | n.d. | n.d. | n.d. | n.d. | n.d. | n.d. | n.d. | n.d. |
| eucalyptol | n.d. | n.d. | n.d. | 4.3 | n.d. | 3.2 | n.d. | n.d. | n.d. |
| 3-carene | n.d. | n.d. | n.d. | n.d. | n.d. | 1.7 | n.d. | n.d. | n.d. |
| linalool | n.d. | n.d. | n.d. | n.d. | n.d. | 1.5 | n.d. | n.d. | n.d. |
| camphor | n.d. | n.d. | n.d. | n.d. | n.d. | 4.5 | n.d. | n.d. | n.d. |
| Physicochemical Characteristics | Sampling A | Sampling B | ||||
|---|---|---|---|---|---|---|
| Area P | Area M | p Value | Area P | Area M | p Value | |
| pH | 4.55 a ± 0.08 | 4.29 b ± 0.03 | 0.009 | 4.36 ± 0.13 | 4.16 ± 0.15 | 0.630 |
| Moisture (%) | 53.70 ± 1.10 | 51.16 ± 0.83 | 0.076 | 53.65 ± 0.93 | 52.30 ± 0.95 | 0.358 |
| Fat (%) | 27.75 ± 0.60 | 29.04 ± 0.90 | 0.243 | 26.28 ± 1.04 | 27.75 ± 0.92 | 0.315 |
| FDM (%) | 60.54 ± 0.36 | 59.42 ± 1.39 | 0.523 | 56.63 ± 0.66 | 58.50 ± 0.30 | 0.550 |
| Protein (%) | 15.70 ± 0.23 | 16.19 ± 0.34 | 0.265 | 16.21 a ± 0.40 | 18.47 b ± 0.30 | 0.039 |
| NaCl (%) | 1.63 ± 0.13 | 1.80 ± 0.13 | 0.394 | 1.15 a ± 0.04 | 2.09 b ± 0.03 | 0.001 |
| Sampling A | Sampling B | |||||
|---|---|---|---|---|---|---|
| Fatty Acid Esters | Area P | Area M | p Value | Area P | Area M | p Value |
| C4:0 | 2.61 ± 0.13 | 2.58 ± 0.05 | NS | 2.64 ± 0.13 | 2.60 ± 0.06 | NS |
| C6:0 | 2.13 ± 0.04 | 1.94 ± 0.03 | * | 2.16 ± 0.17 | 2.04 ± 0.08 | NS |
| C8:0 | 2.16 ± 0.05 | 1.88 ± 0.02 | * | 2.10 ± 0.20 | 2.00 ± 0.11 | NS |
| C10:0 | 7.07 ± 0.18 | 5.85 ± 0.05 | * | 6.63 ± 0.70 | 6.40 ± 0.53 | * |
| C11:0 | n.d. | n.d. | - | 0.08 ± 0.03 | 0.04 ± 0.01 | NS |
| C12:0 | 4.29 ± 0.11 | 3.37 ± 0.02 | * | 3.72 ± 0.38 | 3.48 ± 0.23 | NS |
| C13:0 | 0.15 ± 0.03 | 0.15 ± 0.01 | NS | 0.15 ± 0.01 | 0.13 ± 0.02 | NS |
| C14:0 | 11.83 ± 0.24 | 10.29 ± 0.08 | * | 10.76 ± 0.38 | 10.67 ± 0.25 | NS |
| C14:1 | 0.33 ± 0.03 | 0.23 ± 0.02 | * | 0.23 ± 0.02 | 0.26 ± 0.04 | NS |
| C15:0 | 1.22 ± 0.03 | 1.09 ± 0.02 | * | 1.08 ± 0.02 | 1.08 ± 0.02 | NS |
| C15:1 | n.d. | n.d. | - | n.d. | n.d. | - |
| C16:0 | 28.28 ± 0.42 | 25.53 ± 0.19 | * | 26.92 ± 0.38 | 26.66 ± 0.27 | NS |
| C16:1 | 1.11 ± 0.03 | 0.87 ± 0.02 | * | 0.89 ± 0.06 | 0.94 ± 0.05 | NS |
| C17:0 | 0.84 ± 0.08 | 0.94 ± 0.06 | NS | 0.83 ± 0.05 | 0.88 ± 0.05 | NS |
| C17:1 | n.d. | n.d. | - | n.d. | n.d. | - |
| C18:0 | 9.32 ± 0.29 | 12.21 ± 0.16 | * | 11.52 ± 0.95 | 11.94 ± 0.75 | NS |
| C18:1t | 0.52 ± 0.06 | 0.52 ± 0.03 | NS | 0.57 ± 0.02 | 0.46 ± 0.03 | * |
| C18:1cn9 | 21.21 ± 0.50 | 24.17 ± 0.26 | * | 22.84 ± 1.00 | 24.19 ± 0.60 | * |
| C18:1n7 | 0.50 ± 0.04 | 0.50 ± 0.02 | NS | 0.52 ± 0.04 | 0.50 ± 0.04 | NS |
| C18:2t | 0.22 ± 0.04 | 0.44 ± 0.04 | * | 0.36 ± 0.03 | 0.39 ± 0.06 | NS |
| C18:2c | 2.83 ± 0.09 | 3.02 ± 0.06 | * | 2.73 ± 0.14 | 2.73 ± 0.10 | NS |
| C18:3γ | n.d. | n.d. | - | n.d. | n.d. | - |
| C18:3α | 1.27 ± 0.08 | 1.59 ± 0.05 | * | 0.96 ± 0.09 | 1.16 ± 0.06 | * |
| CLA | 0.85 ± 0.10 | 1.25 ± 0.06 | * | 0.90 ± 0.07 | 1.01 ± 0.07 | NS |
| C20:0 | 0.31 ± 0.04 | 0.46 ± 0.03 | * | 0.48 ± 0.05 | 0.51 ± 0.04 | NS |
| C20:1n9 | 0.04 ± 0.02 | 0.09 ± 0.03 | * | 0.03 ± 0.00 | 0.03 ± 0.00 | NS |
| C20:2 | 0.04 ± 0.01 | 0.01 ± 0.00 | * | n.d. | n.d. | NS |
| C21:0 | 0.08 ± 0.04 | 0.08 ± 0.03 | NS | 0.06 ± 0.02 | 0.10 ± 0.02 | NS |
| C20:3n6 | n.d. | n.d. | - | n.d. | n.d. | - |
| C20:4n6 | 0.38 ± 0.08 | 0.25 ± 0.04 | NS | 0.28 ± 0.03 | 0.18 ± 0.03 | NS |
| C20:3n3 | n.d. | n.d. | n.d. | n.d. | - | |
| C22:0 | 0.10 ± 0.03 | 0.20 ± 0.05 | * | 0.18 ± 0.07 | 0.25 ± 0.08 | * |
| EPA | 0.04 ± 0.02 | 0.17 ± 0.05 | * | 0.11 ± 0.05 | 0.05 ± 0.01 | NS |
| C22:1n11 | n.d. | n.d. | - | n.d. | n.d. | - |
| C22:1n9 | n.d. | n.d. | - | n.d. | n.d. | - |
| C22:2 | n.d. | n.d. | - | n.d. | n.d. | - |
| C23:0 | n.d. | n.d. | - | 0.06 ± 0.02 | 0.05 ± 0.01 | NS |
| C22:4n6 | n.d. | n.d. | - | n.d. | n.d. | - |
| C24:0 | n.d. | n.d. | - | 0.03 ± 0.01 | 0.05 ± 0.02 | NS |
| C22:5n3 | 0.12 ± 0.04 | 0.25 ± 0.05 | * | 0.10 ± 0.04 | 0.18 ± 0.06 | * |
| C24:1 | n.d. | n.d. | - | n.d. | n.d. | - |
| DHA | 0.01 ± 0.00 | 0.03 ± 0.00 | * | 0.06 ± 0.02 | 0.04 ± 0.01 | NS |
| SFA | 70.54 ± 0.67 | 66.60 ± 0.33 | * | 69.40 ± 1.16 | 67.89 ± 0.56 | * |
| PUFA | 5.74 ± 0.21 | 6.99 ± 0.09 | * | 5.53 ± 0.16 | 5.73 ± 0.13 | NS |
| MUFA | 23.72 ± 0.50 | 26.41 ± 0.28 | * | 25.08 ± 1.00 | 25.38 ± 0.50 | NS |
| UFA | 29.46 ± 0.67 | 33.40 ± 0.33 | * | 30.60 ± 1.16 | 31.11 ± 0.56 | NS |
| n-6 | 3.46 ± 0.12 | 3.70 ± 0.06 | * | 3.37 ± 0.12 | 3.31 ± 0.16 | NS |
| n-3 | 1.43 ± 0.07 | 2.04 ± 0.07 | * | 1.25 ± 0.17 | 1.42 ± 0.06 | NS |
| n-6/n-3 | 2.54 ± 0.16 | 1.87 ± 0.09 | * | 3.00 ± 0.57 | 2.36 ± 0.19 | * |
| PUFA/SFA | 0.08 ± 0.00 | 0.103 ± 0.01 | * | 0.08 ± 0.01 | 0.08 ± 0.01 | NS |
| AΙ | 2.82 ± 0.08 | 2.12 ± 0.05 | * | 2.44 ± 0.18 | 2.35 ± 0.09 | * |
| Fatty Acid Esters | Area P | Area M | p Value |
|---|---|---|---|
| C4:0 | 2.21 ± 0.07 | 2.01 ± 0.08 | * |
| C6:0 | 2.00 ± 0.03 | 1.82 ± 0.08 | * |
| C8:0 | 2.00 ± 0.02 | 1.98 ± 0.11 | NS |
| C10:0 | 6.58 ± 0.08 | 6.53 ± 0.44 | NS |
| C11:0 | 0.08 ± 0.03 | 0.05 ± 0.01 | * |
| C12:0 | 4.27 ± 0.06 | 3.20 ± 0.10 | * |
| C13:0 | 0.11 ± 0.01 | 0.12 ± 0.01 | NS |
| C14:0 | 12.50 ± 0.8 | 9.56 ± 0.17 | * |
| C14:1 | 0.28 ± 0.03 | 0.18 ± 0.04 | * |
| C15:0 | 1.38 ± 0.02 | 1.05 ± 0.08 | * |
| C15:1 | n.d. | n.d. | - |
| C16:0 | 30.37 ± 0.18 | 26.00 ± 0.32 | * |
| C16:1 | 1.27 ± 0.03 | 0.73 ± 0.05 | * |
| C17:0 | 0.88 ± 0.02 | 0.96 ± 0.05 | NS |
| C17:1 | n.d. | n.d. | - |
| C18:0 | 8.92 ± 0.15 | 13.91 ± 0.35 | * |
| C18:1t | 0.44 ± 0.01 | 0.56 ± 0.03 | * |
| C18:1cn9 | 20.09 ± 0.26 | 22.42 ± 0.56 | * |
| C18:1n7 | 0.42 ± 0.01 | 0.38 ± 0.02 | NS |
| C18:2t | 0.20 ± 0.06 | 0.34 ± 0.05 | NS |
| C18:2c | 2.65 ± 0.05 | 3.04 ± 0.17 | * |
| C18:3γ | n.d. | n.d. | - |
| C18:3α | 1.16 ± 0.02 | 1.86 ± 0.09 | * |
| CLA | 0.71 ± 0.02 | 1.10 ± 0.09 | * |
| C18:4n3 | n.d. | n.d. | - |
| C20:0 | 0.29 ± 0.01 | 0.47 ± 0.04 | * |
| C20:1n9 | n.d. | n.d. | - |
| C20:2 | n.d. | n.d. | - |
| C21:0 | 0.11 ± 0.01 | 0.10 ± 0.01 | NS |
| C20:3n6 | n.d. | n.d. | - |
| C20:4n6 | 0.23 ± 0.01 | 0.29 ± 0.06 | NS |
| C20:3n3 | n.d. | n.d. | - |
| C22:0 | 0.17 ± 0.01 | 0.23 ± 0.02 | * |
| EPA | 0.12 ± 0.02 | 0.19 ± 0.03 | NS |
| C22:1n11 | n.d. | n.d. | - |
| C22:1n9 | n.d. | n.d. | - |
| C22:2 | n.d. | n.d. | - |
| C23:0 | 0.08 ± 0.03 | 0.21 ± 0.08 | NS |
| C22:4n6 | 0.02 ± 0.00 | 0.06 ± 0.01 | * |
| C24:0 | 0.08 ± 0.02 | 0.14 ± 0.02 | NS |
| C22:5n3 | 0.18 ± 0.01 | 0.32 ± 0.07 | * |
| C24:1 | n.d. | n.d. | - |
| DHA | 0.02 ± 0.01 | 0.08 ± 0.01 | * |
| SFA | 72.05 ± 0.25 | 68.33 ± 0.88 | * |
| PUFA | 5.39 ± 0.03 | 7.31 ± 0.38 | * |
| MUFA | 22.55 ± 0.59 | 24.35 ± 3.34 | * |
| UFA | 27.95 ± 0.25 | 31.65 ± 0.88 | * |
| n-6 | 3.19 ± 0.03 | 3.76 ± 0.21 | * |
| n-3 | 1.49 ± 0.03 | 2.45 ± 0.15 | * |
| n-6/n-3 | 2.15 ± 0.06 | 1.58 ± 0.06 | * |
| PUFA/SFA | 0.07 ± 0.01 | 0.11 ± 0.01 | * |
| AΙ | 3.03 ± 0.04 | 2.28 ± 0.07 | * |
| MDA (ng g−1) | ||
|---|---|---|
| 2 Months | 10 Months | |
| Area P | 26.67 ± 4.31 a | 128.37 ± 11.88 b |
| Area M | 54.19 ± 8.47 a | 114.88 ± 8.51 b |
| Area P | Area M | |||||||||
|---|---|---|---|---|---|---|---|---|---|---|
| Volatile Organic Compounds (VOCs) 1 | P1 | P2 | P3 | P4 | M1 | M2 | M3 | M4 | M5 | M6 |
| Total Ketones | ||||||||||
| Acetone | n.d. | n.d. | n.d. | n.d. | n.d. | n.d. | n.d. | n.d. | n.d. | n.d. |
| 2-Butanone | 0.9 | 5.1 | n.d. | n.d. | n.d. | n.d. | n.d. | 1.0 | n.d. | n.d. |
| 2-pentanone | n.d. | n.d. | n.d. | n.d. | n.d. | n.d. | n.d. | n.d. | n.d. | n.d. |
| 2-heptanone | n.d. | n.d. | n.d. | n.d. | n.d. | n.d. | n.d. | n.d. | n.d. | n.d. |
| Alcohols | ||||||||||
| 2-propanol | n.d. | n.d. | n.d. | n.d. | n.d. | n.d. | n.d. | n.d. | n.d. | n.d. |
| 1-Butanol, 3-methyl | n.d. | n.d. | n.d. | n.d. | n.d. | n.d. | n.d. | n.d. | n.d. | n.d. |
| 2 propanol,1-methoxy | 0.4 | 0.8 | 0.5 | 8.2 | 9.3 | 1.2 | 2.1 | 2.1 | n.d. | 23.9 |
| 2 propanol,1-butoxy | 4.2 | 43.6 | 8.6 | n.d. | 7.5 | 4.3 | 20.1 | 20.9 | n.d. | n.d. |
| Total Esters | ||||||||||
| Ethyl acetate | n.d. | n.d. | n.d. | n.d. | n.d. | n.d. | n.d. | 2.6 | n.d. | n.d. |
| Propyl acetate | n.d. | n.d. | 0.9 | n.d. | 3.1 | 1,6 | 1.8 | n.d. | 0.8 | n.d. |
| Butanoic acid, pentyl ester | n.d. | 32.4 | 10.0 | n.d. | n.d. | 5.3 | 19.2 | n.d. | 13.1 | n.d. |
| Hexanoic acid, ethyl ester | n.d. | n.d. | 6.1 | n.d. | 1.0 | 1.0 | 1.4 | n.d. | - | n.d. |
| Orthoacetic acid, trimethyl ester | n.d. | n.d. | 4.9 | 19.8 | 14.7 | 3.1 | 6.1 | n.d. | 40.3 | n.d. |
| Butanoic acid, ethyl ester | n.d. | n.d. | 8.5 | n.d. | 3.3 | n.d. | 3.2 | n.d. | n.d. | 4.3 |
| 1-butanol, 3-methyl acetate | n.d. | n.d. | 3.0 | 1.0 | n.d. | 1.9 | n.d. | n.d. | n.d. | 1.4 |
| 1-hexane, 4,5-dimethyl | n.d. | n.d. | 35.9 | n.d. | n.d. | n.d. | n.d. | n.d. | n.d. | n.d. |
| Furan, 2-butyl tetrahydro | 75.1 | n.d. | n.d. | n.d. | n.d. | n.d. | n.d. | n.d. | n.d. | n.d. |
| Total Aldeydes | ||||||||||
| Butanal, 3- methyl | n.d. | n.d. | n.d. | n.d. | n.d. | n.d. | n.d. | n.d. | 1.5 | n.d. |
| Total Hydrocarbons | ||||||||||
| Pentane | n.d. | n.d. | n.d. | n.d. | n.d. | n.d. | n.d. | n.d. | n.d. | n.d. |
| Pentane 2-methyl | n.d. | n.d. | n.d. | n.d. | n.d. | n.d. | n.d. | n.d. | n.d. | n.d. |
| Pentane 3-methyl | n.d. | n.d. | n.d. | n.d. | n.d. | n.d. | n.d. | n.d. | n.d. | n.d. |
| Pentane 2,3-dimethyl | n.d. | n.d. | 1.1 | 1.7 | 2.4 | 0.7 | n.d. | n.d. | 0.4 | 1.4 |
| Propane,2-methyl,1-nitro | 5.1 | 9.7 | n.d. | n.d. | n.d. | n.d. | n.d. | n.d. | n.d. | n.d. |
| 1-hexane, 4,5-dimethyl | 3.0 | 6.3 | 38.6 | n.d. | 39.7 | 37.1 | 30.3 | 12.8 | 24.3 | 43.7 |
| tetradecane | 0.4 | n.d. | 3.2 | n.d. | 1.5 | 3.5 | 1.7 | 4.1 | n.d. | n.d. |
| heptanal | n.d. | n.d. | n.d. | n.d. | n.d. | 1.9 | n.d. | 1.4 | n.d. | n.d. |
| Decane | n.d. | n.d. | n.d. | n.d. | n.d. | 2.9 | n.d. | n.d. | n.d. | n.d. |
| cyclohexane | n.d. | n.d. | n.d. | n.d. | n.d. | n.d. | n.d. | n.d. | n.d. | n.d. |
| Octane.2,2,7,7-tetramethyl | n.d. | n.d. | n.d. | 2.2 | n.d. | n.d. | n.d. | n.d. | 0.4 | n.d. |
| Total Acids | ||||||||||
| L-Lactic acid | n.d. | n.d. | n.d. | n.d. | n.d. | n.d. | n.d. | n.d. | n.d. | n.d. |
| Butanoic acid | n.d. | n.d. | n.d. | n.d. | 1.8 | n.d. | n.d. | 4.2 | n.d. | 3.7 |
| Hexanoic acid | n.d. | n.d. | n.d. | n.d. | n.d. | 1.8 | n.d. | n.d. | n.d. | n.d. |
| Thioacetic acid | n.d. | n.d. | n.d. | n.d. | n.d. | n.d. | 2.5 | n.d. | n.d. | 2.3 |
| Total Terpenoids | ||||||||||
| a-pinene | n.d. | n.d. | 1.5 | 1.5 | 1.2 | 1.7 | 1.6 | 2.3 | n.d. | n.d. |
Disclaimer/Publisher’s Note: The statements, opinions and data contained in all publications are solely those of the individual author(s) and contributor(s) and not of MDPI and/or the editor(s). MDPI and/or the editor(s) disclaim responsibility for any injury to people or property resulting from any ideas, methods, instructions or products referred to in the content. |
© 2023 by the authors. Licensee MDPI, Basel, Switzerland. This article is an open access article distributed under the terms and conditions of the Creative Commons Attribution (CC BY) license (https://creativecommons.org/licenses/by/4.0/).
Share and Cite
Maggira, M.; Ioannidou, M.D.; Parissi, Z.M.; Abraham, E.M.; Karatassiou, M.; Samouris, G. Compositional Characteristics, Fatty Acid Profile, Phenolic Content and Volatile Organic Compounds (VOCs) of Feta Cheese Made in Mountainous Grasslands and Plains of Greece. Dairy 2023, 4, 672-688. https://doi.org/10.3390/dairy4040046
Maggira M, Ioannidou MD, Parissi ZM, Abraham EM, Karatassiou M, Samouris G. Compositional Characteristics, Fatty Acid Profile, Phenolic Content and Volatile Organic Compounds (VOCs) of Feta Cheese Made in Mountainous Grasslands and Plains of Greece. Dairy. 2023; 4(4):672-688. https://doi.org/10.3390/dairy4040046
Chicago/Turabian StyleMaggira, Martha, Maria D. Ioannidou, Zoi M. Parissi, Eleni M. Abraham, Maria Karatassiou, and Georgios Samouris. 2023. "Compositional Characteristics, Fatty Acid Profile, Phenolic Content and Volatile Organic Compounds (VOCs) of Feta Cheese Made in Mountainous Grasslands and Plains of Greece" Dairy 4, no. 4: 672-688. https://doi.org/10.3390/dairy4040046
APA StyleMaggira, M., Ioannidou, M. D., Parissi, Z. M., Abraham, E. M., Karatassiou, M., & Samouris, G. (2023). Compositional Characteristics, Fatty Acid Profile, Phenolic Content and Volatile Organic Compounds (VOCs) of Feta Cheese Made in Mountainous Grasslands and Plains of Greece. Dairy, 4(4), 672-688. https://doi.org/10.3390/dairy4040046