
The Importance of Cow-Individual Effects and Diet, Ambient Temperature, and Horn Status on Delayed Luminescence of Milk from Brown Swiss Dairy Cows

Forschungsinstitut KWALIS gGmbH, 36160 Dipperz, Germany
*
Author to whom correspondence should be addressed.
Dairy 2022, 3(3), 513-527; https://doi.org/10.3390/dairy3030037
Submission received: 21 March 2022
/
Revised: 15 June 2022
/
Accepted: 23 June 2022
/
Published: 20 July 2022
Abstract
:To investigate the importance of cow-individual effects and the importance of horn status (horned vs. disbudded), of diet (hay with and without concentrates), and of ambient temperature (10 °C vs. 25 °C) on delayed luminescence (DL) parameters of milk samples, fluorescence excitation spectroscopic (FES) measurements were performed on a total of n = 152 milk samples from 20 cows of a cross-over experiment. Cow-individual variation was investigated in relation to the horn status, diet effects were evaluated by cow in relation to sampling effects, and regression analysis was used to evaluate the importance of the experimental factors on the variation of emission parameters. Variation of short-term emission after yellow excitation (530 to 800 nm) was predominantly related to the individual cow (disbudded cows tended to higher values), and was partly affected by feeding, with higher emission for concentrate-added diets. Short-term emission after white excitation (260 to 850 nm) was most related to ambient temperature, with higher values at warm temperature. Higher emission was observed also in aged (stored) samples or after delayed cooling. The emission after yellow showed to be more robust to handling and ageing of the milk than the emission after white; possible relations to digestive processes of the cow (including the microbiome) are warranted.
1. Introduction
Delayed luminescence (DL), a light-induced photon emission, is detectable for some seconds after excitation, and was used in several fields of application: Chen et al. used it to differentiate serum samples from healthy persons and persons with leukemia, to indicate the functional state of biological systems [1]; structural properties of, e.g., glucose polymers were studied by Grasso et al. [2]; mitochondrial respiration by Baran et al. [3]; mitochondrial morphology and metabolism by Tian et al. [4]; and bioactivity based quality parameters of herbal medicines were evaluated by Sun et al. [5]. Differences between organic and conventional products were shown by FES measurements, e.g., for eggs by Köhler and Egerer [6,7], and for milk by Wohlers and Stolz [8].
There is a wide range of technical devices used for measuring DL. Frequently, excitation is done with white light, or in the wavelength range of UV or blue light. A specialized device was constructed at KWALIS, named Fluorescence Excitation Spectroscopy (FES), to perform excitation with light of different colors, which represent different ranges of wavelengths. The method was validated for milk in house, and for carrots and wheat by Strube [9].
In the context of the research of Wohlers [8] on milk samples, relations of the DL to farming conditions were observed: the parameter for the short-term emission after yellow excitation was increased in milk samples from farms with concentrate-rich diets and high milk yields. In relation to the fatty acid pattern of the milk samples, it was supposed that this concentrate-rich diet may have induced subacute rumen acidosis (SARA), and the high short-term emission after yellow excitation (>800 counts per 0.1 s) may, thus, indicate SARA. Another parameter of DL, the long-term emission after yellow excitation, was supposed to be high (>25 counts per 0.1 s) in situations where the cow’s diet missed energy, resulting in a negative energy balance (NEB). And a third parameter, the declining after light-red excitation (calculated as relation between short- and long-term emission), was observed to be high (>3.8) in milk from high-input farms, and low (<3.0) for organic farms, but intermediate (3.2) for hay-feeding biodynamic farms. In that study, always several factors were different across the three investigated farming conditions—breed, milk yield, feed stuff (hay, silage, and pasture), herd size, housing conditions, etc. So, it was actually of interest whether the DL of the milk can be affected specifically by feeding under experimental conditions, and in relation to cow-individual effects, as these previous studies were performed on farm bulk-milk samples.
It is known from another small-scale study on milk samples from individual cows [10], that the cow’s individuality has an important influence on the emission characteristic. It seemed possible that the horn status may have an effect on the DL, and further investigations seemed worthy to prove the thesis with samples of comparable origin, under comparable feeding conditions, without bias due to breed, to age, or to lactation stage.
Effects of disbudding in calf age on the performance of the adult dairy cows are rarely studied. Anatomical investigations documented changes of the skull shape related to disbudding [11,12], considerations concerning an influence on the metabolism of the cows were published [13,14,15], and investigations were conducted into the metabolites and fatty acids of the milk of horned and dehorned cows [16,17,18]. The horns are repeatedly considered to be of importance for thermoregulation [19,20,21], and also the ears were considered to be enlarged in polled cattle to serve to maintain body temperature homeostasis in hot climatic conditions [22]. Under cold ambient temperatures, the milk metabolites of horned cows indicated an additional energy demand, which was supposed to reflect the energy demand of the heat-emitting horns [17]. It was of interest whether the possible heat dissipation of the horns would be detectable under experimental conditions by FES measurements in milk samples.
As spectroscopic techniques are gaining importance, and, e.g., mid-infrared spectroscopy of milk samples was proposed to be useful to predict energy efficiency in individual dairy cows [23,24], or to estimate methane emission level of individual cows [25], delayed luminescence may also be used, as DL is related to energy-related metabolism in mitochondria [3,4]. So, it was of interest whether the FES provides a useful tool to evaluate the level of cow-individual milk samples and whether different diets and temperature conditions affect the DL of the milk.
The Swiss research institute Agroscope conducted a study to evaluate the influences of diet, ambient temperature, and horn status on the physiology and performances of dairy cows. Milk samples from this experiment were measured also by FES. The results of the FES measurements are presented in this article.
The purpose of these studies of the DL is to complement the existing scarce knowledge, which was predominately obtained from farm bulk-milk samples, and showed differences between organic and conventional farming conditions. This present study aims to obtain reference data for FES measurements. In regards to quality assessments of raw, unprocessed milk, it was of interest whether handling or sampling time affect the DL of the milk. And, in regards to the effects of production methods in dairy farming, such as diet formulation, or climate conditions, such as heat stress, it was of interest whether DL can show such single-term effects, which were previously observed only as system effects on farm bulk-milk level. Lastly, the cow-individual effects and the possible effect of the horn status on DL were to be examined.
2. Materials and Methods
2.1. Experimental Design and Sampling
The experiment was conducted at the Metabolic Center AgroVet in Lindau, CH, from 8 March to 27 June 2021. A total of 10 horned and 10 disbudded Brown Swiss cows were selected from different farms. The cows were similar in milk yield, stage of lactation, and number of lactation and genetic indices. The experiment was divided into five runs with four cows each. The four cows of one run were kept for a total of 36 days at the metabolic center. The cows were kept for 14 days in individual places (tied) to adapt to feeding and housing conditions. Feeding was either hay ad libitum, or restricted hay added with concentrates (to obtain equal energy supply). Afterwards, the cows were kept for 5 d in individual respiration chambers. Data sampling took place during the periods in the respiration chambers. After the first sampling period, rations were changed according to the cross-over design. After a second adaptation period of 10 d the cows were kept for another 5 d in the respiration chamber, where sampling took place. In each sampling period, the cows were kept at thermoneutral conditions (10 °C), and, thereafter, at heat-stress conditions (25 °C), each period lasting 48 h.
Milk samples for the FES measurements were taken at the second day per climate condition, and a morning- and an evening-milking sample was obtained per cow.
2.2. Sample Handling and Measurements
Samples were stored cool (6 ± 1 °C), and measurements were conducted on the fresh samples. Storage time was no longer than 48 h. Prior to measuring, samples were placed for 45 min in the darkroom to acclimatize to the conditions of the room with the measuring equipment (15 ± 1 °C, red-light). To homogenize the skim with the milk, the sample was softly moved (not shaken) just before pouring 101.5 g (±1.5 g) in round quartz cuvettes without scaling (diameter: 50 mm, height: 70 mm, with spout, quartz glass according to DIN 12 330; proQuarz, Mainz, Germany). Measuring followed immediately. Five aliquots per sample were measured in consecutive cycles: the first aliquot of each sample was measured, thereafter the second aliquot of each sample was measured (in reverse order). Before each cycle, a reference sample (UHT-milk, 3.5% fat, homogenized, AlnaturA, Darmstadt, Germany) was measured to control the emission detection level over time. A freshly opened package of the same batch was used daily. The mean of the aliquots was used for further statistical evaluations.
2.3. Method of FES Measurement
The measurement of light-induced emission of the milk was done by Fluorescence Excitation Spectroscopy [8,26]. Measurements were conducted under controlled atmosphere (15 ± 1 °C, 40 ± 5% RH) in a darkroom. Excitation was performed by a computer-controlled projector (Novamat 130AF, Braun Photo Technik, Nürnberg, Germany) with a halogen lamp (Xenophot 64640 HLX, 150 W 24 V G6.35 FCS, Osram, München, Germany) for 20 s. Spectral regions of excitation light were filtered by colored glass filters (Schott®, Mainz, Germany), namely RG695 (dark red), RG630 (red), OG590 (light red, coded lr), RG530 (yellow, coded ye), VG6 (green), BG12 (blue), and UG11 (ultraviolet), to perform excitation at different wavelengths (representing colors). Excitation without a filter was assumed to be white (Table 1). Pneumatically controlled shutters regulated the time of excitation (20 s) and the beginning of detection, which started 0.2 s after the end of excitation.
Emission was detected time-resolved by an amplified photomultiplier in 100 sequences of 0.1 s, starting 0.2 s after the end of excitation. The used photomultiplier (EMI 9202, Thorn EMI Electron Tubes, Middlesex, England) with a 48 mm photocathode (Multialkali S20, Thorn EMI Electron Tubes, Middlesex, England) determine wavelengths in the range of 260–850 nm with a quantum efficiency of <25%. The signal was amplified (Discriminator EMI C604-A, Thorn EMI Electron Tubes, Middlesex, UK). Measuring was conducted in single-photon-counting mode (internal noise: 1.3 counts per 0.1 s) in a 90 °C angle in relation to the excitation direction.
Emission parameters (EPs) were derived from the raw data by the FES software: Short-term emission (Mw1) was calculated as defined by the emission during the first measuring sequence (the interval from 0.2 to 0.3 s after excitation), and long-term emission (R40) as the mean emission of the last 40 sequences (the interval from 6.2 to 10.2 s after excitation). These parameters were calculated for the emission after each color-specific excitation and were used for further statistical analysis.
2.4. Data Analysis
Data analysis was performed by using the software JMP 7.0 (SAS Institute, Cary, NC, USA). Each EP was checked for normal distribution by a histogram, and, if necessary, the data was transformed (log or inverse) prior to further statistical analysis. First, the data of the repeated measurements (five aliquots per sample were determined to control measuring-related variation) were averaged so that each data set represented one sample. The coefficient of variation (CV) of the repeated measurements was documented, and EP-specific variation was calculated by the mean, median, and range of the CV of each EP.
The dataset contained a total of n = 152 samples from 20 cows. At each diet and at each ambient temperature, a sample was taken from the morning and the evening milkings separately (20 × 2 × 2 × 2). Four samples were excluded from analysis as they were stored inappropriately (resulting in abnormal high values in some EPs due to delayed cooling), and from one cow with acute metritis, sampling did take place only at four of the eight planned sampling times. The samples of this cow with metritis were not rejected because the EPs did not indicate any abnormalities. Although some samples showed in some EPs high leverage observations, no further samples were excluded, because the repeated measurements indicated by a low CV that this emission was specific for this sample.
Cow-specific variation of EPs over the course of the study is shown by box plots which represent the median and the interquartile range. Extreme values are depicted by points. Cows were retrospectively grouped in quartiles based on the average EP value of the eight samples of each cow. By this grouping, a comparison among individuals with high, intermediate, and low values is possible, and the unknown reason for the individual emission level is assumed to be represented by the quartile group. Differences between several individuals or groups are calculated by the Tukey–Kramer HSD Test (p = 0.05).
The relation of the EPs to time-related effects was calculated by correlation with the experiment’s day of sampling (day 14, 16, 30, and 32: 4 sampling times with each one morning and one evening milking), and cows with correlations of p < 0.1 were counted as time-affected, and frequency of cows with 0.3 < p < 0.1 were noted in brackets. These high p values were chosen to consider possible effects and to not reject them falsely, as there was only a very small amount of data per cow available (n = 8). Diet-related and temperature-related effects per cow were calculated on the basis of the 4 samples for each diet or each temperature, and cows were counted as affected when the Student’s t test was significant (p < 0.1), cows with 0.3 < p < 0.1 were marked as possibly affected, and the frequency of cows with positive and negative effects was documented. Diet and temperature effects were calculated for 19 cows, because one cow (with metritis) was fed and housed according to the experiment’s design only for one sampling, a subsequent sampling was conducted after the cow recovered from metritis and independent to the experiment’s conditions.
Regression models were constructed to detect the relative importance of factors for data variation. The models contained the main factors of the experiment (cow, diet, and ambient temperature) and sampling-related effects (day time of milking, day of sampling). Possibly confounding effects, such as the milking order (representing delayed cooling of the samples of approx. 40 min between first and last sample), and a baseline for the method of FES, which is represented by the EP-respective value of the reference sample, were separately evaluated, as well as design-related effects, such as the group of cows which were kept simultaneously for group-specific comparisons, the period of the examinations, as cows may adapt to the experiment’s conditions over time, and interactions of them and with experimental factors. Several alternative models were calculated to (a) assess the importance of additional factors, and (b) to assess the influence of extreme values on the results. Importance of extreme values was assessed by excluding all data which was outside the 95% confidence interval (evaluated for each FES parameter separately). The given results were derived from the basic model, which considered five fixed factors: cow (n = 20, categorial), diet (n = 2, cat.), ambient temperature (n = 2, cat.), day time of milking (n = 2, cat.), and day of sampling (continuous). The model’s quality is given for each EP by R2 (calculated as the ratio of sum of squares of the model to sum of squares of CTotal) and R2adj. (calculated as the ratio of mean squares instead of sum of squares, to compare models with different numbers of parameters), and the sum of squares and RMSE (root mean square error, i.e., the standard deviation of the mean error). The importance of impact of the different effects on the variation of each EP can be derived from the estimate (regression coefficient) and its standard error, as well as from the F ratio and significance level of the effect test of the regression analysis.
3. Results
3.1. Sample-Specific Emission—Precision of Different FES Parameters
Each sample was measured five times; each measuring was done on a separate 100 mL measuring-aliquot, which was taken from bottle 1, 2, and 3 (0.5 l-sampling-aliquots) of the sample, respectively.
As shown in Table 2, the repeated measures showed in some EPs a low variation, especially the short-term emission after yellow excitation (Mw1ye) had a low CV of 3.34, while other short-term emission parameters, such as, e.g., short-term emission after red or white excitation, had a high variation due to repeated measurement (CV of 11.6 and 17.88, respectively). All long-term emission parameters showed intermediate variation in relation to repeated measurement, with a CV of 7.05 (yellow) up to 9.49 (white). The difference between the mean and the median of the CV indicated that there were for some samples rather high variations of emission in relation to repeated measures, and in other samples not. This range is indicated by the min. and max. values of the CV.
3.2. Cow-Specific Emission of Different FES Parameters
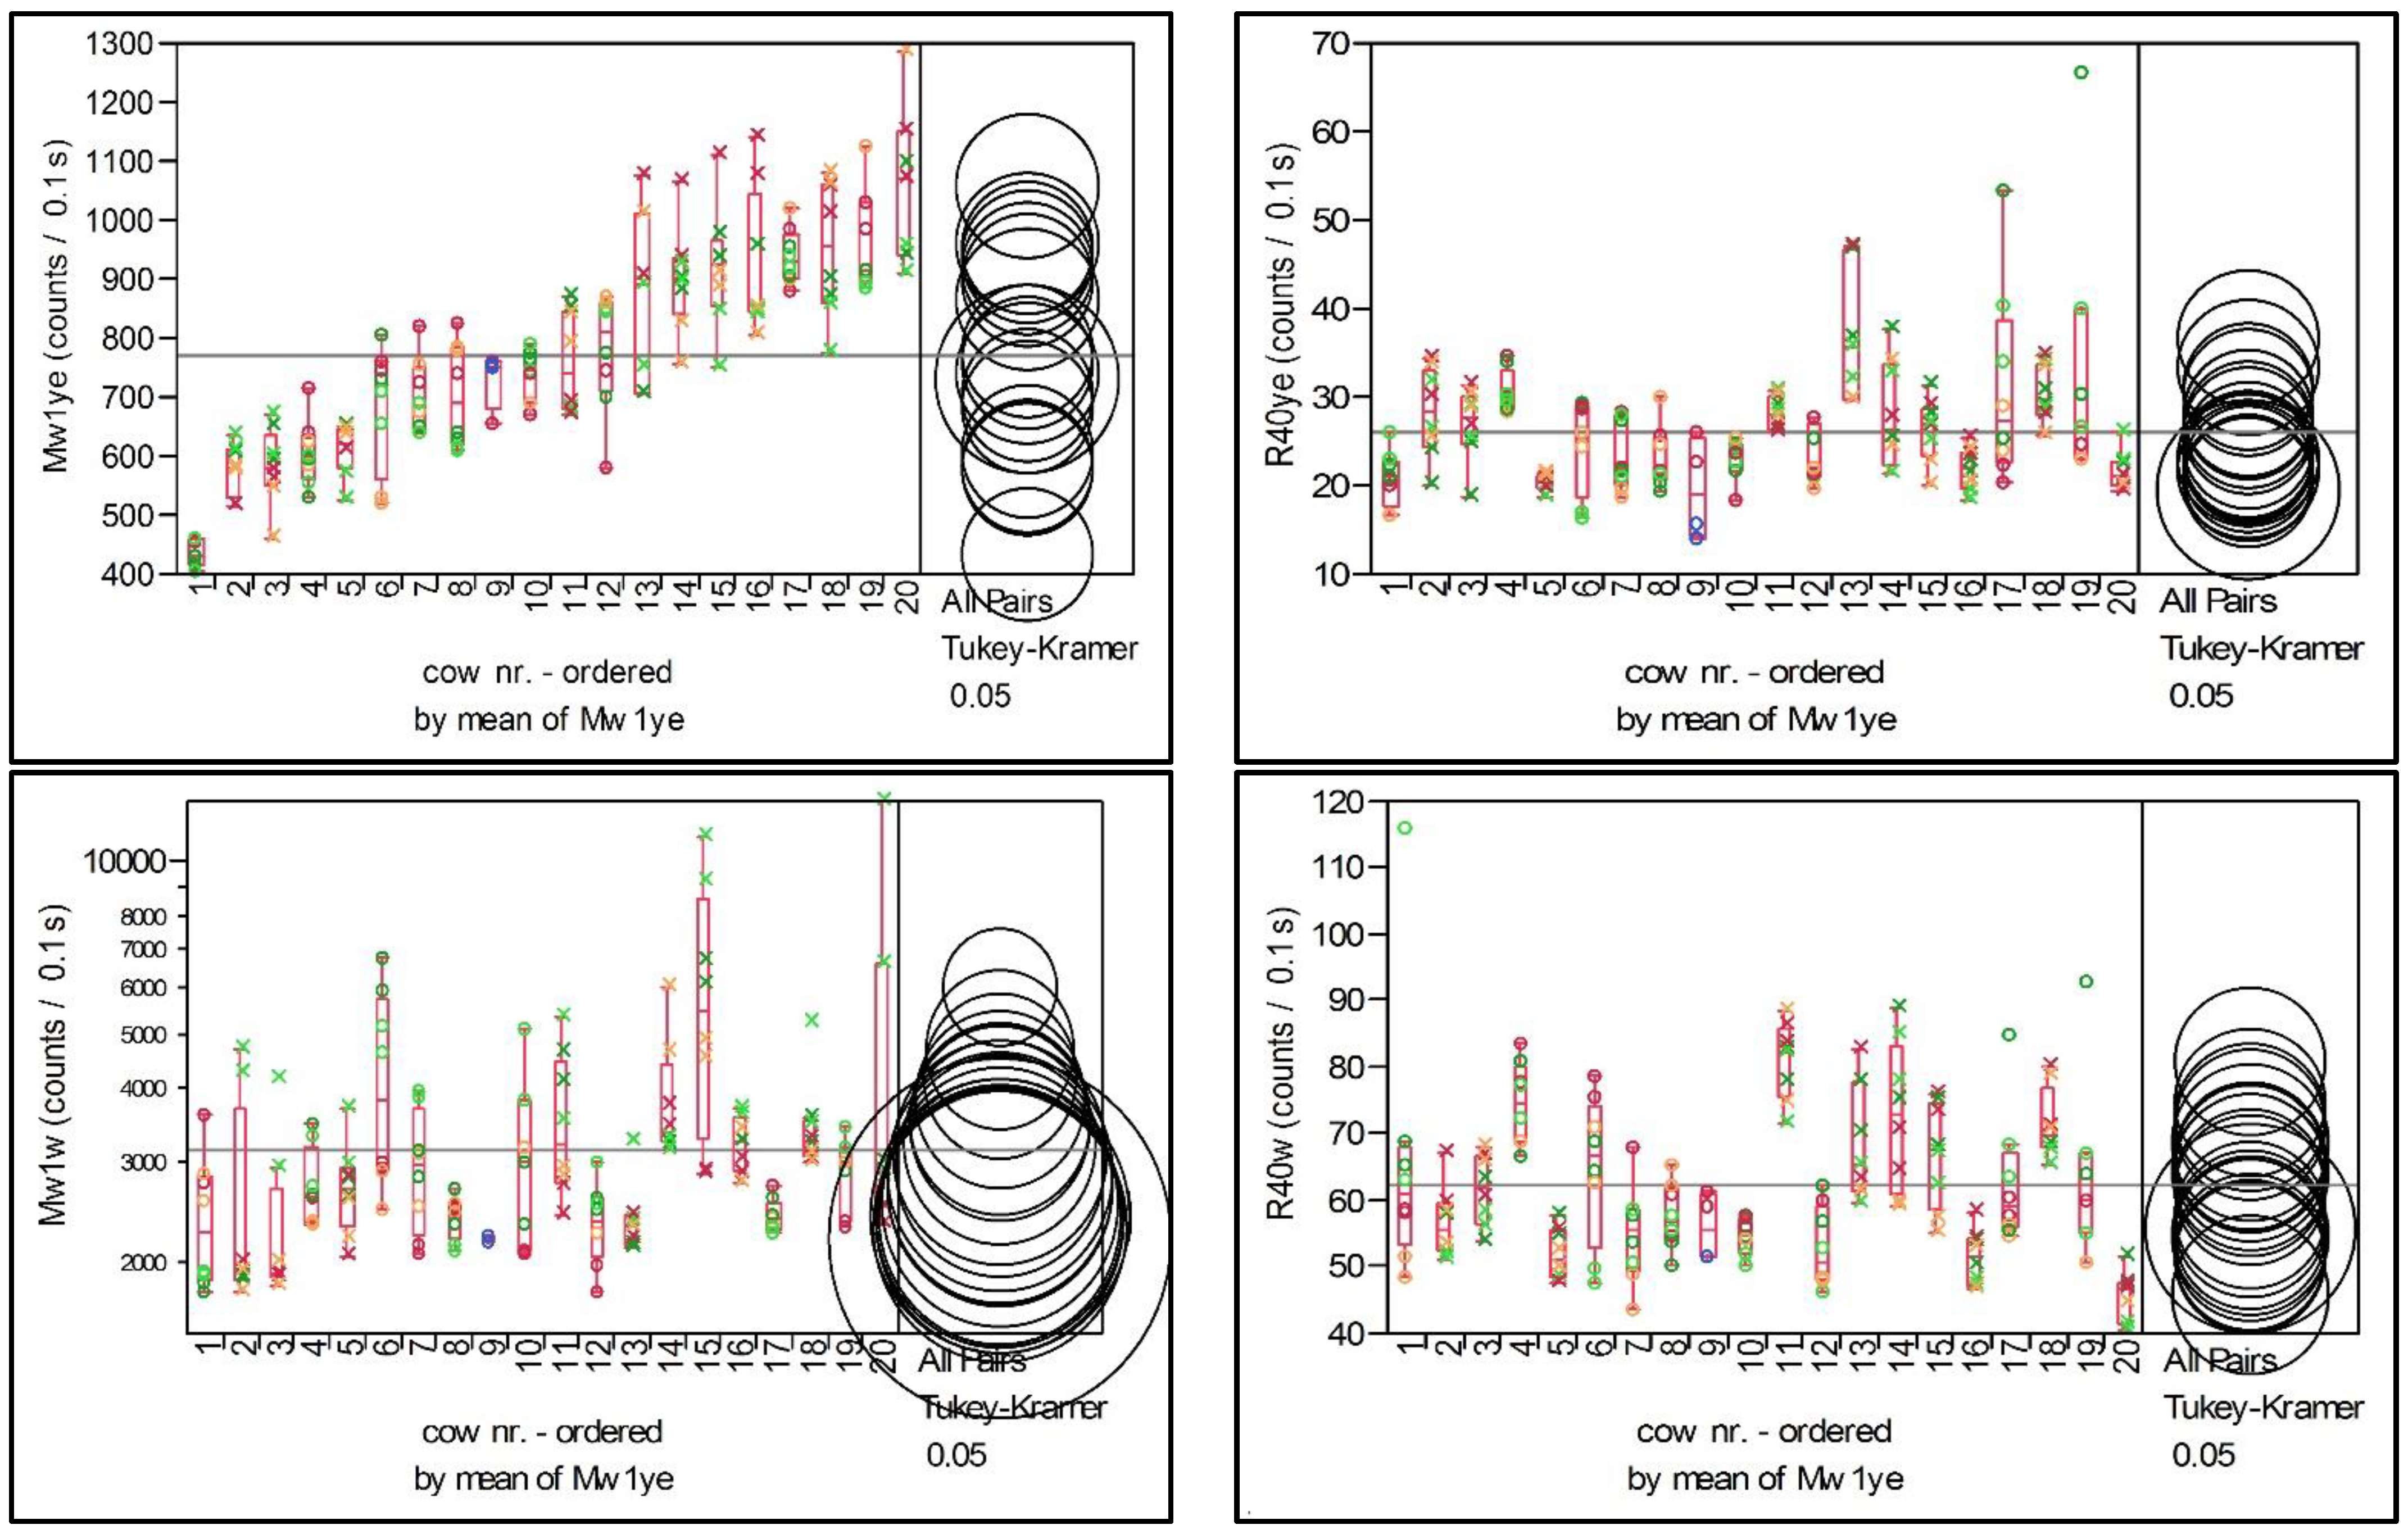
The variation of the short-term emission after yellow excitation was predominately related to the individual cow (cf. Figure 1). The other EPs did reflect cow-individual specific level, but to a lesser extent than the Mw1ye, and not in the same meaning as it was given by the Mw1ye. Correlations between the EPs were found between R40w and R40ye, with R2 = 0.42, p = 0.001, but not between Mw1ye and Mw1w, or Mw1ye and R40ye.
3.3. Emission Variation in Relation to Experimental Factors
3.3.1. Horn Status
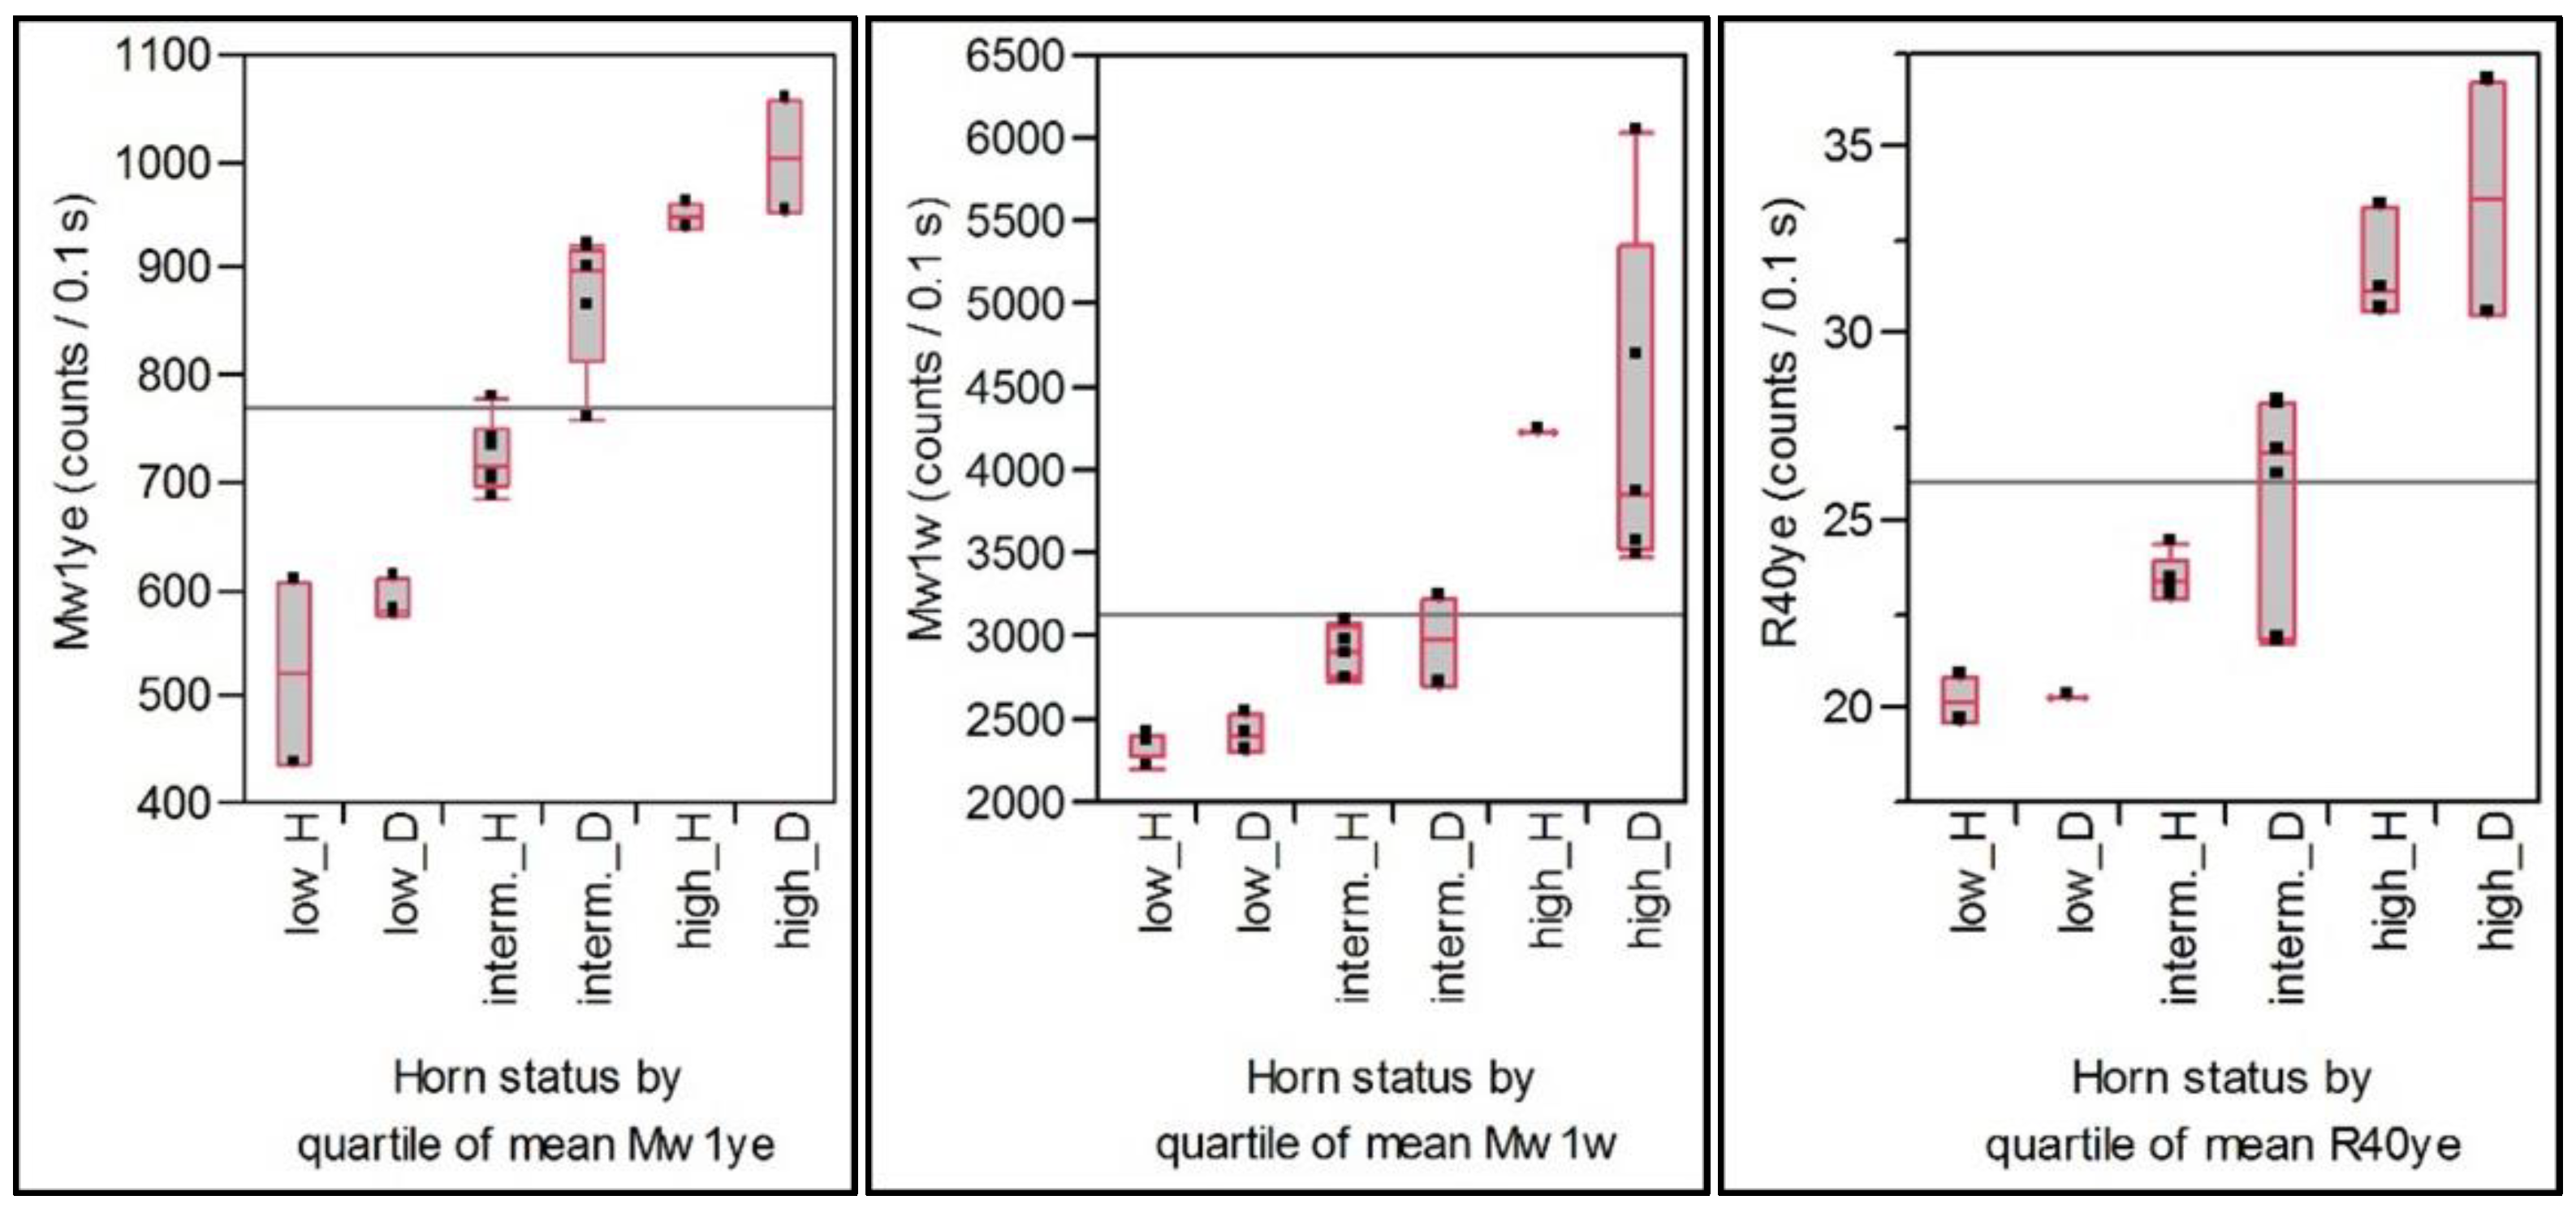
The horn is an animal-specific characteristic, which is linked to the individual. Considering the wide range of the above-described cow-specific emission level, which explains a large part of the data variation, a grouping of the cows according to their mean emission of the eight milk samples into an upper, lower, and intermediate quartile group is a possibility to compare the importance of the horn status within groups of comparable emission levels. Differences between the horned and disbudded cows in each quartile group are depicted in Figure 2 for Mw1ye, Mw1w, and R40ye. The short-term emission after yellow excitation tended in the upper and lower quartile to be lower for the group of the horned cows than for the group of the disbudded cows, in the intermediate quartile this difference was significant. In the other emission parameters, such as Mw1w or R40ye, a horn-related effect was not perceptible.
3.3.2. Diet
The feeding was performed in a cross-over design and implemented that some cows were fed first pure hay, and others were fed first the concentrate added diet. By this, a time-related influence can be distinguished from a diet-related effect. The EP Mw1ye was for eight cows negatively correlated with the repeated measures over time, while other six cows had no significant correlation, and five had a positive time-related trend (Table 3), while the EP Mw1w was for four cows not at all correlated with time-related effects, but in six cases significantly negative, and in a further six cases slightly negative, only three cows showed a positive time-related effect. The diet, calculated as the difference between the four samples of diet A vs. diet B, showed to be not affected at all in six cows in the EP Mw1ye and in three cows in the EP Mw1w. Significant effects or slight tendencies to effects were calculated in the EP Mw1ye for 10 cows with p < 0.1, a further three cows had slightly affected values (0.3 > p > 0.1); the EP Mw1w showed in nine cases significant effects related to the diet with higher values for pure hay diets, and in two cases the contrary, while three cows were not affected. The cows which were not affected by diet in the EP Mw1ye were all highly significantly affected by a negative time trend in the EP Mw1w. The eight cows with a negative time trend in the EP Mw1ye showed in four cases a positive and in the other four cases a negative diet effect, thus the time effect was not biased by diet or vice versa. In the EP Mw1w, the diet effect was biased by time because 11 cows with negative time trend had higher values for hay diets.
The EP Mw1ye and Mw1w were differently affected by the diet: the Mw1ye was in seven cows (37% of 19 cows) higher when they were fed a concentrate-added diet, and the Mw1w was in nine cows (47% of 19 cows) higher in cases of a pure hay diet.
3.3.3. Ambient Temperature
The ambient temperature was for all cows and in all cases first neutral (10 °C) and was then changed to heat stress (25 °C). The sampling of the 25 °C samples was, thus, two days later than the sampling of the 10 °C samples.
The difference of the EP values in relation to the ambient temperature showed for the individual cows that the EP Mw1ye was in three cases lower under 25 °C, and in two cases the reverse; the other cows did not show a significant effect due to the ambient temperature. The effects were not related to the horn status. The EP Mw1w was for nine cows affected (p < 0.1) and one cow tended to be affected (p = 0.11), with higher values at 25 °C; only one cow showed the reverse, the other nine cows did not show significant effects due to the ambient temperature.
3.4. Regression Analysis—Importance of Factors for Data Variation
The relative importance of the factors for data variation was evaluated by regression analysis (Table 4). The variation of the Mw1ye showed to be most related to the individual cow (F ratio of 29.7), but also to diet (F ratio 12.2), and, to a lesser amount (non-significant), to ambient temperature and day time of milking. The day of sampling was absolutely not related to the data variation. The variation of the EP Mw1w was the most related to ambient temperature (F ratio 31.8), also to diet and sampling day (F ratio of 23.6 and 15.4), much less to the individual cow (F ratio 8.7); the day time of milking (evening or morning) was not significantly related to the data variation of the Mw1w. The data variation of the Mw1ye is explained to a great extent by the considered factors, indicated by an F ratio of 25.29 and R2adj. = 0.79, but the model is not so well suited to explain the Mw1w with lower F ratio (10.75) and lower R2adj. (0.60), thus, 40% of data variation of the Mw1w is not explained by the model.
Alternative models were created with only marginal changes of these effects. When additional factors, such as, e.g., the horn status, were considered, the grouping of cows due to the individual emission level was also integrated into the model as a random factor additionally to the cow (or the cow was nested within the quartile groups); in these cases, the horn status showed a significant relation to the Mw1ye, with even more importance (higher F ratio) than the diet effects.
4. Discussion
4.1. Variation of EPs Due to Repeated Measures: Sample-Specific Emission
The EP Mw1ye showed a relatively low coefficient of variation (3.34%) for repeated measurements, which indicated a good repeatability of this EP: the sample-specific properties which are represented by this EP can be supposed to be stable and precisely detectable. But the EP Mw1w showed a high coefficient of variation (17.88%) for repeated measurements, and the VC was even higher for samples with a general high Mw1w-value. In separate investigations [27], the Mw1w was found to be influenced by storage time and by delayed cooling, with higher emission for stored samples and delayed cooled samples, especially when the samples were only very gently moved (shaken) before measuring. Thus, this parameter is likely to be biased by sample handling parameters, which affected the detected value additionally to the sample’s own properties.
4.2. Variation of EPs Due to Experimental Factors: Inter-Individual Variation and the Effect of the Horn Factor
The variation of the EPs, especially that of the EP Mw1ye, was mainly affected by the individual cow. Thus, the DL was able to show animal-individual differences. The importance of the individuality on the emission of the milk was observed before by Wohlers, but relations to the age of the cow, the stage of lactation, or main milk-quality parameters, such as the concentration of fat, protein, urea, or somatic cell count, were not present [10]. The reason for this individual emission level is actually not known.
In order to control the animal-individual variation for statistical evaluations, a grouping on the basis of parameters which are relevant for the feature of interest is often performed, and different kinds of grouping have been evaluated in the context of investigating the animal-individual energy balance [28,29,30]. In the experiment’s design, a grouping of the cows was used to control slight variations due to days in milk, to milk yield, and genetic traits. But as the emission parameters did not reflect these features, a wide range of interindividual variation occurred and had to be controlled for comparisons by re-grouping the cows retrospectively, according to their individual mean emission into a group of high, intermediate, or low emission. Inside these groups, a difference between horned and disbudded cows was observed in the EP Mw1ye (but not in the Mw1w), with higher emission for disbudded cows.
Investigations considering the horn status are rare. Wohlers observed in milk samples from 10 farms, where on each farm horned as well as disbudded cows were kept together in one herd, a slightly increased decay of emission after green excitation for disbudded cows [18]. The reported EP is, unfortunately, not directly comparable with the EPs reported here, but because, in general, a high short-term emission resulted in higher decay, and because the variation of emission after yellow correlates, in general, with that after green excitation, it is possible that the previous observations were in accordance with the presented results. In one special situation reported by Wohlers [18], a herd with cows with three different horn states was investigated: (i) horn-bearing cows, (ii) cows which were disbudded as calves, and (iii) dehorned cows, where dehorning took place in adult animals; all cows were kept together in a free-stall barn. For this herd, higher short-term emission after light red excitation was reported for disbudded cows [18], which can be seen in line with the actual reported results because the short-term emission after light red and after yellow excitation show, in general, a close correlation.
4.3. Variation of EPs Due to Experimental Factors: Intra-Individual Variation and the Effect of Diet
The variation of the EPs over the period of the experiment was evaluated by cow to consider the relevant animal-specific emission level. As the samples represent, on the one side, the time course of the experiment and possible acclimatization effects of the cows to the experimental conditions, and, on the other side, the different diets which were in the most cases randomly and paired assigned to the cows per experimental group, both effects were taken into account. Not all cows showed a change over time, indicating that the different diets did in some cases not affect the animal-specific emission of the milk. Some sample-specific variation occurred in some cases which could not be explained by the experiment’s design, which were supposed to be related to the day time-specific condition of the cow [31] (it is known that variations in milk constituents may occur, despite controlled and constant diet and housing conditions [32,33]—the variation of DL may be related to this circumstance, too). In cases where the data indicated a trend over time, no constant diet effects were observed in the Mw1ye for these cows, so the time trend can be considered to be marginal in relation to diet, but in the Mw1w, the time trend of 11 cows was, at the same time, a diet effect with higher emission for the pure hay diet, thus, the diet effect was biased in this parameter by the time trend.
The comparison of the diets by means of each four samples per cow and diet was used to take into account that repeated measures (morning and evening milkings) and different temperature conditions (the one day 10 °C, the other 25 °C) may also have affected the data variation. Significant differences between the diet situations indicate in this case that the overall variation due to repeated sampling at different day times and different temperature conditions was smaller than the diet-related effect. Modeling these simultaneous effects to detect the relative importance of the factors on the data variation indicated by the high F ratios that the cow was the most important for the Mw1ye-variation, followed by diet effects, while time effects, represented by the day of sampling, were absolutely unimportant. In contrast, the EP Mw1w was, to an important part, related to time effects as well as to diet effects. By this additional information, the observed cases of cow-individual diet effects and time effects have to be assessed cautiously, especially for the Mw1w. And due to the low F ratio of the whole model for the Mw1w and an R2adj. of 0.60, which indicates that only 60% of the data variation is explained by the model’s effects, further factors would have to be considered which affect the variation of the Mw1w, as this parameter is known from separate investigations that handling and processing likely affect this parameter. Consequently, the diet effects in the Mw1ye seem to be reliable, while the diet effects in the MW1w are likely to be biased.
Diet effects on milk quality are comprehensively known, and supplementation of concentrates to a pure roughage diet will result in a shifted fatty acid pattern [34,35,36,37,38]. But correlations between single fatty acids of the milk samples and several emission parameters of the same milk samples were fairly low [10]; the most important relation of emission to fatty acids indicated that the EP Mw1ye was higher when the fatty acid pattern indicated a tendency to subacute rumen acidosis (SARA) [8], which likely occurs in cases of high concentrate:roughage ratios in the diet. This tendency to SARA was present especially in samples from high-yielding cows of conventional high-input production systems, using much higher amounts of concentrates in the diets than the low-input farms. In these cases, the short-term emission after yellow excitation reached 800 counts/0.1 s and higher. The observed diet effect for 37% of the cows in the EP MW1ye was, thus, in line with previous results regarding the concentrate ratio of the diet.
As the cows with a generally higher individual emission level expressed the diet effect more excessively than the cows with low-emission intensity (cf. the Mw1ye in Figure 1), and as these higher-emitting cows are more often disbudded ones, it is possible that these disbudded cows were more sensitive to concentrate-added diets—their milk was more affected by the different diets than the milk of the horned cows with generally lower cow-individual emission intensities.
In total, a direct diet-related effect on DL was not found in all cows equally. DL is, thus, not suited to prove or verify a special diet formulation, but the results indicate that the cow’s diet may influence the DL of the milk.
4.4. Variation of EPs Due to Experimental Factors: The Effect of Ambient Temperature
The results presented in this article indicate that temperature-related effects occurred in the FES parameter Mw1w, but in the EP Mw1ye the effect was only marginally present (non-significant with p = 0.08). Consequently, the temperature effect occurred predominantly in another EP than feeding did. Considering the above-mentioned fact that the short-term emission after white excitation is known to be closely related to storage time and to a delay of cooling, the higher short-term emission (and high declining) after white excitation of the milk gained under warm ambient temperatures has to be evaluated in this context and is likely indicating ageing phenomena due to delay in cooling. A lower emission was observed in fresh milk and in milk gained under cooler ambient temperatures (10 °C).
The influence of the ambient temperature on the metabolism of the cow was supposed to be of importance because the horns are known to emit heat especially in cold environments [21,39]. Baars et al. considered heat loss through the horns as the reason why the horn-bearing cows expressed a higher energy demand, which was recognizable in the fatty acid pattern and the metabolites in the milk, in situations of low ambient temperatures [16,17]. In relation to the thesis of Baars, which claimed a higher energy demand for horned cows under cold ambient temperatures, such a temperature-related difference in relation to the horn status was not obviously apparent in the EP Mw1w, nor in the EP Mw1ye. In the third degree interaction of the regression analysis (results not shown), the disbudded cows showed under warm ambient temperature and with pure hay diet a higher emission intensity in the Mw1w, which may indicate a slightly higher susceptibility to ageing of the milk of disbudded cows, gained under warm ambient temperatures and hay feeding. It may be possible that the disbudded cows suffered more under warm ambient temperature, especially when the diet asked for higher metabolism as roughage had to be digested, and the horns help to dissipate the high body temperature. As the present data was not on cold conditions (below 0 °C) as it was for the data from Baars, but only on thermoneutral temperatures (10 °C), the marginal effects at 10 °C may be explained by this thermoneutral situation.
4.5. Potential Areas of Application for Delayed Luminescence
The results indicate that the different emission parameters reflected different aspects of the milk’s properties: while the emission after white excitation (parameter Mw1w) was affected mostly by ambient temperature, by handling, and ageing, the emission after yellow excitation (parameter Mw1ye) was not. This second parameter Mw1ye was affected the most by cow-individual effects, and, to a lesser extent, by the diet.
A detailed explanation of the meaning of the emission parameters with view to the animal’s physiology or metabolic processes is actually difficult, because basic knowledge is rare. Relations to main milk constituents, such as the concentration of fat, protein, lactose, or somatic cell count, are known to be fairly low for all FES parameters [10]. But relations to diet-related SARA, indicated by the fatty acid pattern of farm bulk milk, were reported for the emission of milk after yellow excitation (Mw1ye) [8]. The results point in the direction that the cow’s metabolic processes seem to be of importance for the variation of the emission after yellow excitation. It was shown that the most variation of DL after yellow excitation was related to the individual cow. Cow-individual variation is known to be related to the efficiency of the cow’s metabolism to digest a special kind of diet [40,41,42]. A wide range of factors has to be considered as reasons for these different efficiencies [43]. And as energy balance is also an important animal-individual aspect for interindividual variation [28,29,30], and as the results of Baars indicated that the metabolites of the milk of horned cows gave rise to the assumption that the pathway of C3 intermediates, which are important for gluconeogenesis and lactose synthesis, may be different to those of disbudded cows [17], it seems to be worth following up in future research a possible relation between the energy balance or metabolic efficiency parameters of the cows (including the microbiome of the rumen) and the induced emission of the milk, especially after yellow excitation.
The emission after white excitation showed to be related to the ambient temperature, causing a delayed cooling of the sample and by this an ageing effect. It was also related to insufficiently (very slightly) moved aged samples (publication in preparation), while intensified shaking of the sample resulted in lower emission after white excitation without affecting the emission after yellow excitation. Thus, higher emission after white excitation was always observed in cases where the sample tended to a condition of ageing or spoilage, where the original fresh and fluid state was lost, and the molecules of the milk were going to agglomerate: the first steps towards thickening.
Milk-related research investigating the DL after white excitation was not found in any journal database. In one publication, the DL after excitation with UV light was reported for milk, which was changed in acidified milk [44]. The result from excitation with UV light is mentioned here because considerably strong correlations exist between the FES parameters representing emission after UV and white excitation, while correlations with emission after yellow excitation are rather weak. The application of DL in the one milk-related research is in the field of degradation (acidification) induced by processing. These processing- and ageing-related effects were observed here also for DL after white excitation.
In conclusion, the higher emission of milk after white light was reported for cases of processing and handling, where a transformation of the substrate by chemical reactions took place, while the DL after yellow excitation showed to be related more to effects due to the synthesis of the milk by the cow.
5. Conclusions
The importance of diet formulation, the ambient temperature, or the horn status for DL of the milk samples showed to be low in relation to the cow-individual effects. This indicates that the diet formulation may be part of, but can’t be, the main reason for the difference in DL of organic and conventional farm bulk-milk samples. The emission parameter Mw1ye, the short-term emission after yellow excitation, reflected especially the sample-, diet-, and cow-specific characteristics. And, as it showed to be robust to sampling and handling related influences, this EP seems to be a reliable parameter for assessing farming-related effects on milk DL quality. By contrast, the variation of the EP Mw1w, the short-term emission after white excitation, occurred mainly in relation to sample handling, processing, and ageing. The Mw1w is, thus, supposed to be a promising sensitive parameter to evaluate handling-related effects on milk DL after milking, e.g., the degree of natural freshness of (raw) milk.
The fundamental knowledge about emission after yellow excitation is not sufficient to explain the reason for the observed cow- and diet-related effects. Further research is needed, especially in the field of metabolic processes and physiological states affecting the DL of cow-individual milk samples.
Author Contributions
Conceptualization, J.W.; data curation, J.W.; formal analysis, J.W.; funding acquisition, J.W. and P.S.; investigation, J.W.; methodology, J.W.; project administration, J.W. and P.S.; supervision, P.S.; validation, P.S.; visualization, J.W.; writing—original draft, J.W.; writing—review and editing, J.W. and P.S. All authors have read and agreed to the published version of the manuscript.
Funding
The investigations by FES were funded by the Software AG-Stiftung, grant number P14219 by 50%, as further funding partners with lower budgets were interested in financing the remaining amount. They were: Zukunftsstiftung Landwirtschaft, grant number 20210123 OH 71747-410; Rudolf Steiner Fonds; Forschungsring e.V.; Edeka Nord; Edeka Hannover-M.; Alnatura and Tegut. The APC was waived.
Institutional Review Board Statement
The experiment was approved by the cantonal veterinary office of Zürich (CH) (ZH-127/2020).
Informed Consent Statement
Not applicable.
Data Availability Statement
All the raw data of the FES measurements are available from J. Wohlers.
Acknowledgments
The Ruminant Research Group of Agroscope, CH, especially A.-M. Reiche, are acknowledged for gaining and spending milk samples from their experiment for the reported FES investigations in the context of the non-profit research collaboration. G. Mende and P. Bokatius are acknowledged for their support with the FES measurements.
Conflicts of Interest
The authors declare no conflict of interest.
References
- Chen, P.; Zhang, L.; Zhang, F.; Liu, J.-T.; Bai, H.; Tang, G.Q.; Lin, L. Spectral discrimination between normal and leukemic human sera using delayed luminescence. Biomed. Opt. Express 2012, 3, 1787–1792. [Google Scholar] [CrossRef] [PubMed] [Green Version]
- Grasso, R.; Musumeci, F.; Triglia, A.; Brizhik, L.; Scordino, A. Impact of structure on the delayed luminescence of d-Glucose-based polymer chains. J. Photochem. Photobiol. B Biol. 2019, 198, 111589. [Google Scholar] [CrossRef]
- Baran, I.; Ionescu, D.; Privitera, S.; Scordino, A.; Mocanu, M.M.; Musumeci, F.; Grasso, R.; Gulino, M.; Iftime, A.; Tofolean, I.T.; et al. Mitochondrial respiratory complex I probed by delayed luminescence spectroscopy. J. Biomed. Opt. 2013, 18, 127006. [Google Scholar] [CrossRef] [PubMed]
- Tian, M.; Li, Q.; Liu, Y.; Zheng, P.; Li, D.; Zhao, Y.; Wang, B.; Li, C.; Wang, J.; Gao, P.; et al. Relationship between delayed luminescence emission and mitochondrial status in Saccharomyces cerevisiae. Sci. Rep. 2022, 12, 394. [Google Scholar] [CrossRef] [PubMed]
- Sun, M.; Wu, H.; He, M.; Jia, Y.; Wang, J.; Liu, T.; Hui, L.; Li, L.; Wei, S.; van Wijk, E.; et al. Integrated assessment of medicinal rhubarb by combination of delayed luminescence and HPLC fingerprint with emphasized on bioactivities based quality control. Chin. Med. 2020, 15, 72. [Google Scholar] [CrossRef] [PubMed]
- Köhler, B. Der Einfluß von Haltung, Fütterung und Beleuchtung auf die Biophotonenemission (Delayed Luminescence) Sowie Herkömmliche Qualitätsparameter von Hühnereiern. Ph.D. Thesis, University of Kassel, Kassel, Germany, KWALIS Qualitätsforschung Fulda GmbH, Dipperz, Germany, 2001. [Google Scholar]
- Egerer, U. Feldstudie zur Eignung der Biophotonenmessung für die Differenzierung von ökologisch und Konventionell Erzeugten Hühnereiern. Ph.D. Thesis, University Hohenheim, Institute of Animal Housing and Breeding, Stuttgart, Germany, 2009; p. 182. Available online: https://opus.uni-hohenheim.de/volltexte/2009/404/ (accessed on 19 June 2017).
- Wohlers, J.; Stolz, P. Differentiation between milk from low-input biodynamic, intermediate-input organic and high-input conventional farming systems using fluorescence excitation spectroscopy (FES) and fatty acids. Biol. Agric. Hort. 2019, 35, 172–186. [Google Scholar] [CrossRef]
- Strube, J.; Stolz, P. The application of fluorescence excitation spectroscopy of whole samples for identification of the culture system of wheat and carrots—method, validation, results. Biol. Agric. Hort. 2010, 27, 59–80. [Google Scholar] [CrossRef]
- Wohlers, J.; Stolz, P.; Mende, G. Projektbericht zu Projekt: CS-P 11364. Qualitätsbeurteilung von Milch Mittels Fluoreszenz-Anregungs-Spektroskopie. Optimierung und Anwendung der Methode; Project report on project: CS-P 11364; KWALIS: Dipperz, Germany, 2017. [Google Scholar]
- Probst, J.; Spengler Neff, A.; Spengler Neff, A. Vergleiche zwischen Schädelformen von als Kalb enthornten Kühen und Schädelformen von behornten Kühen. In Proceedings of the Kolloquium zum Hornstatus Rind 3, Agroscope and FIBL, Posieux, Switzerland, 3 November 2016. [Google Scholar]
- Probst, J.K.; Kauf, P.; Ackermann, A.; Hutter, M.; Spengler Neff, A. Unterscheiden sich die Schädelformen von behornten und unbehornten Kühen? In Proceedings of the Wissenschaftstagung Ökologischer Landbau, Campus Weihenstephan, Freising, Germany, 7–10 March 2017. [Google Scholar]
- Seelbach, V. Das Wesen der Kuh; Schriftenreihe zur Tierwesenkunde, Band 1; Firma Schaette: Bad Waldsee, Germany, 1992; p. 12. [Google Scholar]
- Leiber, F. Was macht die Kuh mit den Hörnern? Das Goetheanum 2008, 4, 6–7. [Google Scholar]
- Rath, S. The Complete Cow; Voyager Press: Saint Paul, MN, USA, 1998. [Google Scholar]
- Baars, T.; Boeren, S.; Hettinga, K.; Vervoort, J.; Jahreis, G.; Lorkowski, S.; Squartini, A.; Pindo, M. The Physiological Impact of Horniness in Winter; FIBL: Frick, Switzerland, 2017; pp. 1–69. [Google Scholar]
- Baars, T.; Jahreis, G.; Lorkowski, S.; Rohrer, C.; Vervoort, J.; Hettinga, K. Changes under low ambient temperatures in the milk lipodome and metabolome of mid-lactation cows after dehorning as a calf. J. Dairy Sci. 2019, 102, 2698–2702. [Google Scholar] [CrossRef] [Green Version]
- Wohlers, J. Ermittlung Geeigneter Methoden zur Differenzierung und Qualitätsbeurteilung Unterschiedlicher Milchqualitäten aus Verschiedenen on-Farm-Experimenten. Ph.D. Thesis, University of Kassel, Witzenhausen, Germany, 2011. Available online: http://nbn-resolving.de/urn:nbn:de:hebis:34-2011121440032 (accessed on 24 June 2022).
- Nazoori, A. Formation, structure, and function of extra-skeletal bones in mammals. Biol. Rev. 2020, 95, 986–1019. [Google Scholar] [CrossRef]
- Hoefs, M. The thermoregulatory potential of Ovis horn cores. Canad. J. Zool. 2000, 78, 1419–1426. [Google Scholar] [CrossRef]
- Parés-Casanova, P.M.; Kucherova, I. Possible tendency of longer horns towards shorter ears in goats. Adv. Agric. Biol. 2014, 1, 17–19. [Google Scholar] [CrossRef]
- Parés-Casanova, P.M.; Caballero, M. Possible tendency of polled cattle towards larger ears. Rev. Colomb. De Cienc. Pecu. 2014, 27, 221–225. Available online: http://www.scielo.org.co/scielo.php?script=sci_arttext&pid=S0120-06902014000300008&lng=en&nrm=iso (accessed on 9 March 2022).
- Bastin, C.; Théron, L.; Lainé, A.; Gengler, N. On the role of mid-infrared predicted phenotypes in fertility and health dairy breeding programs. J. Dairy Sci. 2016, 99, 4080–4094. [Google Scholar] [CrossRef] [Green Version]
- McParland, S.; Berry, D. The potential of Fourier transform infrared spectroscopy of milk samples to predict energy intake and efficiency in dairy cows. J. Dairy Sci. 2016, 99, 4056–4070. [Google Scholar] [CrossRef]
- Denninger, T.M.; Dohme-Meier, F.; Eggerschwiler, L.; Vanlierde, A.; Grandl, F.; Gredler, B.; Kreuzer, M.; Schwarm, A.; Münger, A. Persistence of differences between dairy cows categorized as low or high methane emitters, as estimated from milk mid-infrared spectra and measured by GreenFeed. J. Dairy Sci. 2019, 102, 11751–11765. [Google Scholar] [CrossRef] [Green Version]
- Stolz, P.; Wohlers, J.; Mende, G. Measuring delayed luminescence by FES to evaluate special quality aspects of food samples—An overview. Open Agric. 2019, 4, 410–417. [Google Scholar] [CrossRef]
- Wohlers, J.; Stolz, P.; Mende, G. Projektbericht zu Projekt P14 219: Untersuchungen von Milchproben Horntragender und Enthornter Kühe Mittels Fluoreszenz-Anregungs-Spektroskopie (FAS). Kurztitel: HornMilch_2021; KWALIS: Dipperz, Germany, 2022; p. 48. [Google Scholar]
- Rumphorst, T.; Scheu, T.; Koch, C.; Sundrum, A. Balancing Trade-Offs in Milk Production by Making Use of Animal Individual Energy Balancing. Dairy 2022, 3, 345–363. [Google Scholar] [CrossRef]
- Sniffen, C.J.; Beverly, R.W.; Mooney, C.S.; Roe, M.B.; Skidmore, A.L.; Black, J.R. Nutrient Requirements Versus Supply in the Dairy Cow: Strategies to Account for Variability. J. Dairy Sci. 1993, 76, 3160–3178. [Google Scholar] [CrossRef]
- Mcnamara, J. Triennial Lactation Symposium: Systems biology of regulatory mechanisms of nutrient metabolism in lactation. J. Anim. Sci. 2015, 93, 5575–5585. [Google Scholar] [CrossRef]
- Hotho, G. Establishing the Influence of Character, Health and other Characteristics of the Cow on its Milk Using the Biocrystallisation Method. Elem. Der Nat. 2020, 113, 34–56. [Google Scholar] [CrossRef]
- Forsbäck, L.; Lindmark-Månsson, H.; Andrén, A.; Åkerstedt, M.; Andrée, L.; Svennersten-Sjaunja, K. Day-to-day variation in milk yield and milk composition at the udder-quarter level. J. Dairy Sci. 2010, 93, 3569–3577. [Google Scholar] [CrossRef] [PubMed]
- Linzell, J.L.; Peaker, M. Day-To-Day Variations in Milk Composition in the Goat and Cow as a Guide to the Detection of Subclinical Mastitis. Br. Vet. J. 1972, 128, 284–295. [Google Scholar] [CrossRef]
- Chilliard, Y.; Glasser, F.; Ferlay, A.; Bernard, L.; Rouel, J.; Doreau, M. Diet, rumen biohydrogenation and nutritional quality of cow and goat milk fat. Eur. J. Lipid. Sci. Techn. 2007, 109, 828–855. [Google Scholar] [CrossRef]
- Bär, C.; Sutter, M.; Kopp, C.; Neuhaus, P.; Portmann, R.; Egger, L.; Reidy, B.; Bisig, W. Impact of herbage proportion, animal breed, lactation stage and season on the fatty acid and protein composition of milk. Int. Dairy J. 2020, 109, 104785. [Google Scholar] [CrossRef]
- Magan, J.B.; O′Callaghan, T.F.; Kelly, A.L.; Mc Carthy, N.A. Compositional and functional properties of milk and dairy products derived from cows fed pasture or concentrate-based diets. Compr. Rev. Food Sci. Food Saf. 2021, 20, 1–32. [Google Scholar] [CrossRef]
- Baars, T.; Wohlers, J.; Rohrer, C.; Lorkowski, S.; Jahreis, G. Patterns of Biodynamic Milk Fatty Acid Composition Explained by A Climate-Geographical Approach. Animals 2019, 9, 111. [Google Scholar] [CrossRef] [Green Version]
- Coppa, M.; Ferlay, A.; Chassaing, C.; Agabriel, C.; Glasser, F.; Chilliard, Y.; Borreani, G.; Barcarolo, R.; Baars, T.; Kusche, D.; et al. Prediction of bulk milk fatty acid composition based on farming practices collected through on-farm surveys. J. Dairy Sci. 2013, 96, 4197–4211. [Google Scholar] [CrossRef]
- Taylor, C.R. The vascularity and possible thermoregulatory function of the horns in goats. Physiol. Zool. 1966, 39, 127–139. [Google Scholar] [CrossRef]
- Fernandez, E.E.; Oltjen, J.R.; Sainz, R.D. Mitochondrial abundance and function in muscle from beef steers with divergent residual feed intakes. Animal 2020, 14, 560–565. [Google Scholar] [CrossRef]
- Olijhoek, D.W.; Løvendahl, P.; Lassen, J.; Hellwing, A.L.F.; Höglund, J.K.; Weisbjerg, M.R.; Noel, S.J.; McLean, F.; Højberg, O.; Lund, P. Methane production, rumen fermentation, and diet digestibility of Holstein and Jersey dairy cows being divergent in residual feed intake and fed at 2 forage-to-concentrate ratios. J. Dairy Sci. 2018, 101, 9926–9940. [Google Scholar] [CrossRef] [PubMed] [Green Version]
- Kolath, W.H.; Kerley, M.S.; Golden, J.W.; Keisler, D.H. The relationship between mitochondrial function and residual feed intake in Angus steers. J. Anim. Sci. 2006, 84, 861–865. [Google Scholar] [CrossRef] [PubMed]
- Hendriks, J.; Scholtz, M.M.; Neser, F.W.C. Possible reasons for differences in residual feed intake: An overview. S. Afr. J. Anim. Sci. 2013, 43, 103–106. [Google Scholar] [CrossRef] [Green Version]
- Van Wijk, R. Light in Shaping Life. Biophotons in Biology and Medicine; Meluna: Geldermalsen, The Netherlands, 2014; Volume 432, p. 317. [Google Scholar]
Figure 1.
Cow-specific emission of the short-term and long-term EPs after yellow and white excitation (Mw1ye, Mw1w, R40ye, and R40w). Box plots represent the median and the upper and lower quartile of the eight samples per cow. Data points above or below the whiskers are considered outliers. X = disbudded cow, O = horned cow, green = pure hay diet, red = concentrate added diet, dark colored = 10 °C, and light colored = 25 °C (heat stress). The circles indicate the region of significant difference of the Tukey HSD Test; non-overlapping circles are significantly different.

Figure 2.
Mean emission of the cow in relation to the horn status and the quartile group of the respective EP, for Mw1ye, Mw1w, and R40ye. Box plots indicate the median and by the whiskers the upper and lower quartile region of non-outlier data per group. H = horned, and D = disbudded.
Figure 2.
Mean emission of the cow in relation to the horn status and the quartile group of the respective EP, for Mw1ye, Mw1w, and R40ye. Box plots indicate the median and by the whiskers the upper and lower quartile region of non-outlier data per group. H = horned, and D = disbudded.


Table 1.
Colored glass filters used for excitation, and their specifications (filter type and spectral region of transmission).
Table 1.
Colored glass filters used for excitation, and their specifications (filter type and spectral region of transmission).
| Order | Schott® Filter | Filter Type | Spectral Region (Wavelength Range, Grade of Transmissions > 50%) | Color (Shortcut) |
|---|---|---|---|---|
| 1 | RG695 | Longpass | 695 to 800 nm * | dark red (dr) |
| 2 | RG630 | Longpass | 630 to 800 nm * | red (r) |
| 3 | OG590 | Longpass | 590 to 800 nm * | light red (lr) |
| 4 | OG530 | Longpass | 530 to 800 nm * | yellow (ye) |
| 5 | VG6 | Bandpass | 450 to 590 nm | green (gr) |
| 6 | BG12 | Bandpass | 340 to 470 nm | blue (bl) |
| 7 | UG11 | Bandpass | 270 to 380 nm (UV-A and UV-B) | UV (uv) |
| 8 | (without) | 260–850 nm ** | white (w) |
* limited to the infrared range by a heat protection filter; ** spectral region of the photocathode.
Table 2.
Mean emission (counts/0.1 s) of all n = 152 samples, given for selected EPs, and the mean, median, and maximal variation (min., max.) of the CV (%) of the repeated measurements per sample.
Table 2.
Mean emission (counts/0.1 s) of all n = 152 samples, given for selected EPs, and the mean, median, and maximal variation (min., max.) of the CV (%) of the repeated measurements per sample.
| Emission Intensity | CV 2 of Repeated Measures | ||||||||
|---|---|---|---|---|---|---|---|---|---|
| EP 1 | Excitation Color | Mean | Median | Min | Max | Mean | Median | Min | Max |
| Mw1 | red | 50 | 48 | 29 | 130 | 11.6 | 10.8 | 1.94 | 26 |
| light red | 181 | 181 | 97 | 275 | 5.77 | 5.66 | 1.13 | 14 | |
| yellow | 768 | 756 | 403 | 1283 | 3.34 | 2.90 | 0.43 | 16 | |
| green | 316 | 313 | 189 | 465 | 4.83 | 4.69 | 1.30 | 17 | |
| blue | 589 | 577 | 472 | 788 | 7.08 | 6.06 | 1.11 | 19 | |
| uv | 393 | 393 | 299 | 507 | 6.64 | 6.27 | 0.98 | 20 | |
| white | 3136 | 2784 | 1763 | 12,699 | 17.88 | 11.84 | 1.21 | 99 | |
| R40 | red | 13 | 12 | 6 | 44 | 7.05 | 6.48 | 0.97 | 32 |
| light red | 18 | 17 | 9 | 57 | 7.11 | 6.41 | 1.89 | 23 | |
| yellow | 26 | 25 | 14 | 67 | 7.05 | 5.99 | 1.40 | 25 | |
| green | 22 | 21 | 15 | 43 | 7.18 | 6.78 | 2.00 | 19 | |
| blue | 30 | 28 | 21 | 54 | 7.84 | 7.55 | 1.20 | 24 | |
| uv | 21 | 20 | 14 | 36 | 9.04 | 8.73 | 2.62 | 26 | |
| white | 62 | 59 | 41 | 116 | 9.49 | 9.04 | 1.79 | 26 | |
1 EP = emission parameter. Mw1 = short-term emission, first measuring interval after excitation. R40 = long-term emission, mean of the last 40 of 100 intervals of 0.1 s. 2 CV = coefficient of variation of 5 repeated measurements per sample.
Table 3.
Frequency of cows with positive, negative, or without time-related trend, and frequency of cows with positive and negative feeding effect, for the EPs Mw1ye and Mw1w.
Table 3.
Frequency of cows with positive, negative, or without time-related trend, and frequency of cows with positive and negative feeding effect, for the EPs Mw1ye and Mw1w.
| Time Trend | Diet Effect | ||||
|---|---|---|---|---|---|
| Mw1ye | Mw1w | Mw1ye | Mw1w | ||
| Positive | 5 | 3 | Positive for pure hay | 3 | 9 (+4 *) |
| Negative | 8 | 6 (+6 *) | Negative for pure hay | 7 (+3 *) | 2 (+1 *) |
| Without (ns) | 6 | 4 | Without (ns) | 6 | 3 |
* with p = 0.3–0.1.
Table 4.
Regression analysis of several experiment-related factors for the data variation of the EPs Mw1ye and Mw1w (n = 152).
Table 4.
Regression analysis of several experiment-related factors for the data variation of the EPs Mw1ye and Mw1w (n = 152).
| Mw1ye | Mw1w | ||||||||||||
|---|---|---|---|---|---|---|---|---|---|---|---|---|---|
| DF | Est. | SE | SS (th.) | F Ratio | Prob > F | Est. | SE | SS | F Ratio | Prob > F | |||
| cow | 19 | * | 3 962 | 29.692 | <0.001 | ** | 6.707 | 8.704 | <0.001 | ||||
| diet (c-added) | 1 | 24.88 | 7.11 | 85.9 | 12.231 | <0.001 | −0.083 | 0.017 | 0.958 | 23.620 | <0.001 | ||
| temp. (10 °C) | 1 | 11.28 | 7.02 | 18.1 | 2.583 | 0.084 | −0.095 | 0.017 | 1.289 | 31.779 | <0.001 | ||
| day time (morn.) | 1 | 9.92 | 6.87 | 14.7 | 2.086 | 0.167 | −0.020 | 0.016 | 0.056 | 1.469 | 0.228 | ||
| day of sampling | 1 | −0.74 | 0.95 | 4.3 | 0.606 | 0.445 | −0.009 | 0.002 | 0.623 | 15.358 | <0.001 | ||
| Intercept | 786.59 | 25.11 | 8.18 | 0.060 | |||||||||
| Model | 23 | 4086 | 25.290 | <0.001 | 10.03 | 10.755 | <0.001 | ||||||
| R2 R2 (adj.) | 0.82 0.79 | 0.66 0.60 | |||||||||||
| RMSE | 83.81 | 0.20 | |||||||||||
| error | 126 | 885 | 5.11 | ||||||||||
| total | 149 | 4971 | 15.14 | ||||||||||
Mw1ye = short-term emission intensity after yellow excitation, Mw1w = short-term emission after white excitation, DF = degree of freedom, Est. = Estimate (regression coefficient), SE = Standard error of estimate, SS = sum of squares, th. = in thousand, F Ratio = relative amount of data variation related to the factor (source), and Prob > F = significance level. * = not given, ranging from −332 to 193 (SE mean =29.53), ** = ranging from −0.26 to 0.54 (SE mean 0.07). C-added = concentrate-added diet, temp. = ambient temperature, morn. = morning, and RMSE = root mean square error.
Publisher’s Note: MDPI stays neutral with regard to jurisdictional claims in published maps and institutional affiliations. |
© 2022 by the authors. Licensee MDPI, Basel, Switzerland. This article is an open access article distributed under the terms and conditions of the Creative Commons Attribution (CC BY) license (https://creativecommons.org/licenses/by/4.0/).
Share and Cite
MDPI and ACS Style
Wohlers, J.; Stolz, P. The Importance of Cow-Individual Effects and Diet, Ambient Temperature, and Horn Status on Delayed Luminescence of Milk from Brown Swiss Dairy Cows. Dairy 2022, 3, 513-527. https://doi.org/10.3390/dairy3030037
AMA Style
Wohlers J, Stolz P. The Importance of Cow-Individual Effects and Diet, Ambient Temperature, and Horn Status on Delayed Luminescence of Milk from Brown Swiss Dairy Cows. Dairy. 2022; 3(3):513-527. https://doi.org/10.3390/dairy3030037
Chicago/Turabian StyleWohlers, Jenifer, and Peter Stolz. 2022. "The Importance of Cow-Individual Effects and Diet, Ambient Temperature, and Horn Status on Delayed Luminescence of Milk from Brown Swiss Dairy Cows" Dairy 3, no. 3: 513-527. https://doi.org/10.3390/dairy3030037