Article

First Insight into the Variation of the Milk Serum Proteome within and between Individual Cows

1
State Key Laboratory of Food Science & Technology, Jiangnan University, Wuxi 214122, China
2
Food Quality and Design Group, Wageningen University, 6700 AA Wageningen, The Netherlands
3
Laboratory of Biochemistry, Wageningen University, 6700 AA Wageningen, The Netherlands
4
FrieslandCampina, 3818 LE Amersfoort, The Netherlands
*
Author to whom correspondence should be addressed.
Deceased.
Dairy 2022, 3(1), 47-58; https://doi.org/10.3390/dairy3010004
Submission received: 7 November 2021 / Revised: 5 January 2022 / Accepted: 11 January 2022 / Published: 14 January 2022
(This article belongs to the Section Dairy Systems Biology)

Abstract

:
Milk contains all nutrients needed for development of calves. One important group of components responsible for this are the milk proteins. Variation due to feed or animal health, has been studied for the most abundant milk proteins. The aim of this study was to determine the variation between and within cows for their milk serum proteome. Sample Set 1 was collected from Holstein Friesian (HF) cows between November 2011 and March 2012 and prepared using filter aided sample preparation (FASP) followed by LC-MS/MS for protein identification and quantification. The results showed that the milk serum proteome was very constant in mid lactation (four cows at five time points, p > 0.05) between 3 and 6 months in lactation. Sample Set 2 was collected from HF cows in Dec 2012 and analyzed using FASP and dimethyl labeling followed by LC-MS/MS. Significant variation in the milk serum proteome (p < 0.05) between 17 individual cows was found in Sample Set 2. The most variable proteins were immune-related proteins, which may reflect the health status of the individual cow. On the other hand, proteins related to nutrient synthesis and transport were relatively constant, indicating the importance of milk in providing a stable supply of nutrients to the neonate. In conclusion, the milk serum proteome was stable over mid lactation, but differed significantly between individuals, especially in immune-related proteins.

1. Introduction

Milk contains many bioactive factors and unique nutrients, which are essential for the growth and development of the neonate. It includes components influencing the host defence system, gastrointestinal development, brain development, and growth of the neonate [1]. An important group of components involved in the development of neonates are milk proteins [2].
Milk proteins comprise caseins and whey proteins, which include low abundant immune-related proteins, such as immunoglobulins, proteins of the complement system, monocyte differentiation antigen CD14, osteopontin, clusterin, and alpha-1-antitrypsin [3]. The high abundant milk proteins provide essential amino acids and bioactive peptides, whereas the low abundant proteins provide support for, amongst others, intestinal and immune development. The relative abundance of these proteins is not constant, which may be attributed to several factors, such as lactation stage, health status, feeding, and genotype [3,4]. The health status of cows is the best studied parameter, mainly focusing on variation in the milk proteome due to mastitis [5]. The milk serum proteome shown to change with progressing lactation stage, especially from colostrum to early lactation [4,6]. However, the extent of variation within individual cows between different months in mid lactation has not been studied yet.
Proteomics techniques as an advanced approach for analysis of the relatively low abundant proteins has been widely used in bovine milk studies, including milk serum proteome, milk fat globule membrane proteome as well as their changes over lactation, during mastitis, between species, and after processing [7,8].
Holstein Friesian (HF) is the dominant cow breed in the Netherlands. Therefore, the objectives were to (1) determine the variability between different months of lactation in mid-lactation in HF cows; (2) determine qualitative and quantitative changes of the mature milk serum proteome over lactation in individual HF cows. Our hypothesis was that the milk proteome does not change significantly during mid lactation of HF cows, however, they significantly vary among individual HF cows. Information on such variability within and between cows is useful to help interpret future proteomics studies, as this allows the evaluation of the effect size of a parameter of interest to be compared to the natural variability in the milk serum proteome.

2. Materials and Methods
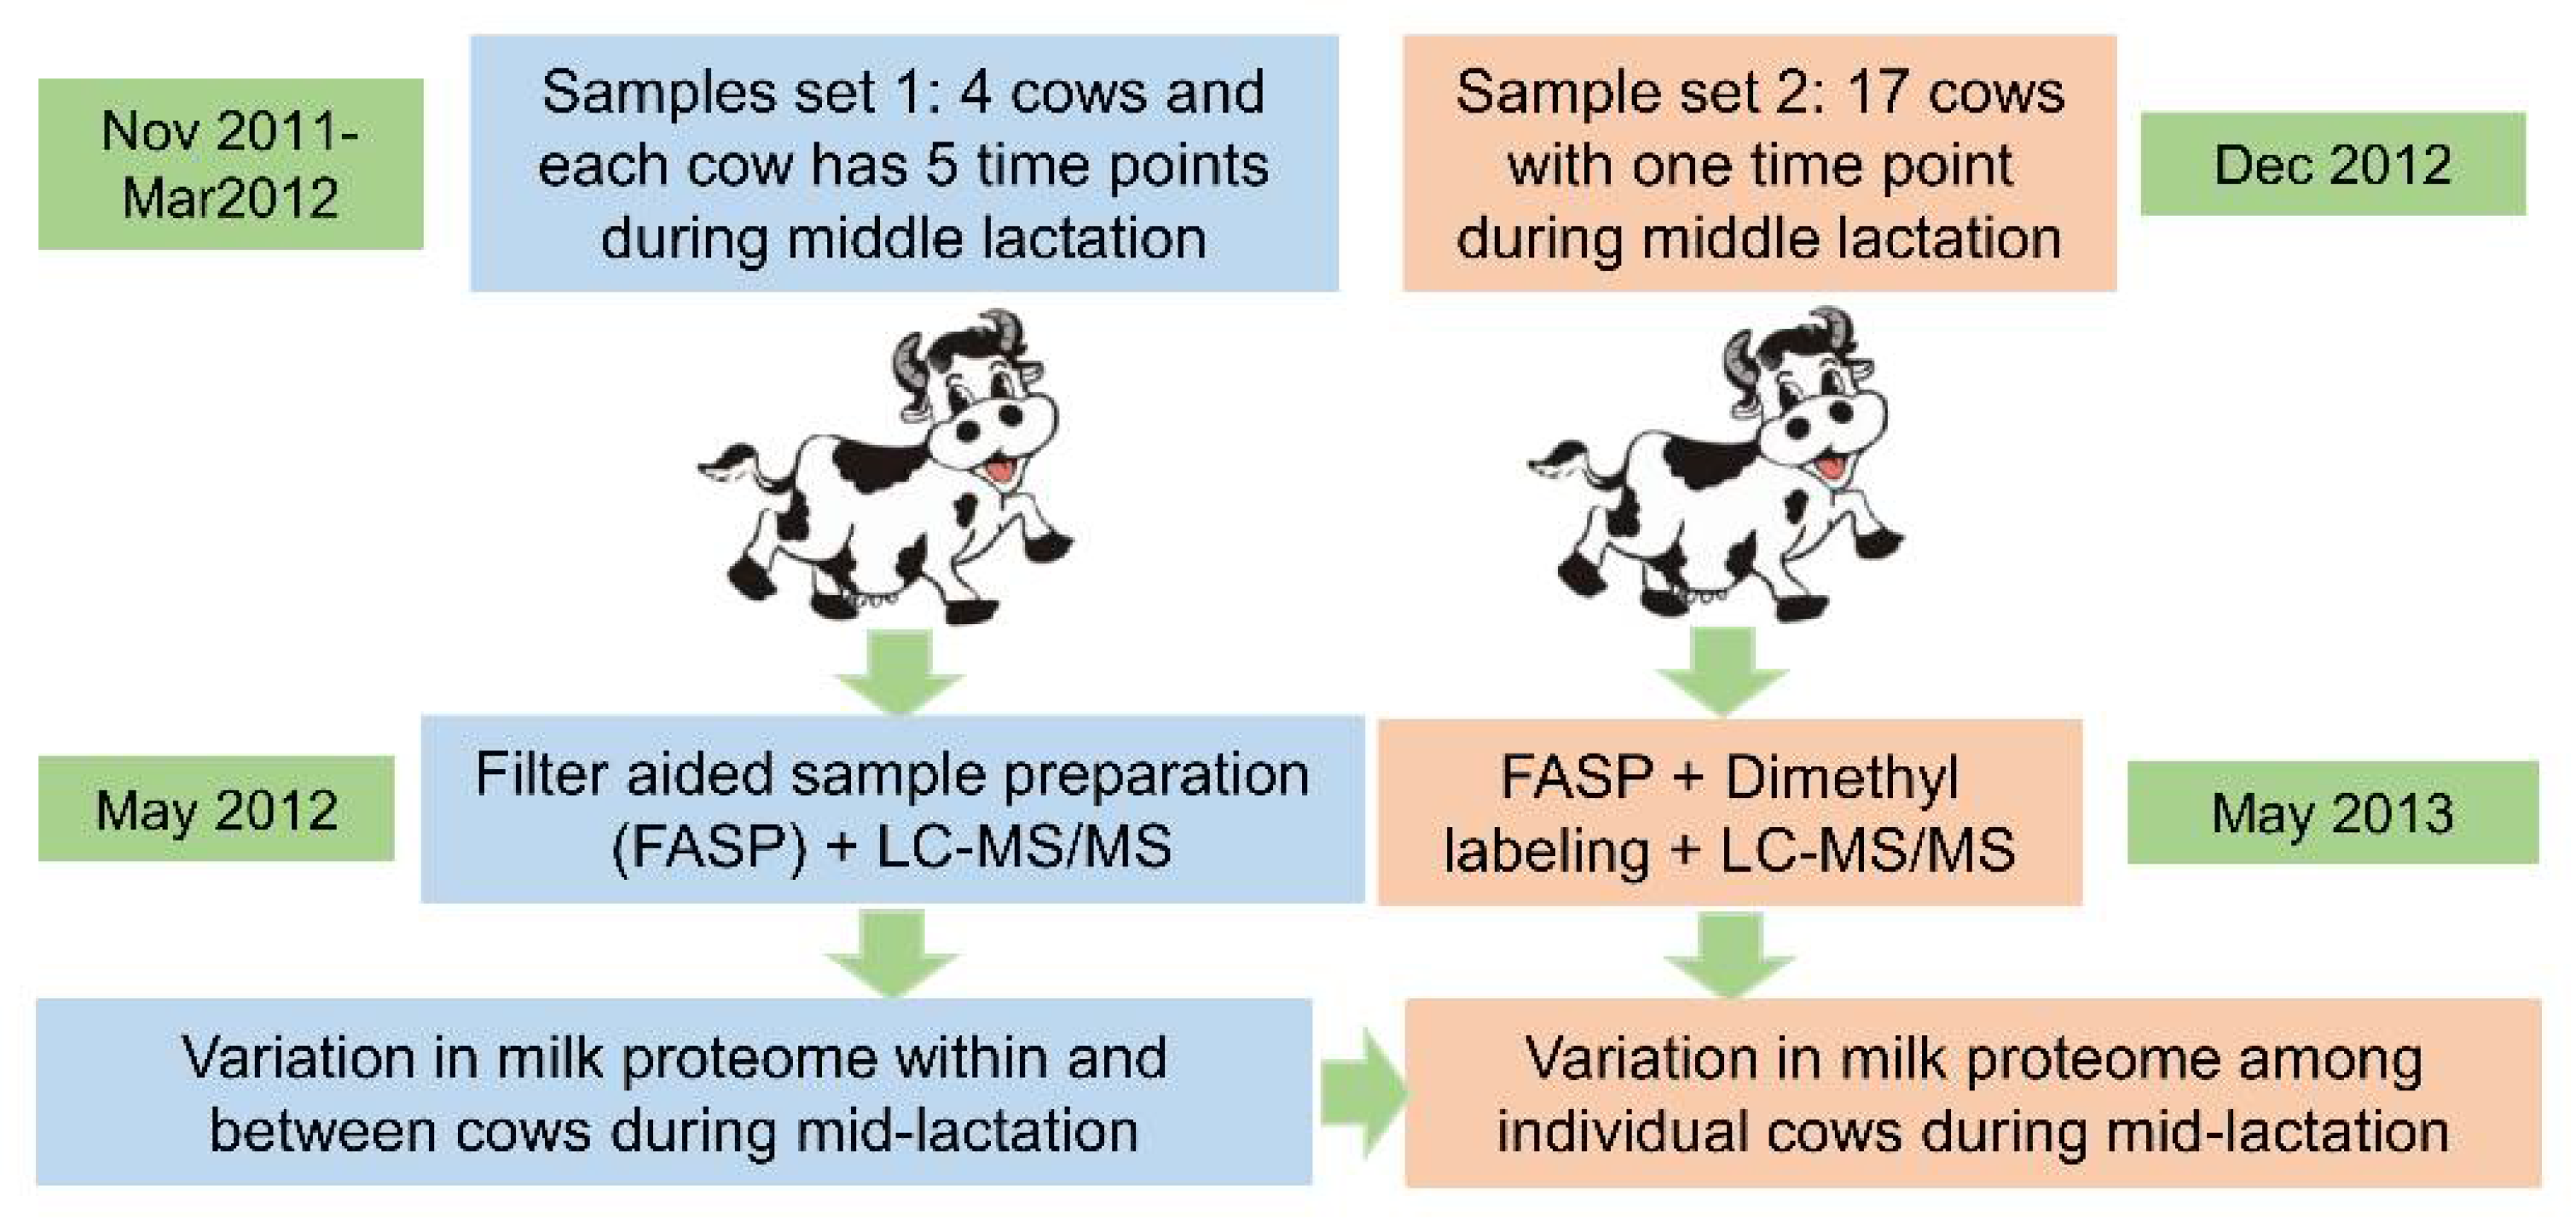
2.1. Samples

Two separate sets of samples from HF cows were analyzed to study the variation both within and between cows. Sample Set 1 was analyzed using filtered aided sample preparation (FASP), followed by LC-MS/MS, which was to determine the variation of low abundant milk serum proteins in mid lactation; Sample Set 2 was composed of a larger number of individual cows, and analyzed using FASP combined with dimethyl labelling followed by LC-MS/MS, which was to profile the overall variation between individual cows. The work flow of this study is shown in Figure 1. The study was in line with international guidelines for the management of animals in research protocols.
Sample Set 1 was collected monthly from four individual healthy HF cows in a farm in Zaffelare (Belgium) between November 2011 and March 2012. All cows were housed indoors, and were managed (including fed) as a single group. These samples were mature milk collected by automatic milking system with the first sample of each cow taken about 3 months in lactation and the last samples taken 3 months later, at about 6 months in lactation. Milk was collected twice a day from each cow (morning and evening). Pooled milk from morning and evening samples was used as one time points of each cow in this study. In total, 20 samples were collected of the four cows. The information of somatic cell count (SCC) and parity were recorded, as shown in Table 1. These four cows received the same feeding, which was a combination of grass silage, maize silage, wheat, and pressed pulp. The samples were first stored in the freezer (−18 °C) on the farm and then transported to Wageningen for further analyses.
Sample Set 2 was collected from 32 healthy HF cows in the Wageningen University farm at the same time (December 2012). Lactation days, SCC, and parity were recorded during the collection period and 17 cows were selected based on lactation days, health status, and parity, as shown in Table 2. All the cows were in mid lactation with lactation days varying from day 112 to day 247, parity varied from 2 to 5, and SCC varied from 151 × 103 to 270 × 103. Milk was collected twice a day from each cow (morning and evening) and was continuously collected for four days. Pooled milk from these four days represent one individual sample of a cow. The milk composition of these 17 samples were also measure as shown in Table S1. Due to the stability on the quantitative level of the mature milk proteome (results from Sample Set 1), 17 mature milk samples with lactation days between 2 months after the start until 2 months before the end of lactation were selected from the 32 cows for this study.

2.2. Methods

The methods used in this study were previously published [6,9] but will be briefly explained below. Sample Set 1 was analyzed in May 2012 and Sample Set 2 was analyzed in May 2013, which were all conducted at Wageningen University.

2.2.1. Milk Serum Separation

Samples of each cow were centrifuged at 100,000× g for 75 min at 4 °C (Beckman L-60, rotor 70 Ti, Beckman Coulter, Fullerton, CA, USA). Three layers were formed, fat layer on the top, milk serum in the middle and casein pellet at the bottom. The middle layer of the milk serum was transferred to a new Eppendorf tubes and centrifuged again at 25,000× g for 20 min at room temperature using a table centrifuged (Eppendorf 5430, Hamburg, Germany). After removal of the top layer, the milk serum was collected. This sample was ready for the BCA assay and protein digestion, as described below.

2.2.2. Bicinchoninic Acid (BCA) Assay

According to the manufacturer’s instructions, BCA Protein Assay Kit 23,225 (Thermo Scientific Pierce®, Rockford, IL, USA) was used for protein concentration measurement. The standard curve was made using bovine serum albumin, which covered the protein concentration ranging from 0.02–2 μg/μL. The milk serum protein concentration was measured through spectrophotometer (Varian Cary 50 Bio UV/Visible, Palo Alto, CA, USA) in triplicate.

2.2.3. Filter-Aided Sampled Preparation (FASP)

Milk serum samples (20 μL), including separate samples of each individual cow and a pooled sample from all cows, were diluted in 100 mM Tris/HCl pH 8.0 + 4% SDS + 0.1 M dithiotreitol (SDT-lysis buffer) to obtain a 1 μg/μL protein solution. Incubated samples for 10 min at 95 °C and cooled down to room temperature. Centrifugation was conducted at 18,500× g for 10 min. Added 20 μL of sample directly to the middle of 180 μL 0.05 M iodoacetamide in 0.1 M Tris/HCl pH 8.0 + 8 M urea (UT) in a low binding Eppendorf tube followed by incubation for 10 min at room temperature with mildly shaking. All the samples were transferred to a Pall 3K omega filter (10–20 kDa cutoff, OD003C34; Pall, Washington, NY, USA) and centrifuged at 15,871× g for 30 min. Added 100 μL UT followed by centrifugation at 15,871× g for 30 min and repeated this step for three times. Added 110 μL 0.05 M NH4HCO3 in water (0.05 M ABC) to the filter followed by centrifugation at 15,871× g for 30 min. Transferred the filter to a new low-binding Eppendorf tube and added 100 μL ABC containing 0.5 μg trypsin and incubated overnight. Centrifuged the digested samples at 15,871× g for 30 min. Finally, removed filter and added 3.5 μL 10% trifluoroacetic acid (TFA) to adjust the pH to around 2. These samples were ready for dimethyl labelling (Sample Set 2), or LC/MSMS in the case of label free analyses (Sample Set 1).

2.2.4. Dimethyl Labeling

The digested pooled milk serum from 17 cows were labeled with the light reagent (mix of CH2O and cyanoborohydride), and digested milk serum of each individual cow were labeled with the heavy reagent (mix of CD2O and cyanoborohydride). According to a previous study [10], stage tips containing 2 mg Lichroprep C18 (25 um particles) was prepared in-house for dimethyl labelling. Firstly, washed the C18+ Stage tip column 2 times by using 200 μL methanol. Secondly, conditioned the column with 100 μL of 1 mL/L formic acid in water (HCOOH). Thirdly, loaded samples onto the C18 + Stage tip column. Washed the column with 100 μL 1 mL/L HCOOH, and flushed slowly with 100 μL labeling reagent (0.2% CH2O or CD2O and 0.03 M cyanoborohydride in 0.05 M phosphate buffer pH 7.5) for about 10 min. Fourthly, washed the column again with 200 μL 1 mL/L HCOOH. Finally, eluted the labeled peptides by using 50 μL of 70% acetonitrile/30% 1 mL/L HCOOH. Then, eluted samples were dried in a vacuum concentrator (Eppendorf Vacufuge®) at 45 °C for 20 to 30 min to obtain the volume of sample less than 15 μL. Mixed the light and heavy dimethyl labelled samples and adjusted the volume to 100 μL through adding 1 mL/L HCOOH. These labeled samples were ready for LC-MS/MS analyses.

2.2.5. LC-MS/MS

Eighteen μL of the peptide samples, from both Sample Set 1 and Sample Set 2, were injected onto a pre-concentration column (0.10 × 30 mm Magic C18AQ 200A 5 µm beads (Michrom Bioresources Inc., Auburn, CA, USA, prepared in house) at a maximum pressure of 270 bar. Eluted peptides from the pre-concentration column to a 0.10 × 200 mm Prontosil 300-3-C18H Magic C18AQ 200A 3 µm analytical column (Leonberg, Germany) by using a gradient from 8% to 33% acetonitrile in water with 0.5 v/v% acetic acid in 50 min at a flow of 0.5 μL/min. Then washed the column through increasing acetonitrile to 80% (0.5 v/v% acetic acid) in 3 min. A P777 Upchurch microcross was positioned between the pre-concentration and analytical column. An electrospray potential at 3.5 kV was used to the eluent via a stainless-steel needle fitted into the waste line of the microcross. Full scan FTMS spectra with m/z 380 and 1400 was measured in positive mode by LTQ-Orbitrap XL (Thermo electron, San Jose, CA, USA). The four most abundant doubly- and triply-charged peaks were recorded in data-dependent mode and further fragmented by CID in the linear trap (MS/MS threshold = 5000).

2.2.6. Data Analyses

The protein were identified by Maxquant 1.3.0.5 with Andromeda search engine [11]. Fixed modification was carbamidomethylation of cysteines. Enzyme of trypsin was used with maximally 2 missed cleavages. Peptide tolerance was set to 10 ppm and fragment ions tolerance was 0.5 amu. Variable modification included oxidation of methionine, N-terminal acetylation and deamidation of asparagine or glutamine for both identification and quantification. The bovine database was downloaded from Uniprot. Common contaminants was added, including Trypsin (P00760, bovine), Trypsin (P00761, porcine), Keratin K22E (P35908, human), Keratin K1C9 (P35527, human), Keratin K2C1 (P04264, human), and Keratin K1C1 (P35527, human). A mass deviation of MS/MS peaks was set to 0.5 Da and deviation on the peptide m/z was set to 6 ppm during the main search. The false discovery rate (FDR) of 1% was used for both peptide and protein level. The length of peptides of 7 amino acids was used. Proteins with more than 2 distinct peptides (at least one unique peptides) was considered as identified.
The absolute quantification (iBAQ) value was used to represent the relative abundance of milk proteins in Sample Set 1. The iBAQ value was calculated through the sum of all peptide intensities divided by the number of observable tryptic peptides, which was reported to have a good correlation with known protein amount as much as four orders of magnitude [12]. Log 10 transformation of was used for the iBAQ values. Dimethyl labeling ratio was calculated through heavy razor and unique peptides (dimethLys4 and dimethNter4) divided by light (dimethLys0 and dimethNter0 as light). Normalized H/L protein ratios calculated by averaging the peptide ratios were used in Sample Set 2 for further statistical analyses. The function of the identified proteins was checked in Uniprot (http://www.uniprot.org/, accessed 10 April 2013). Gene ontology (GO) enrichment was performed by DAVID bioinformatics Resources 6.7 [13]. The significant changes in milk proteins (iBAQ) over mid lactation (Sample Set 1) were analyzed by one-way ANOVA (Matlab R2012A) with time points (5 levels) and individual cows as factor (4 levels). The individual differences among 17 cows (Sample Set 2) were tested using one-way ANOVA with SCC and parity separately as factors. Hierarchical clustering was used to group cows and milk proteins based on their ratios quantified in at least half of the samples from Sample Set 2.

3. Results

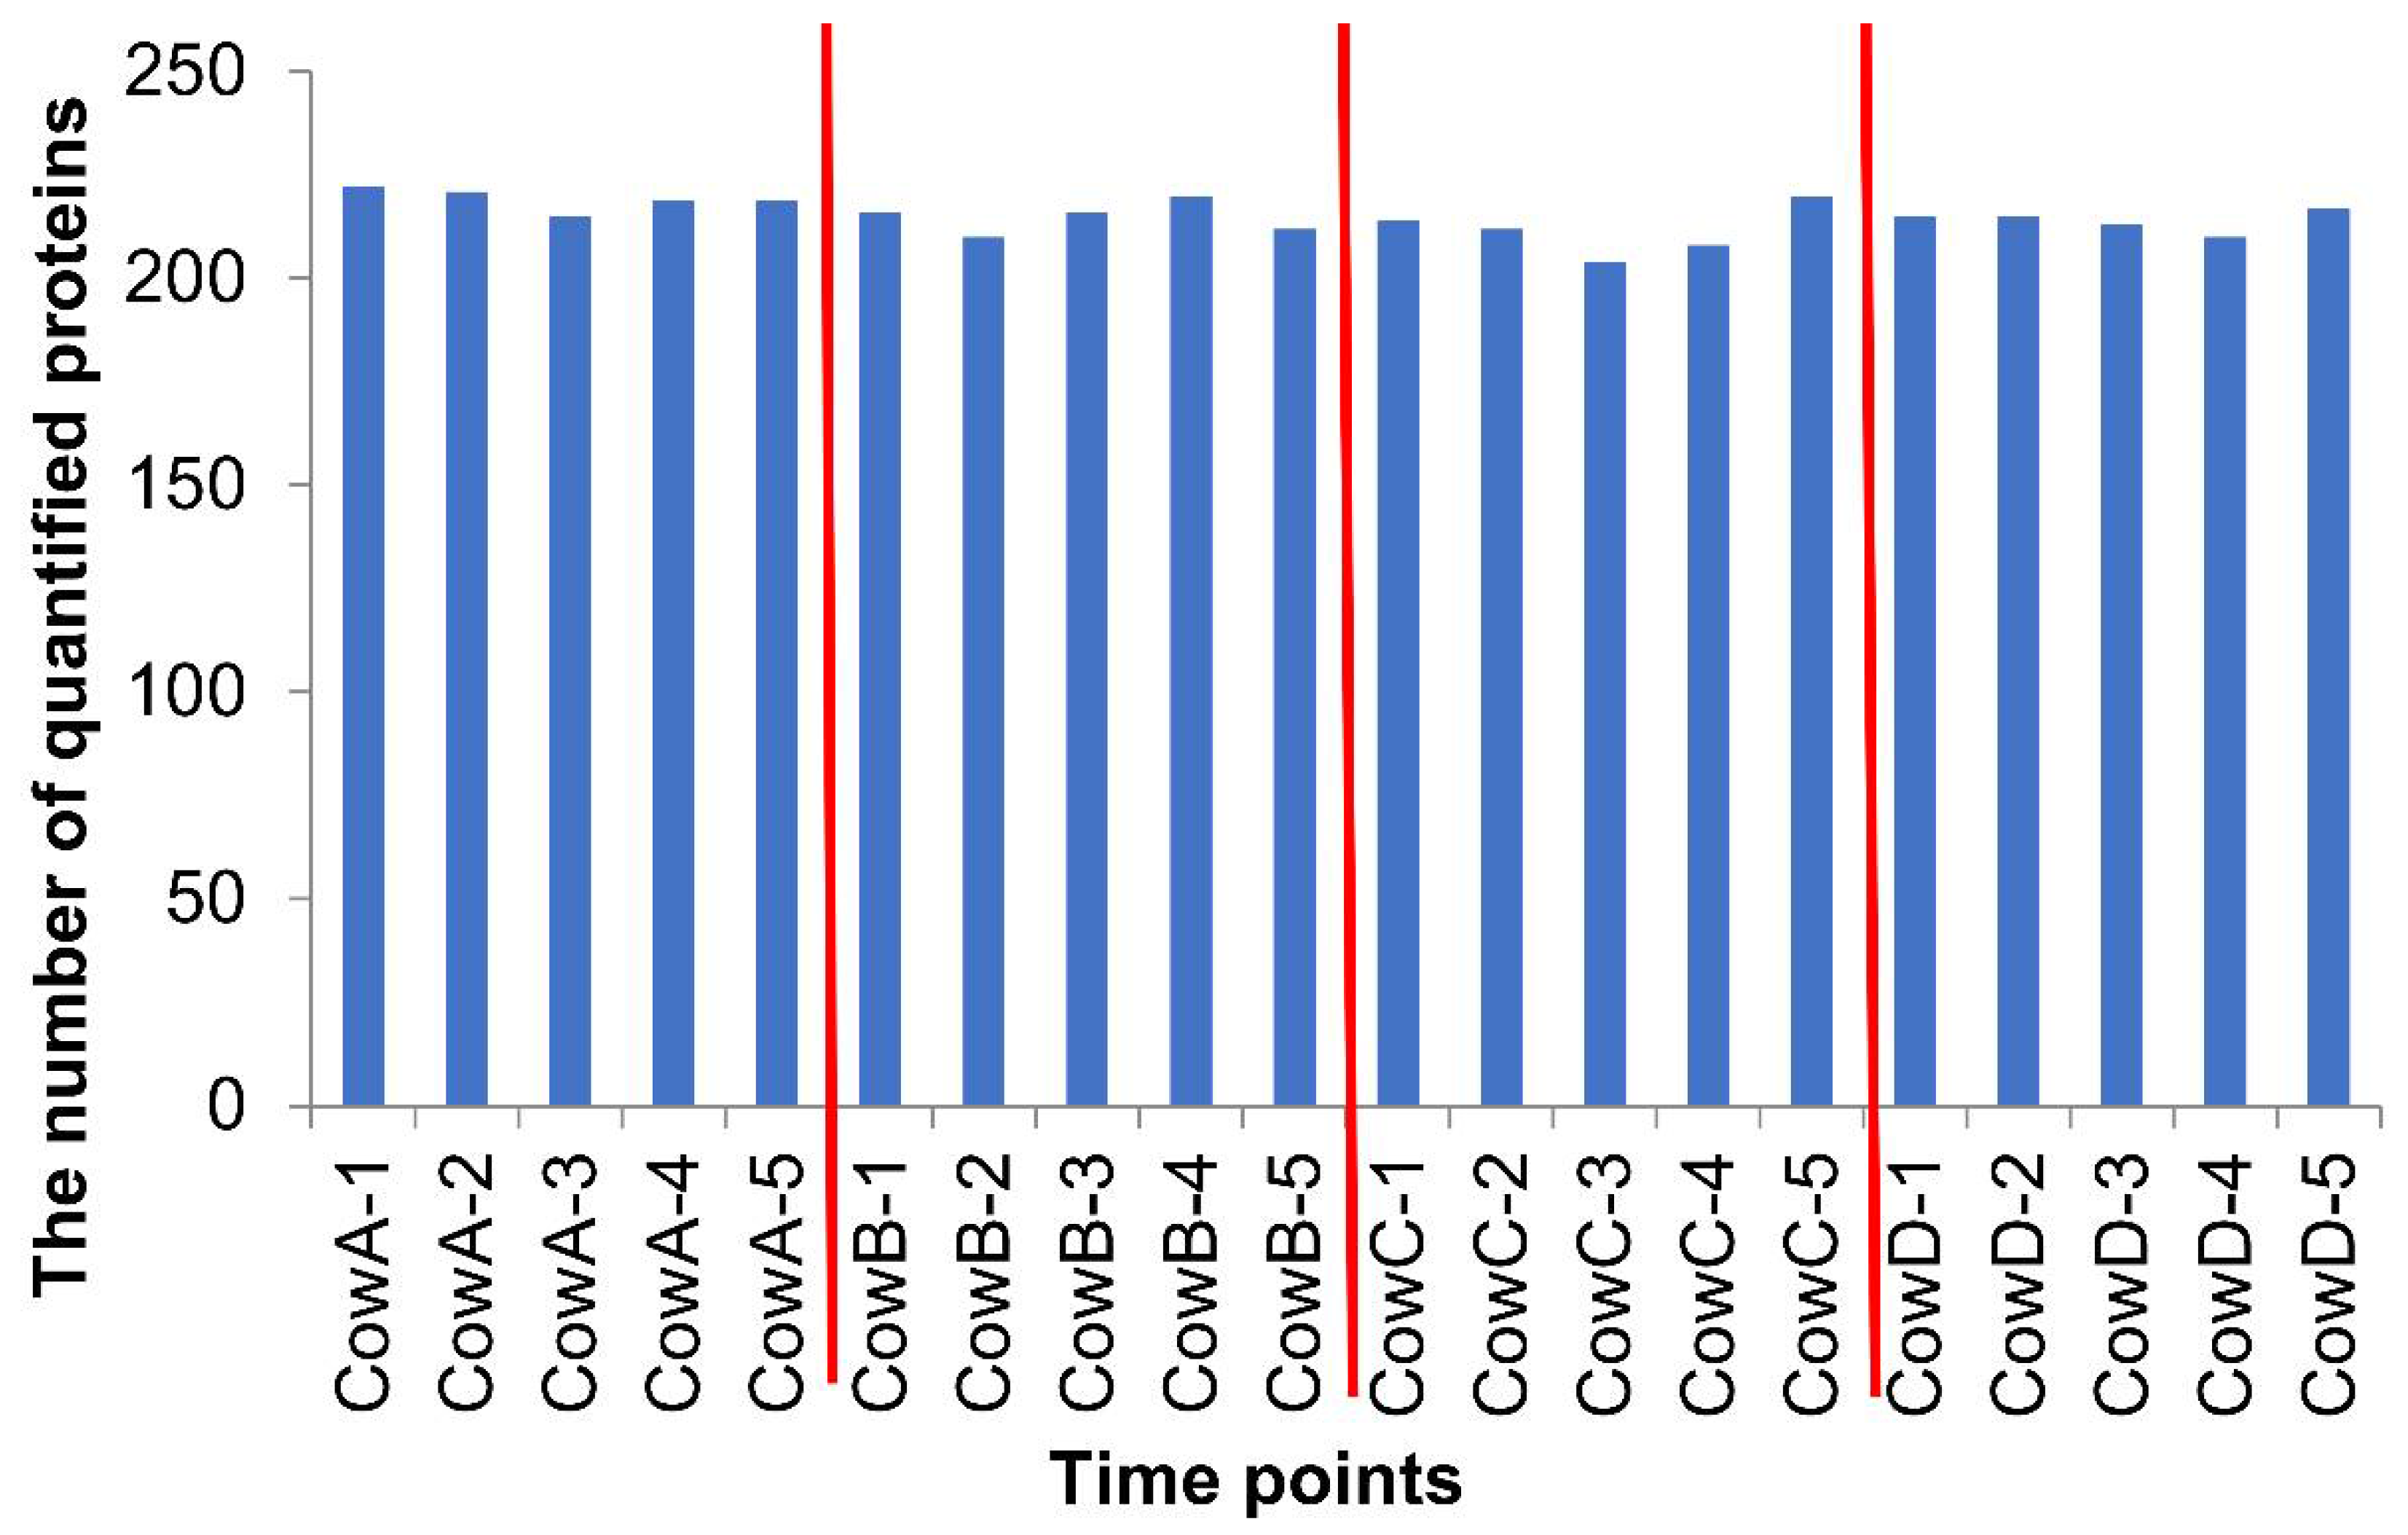
3.1. The Identified and Quantified Proteome in Sample Set 1

A total of 224 proteins were identified and quantified in the milk serum of Sample Set 1 (Table S2). The number of quantified proteins was similar within time series as well as between individual cows, as shown in Figure 2. It also shows that there is a high similarity in the presence of proteins within the milk proteome between individuals, with 218 common proteins.
The concentration of the milk serum proteins did not significantly change between time points in mature milk (p > 0.05), whereas a total of 67 proteins showed significant differences between individual cows. The big variation between individuals and small variation between lactation stages could also be seen in the heatmap (Figure S1).

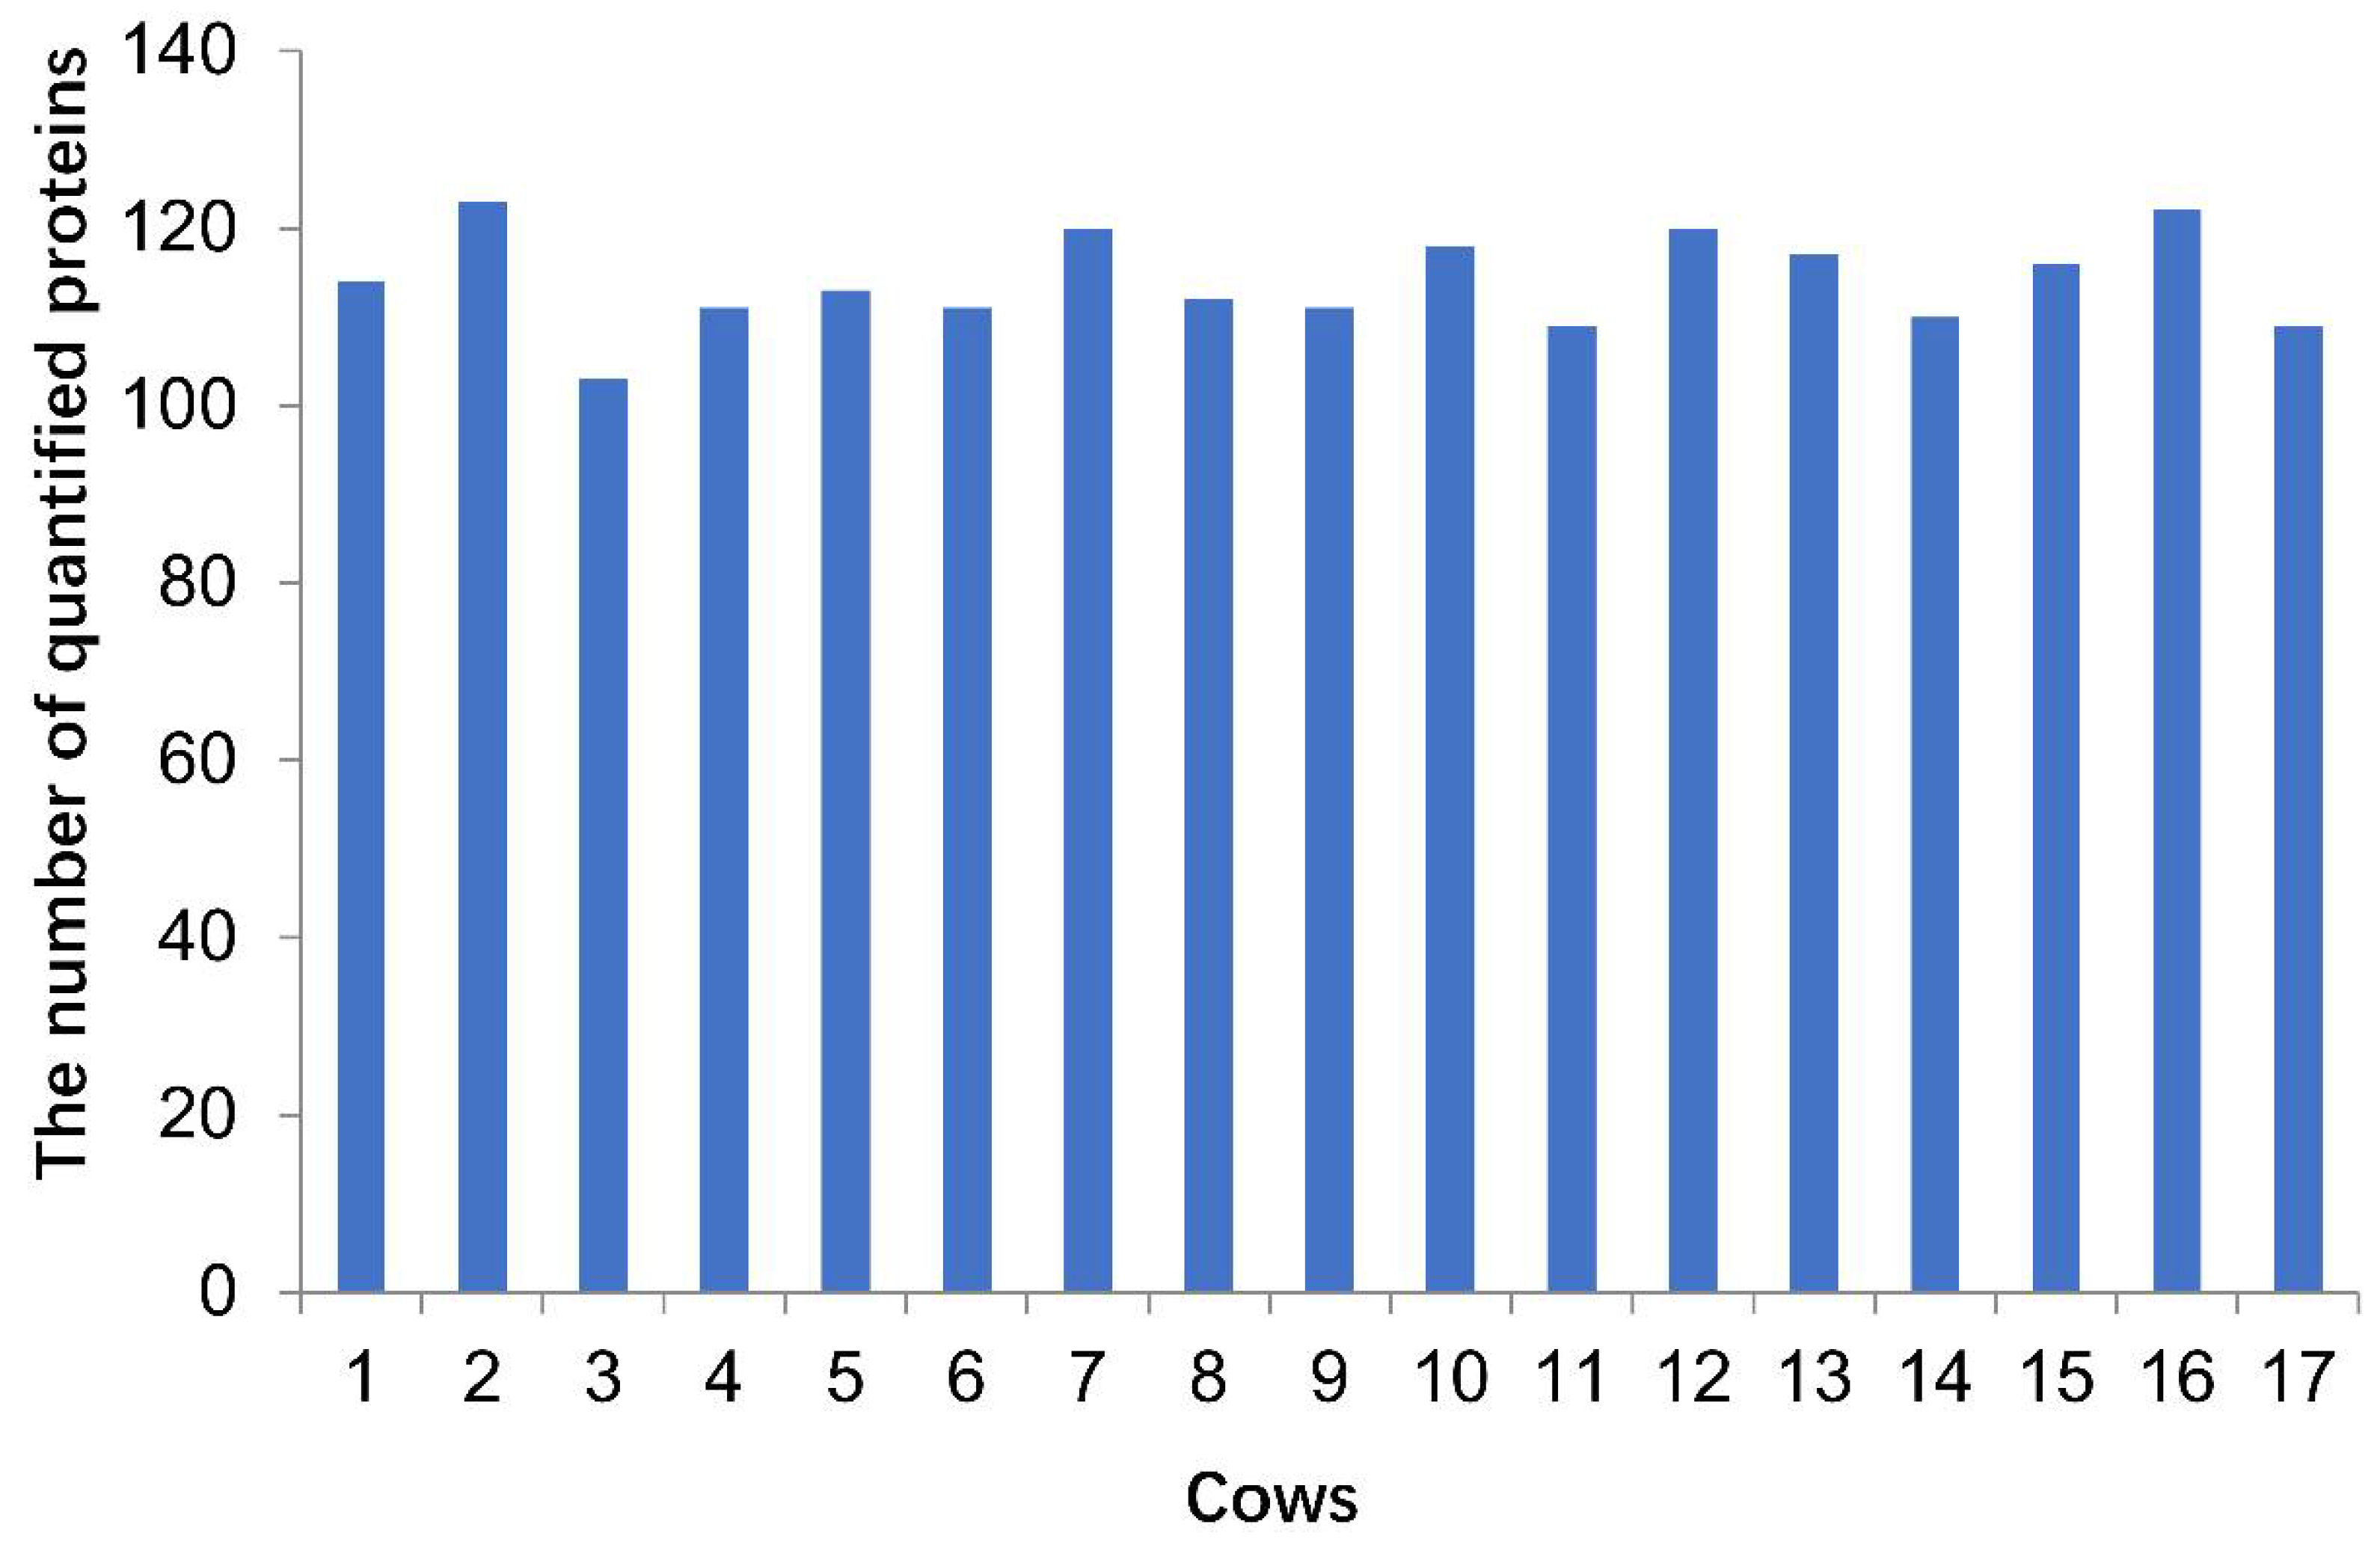
3.2. The Identified and Quantified Proteome in Sample Set 2

As the mature milk serum proteome was constant within healthy individual cows, as shown in Sample Set 1, mature milk collected from a larger number of healthy individual cows at a single time point (n = 17, Sample Set 2) were measured to determine the quantitative variation in milk serum proteins between individual cows. Dimethyl labelling was used for Sample Set 2, because it has been considered as a more precise method in protein quantification in comparison to label free proteomics techniques, as used for Sample Set 1 [14]. A total of 183 proteins were identified, of which 166 proteins could be quantified (Table S3). The variation in the number of quantified proteins among the individual cows is depicted in Figure 3.
Although the total number of proteins did not vary extensively, the detailed milk serum proteome highly varied between individuals as can be seen in the heat map in Figure 4. This agrees with the highly variable milk serum proteins between individual cows, as found in Sample Set 1. The cluster of highly variable immune-related proteins (Figure 3, Cluster A) consists of both innate immune-related proteins and adaptive immune-related proteins, such as cathelicidins (CATHL1, CATHL2), alpha-1-acid glycoprotein 1 (ORM1), osteopontin (SPP1), lactoferrin (LTF), transferrin (TF), inter-alpha-trypsin inhibitor heavy chain H4 (ITIH4), immunoglobulins (IGL@, IGK, IGLL1), and polymeric immunoglobulin receptor (PIGR). In contrast, some proteins showed low variation between individual cows (Figure 3, Cluster B). These proteins, including for example fatty acid-binding protein (FABP3), perilipin-2 (PLIN2), peptidyl-prolyl cis-trans isomerase A (PPIA), 15 kDa selenoprotein (SEP15), and nucleotide exchange factor (SIL1), were mainly related to the synthesis and secretion of nutrients into the milk.

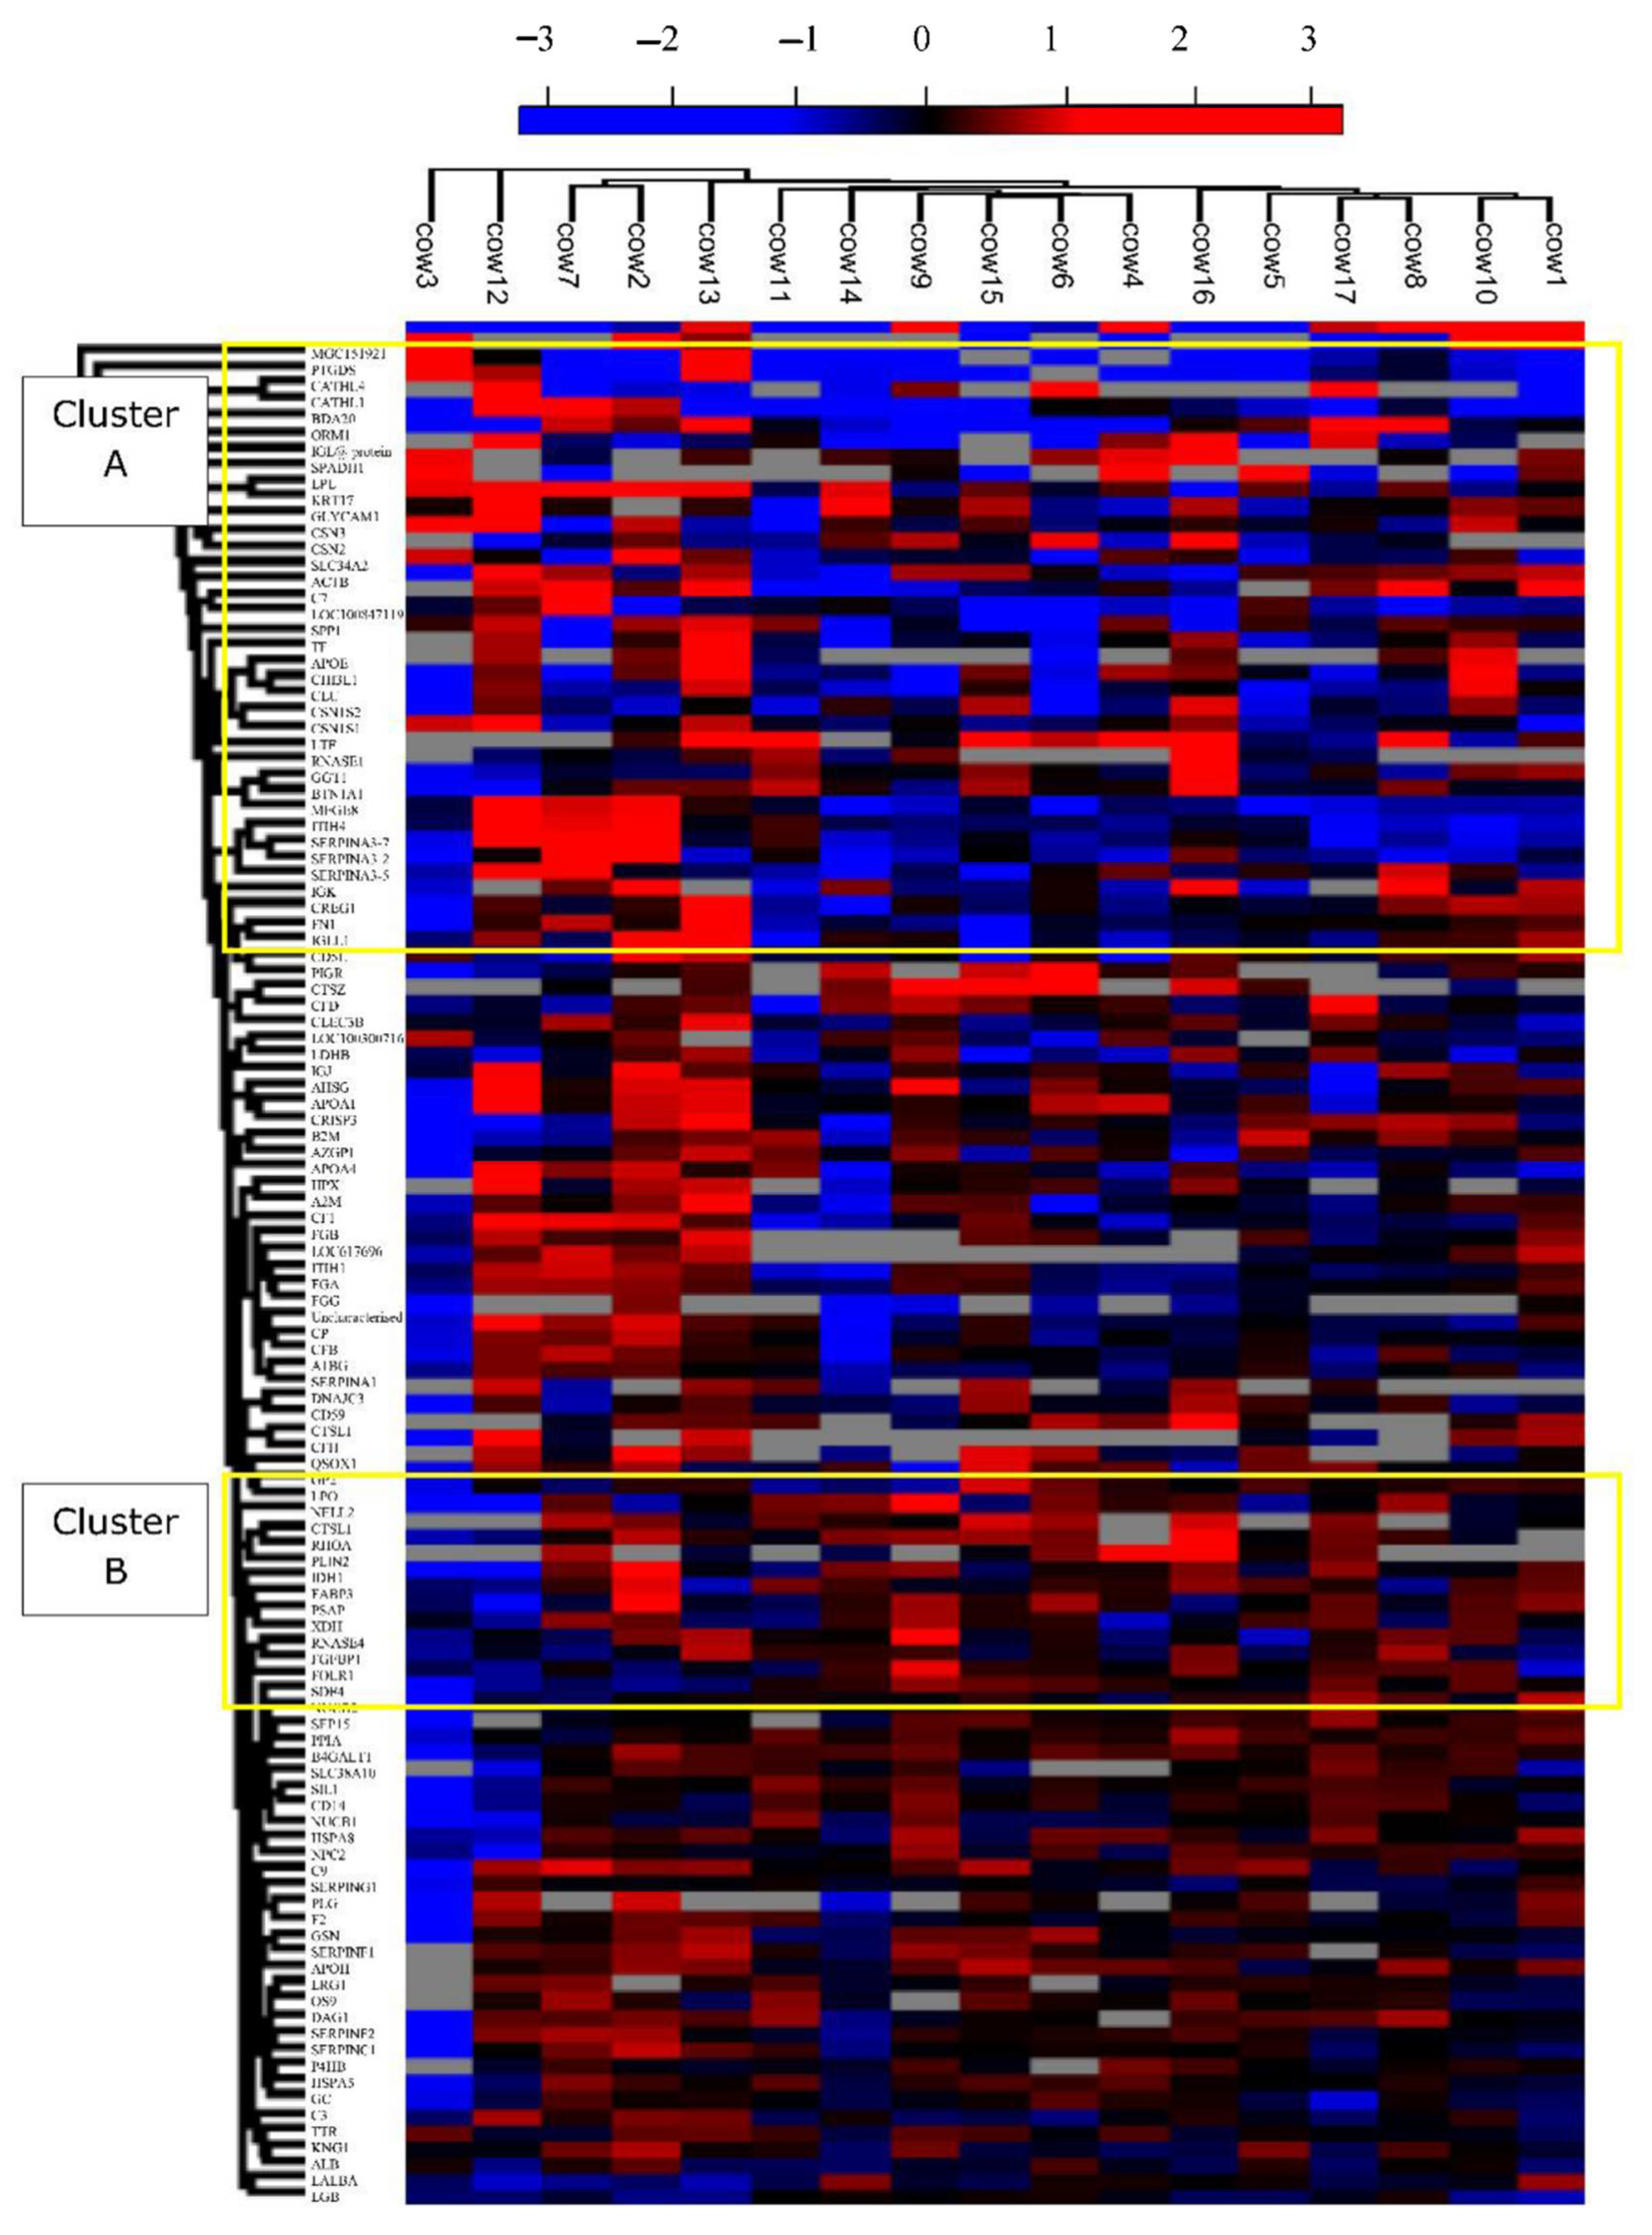
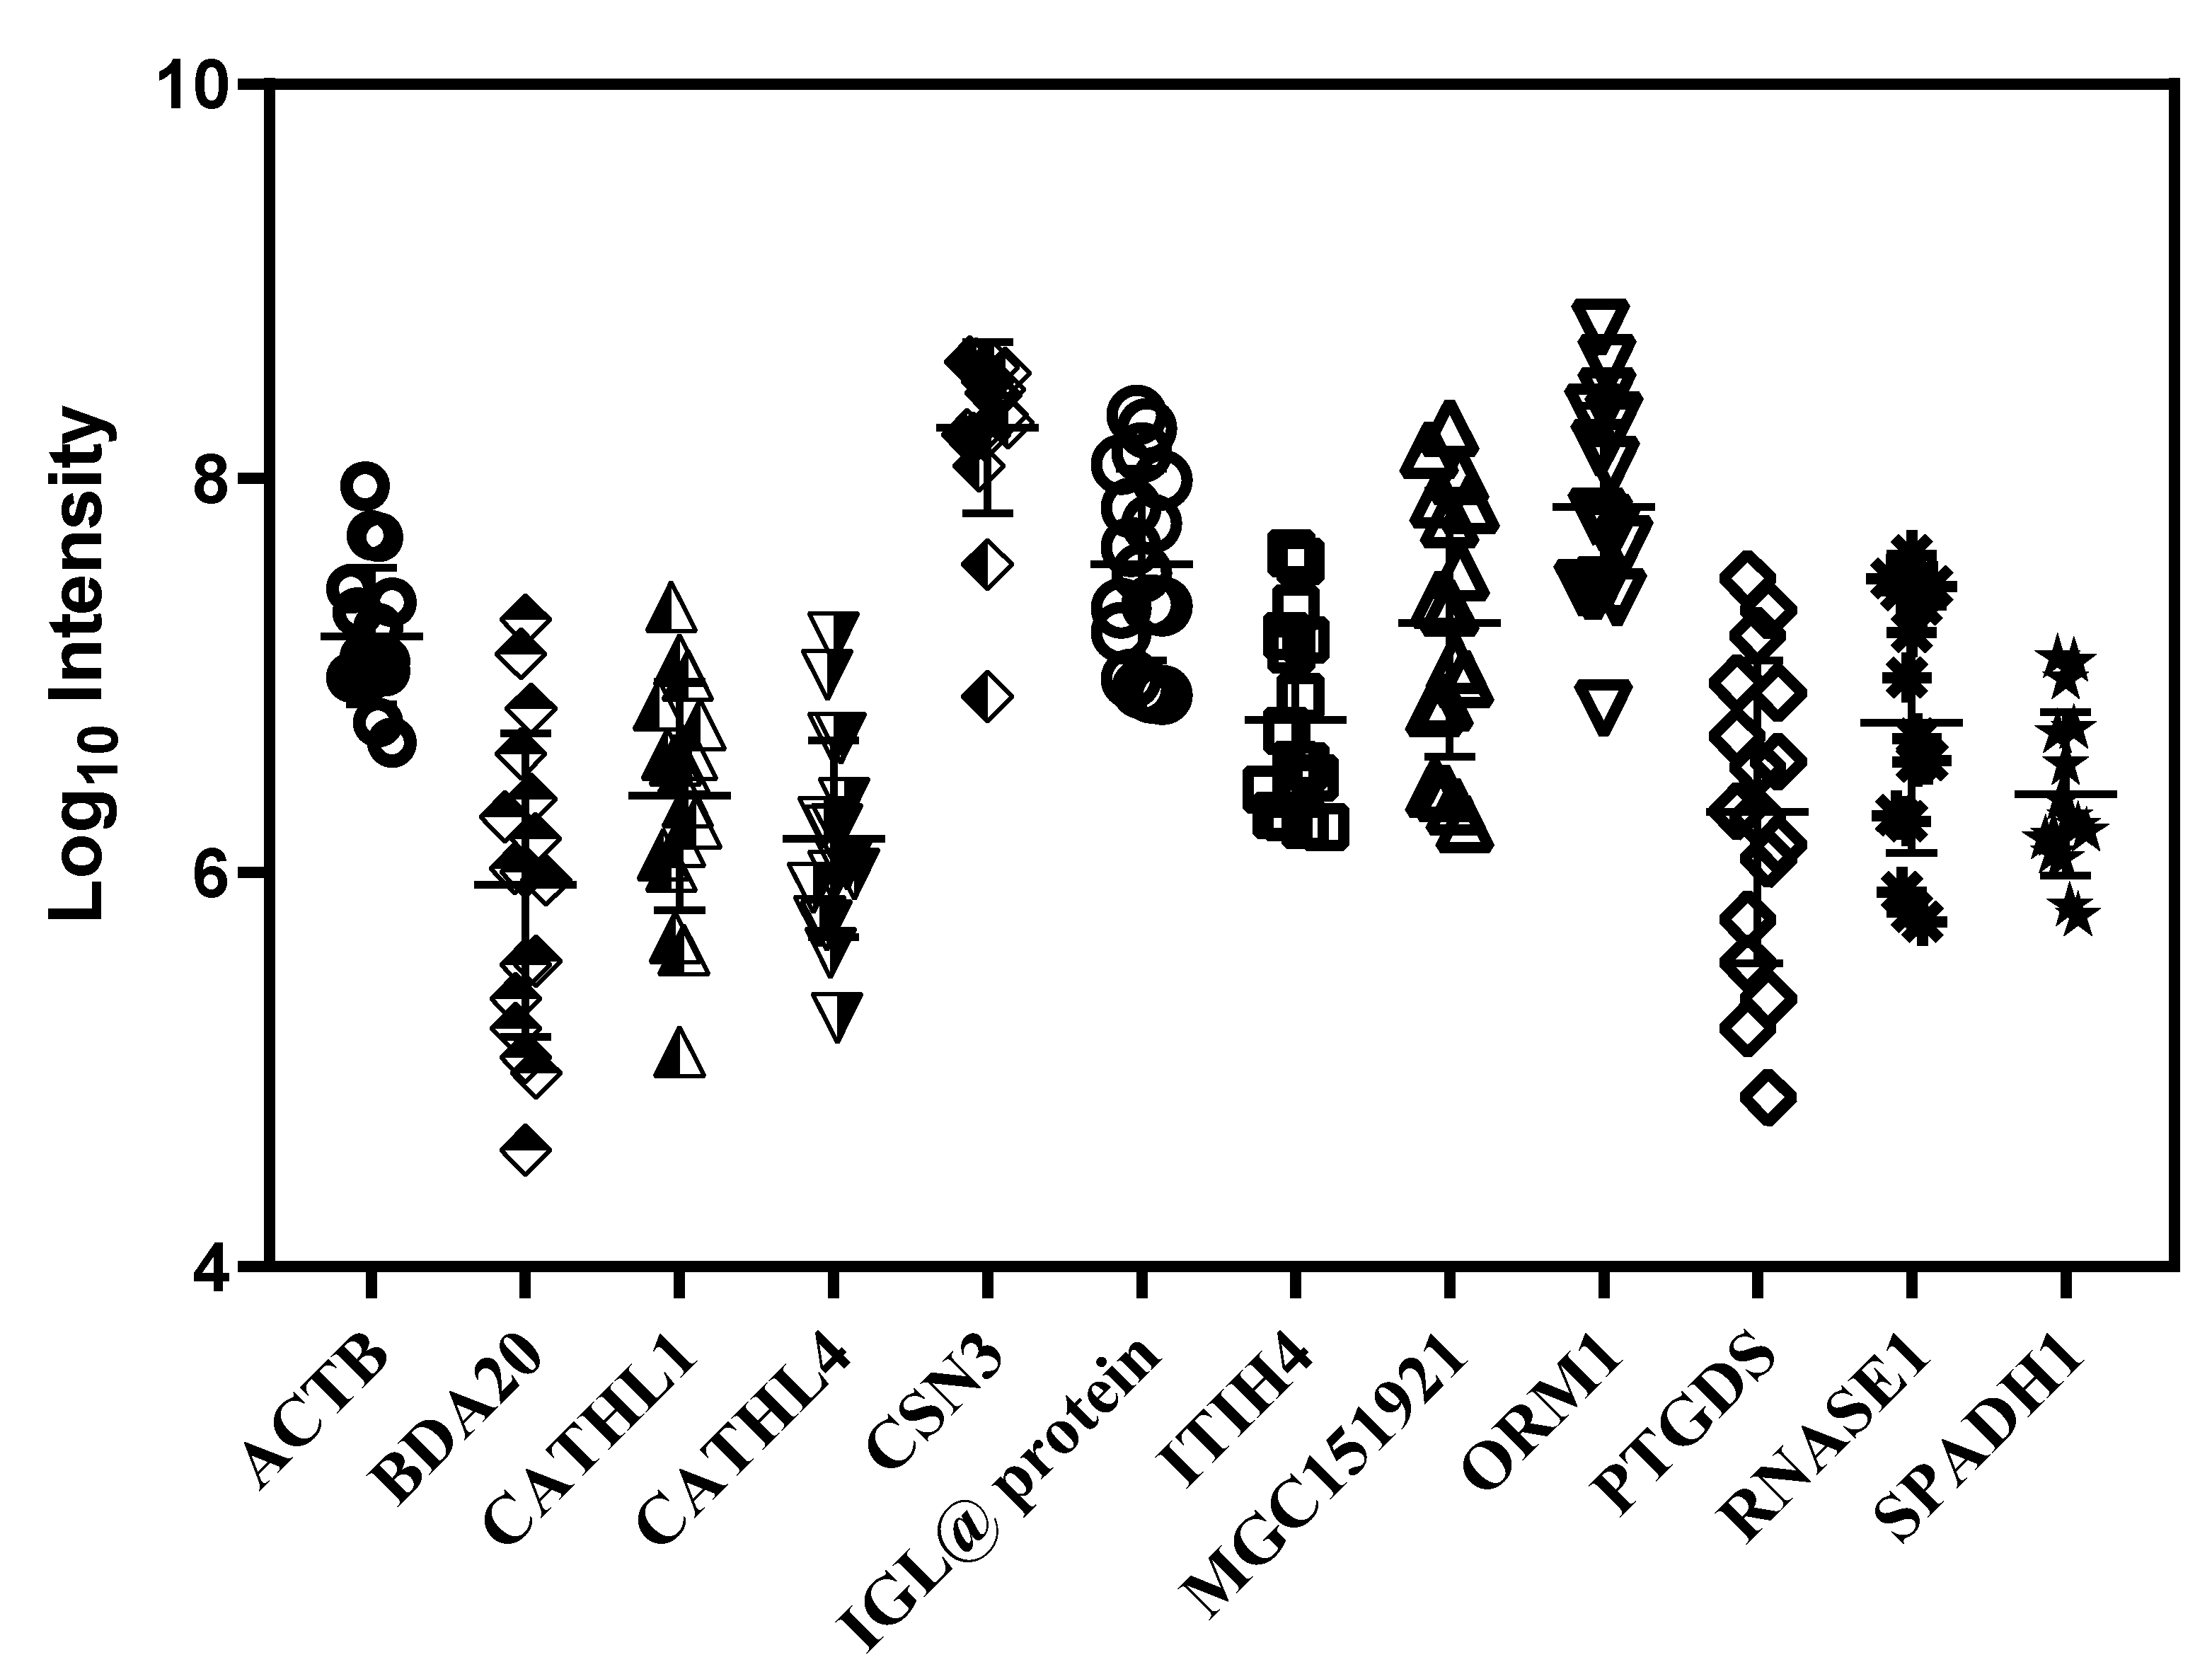
3.3. Quantitative Variation in Milk Serum Proteome between Individuals

Due to the larger number of individual cows, and the more precise quantification method applied, the results of Sample Set 2 were further analyzed to study the individual variation of the quantitative milk serum proteome in more detail. Figure 4 shows that some proteins highly varied between individuals and Table S3 shows the detailed biological function, subcellular location, and intensity of all proteins.
The high variation in most of the proteins in this figure is due to the wide spread among a limited number of individual cows. For instance, odorant-binding protein-like protein (MGC151921) showed as much as a 100-fold variation among individual cows (Figure 5). However, some of these highly variable proteins were showing a wide range of values among all cows, such as CATHL4, ORM1, PTGDS, and RNASE1 (Figure 5).

4. Discussion

The hypothesis of this study was that the milk proteome does not change significantly during mid lactation of HF cows, however, they significantly vary among individual HF cows. Sample Set 1 results confirmed that the variation in mid lactation could be related less to the lactation time point but to the individual cow (Table S2). As no proteins showed differences within individuals cows between the time points, whereas there was extensive variation among individual cows, this first sample set shows that the variation in the milk protein is largely due to individual variability. Although the constant protein abundance of mature milk may be related to the small number of cows in Sample Set 1, the results was consistent with what has been found previously [6], where it was suggested that the milk proteome did not differ qualitatively as lactation advances, assuming samples were taken in mid-lactation. The constant concentration of the mature milk serum proteome is also similar to our previous paper, which showed that most variation happened in the first and last weeks of lactation [7], which were excluded for the present study. Taken together, the results of the quantitative analyses of the milk serum proteome in Sample Set 1 indicates that the concentration of milk proteins was constant in mature milk from healthy cows, but differed significantly between individual cows.
Subsequently in Sample Set 2, only a single time point in mid-lactation was selected where in total 17 cows were analyzed, to obtain a more comprehensive overview of the variation that can be expected among individual cows. Sample Sets 2, similar to Sample Set 1, showed limited variability in the total number of proteins between cows (Figure 2 and Figure 3). The lower number of quantified proteins in Sample Set 2 compared to Sample Set 1 is probably related to different sample preparation methods, because dimethyl labelling as applied in for Sample Set 2 reduces the number of identifications due to an increase in the complexity in the chromatography, although resulting in more precise quantification.
Next, for Sample Set 2, a heatmap was created to determine whether specific groups of proteins would contribute more to the variability among individual cows (Figure 4). This heatmap showed both a cluster with high variability (Cluster A) and a cluster with low variability (Cluster B). When looking at the proteins in Cluster A, it is clear that many are associated with an immune function according to the GO biological function annotation. For example, the cathelicidins that are present in this cluster have been suggested to link the endocrine and immune system during stress [14]. The acute phase response (which includes the protein ITIH4) is a prominent systemic reaction of the organism to local or systemic disturbances in its homeostasis caused by infection and can be used for assessing response processes [15]. The high variation of immune-related proteins (Figure 5) may be related to the response of the immune system to encountered antigens or health status of mothers, as was previously shown for breast milk [16], because the immune system has been considered as a sensory system making interaction and adaptation of an organism to its environment possible [17,18]. Furthermore, the individual variation in the concentration of immune-related proteins may be related to genetic and epigenetic variation between individual cows. Immune response to stroke was also reported to be genetically regulated [19]. A number of significant single nucleotide polymorphisms markers, for example in C2 and C4, were reported to be associated with high and low adaptive and innate immune response of Holstein cows, respectively [20]. The level and isotypes of antibodies, including IgG1, IgM, and IgA, has also been shown to be influenced by genetic variation in Holstein cows [21]. Genetic variability in the humoral immune response to bovine herpesvirus-1 infection was also described for Irish dairy cattle [22]. Furthermore, the immune response against invading micro-organisms has been reported to be associated with epigenetics [23], where the innate immune response to pathogens was shown to be associated with epigenetic regulators [24]. Therefore, the variation of immune-related proteins (Cluster A, Figure 4) may be associated with the differences in the genetic background or epigenetic influences between individual cows, although this should be further studied in future, e.g., by analyses on a much larger number of animals.
Whereas proteins with an immune function showed a relatively large variability among individual cows, the proteins in Cluster B, which were generally related with nutrient synthesis, showed a low variability. For example, fatty acid-binding protein (FABP3) and perilipin-2 (PLIN2), are involved in lipid synthesis and transport [25]; peptidyl-prolyl cis-trans isomerase A (PPIA), 15 kDa selenoprotein (SEP15), and nucleotide exchange factor (SIL1) are related to protein folding and transport [25]; folate receptor alpha (FOLR1) mediates folate absorption 1 [26], and vitamin D-binding protein (GC) [27] as well as 45 kDa calcium-binding protein (SDF4) promote calcium absorption in the gastrointestinal tract. In addition, the least variable proteins, LALBA and LGB (Figure 4), play a major role in providing nutrients, directly as essential amino acid source, through participating in the synthesis of lactose (LALBA) [28], and also by delivering nutrients to the intestinal mucosa through its strong binding to minerals and vitamins [29,30]. The low variation in these nutrient synthesis and transport-related proteins has been previously demonstrated [25], indicating the important role of these milk proteins in providing a stable supply of nutrients to the neonate.
This study contributes to better understanding of the variation of the milk proteome between individual cows and their different functions in providing protection of both mammary gland and calves, as well as in providing nutrients to the claves. There is a limitation due to the sample size used in this study, which is just a first insight on the variation among individuals. Therefore, studies with more individual cows could be conducted by targeted proteomics techniques (such as selected reaction monitoring (SRM)) to confirm our results and to better understand the mechanisms behind, as well as relevance of, the variation in the milk proteome of individual cows.

5. Conclusions

The milk serum proteome is quantitatively constant within individual cows and differs significantly between individual cows, whereas qualitatively, it is similar both within and between individual cows. Most of the highly varying proteins are immune-related proteins, whereas the relative constant proteins are related to nutrient synthesis and transport. The results found in this study is the first insight, indicating that the individual variation in mature milk serum proteome is probably related to the immune status and genetic background of cows, which should be further studied in future.

Supplementary Materials

The following are available online at https://www.mdpi.com/article/10.3390/dairy3010004/s1, Figure S1: heat map and hierarchical cluster of log2 iBAQ value of proteins from four cows with five time points during middle lactation stage (two months after the beginning of the lactation and two month before the end of lactation); Figure S2: the distribution of the significantly different proteins associated with parity in 17 cows; Figure S3: the distribution of the significantly different proteins associated with feeding in 17 cows; Table S1: the milk composition analyses of 17 individual cows; Table S2: the identified and quantified proteins in Sample Set 1; Table S3: the identified and quantified proteins in Sample Set 2.

Author Contributions

Conceptualization, L.Z. and K.H.; methodology, S.B.; software, S.B.; validation, L.Z., S.B., J.V. and K.H.; formal analyses, L.Z. and S.B.; investigation, L.Z.; resources, J.H.; data curation, K.H.; writing—original draft preparation, L.Z.; writing—review and editing, S.B., J.H., J.V., P.Z. and K.H.; visualization, L.Z.; supervision, J.V., P.Z. and K.H.; project administration, K.H.; funding acquisition, K.H. All authors have read and agreed to the published version of the manuscript.

Funding

This research received no external funding.

Institutional Review Board Statement

Not applicable.

Informed Consent Statement

Not applicable.

Data Availability Statement

All data associated with this study have been made available as supplementary material.

Conflicts of Interest

The authors declare no conflict of interest.

References

  1. Zhu, J.; Dingess, K.A. The Functional Power of the Human Milk Proteome. Nutrients 2019, 11, 1834. [Google Scholar] [CrossRef] [PubMed] [Green Version]
  2. Reeds, P.J.; Burrin, D.G.; Davis, T.A.; Fiorotto, M.L.; Stoll, B.; van Goudoever, J.B. Protein nutrition of the neonate. Proc. Nutr. Soc. 2000, 59, 87–97. [Google Scholar] [CrossRef] [PubMed] [Green Version]
  3. Maity, S.; Bhat, A.H.; Giri, K.; Ambatipudi, K. BoMiProt: A database of bovine milk proteins. J. Proteom. 2020, 215, 103648. [Google Scholar] [CrossRef] [PubMed]
  4. Maurmayr, A.; Pegolo, S.; Malchiodi, F.; Bittante, G.; Cecchinato, A. Milk protein composition in purebred Holsteins and in first/second-generation crossbred cows from Swedish Red, Montbeliarde and Brown Swiss bulls. Anim. Int. J. Anim. Biosci. 2018, 12, 2214–2220. [Google Scholar] [CrossRef]
  5. Turk, R.; Rošić, N.; Kuleš, J.; Horvatić, A.; Gelemanovic, A.; Galen, A.; Ljubić, B.B.; Benić, M.; Stevanović, V.; Mrljak, V.; et al. Milk and serum proteomes in subclinical and clinical mastitis in Simmental cows. J. Proteom. 2021, 244, 104277. [Google Scholar] [CrossRef] [PubMed]
  6. Zhang, L.; Boeren, S.; Hageman, J.A.; van Hooijdonk, T.; Vervoort, J.; Hettinga, K. Bovine milk proteome in the first 9 days: Protein interactions in maturation of the immune and digestive system of the newborn. PLoS ONE 2015, 10, e0116710. [Google Scholar] [CrossRef]
  7. Zhang, L.; Boeren, S.; Hageman, J.A.; van Hooijdonk, T.; Vervoort, J.; Hettinga, K. Perspective on calf and mammary gland development through changes in the bovine milk proteome over a complete lactation. J. Dairy Sci. 2015, 98, 5362–5373. [Google Scholar] [CrossRef]
  8. Ma, Y.; Zhang, L.; Wu, Y.; Zhou, P. Changes in milk fat globule membrane proteome after pasteurization in human, bovine and caprine species. Food Chem. 2019, 279, 209–215. [Google Scholar] [CrossRef]
  9. Lu, J.; Boeren, S.; De Vries, S.; van Valenberg, H.; Vervoort, J.; Hettinga, K. Filter-aided sample preparation with dimethyl labeling to identify and quantify milk fat globule membrane proteins. J. Proteom. 2011, 75, 34–43. [Google Scholar] [CrossRef]
  10. Boersema, P.J.; Raijmakers, R.; Lemeer, S.; Mohammed, S.; Heck, A.J. Multiplex peptide stable isotope dimethyl labeling for quantitative proteomics. Nat. Protoc. 2009, 4, 484–494. [Google Scholar] [CrossRef]
  11. Cox, J.; Mann, M. MaxQuant enables high peptide identification rates, individualized p.p.b.-range mass accuracies and proteome-wide protein quantification. Nat. Biotechnol. 2008, 26, 1367–1372. [Google Scholar] [CrossRef] [PubMed]
  12. Schwanhäusser, B.; Busse, D.; Li, N.; Dittmar, G.; Schuchhardt, J.; Wolf, J.; Chen, W.; Selbach, M. Global quantification of mammalian gene expression control. Nature 2011, 473, 337–342. [Google Scholar] [CrossRef] [Green Version]
  13. Dennis, G., Jr.; Sherman, B.T.; Hosack, D.A.; Yang, J.; Gao, W.; Lane, H.C.; Lempicki, R.A. DAVID: Database for Annotation, Visualization, and Integrated Discovery. Genome Biol. 2003, 4, P3. [Google Scholar] [CrossRef]
  14. van Harten, R.M.; van Woudenbergh, E.; van Dijk, A. Cathelicidins: Immunomodulatory Antimicrobials. Vaccines 2018, 6, 63. [Google Scholar] [CrossRef] [Green Version]
  15. Soler, L.; Dąbrowski, R.; García, N.; Alava, M.A.; Lampreave, F.; Piñeiro, M.; Wawron, W.; Szczubiał, M.; Bochniarz, M. Acute-phase inter-alpha-trypsin inhibitor heavy chain 4 (ITIH4) levels in serum and milk of cows with subclinical mastitis caused by Streptococcus species and coagulase-negative Staphylococcus species. J. Dairy Sci. 2019, 102, 539–546. [Google Scholar] [CrossRef] [Green Version]
  16. Hettinga, K.A.; Reina, F.M.; Boeren, S.; Zhang, L.; Koppelman, G.H.; Postma, D.S.; Vervoort, J.J.; Wijga, A.H. Difference in the breast milk proteome between allergic and non-allergic mothers. PLoS ONE 2015, 10, e0122234. [Google Scholar] [CrossRef] [Green Version]
  17. Oetjen, L.K.; Kim, B.S. Interactions of the immune and sensory nervous systems in atopy. FEBS J. 2018, 285, 3138–3151. [Google Scholar] [CrossRef] [PubMed] [Green Version]
  18. Blalock, J.E. The immune system as a sensory organ. J. Immunol. 1984, 132, 1067–1070. [Google Scholar] [PubMed]
  19. Nikolic, D.; Jankovic, M.; Petrovic, B.; Novakovic, I. Genetic Aspects of Inflammation and Immune Response in Stroke. Int. J. Mol. Sci. 2020, 21, 7409. [Google Scholar] [CrossRef] [PubMed]
  20. Thompson-Crispi, K.A.; Sargolzaei, M.; Ventura, R.; Abo-Ismail, M.; Miglior, F.; Schenkel, F.; Mallard, B.A. A genome-wide association study of immune response traits in Canadian Holstein cattle. BMC Genom. 2014, 15, 559. [Google Scholar] [CrossRef] [PubMed] [Green Version]
  21. Cordero-Solorzano, J.; Parmentier, H.K.; Arts, J.A.J.; van der Poel, J.; de Koning, D.J.; Bovenhuis, H. Genome-wide association study identifies loci influencing natural antibody titers in milk of Dutch Holstein-Friesian cattle. J. Dairy Sci. 2019, 102, 11092–11103. [Google Scholar] [CrossRef]
  22. Ring, S.C.; Graham, D.A.; Sayers, R.G.; Byrne, N.; Kelleher, M.M.; Doherty, M.L.; Berry, D.P. Genetic variability in the humoral immune response to bovine herpesvirus-1 infection in dairy cattle and genetic correlations with performance traits. J. Dairy Sci. 2018, 101, 6190–6204. [Google Scholar] [CrossRef] [PubMed]
  23. Netea, M.G.; Schlitzer, A.; Placek, K.; Joosten, L.A.B.; Schultze, J.L. Innate and Adaptive Immune Memory: An Evolutionary Continuum in the Host’s Response to Pathogens. Cell Host Microbe 2019, 25, 13–26. [Google Scholar] [CrossRef] [PubMed] [Green Version]
  24. Zhang, Q.; Cao, X. Epigenetic regulation of the innate immune response to infection. Nat. Rev. Immunol. 2019, 19, 417–432. [Google Scholar] [CrossRef]
  25. Lu, J.; van Hooijdonk, T.; Boeren, S.; Vervoort, J.; Hettinga, K. Identification of lipid synthesis and secretion proteins in bovine milk. J. Dairy Res. 2014, 81, 65–72. [Google Scholar] [CrossRef]
  26. Nygren-Babol, L.; Jägerstad, M. Folate-binding protein in milk: A review of biochemistry, physiology, and analytical methods. Crit. Rev. Food Sci. Nutr. 2012, 52, 410–425. [Google Scholar] [CrossRef] [PubMed]
  27. Bouillon, R.; Schuit, F.; Antonio, L.; Rastinejad, F. Vitamin D Binding Protein: A Historic Overview. Front. Endocrinol. 2019, 10, 910. [Google Scholar] [CrossRef]
  28. Wang, F.; Shi, H.; Wang, S.; Wang, Y.; Cao, Z.; Li, S. Amino Acid Metabolism in Dairy Cows and their Regulation in Milk Synthesis. Curr. Drug Metab. 2019, 20, 36–45. [Google Scholar] [CrossRef]
  29. Ma, F.; Wei, J.; Hao, L.; Shan, Q.; Li, H.; Gao, D.; Jin, Y.; Sun, P. Bioactive Proteins and their Physiological Functions in Milk. Curr. Protein Pept. Sci. 2019, 20, 759–765. [Google Scholar] [CrossRef]
  30. Forrest, S.A.; Yada, R.Y.; Rousseau, D. Interactions of vitamin D3 with bovine beta-lactoglobulin A and beta-casein. J. Agric. Food Chem. 2005, 53, 8003–8009. [Google Scholar] [CrossRef]
Figure 1. Experimental workflow.
Dairy 03 00004 g001
Figure 2. Number of quantified milk serum proteins in Sample Set 1 (four cows (A–D), five time points (1–5, being Day 0, Day 14, Month 1, Month 2 and Month 3, label free proteomics).
Dairy 03 00004 g002
Figure 3. Number of quantified proteins in Sample Set 2 (17 cows, one timepoint, dimethyl labeled proteomics).
Dairy 03 00004 g003
Figure 4. Hierarchical cluster of log2 ratios of quantified proteins in 17 cows. The log2 ratio was the abundance of one protein in each cow against the abundance of this protein in the pooled sample; when log2 ratio was 0, the color was black, when log2 ratio was more than 0, the color was red and when log2 ratio was less than 0, the color was blue. The darker the color intensity, the larger the difference between individual cows and the pooled sample. Proteins that could not be quantified are labelled grey; Cluster A are highly varied immune-related proteins, Cluster B are relatively conserved nutrient transport proteins.
Dairy 03 00004 g004
Figure 5. Relative abundance distribution of 12 most highly variable proteins among 17 individual cows. ACTB: Actin, cytoplasmic 1; BDA20: Allergen Bos d 2; CATHL1: Cathelicidin-1; CATHL4: Cathelicidin-4; CSN3: Kappa-casein; IGL@protein: Immunoglobulin G like protein; ITIH4: Inter-alpha-trypsin inhibitor heavy chain H4; MGC151921: Odorant-binding protein-like; ORM1: Alpha-1-acid glycoprotein 1; PTGDS: Prostaglandin-H2 D-isomerase; RNASE1: Ribonuclease pancreatic; SPADH1: Spermadhesin-1.
Dairy 03 00004 g005
Table 1. Description of cows from Sample Set 1 (somatic cell count (SCC), and parity).
CowParitySCC (×1000 Cells/mL)
Cow A5148
55
184
131
128
Cow B3192
58
29
38
28
Cow C3133
17
22
39
34
Cow D227
34
31
27
25
Table 2. Description of cows from Sample Set 2 (lactation days, somatic cell count (SCC), and parity).
CowLactation StageSCC (103)Parity
11742053
21621972
31361853
42452704
52032343
62262612
72472682
81862173
92022372
101201655
112222432
122222474
131902213
142042392
151121512
161622073
171512005
Publisher’s Note: MDPI stays neutral with regard to jurisdictional claims in published maps and institutional affiliations.

