1. Introduction
New Zealand dairy herds are usually spring-calving and have a mean replacement rate of 22% [
1,
2], with replacements usually generated by breeding about 60% of the herd to high-genetic-merit, dairy-breed bulls. The remaining cows in the herd are often bred to beef-breed bulls, to produce a calf of greater value for beef production than that of a calf sired by a dairy bull [
3,
4,
5]. These cows would typically be the later-mated cows as it is desirable to generate replacements from cows calving in the first 6 weeks [
6].
There is limited research [
4] about what type of beef-breed bulls are most appropriate to use in terms of any impact the service sire has on milk production, inter-calving interval, and pregnancy rate, which must be considered alongside calf value. Angus and Hereford are the predominant beef breeds in New Zealand [
7], with Hereford bulls anecdotally used more commonly in the dairy industry than Angus [
1]. It is of interest to establish if there is any difference in the milk production or rebreeding success among cows mated to different Angus or Hereford bulls.
Milk production is the primary source of income for the dairy farm, with New Zealand farmers paid for milk solids sold, which represents about 93% of dairy farm income [
2]. In order to lactate in the following season, and survive in the herd, the cow needs to get pregnant again within a short timeframe, as breeding and calving are restricted to a limited period in order to match feed requirements to the seasonal pasture growth [
8,
9]. Poor reproductive performance is undesirable because it delays the mean calving date and decreases the available days in milk and total milk production [
8,
10,
11]. In addition to making recommendations for sires based on progeny performance, which have been published previously [
12,
13,
14], the impact of bull on the body condition score, post-calving live weight, milk production, and rebreeding performance of cows must be assessed.
It is hypothesized that service sire will not affect the body condition score, post-calving live weight, milk production, or rebreeding performance of the cow, beyond the direct effects of gestation length on days in milk and assisted calving on rebreeding success. The aims of this case study were to compare the post-calving body condition score, live weight, survival, milk production, and rebreeding performance of mixed-aged cows producing calves sired by a selection of Angus and Hereford beef-breed bulls. In order to assess if there was an effect of service sire, birth weight, gestation length, and calving assistance were examined to see if they explained the effect of service sire on cow performance.
2. Materials and Methods
This study was conducted at Limestone Downs, near Port Waikato, New Zealand (37°28′ S, 174°45′ E). The study and all handling procedures were approved by the Massey University Animal Ethics Committee (MUAEC 15/65).
2.1. Animals
This study used records from 952 lactations from mixed-aged cows bred to Angus (n = 31) and Hereford (n = 34) bulls over 2 years. There were 485 lactation records from 2016 calving cows, and 467 lactation records from 2017 calving cows. There were 270 cows which were present in both years of the case study. The herd was predominantly Holstein–Friesian and Holstein–Friesian–Jersey crossbred cows. Individual cow pedigree recording of the herd was incomplete, with only 68% recorded ancestry.
2.2. Management
Cows were managed under commercial farm conditions in a spring-calving, pastoral, dairy system. Cows were milked twice a day until at least after the rebreeding period. Once-a-day or 16 h milking frequency was implemented near the end of lactation.
2.2.1. Mating to Experimental Bulls
The mating of the cows in each year (2015 and 2016) is previously described [
12]. Briefly, cows were artificially bred using frozen semen to Angus (
n = 31) or Hereford (
n = 34) bulls over a 63-day or 54-day period in two consecutive years. Bulls were used in mating teams balanced for breed, which were rotated according to a pre-determined mating schedule; cows submitted for insemination were randomly assigned to bulls available on the day based on order of presentation to the technician. The aim was to generate 15 calves per sire [
12], and a range of 4 to 26 calves (mean 15 calves) was achieved due to variation in conception rates. Power analysis indicated that 12 lactating cows per sire would be sufficient to detect a 5% difference in milk yield among cows bred to different sires. Records for 80% of sires contained at least 12 lactating cows. The term ‘service sire’ is used to refer to the sire of the calf resulting from the case study mating period, and the milk yields reported here are for the lactation that resulted from successful matings.
2.2.2. Rebreeding following Calving
In 2016, calving was from 7 July to 17 September, and in 2017, from 10 July to 12 September. Rebreeding began on 10 October in both years and in 2016, which included 10 weeks of artificial breeding (AB) followed by 5 weeks of natural mating. In 2017, the rebreeding period included 5 weeks of AB followed by 5 weeks of natural mating. Natural mating ratios were 1:26 and 1:18 bulls to non-pregnant cows for 2016 and 2017, respectively, in accordance with industry recommendations [
15].
In 2016, the semen used during rebreeding period was a combination of frozen experimental beef semen, used to generate the second year of experimental calves, followed by fresh dairy-breed semen procured from Livestock Improvement Corporation (LIC), Hamilton, New Zealand. In 2017, all semen used was fresh dairy-breed semen sourced from LIC. All inseminations were performed by commercial technicians.
An estrous synchrony program using progesterone-controlled internal drug release inserts (CIDR) was used in 118 (2016; Cue-Mate 1.56 g progesterone, Bayer Animal Health, Auckland, New Zealand) and 83 (2017; DIB-H 0.5 g Progesterone, Agri-health, Auckland, New Zealand) cows. CIDR were removed after 7 days and insemination occurred 10 days after insertion. Injections of GnRH and PGF2α were administered alongside the CIDRs as per recommended practice.
Pregnancy detection was carried out in late December (22/12/2016 and 21/12/2017) and in mid-February (17/02/2017 and 14/02/2018), using trans-rectal ultrasound by veterinarians (Franklin Vets, Pukekohe, New Zealand).
2.3. Measurements
The calving date, birth weight of calf, and sex of calf were recorded within 24 h of calving. Assistance at calving was recorded as assisted or not. Sire and dam of each calf were determined using DNA parentage verification (Zoetis Genetics, Dunedin, New Zealand), and the date of insemination of the dam with the confirmed sire was retrieved from the mating records. Gestation length was calculated as the difference between the date of calving and the date of insemination.
Cows were weighed twice daily after milking, using a walk-over weight system (ProTrack, LIC, Hamilton, New Zealand) until 30 days after the last cow had calved. Body condition score (BCS) was recorded 4 times during each season in June (prior to calving), September (prior to rebreeding), February, and April (prior to drying off), on a 1–10 scale [
16,
17] where 1 is emaciated and 10 is obese. Body condition score was assessed by the same certified assessor each time. These scores can be converted to the 5-point scale using the regression equation 5-point = 1.5 + 0.32 × 10-point [
16].
Cow milk production data were collected using herd tests performed by LIC, three (2016) or four (2017) times during lactation in September, December (2017-only), January, and March (2017) or April (2018). Milk yield was measured using a milk meter and a sample collected for lab analysis. Fat and protein percentages were analyzed using an infrared milk analyzer (FTIR, Foss Electric, Hillerød, Denmark). Fat and protein yields were calculated as milk yield x fat or protein percentage, respectively; milk solids yield was calculated as fat yield + protein yield.
Any cow deaths or cows culled from the herd were recorded by the farmer in herd management software (MINDA™), along with the date of death or removal. Cow survival was recorded to rebreeding (start of rebreeding period, October). Survival was recorded as a binary trait, with cows recorded as having survived (1) or not survived (0).
Pregnancy detection results and calving dates in the following year (2017 or 2018 for 2016 and 2017 calving cows, respectively) were recorded. Pregnancy rates were recorded as a binary measure, with cows recorded as being pregnant at pregnancy detection recorded as ‘1′ and cows recorded as not pregnant recorded as ‘0’.
All data except walk-over weights, artificial breeding records, and deaths/removal of cows were recorded by the authors or associated research technicians. Artificial breeding records were recorded by the artificial breeding technician using herd management software, and walk-over weights were recorded automatically. Some mating records were incomplete and some walk-over weights were missed due to faulty or missing tags in the cows. Incomplete mating records were the result of cows missing tags and having no mating records at all, or of visual tags being mis-read or mis-entered into the records. The use of DNA parentage assignment allowed incorrect mating records to be identified. This approach meant gestation length could not be assigned to some calves for which there was no correct mating record, however, since this was at random across calves it would not bias the record of affected sires.
2.4. Statistical Analysis
2.4.1. Data Cleaning
Records from 952 mixed-aged dairy cow lactations were included in the analysis, having been DNA matched to a calf that was also DNA matched to a case study sire.
Cow age ranged from 3 to 13 years of age at calving. Due to low numbers of older cows, age groups of 3, 4, 5, 6, or 7+ years of age were used for analysis.
Deviation from the median date of successful mating was calculated for all cows, within each year, which had a calf gestation length record. Cows mated before the median dates were assigned a negative value.
The calving date for individual cows was expressed as days from planned start of calving (calving day) (2016: 17 July 2016; 2017: 19 July 2017). Individual dry-off dates were recorded for each cow.
Body condition scores at pre-calving and rebreeding were grouped into ≤4, 4.5, and ≥5.0, and ≤3.5, 4.0, 4.5, ≥5.0, respectively, to enable adjustment for differences in body condition for the analysis of milk production and rebreeding.
A 30-day post-calving mean live weight for individual cows was calculated using all weights recorded in the 30 days post-calving. Cows calving in 2016 and 2017 were treated separately. Live weights were cleaned to remove outliers by calculating the mean and standard deviation for each cow. Live weight records for individuals, which were more than four standard deviations from the mean within year, were removed, and the mean was recalculated [
18,
19]. This method was iterated until no more records were deleted [
18,
19]. This left a dataset comprised of 36,751 live weight records (261 records removed) from 927 cows.
The number of days in milk was calculated as the number of days from calving until the end of lactation.
Total milk production per lactation was calculated to a 253-day lactation, determined by the limits of the prediction data (15–267 days post-calving). A 253-day lactation yield of milk, fat, protein, and milk solids was calculated using daily predicted milk production generated using a third-order orthogonal polynomial. A single-trait animal model was fitted to milk, fat, protein, and milk solids yield data in the statistical package ASReml [
20]. The dataset for milk production consisted of the individual cow herd test data as recorded in MINDA™ against the number of days in milk at each test specific for each cow and included 2949 records from 909 cow lactation records. The regression coefficients generated from these models were used to calculate a predicted daily value. There were four 2016 calving cows not included in the analysis of milk production due to low milk volumes collected at herd tests leading to negative predicted milk production curves. These cows were all unassisted and calved to different bulls.
Pregnancy rates were calculated as the number of pregnant cows over the number of cows which calved previously, and were still present in the herd at pregnancy detection. Inter-calving intervals were calculated as the number of days from calving in 2016 or 2017 until the calving in the following year. Cows which were not pregnant or did not have a recorded calving in the following season were excluded from the analysis of the inter-calving intervals. The 21-day re-calving rate was calculated as the proportion of cows that calved in the following year that did so within 21 days of the planned start of calving
2.4.2. Statistical Models
Data were analyzed using SAS (Version 9.4, SAS Institute Inc., Cary, NC, USA).
Service Sire Effect
The effect of service sire on body condition score, post-calving live weight, calving day, days in milk, milk production, and inter-calving intervals were analyzed using mixed models, while CIDR treatment and 21-day re-calving rates were analyzed using generalized linear mixed models based on a binomial distribution.
Models included the fixed effects of service sire nested within breed, breed of service sire, calving year, age of cow, and sex of calf, with cows fitted as a random effect for all models except for CIDR treatment and inter-calving intervals. The two-way interactions of breed of service sire with calving year, sex of calf with calving year, and breed of service sire with sex of calf were considered in all models but were not included in the final models as the interactions were not significant.
The fixed effects of pre-calving BCS and rebreeding BCS were considered in the models for the calving date, days in milk, and milk production. Rebreeding BCS was also fitted for CIDR treatment, inter-calving intervals, and 21-day re-calving rates. Covariates of post-calving live weight and deviation from the median date of mating were considered in all models, except in the post-calving live weight model. Grouped BCS and covariate effects were removed where not significant (p > 0.05). The effect of rebreeding BCS was retained in the model for milk yield; post-calving live weight retained in the pre-calving and late-summer BCS, calving day, days in milk, milk yield and protein yield models; and deviation from median date of mating retained in the rebreeding BCS, late-summer and late-lactation BCS, calving day, days in milk, CIDR treatment, inter-calving intervals, and 21-day re-calving rate models. The date of mating deviation was fitted as a proxy for the date of calving, as gestation length was a trait of interest.
There was insufficient incidence of assisted calving (1.37%) to enable analysis of an effect of service sire. There was no association between CIDR allocation and BCS or date of calving; therefore, cows treated with a CIDR were not excluded from other measures of reproductive success.
Characteristics of the Service Sire
The effect of service sire on pregnancy rates and cow survival was unable to be investigated due to low numbers of cows, within service sire, that did not survive or were not pregnant. Additionally, as the effect of service sire was significant (p < 0.05) for BCS at rebreeding and calving day, further models were applied to investigate whether the inclusion of service sire characteristics—birth weight of the calf (as a linear or quadratic effect), gestation length of the calf, or calving assistance—explained the service sire effect.
The models for BCS at rebreeding and calving day were based on the mixed models outlined for service sire, including the covariate effects of birth weight of the calf (linear and quadratic), gestation length, and the fixed effect of calving assistance. These effects were excluded if not significant. Pregnancy rates and survival were analyzed using generalized linear mixed models based on a binomial distribution, fitting the fixed effects of breed of service sire, calving year, age of cow, sex of calf and calving assistance, and the covariate effects of post-calving live weight, deviation from the median date of mating, birth weight of the calf, and birth weight squared and gestation length of the calf. The model for pregnancy rates also considered the fixed effect of rebreeding BCS and CIDR treatment. Covariate effects of post-calving live weight and deviation from the median date of mating were removed where not significant (p > 0.05), leaving deviation from the median date of mating in the model for pregnancy rates.
For survival, where birth weight of the calf had both a linear and quadratic effect, the estimate of survival and the 95% confidence interval over the range of calf birth weights were generated using the estimate function in SAS for the model outlined above.
3. Results
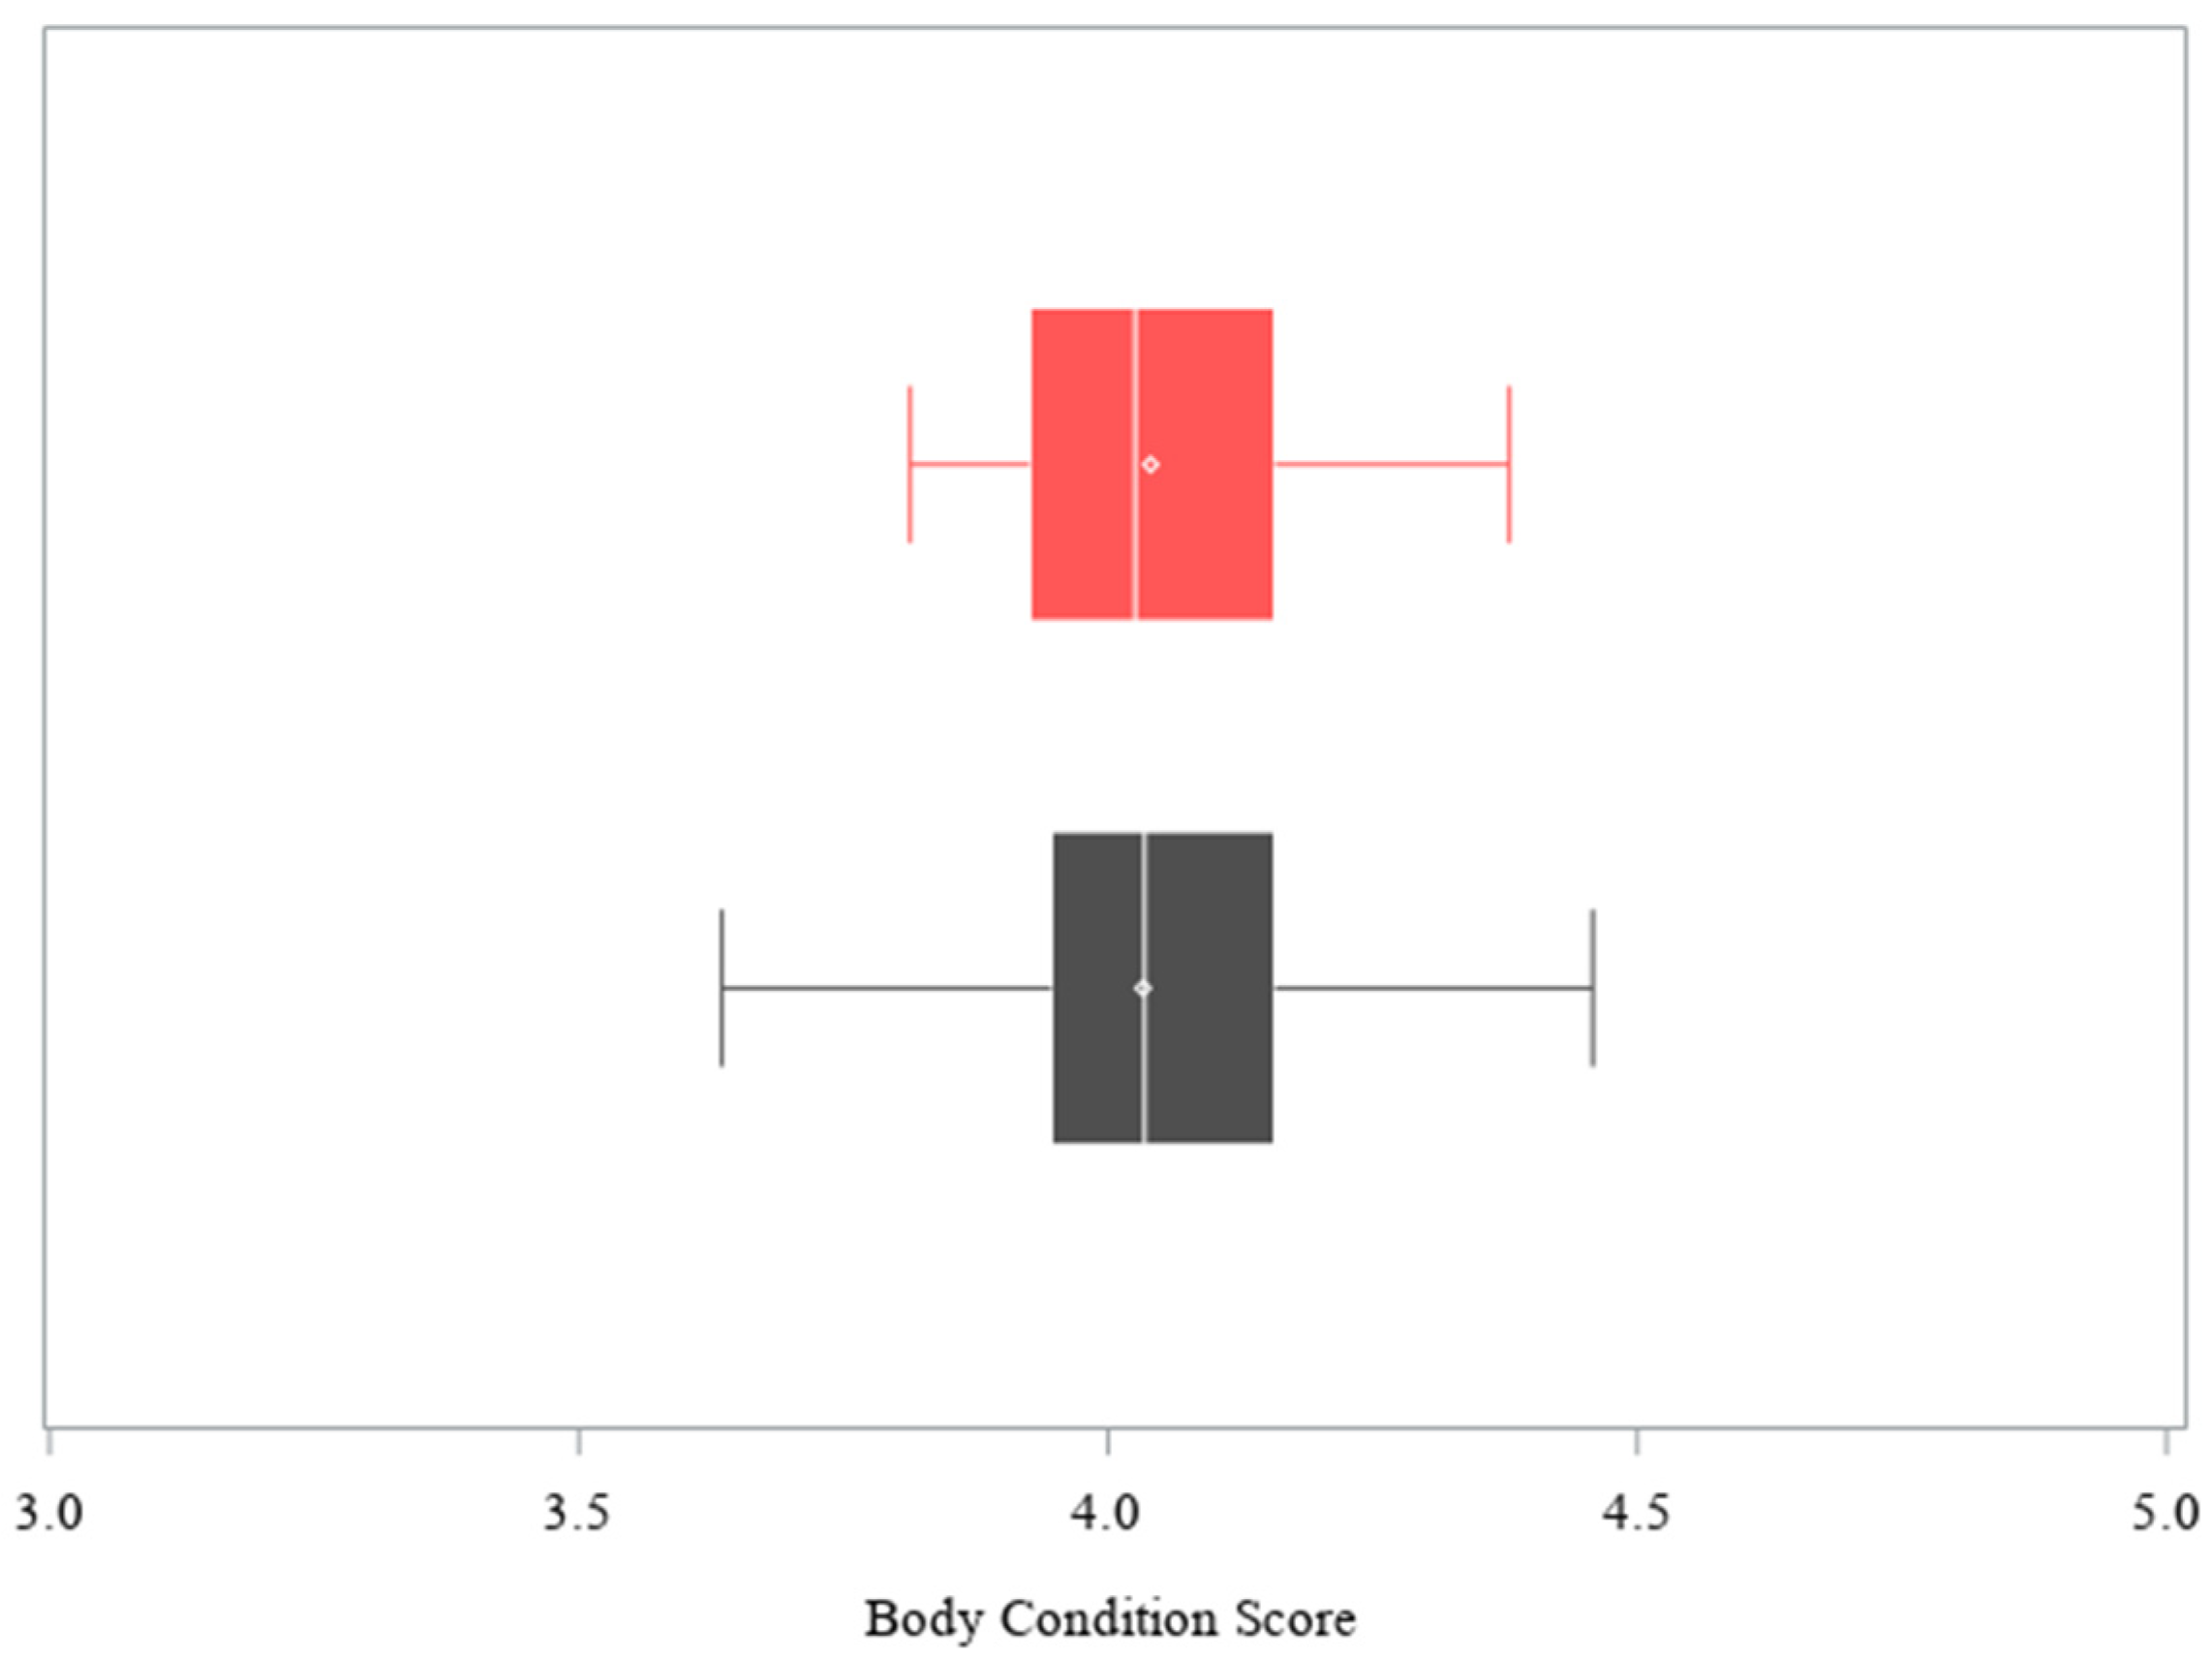
The service sire did not affect the BCS of cows at calving, pregnancy detection or late lactation, or post-calving live weight (
Table 1). There was, however, an effect of service sire on the BCS of cows at rebreeding (
p = 0.045,
Table 1;
Figure 1), and the range among the least squares means for cows bred to different service sires was 0.82 condition scores (3.64 to 4.46).
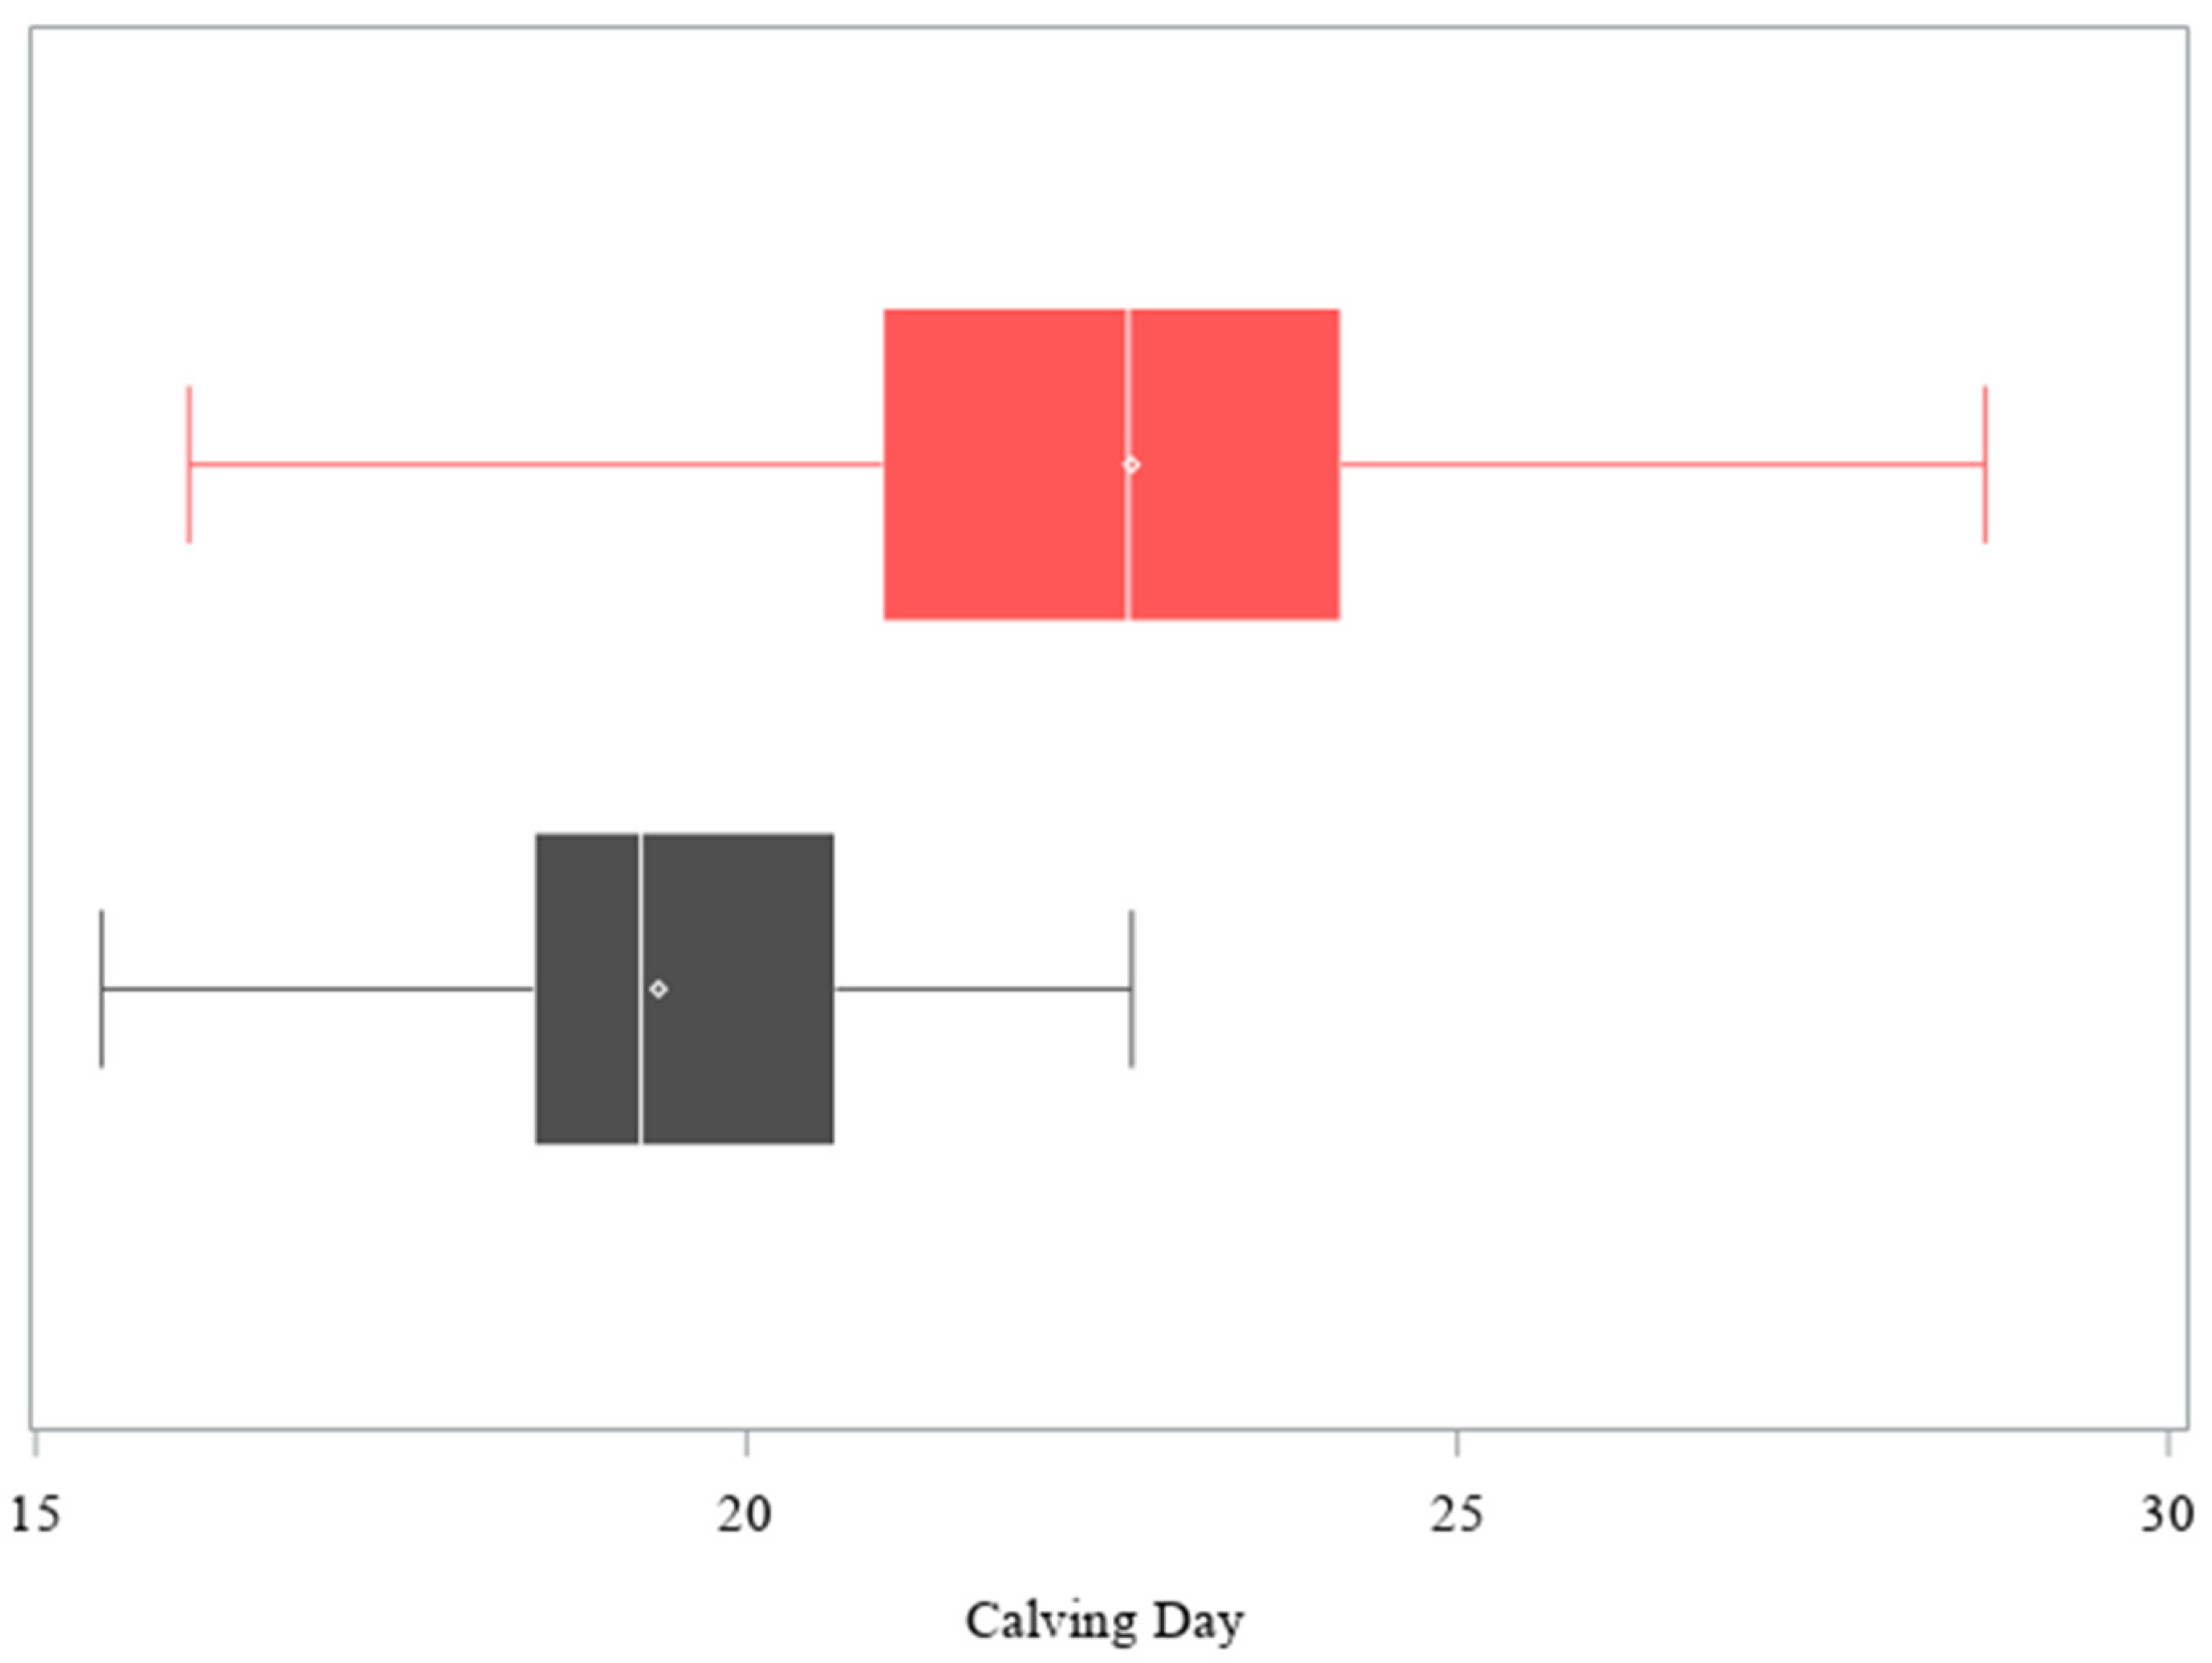
There was an effect of service sire on the calving day, where the service sire least squares means had a range of 13.2 days (
p < 0.001,
Table 1;
Figure 2); however, this did not translate into a difference in the days in milk among service sires (
p = 0.888). Service sire also had no effect on the milk production of the cows, nor the proportion of cows receiving CIDR treatment, inter-calving intervals, or 21-day re-calving rates (
p > 0.05;
Table 1).
There was an effect of service sire on BCS at rebreeding and calving day. Therefore, birth weight of the calf, birth weight squared, and gestation length of the calf and calving assistance were considered to determine which explained the effect of service sire. Neither birth weight of the calf, birth weight squared, gestation length of the calf, nor calving assistance (p > 0.05) had an effect on cow rebreeding BCS. The effect of gestation length of the calf (p < 0.001) explained the variation in service sire on the calving day, as calves with longer gestation lengths were born later in the season. Birth weight of the calf, birth weight squared, and calving assistance had no effect on calving day (p = 1.000).
Neither birth weight of the calf, birth weight squared, nor calving assistance had an effect on pregnancy rates (p > 0.05); however, for every day shorter that the calf gestation was, a cow was 1.048 times (odds ratio; 95% confidence interval 1.004–1.095) more likely to get pregnant in the following breeding season (p = 0.034). The use of CIDR treatment had a favorable effect on the pregnancy rates, whereby cows receiving a CIDR were 2.33 times (odds ratio; 95% confidence interval 1.36–3.95) more likely to get pregnant (p = 0.002).
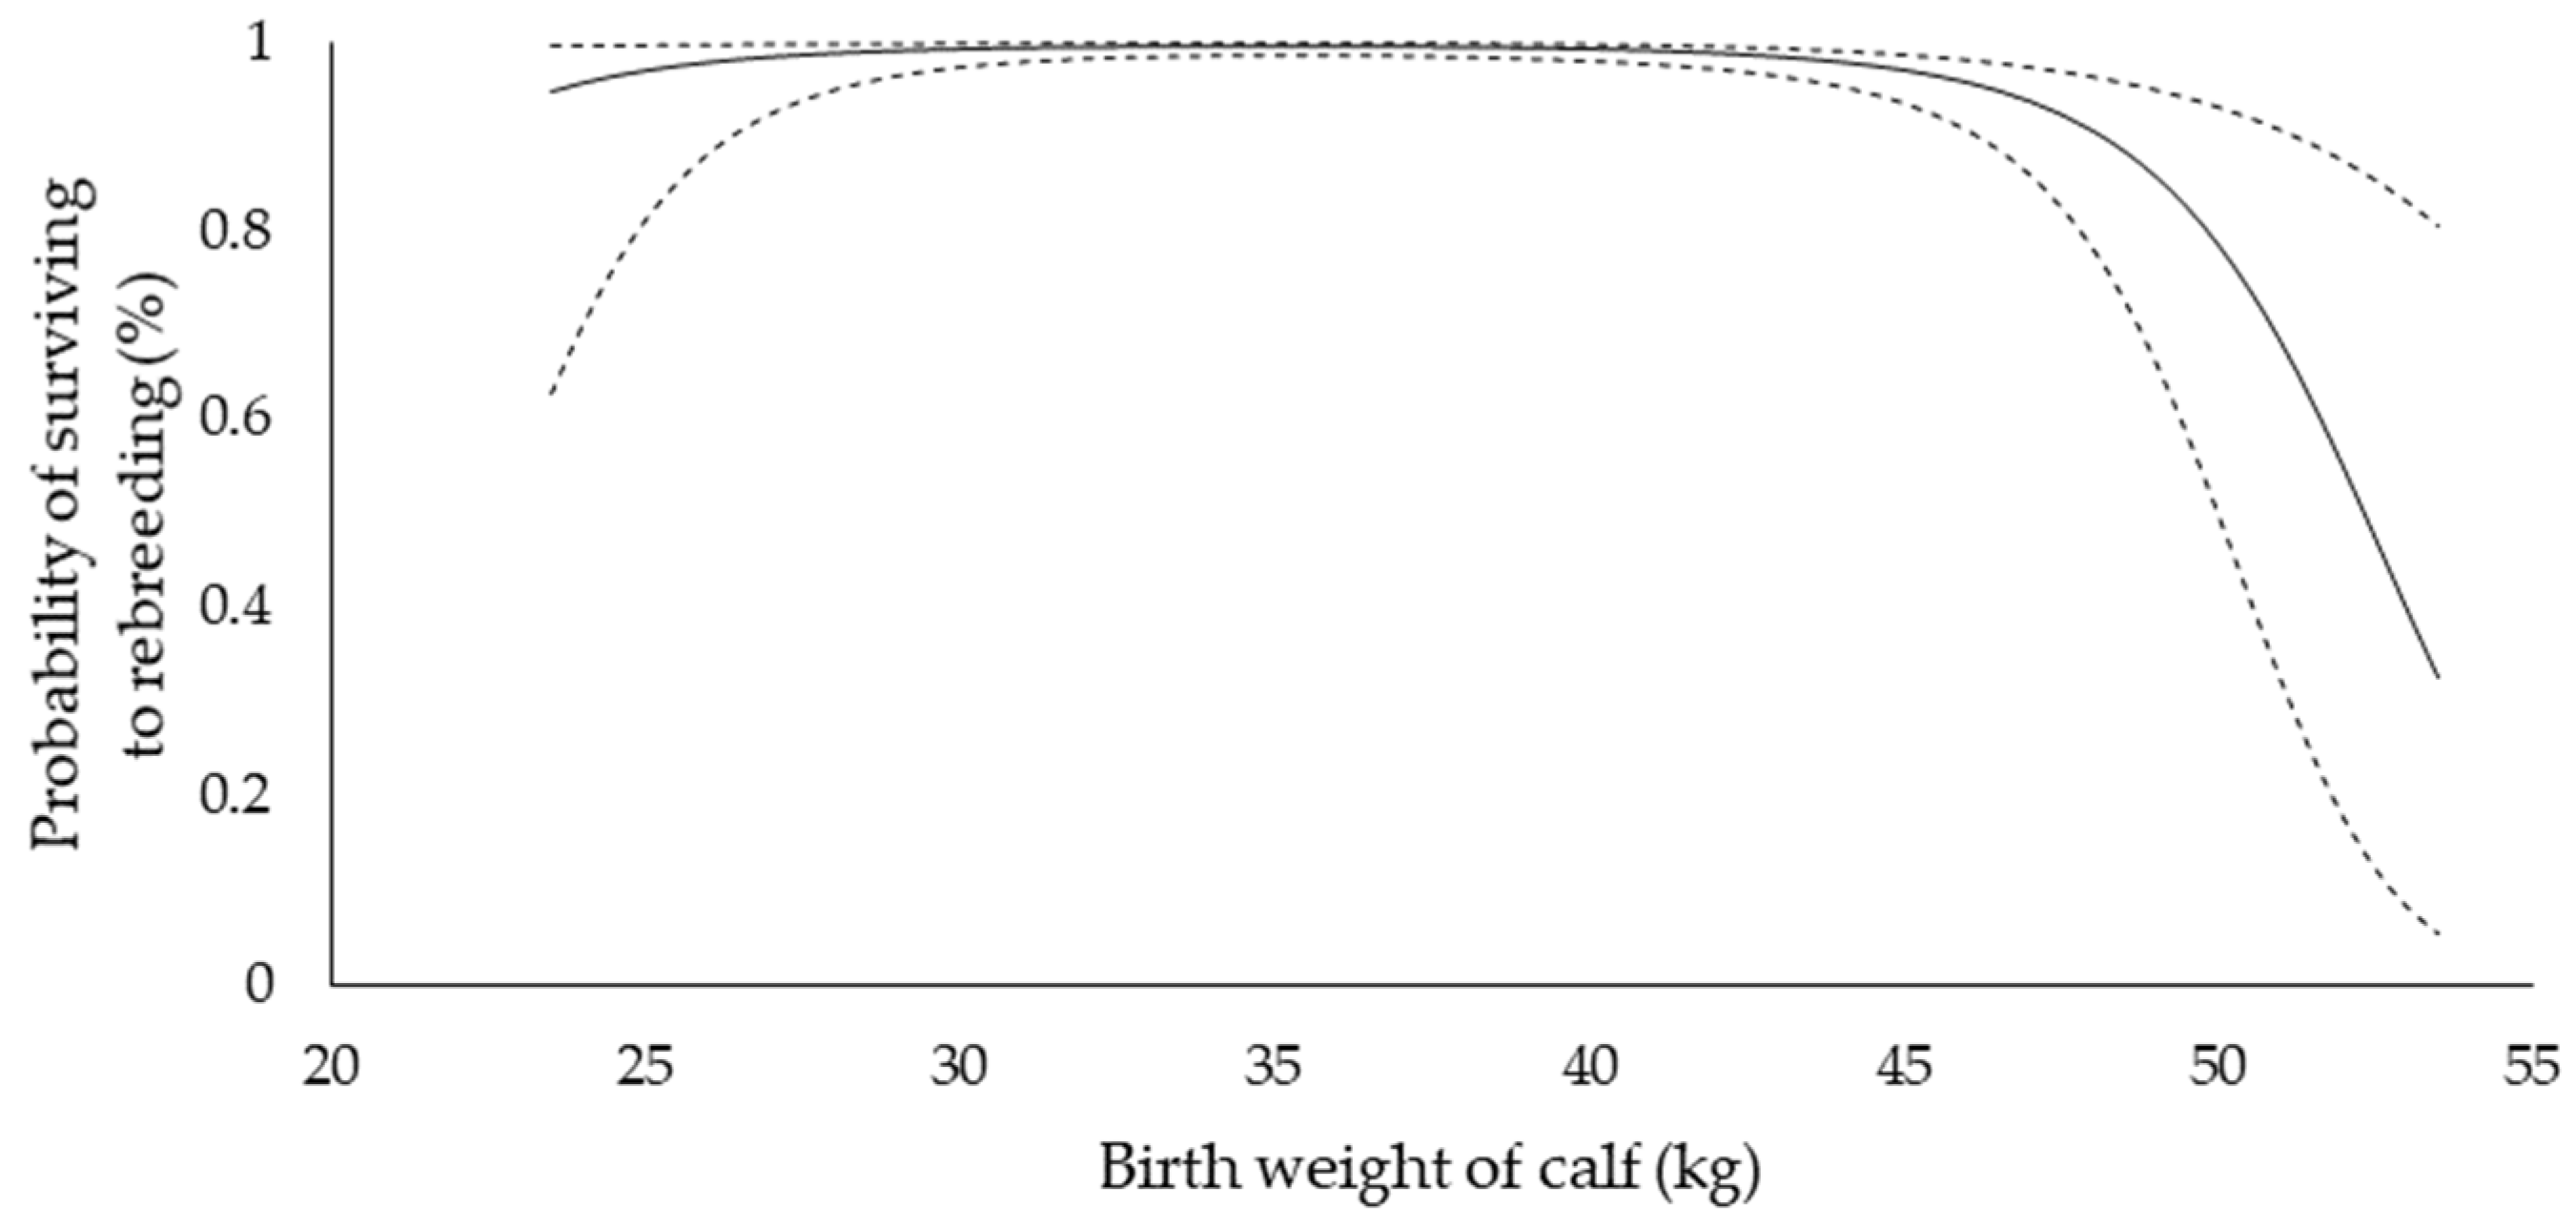
Birth weight of the calf had both a linear and quadratic effect on survival of the dam in the herd to rebreeding (linear: 1.205 ± 0.297,
p = 0.003, quadratic: −0.017 ± 0.005,
p < 0.001), where cows producing heavier calves had lower probability of survival than cows producing medium-sized calves (
Figure 3). Gestation length of calf and calving assistance had no effect on survival (
p > 0.05).
There was little change in the probability of survival of a cow producing a calf between 24 and 46 kg (above 95% survival), producing a calf greater than 46 kg decreased the probability of survival, with a rapid decline seen with calf birth weights greater than 50 kg (
Figure 3).
4. Discussion
This case study demonstrated that service sire did not affect milk production, inter-calving interval, calving day, and 21-day re-calving rate. Several studies report a relationship of birth weight and gestation length with milk production and reproductive performance; those that report a service sire effect attribute it to sire-differences in birth weight or gestation length [
21,
22]. Nevertheless, in the present experiment, there was no effect of service sire effect, despite there being differences in birth weight between sires. However, no sires produced excessively heavy calves (range 33.3–41.4 kg) [
12].
There was a service sire effect on BCS at rebreeding, which could not be explained by birth weight of calf, gestation length of calf, or calving assistance. To the authors’ knowledge, there is no literature evaluating the effect of birth weight of the calf, gestation length of calf, or calving assistance on the body condition score of dairy cows after calving. The effect of service sire on BCS at rebreeding is therefore unable to be explained by the information collected in the present case study. It is possible that the relationship between service sire and BCS at rebreeding is spurious. More research is needed to determine whether the effect is real and, if so, to determine the mechanism. There was no service sire effect on BCS pre-calving, late summer, and at the end of lactation.
There was a difference in the calving date between the different service sires, whereby cows serviced by sires which produced longer gestation calves, calved later in the season. However, this did not translate into a difference in the days in milk in this herd. The service sire effect on calving day was expected given the difference in mean progeny gestation length of the service sires [
12] and the fixed breeding period. The effect of gestation length on the calving pattern is in agreement with studies in seasonal calving dairy cows [
23,
24,
25]. Literature also suggests a relationship between gestation length and the number of days in milk, in seasonally calving dairy herds, which was not evident in the present case study [
25,
26].
The effect of gestation length was evident on pregnancy rate, although gestation length did not appear to influence other reproductive traits. There are eight key factors impact reproductive performance in New Zealand dairy cattle [
15]: body condition score and nutrition, heifer management, calving pattern, heat detection, rebreeding AB practices, service bull management, cow health, and genetics. The only factor for which differences could be attributed to the service sire is calving pattern, through differences in gestation length. The exception is difficult calving, which reduces subsequent in-calf rates [
27,
28] and can be influenced by sire through the birth weight of the calf [
29,
30,
31,
32]. However, in the present experiment, assistance rates were low, and no bulls caused significant calving difficulty.
The influence of gestation length on subsequent reproductive performance was less clear. Longer gestation was associated with a lower pregnancy rate in the following breeding season, indicating the potential to be influenced by the service sire. However, there was no effect of service sire on subsequent inter-calving interval or 21-day re-calving rate, which are typically related to the pregnancy rate. The inter-calving interval and 21-day re-calving rate parameters analyzed here only included cows which successfully re-calved, whereas pregnancy rate included all cows. Therefore, the absence of a service sire effect may be related to cows with longer gestations, because they were less likely to become pregnant again. The difference in reproductive performance among cows bred to different service sires may have been masked by the set breeding period, where the majority of cows had calved early enough in the season to be cycling prior to the start of the breeding period. The post-partum anestrous interval of New Zealand dairy cows is approximately 40 days with reported intervals ranging from 29 to 85 days [
33,
34,
35]. In the present case study, 88% of cows had calved at least 40 days prior to the start of the re-breeding period. It was not clear why there was an effect of gestation length on pregnancy rate, but seemingly no difference in the conception date. The results indicate that there may have been acyclic cows influencing this result; however, cyclic activity was not in the scope of this case study.
The 21-day re-calving rate is in the range 44.4–51.2% for New Zealand dairy cows for three- and four-year-old cows [
36]. The average inter-calving interval of seasonal calving New Zealand cows is in the range of 364–384 days [
8,
33,
37,
38]. Relative to published inter-calving intervals and 21-day re-calving rate ranges, the herd achieved average reproductive performance for a New Zealand herd.
The birth weight of the calf had a linear and quadratic effect on the survival of the cows where, within the range of calf birth weights observed, cows producing heavier calves were less likely to survive. The association between birth weight of calf and cow mortality agrees with the literature which indicates that dystocia can increase the risk of cow mortality [
39,
40,
41,
42], with calf birth weights being the primary factor affecting risk of dystocia [
31,
39,
41]. There was no effect of calving assistance on survival; however, there may have been cows that experienced a difficult calving despite calving unassisted in the present experiment.
The value of four-day-old beef-cross-dairy calves for sale for rearing is partially dependent on the sale weight of the calf, which is directly related to the birth weight of the calf. Therefore, there is a tradeoff to be balanced regarding birth weight so that, whilst the calving ease and survival of the cow must not be jeopardized, the calves produced should be as big as can safely achieve those goals. The results of this study indicate that provided birth weight and calving ease is appropriate and that sire of the calf is unlikely to have a major bearing on performance of the cows, allowing farmers to consider potential calf value as a key consideration in sire selection in order to capture the greatest return from the use of beef bulls in their dairy herd.
The average milk production for cows in this herd was 285.6 kg MS for the 253-day predicted period, which was less than the herd-test average of New Zealand dairy cows for the same seasons (2016/17: 374 kgMS; 2017/18: 362 kgMS [
1]). The results in this case study were limited in that milk yield could not be predicted outside the period of days 15 to 267 of lactation; however, it is clear that the cows in this case study were producing below the national average, likely because the cows were on a low plane of nutrition. This is supported by the mean body condition score pre-calving (4.52 ± 0.42) and at rebreeding (4.05 ± 0.49) which were less than or close to the industry recommended minimum BCS (5.0 at calving and 4.0 at mating for cows 4 years-of-age or older, and 5.5 and 4.5, respectively, for 3 year-old cows, [
43]), indicating that a large proportion of cows were below target (78% below minimum at calving, 39% below at rebreeding). The low body condition scores and low plane of nutrition would likely prevent the animals from reaching their milk production potential, and limit their reproductive performance [
44,
45]. The herd average genetic merit, represented by the breeding worth index indicating the expected ability to breed profitable and efficient progeny [
46], which takes into account milk production and fertility traits [
47], was below the national average [
1], signifying that cows were less efficient producers.
The effect of underfeeding on milk production and reproductive success has been previously studied, which compared similar genetic merit cows for milk production, where underfed cows produced less milk [
44] and had lower pregnancy rates, conception rates, and longer post-partum anestrous intervals [
44,
48,
49,
50]. This depression of performance may contribute to any effects of service sire on milk production and reproduction being dimmed or over-shadowed. Consequently, further research is needed to ascertain whether service sire effects are seen in higher producing cows.
The breed proportions of the individual cows in this experiment could not be accounted for; however, the bulls were randomly assigned to the cows so any effect of cow breed should be small when considering differences among sires. Further work should consider using cows of known pedigree and genetic merit.


