
Estimation of Nitrogen Use Efficiency for Ryegrass-Fed Dairy Cows: Model Development Using Diet- and Animal-Based Proxy Measures

 ,
,  ,
,
Abstract
1. Introduction
2. Material and Methods
2.1. Data Collection and Parameter Estimation
2.2. Statistical Analysis and Model Development
- i.
- Rank correlations to examine the strength of monotonic relationships of each parameter with NUE, without making assumptions of the linearity of any relationships;
- ii.
- Simple linear regression to identify linear relationships of the predictor parameters with NUE;
- iii.
- For those parameters identified as having strong relationships with NUE from (i) and (ii), all subset regression procedures were performed to produce multiple regression models for NUE. These models were evaluated using Akaike information criterion (AIC) values and adjusted R2 values, with high R2 values and low AIC values indicating a high predictive ability [38]. The goodness of fit was also examined visually by plotting predicted values to the observed NUE obtained from each study;
- iv.
- Parameters identified as being included in the best multiple regression models in (iii) were then screened for their convenience in terms of ease of measurement and practical use as proxy measures;
- v.
- For the parameters identified from (iv), linear and nonlinear (asymptotic curves) models were fitted for both breeds combined and separately for each breed to assess whether models were breed specific or applicable across Friesians and Jersey × Friesian cows.
2.3. Rank Correlations and Simple Linear Regression Models
2.4. All Subset Regression Procedures and Multiple Regression Models
2.5. Evaluation of WSC/CP and MUN as Predictors of NUE
2.6. Model Evaluation
- (i)
- Mean absolute error, ;
- (ii)
- Mean relative absolute error, ;
- (iii)
- Root mean square error, ;
- (iv)
- Normalised root mean square error, NRMSE = (RMSE/mean (Obs)) × 100%.
3. Results
3.1. The Database, Rank Correlations, and Simple Linear Regression Models
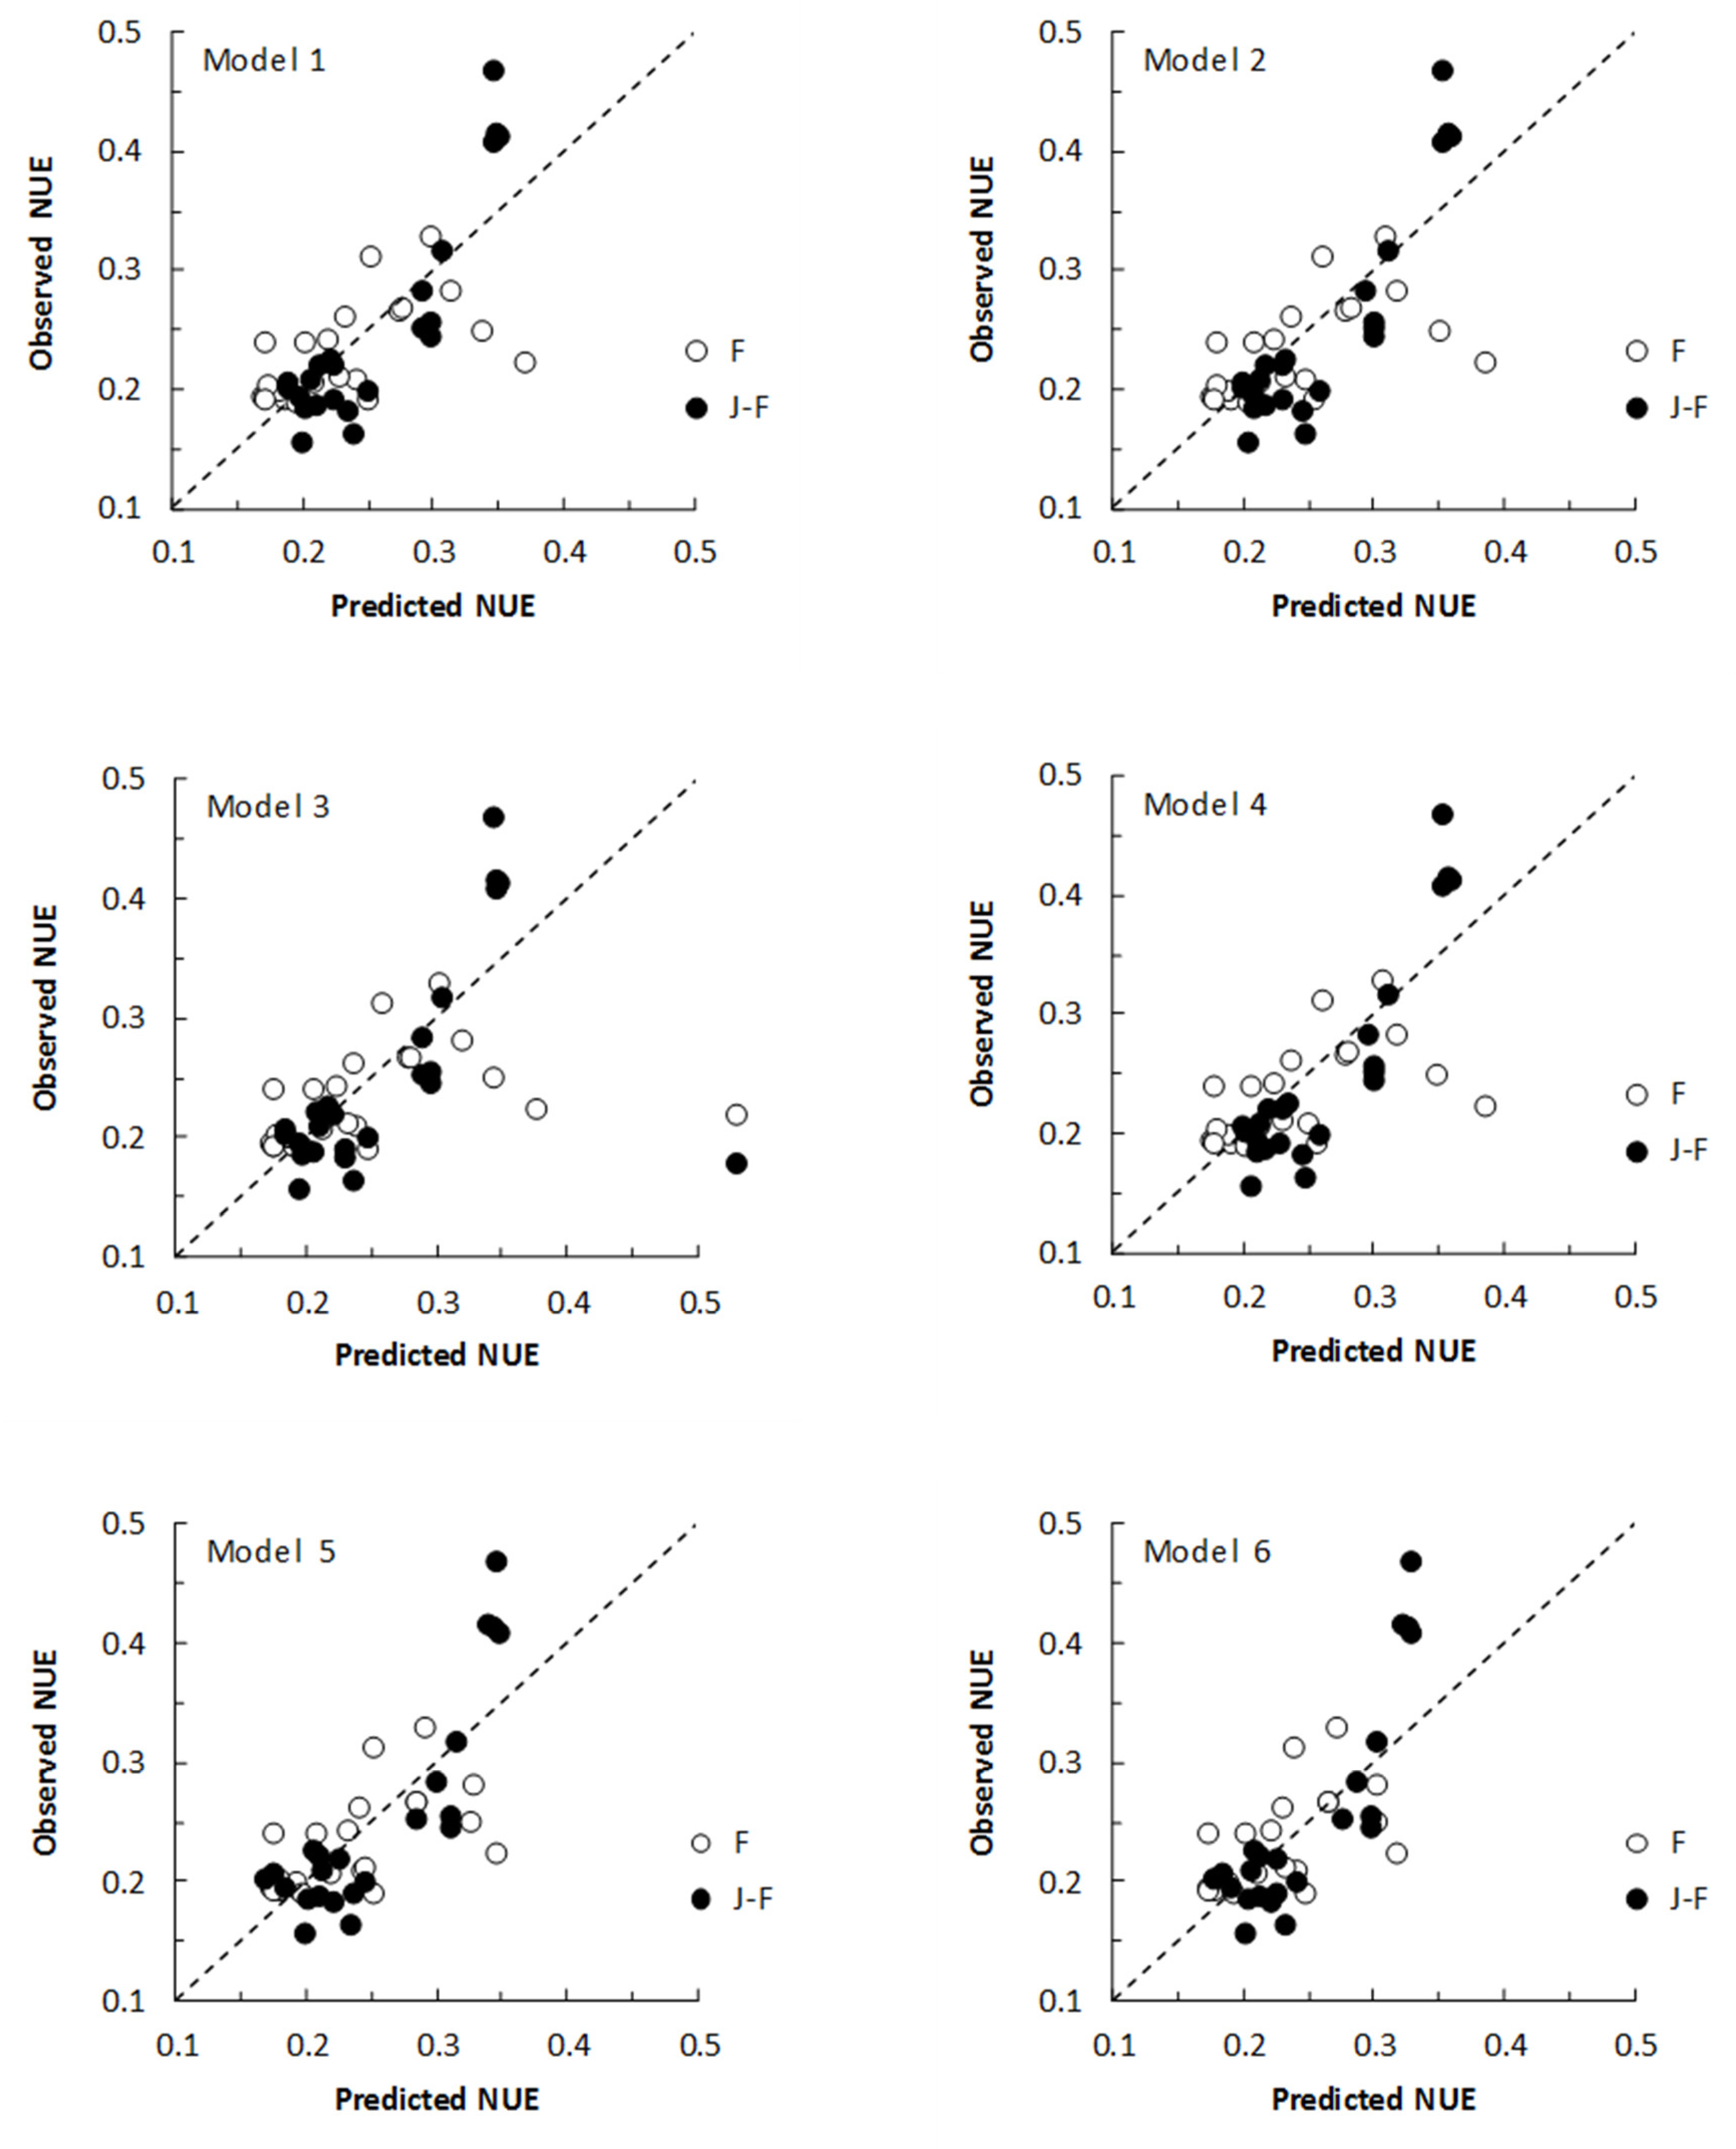
3.2. All Subset Regression Analyses and Multiple Regression Models
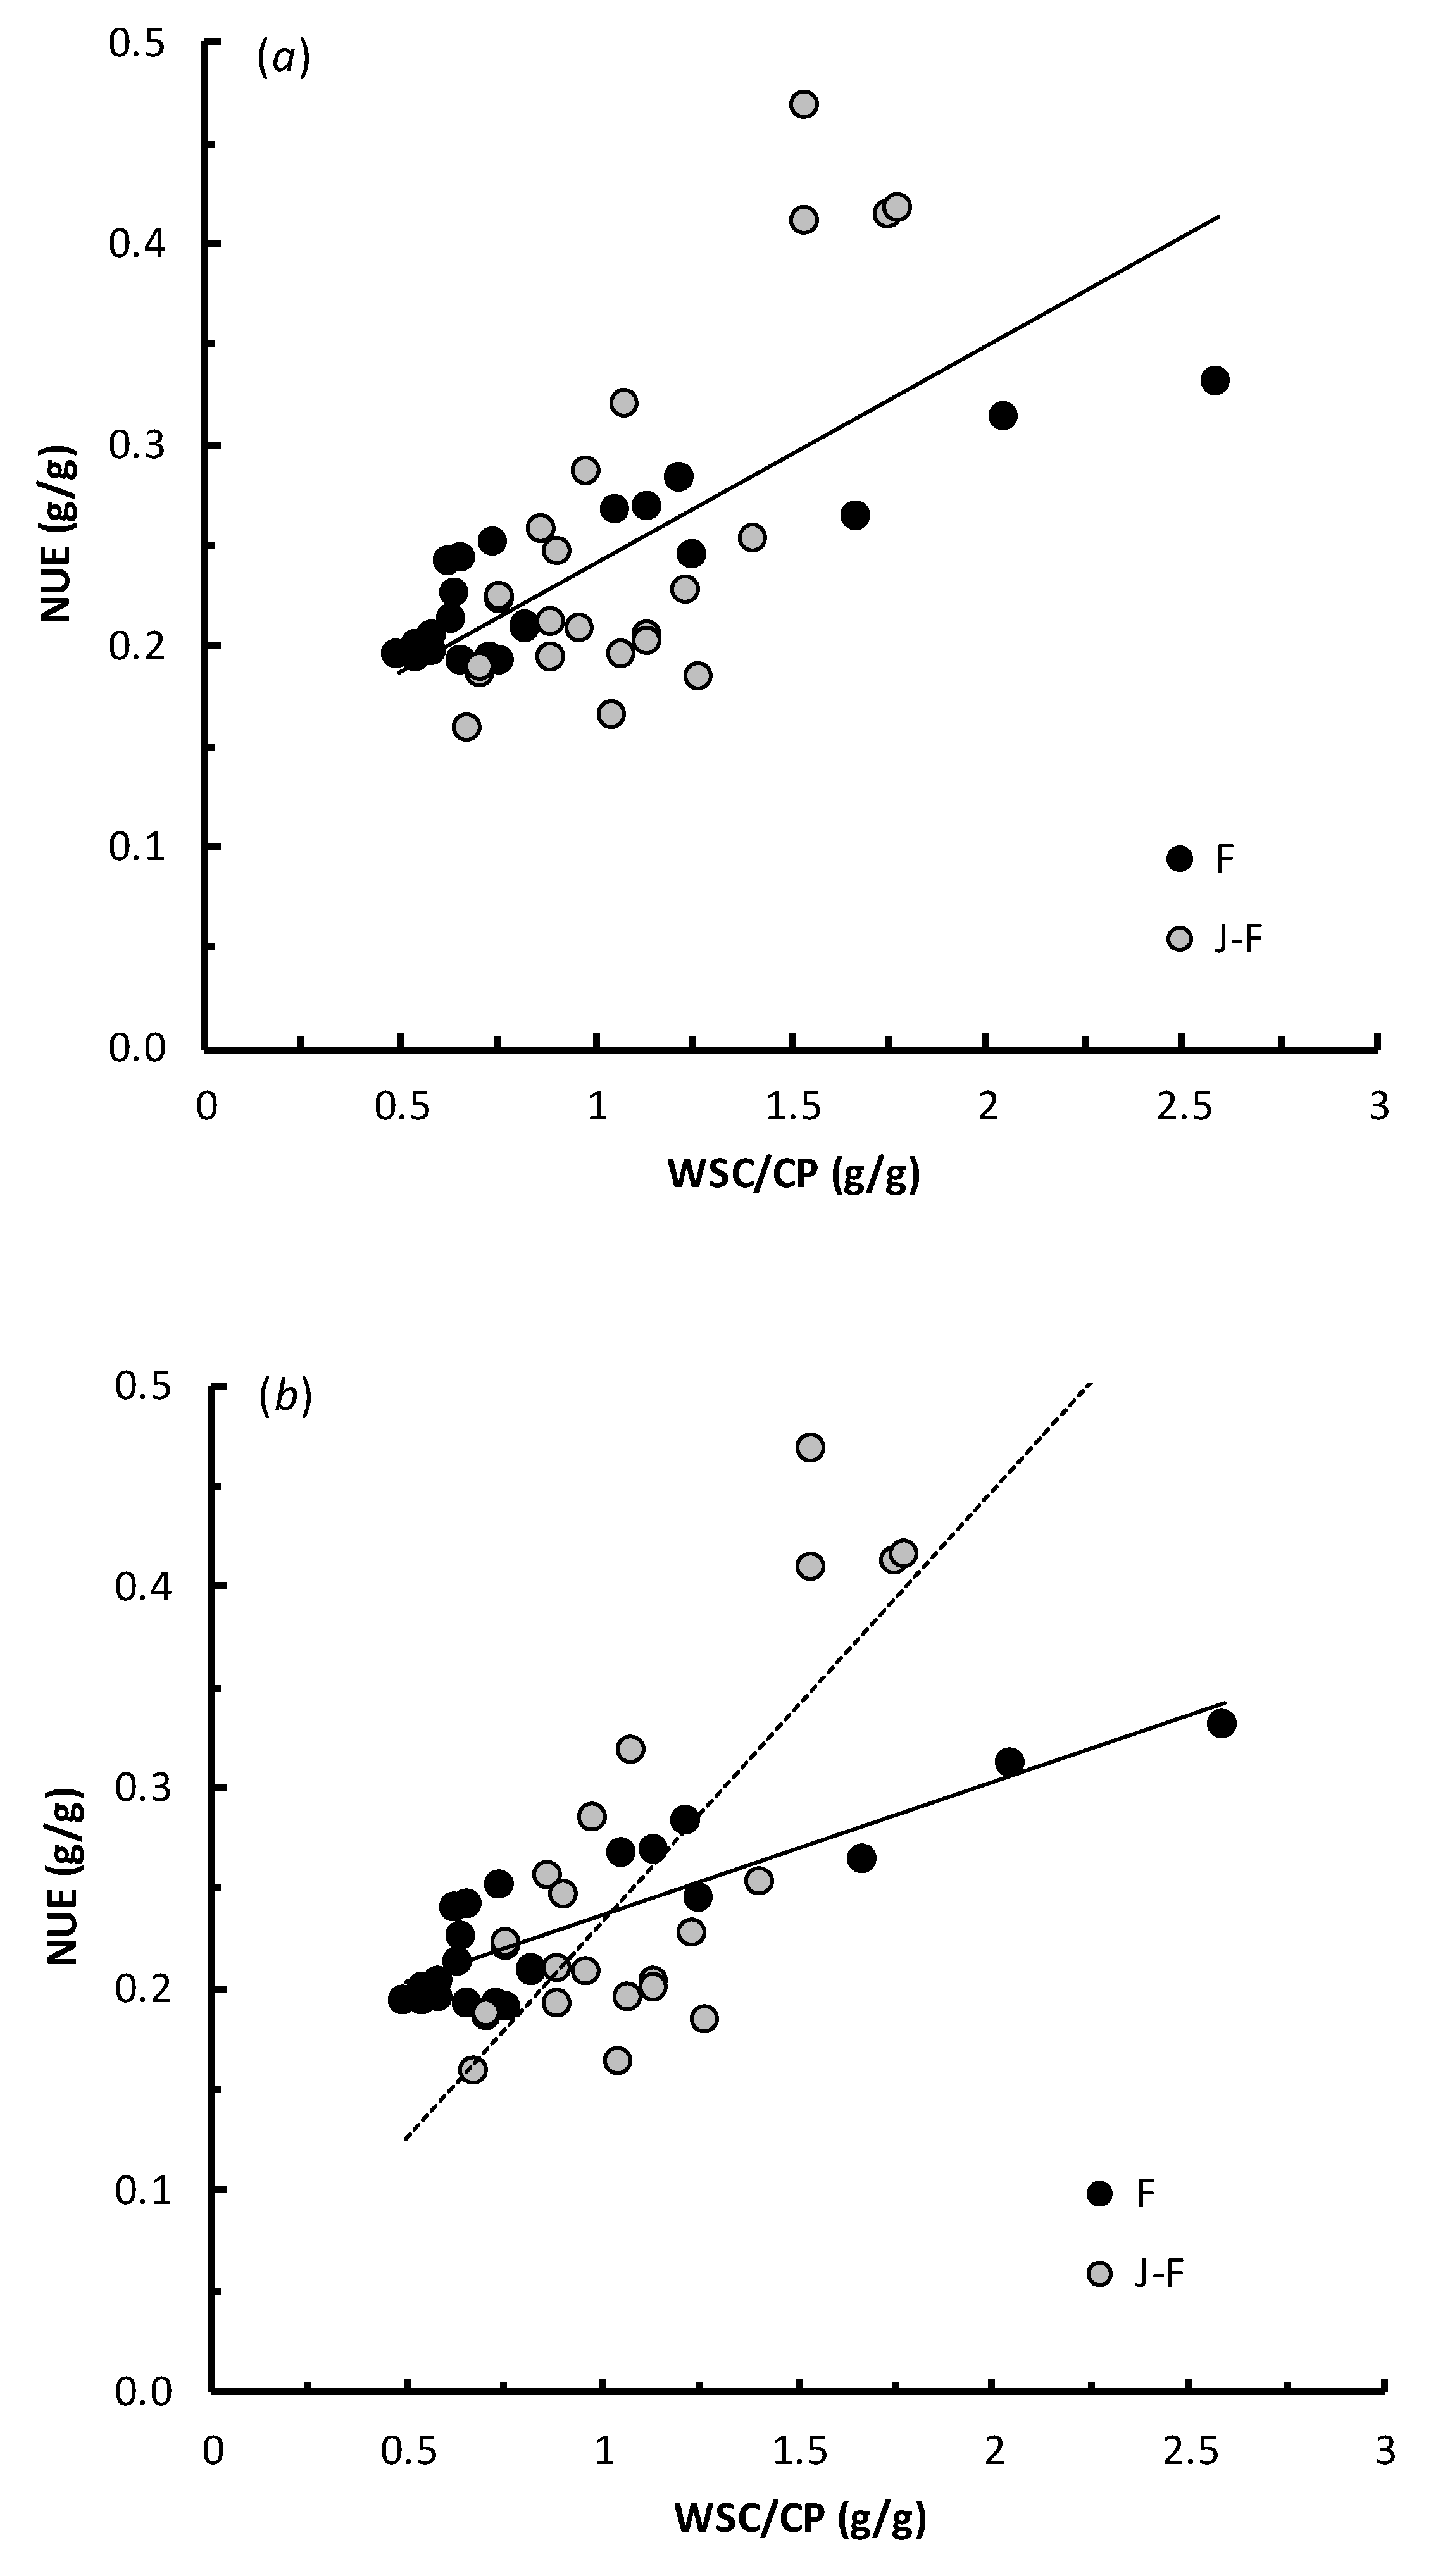
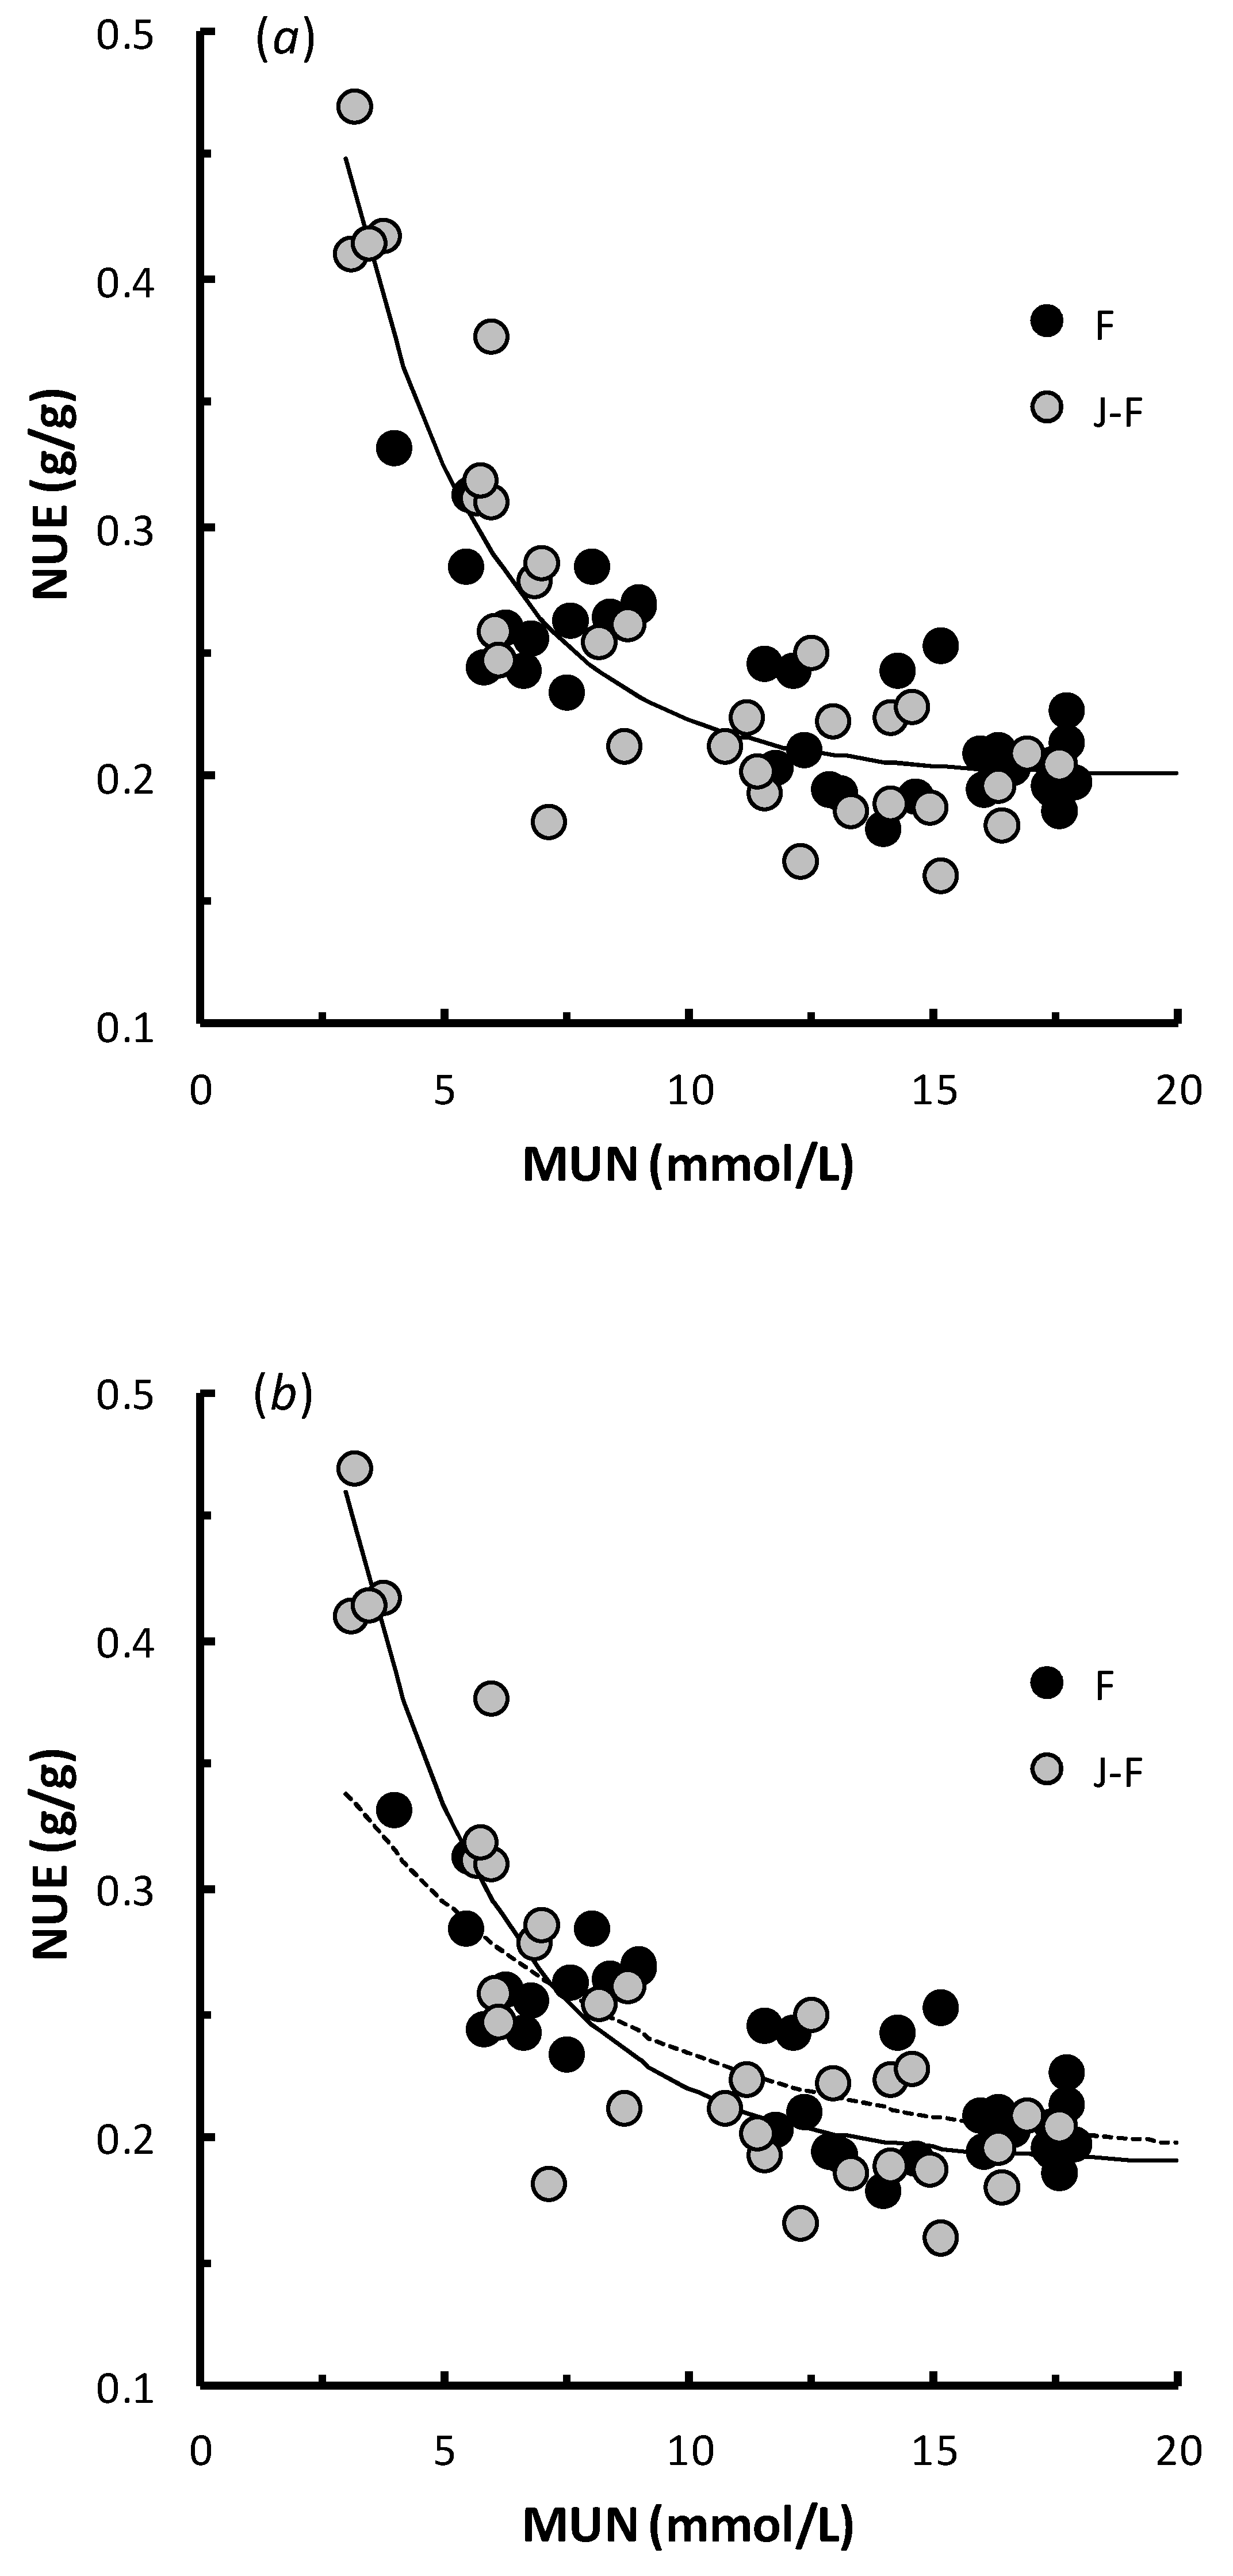
3.3. Practical Parameters: The Relationships of NUE with WSC/CP and MUN
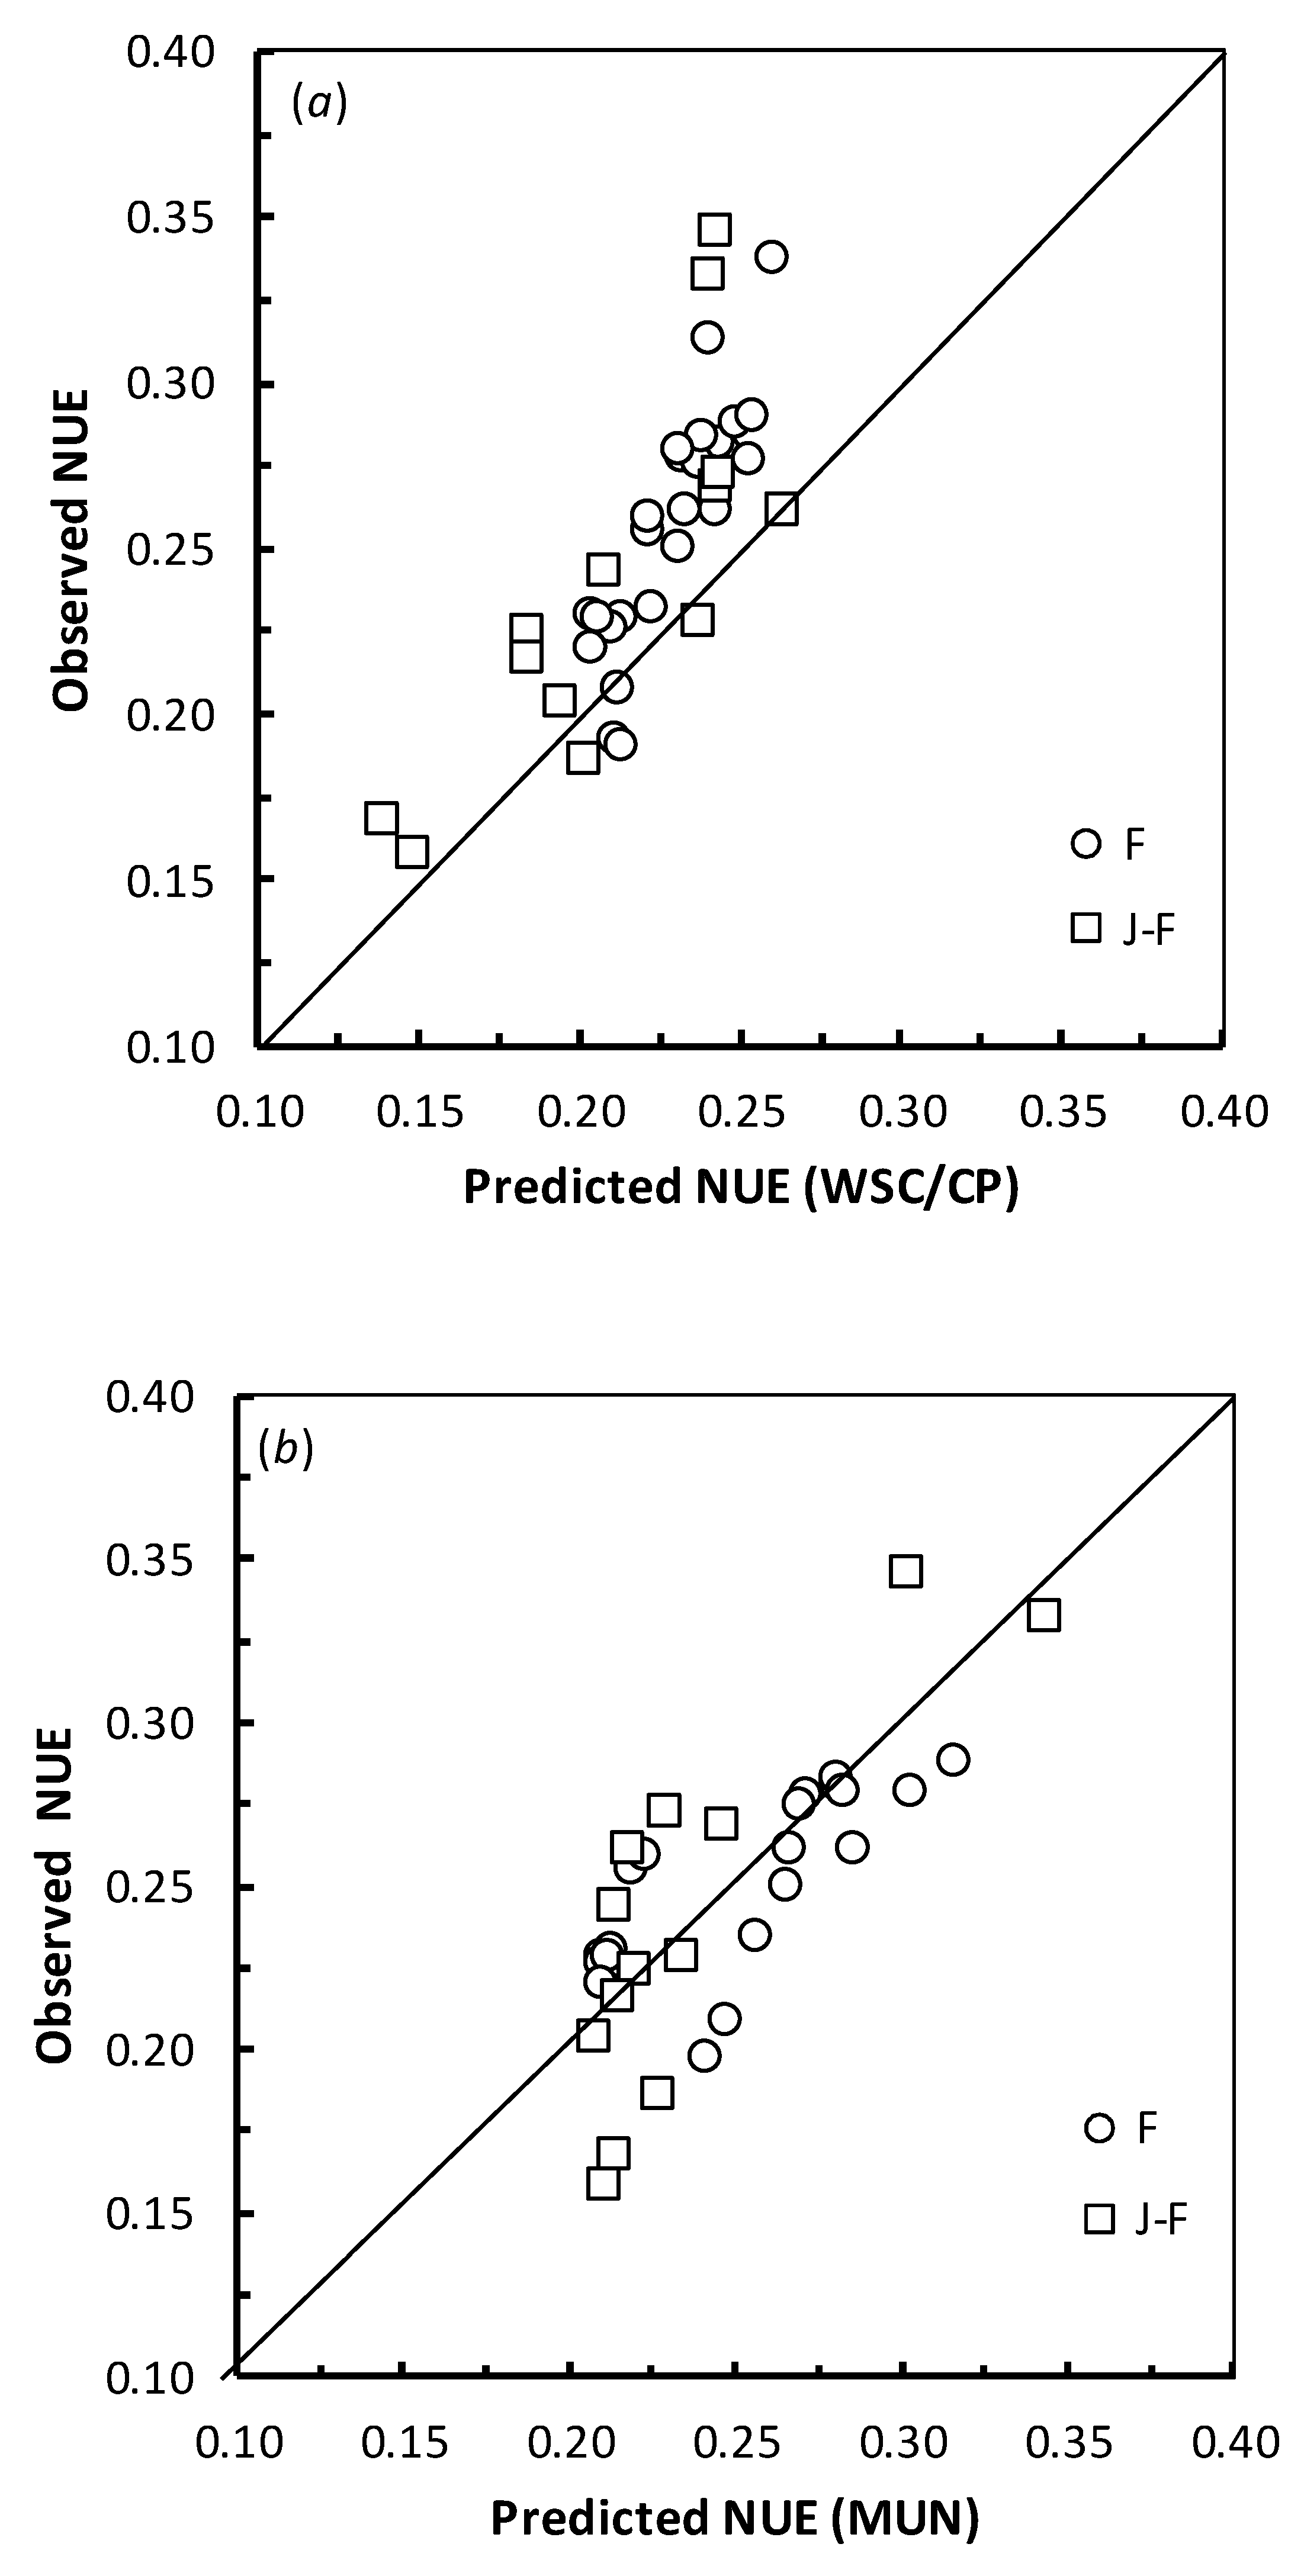
3.4. Model Evaluation
4. Discussion
4.1. The Database, Rank Correlations, and Simple Linear Regression Models
4.2. All Subset Regression Analyses and Multiple Regression Models
4.3. Practical Parameters: The Relationships of NUE with WSC/CP and MUN
4.4. Model Evaluation
5. Conclusions
Author Contributions
Funding
Institutional Review Board Statement
Informed Consent Statement
Data Availability Statement
Acknowledgments
Conflicts of Interest
References
- Nennich, T.D.; Harrison, J.H.; Van Wieringen, L.M.; St-pierre, N.R.; Kincaid, R.L.; Wattiaus, M.A.; Davidson, D.L.; Block, E. Prediction and evaluation of urine and urinary nitrogen and mineral excretion from dairy cattle. J. Dairy Sci. 2006, 89, 353–364. [Google Scholar] [CrossRef]
- Keim, J.P.; Anrique, R. Nutritional Strategies to Improve Nitrogen use Efficiency by Grazing Dairy Cows. Chil. J. Agric. Res. 2011, 71, 623–633. [Google Scholar] [CrossRef]
- Bryant, R.H.; Walpot, V.; Dalley, D.E.; Gibbs, S.J.; Edwards, G.R. Manipulating dietary N in perennial ryegrass pastures to reduce N losses in dairy in spring. In Proceedings of the 4th Australasian Dairy Science Symposium, Lincoln, New Zealand, 31 August–2 September 2010; pp. 97–100. [Google Scholar]
- Johnson, A.; Reed, K.; Kebreab, E. Short communication: Evaluation of nitrogen excretion equations from cattle. J. Dairy Sci. 2016, 99, 7669–7678. [Google Scholar] [CrossRef]
- Pacheco, D.; Waghorn, G. Dietary nitrogen—Definitions, digestion, excretion and consequences of excess for grazing ruminants. N. Z. Grassl. Assoc. 2008, 70, 107–116. [Google Scholar] [CrossRef]
- Pacheco, D.; Burke, J.L.; Cosgrove, G.P. An empirical model to estimate efficiency of nitrogen utilisation in cows grazing fresh forages. In Proceedings of the Australasian Dairy Science Symposium, Melbourne, VA, Australia, 18–20 September 2007; pp. 409–416. [Google Scholar]
- Cheng, L.; Woodward, S.L.; Dewhurst, R.J.; Zhou, H.; Edwards, G.R. Nitrogen partitioning, energy use efficiency and isotopic fractionation measurements from cows differing in genetic merit fed low-quality pasture in late lactation. Anim. Prod. Sci. 2014, 54, 1651–1656. [Google Scholar] [CrossRef][Green Version]
- Broderick, G.A.; Clayton, M.K. A Statistical Evaluation of Animal and Nutritional Factors Influencing Concentrations of Milk Urea Nitrogen. J. Dairy Sci. 1997, 80, 2964–2971. [Google Scholar] [CrossRef]
- Jonker, J.; Kohn, R.; Erdman, R. Using Milk Urea Nitrogen to Predict Nitrogen Excretion and Utilization Efficiency in Lactating Dairy Cows. J. Dairy Sci. 1998, 81, 2681–2692. [Google Scholar] [CrossRef]
- Kauffman, A.; St-Pierre, N. The Relationship of Milk Urea Nitrogen to Urine Nitrogen Excretion in Holstein and Jersey Cows. J. Dairy Sci. 2001, 84, 2284–2294. [Google Scholar] [CrossRef]
- Beatson, P.R.; Meier, S.; Cullen, N.G.; Eding, H. Genetic variation in milk urea nitrogen concentration of dairy cattle and its implications for reducing urinary nitrogen excretion. Animal 2019, 13, 2164–2171. [Google Scholar] [CrossRef]
- Ariyarathne, H.B.P.C.; Correa-Luna, M.; Blair, H.; Garrick, D.; Lopez-Villalobos, N. Can nitrogen excretion of dairy cows be reduced by genetic selection for low milk urea nitrogen concentration? Animals 2021, 11, 737–755. [Google Scholar] [CrossRef] [PubMed]
- Ferguson, J.D.; Thomson, N.; Slesser, D.; Burris, D. Pennsylvania DHIA milk urea testing. J. Dairy Sci. 1997, 80, 161. [Google Scholar]
- Rodríguez, L.; Stallings, C.; Herbein, J.; McGilliard, M. Effect of Degradability of Dietary Protein and Fat on Ruminal, Blood, and Milk Components of Jersey and Holstein Cows. J. Dairy Sci. 1997, 80, 353–363. [Google Scholar] [CrossRef]
- Carruthers, V.R.; Neil, P.G. Milk production and ruminal metabolites from cows offered two pasture diets supplemented with non-structural carbohydrate. N. Z. J. Agric. Res. 1997, 40, 513–521. [Google Scholar] [CrossRef]
- Mackle, T.R.; Bryant, A.M.; Petch, S.F.; Hooper, R.J.; Auldist, M.J. Variation in the composition of milk protein from pasture-fed dairy cows in late lactation and the effect of grain and silage supplementation. N. Z. J. Agric. Res. 1999, 42, 147–154. [Google Scholar] [CrossRef]
- Mackle, T.; Kay, J.; Auldist, M.; McGibbon, A.; Philpott, B.; Baumgard, L.; Bauman, D. Effects of Abomasal Infusion of Conjugated Linoleic Acid on Milk Fat Concentration and Yield from Pasture-Fed Dairy Cows. J. Dairy Sci. 2003, 86, 644–652. [Google Scholar] [CrossRef]
- Pacheco, D.; Lowe, K.; Burke, J.L.; Cosgrove, G.P. Urinary nitrogen excretion from cows at different stage of lactation grazing different ryegrass cultivars during spring or autumn. Proc. N. Z. Soc. Anim. Prod. 2009, 69, 96–200. [Google Scholar]
- Higgs, R.J.; Cosgrove, G.P.; Burke, J.L.; Lane, G.A.; Pacheco, D.; Fraser, K.; Death, A.F.; Ford, J.L. Effect of white clover containing either high or low concentrations of water-soluble carbohydrate on metabolic indicators of protein degradation in the rumen of dairy cows. Proc. N. Z. Soc. Anim. Prod. 2009, 70, 23–28. [Google Scholar]
- Pacheco, D.; Burke, J.L.; Cosgrove, G.P. The effect of different methods of presenting ryegrass and white clover diets on nitrogen utilisation by cows. In Proceedings of the 4th Australasian Dairy Science Symposium, Lincoln, New Zealand, 31 August–2 September 2010; pp. 101–105. [Google Scholar]
- Mackle, T.R.; Parr, C.R.; Bryant, A.M. Nitrogen fertiliser effects on milk yield and composition, pasture intake, nitrogen and energy partitioning, and rumen fermentation parameters of dairy cows in early lactation. N. Z. J. Agric. Res. 1996, 39, 341–356. [Google Scholar] [CrossRef]
- Carruthers, V.R.; Neil, P.G.; Dalley, D.E. Effect of altering the non-structural: Structural carbohydrate ratio in a pasture diet on milk production and ruminal metabolites in cows in early and late lactation. Anim. Sci. 1997, 64, 393–402. [Google Scholar] [CrossRef]
- Harris, S.L.; Auldist, M.J.; Clark, D.A.; Jansen, E.B.L. Effects of white clover content in the diet on herbage intake, milk production and milk composition of New Zealand dairy cows housed indoors. J. Dairy Res. 1998, 65, 389–400. [Google Scholar] [CrossRef] [PubMed]
- Kolver, E.S.; Aspin, P.W. Supplemental fumarate did not influence milk solids or methane production from dairy cows fed high quality pasture. Proc. N. Z. Soc. Anim. Prod. 2006, 66, 409–415. [Google Scholar]
- Allen, M.E. The Effects of Gibberellic Acid and Time of Grazing on Nitrogen Partitioning in Dairy Cows Grazing Perennial Ryegrass Pastures. Master’s Thesis, Lincoln University, Lincoln, New Zealand, 2010. [Google Scholar]
- Woodward, S.L.; Waghorn, G.C.; Bryant, M.A.; Mandok, K. Are high breeding worth index cows more feed conversion efficient and nitrogen use efficient? Proc. N. Z. Soc. Anim. Prod. 2011, 71, 109–113. [Google Scholar]
- Engellbrecht, K.S. Rumen digestion, intake, milk production and nitrogen partitioning of dairy cows grazing simple vs diverse pasture swards at high and low pasture allowance. Master’s Thesis, Lincoln University, Lincoln, New Zealand, 2012. [Google Scholar]
- Taweel, H.; Tas, B.; Smit, H.; Elgersma, A.; Dijkstra, J.; Tamminga, S. Effects of feeding perennial ryegrass with an elevated concentration of water-soluble carbohydrates on intake, rumen function and performance of dairy cows. Anim. Feed Sci. Technol. 2005, 121, 243–256. [Google Scholar] [CrossRef]
- Tas, B.; Taweel, H.; Smit, H.; Elgersma, A.; Dijkstra, J.; Tamminga, S. Utilisation of N in perennial ryegrass cultivars by stall-fed lactating dairy cows. Livest. Sci. 2006, 100, 159–168. [Google Scholar] [CrossRef]
- Abrahamse, P.A.; Tamminga, S.; Dijkstra, J. Effect of daily movement of dairy cattle to fresh grass in morning or afternoon on intake, grazing behaviour, rumen fermentation and milk production. J. Agric. Sci. 2009, 147, 721–730. [Google Scholar] [CrossRef]
- Wims, C.; McEvoy, M.; Delaby, L.; Boland, T.; O’Donovan, M. Effect of perennial ryegrass (Lolium perenne L.) cultivars on the milk yield of grazing dairy cows. Animal 2013, 7, 410–421. [Google Scholar] [CrossRef] [PubMed]
- Clark, C.; McLeod, K.; Glassey, C.; Gregorini, P.; Costall, D.; Betteridge, K.; Jago, J. Capturing urine while maintaining pasture intake, milk production, and animal welfare of dairy cows in early and late lactation. J. Dairy Sci. 2010, 93, 2280–2286. [Google Scholar] [CrossRef]
- Totty, V.; Greenwood, S.; Bryant, R.; Edwards, G. Nitrogen partitioning and milk production of dairy cows grazing simple and diverse pastures. J. Dairy Sci. 2013, 96, 141–149. [Google Scholar] [CrossRef]
- Bryant, R.H.; Dalley, D.E.; Gibbs, J.; Edwards, G. Effect of grazing management on herbage protein concentration, milk production and nitrogen excretion of dairy cows in mid-lactation. Grass Forage Sci. 2013, 69, 644–654. [Google Scholar] [CrossRef]
- Al-Marashdeh, O.; Greenwood, S.L.; Hodge, S.; Edwards, G.R. The effects of feeding maize silage at different times prior to a herbage meal on dry matter intake, milk solids production and nitrogen excretion in late-lactation dairy cows. Proc. N. Z. Soc. Anim. Prod. 2015, 75, 140–144. [Google Scholar]
- Al-Marashdeh, O.; Gregorini, P.; Greenwood, S.L.; Edwards, G. The effect of feeding maize silage 1 h or 9 h before the herbage meal on dry matter intake, milk production, nitrogen partitioning and rumen function of lactating dairy cows. Anim. Prod. Sci. 2016, 56, 2004–2013. [Google Scholar] [CrossRef]
- Al-Marashdeh, O.; Gregorini, P.; Edwards, G. Effect of time of maize silage supplementation on herbage intake, milk production, and nitrogen excretion of grazing dairy cows. J. Dairy Sci. 2016, 99, 7123–7132. [Google Scholar] [CrossRef]
- Payne, R.A. Guide to Regression, Nonlinear and Generalized Linear Models in GenStat, 16th ed.; VSN International Ltd.: Hemel Hempstead, UK, 2013. [Google Scholar]
- Miller, G.A.; Chapman, J.P. Misunderstanding analysis of covariance. J. Abnorm. Psychol. 2001, 110, 40–48. [Google Scholar] [CrossRef]
- Jamieson, J. Analysis of covariance (ANCOVA) with difference scores. Int. J. Psychophysiol. 2004, 52, 277–283. [Google Scholar] [CrossRef]
- Spiess, A.-N.; Neumeyer, N. An evaluation of R2 as an inadequate measure for nonlinear models in pharmacological and biochemical research: A Monte Carlo approach. BMC Pharmacol. 2010, 10, 6. [Google Scholar] [CrossRef] [PubMed]
- Lin, L.I.-K. A Concordance Correlation Coefficient to Evaluate Reproducibility. Biometrics 1989, 45, 255. [Google Scholar] [CrossRef]
- Johnson, R.; Young, A. The Association Between Milk Urea Nitrogen and DHI Production Variables in Western Commercial Dairy Herds. J. Dairy Sci. 2003, 86, 3008–3015. [Google Scholar] [CrossRef]
- Jonker, J.; Kohn, R.; Erdman, R. Milk Urea Nitrogen Target Concentrations for Lactating Dairy Cows Fed According to National Research Council Recommendations. J. Dairy Sci. 1999, 82, 1261–1273. [Google Scholar] [CrossRef]
- Edwards, G.R.; Parsons, A.J.; Rasmussen, S. High sugar ryegrasses for dairy systems. Meeting the Challenges for Pasture-Based Dairying. In Proceedings of the Australasian Dairy Science Symposium, Melbourne, VA, Australia, 2007; 2007; pp. 307–334. [Google Scholar]
- Miller, L.A.; Moorby, J.M.; Davies, D.R.; Humphreys, M.O.; Scollan, N.D.; Macrae, J.C.; Theodorou, M.K. Increased concentration of water-soluble carbohydrate in perennial ryegrass (Lolium perenne L.): Milk production from late-lactation dairy cows. Grass Forage Sci. 2001, 56, 383–394. [Google Scholar] [CrossRef]
- Castillo, A.R.; Kebreab, E.; Beever, D.E.; France, J. A review of efficiency of nitrogen utilisation in lactating dairy cows and its relationship with environmental pollution. J. Anim. Feed Sci. 2000, 9, 1–32. [Google Scholar] [CrossRef]
- Cheng, L.; Sheahan, A.J.; Gibbs, S.J.; Rius, A.; Kay, J.K.; Meier, S.; Edwards, G.R.; Dewhurst, R.; Roche, J.R. Technical note: Nitrogen isotopic fractionation can be used to predict nitrogen-use efficiency in dairy cows fed temperate pasture. J. Anim. Sci. 2013, 91, 5785–5788. [Google Scholar] [CrossRef]
- Røjen, B.; Lund, P.; Kristensen, N.B. Urea and short-chain fatty acids metabolism in Holstein cows fed a low-nitrogen grass-based diet. Animal 2008, 2, 500–513. [Google Scholar] [CrossRef] [PubMed][Green Version]
- Krehbiel, C.R.; Ferrell, C.L.; Freetly, H.C. Effects of frequency of supplementation on dry matter intake and net portal and hepatic flux of nutrients in mature ewes that consume low-quality forage. J. Anim. Sci. 1998, 76, 2464–2473. [Google Scholar] [CrossRef]
- Orr, R.; Rutter, M.; Penning, P.D.; Rook, A.J. Matching grass supply to grazing patterns for dairy cows. Grass Forage Sci. 2001, 56, 352–361. [Google Scholar] [CrossRef]
- Gregorini, P. Diurnal grazing pattern: Its physiological basis and strategic management. Anim. Prod. Sci. 2012, 52, 416–430. [Google Scholar] [CrossRef]


| Study | Year | Groups of Cows in Study | Cows per Group | Breed | Region | Reference |
|---|---|---|---|---|---|---|
| 1 | 1997 | 4 | 8 | F | NZ | [15] |
| 2 | 1999 | 3 | 15 | F | NZ | [16] |
| 3 | 2003 | 4 | 4 | F | NZ | [17] |
| 4 | 2009 | 14 | 20–30 | F | NZ | [18] |
| 5 | 2009 | 2 | 5 | F | NZ | [19] |
| 6 | 2010 | 8 | 15 | F | NZ | [20] |
| 7 | 1996 | 8 | 8 | JF | NZ | [21] |
| 8 | 1997 | 6 | 3 | JF | NZ | [22] |
| 9 | 1998 | 3 | 5 | JF | NZ | [23] |
| 10 | 2006 | 2 | 8 | JF | NZ | [24] |
| 11 | 2010 | 2 | 18 | JF | NZ | [3] |
| 12 | 2010 | 3 | 5 | JF | NZ | Cheng unpublished 2010 |
| 13 | 2010 | 4 | 10 | JF | NZ | [25] |
| 14 | 2011 | 1 | 8 | JF | NZ | [26] |
| 15 | 2012 | 4 | 12 | JF | NZ | [27] |
| 16 | 2013 | 4 | 8 | JF | NZ | Cheng unpublished 2013 |
| 17 | 2005 | 2 | 4–8 | F | Netherlands | [28] |
| 18 | 2006 | 3 | 4 | F | Netherlands | [29] |
| 19 | 2009 | 2 | 10 | F | Netherlands | [30] |
| 20 | 2013 | 4 | 8 | F | Ireland | [31] |
| 21 | 2010 | 3 | 16 | F | NZ | [32] |
| 22 | 2013 | 3 | 12 | JF | NZ | [33] |
| 23 | 2014 | 6 | 6 | JF | NZ | [34] |
| 24 | 2015 | 2 | 5 | JF | NZ | [35] |
| 25 | 2015 | 3 | 3 | JF | NZ | [36] |
| 26 | 2016 | 9 | 4 | JF | NZ | [37] |
| Parameter | Abbreviation | Formula | Unit | |
|---|---|---|---|---|
| Dietary factors | Metabolisable energy | ME | (MJ/kgDM) | |
| Neutral detergent fibre | NDF | (%DM) | ||
| Acid detergent fibre | ADF | (%DM) | ||
| Crude protein | CP | (%DM) | ||
| Water-soluble carbohydrate | WSC | (%DM) | ||
| Nitrogen | N | (%DM) | ||
| Water-soluble carbohydrate to crude protein ratio | WSC/CP | (g/g) | ||
| Metabolisable energy to crude protein ratio | ME/CP | (MJ/g) | ||
| Animal factors | Dry matter intake | DMI | (kg/cow/d) | |
| ME intake | MEI | ME x DMI | (MJ/cow/d) | |
| Milk yield | MY | (kg/cow/d) | ||
| Milk nitrogen% | MN% | (% volume) | ||
| Milk nitrogen | MN | MN% × MY × 10 | (g/cow/d) | |
| Milk protein% | MP% | (% volume) | ||
| Milk protein | MP | MN × 6.38/1000 | (kg/cow/d) | |
| Milk fat% | MF% | (% volume) | ||
| Milk fat | MF | MF% × MY/100 | (kg/cow/d) | |
| Milk solids | MS | MP + MF | (kg/cow/d) | |
| Nitrogen intake | NI | DMI × N | (g/cow/d) | |
| Urinary nitrogen | UN | (g/cow/d) | ||
| Faecal nitrogen | FN | (g/cow/d) | ||
| Milk urea nitrogen | MUN | (mmol/L) | ||
| Derived measures | Nitrogen use efficiency | NUE | MN/NI | (g/g) |
| Milk nitrogen to urinary Nitrogen ratio | MN/UN | (g/g) | ||
| Urinary nitrogen to Nitrogen intake ratio | UN/NI | (g/g) | ||
| Faecal nitrogen to urinary Nitrogen ratio | FN/UN | (g/g) | ||
| Milk solids to dry matter Intake ratio | MS/DMI | (kg/kg) | ||
| Milk yield to dry matter Intake ratio | MY/DMI | (kg/kg) | ||
| ME intake to milk yield ratio | MEI/MY | (MJ/kg) | ||
| ME intake to milk solid ratio | MEI/MS | (MJ/kg) |
| Friesian | Jersey × Friesian | ||||||||||||||
|---|---|---|---|---|---|---|---|---|---|---|---|---|---|---|---|
| N | Mean | SE | Min | Max | rS | Sig. | N | Mean | SE | Min | Max | rS | Sig. | ||
| Dietary factors | ME (MJ/kgDM) | 9 | 11.51 | 0.41 | 9.16 | 12.59 | 0.70 | *** | 37 | 11.80 | 0.09 | 9.87 | 12.70 | 0.45 | *** |
| NDF (%) | 28 | 45.67 | 1.47 | 33.80 | 59.00 | 0.04 | ns | 31 | 43.22 | 0.93 | 34.20 | 58.90 | −0.28 | * | |
| ADF (%) | 8 | 26.79 | 0.95 | 23.88 | 32.30 | 0.25 | ns | 18 | 24.12 | 1.02 | 18.70 | 32.20 | −0.02 | ns | |
| CP (%) | 29 | 20.00 | 0.89 | 11.88 | 28.00 | −0.52 | *** | 37 | 18.62 | 0.64 | 11.60 | 25.30 | −0.61 | *** | |
| WSC (%) | 22 | 18.62 | 1.15 | 13.90 | 34.20 | 0.70 | *** | 24 | 19.23 | 0.99 | 5.00 | 28.70 | 0.13 | ns | |
| WSC/CP (g/g) | 22 | 0.948 | 0.114 | 0.496 | 2.590 | 0.71 | *** | 23 | 1.092 | 0.068 | 0.674 | 1.780 | 0.57 | *** | |
| ME/CP(MJ/g) | 9 | 0.731 | 0.051 | 0.537 | 0.928 | 0.90 | *** | 37 | 0.664 | 0.026 | 0.489 | 1.034 | 0.75 | *** | |
| Animal factors | MEI (MJ/cow/d) | 9 | 170.39 | 8.53 | 120.00 | 196.44 | 0.45 | ns | 37 | 167.81 | 5.95 | 116.20 | 229.20 | 0.03 | ns |
| DMI (kg/cow/d) | 29 | 14.40 | 0.27 | 12.28 | 16.60 | 0.43 | ** | 37 | 14.20 | 0.47 | 10.20 | 19.10 | −0.07 | ns | |
| MY (kg/cow/d) | 21 | 19.25 | 1.06 | 10.60 | 28.70 | 0.51 | ** | 27 | 17.40 | 0.81 | 9.92 | 24.90 | −0.06 | ns | |
| MN (%) | 21 | 0.544 | 0.012 | 0.461 | 0.620 | −0.66 | *** | 27 | 0.600 | 0.012 | 0.511 | 0.706 | 0.70 | *** | |
| MN (g/cow/d) | 35 | 105.42 | 3.52 | 58.32 | 160.00 | 0.24 | * | 37 | 99.14 | 3.91 | 55.82 | 150.00 | 0.38 | ** | |
| MP (kg/cow/d) | 35 | 0.677 | 0.022 | 0.372 | 1.021 | 0.24 | * | 31 | 0.644 | 0.025 | 0.356 | 0.957 | 0.31 | * | |
| MF (%) | 13 | 4.141 | 0.343 | 1.530 | 5.490 | −0.28 | ns | 27 | 5.367 | 0.113 | 4.170 | 6.240 | 0.31 | * | |
| MF (kg/cow/d) | 13 | 0.706 | 0.052 | 0.313 | 0.930 | 0.36 | ns | 27 | 0.889 | 0.028 | 0.545 | 1.210 | 0.05 | ns | |
| MS (kg/cow/d) | 13 | 1.293 | 0.067 | 0.915 | 1.586 | 0.29 | ns | 27 | 1.542 | 0.053 | 0.901 | 1.944 | 0.22 | ns | |
| NI (g/cow/d) | 35 | 464.4 | 17.1 | 283.2 | 650.0 | −0.40 | ** | 37 | 420.0 | 19.5 | 201.6 | 616.0 | −0.50 | *** | |
| UN (g/cow/d) | 18 | 240.9 | 20.1 | 81.0 | 343.0 | −0.81 | *** | 14 | 247.8 | 15.4 | 165.0 | 357.9 | 0.24 | ns | |
| FN (g/cow/d) | 4 | 121.75 | 4.19 | 114.00 | 129.00 | 0.65 | ns | 14 | 110.86 | 4.36 | 86.00 | 138.00 | 0.37 | * | |
| MUN (mmol/L) | 35 | 12.22 | 0.77 | 4.00 | 17.90 | −0.71 | *** | 33 | 10.10 | 0.78 | 3.17 | 17.60 | −0.81 | *** | |
| Derived | MN/UN (g/g) | 18 | 0.515 | 0.058 | 0.279 | 1.210 | 0.93 | *** | 14 | 0.379 | 0.021 | 0.250 | 0.527 | 0.82 | *** |
| measures | UN/NI (g/g) | 18 | 0.510 | 0.025 | 0.274 | 0.663 | −0.84 | *** | 14 | 0.538 | 0.021 | 0.458 | 0.722 | −0.42 | * |
| MS/DMI (kg/kg) | 13 | 0.085 | 0.004 | 0.058 | 0.108 | 0.27 | ns | 27 | 0.108 | 0.003 | 0.069 | 0.138 | 0.52 | *** | |
| MY/DMI (kg/kg) | 21 | 1.273 | 0.057 | 0.809 | 1.750 | 0.48 | ** | 27 | 1.197 | 0.030 | 0.834 | 1.515 | 0.35 | * | |
| MEI/MY (MJ/kg) | 9 | 10.52 | 0.35 | 9.13 | 12.06 | −0.50 | ** | 27 | 10.02 | 0.21 | 7.86 | 12.16 | −0.31 | * | |
| MEI/MS (MJ/kg) | 9 | 126.48 | 2.52 | 115.85 | 138.56 | −0.18 | ns | 27 | 112.23 | 2.98 | 89.41 | 143.09 | −0.53 | *** | |
| NUE (g/g) | 35 | 0.231 | 0.006 | 0.178 | 0.331 | 37 | 0.249 | 0.013 | 0.158 | 0.468 | |||||
| Friesian | Jersey × Friesian | |||||||||||
|---|---|---|---|---|---|---|---|---|---|---|---|---|
| Weighted | N | Constant | Slope | Adj. R2 (%) | p | N | Constant | Slope | Adj. R2 (%) | p | ||
| Dietary factors | CP (%) | No | 29 | 0.326 (0.025) | −0.0047 (0.0012) | 32.3 | <0.001 | 37 | 0.533 (0.042) | −0.0153 (0.0022) | 55.9 | <0.001 |
| Yes | 29 | 0.323 (0.025) | −0.0044 (0.0012) | 33.0 | <0.001 | 37 | 0.597 (0.041) | −0.0186 (0.0023) | 64.8 | <0.001 | ||
| WSC/CP (g/g) | No | 22 | 0.170 (0.009) | 0.0665 (0.0084) | 74.4 | <0.001 | 23 | 0.020 (0.043) | 0.2144 (0.0377) | 58.8 | <0.001 | |
| Yes | 22 | 0.166 (0.009) | 0.0735 (0.0087) | 77.0 | <0.001 | 23 | 0.020 (0.036) | 0.2318 (0.0303) | 72.4 | <0.001 | ||
| Animal factors | NI (g/cow/d) | No | 35 | 0.317 (0.027) | −0.0002 (0.0001) | 22.1 | 0.003 | 37 | 0.417 (0.039) | −0.0004 (0.0001) | 34.3 | <0.001 |
| Yes | 35 | 0.328 (0.028) | −0.0002 (0.0001) | 27.1 | <0.001 | 37 | 0.480 (0.036) | −0.0005 (0.0001) | 50.4 | <0.001 | ||
| MUN (mmol/L) | No | 35 | 0.312 (0.011) | −0.0067 (0.0009) | 63.2 | 0.001 | 33 | 0.403 (0.021) | −0.0147 (0.0019) | 63.7 | <0.001 | |
| Yes | 35 | 0.324 (0.009) | −0.0075 (0.0007) | 77.6 | <0.001 | 33 | 0.426 (0.021) | −0.0175 (0.0022) | 66.1 | <0.001 | ||
| Derived measures | MN/UN (g/g) | No | 18 | 0.150 (0.010) | 0.1725 (0.0182) | 83.9 | <0.001 | 14 | 0.100 (0.017) | 0.2593 (0.0436) | 72.6 | <0.001 |
| Yes | 18 | 0.138 (0.012) | 0.2023 (0.0234) | 81.3 | <0.001 | 14 | 0.096 (0.019) | 0.2659 (0.0480) | 69.5 | <0.001 | ||
| Model | Breed | Weighted | Constant | MUN (mmol/L) | WSC/CP | Breed (JF) | N | Adj. R2 (%) | AIC | p |
|---|---|---|---|---|---|---|---|---|---|---|
| 1 | No | No | 0.3326 (0.0408) | −0.0102 (0.0019) | 0.0297 (0.0204) | - | 45 | 66.6 | 47.03 | <0.001 |
| 2 | No | Yes | 0.3238 (0.0436) | −0.0096 (0.0020) | 0.0381 (0.0225) | - | 45 | 71.1 | 47.28 | <0.001 |
| 3 | Yes | No | 0.3402 (0.0428) | −0.0104 (0.0020) | 0.0292 (0.0205) | −0.0082 (0.0126) | 45 | 66.1 | 48.00 | <0.001 |
| 4 | Yes | Yes | 0.3215 (0.0475) | −0.0095 (0.0022) | 0.0385 (0.0230) | 0.0018 (0.0137) | 45 | 70.4 | 48.26 | <0.001 |
| 5 | Yes | No | 0.3943 (0.0199) | −0.0124 (0.0014) | - | −0.0088 (0.0128) | 45 | 65.3 | 47.98 | <0.001 |
| 6 | Yes | No | 0.3591 (0.0157) | −0.0105 (0.0011) | - | 0.0018 (0.0104) | 67 | 56.8 | - | <0.001 |
| Equation of Form: NUE = a + b(WSC/CP) | |||||||
|---|---|---|---|---|---|---|---|
| Model | Breed | a | b | N | S | p | |
| 7 | All | 0.1324 (0.093–0.172) | 0.1087 (0.073–0.144) | 45 | 0.052 | <0.001 | |
| 8 | F | 0.1700 (0.151–0.189) | 0.0665 (0.049–0.084) | 22 | 0.021 | <0.001 | |
| 9 | J-F | 0.0195 (−0.070–0.109) | 0.2144 (0.136–0.293) | 23 | 0.058 | <0.001 | |
| Equation of Form: NUE = a + bcMUN | |||||||
| a | b | c | N | S | p | ||
| 10 | All | 0.2001 (0.187–0.211) | 0.7000 (0.502–1.003) | 0.7085 (0.645–0.769) | 68 | 0.028 | <0.001 |
| 11 | F | 0.1906 (−0.087−0.212) | 0.2506 (−0.051–0.559) | 0.8393 (0.704–0.979) | 35 | 0.022 | <0.001 |
| 12 | J-F | 0.1896 (0.163–0.210) | 0.6950 (0.486–1.053) | 0.7306 (0.647–0.807) | 33 | 0.031 | <0.001 |
| Predictor | Models | Measure of Model Fit | F | J-F |
|---|---|---|---|---|
| WSC/CP | 8 & 9 | MAE | 0.031 | 0.033 |
| NUE = a + b(WSC/CP) | RMSE | 0.035 | 0.045 | |
| MRAE (%) | 11.57 | 12.81 | ||
| NRMSE (%) | 13.77 | 18.67 | ||
| Correlation | 0.870 | 0.796 | ||
| Concordance | 0.459 | 0.630 | ||
| MUN | 10 | MAE | 0.018 | 0.027 |
| NUE = a + bcMUN | RMSE | 0.022 | 0.033 | |
| MRAE (%) | 7.74 | 12.26 | ||
| NRMSE (%) | 8.91 | 13.64 | ||
| Correlation | 0.748 | 0.811 | ||
| Concordance | 0.729 | 0.764 | ||
Publisher’s Note: MDPI stays neutral with regard to jurisdictional claims in published maps and institutional affiliations. |
© 2021 by the authors. Licensee MDPI, Basel, Switzerland. This article is an open access article distributed under the terms and conditions of the Creative Commons Attribution (CC BY) license (https://creativecommons.org/licenses/by/4.0/).
Share and Cite
Aizimu, W.; Al-Marashdeh, O.; Hodge, S.; Dewhurst, R.J.; Chen, A.; Zhao, G.; Talukder, S.; Edwards, G.R.; Cheng, L. Estimation of Nitrogen Use Efficiency for Ryegrass-Fed Dairy Cows: Model Development Using Diet- and Animal-Based Proxy Measures. Dairy 2021, 2, 435-451. https://doi.org/10.3390/dairy2030035
Aizimu W, Al-Marashdeh O, Hodge S, Dewhurst RJ, Chen A, Zhao G, Talukder S, Edwards GR, Cheng L. Estimation of Nitrogen Use Efficiency for Ryegrass-Fed Dairy Cows: Model Development Using Diet- and Animal-Based Proxy Measures. Dairy. 2021; 2(3):435-451. https://doi.org/10.3390/dairy2030035
Chicago/Turabian StyleAizimu, Wumaierjiang, Omar Al-Marashdeh, Simon Hodge, Richard J. Dewhurst, Ao Chen, Guangyong Zhao, Saranika Talukder, Grant R. Edwards, and Long Cheng. 2021. "Estimation of Nitrogen Use Efficiency for Ryegrass-Fed Dairy Cows: Model Development Using Diet- and Animal-Based Proxy Measures" Dairy 2, no. 3: 435-451. https://doi.org/10.3390/dairy2030035
APA StyleAizimu, W., Al-Marashdeh, O., Hodge, S., Dewhurst, R. J., Chen, A., Zhao, G., Talukder, S., Edwards, G. R., & Cheng, L. (2021). Estimation of Nitrogen Use Efficiency for Ryegrass-Fed Dairy Cows: Model Development Using Diet- and Animal-Based Proxy Measures. Dairy, 2(3), 435-451. https://doi.org/10.3390/dairy2030035