Next Article in Journal
Challenges and Implications of the COVID-19 Pandemic on Mental Health: A Systematic Review
Next Article in Special Issue
Workplace Violence in Healthcare Settings: Work-Related Predictors of Violence Behaviours
Previous Article in Journal / Special Issue
Biases of Temporal Duration Judgements in Visual and Auditory System
 
 
Please note that, as of 22 March 2024, Psych has been renamed to Psychology International and is now published here.
Article

Falsification of the Sexual Experiences Questionnaire: No Evidence of Systemic Sexual Harassment in Academic STEM

Science Affiliate SLAC National Accelerator Laboratory, 2575 Sand Hill Rd., Menlo Park, CA 94025, USA
Psych 2022, 4(3), 404-434; https://doi.org/10.3390/psych4030034
Submission received: 28 May 2022 / Revised: 12 July 2022 / Accepted: 12 July 2022 / Published: 20 July 2022
(This article belongs to the Special Issue Prominent Papers in Psych  2021–2023!)

Abstract

:
Herein, the socio-psychological narrative of sexual harassment (SH) is critically evaluated. The notion of systemic SH in university departments of science, technology, engineering, and mathematics (STEM) is contradicted by the overwhelming (>90%) career satisfaction among female STEM academics. The Sexual Experiences Questionnaire (SEQ), central to the study of SH, inheres the nominalistic fallacy. SEQ usage deploys subjectivist methodologies, categorical ambiguity, the post hoc ergo propter hoc fallacy, and treats respondents as cyphers. Intercorrelation of SEQ factors reduces response statistics by 42%, while phase-space vector geometry indicates the SEQ does not measure SH. Personality analysis implies that serial abusers dominate the incidence of SH. The widespread notion that 20–25% of female college students suffer violent sexual assault rests on a misreading of published work. The 2016 Campus Climate Survey permits an upper limit estimate that 3.2% of female college students suffer rape at the hands of 4.3% of male student perpetrators, largely accompanied by drugs or alcohol. The 2018 National Academy (NAS) Report on sexual harassment in STEM exhibits negligent scholarship and carelessly generalizing statistics and may itself promote violation of the EEOC legal definition of SH. Despite instances of grievous sex-based abuse, there is no evidence that female STEM academics face systemic sexual harassment. Finally, evolutionary psychology and the social significance of personality provide a scientific understanding of SH.

Graphical Abstract

1. Introduction

Despite more than 40 years of research, sexual harassment still lacks a valid objective definition. In the absence of a causal definition from science, problems cannot be discretely formulated, questions lack a focus, and interpretations of behavior remain ambiguous [1]. This work critically evaluates the methodological reliability of modern sexual harassment (SH) studies. The intent is to open the way to a fully scientific description of sexual harassment: one capable of predicting the incidence of SH. Finding a path forward first requires a searching appraisal of existing methodology. The Sexual Experiences Questionnaire provides the grounds and context for current SH research. The approach from science thus brings the SEQ under critical review herein. The necessarily subsequent definition and clarification of sexual harassment as deduced from scientific theory will be forwarded in a future work.
Sexual harassment is a controversial and painful subject. There is no doubt that sex-based harrying and sexist verbal or physical abuse can be significant problems in professional or social environments nor that grievous personal or career outcomes may result. The legal history of sexual harassment demonstrates that case [2,3,4,5]. Therefore, the importance of distinguishing between the phenomenon and its study cannot be over-emphasized.
In this light, the present work does not concern incidents, outcomes, or harms of sexual harassment but rather is a critical examination of the mode and means of its study. Nothing herein disputes the fact of sex-based harrying nor should be seen to gainsay it. Rather, methodology, reproducibility, and reliability of study come under scrutiny, i.e., the objective validity of current academic SH scholarship. This absolutely central distinction should be kept in view and is recalled in what follows.
In 2018, the National Academy of Sciences (NAS) released the paradigmatic report, “Sexual Harassment of Women: Climate, Culture, and Consequences in Academic Sciences, Engineering, and Medicine” (hereinafter the NAS Report) [6]. The NAS Report presents both the state of the art of SH studies and the professional consensus view of sexual harassment occurrence within academic departments of science, technology, engineering, and mathematics (STEM). The authors of the NAS Report represent a body of leading scholars. The combination of being comprehensive in subject and advanced in scholarship recommends the NAS Report as a vehicle for the needed critical evaluation of the methodological validity of sexual harassment studies. That evaluation is presented herein.
The organization of this paper is as follows: Results Section 2.1 outlines the context provided by the NAS Report. Section 2.2 critically assesses the qualitative RTI survey of academic SH that opens the NAS Report. Do the recounted instances of sexual harassment have systemic relevance? Section 2.3 describes the structure of the Cultivating Learning and Safe Environments (CLASE) program that surveyed the behavioral and experiential parameters of campus life. The Sexual Experiences Questionnaire (SEQ), which provides the sole diagnostic support for the notion of systemic sexual harassment in academic STEM, is then critically evaluated in Section 2.4. Section 2.5 introduces the neglected consequence of SEQ factor correlation and its profound impact on reliability. Also described is the unrecognized abuse of statistical inference that plagues the entire field. Finally, Section 2.6 offers a way forward through evolutionary psychology and outlines entry into a fully scientific understanding of SH. Discussion Section 3 applies the results to a diagnosis of scholarship including a re-evaluation of the rate of campus rape. The study finishes by noting the promise of a scientific understanding of SH through the social significance of personality within the context of evolutionary psychology.
Methods of data manipulation are detailed in the Supplementary Material. The year 2017 statistics of job satisfaction in academic STEM evaluated herein are available as a separate Supplementary Information Excel file.

2. Results

2.1. NAS Methodology, Data, and Literature

The two modules of the NAS Report present the state-of-the-art study of SH. The first module consists of a qualitative survey of sexual harassment experienced by female STEM academics, conducted by RTI International, and constitutes Appendix C of the NAS Report. The results were also reported separately [7].
The second module employed the Sexual Experiences Questionnaire (SEQ) to survey the sexualized experiences among the staff and students at the campuses of the University of Texas system, as part of the Cultivating Learning and Safe Environments (CLASE) program under the Administrator-Researcher Campus Climate Collaborative (ARC3). Analogous survey results from Pennsylvania State University were included among the summary statistics. The validity of these two research vehicles, one qualitative the other quantitative, are next evaluated.

2.2. The RTI Survey

RTI used scientific and professional listservs to recruit participants throughout the US. The number of online survey hits is not given, nor is the number of female STEM professionals who may have viewed the survey and elected to either participate or not. A total of 340 female STEM professionals filled out an online survey questionnaire. The judgment of having been sexually harassed was based upon their self-reported experiences. There is no fractional response metric qualifying the 340 respondents, the NAS Report does not provide the RTI survey questions, and the criteria of inclusion are not available for appraisal.
Of the 340 respondents, 65 were deemed to have suffered sufficient negative personal and career sequelae to trigger focused review. Forty professionals were interviewed for inclusion. Within the NAS Report, Appendix C recounts 82 personal stories culled from the 40 interviews [7].

2.2.1. Survey Overview

The RTI survey is not quantitatively assessed here in part because it is anecdotal. Personal and professional difficulties stemming from sexual harassment are recounted. Nevertheless, their larger significance requires the implied context of systemic bigotry. That context is the province of the CLASE survey.
Eighty-two personal stories are recounted within Appendix C of the NAS Report deriving from 10 generic sorts of faculty members. Exemplifying the data are the life experiences from twenty-one engineering faculty occupying four categories of academic standing. Two are labeled Professor of Engineering, two Associate Professor, fourteen Assistant Professor, and three non-tenure-track. These labels exhaust the specification. Anonymity is an imperative in such surveys. Nevertheless, no unique label (e.g., faculty member A-1) assigns each response to a given participant. Therefore, it is unknown whether any one description is a full or partial experience of a single individual.

2.2.2. Evidence from Workplace Job Satisfaction

Workplace sexual harassment is widely reported to correlate strongly with loss of job satisfaction [8,9,10,11,12,13,14,15]. Workplace sexual harassment at virtually any level of experience above zero is averred to produce significant and measurable reductions in health, psychological well-being, and especially in job satisfaction among women [12,16,17,18]. The Oxford Research Encyclopedia reports that, “Well-documented workplace effects of sexual harassment include reduced job satisfaction, organizational commitment, and productivity, and increased job stress, turnover, withdrawal, and conflict” [15]. If the sexual harassment reported within the RTI survey is systemic, low job satisfaction must be widespread. These cognates are next tested for STEM academics.
The U.S. Bureau of Labor Statistics reports that in 2014 there were 237,750 STEM faculty in the USA [19]. By the end of 2017, women made up about 37.8% of all academic STEM faculty, totaling 120,650 individuals [20]. Figure 1a shows that from 1997 to 2010, both female and male STEM faculty reported themselves to be 90–95% somewhat to very satisfied with their employment [21]. More recent data extended this equivalence to 2017 (Figure 1b, Supplementary Information Excel file). A near constant, very high level of job satisfaction among female STEM academics is thus in evidence across 20 years.
It is unknown how many among these 120,650 female STEM faculty members encountered the RTI online survey. However, the 340 who responded conservatively account for about 3.2% of unsatisfied female STEM faculty in 2017, and about 0.3% of all female STEM faculty. The 65 respondents deemed by RTI staff to have suffered sufficiently serious sexual harassment to merit follow-up represent about 0.6% of dissatisfied female STEM faculty and 0.05% of all female STEM faculty.
Any level of exposure to workplace sexual harassment has been inferred to have a measurable harmful outcome [12,16,17,22]. Therefore, systemic sexual harassment should be revealed in the fraction of female STEM academics who remain satisfied with their job, which should be observably smaller than the fraction satisfied of their male colleagues. Inspection of Figure 1b indeed shows a lower incidence of satisfaction among female academics in all fields except the physical and related sciences. However, all differences are within the ±1σ standard error.
The same statistics allow an upper limit estimate of the fraction of sexually harassed female STEM academics. For the sake of this estimate, assume that male and female academics face homologous career pressures and stresses with the exception that female academics also, and uniquely, face sexual harassment. Assume further a female–male equivalence of psychological and health responses to the standard career stresses, other than sexual harassment. With these two reasonable assumptions, excess female job dissatisfaction should reflect the unique impact of workplace sexual harassment upon female STEM academics. Thus, a (female minus male) fractional difference in job satisfaction should be negative.
Figure 2 shows the results of this analysis. Figure 2a displays the full inventory of the 2017 “very satisfied”, “somewhat satisfied”, “somewhat dissatisfied”, and “very dissatisfied” NCSES job satisfaction categories among academic STEM faculty. Figure 2b focuses on levels of dissatisfaction, while Figure 2c details (female minus male) difference fractions in STEM job dissatisfaction.
From Figure 2a, the fractions of very satisfied male faculty were somewhat larger than female reports in every STEM discipline, except in the physical sciences and engineering. In these latter two, the percentages of very satisfied female and male faculty are within one standard deviation (50.2 ± 2.3 vs. 53.0 ± 1.6 and 48.3 ± 3.5 vs. 51.4 ± 1.8, respectively). The several inequivalent female and male “very satisfied” cohorts are nearly equalized by offsetting differences between the “somewhat satisfied”. When the two categories are combined (Figure 1), the 2017 fractions of female or male STEM faculty who are overall satisfied with their careers are the same within a standard deviation everywhere.
Figure 2b focuses on the relatively small fractions of STEM faculty who are somewhat dissatisfied or very dissatisfied with their careers. The combination of somewhat and very dissatisfied shows that females are less dissatisfied within the physical sciences (6.7%) and mathematics and computer sciences (7.1%) than in other STEM divisions. Overall dissatisfaction among female STEM faculty is greatest in the life sciences (9.3%) and the social sciences (9.9%).
Figure 2c displays the (female minus male) difference percentages in job dissatisfaction, including uncertainty whiskers. These differences can be used to estimate an upper limit frequency of sexual harassment endured by female STEM faculty.
From Figure 2c, an approximately 2% excess of female STEM faculty, relative to male faculty, are somewhat dissatisfied with their careers. An exception is within the physical sciences, where the somewhat dissatisfied difference among female faculty is not statistically different from zero. Among the very dissatisfied physical scientists, only the differential percentage of male faculty is statistically non-zero (−1.4 ± 0.7%), with the negative excess indicating that more male faculty members than female are very dissatisfied.
Were the extremes of harassment narrated in the RTI survey a systemic occurrence in STEM fields, one should observe a significant excess of female faculty among the very dissatisfied. However, the small excesses of very dissatisfied female faculty in computer science and mathematics (0.3 ± 0.5%) and in the life sciences (0.2 ± 0.6%) do not rise to significance and are not consistent with a normative or widely experienced culture of harassment.
Likewise, the small excesses of somewhat dissatisfied female academics in the life sciences (1.9 ± 1.2%), the social sciences (1.8 ± 1%), and in engineering (2.1 ± 2.1%) do not speak to large fractions of female STEM academics subject to life-impacting levels of sexual harassment. The sum total of female STEM academics who may have been harassed with sufficient frequency or severity to negatively impact their career satisfaction averages to about 1.9 ± 1.5%, except in the physical sciences and computer sciences and mathematics, where the fractions are approximately zero.

2.2.3. Trends

With respect to prospects, a 2004–2005 National Science Foundation (NSF) survey of STEM departmental job interviews and hiring statistics (Table 1) indicated that female applicants were invited to interviews and subsequently hired in excess of their proportion in the candidate pool [23]. The NSF authors noted (page 5) that, “The findings on academic hiring suggest that many women fared well in the hiring process at Research I institutions, which contradicts some commonly held perceptions of research-intensive universities. If women applied for positions at Research I institutions, they had a better chance of being interviewed and receiving offers than male job candidates had.”

2.3. The CLASE Survey

Focus turns now to the methodology of SH studies. In 2015, the University of Texas (UT) system conducted the Cultivating Learning and Safe Environments (CLASE) survey within the Administrator-Researcher Campus Climate Collaborative (ARC3) program. The comprehensive CLASE study section of the 2018 NAS Report on sexual harassment in academic departments of science, technology, engineering, and medicine (hereinafter NAS Report) provides an in-depth exposition of the field [6].
The ARC3 method and results are described in Appendix D of the NAS Report. According to the CLASE Research Methods Report, the study included 28,270 students, of whom 26,417 were at university and 1853 attended health institutions. The survey involved 13 of the 14 UT campuses. The UT CLASE/ARC3 sexual harassment survey data were collected using the Sexual Experiences Questionnaire (SEQ) developed by Louise Fitzgerald and her collaborators and colleagues [22,24,25,26]. The SEQ is widely accepted as the state-of-the-art instrument to assess the incidence of sexual harassment [14,15,27,28,29]. The SEQ results were centrally diagnostic to the conclusions of the NAS Report. Thus, a critical evaluation of sexual harassment studies should test the accuracy and utility of the SEQ. This test, in turn, is herein accomplished through an analytical appraisal of the data and conclusions of the 2018 NAS Report.

2.4. The Sexual Experiences Questionnaire (SEQ)

In what follows, the psychological definition of sexual harassment is taken as standard, namely, “offensive, unwanted behavior that is either sexual in nature, or targets the victim because of her gender” [30].

2.4.1. The SEQ Criterion Conundrum

The 1988 and 1995 versions of the SEQ included a criterion question (1988) or statement (1995) in which a respondent indicated the positive perception of having been sexually harassed. An affirmative criterion statement was originally considered to validate the fact of sexual harassment [22,25]. Significantly, those answering the criterion question positively have always been a small fraction of the respondents reporting SEQ experiences. For example, Schneider and associates reported a study of 886 women recruited from a private organization and a large university [12], however, see Appendix A.1. Of these, 747 (84%) were motivated to participate, 489 (65% of respondents) reported one or more SEQ experiences, 311 (42% of participants) completed the criterion section, and 82 (17% of those reporting SEQ experiences) indicated having been sexually harassed.
The disparity between counts of SEQ experiences and self-judgments of harassment has been a matter of some concern to researchers [12,16,22,31,32,33]. As described below, the discretion of the researcher has latterly come to find sexual harassment in any level of SEQ experiences.

2.4.2. SEQ Experiences, Stress, and Personality

A cautionary discursion is presented here to set the context for Section 2.4.3 below. In all cohort-response sexual harassment studies, the participants are implicitly treated as identical “shmoo” units [34]. Respondents are analytically undifferentiated, and their individual responses are combined with equal weights. This approach inheres the atomistic fallacy, in which all units are assumed to be indistinguishable [35]. This imposed group homogeneity ignores the variability of individuals and of individual response [36]. Individual women have individual personalities and will respond differently to similar sexualized experiences [37,38]. Given the homologous experience, those women with a more or less resilient personality will respond with less or more stress, respectively [39,40,41]. Nevertheless, no attention is paid in SEQ studies to the possible impact of personality on the distribution or intensity of responses. If personality is not explicitly included in SH studies, personality-based stress responses will be conflated with harassment intensity. Paraphrasing Robertson and Feick, 2018, one might call this the Psychological Fallacy in that the contextual effects of personality were not incorporated into the individual-level analysis. Entering psychological states can influence the intensity and possibly the direction of response to a later challenge [42,43,44]. In group-level SH studies, causality becomes ambiguous when SEQ experiences are not conditioned by the personality and psychological state of cohort members. It appears to have escaped notice that the inherent equivocality of a judgment is hidden when contemporaneous causality is attached to psychological states that themselves may well be rooted in the past.

2.4.3. The SEQ and Subjective Methodological Choices

Schneider et al., 1997 [12], and Magley et al., 1999 [16], reported separate analyses of two identical participant cohorts and SEQ scores of working women. Their study goal was to test whether negative outcomes from SEQ experiences were independent of a positive answer to the criterion question “Have you been sexually harassed?”, that is, whether a sexual harassment outcome is independent of the perception of having been sexually harassed. Identical respondent cohorts allow a comparative study in which outcome differences reflect methodology.
One study group consisted of women working in a corporate environment (N = 447, 449, resp.), and the other included university faculty and staff (N = 300). Magley and associates added a third cohort of women working in agribusiness (N = 419), which is not further considered here (but see Appendix A.1). In both studies, the cohorts were divided into groups of low, moderate, or high frequencies of SEQ experiences. Discriminant functional analysis was then used to regress the SEQ responses against job satisfaction and psychological harm profiles.
However, the choice of distribution into low, moderate, and high cohort SEQ response frequencies varied between the two studies. Schneider et al. divided responses uniformly about the mean into statistically reasonable 16%, (low), 68% (moderate), and 16% (high) segments of the population, respectively (Figure 3a). In Magley et al., 1999 [16], the low, moderate, and high-frequency cohorts were asymmetric about the mean, consisting of 50%, 34%, and 16% of the population, respectively (Figure 3b). Thus, low, moderate, and high SEQ response frequencies are incommensurate in two studies that assessed identical groups and SEQ data sets.
In Schneider et al., 1997 [12], discriminant functional analysis extracted 388 or 289 women for SEQ evaluation from Sample 1 or Sample 2, respectively, while Magley et al., 1999 [16], obtained an equivalent 375 or 290 women in their discriminant analysis of the identical data. In the Schneider et al. study, the discriminant function accounted for 87% or 84% of the variance in Sample 1 or Sample 2 but 67% or 69%, respectively, in Magley et al [16]. It thus appears that the more rationally divided cohort fractions of Schneider et al. [12] yielded a more inclusive analysis.
In the Schneider et al., 1997 [12], study, a lessening of job satisfaction or of psychological health did not cleanly correlate with the statistically symmetric populations of low, moderate, and high SEQ frequency. However, the asymmetric SEQ frequency distribution of Magley et al., 1999 [16], correlated with the outcomes, that is, correlations emerged with a post-hoc revision of method. Figure 4 shows that the alternative frequency choices in the two identical study groups produced substantively different fractions of women represented to have been harassed at low, moderate, or high frequencies. Among the seven equivalent discriminant function correlations in job satisfaction and psychological stress, only those for co-worker or supervisor satisfaction pairwise agreed across these two studies.
Thus, despite the fact of identical participant populations, identical SEQ data sets, comparable discriminant cohorts, and equivalent discriminant functional analyses, the two studies produced markedly disparate outcomes. Such significantly discrepant results following from identical data and numerical methodologies imply subjective procedural choices and thus equivocal outcomes (see Section 3 for further discussion).
Subsequently, Munson and associates employed the asymmetric groupings of Magley et al., 1999 [16], to likewise address whether SEQ experiences accrued equivalently negative consequences independent of self-labeling. Their study included female (N = 22,305) and male (N = 5905) military personnel who completed the 1995 Department of Defense Sexual Harassment Survey, which employed the Department of Defense version of the SEQ (SEQ-DoD) [17,45,46]. One comparative outcome of immediate interest was that military females averaged about half the number of SEQ experiences, 5.2 ± 5.2 per 12 months, than females employed in a public utility or in an agribusiness (22.9 ± 5.7 or 23.8 ± 6.4, respectively, per 24 months) [16,17]. Their rate also inverts the relative military–civilian rates reported by Ilies and associates (cf. Section S6.1.2 in the Supplementary Materials) [31]. The equivalent rates for female academics were not reported.
Figure 5 reveals that the impact of SEQ experiences among military females was modest relative to the condition of no SEQ experiences. For example, the change of mean scores in psychological well-being or health satisfaction over the full range of no SEQ experiences through to high SEQ scores is (17 ± 14%) or (10 ± 10%), respectively. In each outcome series, the variability of individual responses (95% whiskers) is much larger than the mean trend across the no SEQ to high SEQ range. Even at the high end of the range, significant fractions of respondents were either lightly or not measurably affected by SEQ experiences. The implication of these significant outcome spreads within each group is that differences of personality produce differing outcomes in the face of equivalent challenges. Homologous statistics are not available in Schneider et al., 1997 [12], or Magley et al., 1999 [16], disallowing a direct comparison. Similar considerations apply to the SEQ experience impacts of the male military personnel, shown in Figure S1 of the Supplementary Material.
Figure 6 compares the combined discriminant group centroids of Magley et al., 1999 [16], (N = 878) with the first function centroids of Munson et al., 2001 [17] (N = 22,305), along with their estimated response group variability (cf. Section S2 in the Supplementary Material, Assessment of Discriminant Group Centroids, for calculation of group variability). The large study populations minimize possible sample size artifacts. The complete comparative analysis is provided in Section S2 of the Supplementary Material.
The complete inventories of group centroids are shown in Figures S2 and S3 of the Supplementary Material. All the samples showed negative outcomes independent of self-labeling, but the group centroid label/no-label migrations were not consistent across group frequencies. For example, high frequency was less negative with labeling in Sample 1 but more negative in Sample 3. Further, significant overlap of response was found among the groups (Figure 6). The “Combined Sample” low, moderate, and high groups form a continuous set of response outcomes all the way through to no SEQ experiences. Likewise, the moderate and high outcome groups of Munson and associates are confluent in the “Women First Function”. Group confluence is also present in individual discriminant outcomes (cf. Figures S2 and S3 of the Supplementary Material).
Congruence of the Magley–Munson studies was further examined by normalizing the variable outcomes (see Table S1 of the Supplementary Material). For this comparison, the response variable means were divided by the SEQ experience mean (Section S3 in the Supplementary Material). Normalization permits comparing the impact per SEQ experience on members of independent study groups. In the Magley and Munson studies, the impacts per SEQ experience are so dissimilar that it is difficult to surmise that they reflect instrumental equivalence, i.e., that homologous experiences were measured in each SEQ study (Figure S4 in the Supplementary Material). The 50-34-16 model appears to fail Freedman’s test of causal validity, namely “Does [the model] predict the results of interventions?” [47]. From Figure S4, the answer is “evidently not”.
However, the group centroids of Magley et al. and Munson et al. showed a 0.95 regression correlation (Figure S5 in the Supplementary Material), which may be an artifact of the identically asymmetrical groups. This correlation is nevertheless mooted by the wide variability in outcome over and above the problem of centroid meaning itself. The mean group outcomes of all three SEQ-experience impact studies are presented in Figure S6 of the Supplementary Material, showing that group outcomes are both model-dependent given identical cohorts and cohort-dependent given identical models.
The discriminant analyses of SEQ sequelae have been interpreted to mean that any SEQ experience at all resulted in psychological stress, no matter whether a woman construed her experience as sexual harassment or not [12,16]. Psychological stress was taken as the evidentiary sequel of sexual harassment. The more SEQ experiences, the greater the resulting stress. One might analogize this construct as the linear no-threshold model of sexual harassment, in that there is no lower limit where exposure is non-toxic [48,49,50]. In these studies, investigators have imputed standing to disregard the respondents’ criterion judgments and to label any SEQ experience as ipso facto sexual harassment [12,16,32,33]. The authors of the 2018 NAS Report followed this lead (cf. pp. 31–34 and especially p. 59). The criterion answer becomes irrelevant, despite its prior position of critical attestation [22,25]. To ignore the criterion label is to separate the respondents from the meaning of their own experiences and to leave the meaning to the discretion of the researcher.
Summarizing Section 2.4.3, discriminant analytical results are so variable as to not associate with causality. Figure 6 and Supplementary Material Figures S2–S6 indicate that the impact of SEQ experiences is poorly resolved. Definitive conclusions regarding an effect of labeling are obscured in very wide outcome variabilities and in unreliable group meaning. The effect of an SEQ experience or of its labeling remains unpredictable for any woman or group of women. Tests for possible spurious correlations were not included in study designs. The alternative models used to assess identical participant groups and identical SEQ data sets, or the identical methodologies applied to large independent survey populations, produced so significantly discrepant results as to imply subjective methodological choices that must yield non-definitive outcomes. As a result, study validity and conclusions are more ambiguous than merely equivocal. Published interpretations of SEQ surveys posit that SEQ behaviors ipso facto definitively constitute sexual harassment. With the analysis above, the validity and reliability of the SEQ are now in mortal question and are taken up in Section 2.4.4, ff.

2.4.4. The SEQ as a Measure of Sexual Harassment

Gutek and associates have severely criticized the psychometric standing of the SEQ [1,51]. The criticisms are comprehensive and detailed, calling the entire meaning and use of the SEQ into question. Modern studies of SH, including the three studies examined above as well as the NAS Report and the CLASE study, rely on the SEQ for their entire freight of meaning. Despite this, very few modern studies of SH indicate any awareness of the challenge of Gutek and her associates. Most neither cite the paper nor address its criticisms.
As of April 2022, the Web of Knowledge listed 49 citations of Gutek et al., 2004 [1], and two of Gutek, 2007 [51], while Google Scholar listed 104 and 2, respectively. Examination revealed none of them to dispute the critical analysis of the SEQ expressed in Gutek et al., 2004 [1], while three tended to agree with the criticisms [52,53,54]. However, Magley and Shupe incongruously cited Gutek et al., 2004 [1], to support the SEQ-DoD, which Gutek and associates had explicitly criticized [32]. Prof. Vicki Magley is an SEQ researcher and a member of the NAS Committee on The Impacts of Sexual Harassment in Academia.
Further, in their laudatory review of the SEQ, Cortina and Berdahl did not reveal the challenge of Gutek et al., 2004 [1], even though they cited it and evidently knew of it [27]. The apparently uniform negligence levied toward Gutek et al., 2004 [1], by those employing or discussing the SEQ is a serious professional failure.

2.4.5. On Psychometry

Psychometric soundness refers to the presence of both reliability and validity in a survey instrument. Reliability is reported as consistent results across test–retest repetitions. Validity is factual measurement of the target phenomenon [1]. In a scientific context, reliability equates to precision and validity to accuracy. Only accuracy permits a scientifically defensible conclusion.
Users generally represent the SEQ as psychometrically sound, almost invariably citing Arvey and Cavenaugh, 1995 [16,17,33,55,56]. However, Gutek and associates noted that Arvey and Cavanaugh did not independently evaluate the psychometric soundness of the SEQ but simply summarized work in [22] and judged the SEQ as “particularly sound” [57]. In 2018, Fitzgerald and Cortina identified a 2002 version of the SEQ to be the most recent instrument. However, their judgment of the psychometric soundness of that version turned only on prior work [14,25,33,58]. The test–retest precision of the SEQ has never advanced beyond the small (N = 46) 1988 experiment with undergraduate females [22]. The validity (accuracy) of the SEQ is evaluated in Section 2.4.7.

2.4.6. Major Criticisms by Gutek and Associates

Central elements included that SEQ domains are inconsistent, unstandardized, and continuously evolving. Although it has been claimed that the SEQ consists of unitary constructs that, “can be assessed through different specific items over time” [52], Gutek and associates noted that different versions of the SEQ had never been tested for cross-version consistency of response. A Web-of-Knowledge search did not turn up any such studies since the SEQ was introduced in 1988 [22]. Thus, the non-standardization criticism remains valid and implies that response data sets of various versions of the SEQ may not support comparative analysis [1]. This inference is supported by the analyses in Section 2.4.1, Section 2.4.2 and Section 2.4.3 above.
Further criticisms included that the causal direction of SEQ responses is ambiguous and may be inferentially tendentious. That is, SEQ respondents may conclude that their experiences imply workplace tolerance of harassment. However, SEQ researchers typically decide the reverse, namely that workplace tolerance of harassment induces the SEQ experiences. For the SEQ respondents, episodes may imply the environment. For the SEQ researchers, in contrast, environment implies the episodes. SEQ scores do not uniquely reveal or determine the factual direction of causality.
Critical lapses of the SEQ described in [1] include:
  • only modest reliability and validity.
  • over-reporting the prevalence of sexual harassment.
  • over-estimating the gap between the experiences of harassment and the labeling of harassment.
  • under-estimating the rate of sexual harassment reporting.
  • distorting the type and distribution of responses to harassment.
  • overly broad definitions of sexual harassment, which distort findings.
  • inadequate test-retest metrics.
Gutek and associates concluded that, “the SEQ is a flawed instrument and that its positive features have been greatly exaggerated. It does not seem to measure anyone’s definition of sexual harassment, including that of its own developers. … Perhaps a better description of the SEQ is that it assesses non-work-related behavior that would probably be considered inappropriate if it is unwelcome. We believe it is a mistake to consider the SEQ (in its various incarnations) a measure of sexual harassment” [1].
These mortally serious criticisms of the SEQ are central to research but have never been constructively addressed by any subsequent researcher and are ubiquitously ignored by the authors of the paradigmatic NAS Report and of the CLASE study.

2.4.7. The SEQ Factors Are Correlated

The internal factor sections of the SEQ were initially represented as expressing the five separate dimensions of harassment originally extracted by Till [22,59]. Later work reduced the SEQ sexual experiences measure to three factors, namely gender harassment, unwanted sexual attention, and sexual coercion [25,26]. Independent factors imply orthogonal constructs. However, correlation among the SEQ factors is reported to be 0.74 or 0.70 [16,25]. This high intercorrelation of factors has led Fitzgerald and her collaborators to a major revision of the meaning of the SEQ. High cross-factor correlation now, “allows one to view the instrument as measuring a single dominant dimension of sexual harassment, …” [58].
The factors are stated to be first-order representations of different behaviors, while sexual harassment itself is manifest as a single second-order general factor. The admixture of first-order factors subsumed within a single second-order factor is represented as a “hierarchical model [that] provides [a] better fit to SEQ-DoD data than a single-factor model.” The better fit was not evaluated for the impact of any increased degrees of freedom within the new model [47,60]. Nevertheless, all the factors are now said to measure a single dimension; despite that, the SEQ was initially given to measure five separate dimensions but later only three [22,25]. The new second-order dimension is not axially monosemous but instead extends through a hierarchy of meanings. The single dimension, in other words, is multidimensional. This seems to be a case of having one’s unidimensional cake and eating it n-spatially too.
The NAS Report faithfully followed the SEQ categories in defining sexual harassment as gender harassment, unwanted sexual attention, and sexual coercion (pp. 25–28, 48). In light of the highly correlated factors and following from the critical content of Section 2.4.1, Section 2.4.2, Section 2.4.3, Section 2.4.4, Section 2.4.5, Section 2.4.6 and Section 2.4.7 above, the findings within the CLASE survey and the NAS Report are revealed as ambiguous. Section 2.5.1 and Section 2.5.2 below present the fatal consequences to the SEQ, as well as to the NAS Report, that follow from factor correlation.

2.5. Correlation and the Meaning of SEQ Factors

The analysis of the SEQ now turns to the consequences of inter-factor correlation. The NAS Report inaccurately cited Ilies and associates to aver that 58% of academic females are sexually harassed (cfSection S6.1.2 in the Supplementary Material) [31]. That incidence rate will be of focus here.

2.5.1. Statistical Independence

Correlation reduces the number of statistically independent points [61,62]. An upper limit for an effective sample size, Ne, is given by
Ne = N0 × [1/(1 + r)]
where “N0” is the number of correlated points in the data set, and “r” is their correlation coefficient. When there are more than two dimensions of correlated data, the denominator of Equation (1) can be (1 + 2r), but as the dimensionality of SH evidently remains entirely unknown (see Section 2.5.2 below), that possibility is set aside here [62].
Turning to the incidence of SEQ experiences in the academy, the average factor correlation r = 0.72 requires a correction to find the fraction representing statistically independent incidents of SEQ-like behavior. SEQ factor correlation is neither discussed nor considered in the paradigmatic NAS Report.
Applying Equation (1) to the 23 facets (r = 0.72) in the most recent SEQ version [58], the number of statistically independent SEQ experiences is Ne = 23 × [1/(1 + 0.72)] = 13. The final 13 factors must be mutually orthogonal or nearly so. However, the manner in which the 23 facets are to be modified and integrated is obscure. Whether the final orthogonal set of SEQ-type experiences would indeed measure SH is equally obscure.
Turning to the fraction of academic STEM females reporting SEQ experiences, approximately 1 − (1/1.72) = 0.42 fraction of the SEQ facets will disappear following a successful orthogonalization. The remaining 0.58 fraction will be modified in some unknown way. Reduction of the number of facets and the anticipated change in their substantive content is likely to alter the fraction of respondents reporting SEQ-type experiences. Although that fraction of STEM females encountering the fewer independent experiences is presently impossible to know, an estimate can be made by applying Equation (1) to the 58% of academic STEM females (N = 12,005) reported to have had SEQ-type experiences [31]. In this case, the fraction of females encountering independent and orthogonal SEQ experiences is estimated as Ne = [0.58 × [1/(1 + 0.72)] = 0.34.
That is, statistically independent SEQ-type experiences are estimated to accrue to 34% of female STEM academics, rather than 58%. SEQ experience fractions are consistently reported without correction for the high factor correlation. Going through the NAS Report, for example, Figure D-1 (cf. Appendix D, p. 278 of the NAS Report) reports the “Faculty/staff sexual harassment incidence for female students by student major (UT Data).” Therein, the student percentages reporting SEQ experiences are 22% of non-STEM, 20% of science, 27% of engineering, and 47% of medicine. Figure 7 shows these percentages corrected by the 1/(1 + r) correlation factor (0.58), which become 13%, 12%, 16%, and 27%, respectively. All the SEQ experience fractions, in the NAS Report and elsewhere, should be likewise corrected.
This corrected SEQ fraction can be analyzed further. As displayed in Figure 1, about 92% of female STEM faculty were somewhat to very satisfied with their careers in 2010–2017, leaving 8% somewhat to very unsatisfied. In comparison, in the SEQ survey of Ilies and associates, 16% of female academics reported themselves to have been sexually harassed [31]. Adjusting the 16% harassed of Ilies by the 8% dissatisfied of the NAS Report, 8% (half) of the Ilies 16% did not find their harassment to be serious enough to negate their sense of career satisfaction (cf. Figure 2 and especially Figure 2c).

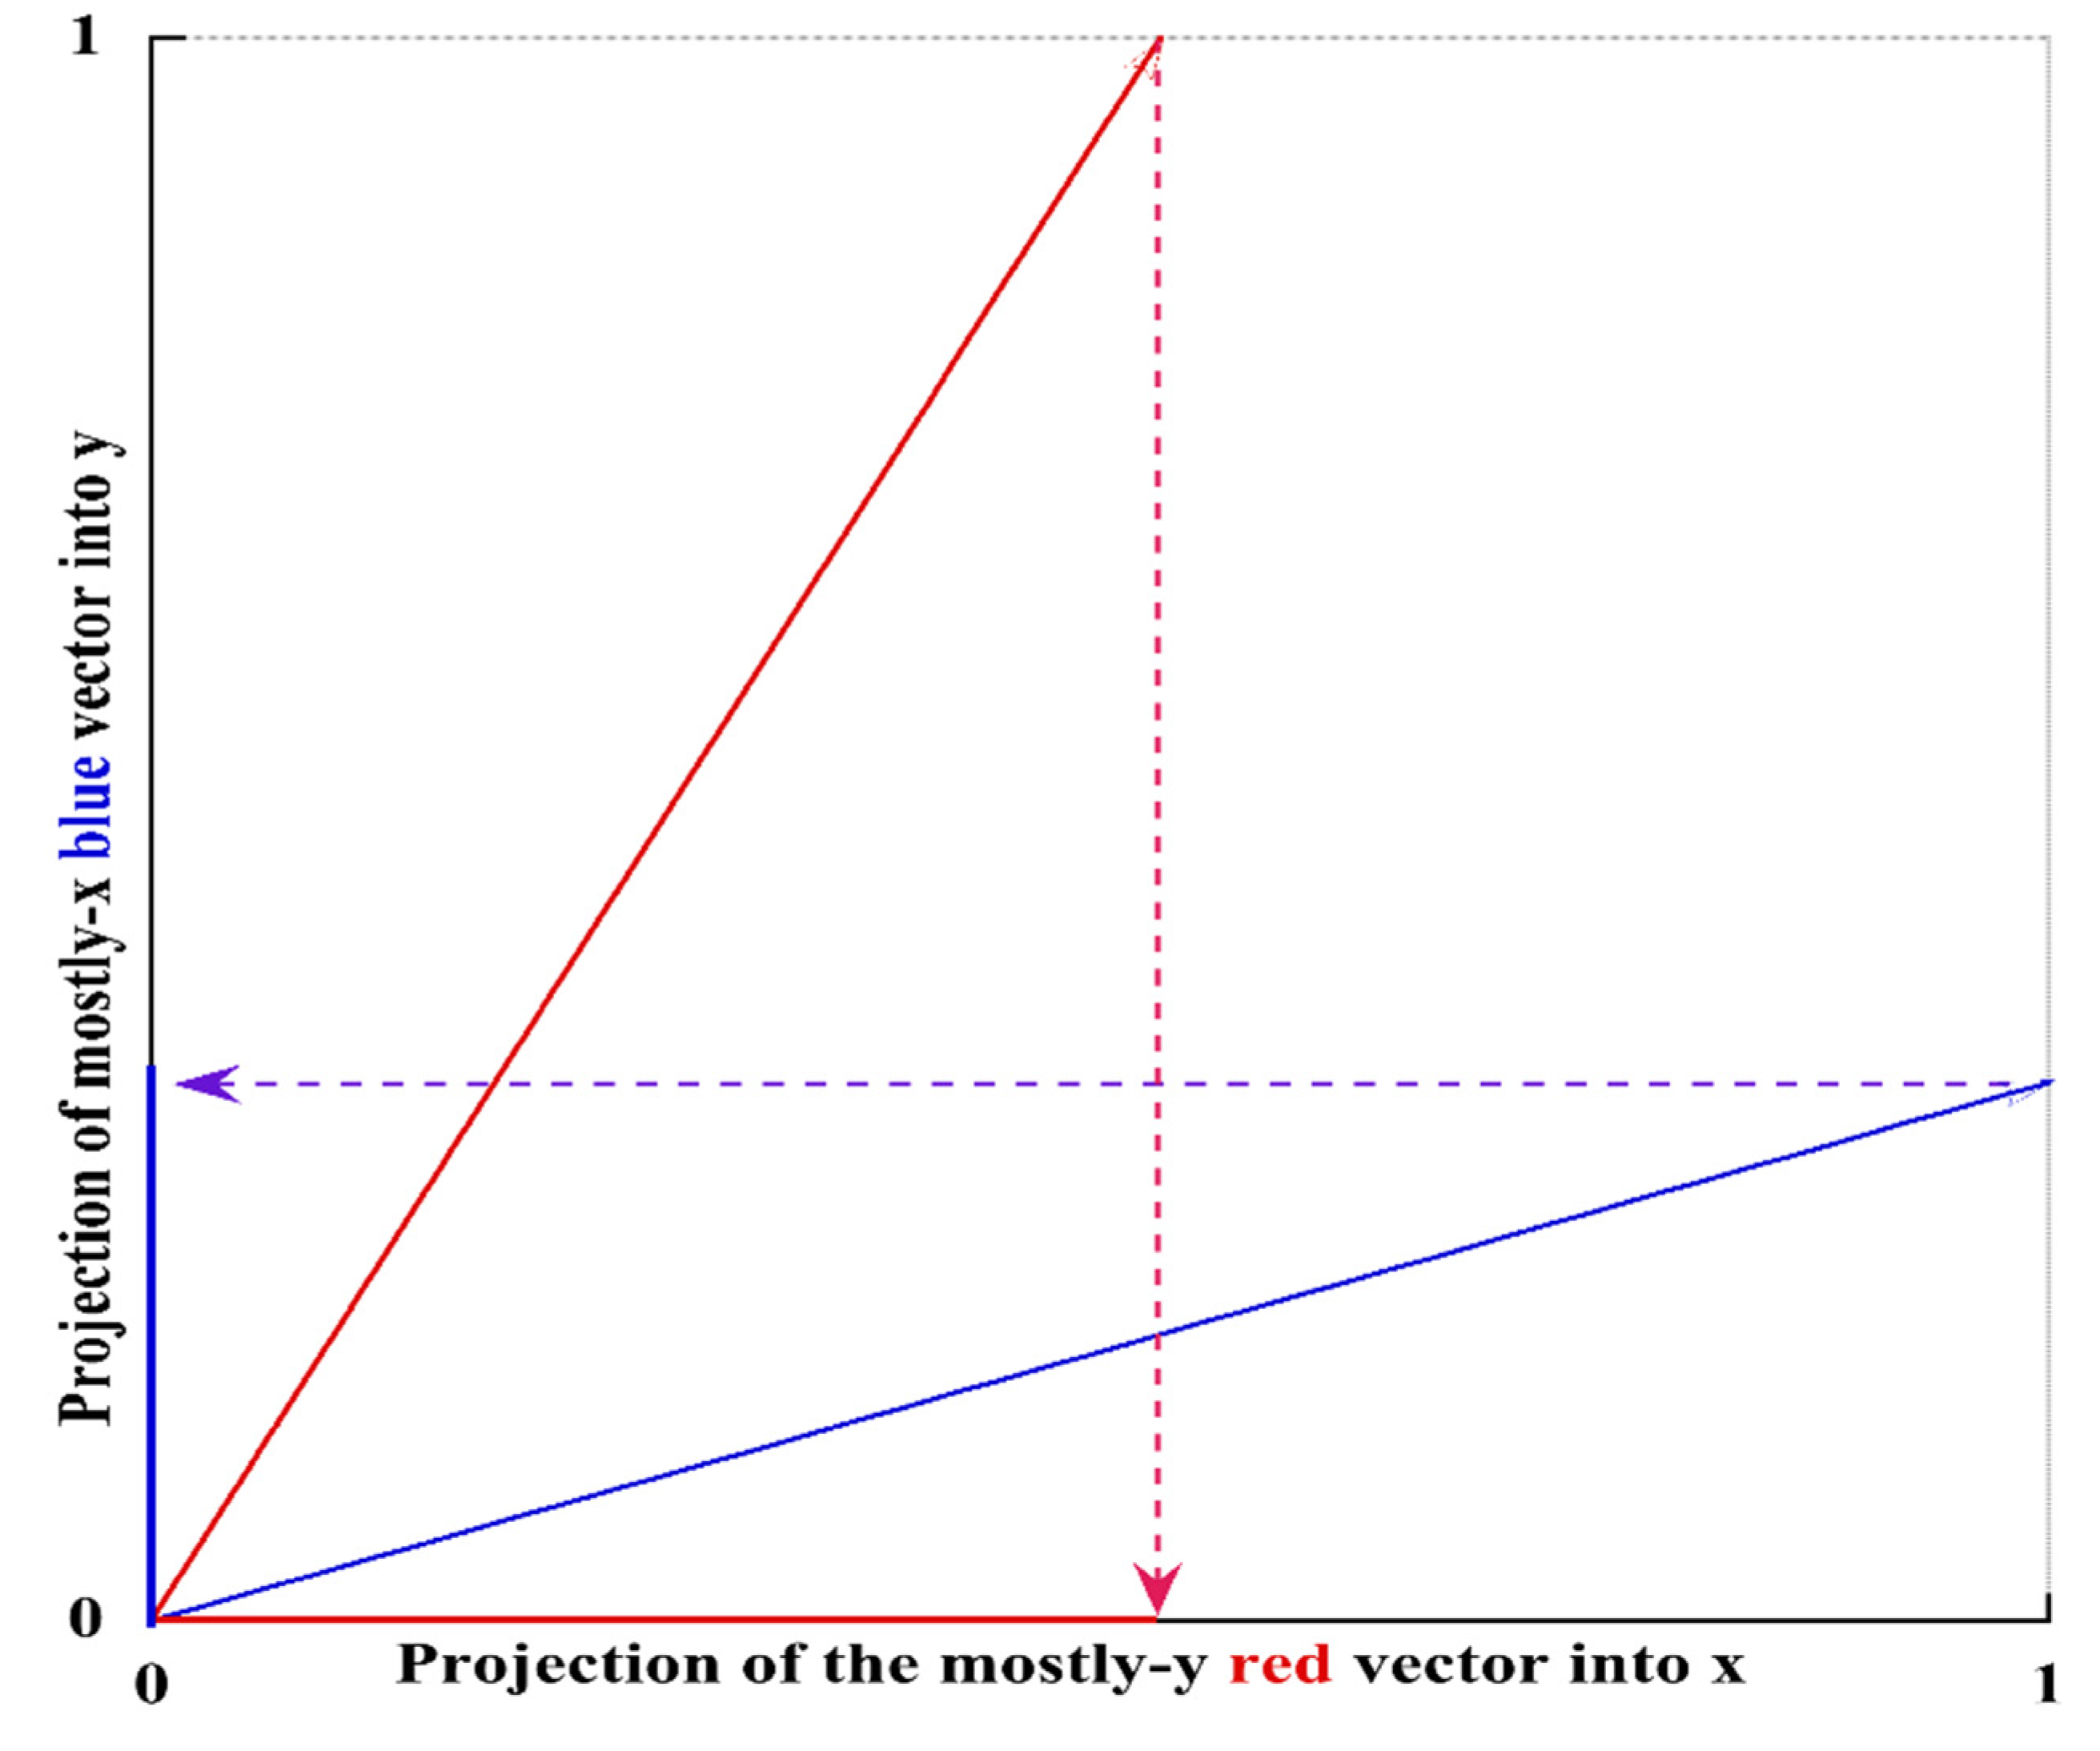
2.5.2. Correlation Geometry and the Absence of Meaning

Correlational analysis can be taken further. The correlation coefficient is the cosine of the phase-space angle between data vectors [63]. The 0.72 average SEQ factor correlation yields the phase-space angle cos−1(0.72) = 44° between the correlated SEQ data vectors. This 44° phase angle means that all the measured SEQ factors have significant projections onto all the orthogonal axes defining the data phase-space. Figure 8 provides a two-dimensional illustration of this condition.
The orthogonal phase-space axes are not known to be the SEQ experience categories but remain unidentified. The number of orthogonal axes—the correct dimensionality of the experiential phase-space—and the objective identities of the axes remain entirely undefined. Identification awaits a monosemous predictively competent, and thus falsifiable, psychological theory of SH. The fallback notion that the SEQ is hierarchically one-dimensional (Section 2.4.7) is thus analytically falsified [58]. The 44° separation between data vectors in the SEQ phase space minimally defines a plane that demands at least two dimensions of meaning.
More simply, the experiences measured using the SEQ have no distinct meaning. This result gives quantitative weight to the conclusion of Gutek and associates, “that the SEQ is a flawed instrument and … does not seem to measure anyone’s definition of sexual harassment, including that of its own developers” [1]. This notion also provides an explanation for the discrepant results described under Section 2.4.3, ff. In the composition of its own narrative, the NAS Report also misrepresented published literature. To retain focus here, examples are provided in the Supplementary Material, Section S6.

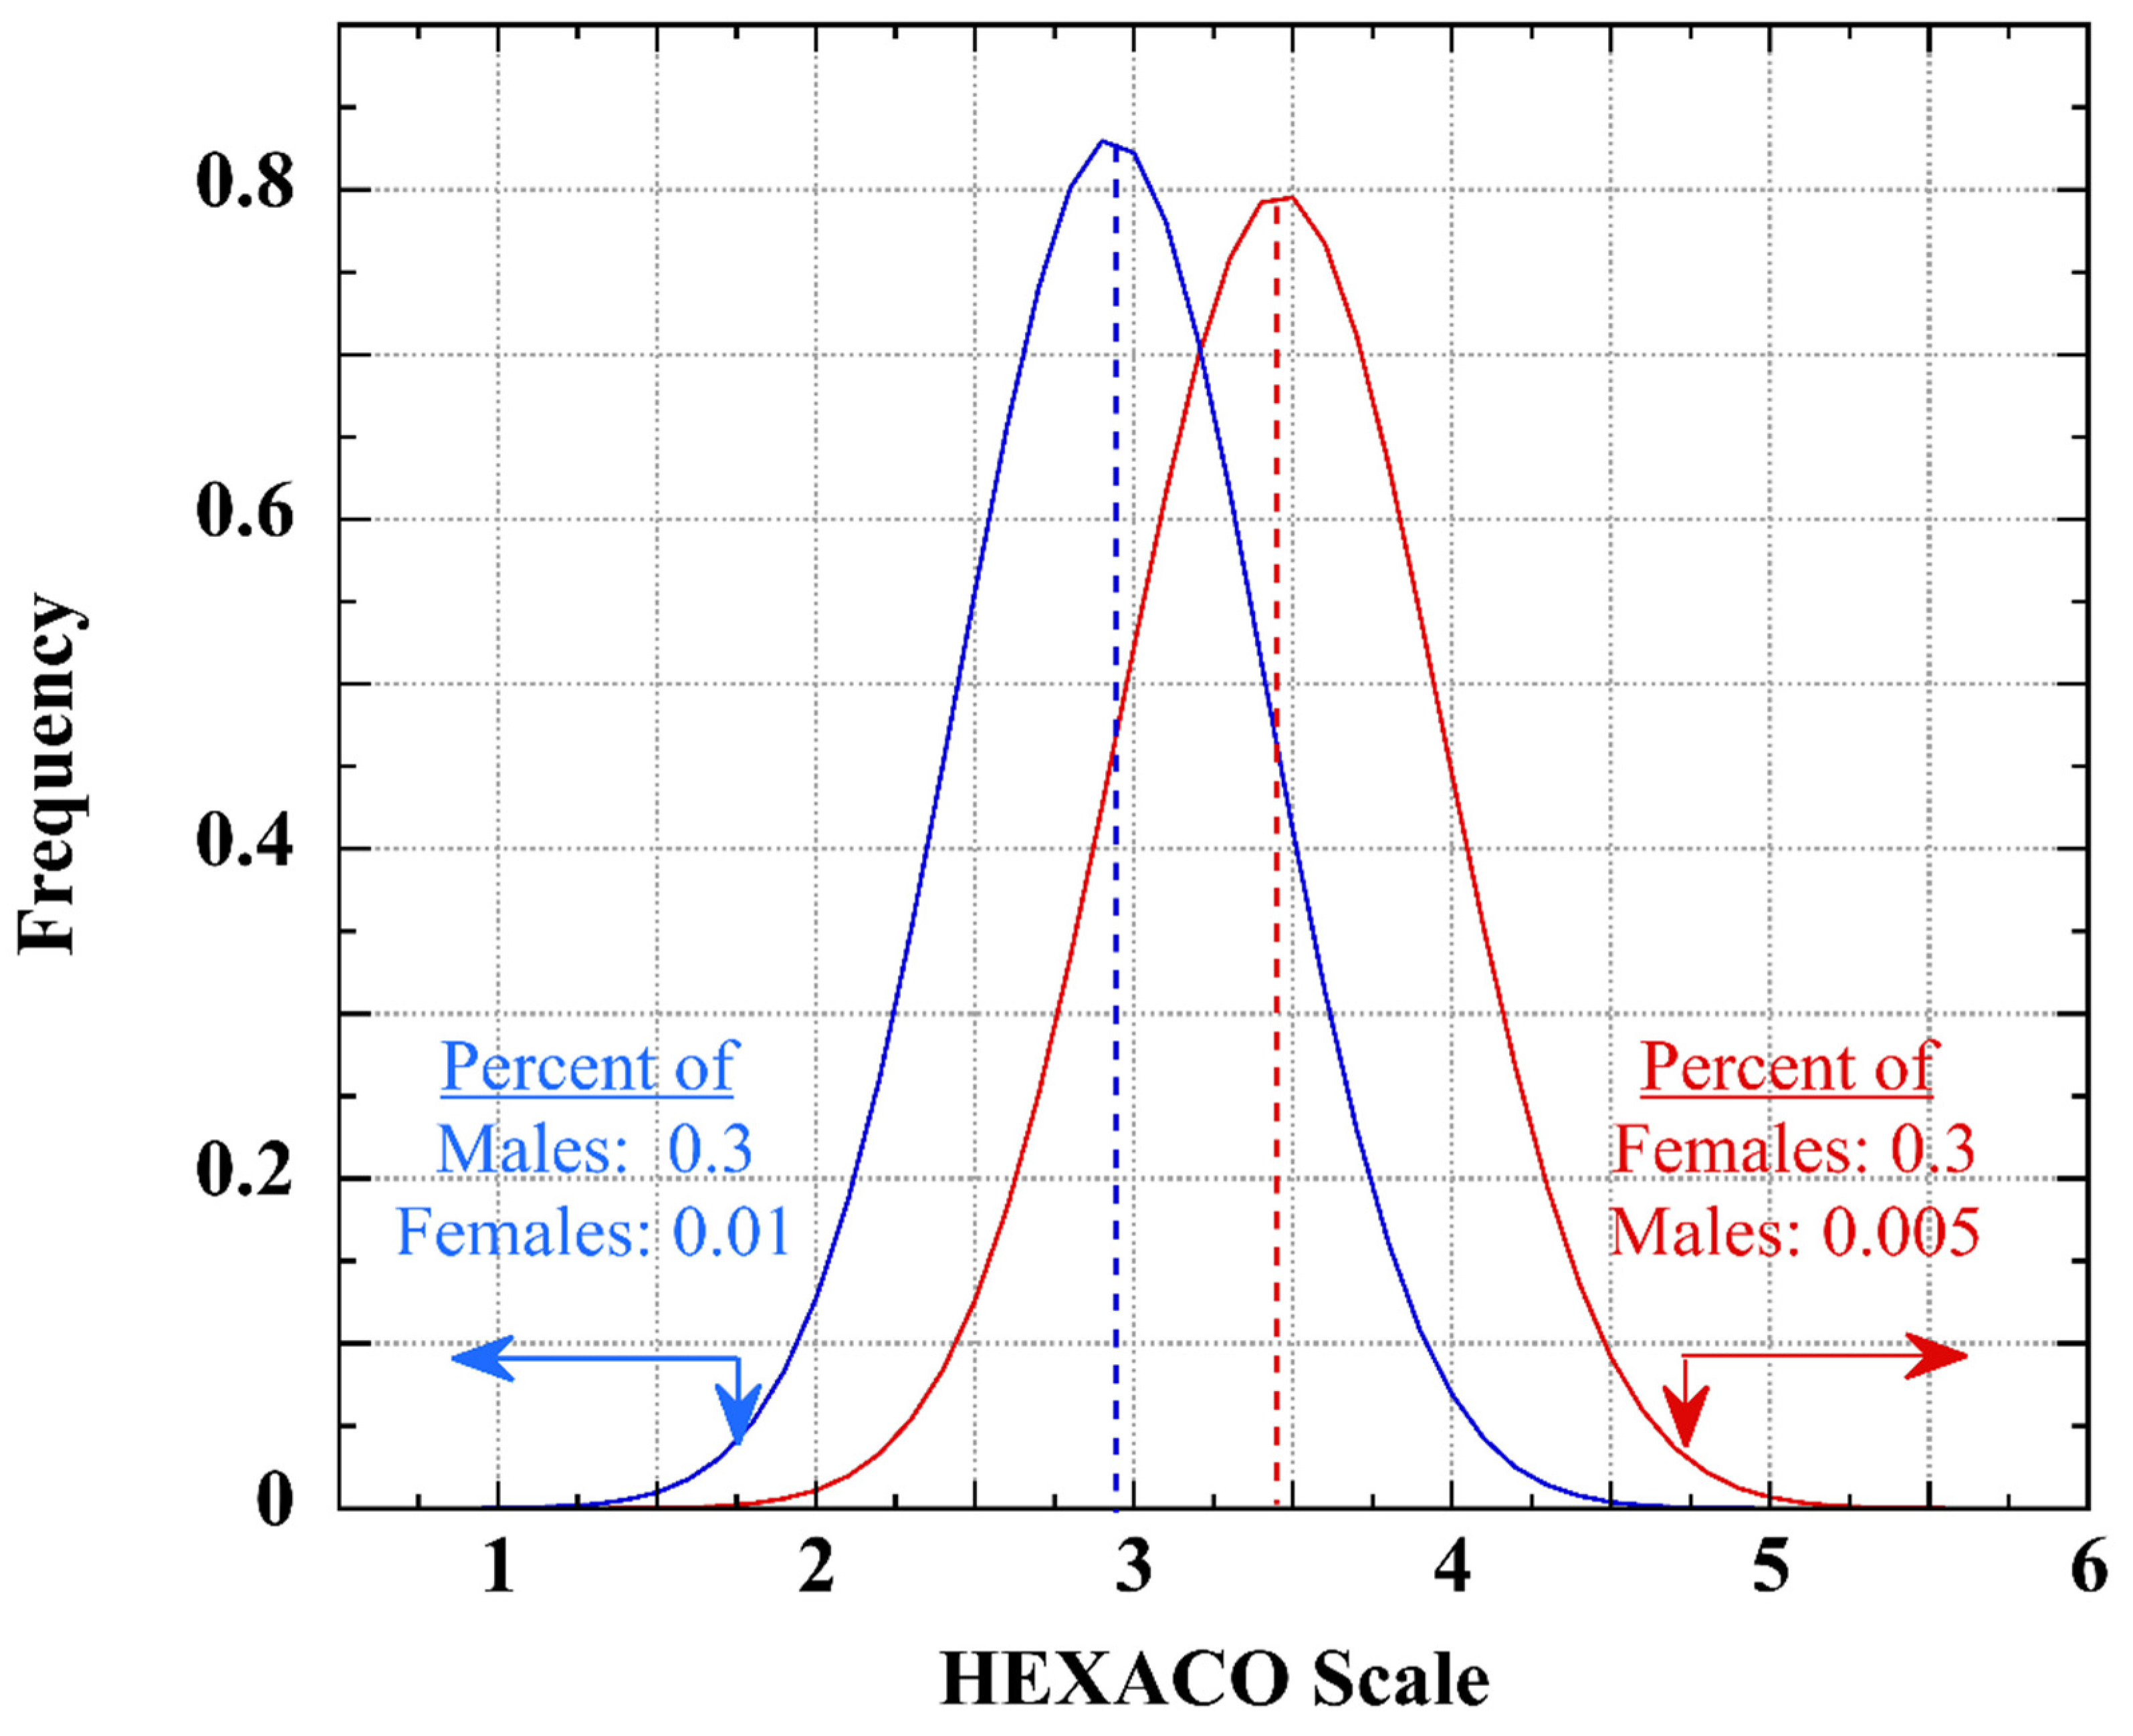
2.6. Evolutionary Psychology, Personality, and the Incidence of Serial Offenders

Neglect of the individual in SEQ studies can be rectified, at least in part, by attending to the HEXACO psychological inventory. HEXACO personality traits find genetic correlates in twin and sibling studies [64,65,66,67]. The six HEXACO personality factors are nearly orthogonal; thus, each is of nearly unique meaning [68,69,70]. Study participant personality profiles can be determined and potentially used to organize survey response distributions. However, this explanatory dimension has never been added to SEQ or to SH studies.

2.6.1. Enter HEXACO Emotionality

Here, the utility of incorporating personality is illustrated. The HEXACO factor Emotionality includes the facets of fearfulness, anxiety, dependence, and sentimentality and is further associated with harm avoidance, help seeking, and kin altruism [71]. Mean female and male Emotionality scores differ by nearly one standard deviation (3.43 ± 0.64 and 2.96 ± 0.61, respectively) [70]. In general, those who score high in Emotionality tend to respond to threat with fear, to fixate on relatively small problems, to share concerns with sympathetic listeners, and are empathetic to the problems of others [72].
Figure 9 shows estimated population average Gaussians for Emotionality among adult women and men [70]. In a statistically valid sample, 16% of adult women fall beyond one standard deviation above their Emotionality population mean. That 16% of high E women are predicted to react strongly and negatively to an unwanted SEQ experience. The empirical facts of personality trait distribution and intensity of response are sufficient to vitiate the assumption of identical respondents inherent in the SEQ methodology.
The 16% high-E fraction compares well with the criterion results of Schneider and associates, who reported that 19% (56 of 300) of working women (Sample 1, Ntotal = 447, but see Appendix A.1) or 15% (26 of 173) of university women (Sample 2, Ntotal = 300) indicated both SEQ experiences and labeled them as sexual harassment [12]. Likewise, in the independent study of Ilies and associates, 16% of academic females indicating SEQ experiences labeled them as sexual harassment [31].
Of further interest in the evolutionary context is that Magley and associates reported that among their three study cohorts, 21 participants labeled themselves as having been sexually harassed without having had any SEQ experiences at all [16]. These women were suggested to have reacted to prevalence rather than personal experience (see footnote 2 in [16]). However, twenty-one participants represent about 1.8% of the study group (N = 1161, but see Appendix A.1). This fraction is the population beyond 1.7 standard deviations above the Emotionality mean. These 21 women are therefore here suggested instead to occupy the empathic extreme of the HEXACO E scale, likely to identify with the experiences of others. This hypothesis is testable by combining a HEXACO evaluation with an SEQ survey.
In the Munson cohorts of military personnel, 210 females and 12 males labeled themselves as having been sexually harassed without having had any SEQ experiences at all. These participants were suggested to be reporting experiences in their lifetimes, rather than over the study interval of 12 months. Crediting this explanation, one is led to wonder whether this same lifetime report contaminated the SEQ responses of the larger population. However, this possibility was apparently not considered.
In any case, these two small Munson cohorts of no-SEQ-experience SH labelers represent 0.9% of the females and 0.2% of the males, equivalent to 1.9 or 2.2 standard deviations above their respective Emotionality means. As with the cohort of Magley and associates, they may be a small high-E group whose elevated empathy caused them to identify with the experiences of others. This hypothesis is again testable.
At the other extreme, Magley and associates reported that their discriminant analysis excluded 192 participants (but see Appendix A.2) whose responses did not correlate with job satisfaction or psychological harm. This 17% fraction (192; N = 1161, but see Appendix A.2) is proposed to be those women scoring low, not high, on the HEXACO E scale.
The impact of personality can thus perhaps provide insight into otherwise obscure patterns of participant response in SH studies. This hypothesis has the unique merit of being testable. The small populational fractions involved would require a study of at least 1000 randomly chosen participants to attain statistical significance. The logic of a connection between extremes of sensitivity to SH, HEXACO Emotionality, and possible genetic correlates recommends an explanation in evolutionary psychology.

2.6.2. The Evolutionary Psychology of SH

Psychological data make clear that individuals with personalities scoring high in the Likelihood to Sexually Harass (LSH) scale are prone to perpetrate sexual harassment [73,74,75]. Those who score high in the LSH score consistently score low in HEXACO Honesty–Humility and Agreeableness, which grounds the LSH in attributes of personality [76,77,78]. This HEXACO connection and its genetic correlates imply an explanation for the harassment personality and for SH itself in evolutionary psychology [38,64,65,66,67,79,80].
The high LSH group is a minority fraction of the general population, consisting of about 10% of males and 3% of females [81]. Personality metrics thus predict that most sex-based abuse is likely to be at the hands of a high-LSH sub-population of serial abusers.
In support of this notion, even the earliest studies of sex-related abuse recognized serial harassers. For example, Till noted, “the almost universal tendency (95%) to describe the initiator of the harassment as a person with a history and continuing practice of similar incidents” and that, “most (74%) reported incidents in which a single person was responsible for initiating multiple incidents of harassment” [59]. Subsequent studies provided copious evidence for a significant population of serial harassers [82,83,84,85,86]. Given the existence of a small high-LSH sub-group, the overwhelming population of males (~90%) and a larger majority of females (~97%) are not prone to committing sex-targeted abuse.
Personality and the LSH scale, and their derived insights, should be at the center of any sociological appraisal of SH incidence but are nowhere to be found within the SEQ literature or the NAS Report. The NAS Report itself cited at least two studies of sexual harassment built upon the LSH scale [87,88]. However, discursive inclusion of personality is absent. Evidently, the authors of the NAS Report did not see fit to recognize LSH in a study dedicated to uncovering and explaining SH.
Summary results include:
  • Job satisfaction statistics of female academics contradict the notion of systemic sexual harassment in academic STEM.
  • SEQ instrumentality presumes the indistinguishable female.
  • SEQ methodology is subjective and lacks predictive power.
  • The SEQ is ambiguous and neither measures nor diagnoses SH.
  • The SEQ CLASE study cannot substantiate a culture of SH in academic STEM.
  • The abuse of generalizing statistics falsely indicts an entire class.
  • Evolutionary psychology provides explanatory power.

3. Discussion

3.1. Representation and Reality

Loss of job satisfaction is the central theoretical diagnostic of SH in the workplace. Were sexual harassment systemic in academic STEM departments, job satisfaction would be systemically diminished among female academics. However, female and male academics report equivalently high (>90%) rates of job satisfaction. Such equity definitively falsifies the notion of a culture of systemic sexual harassment in academic STEM departments. This good news is cause for celebration. There is no bad news.
In addition, the reliability of the Sexual Experiences Questionnaire itself has been falsified. The SEQ is methodologically subjective, equivocal in outcome, and neither reveals nor measures sexual harassment in any scientific sense. The foundational scientific problem is that the term “sexual harassment” is inferential and has no objective meaning and therefore has no deducible observables. This ambiguity is fatal. Falsification of held ideas always advances knowledge. An approach grounded in evolutionary psychology promises a deductive theory of sexual harassment. It is hoped that the present work clears a space for this project.
Emphasized again is that the history of case law leaves no doubt that sex-based harrying and verbal and physical sexual abuse remain problems in professional and social environments or that grievous personal or career outcomes may result [2,3,4,5,51]. Nothing in this critical analysis of the study methodology gainsays those facts nor should be seen to gainsay them.
Rather, the focus here is on the study of SH, not on the observables of sex-based bullying, assault, or coercion, nor their incidence, their experience, or their harmful sequelae. The study-derived map of sex-based abuse is not the real-world territory. This analysis concerns the current sociological map of sexual harassment. That map has been found illusory.
In a national context, the declarations of the 2018 NAS Report ignored the overwhelming evidence of job satisfaction in academic STEM, are grounded in the SEQ, and are thus disconfirmed. The NAS Report is not a trustworthy guide to sexual harassment policy. The factually established larger context indicates that women in STEM fields are doing well, evidently do not today face obstacles of systemic sex bias, are overwhelmingly satisfied with their careers, and (Table 1) have favorable future prospects [21,89].

3.2. Qualitative Meaning and Inferential Modesty

The personal experiences relayed in the RTI study are poignant and reveal serious hurts and deep disappointments among the female academics who suffered them. Nevertheless, the first question for a methodological assessment is whether the RTI study revealed or supported a notion that academic STEM departments systemically induce sexual harassment.
The cautions of Norman Cliff are appropriate, namely that (p. 125), “Someone is likely to take action, perhaps far-reaching action, on the basis of applied research findings. Therefore, both producers of such research and audiences or consumers of it need to be particularly concerned that the conclusions reached are valid ones” [90]. Cliff’s advice for modesty in conclusion applies distinctly to the RTI study, which revealed nothing systemic but was suggested to imply a culture of abuse. It should not need a reminder that indictment of an entire class must not follow from the offenses of individuals.

3.3. The SEQ and Its Sociology

The present study has falsified the Sexual Experiences Questionnaire (SEQ) as a sociological method for objective study of SH. Section 3.3.1, Section 3.3.2 and Section 3.3.3 below discuss specific elements of failure. Prior comprehensive critiques of the SEQ had already called its construct validity into mortal question [1,51]. Barbara Gutek concluded in 2007 that, “Actually, “the SEQ” does not seem to exist. The many different SEQs together show inconsistencies in wording, time frame, and the like. … The various versions also have weak psychometric properties; … It is not clear what or whose definition of sexual harassment the SEQ assesses. … In fact, the current state of the research on the SEQ does not allow one to draw any conclusions about whether any particular sample has yielded a particularly high or low rate of sexual harassment” [51]. However, workers in the field have utterly ignored these criticisms. Rather than engaging Gutek’s critical analysis, academic sexual harassment researchers have greeted it with professional silence and neglect. The NAS Report, which itself critically relied upon the SEQ, provided no hint that the SEQ had ever been invalidated. These are remarkable professional failures.

3.3.1. An Inadequacy of Study: Causality

Correlations between the SEQ and candidate variables do not solve the problem of causality. Babyak has discussed the errors that adventitious correlations can bring to regression analyses [60]. For example, if the variables A and B are themselves correlated, correlation of SEQ scores with A will necessarily induce correlation of SEQ scores with variable B, a correlation that may be spurious [91]. The variables used for discriminant analysis were reported to be significantly intercorrelated [12,16]. The possibility that these variables produced spurious correlations with SEQ responses is therefore possible. However, no corrections for statistical independence were made. One may also ask whether trivially irrelevant variables may also correlate with SEQ scores, such as, e.g., a five-point Likert ranking of window-shade preferences. No null-significance correlation tests were reported.
More deeply, the discriminant analysis employed to imply causality is instead silent on causality [47,91,92]. This incapacity is central but has been ignored. Freedman’s cautions about finding correlation and assuming causality are very relevant here: “regression [cannot] carry much of the burden in a causal argument. Nor do regression equations, by themselves, give much help in controlling for confounding variables. … Indeed, causal arguments based on significance tests and regression are almost necessarily circular. To derive a regression model, we need an elaborate theory that specifies the variables in the system, [and] their causal interconnections … However, the model cannot in general be regarded as given [i.e., predictive], because current social science theory does not provide the requisite level of technical detail for deriving specifications. … Correlation is not the same as causation; statistical technique, alone, does not make the connection. The familiarity of this point should not be allowed to obscure its force” [47]. Freedman’s point is identical to the need for a monosemous theory of SH able to deductively predict observables (cfFigure 8, ff). A prescriptive conclusion requires causality, which SEQ studies have not established. In that event, a conclusion must be both modest and overtly provisional.
A further caution resides in the decision of Magley and associates to reorganize the identical data sets of Schneider et al., 1997 [12]. The group model of Schneider and associates correctly reclassified about 50% of the respondents, relative to about 31% by chance [12]. Magley and associates did not report a reclassification test disallowing comparison. However, Munson et al. employed the model of Magley et al., which successfully reclassified about 35% of respondents, evidently scarcely above chance. The modestly successful symmetric model of Schneider and associates more effectively classified SEQ outcomes even though the revised model of Magley and associates more effectively differentiated group centroids. In revising their model post-analysis, Magley and associates engaged the ex post facto fallacy that Cliff searchingly discussed: “The investigator has a moderately well-defined model [which, however,] is rejected by the data. [T]he natural response is to look around [to find] some … new model which does “fit,” … The scientific-statistical problem is that the investigator has looked at the data and from them made some estimates of the parameters using the same data. The relevant probability distributions no longer apply, and, thus, the goodness-of-fit value is meaningless, or very nearly so” [90].
Data snooping is when, “a given set of data is used more than once for purposes of inference or model selection. When such data reuse occurs, … any satisfactory results obtained may simply be due to chance rather than [to merit]…” [93]. Following Cliff (cf. above), data snooping is a recognized problem in sociology [94,95]. In this case, the statistically reasonable model employed by Schneider et al., 1997 [12], did not organize the SEQ outcomes in a manner consistent with expectations. The subsequent ex post facto adjustments of Magley and associates improved the consistency but vitiated the validity. The same criticism can be levied upon the later dimensional adjustment made to bring the SEQ into better conformance with data (cfSection 2.4.7).
In all three SEQ studies considered here, variables were chosen on the grounds of subjective anticipation that sexual harassment is defined by certain outcomes. Assigning causality to named outcomes engages the nominalistic fallacy as discussed by Cliff: “If we name something, this does not mean we understand it. Suppose we posit a theoretical variable, invent a manifest variable which we think would be related to it, give it the same name and then correlate that variable with some others. The resulting correlations--or absence of them--of the manifest variable cannot be treated as if they corresponded directly to relations of the theoretical one. … The fallaciousness remains, no matter how sophisticated the computer program which takes part in the analysis” [90]. This fallacy distinctly applies to the history of the SEQ.
Naming the observable of interest does not justify deciding that construed survey facets measure the named observable. Nevertheless, the earliest publications announcing the SEQ immediately described it as a measure of sexual harassment. This was despite the fact that sexual harassment itself had no consistent definition much less having been scientifically characterized [22,96]. For example, Arvey and Cavanaugh noted that, “Central to these [workplace] issues is how precisely to define sexual harassment, how to measure it, and how to establish its prevalence” [57]. That is, sexual harassment remained undefined 10 years after the SEQ was published as a measure of sexual harassment.
Thus, SEQ facets were assigned to sexual harassment and since then have been used to diagnose sexual harassment. The nominalistic circularity is apparent: SH is assigned to SEQ behaviors, and then SEQ behaviors are taken to indicate SH.
All three SEQ studies assessed here also manifest the post hoc ergo propter hoc fallacy likewise discussed extensively in Cliff, 1983. In this fallacy, antecedent events are assigned as causal to outcomes of interest but without objective justification. In Schneider et al., 1997 [12], Magley et al., 1999 [16], and Munson et al., 2001 [17], the psychological and work satisfaction variables were measured after occurrence of the SEQ behaviors, following which the SEQ behaviors were assigned by simple inference as causal to the variables. Assigned causality seems universal in SH studies.

3.3.2. An Inadequacy of Study: Summary Diagnosis

Section 2.4.7, Section 2.5.1 and Section 2.5.2 describe the absence of factor orthogonality and the resulting ambiguity of meaning. The neglect of statistical independence and the lack of consistent outcomes compromise SEQ survey results. SEQ studies themselves suffer from methodological subjectivity, presumptions of causation, and opacity of import. Taken together, all these indicate that the SEQ does not knowably measure or uncover sexual harassment. Thus, the earlier criticisms of the SEQ by Barbara Gutek and her associates are herein strongly corroborated [1,51]. Consequent to all this is falsification of the SEQ survey approach to the study of SH. Ancillary to this falsification is that the assigned significance of the CLASE study is voided and the 2018 NAS Report on sexual harassment of women in STEM is left with no core meaning.
In recent reviews, both Foote and Quick and McFadyen have described the sociological approach to sexual harassment as subjective [52,97]. Foote also observed that pre-existing psychological states make difficult the extraction of specifically sexual harassment sequelae. He further noted that seeing causality in correlation remains an unsolved problem in sociological studies. On these grounds alone, the SEQ cannot be known to measure sexual harassment because there exists no objective and falsifiable theory of SH that predicts the SEQ list of experiences as observables. In that event, not only is it impossible to deduce what conclusive sexual harassment observables should look like, but it is also impossible to predict their occurrence or consequence.
All of this does not mean that sex-based harrying is not identifiable. It is located in the legal art of adjudicating emotional or physical abuse or deliberatively prejudicial professional disparities. But sexual harassment is not yet identifiable in science because the sociological term “sexual harassment,” itself has no objective meaning. Within sociology, sexual harassment is a subjective narrative that cannot educe discretely knowable measures. It is not possible to invoke presence when the means of recognition are absent.

3.3.3. An Inadequacy of Study and Its Consequences

The understanding that LSH traits are concentrated in personalities low in HEXACO Honesty–Humility and Agreeableness has been available from psychological research for nearly 20 years [77,98,99]. However, the discernment that abusers are predominantly in a personality sub-group appears to be completely unapplied in the sociological literature on SH (an exception is [100]) and likewise makes no appearance in an NAS Report typifying researcher acuity. In recent reviews of campus sexual assault, the LSH personality is unmentioned as a risk factor [101,102]. This problem will be examined in more detail in a future submission [81].

Generalizing to Defamation

The exclusive use of generalizing statistics to discuss SH fails to transmit the knowledge that propensity toward sexually directed abuse is dominated by sub-categories of personality. The question arises concerning how much serial offenders contribute to the rate of female harassment and thus to the statistics. One notes, for example, that the 10% of males with high LSH personalities could serially harass a much larger fraction of females. Reporting only incidence fractions misdiagnoses multiple offenses by one male as single offenses by multiple males.
The HEXACO personality inventory indicates most men are not inclined to offend, while some men are capable of multiple and continual offenses [98,103,104,105,106,107]. This critically central point is generally ignored in the published sociological literature on sexual harassment, including throughout the NAS Report. Instead, an uncritical use of generalizing statistics has grown into prevalence, which in turn has promoted a culture of group defamation and prompted the idea that the source of sexual harassment is culture rather than individuals with LSH personalities. The undifferentiated statistical presentation encourages an inference—unjustifiable in psychology—that every male, any male, is a potential harasser.
When group accusation indiscriminately generalizes the harassment impulse to entire populations, every academic female is conceived to be under constant threat because every male is a potential offender. For example, Cantalupo noted that, “the only type of campus violence that is unfortunately common enough to be characterized as “ordinary” is peer sexual assault and similar forms of campus gender-based violence” [108]. This was followed by, “[r]ape is the most common violent crime on American college campuses today. Studies estimate that 20–25% of college women are victims of forced sex during their time in college.” Similarly, from Koss and associates, repeating a statement in [109], “The ubiquity of sexual aggression and victimization supports Johnson’s (1980) observation that, “It is difficult to believe that such widespread violence is the responsibility of a small lunatic fringe of psychopathic men. That sexual violence is so pervasive supports the view that the locus of violence against women rests squarely in the middle of what our culture defines as ‘normal’ interaction between men and women” [110].
And finally, this: “Of course, men and masculinity have long been central to feminist theorizing about gender and sexual violence. We suggest, however, that the ways scholarship and activism have tended to address men—as those who perpetrate sexual violence against women and as those who must be taught to not rape—may elide some of the complicated ways in which sexual violence and masculinity are intertwined.” could not be more explicit [111]. Sexual violence is stated to be rooted in masculinity per se. In 2018, the American Psychological Society itself issued a declaration that, “more than 40 years of research [showed] that traditional masculinity is psychologically harmful” [112]. From the APA discussion, the perceived problem with men seems to be that they are not women [113]. To read these statements is to be instructed that any college male might be a rapist, and every college female lives under imminent threat of rape. Use of generalizing statistics has indicted men as a group.
Those exposed are led to infer that the harasser class is omnipresent, is cynically opportunistic, and must be held in abeyance by a protective external power. Every workplace is invited thereby to become poisoned with suspicion, and an undeserved fear and caution is injected into every professional or social relationship. The approach to SH that denigrates primarily males as a class is contradicted by well-established psychological research [74,75,77] and will be the subject of a future submission [81]. One might have hoped that psycho-social scientists would have consciously avoided falling into the error of constructing an out-group prejudice [114].

Misreading about Rape

Ubiquity of campus rape is another canon rooted in generalizing statistics. Aya Gruber noted that, “the “one-in-four” claim is not just a rallying cry of feminist advocates” but “is the “truth” that underlies” the growth of extreme disciplinary policies and the erosion of free speech in higher education [115]. However, although the belief is very widespread, the notion that college females are profoundly in danger of rape is very narrowly grounded. The 20–25% fraction is many times repeated across time and publications [108,116,117], but the repetitions are not independent estimates. For example, the 20–25% victimization fraction did not originate in [108] but was there cited to a book by Bohmer and Parrot on campus sexual assault [117]. Bohmer and Parrot in turn referenced the 25% fraction to a statement in Koss et al., 1985 [118]. Section S6.2.5 in the Supplementary Material traces all the reports of a 20–25% rate of rape among college females back to the single source of Koss and associates [110,118]. However, Koss and associates founded the 20–25% rate on a misreading of even earlier work by Kanin and associates [119,120]. This one incorrect 1985 reading has had an extended life [121].
The results from Kanin and associates are summarized in Table 2 and represent upper limit percentages. The full analysis of Kanin and Kanin and Kirkpatrick may be found in Section S6.2.6 of the Supplementary Material.
Koss and associates reported independent survey results that 25% of college females (N = 3187) had experienced either forcible rape or rape by intoxication or by coercion but rape since age 14 rather than in college alone. For the same cohort, the analogous one-year college campus rate was 6.5% [110,118]. These latter incidents involved 3.2% of college males. College females vulnerable to campus sexual assault reported four distinguishing characteristics that accounted for most of their appearance in this group: childhood sexual abuse, liberal sexual attitudes, alcohol use, and more lifetime sexual activity [122]. The overall rate of unwanted sexual intercourse by force, drugs, or coercion was 2.1 incidents per victimized female [110]. These characteristics should distinguish those more likely to suffer violent sexual assault from the general population of college females.
Koss and associates also reported that, “Kanin (1957) found that 26% of a sample of 341 college men reported a forceful attempt to obtain sexual intercourse that caused observable distress and offense in the woman” [118]. However, this percentage again reflects a mistaken reading. The behavior of 742 males was discussed, of whom 372 had behaved offensively [119]. Of the female respondents (N = 262), 48 had suffered a total of 87 instances of offensively attempted intercourse. These 87 attempts represented 62 males, indicating (62/742) × 100 = 8.4% attempted unwanted intercourse and an estimated 4.3% who committed rape (see Table 2 above and Section S6.2.6 and Table S2 in the Supplementary Material).
The paradigm of large fractions both of female rape victims and of male perpetrators in college campuses arose from these misreadings and has then been accepted uncritically for decades. The resulting bias has led scholarship astray and caused both unjustified alarm and unmerited aspersions. Transmitted uncritically and multiple times across nearly 30 years, the idea that college campuses are dangerous for females has become a canonized fiction.
In another misconstrual Tilley and associates reported is that “An estimated one in five female college students is sexually assaulted during college,” citing Krebs et al., 2016 [116]. However, Krebs and associates found an average 10.1% incidence rate of sexual assault (range = 4.2–20%), which was defined to include both unwanted sexual touching and rape. The average rate of campus rape across these nine colleges was 4.0 ± 2% (cf. Figure ES-2 in the work of Krebs, et al. [123]). The data of Krebs and associates permit an upper limit estimate of 3.4% of male college students as rape offenders (the full calculation is in Section S6.2.7 in the Supplementary Material).

3.4. The NAS Report and the EEOC Definition of Sexual Harassment

Among its legal definitions of sexual harassment, the U.S. Equal Employment Opportunity Commission (EEOC) includes, “verbal or physical conduct of a sexual nature constitute sexual harassment when … such conduct has the purpose or effect of unreasonably interfering with an individual’s work performance or creating an intimidating, hostile, or offensive working environment” (see p. 196, Note 77ff) in [124].
The authors themselves have written a NAS Report that omits or misrepresents critically central scholarship (cfSection 2.4.4 and Section 2.4.6 above and Section S6 in the Supplementary Material). They stand silent on any published study or analysis that might qualify their conclusion of generalized abuse [99,125,126,127]. There is no cognizance of even the possibility that a small personality sub-population may produce most sexual offenders, despite the large indicating literature [59,74,75,87,128,129].
An environment made unjustifiably hostile toward males is predicated to result from false inferences of a general male tendency to sexual harrying. Institutional application of the policies recommended within the NAS Report seem likely to foster a climate of suspicion, thereby corroding professional relations. In that event, when the consequences of its culpose report are judged in light of the above EEOC guidelines, any factually abusive or discriminatory sequelae would likely sustain a legal charge of de jure sexual harassment against the National Academy. A similar legal vulnerability may accrue to a university or any institution that uncritically implements policies based upon the NAS Report. The NAS authors themselves also seem vulnerable to such a charge by virtue of the defamation implicit in their professionally negligent analyses.

3.5. Limitations of This Work

The quantitative validity of this work is vulnerable to the reliability of the national demographics of university faculty provided by the U.S. Bureau of Labor Statistics, to the job-satisfaction statistics of the National Center for Science and Engineering Statistics, and to the statistical power of the assessed SEQ survey populations. The assumption in Section 2.2.2 that male and female STEM academics react analogously to professional pressures and stresses may be falsified by personality inventory [130]. Analytical adjustment on this ground is unlikely to modify the conclusion that evidence for systemic SH is not visible in academic STEM job-satisfaction statistics, however. Larger or more populationally representative SEQ surveys may produce alternative response means or variability widths that may modify the judgment of ambiguity. Additional SEQ surveys may also yield normalized response intensities different from those reported here; although, it is expected the various response categories will continue to display unique personality-driven dependence. Causal (not numerical) orthogonalization of the SEQ may rescue it from the falsification by statistical and phase-space analysis. However, a causally valid SH survey instrument is likely to be grounded in Evolutionary Theory and thus unlikely to resemble the present SEQ.

3.6. Future Research Directions in Evolutionary Psychology

Section 2.6.2 outlined an evolutionary hypothesis for the incidence of SH. The genetic heritability of personality is now well-established. The inventory of personality, in turn, should predict the incidence of sexual harassment. This hypothesis from evolutionary psychology provides the guidepost to future research, which will be developed more fully elsewhere.
Nevertheless, it is presently clear that an objective understanding of sex-based abuses in the workplace can greatly benefit from an inventory of personality, both of the offenders and the offended. It is anticipated that evolutionary psychology will provide the necessary objective and critically productive causal insights.
This research in turn will inform an evolutionary sociology [131,132,133,134]. The living connection of sociology to evolutionary psychology with its shared origin in evolutionary genetics is already available [135,136,137,138,139]. That project will gain advantage with the logically coherent and organic connection of evolutionary sociology with evolutionary biology (distinct from evolutionary determinism [140]).
This transition is expected to bring greater explanatory power and no loss of identity. Thus, biology lost no identity as a separate discipline when it was found to be coherent with physics through chemistry [133,141,142,143]. In this project, the notion that sub-populational cohorts are found to share psychological traits can be used for predictions of social-scale phenomena. This connection will be described in a future work [81].
In conclusion, the basal question arising herein is whether researchers wish to understand the phenomenon of sex-based abuse or merely to forward rationales that target pre-selected conclusions.

Supplementary Materials

The following supplementary material can be downloaded at: https://www.mdpi.com/article/10.3390/psych4030034/s1, 1. Section S1. On the Munson Replication Study; Male Group responses from (Munson et al., 2001 [17]); Figure S1: The SEQ and military male responses; Section S2. The Meaning of Discriminant Group Centroids; Eqn. S1: Group centroid response variability; Figure S2: Discriminant group centroids and variability widths (Magley et al., 1999 [16]); Figure S3: Discriminant group centroids and variability widths (Munson et al., 2001 [17]); Section S3. Study Congruence; Table S1: Equivalent Variables in Two SEQ Experience Studies; Eqns. S2: SEQ normalization; Figure S4: SEQ-normalized outcomes; Section S4. Correlation of Group Centroids; Figure S5: Weighted regression of the discriminant group centroids; Section S5. Comparison of Group Centroids; Figure S6: Discriminant group centroids of the studies; Section S6. Misrepresentations of Scholarship; The initializing validity of the SEQ; Ilies et al., 2003 [31]; The ARC3 survey instrument; The CLASE survey; The road to ruin; Irrationales; The abuse of Koss; The Gold Standard; Sociological whispers and the rate of campus rape; Whispers of Koss et al.; The rate of campus rape in Koss et al., 1985 [118], 1987 [110]; The misreading of both Kanin and the rate of campus rape; Kanin, 1957 [119]; Kirkpatrick and Kanin, 1957 [120]; Table S2: Victims and Offenders; The college male rape-perpetrator fraction from Krebs et al., 2016 [123]; Section S7. Diagnostics and the U.S. National Academy; Critical Race Theory and Intersectionality; A failure of scholarship in Sociology; The subjectivist context of the National Academy; Intentional bankruptcy; References. The 2017 Job Satisfaction statistics are available as a separate supplementary materials Excel file: 2017 Job satisfaction in STEM.xlsx.

Funding

This research received no external funding.

Institutional Review Board Statement

Not applicable.

Informed Consent Statement

Not applicable.

Data Availability Statement

Data is contained within the article and Supplementary Material. The statistics of academic job satisfaction are available as a separate Supplementary Material Excel file (2017 Job satisfaction in STEM.xlsx).

Acknowledgments

This work was carried out on the author’s own time, is not associated with the SLAC National Accelerator Laboratory or with Stanford University, and was funded by no granting agency, organization, or third party. The author thanks Daniel Foley of the National Center for Science and Engineering Statistics for generously providing the 2017 STEM and social science job satisfaction data displayed in Figure 1b. The author also thanks W. Matthew Briggs and S. Stanley Young for helpful discussions of trend statistics. Use of the superb library resources of Stanford University is also acknowledged with gratitude.

Conflicts of Interest

The author declares no conflict of interest.

Appendix A

Appendix A.1. On the Participant Counts in Schneider & assoc. and in Magley & assoc.

The sample participant counts are ambiguous in Schneider et al., 1997 [12], and Magley et al., 1999 [16]. From the respective descriptions, it is evident that both studies made use of identical Sample 1 and Sample 2 participant groups. From Schneider et al., 1997 [12], “Sample 1 consisted of 447 female employees, ” but “91% of the selected employees participated.” This would seem to imply a participation count of 447 × 0.91 = 407 women. However, later one learns that “In Sample 1, 431 women had complete data on all scales; ” obviating a 407 count and implicating 447 female participants. Thus, the initial count must have been about 447/0.91 = 491. In Magley et al., 1999 [16], the participation counts follow a similar pattern, except that “Sample 1 consisted of 459 female employees …” not 447. Again, however, the statement, “Participation rate for this first sample was 91%, …”, seems to imply 418 participants. Alternatively, applying the logic that it was the 459 women who constituted the 91% participation rate, the originally recruited cohort should be N = (459/0.91) = 504.
In Schneider et al., 1997 [12], Sample 2, “Data were obtained from 300 female employees …” and, “Overall participation rate for this sample was 76% …”. Following from the logic and wording of Sample 1, the initial cohort must have been 300/0.76 = 395 women. In Magley et al., 1999 [16], “Sample 2 was drawn from female faculty and staff of a large Midwestern university. Data were obtained from 300 female employees…” but, “Overall participation rate for this sample was 76%; …”. Again, the 300 women must have represented the 76% participation rate, and the original pool must have been (300/0.76) = 395 as in Schneider et al., 1997 [12]. “Sample 3 consisted of 419 female employees…” but, “participation rate was 82%”. Thus, the original Sample 3 count was likely 419/0.82 = 511 women.
The participant descriptions of Samples 1 and 2 of Schneider et al., 1997 [12], and of Magley et al., 1999 [16], are virtually identical. It is thus clear they were the identical cohorts of women, with an unexplained difference in initial counts (447 vs. 459). The same “Sample 1” cohort of women participants is also discussed elsewhere [12,24]. For the purposes here, the Sample 1,2 count is 447 + 300 = 747, and the Sample 1,2,3 count is 447 + 300 + 419 = 1161. Clarification may modify this sum. In Table 2 of Magley et al., 1999 [16], the discriminant count is 375 + 290 + 304 = 969.
The SEQ criterion labeling of the Schneider et al. Sample 1 was originally reported as, “40.9% of those who had endorsed at least one harassing behavior and who completed this section of the questionnaire labeled their experience as sexual harassment by answering yes to this question” [11]. However, only 138 of the 300 women (46.0%) who reported SEQ experiences also completed the criterion question. Of these 138, 40.9% labeled their experience as sexual harassment. Thus, the fraction of those with SEQ experiences who also labeled them as sexual harassment is 0.460 × 0.409 = 0.188 (=56 participants).

Appendix A.2. On the Participation Count of Magley & associates

The participant total was taken to be 1161 (cfAppendix A.1), such that the 969 discriminant analysis participants in Table 2 of Magley et al., 1999 [16], excluded 192 women of the original cohort.

References

  1. Gutek, B.A.; Murphy, R.O.; Douma, B. A Review and Critique of the Sexual Experiences Questionnaire (SEQ). Law Hum. Behav. 2004, 28, 457–482. [Google Scholar] [CrossRef] [PubMed]
  2. Goodman-Delahunty, J. Pragmatic Support for the Reasonable Victim Standard in Hostile Workplace Sexual Harassment Cases. Psychol. Public Policy Law 1999, 5, 519–555. [Google Scholar] [CrossRef]
  3. Isbell, L.M.; Swedish, K.; Gazan, D.B. Who Says It’s Sexual Harassment? The Effects of Gender and Likelihood to Sexually Harass on Legal Judgments of Sexual Harassment. J. Appl. Soc. Psychol. 2005, 35, 745–772. [Google Scholar] [CrossRef]
  4. Juliano, A.; Schwab, S.J. The Sweep of Sexual Harassment Cases. Cornell Law Rev. 2001, 86, 548–602. [Google Scholar]
  5. York, K.M.; Brookhouse, K.J. The Legal History of Work-Related Sexual Harassment and Implications for Employers. Empl. Responsib. Rights J. 1988, 1, 227–237. [Google Scholar] [CrossRef]
  6. National Academies of Sciences, Engineering, and Medicine. Sexual Harassment of Women: Climate, Culture, and Consequences in Academic Sciences, Engineering, and Medicine; The National Academies Press: Washington, DC, USA, 2018. [Google Scholar]
  7. Lindquist, C.; McKay, T. Sexual Harassment Experiences and Consequences for Women Faculty in Science, Engineering, and Medicine; Research Triangle Institute: Research Triangle Park, NC, USA, 2018. [Google Scholar]
  8. Hutagalung, F.; Ishak, Z. Sexual Harassment: A Predictor to Job Satisfaction and Work Stress among Women Employees. Procedia-Soc. Behav. Sci. 2012, 65, 723–730. [Google Scholar] [CrossRef] [Green Version]
  9. Willness, C.R.; Steel, P.; Lee, K. A meta-analysis of the antecedents and consequences of workplace sexual harassment. Pers. Psychol. 2007, 60, 127–162. [Google Scholar] [CrossRef]
  10. Malik, N.I.; Malik, S.; Qureshi, N.; Atta, M. Sexual Harassment as Predictor of Low Self Esteem and Job Satisfaction among in-Training Nurses. FWU J. Soc. Sci. 2014, 8, 107–116. [Google Scholar]
  11. Rubin, M.; Paolini, S.; Subašić, E.; Giacomini, A. A Confirmatory Study of the Relations between Workplace Sexism, Sense of Belonging, Mental Health, and Job Satisfaction among Women in Male-Dominated Industries. J. Appl. Soc. Psychol. 2019, 49, 267–282. [Google Scholar] [CrossRef] [Green Version]
  12. Schneider, K.T.; Swan, S.; Fitzgerald, L.F. Job-Related and Psychological Effects of Sexual Harassment in the Workplace: Empirical Evidence from Two Organizations. J. Appl. Psychol. 1997, 82, 401–415. [Google Scholar] [CrossRef]
  13. Fitzgerald, L.F.; Drasgow, F.; Hulin, C.L.; Gelfand, M.J.; Magley, V.J. Antecedents and consequences of sexual harassment in organizations: A test of an integrated model. J. Appl. Psychol. 1997, 82, 578–589. [Google Scholar] [CrossRef] [PubMed] [Green Version]
  14. Fitzgerald, L.F.; Cortina, L.M. Sexual Harassment in Work Organizations: A View from the 21st Century. In Apa Handbook of the Psychology of Women: Perspectives on Women’s Private and Public Lives; American Psychological Association: Washington, DC, USA, 2018; Volume 2, pp. 214–234. [Google Scholar]
  15. Siuta, R.L.; Bergman, M.E. Sexual Harassment in the Workplace. In Oxford Research Encyclopedias Business and Management; Oxford University Press: Oxford, UK, 2019. [Google Scholar]
  16. Magley, V.J.; Hulin, C.L.; Fitzgerald, L.F.; DeNardo, M. Outcomes of self-labeling sexual harassment. J. Appl. Psychol. 1999, 84, 390–402. [Google Scholar] [CrossRef] [PubMed]
  17. Munson, L.J.; Miner, A.G.; Hulin, C. Labeling sexual harassment in the military: An extension and replication. J. Appl. Psychol. 2001, 86, 293–303. [Google Scholar] [CrossRef]
  18. Berdahl, J.L.; Aquino, K. Sexual Behavior at Work: Fun or Folly? J. Appl. Psychol. 2009, 94, 34–47. [Google Scholar] [CrossRef] [PubMed] [Green Version]
  19. Jones, J.I. An Overview of Employment and Wages in Science, Technology, Engineering, and Math (Stem) Groups. In Beyond the Numbers: Employment & Unemployment; Bureau of Labor Statistics: Washington, DC, USA, 2014. [Google Scholar]
  20. Foley, D.J.; Selfa, L.A.; Grigorian, K.H. Number of Women with U.S. Doctorates in Science, Engineering, or Health Employed in the United States More Than Doubles since 1997. In InfoBrief; National Center for Science and Engineering Statistics: Washington, DC, USA, 2019; pp. 1–7. [Google Scholar]
  21. Ceci, S.J.; Ginther, D.K.; Kahn, S.; Williams, W.M. Women in Academic Science:A Changing Landscape. Psychol. Sci. Public Interest 2014, 15, 75–141. [Google Scholar] [CrossRef] [PubMed] [Green Version]
  22. Fitzgerald, L.F.; Shullman, S.L.; Bailey, N.; Richards, M.; Swecker, J.; Gold, Y.; Ormerod, M.; Weitzman, L. The incidence and dimensions of sexual harassment in academia and the workplace. J. Vocat. Behav. 1988, 32, 152–175. [Google Scholar] [CrossRef]
  23. National Research Council. Gender Differences at Critical Transitions in the Careers of Science, Engineering, and Mathematics Faculty; The National Academies Press: Washington, DC, USA, 2010. [Google Scholar]
  24. Fitzgerald, L.F. Sexual Harassment: Violence against Women in the Workplace. Am. Psychol. 1993, 48, 1070–1076. [Google Scholar] [CrossRef]
  25. Fitzgerald, L.F.; Gelfand, M.J.; Drasgow, F. Measuring Sexual Harassment: Theoretical and Psychometric Advances. Basic Appl. Soc. Psychol. 1995, 17, 425–445. [Google Scholar] [CrossRef]
  26. Gelfand, M.J.; Fitzgerald, L.F.; Drasgow, F. The Structure of Sexual Harassment: A Confirmatory Analysis across Cultures and Settings. J. Vocat. Behav. 1995, 47, 164–177. [Google Scholar] [CrossRef]
  27. Cortina, L.; Berdahl, J. Sexual Harassment in Organizations: A Decade of Research in Review. In The Sage Handbook of Organizational Behavior: Volume 1 Micro Approaches; Barling, J., Cooper, C.L., Eds.; Sage: London, UK, 2008; pp. 469–497. [Google Scholar]
  28. Clancy, K.B.; Cortina, L.M.; Kirkland, A.R. Opinion: Use Science to Stop Sexual Harassment in Higher Education. Proc. Natl. Acad. Sci. USA 2020, 117, 22614. [Google Scholar] [CrossRef]
  29. Swartout, K.M.; Flack Jr, W.F.; Cook, S.L.; Olson, L.N.; Smith, P.H.; White, J.W. Measuring campus sexual misconduct and its context: The Administrator-Researcher Campus Climate Consortium (ARC3) survey. Psychol. Trauma: Theory Res. Pr. Policy 2019, 11, 495–504. [Google Scholar] [CrossRef] [PubMed]
  30. Cortina, L.M.; Swan, S.; Fitzgerald, L.F.; Waldo, C. Sexual Harassment and Assault: Chilling the Climate for Women in Academia. Psychol. Women Q. 1998, 22, 419–441. [Google Scholar] [CrossRef]
  31. Ilies, R.; Hauserman, N.; Schwochau, S.; Stibal, J. Reported incidence rates of work-related sexual harassment in the United States: Using meta-analysis to explain reported rate disparities. Pers. Psychol. 2003, 56, 607–631. [Google Scholar] [CrossRef]
  32. Magley, V.J.; Shupe, E.I. Self-Labeling Sexual Harassment. Sex Roles 2005, 53, 173–189. [Google Scholar] [CrossRef]
  33. Fitzgerald, L.F.; Magley, V.J.; Drasgow, F.; Waldo, C.R. Measuring Sexual Harassment in the Military: The Sexual Experiences Questionnaire (SEQ—DoD). Mil. Psychol. 1999, 11, 243–263. [Google Scholar] [CrossRef]
  34. Agarwal, R.; Barney, J.B.; Foss, N.J.; Klein, P.G. Heterogeneous resources and the financial crisis: Implications of strategic management theory. Strat. Organ. 2009, 7, 467–484. [Google Scholar] [CrossRef]
  35. Robertson, C.; Feick, R. Inference and analysis across spatial supports in the big data era: Uncertain point observations and geographic contexts. Trans. GIS 2018, 22, 455–476. [Google Scholar] [CrossRef]
  36. Antecol, H.; Cobb-Clark, D. The sexual harassment of female active-duty personnel: Effects on job satisfaction and intentions to remain in the military. J. Econ. Behav. Organ. 2006, 61, 55–80. [Google Scholar] [CrossRef] [Green Version]
  37. Kandler, C.; Papendick, M. 29—Behavior Genetics and Personality Development: A Methodological and Meta-Analytic Review. In Personality Development across the Lifespan; Specht, J., Ed.; Academic Press: Cambridge, MA, USA, 2017; pp. 473–495. [Google Scholar]
  38. de Vries, R.E.; Tybur, J.M.; Pollet, T.; van Vugt, M. Evolution, situational affordances, and the HEXACO model of personality. Ethol. Sociobiol. 2016, 37, 407–421. [Google Scholar] [CrossRef]
  39. Xin, Y.; Wu, J.; Yao, Z.; Guan, Q.; Aleman, A.; Luo, Y. The relationship between personality and the response to acute psychological stress. Sci. Rep. 2017, 7, 16906. [Google Scholar] [CrossRef]
  40. de la Fuente, J.; González-Torres, M.C.; Artuch-Garde, R.; Vera-Martínez, M.M.; Martínez-Vicente, J.M.; Peralta-S’Anchez, F.J. Resilience as a Buffering Variable Between the Big Five Components and Factors and Symptoms of Academic Stress at University. Front. Psychiatry 2021, 12, 600240. [Google Scholar] [CrossRef] [PubMed]
  41. Lecic-Tosevski, D.; Vukovic, O.; Stepanovic, J. Stress and Personality. Psychiatriki 2011, 22, 290–297. [Google Scholar] [PubMed]
  42. Dougall, A.L.; Herberman, H.B.; Delahanty, D.L.; Inslicht, S.S.; Baum, A. Similarity of Prior Trauma Exposure as a Determinant of Chronic Stress Responding to an Airline Disaster. J. Consult. Clin. Psychol. 2000, 68, 290–295. [Google Scholar] [CrossRef]
  43. Maguen, S.; Metzler, T.J.; McCaslin, S.E.; Inslicht, S.; Henn-Haase, C.; Neylan, T.C.; Marmar, C.R. Routine Work Environment Stress and PTSD Symptoms in Police Officers. J. Nerv. Ment. Dis. 2009, 197, 754–760. [Google Scholar] [CrossRef] [PubMed] [Green Version]
  44. Garfin, D.R.; Holman, E.A.; Silver, R.C. Exposure to prior negative life events and responses to the Boston marathon bombings. Psychol. Trauma Theory Res. Pract. Policy 2020, 12, 320–329. [Google Scholar] [CrossRef] [PubMed]
  45. Hay, M.S.; Elig, T.W. The 1995 Department of Defense Sexual Harassment Survey: Overview and Methodology. Mil. Psychol. 1999, 11, 233–242. [Google Scholar] [CrossRef]
  46. Mason, R.E.; Kavee, J.A.; Wheeless, S.C.; George, B.J.; Riemer, R.A.; Elig, T.W. The 1995 Armed Forces Sexual Harassment Survey: Statistical Methodology Report; Defense Manpower Data Center (DMDC), Survey & Program Evaluation Division: Arlington, VA, USA, 1996. [Google Scholar]
  47. Freedman, D.A. Statistical Models and Shoe Leather. In Statistical Models and Causal Inference: A Dialogue with the Social Sciences; Collier, D., Freedman, D.A., Sekhon, J.S., Stark, P.B., Eds.; Cambridge University Press: Cambridge, UK, 2009; pp. 45–62. [Google Scholar]
  48. Calabrese, E.J. Origin of the linearity no threshold (LNT) dose–response concept. Arch. Toxicol. 2013, 87, 1621–1633. [Google Scholar] [CrossRef]
  49. Calabrese, E.J. Obituary Notice: Lnt Dead at 89 Years, a Life in the Spotlight. Environ. Res. 2017, 155, 276–278. [Google Scholar] [CrossRef]
  50. Calabrese, E.J.; Golden, R.J. Why toxicologists resisted and radiation geneticists supported EPA’S adoption of LNT for cancer risk assessment. Chem. Interactions 2019, 310, 108736. [Google Scholar] [CrossRef]
  51. Gutek, B.A. How Can We Make Our Research on Sexual Harassment More Useful in Legal Decision Making? In Social Consciousness in Legal Decision Making: Psychological Perspectives; Wiener, R.L., Bornstein, B.H., Schopp, R., Willborn, S.L., Eds.; Springer: Boston, MA, USA, 2007; pp. 153–170. [Google Scholar]
  52. Foote, W.E. Sexual Harassment: What Forensic Clinical Psychologists Need from Social Scientists. Psychol. Inj. Law 2016, 9, 253–264. [Google Scholar] [CrossRef]
  53. Klein, L.B.; Martin, S.L. Sexual Harassment of College and University Students: A Systematic Review. Trauma Violence Abus. 2021, 22, 777–792. [Google Scholar] [CrossRef] [PubMed]
  54. Reddy, M.K.; Murdoch, M. Sex Differences in the Factor Structure of a Modified Sexual Experiences Questionnaire. Psychol. Rep. 2010, 107, 773–783. [Google Scholar] [CrossRef] [PubMed]
  55. Benjes-Small, C.; Knievel, J.; Hunter, J.; Wisecup, A.; Resor-Whicker, J. Quantifying the #Metoo Narrative: Incidence and Prevalence of Sexual Harassment in Academic Libraries. In Proceedings of the Association Of College & Research Libraries Conference, Cleveland, OH, USA, 10–13 April 2019. [Google Scholar]
  56. Berdahl, J.L.; Magley, V.J.; Waldo, C.R. The Sexual Harassment of Men? Exploring the Concept with Theory and Data. Psychol. Women Q. 1996, 20, 527–547. [Google Scholar] [CrossRef]
  57. Arvey, R.D.; Cavanaugh, M.A. Cavanaugh. Using Surveys to Assess the Prevalence of Sexual Harassment: Some Methodological Problems. J. Soc. Issues 1995, 51, 39–52. [Google Scholar] [CrossRef]
  58. Stark, S.; Chernyshenko, O.S.; Lancaster, A.R.; Drasgow, F.; Fitzgerald, L.F. Toward Standardized Measurement of Sexual Harassment: Shortening the SEQ-DoD Using Item Response Theory. Mil. Psychol. 2002, 14, 49–72. [Google Scholar] [CrossRef]
  59. Till, F.J. Sexual Harassment. A Report on the Sexual Harassment of Students; National Advisory Council on Women’s Educational Programs: Washington, DC, USA, 1980. [Google Scholar]
  60. Babyak, M. What You See May Not Be What You Get: A Brief, Nontechnical Introduction to Overfitting in Regression-Type Models. Psychosom Med. 2004, 66, 411–421. [Google Scholar]
  61. Hanley, J.A.; Negassa, A.; Edwardes, M.D.D.; Forrester, J.E. Statistical Analysis of Correlated Data Using Generalized Estimating Equations: An Orientation. Am. J. Epidemiol. 2003, 157, 364–375. [Google Scholar] [CrossRef]
  62. Yang, Y.; Remmers, E.F.; Ogunwole, C.B.; Kastner, D.L.; Gregersen, P.K.; Li, W. Effective Sample Size: Quick Estimation of the Effect of Related Samples in Genetic Case–Control Association Analyses. Comput. Biol. Chem. 2011, 35, 40–49. [Google Scholar] [CrossRef] [Green Version]
  63. Lee Rodgers, J.; Nicewander, W.A. Thirteen Ways to Look at the Correlation Coefficient. Am. Stat. 1988, 42, 59–66. [Google Scholar] [CrossRef]
  64. Lewis, G.J.; Bates, T.C. How Genes Influence Personality: Evidence from Multi-Facet Twin Analyses of the Hexaco Dimensions. J. Res. Personal. 2014, 51, 9–17. [Google Scholar] [CrossRef] [Green Version]
  65. Veselka, L.; Schermer, J.A.; Petrides, K.V.; Cherkas, L.F.; Spector, T.D.; Vernon, P.A. A General Factor of Personality: Evidence from the Hexaco Model and a Measure of Trait Emotional Intelligence. Twin Res. Hum. Genet. 2009, 12, 420–424. [Google Scholar] [CrossRef] [Green Version]
  66. Veselka, L.; Petrides, K.V.; Schermer, J.A.; Cherkas, L.F.; Spector, T.D.; Vernon, P.A. Phenotypic and Genetic Relations between the Hexaco Dimensions and Trait Emotional Intelligence. Twin Res. Hum. Genet. 2010, 13, 66–71. [Google Scholar] [CrossRef] [Green Version]
  67. Kandler, C.; Richter, J.; Zapko-Willmes, A. The Nature and Nurture of HEXACO Personality Trait Differences. Z. Für Psychol. 2019, 227, 195–206. [Google Scholar] [CrossRef]
  68. Ashton, M.C.; Lee, K.; Perugini, M.; Szarota, P.; de Vries, R.E.; Di Blas, L.; Boies, K.; De Raad, B. A Six-Factor Structure of Personality-Descriptive Adjectives: Solutions From Psycholexical Studies in Seven Languages. J. Pers. Soc. Psychol. 2004, 86, 356–366. [Google Scholar] [CrossRef]
  69. Lee, K.; Ashton, M.C. Psychometric Properties of the Hexaco Personality Inventory. Multivar. Behav. Res. 2004, 39, 329–358. [Google Scholar] [CrossRef]
  70. Lee, K.; Ashton, M.C. Further Assessment of the Hexaco Personality Inventory: Two New Facet Scales and an Observer Report Form. Psychol. Assess. 2006, 18, 182–191. [Google Scholar] [CrossRef]
  71. Zettler, I.; Thielmann, I.; Hilbig, B.E.; Moshagen, M. The Nomological Net of the HEXACO Model of Personality: A Large-Scale Meta-Analytic Investigation. Perspect. Psychol. Sci. 2020, 15, 723–760. [Google Scholar] [CrossRef] [PubMed]
  72. Ashton, M.C.; Lee, K.; De Vries, R.E. The Hexaco Honesty-Humility, Agreeableness, and Emotionality Factors:A Review of Research and Theory. Personal. Soc. Psychol. Rev. 2014, 18, 139–152. [Google Scholar] [CrossRef] [PubMed]
  73. Krings, F.; Facchin, S. Organizational justice and men’s likelihood to sexually harass: The moderating role of sexism and personality. J. Appl. Psychol. 2009, 94, 501–510. [Google Scholar] [CrossRef] [Green Version]
  74. Pryor, J.B. Sexual harassment proclivities in men. Sex Roles 1987, 17, 269–290. [Google Scholar] [CrossRef]
  75. Pryor, J.B.; Stoller, L.M. Sexual Cognition Processes in Men High in the Likelihood to Sexually Harass. Personal. Soc. Psychol. Bull. 1994, 20, 163–169. [Google Scholar] [CrossRef]
  76. Ashton, M.C.; Lee, K. The prediction of Honesty–Humility-related criteria by the HEXACO and Five-Factor Models of personality. J. Res. Pers. 2008, 42, 1216–1228. [Google Scholar] [CrossRef]
  77. Lee, K.; Gizzarone, M.; Ashton, M.C. Personality and the Likelihood to Sexually Harass. Sex Roles 2003, 49, 59–69. [Google Scholar] [CrossRef]
  78. Ménard, K.S.; Shoss, N.E.; Pincus, A.L. Attachment and Personality Predicts Engagement in Sexual Harassment by Male and Female College Students. Violence Vict. 2010, 25, 770–786. [Google Scholar] [CrossRef]
  79. Koehn, M.A.; Okan, C.; Jonason, P.K. A Primer on the Dark Triad Traits. Aust. J. Psychol. 2019, 71, 7–15. [Google Scholar] [CrossRef] [Green Version]
  80. Jonason, P.K.; Girgis, M.; Milne-Home, J. The Exploitive Mating Strategy of the Dark Triad Traits: Tests of Rape-Enabling Attitudes. Arch. Sex. Behav. 2017, 46, 697–706. [Google Scholar] [CrossRef] [PubMed]
  81. Frank, P. Sexual Harassment, Sexual Abuse, and the Serial Offender Personality. 2022; to be submitted. [Google Scholar]
  82. McWhorter, S.K.; Stander, V.A.; Merrill, L.L.; Thomsen, C.J.; Milner, J.S. Reports of Rape Reperpetration by Newly Enlisted Male Navy Personnel. Violence Vict. 2009, 24, 204–218. [Google Scholar] [CrossRef]
  83. Lovell, R.; Butcher, F.; Flannery, D.J. Report on Serial and One-Time Sexual Offenders. In Cuyahoga County Sexual Assault Kit Pilot Project (SAK); Case Western Reserve University: Cleveland, OH, USA, 2016. [Google Scholar]
  84. Lovell, R.; Butcher, F.; Flannery, D.J.; Overman, L.; Walker, T. Patterns of Sexual Offending. In Cuyahoga County Sexual Assault Kit Pilot Research Project; Case Western Reserve University: Cleveland, OH, USA, 2016. [Google Scholar]
  85. Cantalupo, N.C.; Kidder, W.C. A Systematic Look at a Serial Problem: Sexual Harassment of Students by University Faculty. Utah Law Rev. 2018, 2018, 671–786. [Google Scholar]
  86. Gutek, B.A. Sex and the Workplace; Jossey-Bass: San Francisco, CA, USA, 1985. [Google Scholar]
  87. Driscoll, D.M.; Kelly, J.R.; Henderson, W.L. Can Perceivers Identify Likelihood to Sexually Harass? Sex Roles 1998, 38, 557–588. [Google Scholar] [CrossRef]
  88. Murphy, J.D.; Driscoll, D.M.; Kelly, J.R. Differences in the Nonverbal Behavior of Men Who Vary in the Likelihood to Sexually Harass. J. Soc. Behav. Personal. 1999, 14, 113–128. [Google Scholar]
  89. Ceci, S.J. Women in Academic Science: Experimental Findings From Hiring Studies. Educ. Psychol. 2018, 53, 22–41. [Google Scholar] [CrossRef]
  90. Cliff, N. Some Cautions Concerning The Application Of Causal Modeling Methods. Multivar. Behav. Res. 1983, 18, 115–126. [Google Scholar] [CrossRef] [PubMed]
  91. Mahoney, J. Beyond Correlational Analysis: Recent Innovations in Theory and Method. Sociol. Forum 2011, 16, 575–593. [Google Scholar] [CrossRef]
  92. Stewart, S.; Ivy, M.A.; Anslyn, E.V. The use of principal component analysis and discriminant analysis in differential sensing routines. Chem. Soc. Rev. 2014, 43, 70–84. [Google Scholar] [CrossRef] [PubMed]
  93. White, H. A Reality Check for Data Snooping. Econometrica 2000, 68, 1097–1126. [Google Scholar] [CrossRef]
  94. O’Brien, R.M. Comment: Some Challenges When Estimating the Impact of Model Uncertainty on Coefficient Instability. Sociol. Methodol. 2018, 48, 34–39. [Google Scholar] [CrossRef] [Green Version]
  95. Murphy, K.R.; Aguinis, H. Harking: How Badly Can Cherry-Picking and Question Trolling Produce Bias in Published Results? J. Bus. Psychol. 2019, 34, 1–17. [Google Scholar] [CrossRef]
  96. Fitzgerald, L.F.; Shullman, S. The Development and Validation of an Objectively Scored Measure of Sexual Harassment. In Proceedings of the Annual Meeting of the American Psychological Association, Los Angeles, CA, USA, 22–25 August 1985. [Google Scholar]
  97. Quick, J.C.; McFadyen, M. Sexual Harassment: Have We Made Any Progress? J. Occup. Health Psychol. 2017, 22, 286–298. [Google Scholar] [CrossRef]
  98. Lee, K.; Ashton, M.C.; Wiltshire, J.; Bourdage, J.S.; Visser, B.A.; Gallucci, A. Sex, Power, and Money: Prediction from the Dark Triad and Honesty–Humility. Eur. J. Personal. 2013, 27, 169–184. [Google Scholar] [CrossRef]
  99. Ashton, M.C.; Lee, K. The HEXACO Model of Personality Structure and the Importance of the H Factor. Soc. Pers. Psychol. Compass 2008, 2, 1952–1962. [Google Scholar] [CrossRef]
  100. Foubert, J.D.; Clark-Taylor, A.; Wall, A.F. Is Campus Rape Primarily a Serial or One-Time Problem? Evidence From a Multicampus Study. Violence Against Women 2020, 26, 296–311. [Google Scholar] [CrossRef] [PubMed]
  101. Swartout, K.M.; Flack, W.F., Jr. Campus Sexual Assault. In The Routledge International Handbook of Violence Studies; DeKeseredy, W.S., Rennison, C.M., Hall-Sanchez, A.K., Eds.; Routledge: London, UK, 2018; pp. 286–295. [Google Scholar]
  102. Swartout, K.M.; de Heer, B.A.; Thompson, M.P.; Zinzow, H.M.; Brennan, C.L. Chapter 18—A Cross-Disciplinary Review of Empirical Studies Addressing Repeat Versus Time-Limited Sexual Violence Perpetration. In Engaging Boys and Men in Sexual Assault Prevention; Orchowski, L.M., Berkowitz, A.D., Eds.; Academic Press: Cambridge, MA, USA, 2022; pp. 411–422. [Google Scholar]
  103. Dinić, B.M.; Wertag, A. Effects of Dark Triad and HEXACO traits on reactive/proactive aggression: Exploring the gender differences. Pers. Individ. Differ. 2018, 123, 44–49. [Google Scholar] [CrossRef]
  104. Jakobwitz, S.; Egan, V. The dark triad and normal personality traits. Pers. Individ. Differ. 2006, 40, 331–339. [Google Scholar] [CrossRef]
  105. Ashton, M.C.; Lee, K. The Dark Triad, the Big Five, and the Hexaco Model. Personal. Individ. Differ. 2014, 67, 2–5. [Google Scholar]
  106. Pailing, A.; Boon, J.; Egan, V. Personality, the Dark Triad and Violence. Personal. Individ. Differ. 2014, 67, 81–86. [Google Scholar] [CrossRef]
  107. Zeigler-Hill, V.; Besser, A.; Morag, J.; Campbell, W.K. The Dark Triad and Sexual Harassment Proclivity. Personal. Individ. Differ. 2016, 89, 47–54. [Google Scholar] [CrossRef]
  108. Cantalupo, N.C. Campus Violence: Understanding the Extraordinary through the Ordinary. J. Coll. Univ. Law 2009, 35, 613–690. [Google Scholar]
  109. Johnson, A.G. On the Prevalence of Rape in the United States. Signs J. Women Cult. Soc. 1980, 6, 136–146. [Google Scholar] [CrossRef]
  110. Koss, M.P.; Gidycz, C.A.; Wisniewski, N. The Scope of Rape: Incidence and Prevalence of Sexual Aggression and Victimization in a National Sample of Higher Education Students. J. Consult. Clin. Psychol. 1987, 55, 162–170. [Google Scholar] [CrossRef]
  111. Pascoe, C.J.; Hollander, J.A. Good Guys Don’t Rape: Gender, Domination, and Mobilizing Rape. Gend. Soc. 2015, 30, 67–79. [Google Scholar] [CrossRef]
  112. Pappas, S. Apa Issues First-Ever Guidelines for Practice with Men and Boys. Monit. Psychol. 2018, 50, 34. [Google Scholar]
  113. Bribiescas, R.G.; Ellison, P.T.; Gray, P.B. Male Life History, Reproductive Effort, and the Evolution of the Genus Homo: New Directions and Perspectives. Curr. Anthropol. 2012, 53, S424–S435. [Google Scholar] [CrossRef]
  114. Brewer, M.B. The Social Psychology of Intergroup Relations: Social Categorization, Ingroup Bias, and Outgroup Prejudice. In Social Psychology: Handbook of Basic Principles; Kruglanski, A.W., Higgins, E.T., Eds.; The Guilford Press: New York, NY, USA, 2007; pp. 695–715. [Google Scholar]
  115. Gruber, A. Anti-Rape Culture Reviews. Jotwell J. Things We Like (Lots) 2015, 2015, 163–165. [Google Scholar]
  116. Tilley, D.S.; Wang, W.; Kolodetsky, G.; Yeatts, P. Factor Analysis of the Administrator-Research Campus Climate Collaborative (ARC3) Survey. Health Educ. Behav. 2020, 47, 54S–69S. [Google Scholar] [CrossRef]
  117. Bohmer, C.; Parrot, A. Sexual Assault on Campus: The Problem and the Solution; Lexington Books: New York, NY, USA, 1993. [Google Scholar]
  118. Koss, M.P.; Gidycz, C.A.; Wisniewski, N. Hidden Rape: Incidence and Prevalence of Sexual Aggression and Victimization in a National Sample of Students in Higher Education. In Proceedings of the 93rd Annual Convention of the American Psychological Association, Los Angeles, CA, USA, 23–27 August 1985. [Google Scholar]
  119. Kanin, E.J. Male Aggression in Dating-Courtship Relations. Am. J. Sociol. 1957, 63, 197–204. [Google Scholar] [CrossRef]
  120. Kirkpatrick, C.; Kanin, E. Male Sex Aggression on a University Campus. Am. Sociol. Rev. 1957, 22, 52. [Google Scholar] [CrossRef]
  121. Subotnik, D. Measuring Sexual Assault on Campus: The Clery Report Challenge. Acad. Quest. 2018, 31, 339–344. [Google Scholar] [CrossRef]
  122. Koss, M.P.; Dinero, T.E. Discriminant Analysis of Risk Factors for Sexual Victimization among a National Sample of College Women. J. Consult. Clin. Psychol. 1989, 57, 242–250. [Google Scholar] [CrossRef]
  123. Krebs, C.; Lindquist, C.; Berzofsky, M.; Shook-Sa, B.E.; Peterson, K.; Planty, M.G.; Langton, L.; Stroop, J. Campus Climate Survey Validation Study Final Technical Report; Bureau of Justice Statistics: Washington, DC, USA, 2016.
  124. Cooper, C.G. Review: Sexual Harassment of Working Women. Catharine, A. Mackinnon. Yale University Press, New Haven and London, Pp. Xiv, 312. $22.50. Univ. Chic. Law Rev. 1981, 48, 183–201. [Google Scholar] [CrossRef]
  125. Zinzow, H.M.; Thompson, M. A Longitudinal Study of Risk Factors for Repeated Sexual Coercion and Assault in U.S. College Men. Arch. Sex. Behav. 2015, 44, 213–222. [Google Scholar] [CrossRef]
  126. Collins, S.C. Portrait in Blue: A Demographic and Behavioral Profile of Police Sexual Harassment. Women Crim. Justice 2006, 18, 79–106. [Google Scholar] [CrossRef]
  127. de Vries, R.; De Vries, A.; De Hoogh, A.; Feij, J.A. More than the Big Five: Egoism and the HEXACO model of personality. Eur. J. Pers. 2009, 23, 635–654. [Google Scholar] [CrossRef]
  128. Craig, T.Y.; Kelly, J.R.; Driscoll, D. Participant Perceptions of Potential Employers. Sex Roles 2001, 44, 389–400. [Google Scholar] [CrossRef]
  129. Sbraga, T.P.; O’donohue, W. Sexual Harassment. Annu. Rev. Sex Res. 2000, 11, 258–285. [Google Scholar]
  130. Magnavita, N. Is there a gender gap in Italian radiology? A cross-sectional study. Eur. J. Radiol. 2013, 82, e502–e507. [Google Scholar] [CrossRef] [PubMed]
  131. Schutt, R.K.; Turner, J.H. Biology and American Sociology, Part I: The Rise of Evolutionary Thinking, Its Rejection, and Potential Resurrection. Am. Sociol. 2019, 50, 356–377. [Google Scholar] [CrossRef]
  132. Turner, J.H.; Schutt, R.K.; Keshavan, M.S. Biology and American Sociology, Part Ii: Developing a Unique Evolutionary Sociology. Am. Sociol. 2020, 51, 470–505. [Google Scholar] [CrossRef]
  133. Hammerl, M. Evolutionary Theory and the Social Sciences: The Case of Evolutionary Sociology. Poster Presentation in the 7th 7th International Society for Human Ethology (ISHE) Summer Institute: Zadar. 2019. Available online: https://www.researchgate.net/publication/335393048_Evolutionary_Theory_and_the_Social_Sciences_The_Case_of_Evolutionary_Sociology (accessed on 11 July 2022).
  134. Takács, K. Discounting of Evolutionary Explanations in Sociology Textbooks and Curricula. Front. Sociol. 2018, 3, 24. [Google Scholar] [CrossRef]
  135. Pedersen, N.L.; Plomin, R.; McClearn, G.E.; Friberg, L. Neuroticism, Extraversion, and Related Traits in Adult Twins Reared Apart and Reared Together. J. Personal. Soc. Psychol. 1988, 55, 950–957. [Google Scholar] [CrossRef]
  136. Plomin, R.; Corley, R.; Caspi, A.; Fulker, D.W.; DeFries, J. Adoption Results for Self-Reported Personality: Evidence for Nonadditive Genetic Effects? J. Personal. Soc. Psychol. 1998, 75, 211–218. [Google Scholar] [CrossRef]
  137. Smith-Woolley, E.; Selzam, S.; Plomin, R. Polygenic score for educational attainment captures DNA variants shared between personality traits and educational achievement. J. Pers. Soc. Psychol. 2019, 117, 1145–1163. [Google Scholar] [CrossRef] [PubMed]
  138. Hill, W.D.; Arslan, R.C.; Xia, C.; Luciano, M.; Amador, C.; Navarro, P.; Hayward, C.; Nagy, R.; Porteous, D.J.; McIntosh, A.M.; et al. Genomic analysis of family data reveals additional genetic effects on intelligence and personality. Mol. Psychiatry 2018, 23, 2347–2362. [Google Scholar] [CrossRef] [PubMed] [Green Version]
  139. Penke, L.; Denissen, J.J.; Miller, G.F. The Evolutionary Genetics of Personality. Eur. J. Personal. 2007, 21, 549–587. [Google Scholar] [CrossRef]
  140. Brandon, R.N.; Carson, S. The Indeterministic Character of Evolutionary Theory: No “No Hidden Variables Proof” But no Room For Determinism Either. Philos. Sci. 1996, 63, 315–337. [Google Scholar] [CrossRef] [Green Version]
  141. Zietsch, B.P.; de Candia, T.R.; Keller, M.C. Evolutionary Behavioral Genetics. Curr. Opin. Behav. Sci. 2015, 2, 73–80. [Google Scholar] [CrossRef] [PubMed] [Green Version]
  142. Tanksley, P.T.; Motz, R.T.; Kail, R.M.; Barnes, J.C.; Liu, H. The Genome-Wide Study of Human Social Behavior and Its Application in Sociology. Front. Sociol. 2019, 4, 53. [Google Scholar] [CrossRef] [Green Version]
  143. Deichmann, U. The social construction of the social epigenome and the larger biological context. Epigenet. Chromatin 2020, 13, 37. [Google Scholar] [CrossRef]
Figure 1. Percentages of female and male faculty reporting themselves somewhat satisfied or very satisfied with their jobs. Panel (a) is 1997 and 2010 data for selected academic fields, extracted from Figure 19 of [21]. Panel (b) is 2017 data for post-secondary STEM and includes combined social science and psychology faculty (National Center for Science and Engineering Statistics (NCSES). The uncertainty whiskers in panel (b) are ±1σ standard error. See the Acknowledgements and the Supplemental Information for panel (b)’s source and data.
Psych 04 00034 g001
Figure 2. Panel (a) is the 2017 data for post-secondary STEM and combined social science and psychology faculty (National Center for Science and Engineering Statistics (NCSES). See the Acknowledgements and the Supplemental Information for source and data. Panel (b) is the expansion of the somewhat and very dissatisfied percentages in Panel (a). Panel (c) is the (female minus male) difference percentages for somewhat or very dissatisfied STEM faculty. The whiskers are ±1σ standard error (SE) of the count, except in the Figure 2c differences, where they are the root-sum-square SE values of the differences.
Psych 04 00034 g002
Figure 3. Panel (a) shows a Gaussian divided into Schneider et al., 1997, SEQ experience-rate groups for discriminant analysis [12]. In panel (b), the Gaussian is divided into Magley et al., 1999, or Munson et al., 2001, SEQ experience-rate groups for discriminant analysis [16,17]. Frequencies were normalized by the reported total number of SEQ questions.
Psych 04 00034 g003
Figure 4. Group fractions from two studies of female agribusiness employees (Sample 1) or academic faculty and staff (Sample 2) partitioned into low, moderate, and high frequencies of SEQ experiences or, at the far right, those who labeled their SEQ experiences as sexual harassment. Sample 1 or Sample 2, respectively: Schneider et al., 1997 [12], dark blue or dark red; Magley et al., 1999 [16], light blue or pink. In each case, the respective samples were composed of identical study groups and identical SEQ responses, which were segregated using equivalent numerical methods. The only analytical difference was the manner in which the researchers chose to divide the cohorts into low, moderate, and high harassment groups.
Psych 04 00034 g004
Figure 5. Psychological and work outcome variables among 22,305 military women in response to varying degrees of SEQ experiences, taken from Table 2 in Munson et al. [17] Variables are: 1, coworker satisfaction; 2, supervisor satisfaction; 3, psychological well-being; 4, emotional effects; 5, health satisfaction; 6, work group cohesiveness; 7, organizational commitment; 8, climate intolerant of sexual harassment; 9, attitudes toward sexual harassment; 10, amount of training; and 11, training effectiveness. The whiskers are ±2σ, equivalent to 95% of the response variability among individuals.
Psych 04 00034 g005
Figure 6. Discriminant group centroids of low, moderate, and high SEQ experience respondents, differentiated according to their sexual harassment self-label. Left panel is the “Combined Sample” (N = 689) of Magley et al., 1999 [16]. Right panel is the “Women First Function” (N = 19,615) of Munson et al., 2001 [17]. The whiskers represent the 95% (±2σ) variability of response.
Psych 04 00034 g006
Figure 7. SEQ experiences of academic STEM females. Bars are: (blue), from Appendix D of the NAS Report, their Figure D-1; (red), the same Figure D-1 of the NAS Report after correction for 0.72 factor correlation; and; (green), average fraction of women reporting sexual harassment across all academic departments (not STEM alone), given by positive criterion answers from two different academic SEQ studies [22,31]. The whiskers on the green bars are ±0.047. The NAS authors count the blue SEQ experiences as sexual harassment, no matter whether the respondents did so or not. The red bars indicate statistically independent SEQ experience fractions, not the incidence of SH.
Psych 04 00034 g007
Figure 8. The blue and red lines are representational data vectors separated by a 44° angle in their multi-dimensional phase space. The dotted arrows indicate that each vector has a projection onto both the x-axis and the y-axis. Explanatory ambiguity results from the fact that each SEQ facet vector is an admixture of each of the unique meanings represented by each of the orthogonal axes. However, the unique meanings themselves remain unknown, as does the dimensionality of the SH phase space.
Psych 04 00034 g008
Figure 9. Gaussians displaying the idealized population average distribution of HEXACO Emotionality for college-age female (red) or male (blue) students (Lee and Ashton, 2006) The dashed lines mark the means (F: 3.43; M: 2.96). One standard deviation above the female mean (>4.07) defines 16% of high-E individuals. In the ≥2σ high-E tail of the distribution of females, males are comparatively outnumbered by ≥60:1. Likewise, in the ≤2σ low-E tail of the distribution of males, females are comparatively outnumbered by ≥30:1.
Psych 04 00034 g009
Table 1. Percentage of Ph.D.’s transitioning toward faculty STEM positions who were female.
FieldFemale Ph.D.’s 1999–2003Applicants Who Were FemaleInvited Applicants Who Were FemaleFirst Offers that Went to Females
Biology45262834
Chemistry32182529
C. Eng.18163032
E. Eng.12111932
Math.25202832
Physics14121920
National Science Foundation survey of applicants during 2004–2005, page 7. “C. Eng.” is civil engineering. “E. Eng.” is electrical engineering.
Table 2. Percentage of rape victims and offenders reported in Kanin et al.
% Female Victims a% Male Offenders bTime FrameReference
13.44.7Prior to college[119] c
10.78College[120] d
a. Fraction of females victimized. b. Fraction of males who committed rape. c. Year prior to college (Nf = 262; Nm = 742). d. College students (Nf = 291; Nm = 388).
Publisher’s Note: MDPI stays neutral with regard to jurisdictional claims in published maps and institutional affiliations.

