Next Article in Journal
Concepts and Coefficients Based on John L. Holland’s Theory of Vocational Choice—Examining the R Package holland
Previous Article in Journal
Anonymiced Shareable Data: Using mice to Create and Analyze Multiply Imputed Synthetic Datasets
 
 
Please note that, as of 22 March 2024, Psych has been renamed to Psychology International and is now published here.
Article

The Application of the SKT Short Cognitive Performance Test to English-Speaking Populations

1
Department of Psychology, University of Erlangen-Nuremberg (FAU), 91052 Erlangen, Germany
2
Institute of Gerontology, College of Public Health, University of Georgia, Athens, GA 30319, USA
*
Author to whom correspondence should be addressed.
Psych 2021, 3(4), 717-727; https://doi.org/10.3390/psych3040046
Submission received: 25 October 2021 / Revised: 5 November 2021 / Accepted: 18 November 2021 / Published: 24 November 2021
(This article belongs to the Section Neuropsychology, Mental Health and Brain Disorders)

Abstract

:
The SKT (Syndrom-Kurz-Test) is a well-established short cognitive performance test for the detection of attention and memory deficits in Germany. The goal of this paper is to test whether the SKT could be applied to English-speaking populations to screen cognitive impairments in the US, Australia, and Ireland. A regression-based continuous norming technique was applied. Standardized test results obtained from German-speaking (n = 1056) and English-speaking (n = 285) samples were compared. Both samples consisted of cognitively unimpaired, community-dwelling, and independently living volunteers (non-patients) over 60 years of age. Means, medians, and standard deviations of raw scores were calculated. A high similarity in the raw value distributions of the criterion variables and a comparison of German and English multiple regression residuals indicated the equivalence among the samples. In addition, the obtained multiple regression equations for predicting the subtest scores including the explained variances (R2) were highly comparable. Age and intelligence turned out to be the most important and necessary predictors for each subtest performance. The results suggest that the new regression-based norming of the SKT can be validly used in the three English-speaking countries.

1. Introduction

The SKT (Syndrom-Kurz-Test) Short Cognitive Performance Test by Erzigkeit [1] is a diagnostic instrument for the early detection of cognitive deterioration and the assessment of the cognitive decline severity. The SKT is well-established in Germany, and manuals for its use are available in numerous languages, including English [2]. The SKT measures memory performance and attention in terms of processing speed; for a short description of the SKT, see also [3].
The goal of this paper was to examine whether the modern regression-based continuous norming technique (i.e., [4]) with the SKT is also applicable to English-speaking populations. For this reason, we compared the test results and the standardization based on a German-speaking sample with those based on English-speaking samples.
The raw scores of the SKT subtests can be converted into norm values which are summed into a total summary score and two subscores for memory and attention. The summary score is used to assess the severity of cognitive impairments. Numerous studies have empirically confirmed the two-factor structure of the SKT with the two dimensions of attention in the sense of processing speed and memory [5,6]. Stemmler and colleagues [7] also tested the SKT using item-response theory and found that a two-dimensional graded response model provided the best fit. This structure forms the basis for a meaningful interpretation of the two subscores.
In 2015, the German version of the SKT was subjected to a new standardization to update the old norming and to be more sensitive to early cognitive decline; the old norming turned out to be too lenient in the early stages of cognitive decline, producing too many false negatives [8]. Instead of using norming tables, a regression-based continuous norming approach was used to compare the obtained test scores of a subject with those of a norming sample [9]. A test score was predicted for each test person while taking into account individual characteristics of that person (i.e., age, gender, and intelligence); then the actually observed test score was compared to the predicted score. This Continuous Norming approach was proposed by Zachary and Gorsuch [4]. Here, multivariate regression equations are calculated, which include all predictor variables significantly related to the test performance. Based on the data of the total norming sample, the population parameters can be estimated [4].
In the new German norming of the SKT, linear regression equations with the predictors age, intelligence, and gender were created for all SKT subtests. These equations were used to predict the expected test performance of a person which is then compared to the observed test performance. To compare the observed performance with the predicted performance, the estimated value is subtracted from the observed value, and the difference is divided by s Y ^ , the standard error for a new observation as suggested by Crawford and Howell [10]. The result is a t-distribution with n−2 degrees of freedom [9,11]. A positive difference between observed and predicted values indicates that the person performed better than predicted. In this case, 0 deviation points or norm values are assigned. If there is a substantial negative difference, comparable to the percentile rank (PR) between PR 25 and PR 16 of the t-distribution, then the norm value 1 is assigned. If the negative difference is even larger, comparable to the percentile rank of 16 or below, then the test person receives 2 deviation points or norm values in the respective subtest (cf. [12]). The norm values or deviation points can then be summed up to a total summary score, which ranges from 0 to 18 points. A cross-validation study by Hessler and colleagues [13] showed that the newly normed SKT was able to detect cognitive decline at early stages. Since the new regression-based norming for German-speaking countries has proven successful in recent years, the goal of this paper is to evaluate whether this SKT standardization can be applied to English-speaking samples.

2. Methods

2.1. Participants

The older adults were recruited from German- and three English-speaking countries.

2.2.1. German-Speaking Sample

For the German norming sample, data of 1053 cognitively unimpaired, community-dwelling, and independently living persons (i.e., non-patients) aged 60 to 91 years with German as their first language were collected from a total of eight test centers in Germany and Austria. The inclusion and exclusion criteria as well as the collected variables largely corresponded to those of the English-speaking sample described below. Intelligence was assessed using the Matrix Reasoning and Vocabulary test of the Wechsler Adult Intelligence Scale (WAIS-IV; [14,15]) or the Vocabulary Test (WST; Schmidt and Metzler, [16]). The results of different measures of intelligence were transformed into Wechsler value points (i.e., mean (M) of 10 and standard deviation (SD) of 3) to be comparable.
The sample consisted of 584 (55.5%) women and 469 (44.5%) men. The average age was 71.5 (SD = 7.4) years (cf. [11]). The group of individuals aged 60–69 accounted for 43.4%, those 70–79 for 40.0%, those 80–84 for 9.8%, and those 85 or older for 6.8% of the total sample. The sample was recruited through newspaper ads and postings on the university websites.

2.2.2. English-Speaking Samples

Samples from three English-speaking countries were collected. Data from 285 older people were collected in the period from October 2016 to January 2018. The survey took place in three test centers: Tulsa, Oklahoma, USA by Tulsa Clinical Research LLC; in Sydney, Australia at the University of New South Wales Medicine, School of Psychiatry at the Centre for Healthy Brain Ageing as part of the Sydney Memory and Ageing Study (MAS); and in Cork, Ireland by the School of Applied Psychology at University College Cork.
The norming sample included cognitively unimpaired, community-dwelling, and independently living persons (i.e., non-patients) with English as their first language who were older than 60 years of age at the time of testing and whose data sets were complete. Exclusion criteria were severe sensory impairment, the use of antidementia drugs, the presence of dementia, or other conditions that may affect cognitive performance, such as depression. In Sydney and Cork, the Mini Mental State Examination (MMSE; Folstein, Folstein, and McHugh [17]) was used to control for the level of cognitive functioning associated with the SKT. In Sydney, the subjects were taking part in the Memory and Aging Study (MAS); the Human Research Ethics Team of the University of New South Wales approved the study (HC No.: HC17949). In Cork, the subjects were recruited during local Bingo games. All subjects gave their informed consent for inclusion before they participated in the study (the Ethic Code of the project can be requested from the author). In Tulsa, no MMSE was used. Here, the subjects were husbands or wives, significant others, or relatives who accompanied a suspected patient to the clinic of Dr. Ralph Richter; they were asked to take part in the testing procedure while waiting (they also filled out an informed consent form before participation). Two subtests of the WAIS-III [18] were performed in order to access fluid and crystalized intelligence and to keep the testing short. Therefore, in Tulsa, we predicted the MMSE scores from the obtained intelligence value points based on the two WAIS-IV subtests (r = 0.17; p < 0.05). Age and gender were found not to be significantly correlated Spearman’s rs = −0.06 (age) and rs = −0.01 (gender; male = 0; female = 1), proving the heavy influence of intelligence on the MMSE score. The mean values of the MMSE scores for the three samples were quite similar and support the notion of a sample of non-demented older adults (Cork: M = 28.62 (SD = 2.15); Sydney: M = 28.82 (SD = 1.44); Tulsa: M = 28.84 (SD = 0.39); see Table 1). The sampling of data from three different English-speaking countries was driven by the idea of creating a sample more representative of the population by sampling a broad range of different people.
Data were collected using the parallel forms A and B of the SKT. Intelligence was assessed by tests of fluid and verbal intelligence. For this purpose, the Matrix Reasoning and Vocabulary tests of the Wechsler Adult Intelligence Scale (WAIS-III; Wechsler [18]) were used at the test centers in Cork and Tulsa, whereas in Sydney, the Digit Symbol Coding Test (DSC) of the Wechsler Adult Intelligence Scale (WAIS-IV) and the FAS, a phonemic fluency test [19] were used. The acronym FAS stands for the letters F-A-S that would be likely to stimulate a high number of responses; the raw scores of the FAS test were transformed into the Wechsler value point scale (M = 10; SD = 3) so all intelligence measures were available in the same unit.
The sample consisted of 285 persons aged between 60 and 96 years and included 162 (56%) women and 123 (43.2%) men. On average, women were 74.31 (SD = 8.98) and men were 73.78 (SD = 9.74) years old. The 60- to 69-year-old group made up 37.5% of the subjects, the 70- to 79-year-old group 31.6%, the 80- to 84-year-old group 13.0%, and the group of those aged at least 85 years 17.9%. The duration of school and vocational training in the overall sample was between six and 25 years (M = 14.31; SD = 3.95). Men, with an average of 14.96 (SD = 3.96) years, had completed a somewhat longer education and training than women with an average of 13.81 (SD = 3.88) years. The sample consisted of 118 subjects (41.4%) from Tulsa, 57 (20.0%) from Sydney, and 110 (38.6%) from Cork.
Since the validation for the English-speaking samples is based on the German norming, a significantly smaller sample size is sufficient. According to Tabachnick and Fidell [20], regression-based cross-validations usually have a sample ratio of 80:20. The present sample ratio of 1053:285 is very close to this rule of thumb, thus allowing enough power to detect significant predictors for the regression equation.

3. Procedure

To identify relevant predictors for the continuous norming and the respective multiple regression equations, correlation analyses were performed for each subtest. Those variables that were significantly related to the test performance in a subtest were included as predictors in the respective regression model. The model with the best fit was determined using the coefficient of determination 
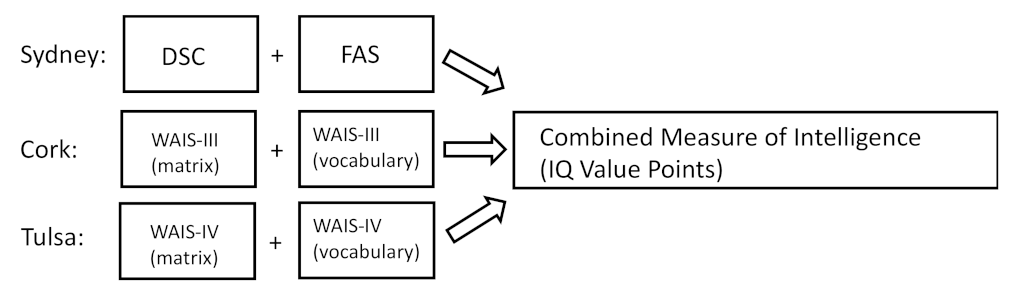
R2. Non-significant predictors were excluded from the model unless they were present in the model in a higher order (as an interaction or squared). For the predictor intelligence, the mean scores of the two test values were transformed into the Wechsler value points. We used two measures of cognitive ability, one assessing fluid intelligence (e.g., DSC and WAIS matrix reasoning) and one assessing crystalized intelligence (e.g., FAS and WAIS vocabulary). In Sydney, the FAS and DSC were applied, and two Wechsler subtests were used in Cork and Tulsa (matrix and vocabulary), although with different versions of the WAIS (e.g., either III or IV). Always the mean of the two intelligence measures was calculated and aggregated to one variable of ‘intelligence’ (see Figure 1). To avoid multicollinearity, the continuous variables age and intelligence were mean-centered. Subsequently, the interactions of age and gender, age and intelligence, and gender and intelligence were calculated.
The statistical requirements for all multiple regression analyses were fulfilled. If homoscedasticity or normal distribution requirements were not met, the criterion variable was transformed accordingly. For each SKT subtest, a multiple linear regression was calculated. The criterion was the test performance in the respective SKT subtest. In subtests I and III to VII, the test performance was represented by the required processing time measured in seconds; in subtests II, VIII, and IX, test performance was measured by the number of objects not remembered. The following variables were included as predictors: age in years, gender, and intelligence, as well as all interactions between these variables. In addition, age squared was included as a predictor to determine the acceleration of cognitive decline in very old age.
All statistical calculations were performed using SPSS version 26. The PROCESS macro for SPSS version 3.4 was used for the calculation and graphical preparation of interactions [21].

4. Results

The range of the total intelligence level extends from 3 to 18.5 Wechsler value points, which covers both extreme areas of the scale well. The average value is 10.76 value points (SD = 9.92), which corresponds to an average intelligence of about 100 to 105 IQ points. In the German normative sample, the measured intelligence was 10.67 on average.
Table 2 lists mean values, medians, standard deviations, and value ranges of the observed test performances in the nine SKT subtests for the English-speaking as well as for the German-speaking samples. The average processing time of the attention tests was between 10.3 and 29.8 seconds (s) in the English-speaking sample and between 7.7 and 23.4 s in the German-speaking sample. The subtest Naming Numerals was completed the fastest by the test subjects (subtest III) in both samples. Half of the English-speaking subjects needed no more than 9 s (M = 10.3; SD = 4.8) in comparison to 7 s (M = 7.7; SD = 2.5) in the German-speaking sample. The Reversal Naming test (subtest VII) took the longest to complete, averaging 29.8 seconds (SD = 9.7; median = 27) in the English-speaking sample and 23.4 s (SD = 6.7; median = 22) in the German-speaking sample. A comparison of the mean values with the medians indicated that the distributions for both data sets were highly skewed to the right. The median was always below the mean in all attention tests, also indicating a skewed distribution. In the Immediate Recall (subtest II) and Delayed Recall (subtest VIII) memory tests, the average number of objects not remembered by test subjects was 5.8 (SD = 2.2) for the English-speaking subjects and 5.6 (SD = 1.5) in the comparison sample. The median number of objects not remembered in these two tests was six for both samples. In the task Recognition Memory (subtest IX), the number of not-remembered objects was 1.5 (SD = 1.9), on average, in the English-speaking sample and 0.8 (SD = 1.2), on average, in the German-speaking sample. This task proved to be very easy for the cognitively unimpaired study participants. All descriptive values indicate a high similarity between the two samples despite some random fluctuations.
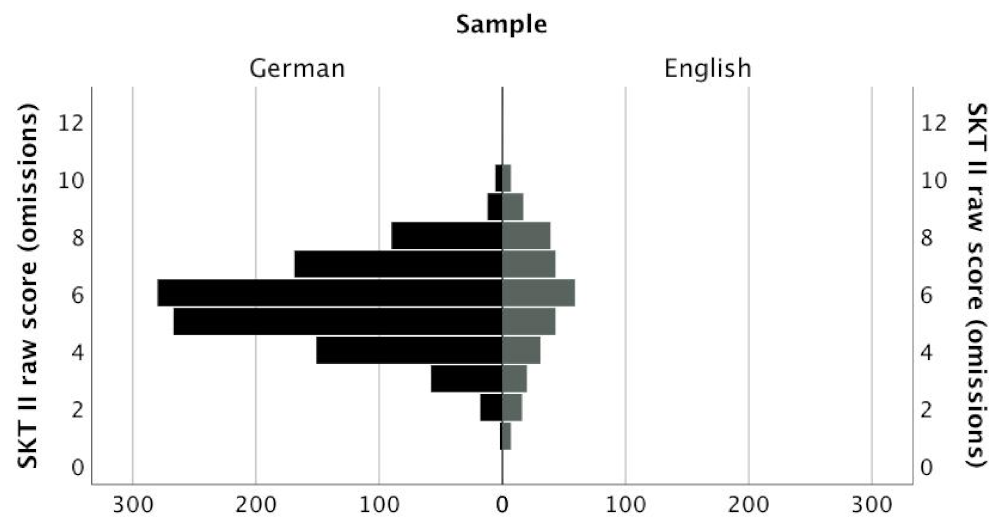
The raw value distributions of a selected SKT subtest (i.e., subtest II) for the German-speaking and English-speaking samples is shown in Figure 2. Despite different sample sizes (and therefore different heights of the histograms), the distributions of the two samples show a remarkable similarity.
The examination of the distributions showed that the regression residuals were normally distributed only for the SKT subtests II and VIII in both datasets. The regression residuals of the remaining seven subtests showed right-skewed distributions, most extremely in subtest IX (Recognition Memory). To meet the normal distribution requirement for regression residuals, the right-skewed subtests I, III, IV, V, VI, and VII were transformed as indicated in Table 3. For subtests IV and VI, a square-root transformation instead of a logarithmic transformation was applied; a logarithmic transformation was preferred over the square-root transformation if the data were more extremely skewed. For subtests I, V, and VII, a transformation using the reciprocal (1:x) was conducted; here, a logarithmic and a square-root transformation was applied in the German-speaking sample. It should be noted that a reciprocal transformation inverts the two poles of the distribution. Thus, after the transformation, low values represent a longer processing time, while high values represent a shorter processing time [22]. Subtests III, IV, and VI could be normalized by a decadic logarithm (LG10). Due to the extreme skewness of the distribution of subtest IX, it was not possible to achieve a normal distribution of residuals by any transformation.
Table 3 presents the predictors included in the respective regression models for subtests I to VIII in both samples. Age and intelligence were the most important predictors (included in all eight models of the English-speaking sample and seven models of the German-speaking sample). In three models, age squared was a significant predictor. In contrast to the English-speaking sample, age squared was not included in any of the German models; here, the interaction between intelligence and age showed significance in the regression model for subtest II (Immediate Recall). Only two regression models contained gender as a predictor for the English-speaking subjects. Gender turned out to be significant in six German regression equations. The interaction of gender and age made a significant contribution to the prediction of the score in subtest V in both datasets. All regression models achieved statistical significance. Column R2 in Table 3 lists the amount of variance explained by the respective models. It varied between 5.0% and 26.3% in the English-speaking sample and between 5.4% and 27.2% in the German-speaking sample, depending on the complexity and requirements of the cognitive task. The models of subtests I (Naming Objects) and III (Naming Numerals) had the lowest explained variance with 9.8% and 5.0% (German-speaking sample: 5.4% and 5.4%), respectively. The models of subtests V (Replacing Blocks) and VII (Reversal Naming) explained the most variance with 26.3% (about 27% in the German-speaking dataset) each, followed by subtest IV (Arranging Blocks) with 26.1% (German-speaking sample: 27.1%). In sum, the explained variance in the models was comparable in both samples. Only in subtest II did the model for the English-speaking sample (21.9%) explain considerably more variance than that of the German-speaking sample (13.4%).
The final multiple regression equations for the SKT subtests I to VIII are shown in Table 4 for both datasets. Each equation contains all predictors relevant for the prediction of the respective test result with the corresponding unstandardized regression coefficients and the intercepts. By inserting the person-specific variable characteristics, a predicted score can be calculated for each subtest, to which the observed test score can be subsequently compared. For the non-transformed subtests II and VIII, the number of objects not remembered is predicted. The predicted score of all other subtests cannot be interpreted directly because of the transformations made. Therefore, the observed scores must also be transformed accordingly for the comparison of the predicted and actually observed scores.
For subtest IX, the multiple regression calculation was not possible due to the extremely right-skewed distribution of residuals in both datasets. Instead, an area transformation of the raw values was performed (Tabachnick and Fidell [20]). The predictors age, gender, and intelligence could not be taken into account. The results of the area transformation are presented in the form of a conversion table. This enables a direct transformation of the raw scores; in this case the number of objects not recalled, into percentiles. Two-thirds of both norming samples recognized eleven or twelve objects. Only a small number of participants (less than 10%) did not remember four or more objects.

5. Discussion

The goal of this paper was to evaluate the application of the German-based cognitive SKT test on three different English-speaking populations using a regression-based norming technique [9]. Although the SKT was designed to be a culture fair German test, we were able to test convenience samples from three uniquely different English-speaking populations: the United States, Australia, and Ireland. The results showed a remarkable concordance for the use of the SKT in both German and three English-speaking populations. We were able to provide a comprehensive picture of how the newly normed German test would fare to demonstrate the utility of the SKT in the English-speaking populations.
One difference between the German- and English-language norming was that age squared proved to be a significant predictor in three regression equations in the latter, whereas age squared was not included in any German-language model. A possible reason for this discrepancy is the different age distributions of the two samples. The group of people aged 85 years and older was underrepresented in the German-speaking sample (6.8%) compared to the English-speaking sample (17.9%). A larger sample size of the oldest age group increases the probability that a significant acceleration of cognitive impairment can be observed with increased age.
Overall, however, there are clear similarities in the regression models of the German- and English-speaking samples; the SKT is validly and reliably applicable to English-speaking populations. Since the German regression-based norming has so far proven to be useful in practice and particularly sensitive in the area of mild cognitive impairment (cf. [11]), it can be assumed that these favorable characteristics will also be evident for the English-language norming. The use for the new English-language sample of the methodological approach developed in the German norming thus appears justified.
On the other hand, the above-mentioned differences between the samples underline the need for a fine-tuning of the standardization and the need to calculate extra regression equations for the English-speaking world. A simple translation of the German manual and the complete adoption of the German standards would have led to a significant loss of validity of the SKT in English-speaking populations. The modern regression-based norming of the SKT now offers the advantage of continuous norming. More predictors and the interactions between different predictors can now be considered. In addition, a new evaluation program (i.e., EXCEL sheet) for computers makes it easier to convert the raw values into standard values and to assess the severity of cognitive impairment.
Another limitation was that we did not use the MMSE in Tulsa. We used two subtests of the WAIS-III (matrices and vocabulary test) to measure the current level of intelligence and regression equations based on age, gender, and intelligence to predict the MMSE. Intelligence was the only significant predictor. Testing and controlling for the influence of age and intelligence as important predictors for cognitive performance in older adults is another reason to plea for more regression-based norming in the area of gerontology.
Unfortunately, different testing centers used different measures of intelligence. We preferred any valid measure of intelligence over an estimate of intelligence, such as an estimate based on years of education. The different measures were made comparable through a transformation into the Wechsler norm values. To account somewhat for the different intelligence tests used, two measures of intelligence were always used: one for fluid intelligence and one for crystallized intelligence.
More limitations can be seen in the much smaller English sample size in comparison to the German one (n = 285 versus n = 1051). It would have been more appropriate if other countries would have participated, such as Great Britain, Canada, or India, in order to obtain a more representative sample of the English-speaking world. However, the SKT consists of almost culturally free test stimuli (e.g., painted objects, Arabic numerals, and other symbols) and one can assume that the assessment of the cognitive functioning of older adults in the remaining English-speaking countries would be equivalently valid while using the regression-based norming approach which controls for age, gender, intelligence, and all possible interactions.
Nevertheless, it is desirable to review the new English language norms in the near future based on further national samples. Cross-validations on clinical samples should be carried out to investigate whether the English regression-based norming of the SKT is suitable as a reliable assessment of cognitive disorders, especially in the area of MCI, and how well the results of the SKT correspond to the clinical diagnoses of experts (cf. [23]).
Future work should aim at creating a regression-based norming of the SKT for other languages, too. We are in the process of validating the SKT in China [24]. In addition, for the new regression-based norming, the sewing test in practice is still missing.

6. Conclusions

The SKT Short Cognitive Performance test is a well-established test for the assessment of cognitive impairment in terms of memory and speed of information processing. The SKT, which is an almost culturally free test, was already translated in several languages. In 2015, a new the regression-based norming was applied to the German SKT version to improve the sensitivity for early cognitive decline. In 2019, the same continuous norming approach was also applied to data from English speaking samples. The German and English norming revealed measurement equivalence. The SKT can therefore be validly used to screen cognitively impaired older adults in German- and English-speaking countries.

Author Contributions

S.M.V.S., L.W.P. and M.S. wrote the manuscript; S.M.V.S. performed all the statistical analyses. This article is based on S.M.V.S.’s master thesis (supervisor: M.S.). M.S. and S.M.V.S. worked together in planning, running, and evaluating the new standardization of the SKT in English. L.W.P. gave scientific advice for the English validation. All authors have read and agreed to the published version of the manuscript.

Funding

This study was financially supported by Dr. Willmar Schwabe Inc., Karlsruhe, Germany.

Institutional Review Board Statement

In Sydney, the subjects were taking part in the Memory and Aging Study (MAS); the Human Research Ethics Team of the University of New South Wales approved the study (HC No.: HC17949).

Informed Consent Statement

In Cork, the subjects were recruited during local Bingo games. All subjects gave their informed consent for inclusion before they participated in the study (the Ethic Code of the project can be requested from the author). In Tulsa, the subjects were husbands or wives, significant others, or relatives who accompanied a suspected patient to the clinic of Dr. Ralph Richter; they were asked to take part in the testing procedure while waiting (they also filled out an informed consent form before participation).

Data Availability Statement

Data were collected in a complex and high-cost multi-center study in Germany, Australia, Ireland and the US from 2013 to 2019. The data collection in Australia was part of the ongoing Sydney Memory and Aging Study (MAS) and thus belongs to a larger project in which I am not principal investigator. Therefore, legal rights concerning proprietary data preclude their release.

Acknowledgments

The authors express their gratitude to Ralph Richter, Sadie Fuller, and Raminta Wilson of the Tulsa Clinical Research LLC (USA); to Henry Brodaty, Perminder Sachdev, Katya Numbers, and Adam Benvelzen from the Sydney Memory and Aging Study (MAS) of the University of New South Wales Medicine, School of Psychiatry in the Centre for Healthy Brain Ageing (Australia); as well as to Sean Hammond, Annalisa Setti, and Mike Murphy of the University College Cork, School of Applied Psychology (Ireland) for data collection. We thank Sandra Schläfke and Rainer Diebow (Willmar Schwabe) for creating a new Excel spreadsheet for the English norming and to Robert Hoerr (Willmar Schwabe) for his helpful comments on an earlier version of the manuscript.

Conflicts of Interest

Sophia M. V. Schneider and Leonard W. Poon have no conflicts of interest. SKT copyright Andreas Erzigkeit, owner of Geromed Ltd. (Spardorf, Germany; [email protected]). Mark Stemmler received fees from Geromed Ltd. for scientific advice.

References

  1. Erzigkeit, H. Der Syndrom-Kurztest zur Erfassung von Aufmerksamkeits und Gedächtnisstörungen: SKT [The SKT a Short Cognitive Performance Tests for the Assessment of Memory and Attention]; Vless Publishing: Vaterstetten, Germany, 1977. [Google Scholar]
  2. Stemmler, M.; Lehfeld, H.; Erzigkeit, A. SKT. A Short Cognitive Performance Test according to Hellmut Erzigkeit. SKT English Manual Edition 2019; Geromed Publishing: Spardorf, Germany, 2019. [Google Scholar]
  3. Schneider, L.S. Rating Scales and Outcome Variables Used in Clinical Trials. In Alzheimer’s Disease: A Physician’s Guide to Practical Management; Richter, R.W., Richter, B.Z., Eds.; Humana Press: Totowa, NJ, USA, 2004; pp. 337–349. [Google Scholar]
  4. Zachary, R.A.; Gorsuch, R.L. Continuous norming: Implications for the WAIS-R. J. Clin. Psychol. 1985, 41, 86–94. [Google Scholar] [CrossRef]
  5. Kim, Y.S.; Nibbelink, D.W.; Overall, J.E. Factor structure and scoring of the SKT test battery. J. Clin. Psychol. 1993, 49, 61–71. [Google Scholar] [CrossRef]
  6. Lehfeld, H.; Rudinger, G.; Rietz, C.; Heinrich, C.; Wied, V.; Fornazzari, L.; Pittas, J.; Hindmarch, I.; Erzigkeit, H. Evidence of the cross-cultural stability of the factor structure of the SKT short test for assessing deficits of memory and attention. Int. Psychogeriatr. 1997, 9, 139–153. [Google Scholar] [CrossRef] [PubMed]
  7. Stemmler, M.; Keller, F.; Fasan, R. Item Response Theory (IRT) analysis of the SKT Short Cognitive Performance Test. Psychol. Test Assess. Modeling. 2019, 61, pp. 149–160. Available online: https://www.psychologie-aktuell.com/fileadmin/Redaktion/Journale/ptam-2019-2/02_Stemmler.pdf (accessed on 20 November 2021).
  8. Merten, T. Über den und Unsinn der Verwendung von Screening-Instrumenten in der neuropsychologischen Diagnostik [On the sense and nonsense of using screening instruments in neuropsychological assessment]. Diagnostica 1999, 45, 154–162. [Google Scholar] [CrossRef]
  9. Crawford, J.R.; Garthwaite, P.H. Comparing patients’ predicted test scores from a regression equation with their obtained scores: A significance test and point estimate of abnormality with accompanying confidence limits. Neuropsychology 2006, 20, 259–271. [Google Scholar] [CrossRef] [PubMed] [Green Version]
  10. Crawford, J.R.; Howell, D.C. Comparing an individual’s test score against norms derived from small samples. Clin. Neuropsychol. 1998, 12, 482–486. [Google Scholar] [CrossRef]
  11. Stemmler, M.; Lehfeld, H.; Siebert, J.; Horn, R. Ein kurzer Leistungstest zur Erfassung von Störungen des Gedächtnisses und der Aufmerksamkeit: SKT Manual Edition 2015–und der regressionsbasierte Ansatz [A brief performance test to assess impairment of memory and attention: SKT Manual Edition 2015-and the regression-based approach]. Diagnostica 2017, 63, 243–255. [Google Scholar] [CrossRef]
  12. Stemmler, M.; Hessler, J.B.; Bickel, H. Predicting cognitive decline and dementia with the newly normed SKT short cognitive performance test. Dement. Geriatr. Cogn. Disord. Extra 2019, 9, 184–193. [Google Scholar] [CrossRef]
  13. Hessler, J.B.; Stemmler, M.; Bickel, H. Cross-validation of the newly-normed SKT for the detection of MCI and dementia. GeroPsych J. Gerontopsychol. Geriatr. Psychiatry 2016, 30, 19–25. [Google Scholar] [CrossRef]
  14. Wechsler, D.; Coalson, D.L.; Raiford, S.E. WAIS-IV Technical and Interpretive Manual; Pearson: Boston, MA, USA, 2008. [Google Scholar]
  15. Petermann, F. (Ed.) Wechsler Adult Intelligence Scale–Fourth Edition (WAIS-IV); German Version; Pearson Assessment: Frankfurt, Germany, 2012. [Google Scholar]
  16. Schmidt, K.-H.; Metzler, P. Wortschatztest: WST Vocabulary Test; Beltz: Weinheim, Germany, 1992. [Google Scholar]
  17. Folstein, M.F.; Folstein, S.E.; McHugh, P.R. Mini-mental state. A practical method for grading the cognitive state of patients for the clinician. J. Psychiatr Res. 1975, 12, 189–198. [Google Scholar] [CrossRef] [PubMed]
  18. Wechsler, D. WAIS-III, Wechsler Adult Intelligence Scale: Administration and Scoring Manual (Manual III); Psychological Corporation: San Antonio, TX, USA, 1997. [Google Scholar]
  19. Trollor, J.N.; Smith, E.; Agars, E.; Kuan, S.A.; Baune, B.T.; Campbell, L.; Samaras, K.; Crawford, J.; Lux, O.; Kochan, N.A.; et al. The association between systemic inflammation and cognitive performance in the elderly: The Sydney Memory and Ageing Study. Age 2012, 34, 1295–1308. [Google Scholar] [CrossRef] [PubMed] [Green Version]
  20. Tabachnick, B.G.; Fidell, L.S. Using Multivariate Statistics, 5th ed.; Pearson/Allyn & Bacon: Boston, MA, USA, 2007. [Google Scholar]
  21. Hayes, A.F. Introduction to Mediation, Moderation, and Conditional Process Analysis: A Regression-Based Approach, 2nd ed.; Guilford Press: New York, NY, USA, 2018. [Google Scholar]
  22. Field, A.P. Discovering Statistics Using IBM SPSS Statistics: And Sex and Drugs and Rock “n” Roll, 4th ed.; Sage: London, UK, 2013. [Google Scholar]
  23. Lehfeld, H.; Stemmler, M. The newly normed SKT reveals differences in neuropsychological profiles of patients with MCI, mild dementia and depression. Diagnostics 2019, 9, 163. [Google Scholar] [CrossRef] [Green Version]
  24. Lu, Y.; Hu, J.; Stemmler, M.; Guo, Q. Validation of Chinese version of SKT (Syndrom Kurztest (SKT): A short cognitive performance screening test of or the assessment of memory and attention. Diagnostics 2021, in press. [Google Scholar] [CrossRef]
Figure 1. Aggregation of the intelligence score. Note. FAS = phonemic fluency test; DSC = digital symbol coding test; WAIS = Wechsler Adult Intelligence Scale; WAIS (matrix) = subtest matrix reasoning; WAIS (vocabulary) = subtest vocabulary test.
Psych 03 00046 g001
Figure 2. Raw score distributions of the German and English sample for SKT subtest II (Immediate Recall).
Psych 03 00046 g002
Table 1. Descriptive statistics for the subsamples.
City AgeEducation YearsMMSEIntelligence
MSDMSDMSDMSD
Cork70.306.5213.593.8628.622.159.522.52
Tulsa71.277.6716.543.7628.84 a0.3911.513.08
Sydney87.213.6413.493.4928.921.4411.572.43
Note: nCork = 110; 57.3% female. nTulsa = 118; 55.9% female. nSydney = 57; 57.9% female. M = mean; SD = standard deviation. a The MMSE was not applied in Tulsa; the scores were predicted by a simple regression based on the intelligence value points.
Table 2. Descriptive statistics for the SKT subtests.
SubtestFactorRaw ScoreM (SD)MedianRange
EGEGEG
SKT IAttentionSeconds14.9 (5.1)10.8 (4.3)14107–373–47
SKT IIMemoryOmissions5.8 (2.2)5.6 (1.5)660–121–10
SKT IIIAttentionSeconds10.3 (4.8)7.7 (2.5)973–313–27
SKT IVAttentionSeconds23.8 (9.1)18.5 (6.3)22177–605–60
SKT VAttentionSeconds19.2 (8.1)15.3 (5.4)18149–606–60
SKT VIAttentionSeconds25.3 (9.0)19.9 (5.4)231912–608–50
SKT VIIAttentionSeconds29.8 (9.7)23.4 (6.7)272213–6012–60
SKT VIIIMemoryOmissions5.8 (2.6)4.9 (1.9)650–120–12
SKT IXMemoryOmissions1.5 (1.9)0.8 (1.2)100–120–12
Note: E = English-speaking sample (n = 285); G = German-speaking sample (n = 1053). M = mean; SD = standard deviation.
Table 3. Transformation of the SKT raw scores, significant predictors, and R² of the final multiple regression models for every SKT subtest (n = 285); significant predictors and R² of the German sample for comparison (n = 1053).
SKT-
Subtest
TransformationPredictors
English Sample
Predictors
German Sample
R² ER² G
SKT I1:xA, IQA, IQ, G0.0980.054
SKT IInoneA, IQ, A2A, IQ, G, IQxA0.2190.134
SKT IIILG10A, IQ, A2A, G0.0500.054
SKT IVLG10A, IQ, GA, IQ, G0.2610.271
SKT V1:xA, IQ, G, GxAA, IQ, G, GxA0.2630.271
SKT VILG10A, IQA, IQ0.1780.151
SKT VII1:xA, IQ, A2A, IQ, G0.2630.272
SKT VIIInoneA, IQA, IQ, G0.1540.130
SKT IX Area TransformationArea Transformation
Note: A: age; A2: age squared; IQ: IQ points; G: gender; IQxA: interaction between IQ and age; GxA: interaction between gender and age. E = English-speaking sample (n = 285); G = German-speaking sample (n = 1053).
Table 4. Multiple regression equations to predict individual reference standards in SKT subtests I to VIII (n = 285) in the English and German sample.
SKT SubtestMultiple Regression Equations
Naming ObjectsEnglish: SKT I = (−0.001) A + 0.002 IQ + 0.074
German: SKT I = (−0.001) A + 0.001 IQ + 0.006 G + 0.101
Immediate RecallEnglish: SKT II = 0.088 A + (−0.165) IQ + 0.003 A2 + 5.505
German: SKT II = 0.061 A + (−0.085) IQ + (−0.447) G + 0.006 (IQxA) + 5.850
Naming NumeralsEnglish: SKT III = (−0.001) A + (−0.007) IQ + (−0.001) A2 + 1.100
German: SKT III = 0.006 A + (0.103) G + 1.942
Arranging BlocksEnglish: SKT IV = 0.006 A + (−0.018) IQ + (−0.039) G + 1.371
German: SKT IV = 0.042 A + (−0.059) IQ + (−0.20) G + 4.360
Replacing BlocksEnglish: SKT V = (−0.001) A + 0.002 IQ + 0.002 G + (−0.001) GxA + 0.058
German: SKT V = 0.014 A + (−0.026) IQ + (−0.078) G + 0.005 GxA + 2.724
Counting SymbolsEnglish: SKT VI = 0.005 A + (−0.014) IQ + 1.1379
German: SKT VI = 0.027 A + (−0.039) IQ + 4.429
Reversal NamingEnglish: SKT VII = (−0.001) A + 0.002 IQ + 0.001 A2 + 0.035
German: SKT VII = 0.027 A + (−0.039) IQ + (−0.127) G + 4.863
Delayed RecallEnglish: SKT VIII = 0.101 A + (−0.169) IQ + 5.787
German: SKT VIII = 0.075 A + (−0.109) IQ + (−0.671) G + 5.288
Note: English = English-speaking sample; German = German-speaking sample; A: age; A2: age squared; IQ: IQ points; G: gender (male = 0; female = 1); GxA: interaction between gender and age.
Publisher’s Note: MDPI stays neutral with regard to jurisdictional claims in published maps and institutional affiliations.

