Next Article in Journal
A Pilot Study of a Mindfulness-Based Stress Reduction Programme in Patients Suffering from Atopic Dermatitis
Next Article in Special Issue
Why Do Students Become Cyberbullies? Elucidating the Contributions of Specific Developmental Risks to Cyberbullying
Previous Article in Journal
An Evaluation of DIF Tests in Multistage Tests for Continuous Covariates
Previous Article in Special Issue
Evaluating Caregiver Risk: The Dementia Caregiver Interview Guide
 
 
Please note that, as of 22 March 2024, Psych has been renamed to Psychology International and is now published here.
Article

Listening to People with Misophonia: Exploring the Multiple Dimensions of Sound Intolerance Using a New Psychometric Tool, the S-Five, in a Large Sample of Individuals Identifying with the Condition

1
Psychometrics and Measurement Lab, Biostatistics and Health Informatics Department, Institute of Psychiatry, Psychology and Neuroscience, King’s College, London SE5 8AB, UK
2
Centre for Anxiety Disorders and Trauma, South London and Maudsley NHS Foundation Trust, London SE5 8AZ, UK
3
Department of Experimental Psychology, University of Oxford, Oxford OX2 6GG, UK
*
Author to whom correspondence should be addressed.
Psych 2021, 3(4), 639-662; https://doi.org/10.3390/psych3040041
Submission received: 10 August 2021 / Revised: 18 October 2021 / Accepted: 20 October 2021 / Published: 28 October 2021
(This article belongs to the Special Issue Prominent Papers in Psych  2021–2023!)

Abstract

:
Misophonia involves a strong emotional response to certain sounds and can cause significant distress and functional impairment. The aim of this study was to present and psychometrically evaluate a new, multidimensional measure of misophonia, the S-Five. The study also aimed to present and test a supplementary tool, a checklist of triggers that measure the nature and intensity of reactions. The stages of development for the measure are described. Psychometric testing on the final version of the tool was conducted using a sample of 828 individuals who identified with having misophonia. Analyses included factor structure assessment, measurement invariance testing, reliability (test–retest and internal consistency), and (concurrent) convergent validity assessment. Five factors emerged in the S-Five as dimensions of the experience of misophonia: internalising appraisals, externalising appraisals, sense of emotional threat, outbursts, and impact. No measurement bias was identified with respect to gender and age. All reliability and validity indices were satisfactory. The S-Five is a multidimensional measurement scale with satisfactory psychometric properties and will be a valuable tool for improving understanding of misophonia in research and clinical settings.

1. Introduction

Misophonia, also known as selective sound sensitivity syndrome (4S), is a relatively newly recognised disorder characterised by a disproportionate emotional response to certain everyday sounds [1,2]. It can cause significant distress in those reporting the condition and can lead to impairment in social and occupational functioning as well as reduced ability to relax or enjoy leisure activities [1,3,4,5,6]. Despite the reported negative impact of misophonia, and prevalence estimates of around 5–20% in some samples [6,7], this is a relatively unknown and under-researched condition [8,9].
One of the biggest limitations to misophonia research has been the absence of a validated psychometric tool for assessing the presence and severity of symptoms. In a recent scoping review, Potgieter et al. [9] identified nine questionnaires referring to misophonia appearing in research literature, none of which had been subjected to formal psychometric evaluation. The review highlighted the need for a robust, multidimensional outcome measure of misophonia to be developed for use in research and treatment. We briefly present here currently existing scales for misophonia to illustrate their unique designs and scopes.
The misophonia questionnaire (MQ) [6] is composed of three sections. First is the misophonia symptom scale (MSYS), assessing sensitivity to specific triggers in comparison to other people. Second is the misophonia emotions and behaviours scale (MEBS), which asks about reactions to triggering sounds. Third, the misophonia severity scale (MSES), adapted for misophonia from the NIMH global obsessive-compulsive scale (NIMH GOCS) [6,10], is a single item rating the severity of sound sensitivity. It has shown good internal consistency, but a full psychometric evaluation has not been published.
The Amsterdam misophonia scale (A-MISO-S) [5] was adapted from the Yale–Brown obsessive compulsive scale (YBOCS) [11], an established clinician-rated tool for measuring the severity of OCD symptoms. A revised version of the A-MISO-S was published recently (AMISOS-R) [12], consisting of three sections. The first section asks participants to select which groups of sounds (that is, eating sounds, nasal sounds) they are sensitive to, in comparison to other people. The second section asks which emotions are evoked by sounds, with the option of selecting irritation, anger, disgust, and/or specifying “other” emotions. The third section of the AMISOS-R covers a range of possible aspects of distress or impairment associated with reactions to sounds. Full psychometric properties of the A-MISO-S and AMISOS-R have not been published.
Potgieter et al. [9] described several other unvalidated outcome measures for misophonia, including the single-item misophonia activation scale (MAS-1) [13] and the misophonia assessment questionnaire (MAQ) [14], which asks about the emotional, social, and functional impact of “sound issues”, but has not been tested to establish whether it captures the impact of misophonia specifically [15].
Another questionnaire, MisoQuest [16], published since the review by Potgieter et al. [9], was developed based on the diagnostic criteria proposed by Schröder et al. [5], which have been subsequently revised [12]. Psychometric testing found the unidimensional measure to be a valid and reliable tool for screening for the presence of misophonia when the Schröder et al. [5] diagnostic criteria are being used. However, it is not presented as a measure of symptom severity.
The most recent misophonia scale published is the Duke Misophonia Questionnaire (DMQ). This is a comprehensive 86-item tool comprising nine standalone scales (trigger frequency, affective responses, physiological responses, cognitive responses, coping before, coping during, coping after, impairment, and beliefs). These scales were designed and tested as separate scales and then combined to form two composite scales, the symptom scale (combining the three “responses” subscales) and the coping scale (combining the three coping subscales).
These two recently published measures, MisoQuest and DMQ, offer improvements on the pre-existing scales, most of which were limited in scope and not fully validated. The DMQ is the most extensive tool published to date, with two composite scales capturing many of the components identified in the recently published “consensus definition” of misophonia (for pre-print, see [12]). At this stage, there are no published scales that have been developed using multidimensional reflective latent variables models with the purpose of identifying the dimensions of misophonia. The present study aimed to develop a short and straightforward tool that would be able to provide reliable and valid measurement of misophonia, capturing the rich and varied experience of the phenomenon. The theoretical background for the item development is described below.
During incidents where they are triggered by sounds, individuals with misophonia have reported feelings of anger [12,17,18], distress [14,17,19,20], disgust [12,21], and anxiety [18,22]. People who identify with the condition have described negative appraisals about the character and intent of the perpetrators of sounds [3,4,18,19], intrusive thoughts about the sounds and the people making them [21], and a sense of violation from friends and family members who make noises despite being aware of the individual’s sensitivities [17,19,23].
Some individuals report perceived loss of control when triggered [12,24] and urges of verbal and physical aggression [17]. Catastrophic predictions are made about what would happen if unable to escape sounds, such as being unable to cope [19], having verbal and physical outbursts [4,18,24], embarrassing oneself, and physically exploding [17]. Safety-seeking behaviours intended to prevent predicted outcomes in the moment include leaving the situation [17,22], blocking sounds [21,22,24], distraction, seeking reassurance [18], and verbal aggression [18,24]. Physical outbursts towards others [21,25] and the environment [18], while rare [12], have also been reported.
Appraisals directed towards oneself also appear to happen both during and after being triggered by sounds, contributing to feelings of shame, guilt, regret, and embarrassment [3,17,23,24,25]. Individuals describe a sense of failure, sadness, and concern about the impact that condition has on their lives [3,4,17]. They hold beliefs about how they come across to others in moments of reacting to sounds [23] and worry about being judged [17].
The impact of misophonia is not contained to moments of being bothered by sounds, with reports of anticipatory anxiety about eating situations [21], rumination and replaying events [20], and beliefs about continuing to be bothered by sounds and being impacted negatively in the future [18]. Common strategies intended to minimise impact include avoidance [4,17,19,21], withdrawal, and organising life in a way so as not to encounter triggers [17,19,20,21,22,24].
In addition to reported impact on social functioning, relationships, and work [3,4], case studies have reported loss of enjoyment of life [24], needing to be home schooled [22], a desire to be made deaf [26], and attempted suicide [21] as a result of misophonia.
The aim of the present study was to develop and test a self-reported measurement tool that would capture the multidimensional nature of misophonia. We had four main goals.
  • To develop a tool that would be multidimensional, identifying, and measuring the complex nature of the misophonic experience.
  • To make the tool brief enough to use routinely for evaluations in both research and clinical practice.
  • To ensure excellent psychometric properties, including being unbiased with respect to gender and age of the respondent.
  • To create a supplementary scale to quantify the burden of triggers, capturing the nature of reactions, number of triggers, intensity of the reaction, and the synergy of number and intensity. We aimed to do this with a flexible format to allow researchers and clinicians to add or remove sounds.
The selective sound sensitivity syndrome scale (S-Five) builds on a reflective latent variables model, where each question is an indicator of the assumed underlying misophonia, and groups of indicators capture different dimensions of the misophonic experience. That is, the dimensions emerged as latent variables from a pool of items, rather than the tool being built from a priori defined dimensions.
In this article, we describe the methodological steps taken, and reveal the psychometric value of the final tool. We present first the steps taken in the development of the items content and the three different waves of sampling and item refinement. We then explore the dimensionality of the final tool, and within each dimension, we provide evidence of the reliability and the validity of the measurement. We then describe in detail the triggers checklist and the construction of its summary scores.

2. Materials and Methods

For the development of the scale and for establishing the analysis plan, we followed the consensus-based standards for the selection of health measurement instruments (COSMIN) [27,28] and the contemporary psychometrics checklist (ConPsy) [29] recommendations. The scale was developed over four waves between January 2019 and March 2020 (Figure 1).

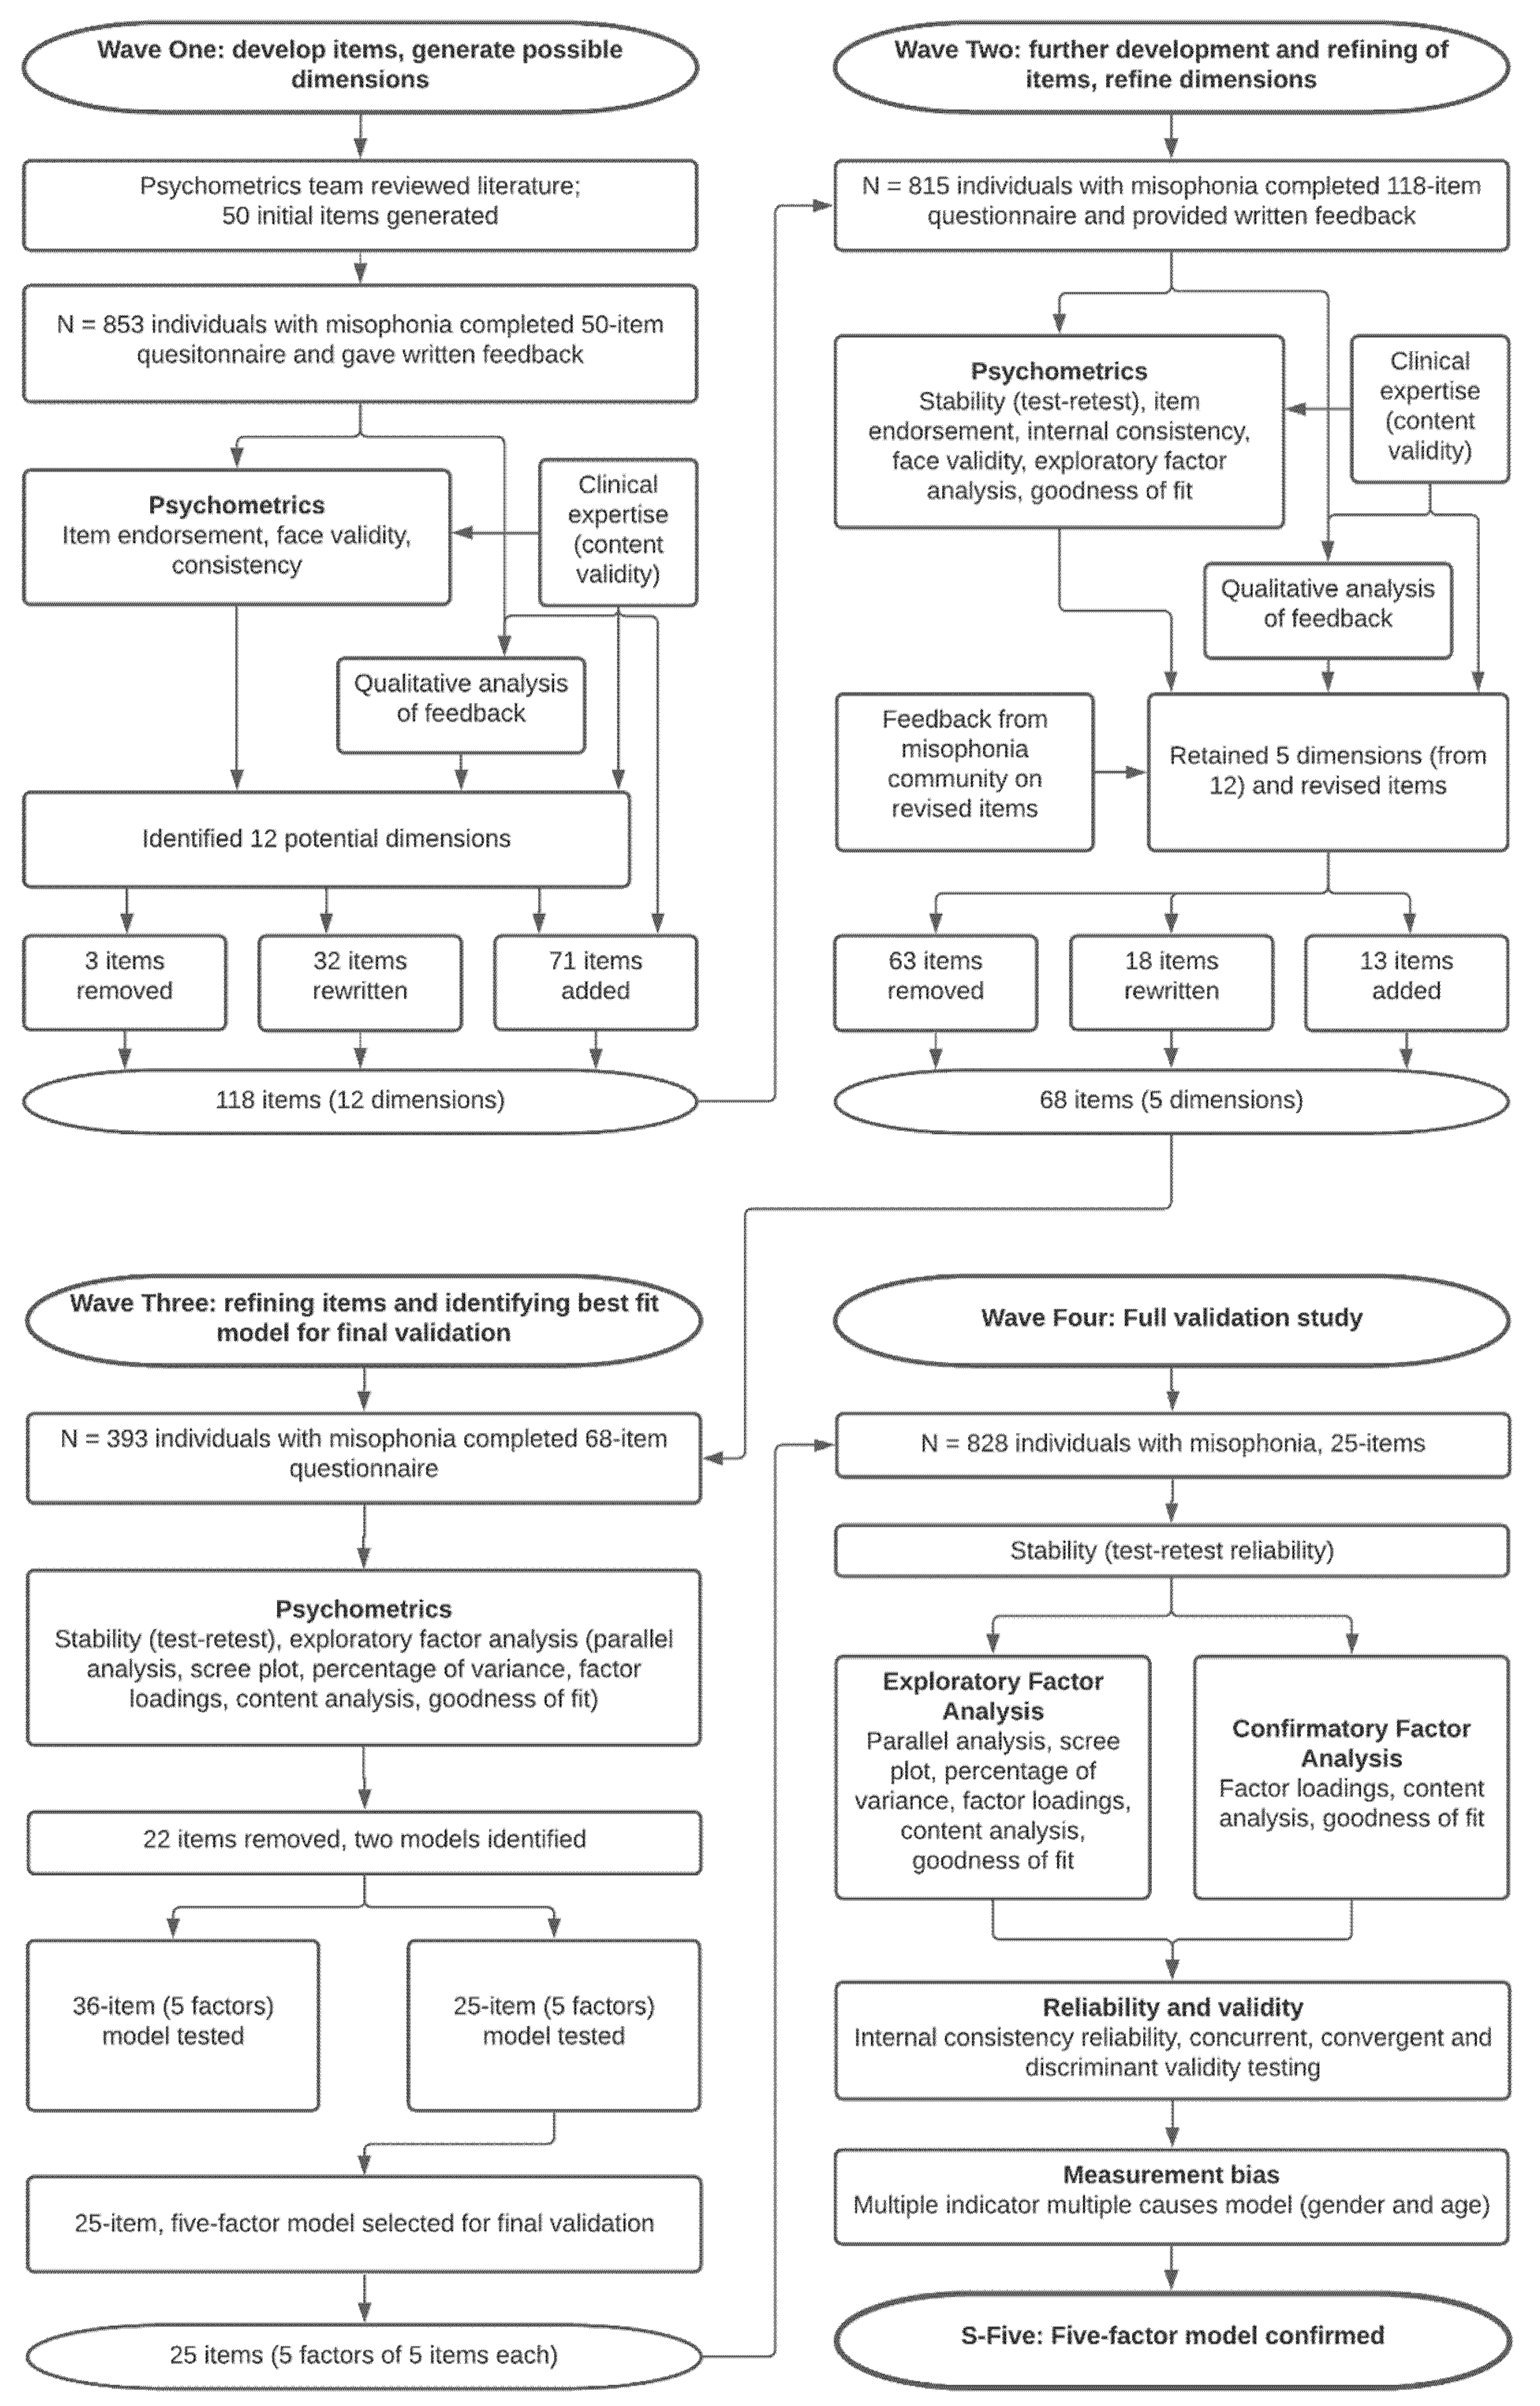
2.1. Scale Development

Wave One (January–May 2019). A pool of 50 preliminary statements were developed by the psychometrics team based on the misophonia literature. These items, measured on a 7-point scale (from 1—Not at all true to 7—Completely true), were administered to 853 individuals, who were invited to provide detailed feedback. A clinical psychologist (JG), with extensive experience of working clinically with patients with misophonia, joined the team at the analysis stage of this wave. Based on preliminary analyses, participants’ feedback, and clinical observations, several possible dimensions were identified, and the pool of statements was substantially revised.
The dimensions identified in the first wave were: attention and focus (“there are some sounds which I simply cannot ignore”), coping strategies (“I mimic or exaggerate sounds people make to help me get through the situation”), externalising appraisals (“I react strongly to certain sounds because I can’t stand how selfish, thoughtless, or bad-mannered people can be”), impact (“I won’t see friends when they are unwell because of the sounds they might make”), insight “the way I react to some sounds can be extreme and out of proportion to the situation, compared to most people’s reactions”), internalising appraisals (“the way I feel/react to certain sounds makes me think whether deep inside I’m just a bad person”), interpretation (“hearing certain sounds makes me feel as if I am under attack”), modulators (“Most of my worst sound triggers come from people that are closest to me”), outbursts (“I’m afraid I will do something aggressive or violent because I can’t stand the noise someone is making”), physiological response (“My heart starts beating fast if I cannot avoid listening to certain sounds”), feared social consequences (“I worry that my family and friends will withdraw from me if I tell them how I feel about certain noises”), and threat (“If I cannot avoid certain sounds, I feel helpless”).
Wave two (June–November 2019). The 118 items were administered to 815 individuals. The analysis examined the emerging dimensions of misophonia and items with the best psychometric properties were retained. Exploratory factor analysis led to a five-factor structure (internalizing, externalizing, impact, outburst, threat), with strong internal consistency within each factor. Items were omitted based on the following criteria: (a) items that loaded less than 0.5 on their factor or cross-loaded in two or more factors (secondary loading(s) at least 0.3), (b) items that did not have strong loadings to any of the factors, (c) items that correlated higher than 0.8 with other items, (d) items that reduced the internal consistency of their designated factor, and (e) items with less than satisfactory stability in time (two weeks test–retest agreement less than 0.8). This phase resulted in the removal of items related to the dimensions of attention, coping strategies, insight, interpretation, modulators, physiological response, and feared social consequences due to poor fit to the model. Based on the psychometric criteria, feedback from the responders, and expert opinion, 18 statements were rephrased, 63 were deleted, and 13 new statements were added, resulting in a pool of 68 items for the third wave of data collection. The rating scale was changed to a 0–10 scale to allow for a detailed assessment of the severity of the experiences.
Wave three. Data collection (January–March 2020) involved a misophonia-specific sample of 393 participants. Exploratory factor analysis found the same five factor structure that had emerged in the second wave data analysis. Based on the loadings criteria, the questionnaire was reduced to 36 items. We compared two models. The 36-item/5-factor solution provided good fit to our data, yet a 25-item/5-factor solution had the best fit to our data.
Wave four. The 25-item, five-factor model was selected for the full validation study presented in this study.
Supplementary Trigger checklist. A supplementary checklist was developed to measure the frequency and intensity of reactions to misophonia triggers and tested alongside the main scale in all four waves. In the first wave, 36 sounds were listed, using a 6-point ordinal scale (from “Not at all bothered” to “Unbearable”) to measure the intensity of the reaction to these sounds. Based on endorsement of the sounds, participant feedback, and clinical observation, 10 items were rephrased, 11 were removed, and 10 new items were added, leaving a total of 37 items/triggers for use in the present study.
The final trigger checklist used in the present study comprised a list of 37 possible triggers, each with a two-part response. The first part asked the main reaction to the trigger (henceforth trigger reaction) in the past two weeks, with the options no feeling, irritation, distress, disgust, anger, panic, other feeling: negative, and other feeling: positive. The second part of the item response rated the intensity (henceforth trigger intensity) of the reaction, from 0: doesn’t bother me at all to 10: unbearable/causes suffering.

2.2. Sampling

The final sample consisted of 828 participants, recruited from misophonia support groups on social media. Inclusion criteria included being aged 18 years and over, fluent in English, and identifying with having misophonia. Exclusion criteria included presence of a severe learning or intellectual disability. Participants read a participants’ information sheet about the study and gave their consent before completing the questionnaires online (ethics approval reference RESCM-19/20-11826). We aimed to use both exploratory and confirmatory factor analysis models, and thus aimed at 700 participants or more (that is, eight times more cases than items, for each model separately).

2.3. Measures

In addition to the new scale and the supplementary trigger checklist describe above, several other questionnaires were administered, listed in the Appendix A (Table A4). For the validation of the S-Five specifically, we used the two main misophonia scales available at the time, the misophonia questionnaire (MQ) [6] and the Amsterdam misophonia scale (A-MISO-S) [5].
The MQ has three subscales, the 7-item MSYS and the 10-item MEBS, both rated on a five-point ordinal scale, ranging from 0 (not at all true/never) to 4 (always true/always) and the single items MSES on a scale from 1 (minimal) to 15 (very severe). The MQ total score is calculated by combining these first two sections of the questionnaire, with a score ranging from 0 to 68.
The 6-item A-MISO-S is also rated on a five-point ordinal scale from 0–4, with a total possible score of 24. Additionally, we used the patient health questionnaire-9 (PHQ-9) [30], a 9-item instrument measuring severity of depression with items scored on a 4-point ordinal scale and a total score range of 0 to 27. For anxiety assessment we used the general anxiety disorder-7 questionnaire (GAD-7) [31], a 7-item questionnaire measuring severity of anxiety symptoms rated on a 4-point ordinal scale with a total score ranging from 0 to 21.

2.4. Factor Analysis

To ensure the data were suitable for factor analysis, each individual variable’s measures of sampling adequacy (MSA), the Kaiser–Meyer–Olkin (KMO) statistic for the overall scale [32,33], and Bartlett’s test of sphericity [34] were considered. In an exploratory factor analysis (EFA), the maximum likelihood estimator with robust standard errors MLR [35] corresponding to the T2* test statistic in [36], was selected to account for the non-normality of the data. The eigenvalues of the sample correlation matrix were computed to facilitate determining the number of factors to be extracted [37]. For that purpose, we evaluated the number of eigenvalues above 1 (Guttman-Kaiser criterion) [32,38], identified the number of the eigenvalues that were larger than the eigenvalues of 50 randomly generated samples with the same number of factors and observations (parallel analysis criterion) [39], and depicted the results using Cattell’s [40] scree plot. We also considered the percentage of variance explained [41]. Oblimin (oblique) rotation was used [42]. Solutions that produced factors whose items had loadings less than 0.5 or surfaced substantial cross loadings (>0.3) were considered problematic. The emerging factors were also evaluated in terms of the coherence of their content.
The multiple indicator multiple causes model (MIMIC) [43] was incorporated to assess potential measurement bias in relation to gender and age. Differential item functioning due to group membership is evident when a significant direct effect of gender or age on an item was present.
Popular measures of goodness of fit from the structural equation modelling literature were used, namely the root mean square error of approximation (RMSEA; values below 0.08 indicate adequate fit) [44,45], the relative chi-square (rel χ2: values close to 2 indicate an adequate fit) [46], the comparative fit index (CFI: values above 0.90 indicate a close fit) [47], the Taylor–Lewis index (TLI: values above 0.90 are required for close fit) [48], and the standardized root mean residual (SRMR: values below 0.05 suggest a good fit) [49].

2.5. Reliability and Validity

Internal consistency was evaluated using Cronbach’s [50] alpha coefficient, the alpha for each item omitted, and the item-total correlations [41]. Stability (test–retest reliability) was evaluated using the Psi coefficient [51] and the mixed effects, absolute agreement, intraclass correlation coefficient at factor level (ICC) [52], following Landis and Koch [53] guidelines for interpreting the results. Concurrent, construct (convergent and discriminant) validity was evaluated via the associations with other measures related to misophonia. Parametric (t-test, Pearson’s r) or non-parametric (Mann–Whitney test, Spearman’s rho) methods were used for hypothesis testing and validity assessment, subject to data normality.

3. Results

3.1. Sample

3.1.1. Demographic and Clinical Characteristics of the Sample

The sample consisted of 828 individuals who identified as having misophonia. With respect to gender, 657 (79.3%) individuals identified as women (2 trans women), 147 (17.8%) as men (6 trans men), and 24 (2.9%) as non-binary or other. The mean age was 39.1 years old (standard deviation SD = 14.7, min = 18, max = 79). Women were, on average, 3.8 (SD = 1.4) years younger than men (t = −2.773, df = 794, p = 0.006). The vast majority of the participants stated that, at the time of the study, they were living permanently in English-speaking countries (USA 42.6%, UK 31.6%, Canada 6.3%, Australia 2.7%, and 15% participants from the rest of the world) and identified mostly as being of white ethnicity (91%). With respect to education, 14% had up to high school education, 68% had some years of college or an undergraduate degree, and 18% had postgraduate degrees), with no differences between genders (χ2 = 4.218, df = 5, p = 0.518).
The psychiatric conditions most frequently reported by participants were depression (34%), generalised anxiety disorder (33.5%), social anxiety (9.3%), obsessive compulsive disorder (8.9%), and panic disorder (4.5%). Tinnitus was reported by 9% of the sample, hyperacusis by 2.4%, and auditory processing disorder by 1.2%. Table S1 in the Supplementary Material presents all disorders reported by participants. Additionally, 29.2% of the sample reported experiencing the phenomenon of the autonomous sensory meridian response (ASMR), and 17.8% reported synaesthesia.

3.1.2. Misophonia Statistics

All participants identified with having misophonia. The participants stated that they noticed the misophonic symptoms at a mean age of 12.8 years (SD = 8). In fact, 65% of the participants noticed their first trigger in childhood (up to 12 years old), another 23% in adolescence (up to 18 years old), and only 12% were older than 18 years old at the onset of the sensitivity.
Most of the participants (83%) stated that eating sounds were among their first triggers, followed by nasal sounds (40%), throat sounds (29%), and tapping sounds (28%; see Table S2 in supplementary material for a full list). More than 73% of the participants stated that, in the past five years, their symptoms have increased in frequency and intensity. Sixty-one percent of participants stated that another family member also suffers from sound sensitivities, including parents (21%), siblings (18%), and children (11%).

3.2. Validation of the S-Five

3.2.1. Endorsement

The 25 S-Five items are presented in the Appendix A (please see Table A1 for the items and Table A2 for the scoring instructions). Table 1 presents the descriptive indices of the final 25 items. The items with the highest endorsement (that is, towards or at the “completely true” end of the ordinal scale) were the statements referring to feelings experienced when unable to avoid certain sounds: distress (I10), anxious (I07), trapped (I11), panic (I02), and helpless (I03). At least 75% of the participants endorsed these statements with a score of 8 or higher. The least endorsed statements (towards the “not at all true” end of the ordinal scale) were the statements related to being physically aggressive (I17) and violent (I22), with 75% of the participants rating them with 0 or 1. With respect to reported gender, females scored significantly higher than males in 6 of the statements, with the largest differences appearing in I10 “dislike myself” and I18 “bad person inside”. Almost all items had significant, but weak, negative correlations with age.

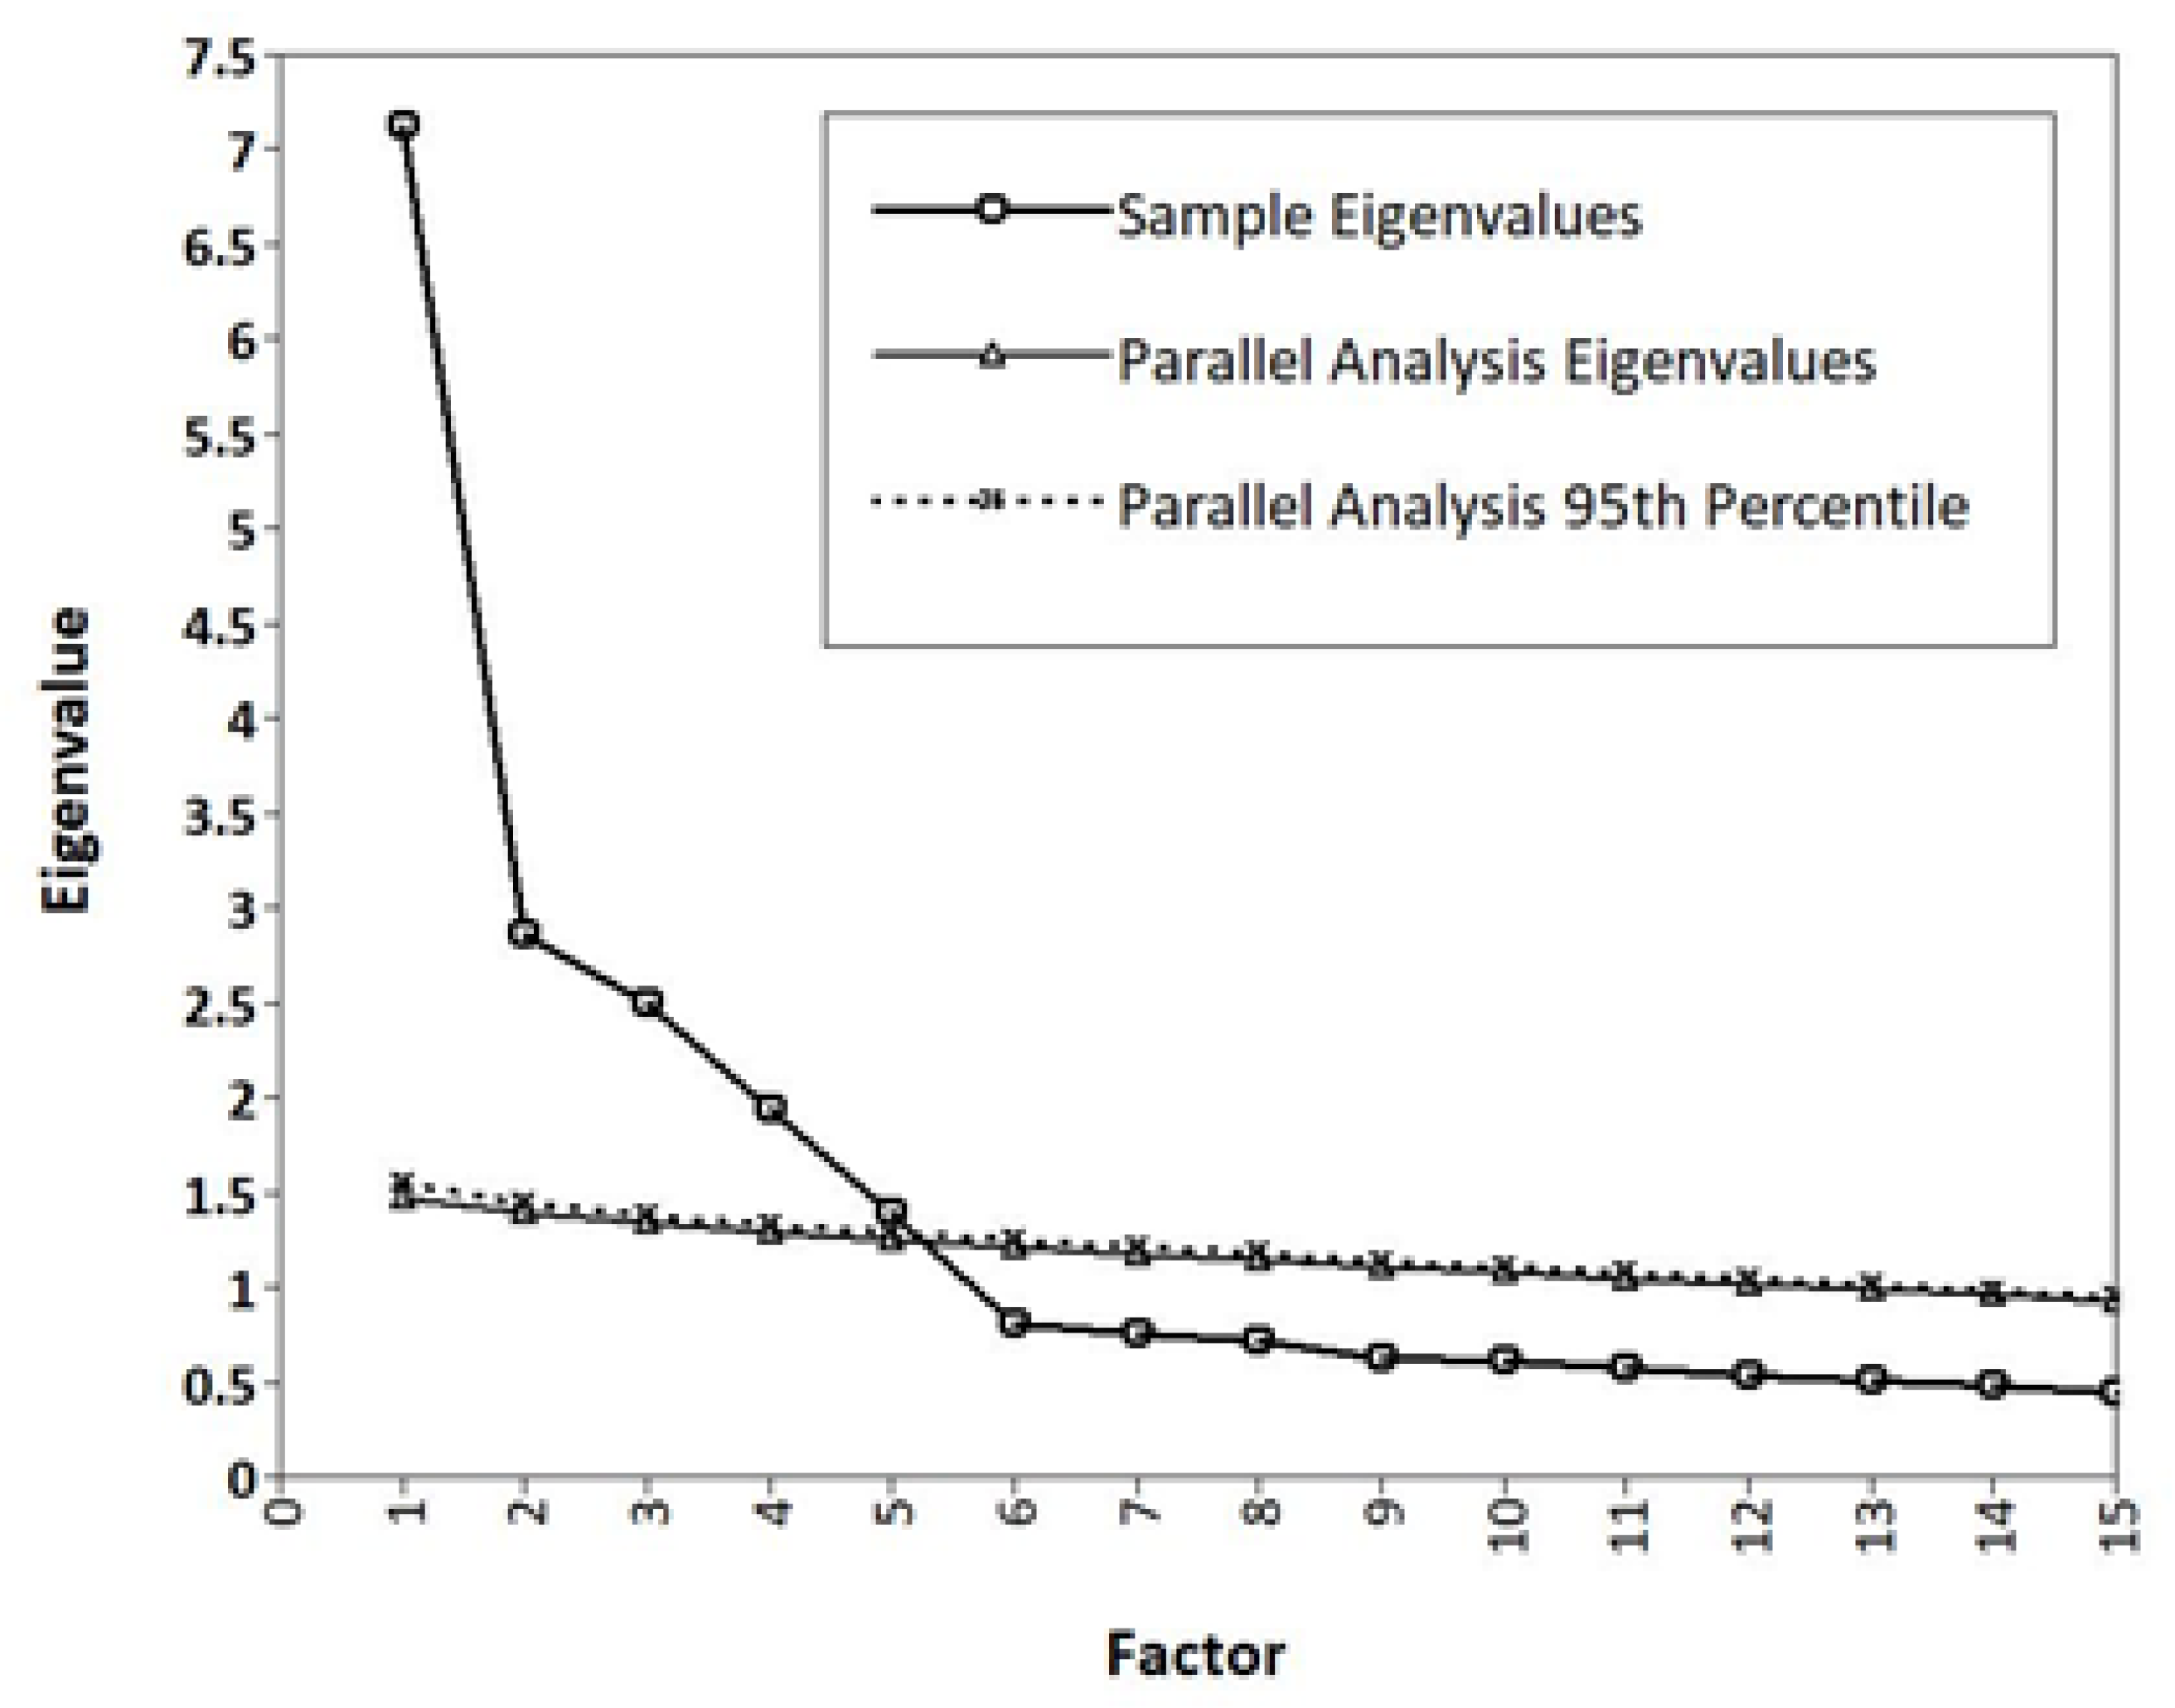
3.2.2. EFA and CFA: Dimensionality

The adequacy of the data for factor analysis was evident (anti-image correlations > 0.85 for all statements, KMO = 0.90, Bartlett’s test χ2 = 10547.5, df = 300, p < 0.001). EFA was conducted with the first random split half of the data (N = 422). The sample correlation matrix had five eigenvalues above 1 (7.1, 2.9, 2.5, 1.9, and 1.4) explaining 67% of total variance. In fact, apart from the Kaiser–Guttman criterion, parallel analysis also indicated that the five-factor solution was suitable for our data (see scree plot in Figure 2). The goodness of fit indices suggested adequate to close fit (rel χ2 = 2.45; RMSEA = 0.059 with 95% (0.052, 0.065); TLI = 0.90, CFI = 0.94, SRMR = 0.026). Increasing the number of factors created non-interpretable factors whose items loaded with non-significant, low (<0.3) loadings.
The model was tested using CFA in the second split half of the sample (N = 406), which also indicated good fit to our data (rel χ2 = 2.38; RMSEA = 0.058 with 95% (0.052, 0.064); TLI = 0.91, CFI = 0.92, SRMR = 0.053). Based on these results, the five-factor solution presented in Table 1 (EFA and CFA loadings) was considered the final solution for the latent structure of the S-Five.
In terms of content, the five factors emerging were: internalising appraisals (“sometimes I think that I am crazy because of the way I feel when I hear certain sounds”), externalising appraisals (“I get angry at other people because of how disrespectful they are with the noises they make”), perceived emotional threat (“if I can’t get away from certain noises, I am afraid I might panic or feel like I’ll explode”), outbursts (“some sounds are so unbearable that I will shout at people to make them stop”), and impact on functioning (“I don’t meet friends as often as I’d like to because of the noises they make”).

3.2.3. MIMIC Model: Measurement Invariance

A MIMIC model was fitted to explore potential bias in the S-Five measurement due to gender, adjusted for age. Two items were found to be non-invariant. Specifically, for the same levels of the latent sound sensitivity, women score significantly higher on the I18 statement (“bad person inside”) by 0.643 units and on the I19 statement (“dislike self”) by 1.012 units on the 0–10 scale. The rest of the 23 items were measurement invariant with respect to gender (adjusted for age). As the differences were minimal, we conclude that the scores of the S-Five can be used to compare individuals across different genders.
Significant age direct effects were also found for six statements (namely: I02 “panic or explode”, I06 “others should avoid making noises”, I18 “bad person inside”, I19 “dislike self”, I22 violence, I24 “afraid of outburst”) but their magnitude was very small (one-year increase in age corresponded to less than 0.03 units expected reduction on the 0–10 scale in all cases, adjusted for gender). All effects were negative, that is, the expected score on those items reduced as age increased.

3.2.4. Scores, Reliability, and Validity

The total S-Five score was higher by nine units for females compared to males, which reflects the significant differences related to two factors only, namely the internalising and the threat factors (Table 2). In terms of reliability, alpha was satisfactory within all factors (0.83 or higher; Table 2), indicating satisfactory internal consistency; test–retest reliability was also satisfactory with ICC being larger than 0.8 in all cases.
The S-Five factor intercorrelations were low to moderate (0.21–0.51; Table 3). Negative low correlations emerged with age (−0.12 to −0.20), apart from the externalising factor. Concurrent convergent validity was evident based on the moderate to high correlations of A-MISO-S scores with the internalising and threat factors, whereas evidence towards discriminant validity are provided by the low correlations between A-MISO-S and the S-Five externalising factor. Similarly, there was a low correlation between the MQ MSYS scale and all S-Five scales, and between the S-Five externalising factor and all MQ scores. The other S-Five factors and MQ subscales were moderately correlated, as expected based on content. Low to moderate correlations emerged between the S-Five scores and depression and general anxiety, with the lowest appearing in the externalising factor. Finally, evidence towards convergent validity were present by the strong correlation between the S-Five and the WSAS scores (Table 3).

3.3. S-Five Triggers Checklist (S-Five-T)

3.3.1. Checklist Scoring Options

The S-Five-T items are presented in the Appendix A (please see Table A3 for the items and the scoring instructions). The S-Five-T was designed to allow researchers and treatment providers to customise the checklist according to the needs of their study or individual clients. The format facilitates adding or removing triggers (for instance visual triggers) or reaction types (physiological reactions for example) as research findings progress or when treatment plans are being customised. The following four indices allow for the S-Five-T to be scored regardless of the number of triggers and reactions used. A trigger is said to be “endorsed” if the participant selects any of the negative reactions (that is, not “no feeling” or “other: positive”) and a non-zero response on the intensity rating.
  • Trigger Count (TC) is the total number of triggers endorsed by a participant from the list provided. So, for the present study, the participant’s TC would take values between 0–37, as we listed 37 possible triggers. For example, if an individual selected “no feeling” or “other: positive” reaction to 32 out of 37 triggers, their TC would be 5, that is, the number of triggers to which they experience a negative reaction (irrespective of intensity). This index tells us about the number of triggers that cause a negative reaction.
  • Reaction count (RC) is the number of times each particular reaction type is endorsed and can be counted across triggers in a single participant, or across participants. The index is computed for each reaction type separately, resulting in a reaction count for each (for example, RC-Anger, RC-Irritability, etc.). The total possible RC for a participant is determined by the number of triggers listed (37 in the present study). For example, if a participant selected anger as their main emotional reaction to three triggers, panic as their main reaction to two triggers, and no feeling for their remaining triggers, then they would have an RC-Anger of 3, RC-Panic of 2, and RC-No feeling of 32 (irrespective of intensity). This index tells us about the nature of the emotional responses to triggers.
  • Frequency/intensity of reactions score (FIRS) is the total value of the intensity items of all endorsed triggers. The intensity is rated from 0–10, and therefore, for the present study, the FIRS takes values between 0 and 370. For example, if a participant reported a negative reaction to five triggers and rated each to the highest possible intensity (that is, 10), their FIRS value would be 50. A participant who reported 10 triggers, each at a moderate intensity of 5, would also have a FIRS value of 50. This index provides combined information about the number of triggers and their intensity.
  • Relative intensity of reactions score (RIRS) gives an estimate of the intensity of reactions to triggers, relative to the number of triggers reported. It is computed by dividing the FIRS index by the TC index. RIRS takes values between 0 and 100, regardless of the number of reactions available and number of triggers listed in the study. Continuing with the examples from above, the individual who had a FIRS of 50, who reported 5 triggers with an intensity of 10 each, their RIRS would equal 10 (50 divided by 5 triggers). However, the individual with the same FIRS (50) who reported 10 triggers with an intensity of 5 would have a RIRS of 5 (FIRS 50 divided by TC 10). This index provides information about the average intensity of an individual’s reaction to triggers.
The scoring guide and the programming codes (SPSS, R project, Stata) to obtain all factors and indices are freely available upon request made to the first author.

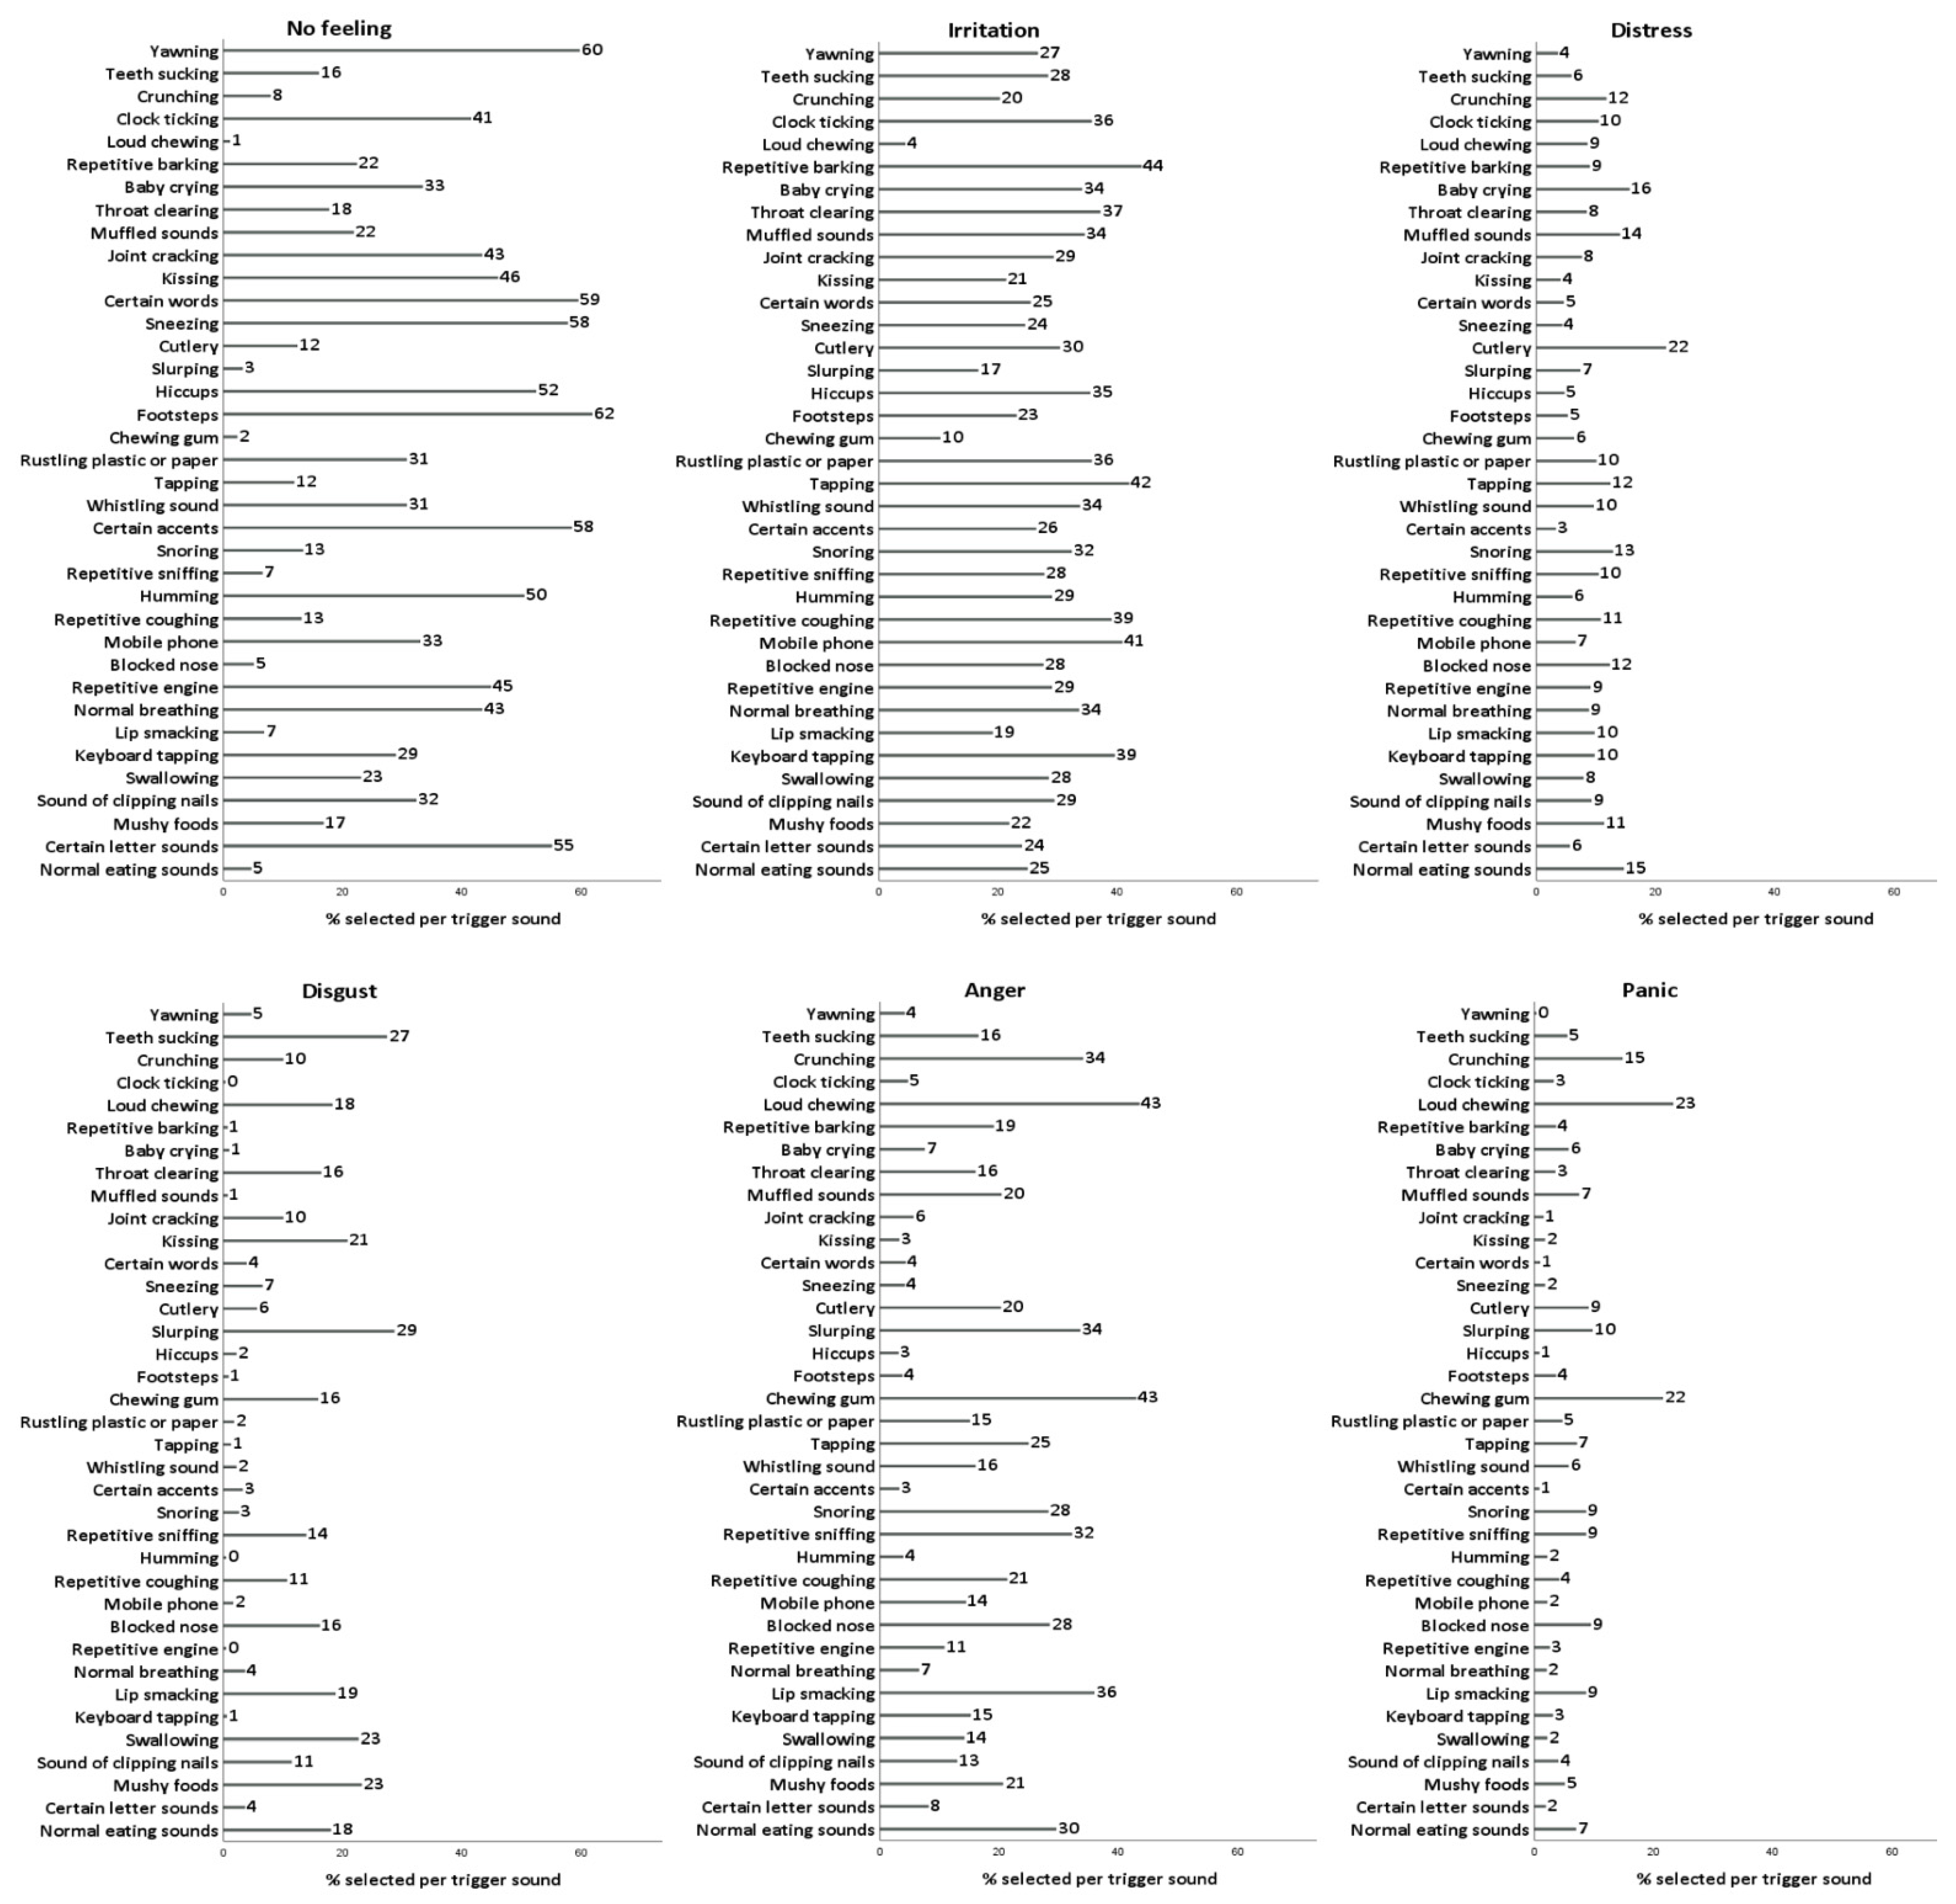
3.3.2. Reported Reactions to Triggers

Figure 3 presents the percentage of respondents selecting each type of reaction for the 37 trigger reaction items. The triggers for which no feeling was most frequently selected were “footsteps” and “yawning” (62% and 60%, respectively). The triggers for which irritation was most often selected were “repetitive barking” (44%), “tapping” (42%), and “mobile phone sounds”. Distress was more frequently selected for “cutlery sounds” (22%), and disgust was reported for sounds such as “slurping” (29%) and “teeth sucking” (27%). The triggers for which anger was most often reported were “loud chewing” (43%), “chewing gum” (43%), “lip smacking” (36%) and “crunching” (34%), and for panic they were “loud chewing” (23%) and “chewing gum” (22%).
Table 4 presents the descriptive indices of the 37 trigger intensity items. According to the table, the highest mean intensity occurred in ‘loud chewing’ and ‘chewing gum’. With respect to reported gender, females reported higher intensity than males in all triggers, and in half of the triggers the difference was statistically significant, with the largest differences appearing in ‘blocked nose’ and ‘kissing sounds’. Half the triggers had significant but weak correlations with age. The stability of the intensity items was excellent (ICC > 0.8).
Table 5 presents the descriptive indices of the six reaction counts (the two “other feeling” options were not included), the trigger count, and the frequency/intensity and relative intensity of reaction scores. According to the table, no feeling and irritation were the reactions selected more frequently, followed by anger. Panic was the emotion reaction selected for the least number of trigger sounds. Men reported no feeling significantly more often than women, who, in turn, reported disgust significantly more often than men. On average, 24 triggers were reported, and the relative intensity was 6 out of 10 in our sample. Women had significantly higher FIRS than men. The stability of the measurement for all S-Five-T measures was high (ICC above 0.86).
Low correlations emerged between the reaction counts and the S-Five factor and total scores (Table 6). The S-Five total score was found to be correlated with all summary indices of the S-Five-T, the highest correlation being with the RIRS (0.37).
The reaction counts for no feeling correlated negatively with all subscales of the S-Five, MQ, and the A-MISO-S, and RC-irritation correlated negatively with the S-Five, A-MISO-S, and two of the MQ subscales. RC-Anger and RC-Panic had low to moderate positive correlations with the total scores for S-Five, A-MISO-S and MQ.
Low correlations occurred between all the S-Five-T indices and the PHQ9, GAD7, and WSAS scales, with the exception of RC-disgust, which did not have a significant correlation with the PHQ9 and WSAS.

4. Discussion

The aim of this study was to develop a multidimensional tool for measuring misophonia and to evaluate its psychometric properties. We presented the iterative process of developing the questionnaire, responding to qualitative feedback from hundreds of individuals with misophonia alongside psychometric analysis during the first two phases. The combined psychometric and clinical expertise in the development team enriched the interpretation of qualitative and quantitative information as the scale was refined. In the final psychometric analysis, a five-factor model was confirmed. Good reliability indices emerged and strong evidence towards the validity of the scale was present. No measurement bias was identified with respect to gender and age. [5,6,16]. The S-Five is the first validated questionnaire to capture the multidimensional nature of the experience of misophonia, using latent variable models.

4.1. The Dimensions of Misophonia

The five dimensions of the experience of misophonia captured by the scale were: judging and blaming oneself for the reaction to sounds (internalising appraisals), judging and blaming others for causing the reaction to sounds (externalising appraisals), the presence or fear of extreme escalating emotions in the presence of certain sounds (threat), the presence or fear of aggression in reaction to sounds (outburst), and the perceived current and future limitations caused by reactions to sounds (impact).
Mean scores were highest for the threat factor and lowest for the outburst factor. Within the outburst factor, mean scores were higher for the items related to verbal aggression, shouting, and a fear of doing something aggressive in response to sounds, in comparison to the items relating to the use of violence and physical aggression. These findings are consistent with Jager et al.’s [12] study, reporting high rates of feelings of powerlessness and loss of control and low reports of violence, particularly in comparison to the frequency of thoughts about violence and aggression. Siepsiak et al. [16] also found low endorsement of an item relating to the use of physical violence and subsequently removed the item from the final version of MisoQuest.
The final model included dimensions capturing the meaning that misophonics place on their reactions to sounds. This is an important development in misophonia research, particularly following previous work using fMRI, which found activation of the “salience network” of the brain in those with misophonia when exposed to trigger sounds, an area related to detecting and processing the importance of internal and external stimuli [54,55]. Our findings indicate that the misophonic experience involves placing meaning not just on the sounds, but on the meaning of the individual’s reaction, that is, attributing their reaction to others’ poor behaviour (externalising appraisals) and holding beliefs about what their reactions say about their own character (internalising appraisals). Future research could focus on experimentally testing whether these beliefs and their associated emotions are maintained with safety-seeking behaviours. These beliefs could also be tested as potential cognitive mechanisms of change in treatment studies.
It was interesting to find that the outburst factor was moderately correlated with internalising appraisals and only weakly correlated with externalising, whereas we had expected that outbursts would be more associated with externalising. Internalising also showed moderate to strong positive correlations with factors of threat and impact, indicating that those who judged or blamed themselves for their reactions experienced a greater sense of emotional threat if unable to get away from sounds and were more likely to perceive their lives as limited by misophonia.
Due to the cross-sectional design, we cannot make assumptions about the causality of these relationships. It could be that individuals are more likely to judge or blame themselves more due to the higher intensity of their experience of emotional threat, the presence of outbursts and the greater impact their sound sensitivity has on their lives. Alternatively, it could be that blaming and judging oneself increases the emotional intensity in the moment, and that those who blame themselves for their reactions and worry about having outbursts place more limitations on their own lives so as not to burden others. It is also possible that there are other underlying variables contributing to higher scores on all three factors. For example, higher base levels of anxiety, lower emotional tolerance, more frequent exposure to triggering sounds, or experiences of being criticised and excluded by others for their atypical reaction to sounds. Future research improving the understanding of these relationships will be useful for identifying appropriate targets for intervention, for example, cognitive–behavioural interventions to modify appraisals and test predictions, distress tolerance interventions to reduce the sense of threat, or behavioural interventions aimed at improving social and occupational functioning.

4.2. Emotional Reactions to Trigger Sounds

Consistent with the findings of Jager et al. [12], participants in the present study endorsed irritation and anger as the primary reaction to more trigger sounds than the emotions of disgust, distress and panic. However, those reporting irritation more often as their primary emotional reaction tended to score lower on the S-Five total, the A-MISO-S, and two subscales (MEBS and MSES) of the MQ. This suggests that reacting with irritation to trigger sounds may not be a good indicator of overall misophonia severity, in contrast to anger and panic, which were positively correlated with the S-Five, A-MISO-S, and subscales of the MQ.
Panic was reported by 23% of participants as the main reaction to loud chewing, and 22% reported panic as the main reaction to the sound of chewing gum. This finding is consistent with some studies where anxiety and panic were reported by individuals with misophonia [3,4], but inconsistent with the findings of Jager et al. [12], a study in which neither anxiety nor panic was reported as a primary reaction from any of the participants in a large clinical sample. The authors suggested that any reported anxiety may be secondary to anger and disgust or experienced in anticipation of trigger sounds. Our findings suggest that panic is a sound-specific reaction for some individuals. Individuals may not consider panic to be one of their main reactions to sounds in general when reporting on a questionnaire such as the AMISO-R used by Jager et al. [12]. It is worth noting that the AMISOS-R does not include anxiety or panic as a stated option on the question asking about emotional reactions to sounds, so these emotions would only be captured if the subject wrote it in as an “other” option.
The relative lower reports of distress and panic in reaction to trigger sounds is interesting considering the high endorsement of the threat factor, which includes items related to feelings of distress, panic, helplessness, and feeling trapped if unable to avoid certain sounds. This suggests that the threat factor is not capturing a primary reaction to sounds, but perhaps instead secondary emotions in the presence of sounds. That is, an individual with misophonia may initially react with anger to the sounds, followed by a sense of panic or helplessness if they are unable to escape those sounds. Alternatively, it could be that the threat factor is capturing catastrophic predictions of what might happen emotionally, and that individuals do not necessarily need to experience these emotions routinely to fear having them. A suitable comparison might be those with panic disorder interpreting a bodily sensation such as a racing heartbeat as a sign of impending heart attack [56], in that those with misophonia interpret their initial reaction (for example. anger or disgust) as a sign of impending feelings of panic or helplessness.
Importantly, these findings demonstrate the complexities of the experience of misophonia. The primary emotional reactions to trigger sounds captured in the RC and FITS were only weakly to moderately correlated to the S-Five total scores, highlighting the importance of this new measure to capture the multidimensional nature of this phenomenon beyond the immediate emotional reaction.

4.3. The S-Five in the Context of the Consensus Definition of Misophonia

Misophonia was recently defined as a disorder by consensus from a panel of experts [2], and we argue that the latent variables that the S-Five meaningfully captures is the severity of misophonia the disorder. This is distinct from (albeit related to) the phenomenon of a decreased tolerance to certain sounds, which may or may not cause the levels of distress and impairment required for the diagnosis of a disorder. Distress and/or impairment in functioning are included in the diagnostic criteria for many of the psychiatric and neurodevelopmental conditions in the Diagnostic and Statistical Manual of Mental Disorders [57]. This is particularly important for defining the point at which a trait, or series of traits, existing on a spectrum in the general population (for example, decreased tolerance to certain repetitive sounds), becomes a clinical problem (for example clinical misophonia), warranting treatment or professional support. We pose that the supplementary checklist S-Five-t captures the nature and intensity of the phenomenon of a decreased tolerance to certain repetitive sounds (with the potential to measure reactions to other, non-visual repetitive stimuli), while the main S-Five captures the severity of misophonia as a disorder. The research team is currently undertaking further exploration of this using diagnostic clinical interviews.
The recently presented consensus definition of misophonia [2], which was published as a pre-print after the development of the S-Five, included a number of defining statements with considerable overlap with the dimensions that emerged in the early waves of the present study. It is useful to note that many of these dimensions were not a good fit for the final model. Items that did not fit the overall model (that is, the latent variable capturing the severity of the misophonic experience) included those related to the theorised dimensions of attention, coping strategies, insight, interpretation, modulators, physiological response, and feared social consequences. Despite the considerable overlap in the dimensions that emerged from both the early waves of our study and the consensus definition [2], our analysis reveals that these other dimensions did not meaningfully load onto the continuum (latent trait) of the misophonic experience, at least not from a psychometric perspective. While relevant and important, these appear to be external to the trait.
However, these dimensions omitted from the S-Five may be important to measure in other ways, to improve our understanding of the condition and implications for treatment. Physiological response, for example, may be better placed as one of the possible reactions in the S-Five-t, which would allow for the individual to indicate when a reaction is perceived as primarily physiological, as opposed to the physiological signs of an emotion.
Coping behaviour is one of the omitted dimensions that warrants further investigation in future research. Individuals with misophonia described a range of coping strategies in their feedback during our first two waves of development, which is consistent with previous research [4], with the consensus definition [2], and with the recently published Duke misophonia questionnaire [58]. However, these behaviour items did not meaningfully load onto the model in the present study. This makes sense based on our clinical observation that many of the commonly reported behaviours can serve as both helpful coping techniques (such as being able to get work done when using earplugs) and safety-seeking behaviours (for example, the use of earplugs preventing disconfirmation of predicted catastrophic emotional reactions to sounds, or having the unintended consequence of causing barriers with other people, thus potentially reinforcing the belief about being unlikeable). Therefore, it is difficult to use frequency of behaviour as part of a measure of misophonia severity, but it would be useful to have other ways of identifying relevant behaviours and understanding their function, particularly for treatment purposes.

4.4. Limitations

There are several limitations to this study. The sample consisted of participants with self-reported misophonia, largely recruited from misophonia support forums on social media, and predominantly from English-speaking countries. The research team has repeated the study using a representative sample of the UK general population and is currently using structured clinical interviews for further validation and to support the identification of clinical cut-off scores.
Further research is needed to determine whether the measure is suitable for use with those from a range of cultural backgrounds, using versions of the questionnaire that have been translated and modified appropriately for different cultural contexts. The research team has a number of projects underway, with the S-Five being translated into multiple languages and being tested on non-English speaking populations. The research team is also creating an adolescent version of the scale.
We did not complete audiometry testing in our participants. This may be useful to include in future studies for discriminative validity, although one large misophonia study initially used this procedure, and after finding no meaningful results, they discontinued the procedure to minimise burden on patients [12]. Future research would benefit from assessing discriminant validity using clinical comparison groups for conditions where sound sensitivities may be present, such as hyperacusis, autism, attention deficit hyperactivity disorder (ADHD), and anxiety disorders. Our research team is currently investigating the relationship between autism, ADHD, and misophonia traits in the general population. The prevalence of co-occurring depression and anxiety disorders was measured using a single item asking participants to select from a list any diagnoses they hold, and the prevalence reported by our sample was higher than previously seen in community and misophonia samples [59,60]. Future studies on conditions co-occurring with misophonia would benefit from structured clinical interviews and representative samples.
The present study used online data collection; future research should include paper and pencil completion of the questionnaire. Finally, the questionnaire should be tested in a treatment sample to assess suitability for use as a clinical tool for treatment planning and measuring clinical change.

4.5. Conclusions and Practical Applications

The S-Five is a robust, multidimensional psychometric tool for measuring misophonia. It is relatively short and simple to administer, making it an ideal tool for use in research and clinical settings. It can be used as an overall measure of severity of misophonic traits, as part of cross-sectional data collection, as a measure of change in misophonia severity over time, or to evaluate change in response to intervention. The questionnaire could be used to report on the condition methodologically, to test hypotheses of differences between groups, and to examine correlations with other traits and co-occurring diagnoses.
The five factors can be used to improve our understanding of how psychological factors might be related to different aspects of misophonia and, in clinical research, investigating mechanisms of change. The separate factors can also be used clinically as part of individual assessment for formulation-driven treatment approaches and to monitor change in response to targeted interventions, for example, using a single case experimental design.
Additionally, the supplementary trigger scale can be used in research aimed at understanding the differential reactions to different sounds, perhaps comparing acoustic and semantic properties of the sounds. It is flexibly designed to enable the study of a wide range of sensory triggers and potential emotional, physiological, and behavioural reactions. The flexible scoring indices allow for direct comparisons between individuals, even where they differ in the number of triggers they endorse. The triggers scale can also be used to measure changes in the nature and intensity of reactions to sounds for an individual patient in response to treatment.
In addition to the new measurement tool, this study sheds new light onto the experience of misophonia. We found evidence of the key psychological factors that form part of the experience of the disorder of misophonia, including a sense of emotional threat and judgement towards self and others. This study provides hope for the potential benefits of psychological therapies to reduce the distress and impairment reported by so many individuals with misophonia, along with a robust measurement tool to support treatment and further research.

Supplementary Materials

The following are available online at https://www.mdpi.com/article/10.3390/psych3040041/s1, Table S1: Reported diagnoses; Table S2: Descriptive indices of measures-complete sample.

Author Contributions

Conceptualization, S.V.; methodology, S.V., N.U.-M. and C.H.; software, S.V.; validation, S.V. and J.G.; formal analysis, S.V.; investigation, S.V., N.U.-M. and C.H.; resources, S.V.; data curation, N.U.-M. and C.H.; writing—original draft preparation, J.G.; writing—review and editing, S.V., N.U.-M., C.H. and J.G.; visualization, S.V.; supervision, S.V. and J.G.; project administration, S.V., N.U.-M. and C.H.; funding acquisition, S.V. All authors have read and agreed to the published version of the manuscript.

Funding

S.V., C.H. and N.U.-M. were funded or partially funded by the Biomedical Research Centre for Mental Health at South London and Maudsley NHS Foundation Trust and King’s College London. This research was funded in whole, or in part, by the Wellcome Trust [JG; 102176/B/13/Z]. For the purpose of open access, the author has applied a CC BY public copyright licence to any Author Accepted Manuscript version arising from this submission. The views expressed are those of the author(s) and not necessarily those of the NHS, the NIHR, Wellcome Trust, or the Department of Health and Social Care.

Institutional Review Board Statement

The study was conducted according to the guidelines of the Declaration of Helsinki, and approved by the Psychiatry, Nursing Midwifery Ethics Subcommittee of King’s College London (REC Reference Number: HR-19/20-17173 and date of approval 5 February 2020).

Informed Consent Statement

Informed consent was obtained from all subjects involved in the study.

Data Availability Statement

The data presented in this study are available on request from the first author.

Conflicts of Interest

The authors declare no conflict of interest.

Appendix A

Table A1. The S-Five statements.
Please read each statement * carefully and base your answer on how true they feel to you based on your current thoughts, experiences, and reactions: 0-not at all true to 10-completely true
Externalising
I13 People should not make certain sounds, even if they do not know about others’ sensitivities
I25 I get angry at other people because of how disrespectful they are with the noises they make
I06 People should do everything they can to avoid making noises that might bother others
I16 I react strongly to certain sounds because I cannot stand how selfish, thoughtless, or bad-mannered people can be
I21 Certain sounds are just bad manners, and it is not strange to feel intense anger about that
Internalising
I18 The way I react to certain sounds makes me wonder whether deep inside I am just a bad person
I08 The way I react to certain noises makes me feel like I must be an unlikable person deep down
I05 I respect myself less because of my responses to certain sounds
I12 I feel like I must be a very angry person inside because of the way I react to certain sounds
I19 I dislike myself in the moments of my reactions to sounds
Impact
I20 My job opportunities are limited because of my reaction to certain noises
I01 I do not meet friends as often as I would like to because of the noises they make
I14 There are places I would like to go but do not, because I am too worried about how the noises will impact me
I15 I can see future where I cannot do everyday things because of my reactions to noises
I09 The way I feel/react to certain sounds will eventually isolate me and prevent me from doing everyday things
Outburst
I17 I can get so angry at certain noises that I get physically aggressive towards people to make them stop
I22 Sometimes I get so distressed by noises that I use violence to try and make it stop
I23 Some sounds are so unbearable that I will shout at people to make them stop
I04 If people make certain sounds that I cannot bear, I become verbally aggressive
I24 I am afraid I will do something aggressive or violent because I cannot stand the noise someone is making
Threat
I11 I feel trapped if I cannot get away from certain noises
I07 I feel anxious if I cannot avoid listening to certain sounds
I02 If I cannot get away from certain noises, I am afraid I might panic or feel like I will explode
I03 If I cannot avoid certain sounds, I feel helpless
I10 I can experience distress as the result of some noises
* Items should be randomised before being administered and without enumeration
Table A2. Scoring Instructions for the S-Five.
In this section each item is rated in a 0–10 ordinal scale, for example:

People should not make certain sounds, even if they do not know about others’ sensitivities
0 (not at all true) 1 2 3 4 5 6 7 8 9 10 (completely true)

Factor scores and Total Score: Please add the responses of the corresponding items for each factor to compute the factor score and all items for the total S-Five-E score. Each factor has 5 items thus the scores are directly comparable in terms of statement endorsement.
Range: factor scores range between 0 and 50, total score is between 0 and 250.
The scoring guide and the programming codes (SPSS, R project, Stata) to obtain all factors and indices are freely available upon request made to the first author.
The S-Five, © Copyright King’s College London, 2021. All Rights Reserved.
Table A3. The S-Five-t triggers checklist and scoring.
Trigger reaction items: Thinking about the past few weeks, what is the main feeling this sound has caused you?No feeling, irritation, distress, disgust, anger, panic, other feeling: negative, other feeling: positive, other: physiological reaction
Trigger intensity items: Thinking about the past few weeks, please rate the intensity of your reaction to this sound when made by another person or object (from 0: doesn’t bother me at all to 10: unbearable/causes suffering)
List of triggers currently included in the S-Five-t: Normal eating sounds, Certain letter sounds, Mushy foods being eaten, Sound of clipping nails, Swallowing, Keyboard tapping, Lip smacking, Normal breathing, Repetitive engine noises, Loud/unusual breathing, Mobile phone sounds, Repetitive coughing, Humming noise, Repetitive sniffing, Snoring, Certain accents, Whistling sound, Sound of tapping, Rustling, Chewing gum, Footsteps, Hiccups, Slurping, Cutlery noises, Sneezing, Certain words, Kissing, Joint cracking, Muffled sounds, Throat clearing, Baby crying, Repetitive barking, Loud chewing, Clock ticking, Crunching eating sounds, Teeth sucking, Yawning.
The scoring guide and the programming codes (SPSS, R project, Stata) to obtain all factors and indices are freely available upon request made to the first author.
The S-Five, © Copyright King’s College London, 2021. All Rights Reserved.
Table A4. Full list of administered questionnaires.
  • Bryant and Smith Aggression Questionnaire (BS-AQ) [61] is a shorter refined version of the original AQ, with 12 items rather than 29 items, rated on a five-point Likert scale. The scale captures four aspects of aggression: physical aggression, verbal aggression, anger and hostility. Higher scores are indicative of higher levels of aggressive behaviour.
  • Generalized Anxiety Disorder-7 Questionnaire (GAD-7) [31] screens for measures severity of generalised anxiety disorder. The questionnaire asks the rater to consider the past two weeks and rate each item on a four-point scale from ‘Not at all’ to ‘Nearly every day’. The scores for each item are totalled, with higher scores suggesting higher levels of generalised anxiety.
  • The Patient Health Questionnaire-9 (PHQ-9), from Kroenke et al. [30], is the brief assessment of depression severity. The nine DSM-5 criteria are scored on a four-point scale, with higher scores indicating higher severity of depression.
  • The Work and Social Adjustment Scale (WSAS) [62] is a simple measure of impairment in functioning, consisting of five items rated on a nine-point scale from “Not at all” (0) to “Severely impaired” (8). Higher scores on the WSAS indicate a greater level of impairment in work and social aspects of life.
  • The Beliefs about Emotions Scale (BES) [63] is a 12-item questionnaire on beliefs regarding the inability to accept negative emotions, and the adverse consequences of experiencing and expressing those emotions. Items are rated on a seven-point Likert scale, specifying level of agreement or disagreement.
  • The Mindful Attention Awareness Scale (MAAS) [64] assesses a receptive state of mind, which is a core feature of mindfulness. MAAS contains 15 items measured on a six-point ordinal scale ranging from ‘almost always’ to ‘almost never’.
  • The Autonomous Sensory Meridian Response (ASMR-15) [65] is a questionnaire assessing altered state of consciousness phenomena, namely autonomous sensory meridian response (ASMR), which is characterised by pleasurable tingling sensation in response to certain audio-visual stimuli, causing relaxation and euphoria. The 15-item scale is rated on a scale from 1, ‘completely untrue for me’ to 5, ‘completely true for me’, and consists of four subscales: altered consciousness, sensation, relaxation and affect.
  • The reduced-item Disgust Propensity and Sensitivity Scale-Revised (DPSS-R) [66] consists of 12 items on a five-point response scale that assess how easily one is disgusted, known as disgust propensity, and how bothered a person is by their disgust, which is described as disgust sensitivity, both of which contribute to disgust reactions.
  • The Anxiety Sensitivity Index (ASI-3) [67] is a shorter 18-item version of the original anxiety sensitivity index [68]. It assesses anxiety sensitivity conceptualised as one’s considerations regarding misinterpretations of anxiety-related sensations. The scale measures anxiety sensitivity on physical, cognitive, and social dimensions.
  • The Adult Eating Behaviour Questionnaire (AEBQ) [69] is a 35-item measure that assesses appetitive traits in adulthood. AEBQ consists of eight subscales; however, for the purpose of this study only ‘food fussiness’ subscale was implemented, which consists of five items measured on a five-point Likert scale ranging from ‘strongly disagree’ to ‘strongly agree’.
  • The Temperament Evaluation of Memphis, Pisa, Paris and San Diegoautoquestionnaire (TEMPS-A) [70] measures temperamental variations based on diagnostic classifications for affective temperaments, namely cyclothymic, dysthymic, irritable, hyperthymic, and anxious, and has five subscales named as such. The scale is a yes-or-no type questionnaire and consists of 39 items.
  • The Big Five Inventory (BFI) [71] is a 44-item questionnaire with a five-point Likert agreement scale, which measures one’s personality on the Big Five Factors of personality: extraversion vs. introversion, agreeableness vs. antagonism, conscientiousness vs. lack of direction, neuroticism vs. emotional stability, openness vs. closedness to experience. Those factors are further separated into personality dimensions.
  • The Leahy Emotional Schema Scale II (LESS II) [72] is a 28-item measure with a six-point ordinal response scale that determines beliefs and attributions about emotions. The scale is divided into fourteen dimensions: invalidation, incomprehensibility, guilt, simplistic view of emotion, devalued, loss of control, numbness, overly rational, duration, low consensus, non-acceptance of feelings, rumination, low expression, and blame.
  • The Body Consciousness Questionnaire (BCQ) [73] contains 15 items with a five-point Likert scale and assesses inner bodily awareness, which is subdivided into three subscales, namely private body, public body, and body competence.
  • The Misophonia Questionnaire (MQ) [6] is a 34-item scale consisting of three sections that assesses misophonia regarding the presence of specific triggers, emotional and behavioural responses and its severity. The first two sections, misophonia symptom scale and misophonia emotions and behaviours scale, are rated on a five-point ordinal scale, whilst the third section, Misophonia Severity Scale, measures one’s severity of sound sensitivity on a 1 to 15-point scale, with 1 suggesting minimal sound sensitivity and 15 indicating very severe sensitivity.
  • The Amsterdam Misophonia Scale (A-MISO-S) [5] is a six-item scale that measures different facets of misophonia, namely time consumed by the condition, its impact on one’s functioning, level of distress, level of resistance, perceived control over thoughts, and avoidance behaviours.

References

  1. Jastreboff, M.M.; Jastreboff, P.J. Decreased sound tolerance and tinnitus retraining therapy (TRT). Aust. N. Z. J. Audiol. 2002, 24, 74. [Google Scholar] [CrossRef]
  2. Swedo, S.; Baguley, D.M.; Denys, D.; Dixon, L.J.; Erfanian, M.; Fioretti, A.; Jastreboff, P.J.; Kumar, S.; Rosenthal, M.Z.; Rouw, R.; et al. A Consensus Definition of Misophonia: Using a Delphi Process to Reach Expert Agreement. medRxiv 2021. [Google Scholar] [CrossRef]
  3. Edelstein, M.; Brang, D.; Rouw, R.; Ramachandran, V.S. Misophonia: Physiological investigations and case descriptions. Front. Hum. Neurosci. 2013, 7, 296. [Google Scholar] [CrossRef] [PubMed] [Green Version]
  4. Rouw, R.; Erfanian, M. A Large-Scale Study of Misophonia. J. Clin. Psychol. 2018, 74, 453–479. [Google Scholar] [CrossRef]
  5. Schröder, A.E.; Vulink, N.; Denys, D. Misophonia: Diagnostic Criteria for a New Psychiatric Disorder. PLoS ONE 2013, 8, e54706. [Google Scholar] [CrossRef]
  6. Wu, M.S.; Lewin, A.B.; Murphy, T.K.; Storch, E.A. Misophonia: Incidence, Phenomenology, and Clinical Correlates in an Undergraduate Student Sample. J. Clin. Psychol. 2014, 70, 994–1007. [Google Scholar] [CrossRef]
  7. Zhou, X.; Wu, M.S.; Storch, E.A. Misophonia symptoms among Chinese university students: Incidence, associated impairment, and clinical correlates. J. Obs. Compuls. Relat. Disord. 2017, 14, 7–12. [Google Scholar] [CrossRef]
  8. Brout, J.J.; Edelstein, M.; Erfanian, M.; Mannino, M.; Miller, L.J.; Rouw, R.; Kumar, S.; Rosenthal, M.Z. Investigating Misophonia: A Review of the Empirical Literature, Clinical Implications, and a Research Agenda. Front. Neurosci. 2018, 12, 36. [Google Scholar] [CrossRef] [PubMed] [Green Version]
  9. Potgieter, I.; MacDonald, C.; Partridge, L.; Cima, R.; Sheldrake, J.; Hoare, D.J. Misophonia: A scoping review of research. J. Clin. Psychol. 2019, 75, 1203–1218. [Google Scholar] [CrossRef] [PubMed]
  10. Murphy, D.L.; Pickar, D.; Alterman, I.S. Methods for the quantitative assessment of depressive and manic behavior. In The Behaviour of Psychiatric Patients: Quantitative Techniques for Evaluation; Burdock, E.I., Sudilovsku, A., Gershon, S., Eds.; Marcel Dekker: New York, NY, USA, 1982; pp. 335–392. [Google Scholar]
  11. Goodman, W.K.; Price, L.H.; Rasmussen, S.A.; Mazure, C.; Fleischmann, R.L.; Hill, C.L.; Heninger, G.R.; Charney, D.S. The Yale-Brown Obsessive Compulsive Scale. I. Development, use, and reliability. Arch. Gen. Psychiatry 1989, 46, 1006–1011. [Google Scholar] [CrossRef]
  12. Jager, I.; de Koning, P.; Bost, T.; Denys, D.; Vulink, N. Misophonia: Phenomenology, comorbidity and demographics in a large sample. PLoS ONE 2020, 15, e0231390. [Google Scholar] [CrossRef] [PubMed] [Green Version]
  13. Fitzmaurice, G. Misophonia Activation Scale (MAS-1). Available online: http://www.misophonia-uk.org/the-misophonia-activation-scale.html (accessed on 25 October 2021).
  14. Johnson, M.A. Rating Misophonia Severity: The Misophonia Assessment Questionnaire. 2013; Unpublished. [Google Scholar]
  15. Naylor, J.; Caimino, C.; Scutt, P.; Hoare, D.J.; Baguley, D.M. The Prevalence and Severity of Misophonia in a UK Undergraduate Medical Student Population and Validation of the Amsterdam Misophonia Scale. Psychiatr. Q. 2021, 92, 609–619. [Google Scholar] [CrossRef] [PubMed]
  16. Siepsiak, M.; Śliwerski, A.; Dragan, W. Development and Psychometric Properties of MisoQuest—A New Self-Report Questionnaire for Misophonia. Int. J. Environ. Res. Public Health 2020, 17, 1797. [Google Scholar] [CrossRef] [Green Version]
  17. Singer, D.A. The Mixed-Methods Case Study of "Zara": Cognitive Behavior Therapy Treatment of a College Student with Misophonia; Rutgers University: New Brunswick, NJ, USA, 2018. [Google Scholar]
  18. Reid, A.M.; Guzick, A.G.; Gernand, A.; Olsen, B. Intensive cognitive-behavioral therapy for comorbid misophonic and obsessive-compulsive symptoms: A systematic case study. J. Obs. Compuls. Relat. Disord. 2016, 10, 1–9. [Google Scholar] [CrossRef]
  19. Schneider, R.L.; Arch, J.J. Letter to the editor: Potential treatment targets for misophonia. Gen. Hosp. Psychiatry 2015, 37, 370–371. [Google Scholar] [CrossRef]
  20. Muller, D.; Khemlani-Patel, S.; Neziroglu, F. Cognitive-Behavioral Therapy for an Adolescent Female Presenting With Misophonia: A Case Example. Clin. Case Stud. 2018, 17, 249–258. [Google Scholar] [CrossRef]
  21. Alekri, J.; Al Saif, F. Suicidal misophonia: A case report. Psychiatry Clin. Psychopharmacol. 2019, 29, 232–237. [Google Scholar] [CrossRef] [Green Version]
  22. Johnson, P.; Webber, T.; Wu, M.; Lewin, A.; Murphy, T.; Storch, E. When selective audiovisual stimuli become unbearable: A case series on pediatric misophonia. Neuropsychiatry 2013, 3, 569–575. [Google Scholar] [CrossRef]
  23. Bernstein, R.; Angell, K.; Dehle, C. A brief course of cognitive behavioural therapy for the treatment of misophonia: A case example. Cogn. Behav. Ther. 2013, 6, E10. [Google Scholar] [CrossRef]
  24. Hocaoglu, C. A little known topic misophonia: Two case reports. Dusunen Adam J. Psychiatry Neurol. Sci. 2018, 31, 89–96. [Google Scholar] [CrossRef] [Green Version]
  25. Tunç, S.; Başbuğ, H.S. An extreme physical reaction in misophonia: Stop smacking your mouth! Psychiatry Clin. Psychopharmacol. 2017, 27, 416–418. [Google Scholar] [CrossRef] [Green Version]
  26. Veale, D. A Compelling Desire for Deafness. J. Deaf. Stud. Deaf. Educ. 2006, 11, 369–372. [Google Scholar] [CrossRef] [Green Version]
  27. Mokkink, L.B.; Terwee, C.B.; Patrick, D.L.; Alonso, J.; Stratford, P.W.; Knol, D.L.; Bouter, L.M.; de Vet, H.C. The COSMIN study reached international consensus on taxonomy, terminology, and definitions of measurement properties for health-related patient-reported outcomes. J. Clin. Epidemiol. 2010, 63, 737–745. [Google Scholar] [CrossRef] [Green Version]
  28. De Vet, H.; Terwee, C.; Mokkink, L.; Knol, D. Measurement in Medicine: A Practical Guide (Practical Guides to Biostatistics and Epidemiology; Cambridge University Press: Cambridge, UK, 2011; pp. 1–6. [Google Scholar]
  29. Khadjesari, Z.; Boufkhed, S.; Vitoratou, S.; Schatte, L.; Ziemann, A.; Daskalopoulou, C.; Uglik-Marucha, E.; Sevdalis, N.; Hull, L. Implementation outcome instruments for use in physical healthcare settings: A systematic review. Implement. Sci. 2020, 15, 66. [Google Scholar] [CrossRef]
  30. Kroenke, K.; Spitzer, R.L.; Williams, J.B. The PHQ-9: Validity of a brief depression severity measure. J. Gen. Intern. Med. 2001, 16, 606–613. [Google Scholar] [CrossRef] [PubMed]
  31. Spitzer, R.L.; Kroenke, K.; Williams, J.B.; Lowe, B. A brief measure for assessing generalized anxiety disorder: The GAD-7. Arch. Gen. Psychiatry 2006, 166, 1092–1097. [Google Scholar] [CrossRef] [PubMed] [Green Version]
  32. Kaiser, H.F. The Application of Electronic Computers to Factor Analysis. Educ. Psychol. Meas. 1960, 20, 141–151. [Google Scholar] [CrossRef]
  33. Kaiser, H.F.; Rice, J. Little Jiffy, Mark I. Educ. Psychol. Meas. 1974, 34, 111–117. [Google Scholar] [CrossRef]
  34. Bartlett, M.S. The effect of standardization on a Chi-square approximation in factor analysis. Biometrika 1951, 38, 337–344. [Google Scholar]
  35. Muthen, L.K.; Muthén, B. Mplus User’s Guide; Muthén & Muthén: Los Angeles, CA, USA, 1998–2017.
  36. Yuan, K.-H.; Bentler, P.M. 5. Three Likelihood-Based Methods for Mean and Covariance Structure Analysis with Nonnormal Missing Data. Sociol. Methodol. 2000, 30, 165–200. [Google Scholar] [CrossRef]
  37. Hayton, J.C.; Allen, D.G.; Scarpello, V. Factor Retention Decisions in Exploratory Factor Analysis: A Tutorial on Parallel Analysis. Organ. Res. Methods 2004, 7, 191–205. [Google Scholar] [CrossRef]
  38. Guttman, L. Some necessary conditions for common factor analysis. Psychometrika 1954, 19, 149–161. [Google Scholar] [CrossRef]
  39. Horn, J.L. A rationale and test for the number of factors in factor analysis. Psychometrika 1965, 30, 179–185. [Google Scholar] [CrossRef] [PubMed]
  40. Cattell, R.B. The Scree Test For The Number Of Factors. Multivar. Behav. Res. 1966, 1, 245–276. [Google Scholar] [CrossRef]
  41. Nunnally, J.C.; Bernstein, I.H. Psychometric Theory; McGraw-Hill: New York, NY, USA, 1994. [Google Scholar]
  42. Clarkson, D.B.; Jennrich, R.I. Quartic rotation criteria and algorithms. Psychometrika 1988, 53, 251–259. [Google Scholar] [CrossRef]
  43. Muthén, B. A structural probit model with latent variables. J. Am. Stat. Assoc. 1979, 74, 807–811. [Google Scholar] [CrossRef]
  44. Steiger, J.H.; Lind, J.C. Statistically-based tests for the number of common factors. In Proceedings of the Annual Meeting of the Psychometric Society, Iowa City, IA, USA, 28 May 1980. [Google Scholar]
  45. Browne, M.W.; Cudeck, R. Alternative Ways of Assessing Model Fit. Sociol. Methods Res. 1992, 21, 230–258. [Google Scholar] [CrossRef]
  46. Ullman, M.T. The neural basis of lexicon and grammar in first and second language: The declarative/procedural model. Biling. Lang. Cogn. 2001, 4, 105–122. [Google Scholar] [CrossRef] [Green Version]
  47. Bentler, P.M. Comparative fit indexes in structural models. Psychol Bull. 1990, 107, 238–246. [Google Scholar] [CrossRef] [PubMed]
  48. Bentler, P.M.; Bonett, D. Significance tests and goodness of fit in the analysis of covariance structures. Psychol. Bull. 1980, 88, 588–606. [Google Scholar] [CrossRef]
  49. Hooper, D.; Coughlan, J.; Mullen, M.R. Structural equation modelling: Guidelines for determining model fit. J. Bus. Res. Methods 2008, 6, 53–60. [Google Scholar] [CrossRef]
  50. Cronbach, L. Coefficient alpha and the internal structure of tests. Psychometrika 1951, 16, 297–334. [Google Scholar] [CrossRef] [Green Version]
  51. Kuiper, R.; Hoogenboezem, R. Nopaco: A Non-Parametric Concordance Coefficient, Version 1.0.5. 2019. Available online: https://CRAN.R-project.org/package=nopaco (accessed on 16 August 2021).
  52. Shrout, P.E.; Fleiss, J.L. Intraclass correlations: Uses in assessing rater reliability. Psychol. Bull. 1979, 86, 420–428. [Google Scholar] [CrossRef]
  53. Landis, J.R.; Koch, G.G. The measurement of observer agreement for categorical data. Biometrics 1977, 33, 159–174. [Google Scholar] [CrossRef] [PubMed] [Green Version]
  54. Kumar, S.; Tansley-Hancock, O.; Sedley, W.; Winston, J.S.; Callaghan, M.F.; Allen, M.; Cope, T.E.; Gander, P.E.; Bamiou, D.-E.; Griffiths, T.D. The Brain Basis for Misophonia. Curr. Biol. 2017, 27, 527–533. [Google Scholar] [CrossRef] [PubMed] [Green Version]
  55. Schröder, A.; van Wingen, G.; Eijsker, N.; San Giorgi, R.; Vulink, N.C.; Turbyne, C.; Denys, D. Misophonia is associated with altered brain activity in the auditory cortex and salience network. Sci. Rep. 2019, 9, 7542. [Google Scholar] [CrossRef]
  56. Clark, D.M. A cognitive approach to panic. Behav. Res. Ther. 1986, 24, 461–470. [Google Scholar] [CrossRef]
  57. American Psychiatric Association. Diagnostic and Statistical Manual of Mental Disorders, 5th ed.; American Psychiatric Association: Washington, DC, USA, 2013. [Google Scholar]
  58. Rosenthal, M.Z.; Anand, D.; Cassiello-Robbins, C.; Williams, Z.J.; Guetta, R.E.; Trumbull, J.; Kelley, L.D. Development and Initial Validation of the Duke Misophonia Questionnaire. Front. Psychol. 2021, 12, 709928. [Google Scholar] [CrossRef]
  59. McManus, S.; Bebbington, P.; Jenkins, R.; Brugha, T. Mental Health and Wellbeing in England: Adult Psychiatric Morbidity Survey 2014; NHS Digital: Leeds, UK, 2016. [Google Scholar]
  60. Erfanian, M.; Kartsonaki, C.; Keshavarz, A. Misophonia and comorbid psychiatric symptoms: A preliminary study of clinical findings. Nord. J. Psychiatry 2019, 73, 219–228. [Google Scholar] [CrossRef]
  61. Bryant, F.B.; Smith, B.D. Refining the Architecture of Aggression: A Measurement Model for the Buss–Perry Aggression Questionnaire. J. Res. Personal. 2001, 35, 138–167. [Google Scholar] [CrossRef]
  62. Mundt, J.C.; Marks, I.M.; Shear, M.K.; Greist, J.M. The work and social adjustment scale: A simple measure of impairment in functioning. Br. J. Psychiatry 2002, 180, 461–464. [Google Scholar] [CrossRef]
  63. Rimes, K.; Chalder, T. The Beliefs about Emotions Scale: Validity, reliability and sensitivity to change. J. Psychosom. Res. 2010, 68, 285–292. [Google Scholar] [CrossRef]
  64. Brown, K.W.; Ryan, R.M. The benefits of being present: Mindfulness and its role in psychological well-being. J. Personal. Soc. Psychol. 2003, 84, 822–848. [Google Scholar] [CrossRef] [Green Version]
  65. Roberts, N.; Beath, A.; Boag, S. Autonomous sensory meridian response: Scale development and personality correlates. Psychol. Conscious. Theory Res. Pract. 2019, 6, 22–39. [Google Scholar] [CrossRef]
  66. Fergus, T.A.; Valentiner, D.P. The Disgust Propensity and Sensitivity Scale-Revised: An examination of a reduced-item version. J. Anxiety Disord. 2009, 23, 703–710. [Google Scholar] [CrossRef] [PubMed]
  67. Taylor, S.; Zvolensky, M.J.; Cox, B.J.; Deacon, B.; Heimberg, R.G.; Ledley, D.R.; Abramowitz, J.S.; Holaway, R.M.; Sandin, B.; Stewart, S.H.; et al. Robust dimensions of anxiety sensitivity: Development and initial validation of the Anxiety Sensitivity Index-3. Psychol. Assess. 2007, 19, 176–188. [Google Scholar] [CrossRef] [PubMed] [Green Version]
  68. Peterson, R.A.; Reiss, S. Anxiety Sensitivity Index Manual; International Diagnostic Systems: Worthington, OH, USA, 1992; Volume 2. [Google Scholar]
  69. Hunot, C.; Fildes, A.; Croker, H.; Llewellyn, C.H.; Wardle, J.; Beeken, R.J. Appetitive traits and relationships with BMI in adults: Development of the Adult Eating Behaviour Questionnaire. Appetite 2016, 105, 356–363. [Google Scholar] [CrossRef] [Green Version]
  70. Akiskal, H.S.; Akiskal, K.K.; Haykal, R.F.; Manning, J.S.; Connor, P.D. TEMPS-A: Progress towards validation of a self-rated clinical version of the Temperament Evaluation of the Memphis, Pisa, Paris, and San Diego Autoquestionnaire. J. Affect. Disord. 2005, 85, 3–16. [Google Scholar] [CrossRef]
  71. John, O.P.; Srivastava, S. The Big Five trait taxonomy: History, measurement, and theoretical perspectives. In Handbook of Personality: Theory and Research, 2th ed.; Pervin, L.A., John, O.P., Eds.; Guilford Press: New York, NY, USA, 1999; pp. 102–138. [Google Scholar]
  72. Leahy, R.L. Leahy Emotional Schema Scale II (LESS II); American Institute for Cognitive Therapy: New York, NY, USA, 2012. [Google Scholar]
  73. Miller, L.C.; Murphy, R.; Buss, A.H. Consciousness of body: Private and public. J. Personal. Soc. Psychol. 1981, 41, 397–406. [Google Scholar] [CrossRef]
Figure 1. Flow chart of the process and methodology of developing the scale of four waves of data collection.
Psych 03 00041 g001
Figure 2. Scree plot and parallel analysis visualisation.
Psych 03 00041 g002
Figure 3. Percentages of selection per feeling per trigger.
Psych 03 00041 g003
Table 1. Descriptive indices, associations with age and gender, factor loadings to factors, and reliability indices of the 25 S-Five items (N = 828).
StatementsMean
(SD)
Median
(Q1–Q3)
Mode
(min–max)
Spearman
Correlation
with Age
Average
Gender
Difference
Loadings
EFA (CFA)
Psi
(95% CI)
ICC
Externalising
I06 Others avoid making noises6.5 (3.3) 7 (4–10) 10 (0–10) 0.01 −0.2 (0.3) 0.75 (1a) 0.82 (0.8,1) 0.87
I13 Others should not make sounds6.4 (3.5) 7 (4–10) 10 (0–10) * −0.08 0.3 (0.3) 0.80 (1.08) 0.86 (0.8,1) 0.88
I16 Others selfish5.5 (3.6) 6 (2–9) 10 (0–10) −0.02 0.3 (0.3) 0.69 (1.25) 0.83 (0.8,1) 0.87
I21 Others bad manners6.3 (3.2) 7 (4–9) 10 (0–10) 0.02 0.4 (0.3) 0.65 (0.84) 0.84 (0.8,1) 0.87
I25 Others disrespectful7.0 (3.2) 8 (5–10) 10 (0–10) * −0.09 0.1 (0.3) 0.70 (1.15) 0.82 (0.8,1) 0.86
Internalising
I05 Respect myself less4.5 (3.6) 4.5 (1–8) 0 (0–10) ** −0.13 * −0.8 (0.3) 0.67 (1a) 0.83 (0.8,1) 0.87
I08 Unlikeable person5.2 (3.8) 5 (1–9) 10 (0–10) ** −0.14 * −0.8 (0.3) 0.86 (1.18) 0.83 (0.8,1) 0.87
I12 Angry person inside6.0 (3.6) 7 (3–10) 10 (0–10) −0.07 −0.5 (0.3) 0.68 (0.85) 0.84 (0.8,1) 0.87
I18 Bad person inside4.5 (3.7) 4 (1–8) 0 (0–10) ** −0.20** −1.5 (0.3) 0.83 (1.14) 0.83 (0.8,1) 0.87
I19 Dislike self6.8 (3.5) 8 (4–10) 10 (0–10) ** −0.17 ** −1.7 (0.3) 0.63 (0.91) 0.84 (0.8,1) 0.87
Impact
I01 Do not meet friends4.6 (3.4) 5 (1–7) 1 (0–10) * −0.07 0 (0.3) 0.68 (1a) 0.83 (0.8,1) 0.87
I09 Eventually isolated5.8 (3.5) 6 (3–9) 10 (0–10) ** −0.12 −0.4 (0.3) 0.62 (1.27) 0.72 (0.7,1) 0.83
I14 Avoid places5.8 (3.6) 6 (2–10) 10 (0–10) −0.05−0.1 (0.3) 0.74 (1.07) 0.85 (0.8,1) 0.88
I15 Cannot do everyday things5.4 (3.5) 6 (2–9) 10 (0–10) ** −0.15 −0.5 (0.3) 0.76 (1.31) 0.82 (0.8,1) 0.86
I20 Limited job opportunities3.9 (3.6) 3 (1–7) 0 (0–10) ** −0.14 −0.3 (0.3) 0.76 (1.05) 0.86 (0.8,1) 0.88
Outburst
I04 Verbally aggressive5.3 (3.3) 5 (2–8) 10 (0–10) * −0.09 −0.1 (0.3) 0.6 (1a) 0.82 (0.8,1) 0.87
I17 Physically aggressive2.7 (3.1) 1 (0–5) 0 (0–10) * −0.08 −0.3 (0.3) 0.80 (1.01) 0.79 (0.8,1) 0.85
I22 Violence2.3 (3.0) 1 (0–3) 0 (0–10) ** −0.19 −0.4 (0.3) 0.74 (0.97) 0.82 (0.8,1) 0.86
I23 Shout at people4.7 (3.7) 4 (1–8) 10 (0–10) ** −0.10−0.4 (0.3) 0.67 (1.16) 0.84 (0.8,1) 0.87
I24 Afraid of outburst4.5 (3.7) 4 (1–8) 0 (0–10) ** −0.20 −0.2 (0.3) 0.53 (1.11) 0.83 (0.8,1) 0.87
Threat
I02 Panic or explode8.9 (1.9) 10 (8–10) 10 (0–10) ** −0.13 * −0.4 (0.2) 0.59 (1a) 0.79 (0.8,1) 0.85
I03 Feel helpless8.4 (2.4) 10 (8–10) 10 (0–10) ** −0.16 −0.4 (0.2) 0.59 (1.27) 0.79 (0.8,1) 0.85
I07 Feel anxious9.2 (1.7) 10 (9–10) 10 (0–10) * −0.08 * −0.3 (0.2) 0.69 (0.84) 0.77 (0.7,1) 0.84
I10 Experience distress9.4 (1.4) 10 (10–10) 10 (0–10) −0.06 −0.3 (0.1) 0.53 (0.62) 0.77 (0.7,1) 0.85
I11 Feel trapped9.2 (1.7) 10 (9–10) 10 (0–10) ** −0.10 −0.2 (0.2) 0.72 (0.95) 0.81 (0.8,1) 0.86
Q1 Q3 first and third quartile/ICC intraclass correlation coefficient/Psi coefficient and 95% confidence intervals * p < 0.05; ** p < 0.01; men vs. women comparison via Mann–Whitney test; a Loading constrained to 1 for model identification. EFA: Exploratory Factor Analysis; CFA: Confirmatory Factor Analysis; CI: Confidence interval; ICC: Intraclass Correlations Coefficient (2-way, absolute agreement in time, mixed effects).
Table 2. Descriptive indices and reliability of the 5 factors and S-Five total score (N = 828).
Males
(N = 141)
Females
(N = 655)
TotalComparisonInternal ConsistencyStability
Mean
(SD)
Mean
(SD)
Mean
(SD)
Statisticp-ValueAlphaIICITCPsi
(95% CI)
ICC
Externalising32.7
(13.3)
31.6
(13.2)
31.8
(13.2)
U = 43,707.50.3180.850.40–0.670.56–0.720.87
(0.9,1)
0.89
Internalising22.5
(14.6)
27.7
(14.6)
26.8
(14.7)
U = 36,777.5<0.0010.880.53–0.770.69–0.770.86
(0.8,1)
0.88
Impact23.9
(15.4)
25.4
(14.3)
25.1
(14.5)
U= 43,381.50.2590.830.42–0.740.62–0.780.89
(0.9,1)
0.89
Outburst18.1
(13.5)
19.5
(13.2)
19.2
(13.1)
U= 43,249.50.2370.840.42–0.640.61–0.670.87
(0.9,1)
0.89
Threat43.7
(8.3)
45.3
(6.9)
45.1
(7.2)
U= 39,925.50.0090.830.38–0.600.55–0.710.83
(0.8,1)
0.87
S-Five total140.9
(46.4)
149.5
(43.1)
148.0
(43.8)
t = 2.11 (794)0.0350.900.02–0.770.27–0.700.89
(0.9,1)
0.90
U stands for Mann–Whitney test and t for t-test, subject to the symmetry of the data distribution. SD: standard deviation; alpha: Cronbach’s alpha, IIC: inter-item correlations; ITC: item-total correlations; ICC: intraclass correlation coefficient (two-way mixed effects, absolute agreement).
Table 3. Intercorrelations of the S-Five scores, and correlations with other measures (validity assessment).
S-Five (N = 828)
Externalising Internalising Impact Outburst Threat
S-Five (N = 828)
Internalising0.206 **
Impact0.288 **0.495 **
Outburst0.299 **0.403 **0.393 **
Threat0.267 **0.321 **0.510 **0.332 **
Total0.600 **0.734 **0.784 **0.709 **0.620 **
Age (N = 828)
Age −0.060−0.123 **−0.192 **−0.167 **−0.192 **
A-MISO-S 1 (N = 319)
Total 0.243 **0.697 **0.415 **0.358 **0.496 **
MQ (N = 320)
MSYS (N = 281) 0.205 **0.291 **0.122 *0.1050.273 **
MEBS (N = 281) 0.265 **0.523 **0.315 **0.577 **0.545 **
MSES (N = 320) 0.1000.568 **0.302 **0.339 **0.391 **
Total (N = 281) 0.302 **0.529 **0.287 **0.457 **0.534 **
PHQ9 (N = 800)
Total 0.169 **0.435 **0.375 **0.287 **0.300 **
GAD7 (N = 810)
Total 0.200 **0.414 **0.383 **0.284 **0.324 **
WSAS (N = 813)
Total 0.230 **0.764 **0.484 **0.383 **0.404 **
A-MISO-S: Amsterdam Misophonia Scale; MQ: Misophonia Questionnaire; MSYS: Misophonia Symptoms Scale; MEBS: Misophonia Emotions and Behaviours Scale; MSES: Misophonia Severity Scale; PHQ-9: Physical Health Questionnaire; GAD-7: Generalised Anxiety Disorder Assessment; WSAS: Work and Social Adjustment Scale. * p < 0.05; ** p < 0.01.
Table 4. Descriptive indices of the intensity of the 37 S-Five-t trigger sounds (N = 752).
Trigger Sounds Mean
(SD)
Median
(Q1–Q3)
Mode
(Min–Max)
Average
Gender
Difference
Pearson
r
with Age
Psi
(95% CI)
ICC
Normal eating sounds6.6 (2.5)7 (6–8)7 (0–10)−0.1 (0.2)** −0.1170.76 (0.7,1)0.84
Certain letter sounds2.3 (3.0)0 (0–4)0 (0–10)−0.5 (0.3)−0.0370.79 (0.8,1)0.85
Mushy foods5.4 (3.3)6 (3–8)0 (0–10)0.0 (0.3)** −0.2200.82 (0.8,1)0.87
Sound of clipping nails3.8 (3.4)3 (0–7)0 (0–10)** −1.2 (0.3)** 0.1120.85 (0.8,1)0.87
Swallowing4.3 (3.3)4.5 (1–7)0 (0–10)−0.5 (0.3)** −0.1030.86 (0.8,1)0.88
Keyboard tapping3.7 (3.3)3 (0–6)0 (0–10)−0.3 (0.3)*0.0880.83 (0.8,1)0.87
Lip smacking6.6 (3.0)7 (5–9)10 (0–10)0.1 (0.3)** −0.1100.86 (0.8,1)0.88
Normal breathing2.9 (3.1)2 (0–5)0 (0–10)** −1.2 (0.3)** −0.1760.82 (0.8,1)0.86
Repetitive engine2.5 (3.0)1 (0–4)0 (0–10)0.0 (0.3)** 0.1970.82 (0.8,1)0.86
Blocked nose6.3 (3.0)7 (4–9)10 (0–10)** −1.4 (0.3)** −0.1040.83 (0.8,1)0.87
Mobile phone3.4 (3.2)3 (0–6)0 (0–10)−0.6 (0.3)0.0690.84 (0.8,1)0.87
Repetitive coughing5.0 (3.1)5 (2–8)0 (0–10)** −0.8 (0.3)0.0160.81 (0.8,1)0.86
Humming1.9 (2.7)0 (0–3)0 (0–10)−0.4 (0.3)** 0.1300.81 (0.8,1)0.86
Repetitive sniffing6.3 (3.1)7 (4–9)10 (0–10)** −1.0 (0.3)0.0390.85 (0.8,1)0.87
Snoring5.8 (3.5)6.5 (3–9)10 (0–10)** −1.7 (0.3)0.0450.86 (0.8,1)0.88
Certain accents1.7 (2.7)0 (0–3)0 (0–10)−0.2 (0.3)** 0.1130.78 (0.7,1)0.85
Whistling sound3.9 (3.5)3 (0–7)0 (0–10)** −1.0 (0.3)** 0.1030.86 (0.8,1)0.88
Tapping5.2 (3.3)5 (3–8)10 (0–10)** −1.2 (0.3)* 0.0880.87 (0.9,1)0.89
Rustling plastic or paper3.7 (3.4)3 (0–7)0 (0–10)−0.6 (0.3)* 0.0880.86 (0.8,1)0.88
Chewing gum8.3 (2.5)9 (8–10)10 (0–10)−0.3 (0.2)−0.0300.84 (0.8,1)0.87
Footsteps1.7 (2.7)0 (0–3)0 (0–10)−0.1 (0.3)−0.0110.77 (0.7,1)0.85
Hiccups1.8 (2.5)0 (0–3)0 (0–10)−0.4 (0.2)−0.0140.82 (0.8,1)0.86
Slurping7.1 (2.9)8 (5–10)10 (0–10)−0.4 (0.3)0.0050.83 (0.8,1)0.87
Cutlery5.7 (3.4)6 (3–9)10 (0–10)−0.3 (0.3)−0.0300.86 (0.8,1)0.88
Sneezing1.9 (2.8)0 (0–3)0 (0–10)−0.5 (0.3)0.0310.82 (0.8,1)0.86
Certain words1.7 (2.7)0 (0–3)0 (0–10)* −0.5 (0.3)0.0280.75 (0.7,1)0.84
Kissing2.5 (3.2)1 (0–5)0 (0–10)** −1.4 (0.3)−0.0500.83 (0.8,1)0.87
Joint cracking2.6 (3.1)1 (0–5)0 (0–10)** −0.8 (0.3)** 0.1840.83 (0.8,1)0.87
Muffled sounds4.7 (3.6)5 (1–8)0 (0–10)** −0.7 (0.3)0.0270.85 (0.8,1)0.88
Throat clearing4.5 (3.4)4 (2–7)0 (0–10)** −1.1 (0.3)0.0420.84 (0.8,1)0.87
Baby crying3.2 (3.3)2 (0–6)0 (0–10)0.6 (0.3)0.0110.85 (0.8,1)0.88
Repetitive barking4.0 (3.3)3 (1–7)0 (0–10)0.3 (0.3)** 0.2210.85 (0.8,1)0.88
Loud chewing8.8 (2.0)10 (8–10)10 (0–10)−0.2 (0.2)** −0.1060.81 (0.8,1)0.86
Clock ticking2.8 (3.4)1 (0–5)0 (0–10)** −0.7 (0.3)−0.0110.83 (0.8,1)0.87
Crunching7.1 (3.3)8 (5–10)10 (0–10)0.0 (0.3)−0.0080.86 (0.8,1)0.88
Teeth sucking5.3 (3.4)6 (3–8)0 (0–10)** −1.1 (0.3)0.0550.87 (0.8,1)0.88
Yawning1.9 (2.8)0 (0–4)0 (0–10)−0.5 (0.3)−0.0130.81 (0.8,1)0.86
Q1 Q3 first and third quartile/ICC intraclass correlation coefficient/Psi coefficient and 95% confidence intervals * p < 0.05; ** p < 0.01; men vs. women comparison via Mann–Whitney test.
Table 5. Descriptive indices and reliability of the 6 RC scores (N = 828), TC, FIRS and RIRS.
Mean
(SD)
Median
(Q1–Q3)
Mode
(Min–Max)
Average
Gender
Difference
M vs. F (sd)
N = 796
Psi
(95% CI)
N = 104
ICC
N = 104
RC
No feeling9.8 (6.4)9 (5–14)0 (0–31)2.4 * (0.6)0.89 (0.9,1)0.89
Irritation9.8 (5.2)10 (6.25–13)9 (0–31)−0.5 (0.5)0.80 (0.8,1)0.86
Distress3.1 (3.0)2 (1–5)0 (0–27)−0.4 (0.3)0.82 (0.8,1)0.86
Disgust3.0 (3.0)2.5 (1–5)0 (0–28)−0.6 * (0.3)0.84 (0.8,1)0.87
Anger5.8 (4.6)5 (2–8)0 (0–26)0.2 (0.4)0.82 (0.8,1)0.86
Panic1.9 (2.8)1 (0–3)0 (0–18)−0.5 (0.3)0.83 (0.8,1)0.87
TC24.1 (8.8)26 (20–30)29 (0–37)−1.7 (0.8)0.89 (0.9,1)0.89
FIRS146.1 (66.4)150 (103–189)173 (0–363)−16.5 * (6.2)0.89 (0.9,1)0.89
RIRS6 (1.4)6.1 (5.1–7)7 (2–10)−0.3 (0.1)0.84 (0.8,1)0.87
RC: reaction count; TC: trigger count; FIRS: Frequency-intensity reaction score; RIRS: relative intensity reaction score; Q1 Q3 first and third quartile/ICC intraclass correlation coefficient/Psi coefficient and 95% confidence intervals; * p < 0.05; men vs. women comparison via Mann–Whitney test.
Table 6. Intercorrelations of the S-Five-T scores (TC, RIRS and FIRS), and correlations with other measures (validity assessment).
No FeelingIrritationDistressDisgustAngerPanicTCFIRSRIRS
S-Five-T (N = 828)
Irritation−0.025
Distress−0.142 **0.068
Disgust−0.166 **0.010.101 **
Anger−0.208 **0.041−0.105 **0.074 *
Panic−0.070 *−0.150 **0.120 **0.023−0.041
TC−0.257 **0.590 **0.404 **0.420 **0.522 **0.256 **
FIRS−0.344 **0.325 **0.344 **0.354 **0.594 **0.287 **0.862 **
RIRS−0.282 **−0.287 **0.020.0280.294 **0.154 **0.0520.503 **1
S-Five (N = 828)
Internalising−0.194 **−0.0640.0170.0470.160 **0.098 **0.107 **0.189 **0.215 **
Externalising−0.155 **−0.078 *−0.072 *0.0640.159 **0.0170.0370.127 **0.221 **
Impact−0.300 **−0.149 **0.111 **0.0270.190 **0.257 **0.152 **0.303 **0.344 **
Outburst−0.145 **−0.102 **−0.011−0.0320.213 **0.0320.0610.143 **0.221 **
Threat−0.162 **−0.167 **0.127 **0.114 **0.153 **0.241 **0.143 **0.267 **0.296 **
Total −0.281 **−0.152 **0.0380.0530.253 **0.172 **0.139 **0.288 **0.367 **
Age (N = 828)
Age−0.0160.125 **−0.029−0.130 **0.0030.0280.0220.027−0.009
A-MISO-S (N = 341)
Total−0.206 **−0.221 **0.0490.080.146 **0.291 **0.1050.317 **0.411 **
MQ (N = 320)
MSYS (N = 281)−0.626 **0.0540.239 **0.162 **0.356 **0.0980.421 **0.514 **0.370 **
MEBS (N = 281)−0.198 **−0.134 *0.0220.0370.224 **0.167 **0.1160.232 **0.260 **
MSES (N = 320)−0.216 **−0.187 **0.071−0.0280.0710.304 **0.0660.200 **0.306 **
Total (N = 281)−0.503 **−0.060.156 **0.121 *0.363 **0.172 **0.327 **0.461 **0.396 **
PHQ9 (N = 800)
Total−0.227 **−0.091 **0.081 *0.0290.159 **0.137 **0.119 **0.187 **0.171 **
GAD7 (N = 810)
Total0.207 **0.207 **0.207 **0.207 **0.207 **0.207 **0.207 **0.207 **0.207 **
WSAS (N = 813)
Total−0.362 **−0.131 **0.126 **0.050.151 **0.219 **0.148 **0.269 **0.290 **
TC: trigger count; FIRS: Frequency-intensity reaction score; RIRS: relative intensity reaction score; A-MISO-S: The Amsterdam Misophonia Scale; MQ: Misophonia Questionnaire; PHQ9: Patient Health Questionnaire-9; GAD7: General Anxiety Disorder-7 questionnaire; WSAS: Work and Social Adjustment Scale. * p < 0.05; ** p < 0.01.
Publisher’s Note: MDPI stays neutral with regard to jurisdictional claims in published maps and institutional affiliations.

